geometallurgical mapping: a new approach … · geometallurgical mapping: a new approach that ....
TRANSCRIPT

SGS MINERALS SERVICES TECHNICAL PAPER 2004-01 2004
GEOMETALLURGICAL MAPPING: A NEW APPROACH THAT REDUCES TECHNICAL RISKSTEVEN R. WILLIAMS , M.B.A. AND JEAN M. RICHARDSON, PH D., C.CHEM., –– SGS
ABSTRACT Geometallurgical mapping is a new team-based approach that documents variability within an orebody and quantifies the impact of geology (host rocks, alteration and structure) and mineralogy on grinding, metallurgical response and metal recovery processes. The quantitative, spatially constrained database that results can be readily integrated into 3-D block models and mine planning activities. Thus it is an important tool to reduce the technical risk associated with new mine developments or expansions.
Normally undertaken during pre-feasibility or feasibility planning stages, the first step of geometallurgical mapping is to review the geology, mineralogy and other critical parameters and construct a geometallurgical matrix. This matrix provides an objective base to then guide sampling and/or compositing activity for physical property and metallurgical testing. Depending on the project, an array of testing techniques can be used to characterize the ore and feed data into the geometallurgical model.
While the range and number of tests needed is project-dependant, the geometallurgical mapping approach allows the development of empirical models or interdependent relationships, grounded by spatially-constrained real data. Extensive data sets collected using less expensive testing methods can be meaningfully correlated with results from complex specialty tests to yield realistic metallurgical recovery data.
With geometallurgical mapping completed, the resulting database can be integrated into an overall 3-D block mine model. This means that metallurgical response can be used to realistically forecast the recoveries of specific blocks, perhaps sampled only by drilling. Mine planning can then incorporate the forecasted metallurgical response and generate future project cash-flows; opening the door to economic optimization of the mine exploitation.
WHAT IS THE GEOMETALLURGICAL MAPPING APPROACH?
Geometallurgical mapping is a new tool, a new way to “scope down for value” when developing an ore deposit. It is a framework to document variability within an orebody and quantify the impact of many factors including geology (host rocks, alteration and structure) and mineralogy on grinding, metallurgical response and metal recovery processes. The quantitative, spatially constrained database thus generated can be read-ily integrated into 3-D block models and mine planning activities. Thus it is an important tool to reduce the technical risk associated with new mine developments or expansions.
The geometallurgical mapping approach consists of several steps: • Developing a geometallurgical matrix
using the geological model of the deposit
• Using the geomatrix guide sampling and compositing for further testing
• Characterizing of the ore samples or composites for a selection of geological, analytical, geotechnical, mineralogical, metallurgical and physical characteristics
• Adding this data added to the overall 3D model used for mine planning and economic projections
SGS MINERALS SERVICES TECHNICAL BULLETIN 2004-01
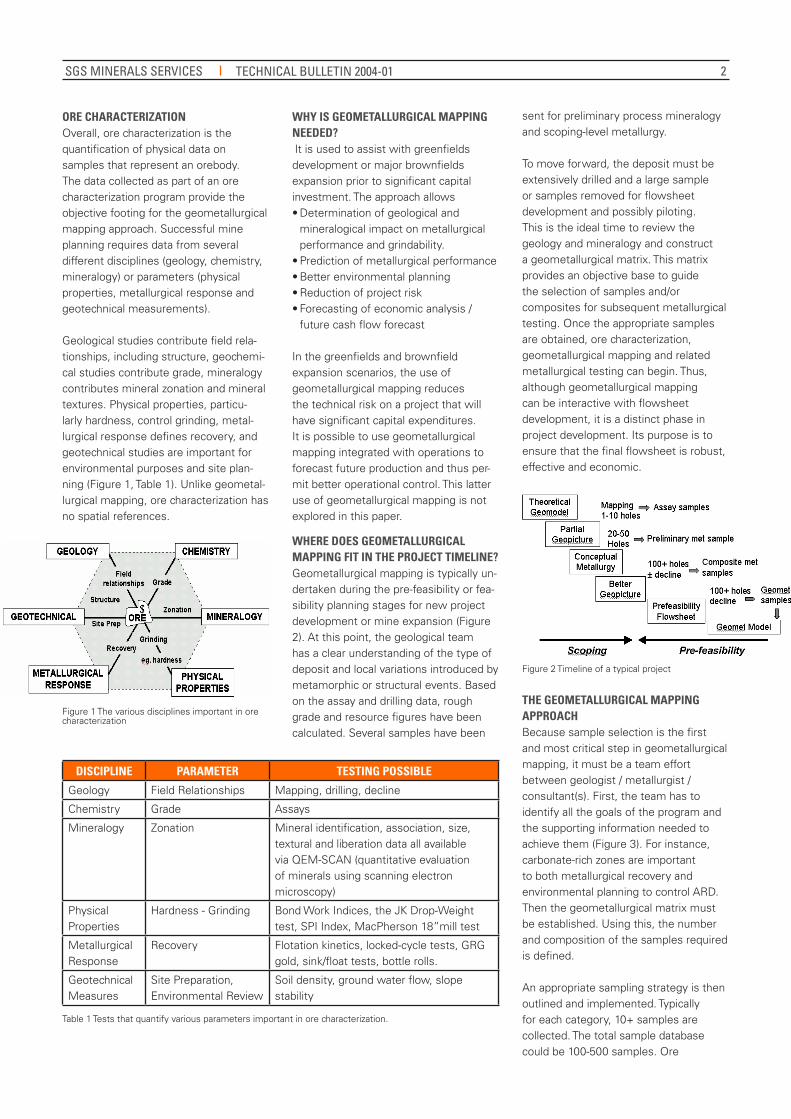
ORE CHARACTERIZATION Overall, ore characterization is the quantification of physical data on samples that represent an orebody. The data collected as part of an ore characterization program provide the objective footing for the geometallurgical mapping approach. Successful mine planning requires data from several different disciplines (geology, chemistry, mineralogy) or parameters (physical properties, metallurgical response and geotechnical measurements).
Geological studies contribute field rela-tionships, including structure, geochemi-cal studies contribute grade, mineralogy contributes mineral zonation and mineral textures. Physical properties, particu-larly hardness, control grinding, metal-lurgical response defines recovery, and geotechnical studies are important for environmental purposes and site plan-ning (Figure 1, Table 1). Unlike geometal-lurgical mapping, ore characterization has no spatial references.
4. Adding this data added to the overall 3D model used for mine planning and economic projections
Ore Characterization Overall, ore characterization is the quantification of physical data on samples that represent an orebody. The data collected as part of an ore characterization program provide the objective footing for the geometallurgical mapping approach. Successful mine planning requires data from several different disciplines (geology, chemistry, mineralogy) or parameters (physical properties, metallurgical response and geotechnical measurements). Geological studies contribute field relationships, including structure, geochemical studies contribute grade, mineralogy contributes mineral zonation and mineral textures. Physical properties, particularly hardness, control grinding, metallurgical response defines recovery, and geotechnical studies are important for environmental purposes and site planning (Figure 1, Table 1). Unlike geometallurgical mapping, ore characterization has no spatial references.
Figure 1 The various disciplines important in ore characterization
Figure 1 The various disciplines important in ore characterization
DISCIPLINE PARAMETER TESTING POSSIBLE
Geology Field Relationships Mapping, drilling, decline
Chemistry Grade Assays
Mineralogy Zonation Mineral identification, association, size, textural and liberation data all available via QEM-SCAN (quantitative evaluation of minerals using scanning electron microscopy)
Physical Properties
Hardness - Grinding Bond Work Indices, the JK Drop-Weight test, SPI Index, MacPherson 18”mill test
Metallurgical Response
Recovery Flotation kinetics, locked-cycle tests, GRG gold, sink/float tests, bottle rolls.
Geotechnical Measures
Site Preparation, Environmental Review
Soil density, ground water flow, slope stability
Table 1 Tests that quantify various parameters important in ore characterization.
WHY IS GEOMETALLURGICAL MAPPING NEEDED? It is used to assist with greenfields development or major brownfields expansion prior to significant capital investment. The approach allows • Determination of geological and
mineralogical impact on metallurgical performance and grindability.
• Prediction of metallurgical performance • Better environmental planning • Reduction of project risk • Forecasting of economic analysis /
future cash flow forecast
In the greenfields and brownfield expansion scenarios, the use of geometallurgical mapping reduces the technical risk on a project that will have significant capital expenditures. It is possible to use geometallurgical mapping integrated with operations to forecast future production and thus per-mit better operational control. This latter use of geometallurgical mapping is not explored in this paper.
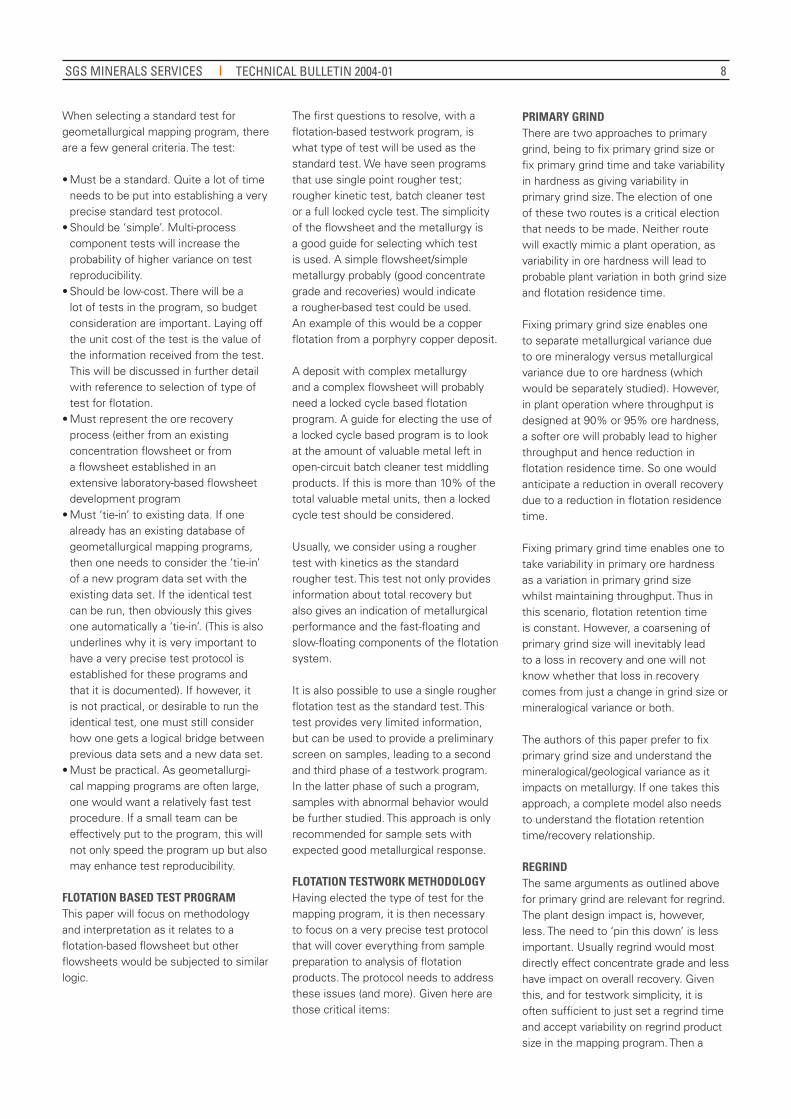
WHERE DOES GEOMETALLURGICAL MAPPING FIT IN THE PROJECT TIMELINE? Geometallurgical mapping is typically un-dertaken during the pre-feasibility or fea-sibility planning stages for new project development or mine expansion (Figure 2). At this point, the geological team has a clear understanding of the type of deposit and local variations introduced by metamorphic or structural events. Based on the assay and drilling data, rough grade and resource figures have been calculated. Several samples have been
sent for preliminary process mineralogy and scoping-level metallurgy.
To move forward, the deposit must be extensively drilled and a large sample or samples removed for flowsheet development and possibly piloting. This is the ideal time to review the geology and mineralogy and construct a geometallurgical matrix. This matrix provides an objective base to guide the selection of samples and/or composites for subsequent metallurgical testing. Once the appropriate samples are obtained, ore characterization, geometallurgical mapping and related metallurgical testing can begin. Thus, although geometallurgical mapping can be interactive with flowsheet development, it is a distinct phase in project development. Its purpose is to ensure that the final flowsheet is robust, effective and economic.
metallurgical testing can begin. Thus, although geometallurgical mapping can be interactive with flowsheet development, it is a distinct phase in project development. Its purpose is to ensure that the final flowsheet is robust, effective and economic.
Figure 2 Timeline of a typical project
The Geometallurgical Mapping Approach Because sample selection is the first and most critical step in geometallurgical mapping, it must be a team effort between geologist / metallurgist / consultant(s). First, the team has to identify all the goals of the program and the supporting information needed to achieve them (Figure 3). For instance, carbonate-rich zones are important to both metallurgical recovery and environmental planning to control ARD. Then the geometallurgical matrix must be established. Using this, the number and composition of the samples required is defined. An appropriate sampling strategy is then outlined and implemented. Typically for each category, 10+ samples are collected. The total sample database could be 100-500 samples. Ore characterization is performed via metallurgical and grinding studies, the data is interpreted and fed to a database which integrates into the 3-D matrix that is used for mine planning and prediction.
Team Approach to Sampling The selection of samples for feasibility stage metallurgical testing is a critical factor upon which future profitability rests. These must be both representative of the entire suite of materials that will be processed (including the various overlapping ore zones and styles of alteration), and be large enough to allow the amount of work required. Selection hinges upon the effective integration of the geological understanding of the deposit (which is usually reasonably well known) with an understanding of the mineral separation, metal recovery and purification processes that are appropriate flowsheet being considered (before it is
Figure 2 Timeline of a typical project
THE GEOMETALLURGICAL MAPPING APPROACH Because sample selection is the first and most critical step in geometallurgical mapping, it must be a team effort between geologist / metallurgist / consultant(s). First, the team has to identify all the goals of the program and the supporting information needed to achieve them (Figure 3). For instance, carbonate-rich zones are important to both metallurgical recovery and environmental planning to control ARD. Then the geometallurgical matrix must be established. Using this, the number and composition of the samples required is defined.
An appropriate sampling strategy is then outlined and implemented. Typically for each category, 10+ samples are collected. The total sample database could be 100-500 samples. Ore
2

SGS MINERALS SERVICES TECHNICAL PAPER 2004-01
characterization is performed via metallurgical and grinding studies, the data is interpreted and fed to a database which integrates into the 3-D matrix that is used for mine planning and prediction.
TEAM APPROACH TO SAMPLING The selection of samples for feasibility stage metallurgical testing is a critical factor upon which future profitability rests. These must be both representative of the entire suite of materials that will be processed (including the various overlapping ore zones and styles of alteration), and be large enough to allow the amount of work required.
Selection hinges upon the effective integration of the geological understanding of the deposit (which is usually reasonably well known) with an understanding of the mineral separation, metal recovery and purification processes that are appropriate flowsheet being considered (before it is tested and confirmed). Experience shows that this integration is most effective when geological parameters and & metallurgical criteria are examined in context of deposit.
Figure 3 Flowsheet illustrating geometallurgical mapping approach
GEOMETALLURGICAL MATRIX
The geometallurgical matrix or geomatrix is built from the experience the team brings to the project. The matrix is not a spatial map of orebody or a sampling grid, but an x-y-z plot consisting of three axes. Two axes represent geological factors (rock-type, alteration) and the
third, critical parameters that highlight value or process difficulty (these are often, but not always, mineralogical in nature)(Figure 4,Table 2).
tested and confirmed). Experience shows that this integration is most effective when geological parameters and & metallurgical criteria are examined in context of deposit.
Team identifies goals and data needed ⇓
Establish geometallurgical matrix ⇓
Determine categories for samples ⇓
Collect samples ⇓
Ore characterization (chemical, mineralogical, grinding and metallurgy)
⇓ Interpret data
⇓ Put in 3D models.
⇓ Use (prediction, planning)
Figure 3 Flowsheet illustrating geometallurgical mapping approach
GEOMETALLURGICAL MATRIX The geometallurgical matrix or geomatrix is built from the experience the team brings to the project. The matrix is not a spatial map of orebody or a sampling grid, but an x-y-z plot consisting of three axes. Two axes represent geological factors (rock-type, alteration) and the third, critical parameters that highlight value or process difficulty (these are often, but not always, mineralogical in nature)(Figure 4,Table 2).
Figure 4 Geometallurgical matrix
Figure 4 Geometallurgical matrix
ROCK TYPE (Y AXIS)
ALTERATION (Z AXIS)
CRITICAL PARAMETER (X AXIS)
Rhyolite Chloritization Pyrrhotite vs pyrite vs valuable sulphide minerals
Andesite Sericitization Ore Minerals
Basalt Talc Formation Pay metal ratios (e.g. Cu/Zn)
Tuffite Argillic Au, PGE sweeteners
Porphyry Potassic Smelter penalties (e.g. As, Bi, Hg, Se)
Breccia Phyllic “Unresponsive” minerals (e.g. chalcopyrite does not respond to bacterially assisted leaching)
Marble Skarn Refractory gold
Environmental hazards
Table 2. Rock types, alteration types and critical parameters that might be found in geometallurgical matrices.
USE OF THE GEOMATRIX Together, the team identifies the suite of major and /or important factors or parameters for each axis. These are assembled into the 3-D format. From Table 2 and Figure 4, it is clear that the more complex the deposit is, the more factors must be evaluated and the larger and more complex the geomatrix become. Even the least complicated deposit will have a large number of cells within the matrix (e.g. 3 rock types by 3 alteration types by 4 parameters will yield 36 cells).
Geomatrices for deposits with many alteration zones and complicated structural relationships (e.g. por-phyry gold-copper deposits) can have hundreds of cells. To simplify this, all those categories that do not exist, are economically insignificant or are geographically very small are rationalized.
This reduces the geomatrix by 50-70% and allows the team to delineate the most representative or the most critical
zones in the deposit for subsequent testing.
Thus the geometallurgical matrix is a disciplined way to document and assess the geological variability of a deposit and it guides representative sampling for future testwork.
GEOLOGICAL CONTRIBUTIONS TO THE GEOMATRIX The geometallurgical matrix is rooted in the critical geological factors that define and cause variability within the deposit. These involve the “rock type”, the “alteration type” and some “criti-cal factors”. At the most basic level, the major geological components area
• Primary rock types and their distribution• variations in Si, Fe, Mg, CO3 content• mineralogy• hardness, grain size, competency• porosity, reactivity
• Ore assemblages and ore-forming process• specific minerals present (e.g.
chalcopyrite vs bornite)• mineral distribution and zonation
(metal ratios)• mineral textures (e.g. intergrowths)• brecciation• silification
• Alteration assemblages, both (down-temp)(hypogene) and weathering (supergene)• changes in hardness (e.g.
chloritization, sericitization)• changes in mineralogy• changes in solubility/reactivity• altered textures (e.g. rimming,
replacement)
3
Team identifies goals and data needed⇓
Establish geometallurgical matrix⇓
Determine categories for samples⇓
Collect samples⇓
Ore characterization(chemical, mineralogical, grinding and
metallurgy)⇓
Interpret data⇓
Put in 3D models.⇓
Use (prediction, planning)

SGS MINERALS SERVICES TECHNICAL BULLETIN 2004-01
• Structural parameters, especially faulting• grain size reduction and formation of
clays in fault gouge• changes in hardness• open pathways to fluids (especially
surface water) and oxidation• local zoning
• Metamorphic overprinting• recrystallization textures• dehydration reactions• new minerals• coarse-grained aggregates• alteration to micas, talc, clays• changes in hardness.
The creation of a comprehensive geo-metallugical matrix is made easier by the efforts that have been expended to develop geological models. The overall purpose of such modeling is to simplify the complex and to provide a predictive tool that can be used to frame explora-tion activities and then mine planning. For instance, predictions based on the model could enable a firm to locate a faulted extension of a zoned orebody.
Such models are available for all types of deposits (summaries in Kirkham et al. 1993). The best known and tested models are those for massive sulfide and polymetallic deposits and porphyry Cu ± Mo ± Au deposits and the most complex are for skarn deposits. Models like this are useful to geometallurgical modeling because they alert the team to probable changes within the orebody with depth or faulting. This could include the location undetected ore or alteration minerals etc.
METALLURGICAL CONTRIBUTIONS TO THE GEOMATRIX Metallurgical unit operations can be broadly grouped into several categories. Variations in metallurgical response are controlled by physical characteristics as indicated• Grindability
• grain size and grain size distribution • microfractures • mineralogy • rock type • extent and type of alteration
• Separation factors • specific gravity • magnetic susceptibility • grain size • mineralogy, texture, deportment
• Solid/liquid separation • particle size • hydrophilic nature • specific gravity • presence of clays, sericite or other
alteration minerals • Flotability
• mineralogy, texture • desired minerals and associated
gangue minerals • grain size • surface activation “tarnishing” • presence of talc, clays or other altera-
tion minerals • presence of soluble phases
• Leachability • thermodynamics • solubility • permeability • refractory nature • particle size and fracturing • pH, Eh • presence of clays and alteration
minerals • Purification
• associated minerals • cations and anions (e.g. As, Hg, Cl)
LINKAGE BETWEEN GEOLOGY AND METALLURGYFrom the preceding, it is clear that geological factors have major impact on the metallurgical processing. For instance, a siliceous, unaltered, fine-grained volcanic rock such as rhyolite will be very hard. If it is brecciated and mixed with soft sulphide ore minerals, it will pose a grinding challenge that can be addressed during flowsheet development. Several other interrelationships such as this are outlined in Table 3.
GEOLOGICAL/MINERALOGICAL
FACTOR
AREA OF LINKAGE METALLURGICAL UNIT OPERATION
Primary rock types and distribution
Hardness Grinding
Ore assemblage and ore formation processes
Solubility, presence of talc, hardness
Grinding, flotation, leachability,
Alteration• Down temperature
(hypogene)• Weathering (supergene)
Clays, hardness
Solubility
Grinding, S/L separation
Leachbility, purification
Faulting Clays, oxidation S/L separation, flotation
Metamorphism Clays, presence of talc, hardness
Grinding, S/L separation, flotation
Clearly, when important geological factors can be known or predicted, the metallurgical process can be designed to account for it. When geological factors are unknown or unexpected and the flowsheet not designed to address the individual situation, a huge investment can be lost. The geometallurgical mapping approach provides rigor to the early discussions of how to sample and then guides the subsequent testing program.
DETVE SULPHIDE Cu, Zn, ± Pb DEPOSIT. To illustrate how a team would use a geometallurgical matrix, let us develop the example of a massive sulphide Cu-Zn deposit. There are many world class examples of this, including Cyprus, the Kuroko deposits and the Archean greenstone deposits of Canada, Norway and Australia (for example, Noranda, Kidd Creek, Mount Isa). While each camp and deposit varies from the model, the overall style is very well understood geologically (Lydon 1984, Franklin, 1993) and the model can be used to empirically illustrate the importance of the geomet-allurgical mapping approach.
A typical massive sulphide deposit consists of a lenticular massive sulphide zone that is zoned (Spot 1, Figure 5) with respect to chalcopyrite, iron-rich sphalerite and silver-bearing galena, pyrite and pyrrhotite, and barite. This can be covered with a thin barren tuffite or exhalite layer that is strongly siliceous and iron-rich, containing pyrite and hematite (Spot 2, Figure 5). It is lies coherently within a package of rhyolite and andesite, volcanic rocks of varying
Table 3 Linkage between geological and metallurgical factors.
4

SGS MINERALS SERVICES TECHNICAL PAPER 2004-01
silica and iron content.
Below the sulphide mineralization there is a strongly chloritized root of breccia which contains disseminated chalcopy-rite, pyrite and pyrrhotite (Spot 3,Figure 5). This root is enveloped by a sericitized halo with pyrite, sphalerite and galena (Spot 5, Figure 5). This entire mineral-ized zone lies within siliceous rhyolites. Some deposits contain gold and arsenic. For simplicity sake, our model is not weathered, metamorphosed or faulted. As well, we do not have textural relation-ships or deportment data on the mineral textures, a critical factor in assessing metallurgical performance, even at this most basic level.
Figure 5 Theoretical model of massive sulphide deposit highlighting areas where there are critical
parameters that must be considered in the geochemical matrix
Even from this most basic description, a series of geological factors that have important linkage to metallurgical processing can be isolated and spatially constrained. Some highlights that would have to be considered from even this elementary representation. • Sulphide minerals and their distribution
- Sulphide ore is zoned with chalcopyrite, pyrite and pyrrhotite located in the lower part of the lens (Spot 1) and in the central root of the deposit (Spot 3). In contrast, galena (and thus likely silver if it is present) is in the top of the lens, associated with sphalerite, pyrite and barite. Contacts between the zones are gradational, but clearly the grade and metal ratios will change over the mine life.
- The presence of pyrite and/or pyrrhotite and the relative abundance of these sulphide gangue minerals will probably effect flotation selectivities
- The flowsheet must be robust enough to recover the Cu, Zn, Pb and possibly silver, as the ratios change throughout the mine life
• Distribution of ore minerals with respect to silicate minerals
- Difference in hardnesses cause difficulties in grinding. Careful mine planning could address the problems at the top and sides of the deposit, where the ore is in contact with hard siliceous materials that is oxidized (Spot 2, top) or sericitized (Spot 5, side). However, the difference between the relatively soft massive sulphide ore at Spot 1 and the brecciated/disseminated ore depicted at Spot 4 must be addressed during flowsheet development.
Figure 5 Theoretical model of massive sulphide deposit highlighting areas where there are critical parameters that must be considered in the geochemical matrix
Even from this most basic description, a series of geological factors that have important linkage to metallurgical processing can be isolated and spatially constrained. Some highlights that would have to be considered from even this elementary representation.
• Sulphide minerals and their distribution • Sulphide ore is zoned with
chalcopyrite, pyrite and pyrrhotite located in the lower part of the lens (Spot 1) and in the central root of the deposit (Spot 3). In contrast, galena (and thus likely silver if it is present) is in the top of the lens, associated with sphalerite, pyrite and barite. Contacts between the zones are gradational, but clearly the grade
and metal ratios will change over the mine life.
• The presence of pyrite and/or pyrrhotite and the relative abundance of these sulphide gangue minerals will probably effect flotation selectivities
• The flowsheet must be robust enough to recover the Cu, Zn, Pb and possibly silver, as the ratios change throughout the mine life
• Distribution of ore minerals with respect to silicate minerals • Difference in hardnesses cause
difficulties in grinding. Careful mine planning could address the problems at the top and sides of the deposit, where the ore is in contact with hard siliceous materials that is oxidized (Spot 2, top) or sericitized (Spot
5, side). However, the difference between the relatively soft massive sulphide ore at Spot 1 and the brecciated/disseminated ore depicted at Spot 4 must be addressed during flowsheet development.
• Alteration (Spot 3, 4) • There are at least three types of
alteration associated with this deposit, pyrite and hematization (Spot 2), chloritization (Spot 3) and sericitization (Spot 5). Again, depending on mine planning, the pyrite-hematite material might be avoided (Spot 2), but it will be impossible to avoid processing chloritized and likely the sericitized material as well.
• Implications for metallurgy will possibly be poorer flotation selectivities in highly altered zones.
• Presence of gold, silver and arsenic • Sweetners such as gold and silver
can be associated with volcanogenic massive sulphide deposits. As well, smelter-penalty elements such as arsenic and mercury can occur. If applicable, the distribution of all of these elements would have to be included in the matrix.
Based upon this simplistic example, a geometallurgical matrix of 36 cells (3*4*5) would be established (Figure 6) and this would increase to 60, if there was a fault.
• Alteration (Spot 3, 4)
- There are at least three types of alteration associated with this deposit, pyrite and hematization (Spot 2), chloritization (Spot 3) and sericitization (Spot 5). Again, depending on mine planning, the pyrite-hematite material might be avoided (Spot 2), but it will be impossible to avoid processing chloritized and likely the sericitized material as well.
- Implications for metallurgy will possibly be poorer flotation selectivities in highly altered zones.
• Presence of gold, silver and arsenic
- Sweetners such as gold and silver can be associated with volcanogenic massive sulphide deposits. As well, smelter-penalty elements such as arsenic and mercury can occur. If applicable, the distribution of all of these elements would have to be included in the matrix.
Based upon this simplistic example, a geometallurgical matrix of 36 cells (3*4*5) would be established (Figure 6) and this would increase to 60, if there was a fault.
Figure 6 Geometallurgical matrix for a simple, unmetamorphosed, unfaulted and unweathered
massive sulphide deposit. Development of a Geometallurgical Matrix for a Porphyry Copper-Gold-Molybdenum deposit A porphyry-style deposit is a large 3 to 8 km across body of intrusive rock that contains disseminated typically less than 1% Cu, 200 ppm Mo and 0.5 g/t (or less) Au. As a group and individually, these deposits (including porphyry copper, copper-gold and copper molybdenum variants) have been extensively studied due to the exploration and development from 1950 to 1980 in North and South America. From this, there have arisen well constrained genetic models that outline the geology, mineralogy, alteration, geochemistry, metal sources and complex series of ore-forming processes (Jerome, 1966, Lowell and Guilbert, 1970, Lowell, 1974, McMillan and Panteleyev, 1980, Beane and Titley, 1981, Titley, 1993, and Sillitoe, 1993).
Figure 6 Geometallurgical matrix for a simple, unmetamorphosed, unfaulted and unweatheredmassive sulphide deposit.
DEVELOPMENT OF A GEOMETALLURGICAL MATRIX FOR A PORPHYRY COPPER-GOLD-MOLYBDENUM DEPOSITA porphyry-style deposit is a large 3 to 8 km across body of intrusive rock that contains disseminated typically less than 1% Cu, 200 ppm Mo and 0.5 g/t (or less) Au. As a group and individually, these deposits (including porphyry copper, copper-gold and copper molybdenum variants) have been extensively studied due to the exploration and development from 1950 to 1980 in North and South America. From this, there have arisen well constrained genetic models that outline the geology, mineralogy, alteration, geochemistry, metal sources and complex series of ore-forming processes (Jerome, 1966, Lowell and Guilbert, 1970, Lowell, 1974, McMillan and T, 1980, Beane and Titley, 1981, Titley, 1993, and Sillitoe, 1993).
While there are fundamental differences between porphyry copper, copper-T and gold deposits that must be recognized, commonalties include shallow T of T porpyrytic intrusions into older crustal rocks followed by apical development
5

SGS MINERALS SERVICES TECHNICAL BULLETIN 2004-01
of a zoned sequence of hydrothermal sulphide mineralization and alteration. The mineralization and alteration is controlled by the composition of the younger mineralizing intrusion, the host rocks and structural setting as well as the density and extent of fracturing and crackle breccia. Thus the complex mineralization “episode” overprints the existing geology and structure which in itself is often complex. The entire package can then be subjected to deep weathering or saprolitized.
Most simplistically, there is a complex sequence of events:• Magmatic emplacement into multiple
host rocks and a pre-existing structural setting
• Ore formation characterized by a barren core, an ore shell, a pyrite halo or zone, a low pryite zone and veins)
• Hydrothermal alteration, classically expected to be potassic, phyllic, argillic, propylitic in nature from the core outward
• ± Faulting• Weathering & ore remobilization
resulting in a leached cap and pos-sibly an enriched chalcocite blanket depending on the age, climate and erosion.
A geometallurgical matrix for such a deposit is very complex. It would consist of six rock types (two host rocks and four intrusive events), potentially eight alteration suites and a suite of critical parameters (Table 4). Clearly each individal case will have their own suites of rock, alteration and parameters. The total number of permutations that could exist depends on the specific deposit. In this case shown, the geomatrix would consist of 384 cells!
However, experience has shown that many of these cells either do not exist or are so economically insignificant as to be classified as non-existent. Further, often two or more classes are very similar and so can be grouped together. Applying such logic frequently halves the number of possible classes. Using our example of 384 possible classes, likely the actual number of categories one would need to realistically consider in a geometallurgical mapping program would be thirty to forty.
ROCK TYPES ALTERATION TYPES CRITICAL PARAMETERS
Calcareous country rock Hypogene Barren core
Non-calcareous country rock Potassic alteration Pyrite zone
Volcanic host rocks Phyllitic alteration ± Gold
Quartz diorite Argillic alteration ± molybdenite
Granodiorite Propylitic alteration Crackle breccia
Quartz monzonite Supergene Caldron subsidence fractures
Leached cap Chalcopyrite vs bornite
Enriched blanket Chalcocite, covellite
Table 4 Potential components for a geomatrix from a complex porphyry-style deposit
TOOLS FOR ORE CHARACTERIZATION
MINERALOGYOne of the key assumptions in the geometallurgical mapping methodology outlined here is that the mineralogy of the sample and the distribution of those minerals throughout x-y-z space, ultimately controls the grade, recovery and hardness, thus the metallurgical performance and economic value of any project.
It becomes elementary then, that any geometallurgical program should include a systematic mineralogical assessment to determine and/or confirm the• Mineral phases present (primary,
secondary, gangue) major and trace• Their deportment/texture (e.g. rimming,
replacement, psuedomorphing, recrystallized)
• Mineral association• Particle size(s)• Liberation characteristics
There is a wide range of technology available to assist with this, from the traditional petrographic microscopy for optical evaluations to XRD, SEM, electron microprobe and the most recent advance QEMScan (QEM Scan Quantitative Evaluation of Minerals Using SCANning Electron Microscopy). Given the wide variety of minerals and textures often observed, the data sets encompassing all this data can be stupendous in size and the recent developments in computer data handling are essential.
Samples selected for an analysis for a tool such as QEMScan are coarsely crushed so as not to destroy mineral association textures or create a large
amount of fines. The samples are screened to generate approximately +0.3 mm fractions (depending on individual ore characteristics).
The following parameters are determined by QEMScan• mineral volume and weight percent• metal assay,• mineral association percent• normalised mineral association percent• mineral mean intercept length (μ)• estimated mean mineral sieve size (μ)• mineral surface area per unit volume
(mm2/mm3)• phase specific surface area (mm2/mm3
– PSSA)• surface area ratio (%).
QEMScan can determine a parameter known as Phase Specific Surface Area. This is a measure of “surface area to volume”. Samples with low PSSA (<50) are characterized by large blocky grains that are easy to liberate as opposed to samples with high PSSA (over 200) which are fine grained, finely intergrown and show complex textural relationships. In many deposits, low PSSA are characteristics of high concentration efficiencies (high flotation recovery).
Such data integrates back into the geological picture determined by drill-ing: it highlights the zonation, clarifies the alteration, shows the extent of metamorphism (through recrystallization and specific mineral development) and allows the mineralogical manifestation of structural events to be mapped out. This data can be integrated forward to provide a strong objective, mappable ground-ing to subsequent metallurgical testing. It can provide clear direction to the metallurgical testing program, allowing it to focus on the key relationships that control the economic value equation.
6

SGS MINERALS SERVICES TECHNICAL PAPER 2004-01
CHEMISTRYChemical analyses are always incorporated in the geometallurgical mapping program and provide the data for perhaps the most typical block-model construct. “Total analyses” are the most common analysis performed. However, less routine chemical analysis such as specific speciation analysis or segmented diagnostic leaching (Table 5) can also provide information to augment metallurgical or mineralogical interpretations.
For example• Analysis of cyanide-soluble gold for
gold recoverable by a cyanide recovery process is a type of speciation analysis Analysis of cyanide-soluble gold for gold recoverable by a cyanide recovery process is a type of speciation analysis
• Cu 2+ and Fe 2+ are soluble in sulphuric acid can be tested by speciation analy-sis to determine the level of potential interferents to gold recovery by cyanide
• Sequential leaches (Table 5) are used to determine copper mineral speciation. These steps include first determining copper soluble in sulphuric acid as an indication of copper that could be recovered by an acid leach operation. Next, copper soluble in cyanide solution is an indication of copper that could be recovered by a bacterially assisted leach process. This sequence is finished with a four acid digest to indicate the residual amount of copper that is predominately chalcopyrite. When performing such extractions, it is important to determine if enargite (Cu3AsS4) is present since approximate-ly 60-70% of the enargite will dissolved in cyanide solution but none will in the case of bacterially assisted leaching. The inclusion of total arsenic analy-sis in the diagnostic suite is a useful alert and can be used to calculate “enargite”content.
• The use of citric acid soluble copper as an indicator of secondary oxidation minerals (such as malachite, azurite and chrysocolla) that will not be recovered in a sulphidebased copper flotation recovery process.
The addition of this type of chemical classification can bring additional value to the block model database.
STEP 1 2 3 4
Secondary Oxidation Minerals
Secondary sulphide minerals
Secondary sulphide minerals
Primary ore
Mineralogy Malachite, azurite
Chalcocite Covellite, Bornite
Chalcopyrite
Type of leach Citric acid Sulphuric acid Cyanide leach 4 acid digest
Table 5 Diagnostic sequential leaching of copper ores
GRINDINGGrinding is an inefficient, energy intensive process. Grinding circuits are also usually a very significant component of both the capital and operating costs of a processing concentrator. As well, SAG mill throughputs are quite sensitive to ore hardness. SAG mill circuits are inevitably designed to achieve a target grind size and target throughput whilst treating a hard ore type. Typically, the circuit is designed on the 90th or 95th percentile hardness. Implicit in this approach is that the variation of hardness in the orebody has been documented. These factors make it imperative to quantify the variation in the grindability of the ore throughout the deposit.
To quantify this variability, we must consider the variability in hardness per a size of particle. Hardness frequently changes from the ball mill feed size-range through to the SAG mill feed size-range. Consequently, there are several tests to map variability in grindability.
Bond Ball Mill Work IndexThis test determines ball mill feed size and uses about 10 kg of –6mesh feed material. This is a well known test that should always be included in a mapping program.
Bond Rod Mill Work IndexThis test uses feed size of –1/2” and requires about 20 kg. It is less commonly used but is used by some practitioners to dimension SAG mill circuits (Barratt, 1989).
SPI TestThis test, for SAG mill feed size material, needs about 10 kg and uses 80% -1/2”feed material. It is used to map SAG mill rock size, hardness variability and is also used by some practitioners to dimension SAG mill circuits using CEET software (Dobby et al, 2001).
JK Drop Weight TestThis test, called the SMC test uses SAG mill feed size material. It needs about 5 kg and requires 1” material (larger is also possible). The SMC test is an abbreviated JK Drop Weight test but using only one size fraction as opposed to the five size fractions that the full drop weight test uses. This test is used to map hardness. The test links to the full JK drop weight test. It is also used by some praction-ers to dimension SAG mill circuits using JK SIMMET software (Morrell in press, Morrell and Morrison, 1999).
SummaryA typical mapping program for grindability will use a Bond Mill work index and one of the Bond Rod Mill Work Index, the SPI test or the SMC test. The latter tests would map hardness variability at a coarser (SAG mill) size.
METALLURGICAL TESTWORKThe type of metallurgical test used in a geometallurgical mapping program will obviously be based around the core flowsheet for the project. Fast, low-cost standard tests are most appropriate for mapping variability in metallurgical response throughout a deposit, focusing on zones outlined by mineralogy (Table 6). Obviously, these tests could begravity concentration, flotation, leaching, cyanidation, amongst others.
Gravity GRG gold, float/sink tests
Flotation Ro kinetics, batch cleaner, locked-cycle tests
Leaching bottle rolls, amenability testing
Table 6 Typical bench scale tests useful for geometallurgical mapping
7
SGS MINERALS SERVICES TECHNICAL BULLETIN 2004-01
When selecting a standard test for geometallurgical mapping program, there are a few general criteria. The test:
• Must be a standard. Quite a lot of time needs to be put into establishing a very precise standard test protocol.
• Should be ‘simple’. Multi-process component tests will increase the probability of higher variance on test reproducibility.
• Should be low-cost. There will be a lot of tests in the program, so budget consideration are important. Laying off the unit cost of the test is the value of the information received from the test. This will be discussed in further detail with reference to selection of type of test for flotation.
• Must represent the ore recovery process (either from an existing concentration flowsheet or from a flowsheet established in an extensive laboratory-based flowsheet development program
• Must ‘tie-in’ to existing data. If one already has an existing database of geometallurgical mapping programs, then one needs to consider the ‘tie-in’ of a new program data set with the existing data set. If the identical test can be run, then obviously this gives one automatically a ‘tie-in’. (This is also underlines why it is very important to have a very precise test protocol is established for these programs and that it is documented). If however, it is not practical, or desirable to run the identical test, one must still consider how one gets a logical bridge between previous data sets and a new data set.
• Must be practical. As geometallurgi-cal mapping programs are often large, one would want a relatively fast test procedure. If a small team can be effectively put to the program, this will not only speed the program up but also may enhance test reproducibility.
FLOTATION BASED TEST PROGRAMThis paper will focus on methodology and interpretation as it relates to a flotation-based flowsheet but other flowsheets would be subjected to similar logic.
The first questions to resolve, with a flotation-based testwork program, is what type of test will be used as the standard test. We have seen programs that use single point rougher test; rougher kinetic test, batch cleaner test or a full locked cycle test. The simplicity of the flowsheet and the metallurgy is a good guide for selecting which test is used. A simple flowsheet/simple metallurgy probably (good concentrate grade and recoveries) would indicate a rougher-based test could be used. An example of this would be a copper flotation from a porphyry copper deposit.
A deposit with complex metallurgy and a complex flowsheet will probably need a locked cycle based flotation program. A guide for electing the use of a locked cycle based program is to look at the amount of valuable metal left in open-circuit batch cleaner test middling products. If this is more than 10% of the total valuable metal units, then a locked cycle test should be considered.
Usually, we consider using a rougher test with kinetics as the standard rougher test. This test not only provides information about total recovery but also gives an indication of metallurgical performance and the fast-floating and slow-floating components of the flotation system.
It is also possible to use a single rougher flotation test as the standard test. This test provides very limited information, but can be used to provide a preliminary screen on samples, leading to a second and third phase of a testwork program. In the latter phase of such a program, samples with abnormal behavior would be further studied. This approach is only recommended for sample sets with expected good metallurgical response.
FLOTATION TESTWORK METHODOLOGY Having elected the type of test for the mapping program, it is then necessary to focus on a very precise test protocol that will cover everything from sample preparation to analysis of flotation products. The protocol needs to address these issues (and more). Given here are those critical items:
PRIMARY GRIND There are two approaches to primary grind, being to fix primary grind size or fix primary grind time and take variability in hardness as giving variability in primary grind size. The election of one of these two routes is a critical election that needs to be made. Neither route will exactly mimic a plant operation, as variability in ore hardness will lead to probable plant variation in both grind size and flotation residence time.
Fixing primary grind size enables one to separate metallurgical variance due to ore mineralogy versus metallurgical variance due to ore hardness (which would be separately studied). However, in plant operation where throughput is designed at 90% or 95% ore hardness, a softer ore will probably lead to higher throughput and hence reduction in flotation residence time. So one would anticipate a reduction in overall recovery due to a reduction in flotation residence time.
Fixing primary grind time enables one to take variability in primary ore hardness as a variation in primary grind size whilst maintaining throughput. Thus in this scenario, flotation retention time is constant. However, a coarsening of primary grind size will inevitably lead to a loss in recovery and one will not know whether that loss in recovery comes from just a change in grind size or mineralogical variance or both.
The authors of this paper prefer to fix primary grind size and understand the mineralogical/geological variance as it impacts on metallurgy. If one takes this approach, a complete model also needs to understand the flotation retention time/recovery relationship.
REGRIND The same arguments as outlined above for primary grind are relevant for regrind. The plant design impact is, however, less. The need to ‘pin this down’ is less important. Usually regrind would most directly effect concentrate grade and less have impact on overall recovery. Given this, and for testwork simplicity, it is often sufficient to just set a regrind time and accept variability on regrind product size in the mapping program. Then a
8
SGS MINERALS SERVICES TECHNICAL PAPER 2004-01
second phase of testwork can be used to study the relationship between regrind size and metallurgical performance and concentrate grade.
GRINDING CONDITIONS Important parameters that need to be established (apart from grind time). These include, type of mill (rod mill, ball mill), mill charge (weight, size, type of metal/pebble, grinding % solids).
FLOTATION CONDITIONSImportant parameters here include; reagents, dosage and points of addition, flotation % solids, flotation machine speed, air addition, pH, Eh, time between flotation concentrates.
QUALITY CONTROL PROGRAMAny geometallurgical mapping program must include a quality control component. It is important to understand the variance in the testwork results, so that one can establish whether total variance realized is dependent on some independent variable or on testwork error.
A quality control program should examine the error in each step of the process. Ideally, this is sample preparation, test operation and chemical analyses. The latter two are easy to check. Sample preparation is difficult to check (unless one had a lot of sample weight, which is frequently not the case). Blind repeats of 5-10% of the tests and assay is the suggested way to check these.
PROGRAM EXECUTIONThe total number of samples used in a geometallurgical mapping program depends on
• The complexity or size of the matrix (that is the total number of meaningful permutations that are established for the orebody)
• The availability of samples for the program
• The cost to get the samples• The value that is expected or required
from the geometallurgical program. What is the technical and economic risk for this project and to what extent must the geometallurgical variability be
• examined to satisfactorily mitigate that risk?
Table 7 gives an indication of the size of a geometallurgical mapping test work program.
TYPE OF TEST NUMBER
Assays 10,000++
Mineralogy 1000+
Grinding 100-300
Metallurgical Tests (e.g. flotation, bottle rolls)
100-300
Table 7 Possible number of tests needed in a geometallurgical mapping program
The entire geometallurgical mapping program needs to be pre-planned from a sample preparation through to data handling. A schedule of testwork should be established, incorporating repeats on tests and assaying. It is also important to consider the personnel component of a testwork program. It is necessary to maintain the same flotation operator on each test. If one is using a locked cycle test as the standard test, it is possible to break the test in two and have one operator on rougher flotation and another on cleaner flotation. For higher productivity, it is also possible to incorporate into a team another operator carrying out the grinding and product filtration.
DATA HANDLING
A geometallurgical mapping program can root the high cost exercises of mine evaluation, design and production planning in the physical reality of the deposit (Potts, 2003). Traditionally mine design and planning has been done using a “block model” or a three dimensional diagrammatic representation approach.
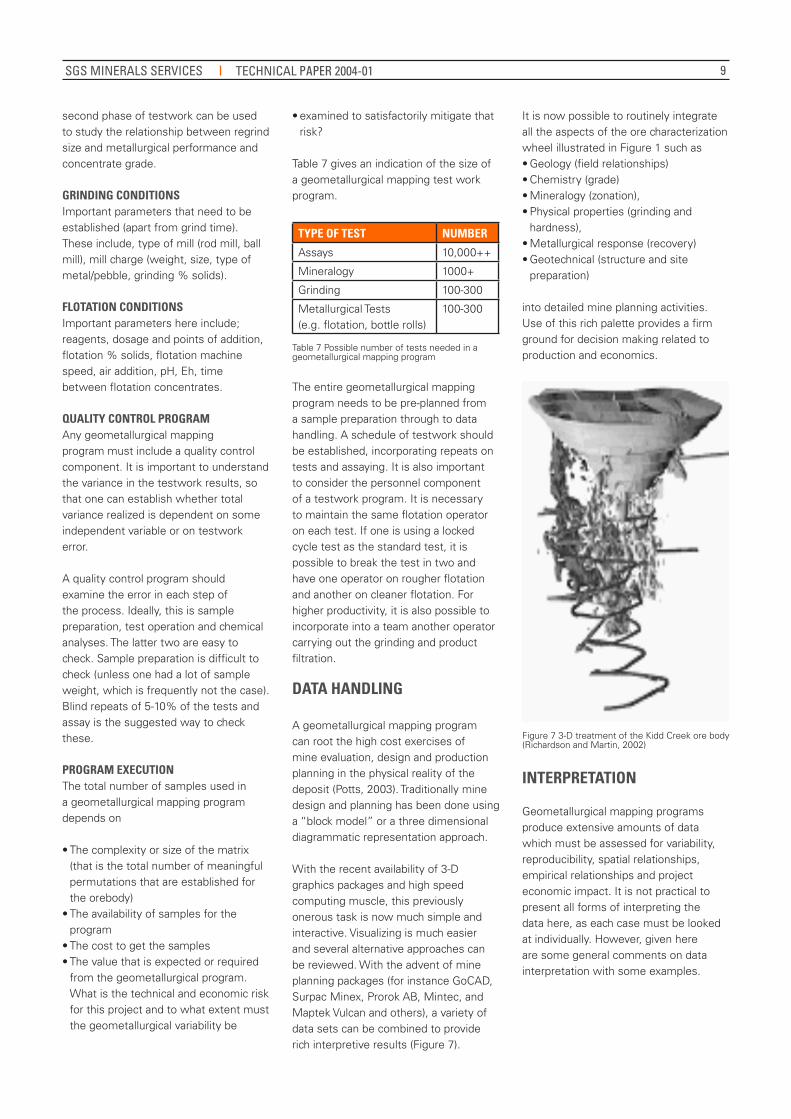
With the recent availability of 3-D graphics packages and high speed computing muscle, this previously onerous task is now much simple and interactive. Visualizing is much easier and several alternative approaches can be reviewed. With the advent of mine planning packages (for instance GoCAD, Surpac Minex, Prorok AB, Mintec, and Maptek Vulcan and others), a variety of data sets can be combined to provide rich interpretive results (Figure 7).
It is now possible to routinely integrate all the aspects of the ore characterization wheel illustrated in Figure 1 such as• Geology (field relationships)• Chemistry (grade)• Mineralogy (zonation),• Physical properties (grinding and
hardness),• Metallurgical response (recovery)• Geotechnical (structure and site
preparation)
into detailed mine planning activities. Use of this rich palette provides a firm ground for decision making related to production and economics.
It is now possible to routinely integrate all the aspects of the ore characterization wheel illustrated in Figure 1 such as • Geology (field relationships) • Chemistry (grade) • Mineralogy (zonation), • Physical properties (grinding and hardness), • Metallurgical response (recovery) • Geotechnical (structure and site preparation) into detailed mine planning activities. Use of this rich palette provides a firm ground for decision making related to production and economics.
Figure 7 3-D treatment of the Kidd Creek ore body (Richardson and Martin, 2002)
INTERPRETATION Geometallurgical mapping programs produce extensive amounts of data which must be assessed for variability, reproducibility, spatial relationships, empirical relationships and project economic impact. It is not practical to present all forms of interpreting the data here, as each case must be looked at individually. However, given here are some general comments on data interpretation with some examples.
Figure 7 3-D treatment of the Kidd Creek ore body (Richardson and Martin, 2002)
INTERPRETATION
Geometallurgical mapping programs produce extensive amounts of data which must be assessed for variability, reproducibility, spatial relationships, empirical relationships and project economic impact. It is not practical to present all forms of interpreting the data here, as each case must be looked at individually. However, given here are some general comments on data interpretation with some examples.
9

SGS MINERALS SERVICES TECHNICAL BULLETIN 2004-01
VARIABILITYThe use of bar graphs permits one to study the data variability. Standard statistical analysis can also be applied. Variability can be studied to determine if the data shows a normal distribution, or some non-normal distribution such as a bi-modal distribution (Figure 8 Variability of head grade ). If non-normal distribution is observed, can it be accounted for by a geological or mineralogical explanation?
Variability
The use of bar graphs permits one to study the data variability. Standard statistical analysis can also be applied. Variability can be studied to determine if the data shows a normal
distribution, or some non-normal distribution such as a bi-modal distribution (
Figure 8
Figure 8 Variability of head grade
). If non-normal distribution is observed, can it be accounted for by a geological or mineralogical explanation?
Figure 8 Variability of head grade
Reproducibility Reproducibility can be studied using standard statistical tools (Table 8).
Table 8 t-test analysis of duplicate flotation tests
Conc. Tails Heads Test K80 % Assays %
Distrib. t-test t-test t-test
No. µm -65M % prob. prob. prob. A 173 88.9 5.44 93.3 0.98 0.98 0.96
A (repeat) 167 89.7 5.58 91.9 B 227 78.4 4.75 94.6 1.00 0.99 0.88
B(repeat) 227 78.4 4.74 95.0 C 252 74.4 6.83 91.5 0.95 0.95 0.93
C (repeat) 273 71.8 6.59 89.0 D 178 87.1 4.39 94.4 0.97 0.96 0.97
D (repeat) 194 83.4 4.31 94.6
Head Grade
0
10
20
30
40
50
0.00-0.19
0.2-0.39
0.40-0.59
0.6-0.79
0.80-0.99
1.00-1.19
1.20-1.39
1.40-1.59
1.6-1.79
1.8-1.99
2-2.19
%
Num
ber o
f sam
ples
Figure 8 Variability of head grade
REPRODUCIBILITYReproducibility can be studied using standard statistical tools (Table 8).
TEST
NO.
K80
µm
%
-65M
ASSAYS
%
%DISTRIB.
CONC.T-TEST
PROB.
TAILST-TEST
PROB.
HEADST-TEST
PROB.
A 173 88.9 5.44 93.3 0.98 0.98 0.96
A (repeat) 167 89.7 5.58 91.9
B 227 78.4 4.75 94.6 1.00 0.99 0.88
B (repeat) 227 78.4 4.74 95.0
C 252 74.4 6.83 91.5 0.95 0.95 0.93
C (repeat) 273 71.8 6.59 89.0
D 178 87.1 4.39 94.4 0.97 0.96 0.97
D (repeat) 194 83.4 4.31 94.6
E 202 81.9 4.32 94.3 0.96 0.96 0.94
E (repeat) 203 82.3 4.16 94.5
F 141 93.0 4.91 92.6 0.95 0.94 0.97
F (repeat) 156 92.1 5.04 96.1
G 194 85.0 5.17 95.6 0.99 0.98 0.64
G (repeat) 199 83.9 5.14 96.4
Table 8 t-test analysis of duplicate flotation tests
SPATIAL RELATIONSHIPS The basis of the geo-metallurgical mapping program is the geo-metallurgical matrix of sample class. This classification will inevitably have a spatial basis.
All the data needs to be studied for its spatial relationship using the block model software. Specifically, we would look for spatial profiles or ‘halos’ for an element of interest (Figure 9). An element of interest could be anything from a chemical assay, mineralogical occurrence, metallurgical performance or grindability. The use of spatial analysis can assist in process development (e.g. use of leaching or flotation in a por-
phyry copper system), mine planning, economic analysis (will this ore-block be ore, low-grade dump or waste), production forecasting (for example, throughput on the SAG mill is forecast to be “x tonnes per hour” on this block).
E 202 81.9 4.32 94.3 0.96 0.96 0.94 E(repeat) 203 82.3 4.16 94.5
F 141 93.0 4.91 92.6 0.95 0.94 0.97 F(repeat) 156 92.1 5.04 96.1
G 194 85.0 5.17 95.6 0.99 0.98 0.64 G(repeat) 199 83.9 5.14 96.4
Spatial Relationships The basis of the geo-metallurgical mapping program is the geo-metallurgical matrix of sample class. This classification will inevitably have a spatial basis. All the data needs to be studied for its spatial relationship using the block model software. Specifically, we would look for spatial profiles or 'halos' for an element of interest (Figure 9). An element of interest could be anything from a chemical assay, mineralogical occurrence, metallurgical performance or grindability. The use of spatial analysis can assist in process development (e.g. use of leaching or flotation in a porphyry copper system), mine planning, economic analysis (will this ore-block be ore, low-grade dump or waste), production forecasting (for example, throughput on the SAG mill is forecast to be “x tonnes per hour” on this block).
Figure 9 Example of 3-D graphic showing Na2O distribution around the Kidd Creek Mine
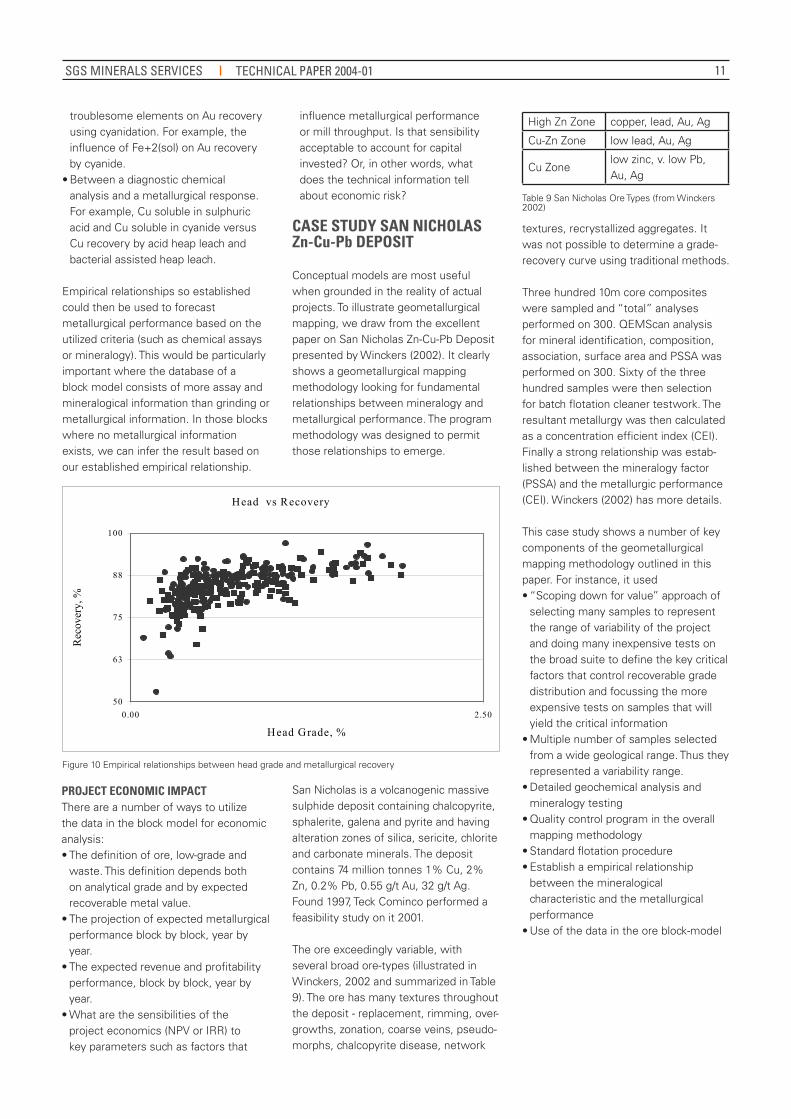
Empirical Relationships The methodology outlined in this paper is based on the premise that grinding and metallurgical performance is a function of the geology relationships and mineralogy of the sample. Empirical relationships discern those geological or mineralogical components that influence grinding or metallurgical response)(Figure 10). Some examples of metallurgical relationships that one could look for are the relationship • Between head grade and metallurgical performance
Figure 9 Example of 3-D graphic showing Na2O distribution around the Kidd Creek Mine
EMPIRICAL RELATIONSHIPS The methodology outlined in this paper is based on the premise that grinding and metallurgical performance is a function of the geology relationships and mineralogy of the sample. Empirical relationships discern those geological or mineralogical components that influence grinding or metallurgical response)(Figure 10).
Some examples of metallurgical relationships that one could look for are the relationship• Between head grade and metallurgical
performance• On metallurgical performance of an
element dependant on another element or mineralogy (e.g. Au recovery vs Cu recovery or Cu recovery vs pyrite content)(can be positive or negative)
• Between grain size and on metallurgical performance. For example, the QemSCAN PSSA factor vs Cu metallurgical performance. Between
10
SGS MINERALS SERVICES TECHNICAL PAPER 2004-01
troublesome elements on Au recovery using cyanidation. For example, the influence of Fe+2(sol) on Au recovery by cyanide.
• Between a diagnostic chemical analysis and a metallurgical response. For example, Cu soluble in sulphuric acid and Cu soluble in cyanide versus Cu recovery by acid heap leach and bacterial assisted heap leach.
Empirical relationships so established could then be used to forecast metallurgical performance based on the utilized criteria (such as chemical assays or mineralogy). This would be particularly important where the database of a block model consists of more assay and mineralogical information than grinding or metallurgical information. In those blocks where no metallurgical information exists, we can infer the result based on our established empirical relationship.
• On metallurgical performance of an element dependant on another element or
mineralogy (e.g. Au recovery vs Cu recovery or Cu recovery vs pyrite content)(can be positive or negative)
• Between grain size and on metallurgical performance. For example, the QemSCAN
PSSA factor vs Cu metallurgical performance. • Between troublesome elements on Au recovery using cyanidation. For example, the
influence of Fe+2(sol) on Au recovery by cyanide. • Between a diagnostic chemical analysis and a metallurgical response. For example,
Cu soluble in sulphuric acid and Cu soluble in cyanide versus Cu recovery by acid heap leach and bacterial assisted heap leach.
Empirical relationships so established could then be used to forecast metallurgical performance based on the utilized criteria (such as chemical assays or mineralogy). This would be particularly important where the database of a block model consists of more assay and mineralogical information than grinding or metallurgical information. In those blocks where no metallurgical information exists, we can infer the result based on our established empirical relationship.
Figure 10 Empirical relationships between head grade and metallurgical recovery
Project Economic Impact There are a number of ways to utilize the data in the block model for economic analysis:
Head vs Recovery
50
63
75
88
100
0.00 2.50
Head Grade, %
Rec
over
y, %
Figure 10 Empirical relationships between head grade and metallurgical recovery
Table 9 San Nicholas Ore Types (from Winckers 2002)
PROJECT ECONOMIC IMPACT There are a number of ways to utilize the data in the block model for economic analysis:• The definition of ore, low-grade and
waste. This definition depends both on analytical grade and by expected recoverable metal value.
• The projection of expected metallurgical performance block by block, year by year.
• The expected revenue and profitability performance, block by block, year by year.
• What are the sensibilities of the project economics (NPV or IRR) to key parameters such as factors that
influence metallurgical performance or mill throughput. Is that sensibility acceptable to account for capital invested? Or, in other words, what does the technical information tell about economic risk?
CASE STUDY SAN NICHOLAS Zn-Cu-Pb DEPOSIT
Conceptual models are most useful when grounded in the reality of actual projects. To illustrate geometallurgical mapping, we draw from the excellent paper on San Nicholas Zn-Cu-Pb Deposit presented by Winckers (2002). It clearly shows a geometallurgical mapping methodology looking for fundamental relationships between mineralogy and metallurgical performance. The program methodology was designed to permit those relationships to emerge.
San Nicholas is a volcanogenic massive sulphide deposit containing chalcopyrite, sphalerite, galena and pyrite and having alteration zones of silica, sericite, chlorite and carbonate minerals. The deposit contains 74 million tonnes 1% Cu, 2% Zn, 0.2% Pb, 0.55 g/t Au, 32 g/t Ag. Found 1997, Teck Cominco performed a feasibility study on it 2001.
The ore exceedingly variable, with several broad ore-types (illustrated in Winckers, 2002 and summarized in Table 9). The ore has many textures throughout the deposit - replacement, rimming, over-growths, zonation, coarse veins, pseudo-morphs, chalcopyrite disease, network
High Zn Zone copper, lead, Au, Ag
Cu-Zn Zone low lead, Au, Ag
Cu Zonelow zinc, v. low Pb, Au, Ag
textures, recrystallized aggregates. It was not possible to determine a grade-recovery curve using traditional methods.
Three hundred 10m core composites were sampled and “total” analyses performed on 300. QEMScan analysis for mineral identification, composition, association, surface area and PSSA was performed on 300. Sixty of the three hundred samples were then selection for batch flotation cleaner testwork. The resultant metallurgy was then calculated as a concentration efficient index (CEI). Finally a strong relationship was estab-lished between the mineralogy factor (PSSA) and the metallurgic performance (CEI). Winckers (2002) has more details.
This case study shows a number of key components of the geometallurgical mapping methodology outlined in this paper. For instance, it used• “Scoping down for value” approach of
selecting many samples to represent the range of variability of the project and doing many inexpensive tests on the broad suite to define the key critical factors that control recoverable grade distribution and focussing the more expensive tests on samples that will yield the critical information
• Multiple number of samples selected from a wide geological range. Thus they represented a variability range.
• Detailed geochemical analysis and mineralogy testing
• Quality control program in the overall mapping methodology
• Standard flotation procedure• Establish a empirical relationship
between the mineralogical characteristic and the metallurgical performance
• Use of the data in the ore block-model
11

SGS MINERALS SERVICES TECHNICAL BULLETIN 2004-01
CONCLUSIONS
• Geometallurgical mapping is a powerful integrated approach to project development and planning as it can be used to link primary ore attributes to metallurgical processing and mine eco-nomics. Sampling is a team effort and is most effective if it is focussed using the geomatrix.
• Ore characterization is more robust due to the new technical tools that are available to generate data “Scoping down for value” approach of selecting many samples to represent the range of variability of the project and doing many inexpensive tests on the broad suite to define the key critical factors that control recoverable grade distribu-tion and focussing the more expensive tests on samples that will yield the critical information
• Metallurgical testing data can now be integrated with 3D block modeling
Geometallurgical mapping and ore characterization allows the integration of ore characterization data into flowsheet development and also block modeling. This means more robust processing circuits and better mine planning. The means better data and communication and reduces risk.
REFERENCES
Barrett, D.J. 1989 An Update on Testing, Sale-ups and Sizing Equipment for Autogenous and Semi-autogenous Grinding Circuits, in “Advances in autogenous and Semiautogenous Grinding Technology” p. 25, Edited by Mular and Agar, 1989
Beane, R.E. and Titley, S.R. 1981 Porphyry copper deposits. II: Hydrothermal alteration and mineralization: Economic Geology, 75th Anniversary Volume, p. 235-269
Dobby G., Bennett C., Kosick, C, 2001, Advances in SAG Circuit Design and Simulation Applied - The Mine Block Model, “International autogenous and Semi-autogenous Grinding Technology 2001, V.4 p.221, Edited by D.J. Barratt, Allan, Mular, 2001
Franklin, J.M. Volcanic-Associated massive sulphide Deposits, in Mineral Deposits Modeling, p. 315-334. GAC Special Paper 40, Edited by R.V. Kirkham, WS Sinclair, RI Thorpe and JM Duke. 797p.
Jerome, S.E., 1996, Some features pertinent in exploration of porphyry copper deposits, in Titley, S.R. and Hicks, C.L. eds., Geology of the Porphyry Copper Deposits, Southwestern North America: University of Arizona Press, Tucson, AZ, p. 75-85
R.V. Kirkham, WS Sinclair, RI Thorpe and JM Duke. editors 1993 Volcanic-Associated massive sulphide Deposits, in Mineral Deposits Modeling, GAC Special Paper 40, 797p.
Morrell, S., 2004, Determination of the Drop Weight Index using the SMC test and its use in orebody profiling, comminution circuit design and optimization, In publication, Mineral Engineering, 2004
Morrell S. and. Morrison. R.D. , 1996 AG and Sag Mill Circuit Selection and Design by Simulation. In “International autogenous and Semi-autogenous Grinding Technology”, V2, page 769, Edited by Mular, Barratt and Knight, 1996
McMillan, W.J. and Panteleyev, A., 1980 Ore Deposit Models 1: Porphyry copper deposits: Geoscience Canada, v. 7, p. 52-63
Lowell, J.D. 1974, Regional characteristics of porphyry copper deposits of the Southwest: Economic Geology v. 69, p. 601-617 Lowell, J.D. and Guilbert, J.M., 1970 Lateral and vertical alteration zoning in porphyry ore deposits: Economic Geology, v. 65, p. 373-408
Lydon, J. 1984. Volcanogenic massive sulphide deposits, Part 1. A Descriptive Model. Geoscience Canada, V.11, p.195-202.
Potts, A. 2003. Mine planning. Mining Magazine April 2003 , p.156-165
Titley, S.R. 1993, Characteristics of porphyry copper deposits in the American southwest, in Mineral Deposits Modeling, p. 433-464. GAC Special Paper 40, Edited by R.V. Kirkham, WS Sinclair, RI Thorpe and JM Duke, 797p.
Richardson, D. and Martin, L, 2002, Evaluation of Exploration Targets Using 3D GID (GOCAD) at Kidd Creek, www.mirageoscience.com/publications/?dir=User%20Presentations
Sillitoe, R.H.1993, Gold-rich porphyry copper deposits: Geological Model and exploration Implications, p.465-478in Mineral Deposits Modeling, GAC Special Paper 40, Edited by R.V. Kirkham, WS Sinclair, RI Thorpe and JM Duke, 797p.
Winckers A.H. 2002. Metallurgical mapping of the San Nicholas deposit” Proceedings of the 2002 annual Meeting of the Canadian Mineral Processors.
12

SGS MINERALS SERVICES TECHNICAL PAPER 2004-01
© 2011 SGS. All rights reserved. The information contained herein is provided “as is” and SGS does not warrant that it will be error-free or will meet any particular criteria of per-formance or quality. Do not quote or refer any information herein without SGS’ prior written consent. Any unautho-rized alteration, forgery or falsification of the content or appearance of this document is unlawful and offenders may be prosecuted to the fullest extent of the law.
CONTACT INFORMATION
Email us at [email protected]
WWW.SGS.COM/MINERALS
SG
S Te
chni
cal P
aper
#20
04-0
1
13