geopolitics of energy - ceri · adnan shihab-eldin paul sullivan paul tempest geopolitics of energy...
TRANSCRIPT
Geopolitics
of Energy Volume 38, Issue 3
March 2016
Editorial Committee Paul Kralovic Dinara Millington Megan Murphy Jon Rozhon Allan Fogwill Advisory Board Kimble Ainslie Yasser Al-Saleh Anis Bajrektarevic Fred Banks Fatih Birol John Brunton Zachary Cuyler Athanasios Dagoumas Alberto Cisneros Lavaller Napier Collyns George Eynon Floros Flouros Herman Franssen Ieda Gomes Antoine Halff David Howell Seyed Jazayeri Wenran Jiang Larry Kaufmann Alex Kemp Walid Khadduri David Knapp Mikhail Krutikhin Vadim Loktionov Michael Lynch Keun-wook Paik Karl Pinno David Pumphrey Adnan Shihab-Eldin Paul Sullivan Paul Tempest
Geopolitics of Energy was founded by the late Melvin A. Conant of Washington, DC in 1979. Since 1993, it has been published under the auspices of the Canadian Energy Research Institute. All views expressed in this journal are those of the individual authors and do not reflect the views of the Canadian Energy Research Institute.
Inside this Issue... Low Oil Price Impact on Latin American Non-Conventionals Page 2 Alberto Cisneros Lavaller Dr. Lavaller reviews the history of oil price declines over the last 40 years to put the current one into context. He projects three scenarios of supply and demand responses showing the range of price improvements from a short– and long-term perspective. While some oil developments are facing delays, the overall impact on Latin American non-conventional markets is expected to be minimal.
Economic and Geopolitical Impacts of the End of Crude Export Restrictions Page 8 Zachary Cuyler and David Pumphrey The authors’ view of the impact of lifting crude export restrictions is that the international oil market will become more resilient to supply disruptions. The US entry to the export market provides an additional supply option for consuming countries. Without export controls, the US government will have fewer international levers to affect the activities of other governments.
®

GEOPOLITICS OF ENERGY/MARCH 2016 2
Low Oil Price Impact on Latin American Non-Conventionals
Dr. Alberto Cisneros Lavaller
This article discusses, from a historical perspective, previous oil price downfalls. Such a preliminary analysis will help garner a better understanding of the current low oil price situation and the implications for Latin America. As well, this article attempts to study the last three price downfalls over the last thirty years. We then turn our attention to the impact of those low prices on the developments of non-conventional oil developments such as deep waters, extra heavy oils, pre-salt and shale oil. In this regard, it is worth clarifying that “non-conventional oils” is a wide-open definition encompassing difficult plays to develop as well as shale developments. In other words, all plays other than conventional or light “easy fields” to develop. In a crisis situation like the one currently caused by low oil prices, it is significant to begin with a thorough analysis to understand: i) the crisis dimension, and ii) its impact amidst other similar international oil market crunches that have taken place in the
past. In reviewing those critical situations through a longitudinal analysis, it is possible to historically identify three previous oil price downfalls over the last 30 years. The first one took place from 1983 to 1990. The second started in late 1997, early 1998 and the third one erupted in 2009. Oil Prices: Downturns Compared ($/b)
The first oil price crisis during contemporary times started in early 1983 due to, among other factors, a huge buildup of stocks during 1982. In a relatively short timeframe (8 months), prices plunged from $30/b in November 1983 to $12/b by July 1984; a two-thirds downfall equivalent to almost $20/b. OPEC at that time decided unilaterally on a strategy to ramp up prices (Price Defense) in order to support prices through significant production cuts and implementing quotas. Within that international oil market environment, the role of the Organization was that of a swing producer and within it, Saudi Arabia was the producer of ultimate resort. As a consequence, in the summer of 1986 Saudi production fell just above 2 Mb/d from a peak production of 10 Mb/d in 1980 during the Iranian crisis.
Introduction
The First Price Crisis: OPEC on Her Own
3 GEOPOLITICS OF ENERGY/MARCH 2016
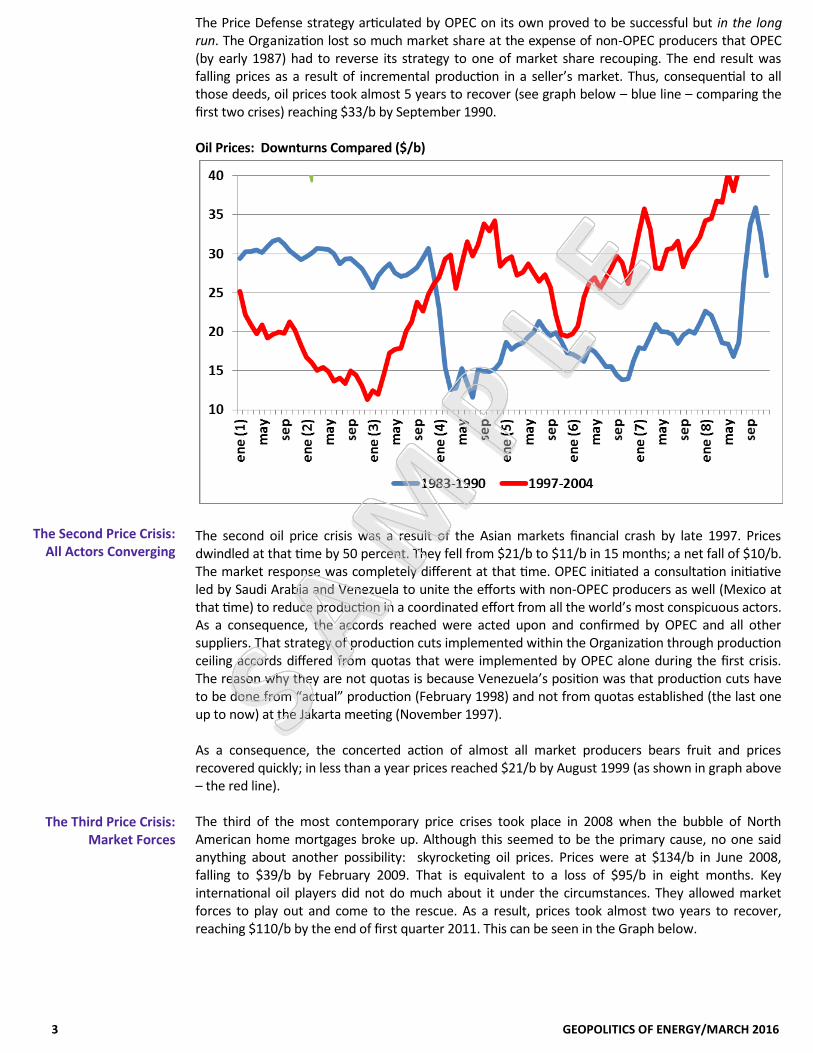
The Price Defense strategy articulated by OPEC on its own proved to be successful but in the long run. The Organization lost so much market share at the expense of non-OPEC producers that OPEC (by early 1987) had to reverse its strategy to one of market share recouping. The end result was falling prices as a result of incremental production in a seller’s market. Thus, consequential to all those deeds, oil prices took almost 5 years to recover (see graph below – blue line – comparing the first two crises) reaching $33/b by September 1990. Oil Prices: Downturns Compared ($/b)
The second oil price crisis was a result of the Asian markets financial crash by late 1997. Prices dwindled at that time by 50 percent. They fell from $21/b to $11/b in 15 months; a net fall of $10/b. The market response was completely different at that time. OPEC initiated a consultation initiative led by Saudi Arabia and Venezuela to unite the efforts with non-OPEC producers as well (Mexico at that time) to reduce production in a coordinated effort from all the world’s most conspicuous actors. As a consequence, the accords reached were acted upon and confirmed by OPEC and all other suppliers. That strategy of production cuts implemented within the Organization through production ceiling accords differed from quotas that were implemented by OPEC alone during the first crisis. The reason why they are not quotas is because Venezuela’s position was that production cuts have to be done from “actual” production (February 1998) and not from quotas established (the last one up to now) at the Jakarta meeting (November 1997). As a consequence, the concerted action of almost all market producers bears fruit and prices recovered quickly; in less than a year prices reached $21/b by August 1999 (as shown in graph above – the red line). The third of the most contemporary price crises took place in 2008 when the bubble of North American home mortgages broke up. Although this seemed to be the primary cause, no one said anything about another possibility: skyrocketing oil prices. Prices were at $134/b in June 2008, falling to $39/b by February 2009. That is equivalent to a loss of $95/b in eight months. Key international oil players did not do much about it under the circumstances. They allowed market forces to play out and come to the rescue. As a result, prices took almost two years to recover, reaching $110/b by the end of first quarter 2011. This can be seen in the Graph below.
The Second Price Crisis: All Actors Converging
The Third Price Crisis: Market Forces

GEOPOLITICS OF ENERGY/MARCH 2016 4
Oil Prices: Downturns Compared ($/b)
Currently, oil price behavior seems to have been developing in two tiers. The first one was a strenuous fall; the other tier instead seems to be in search of a price floor. Each of these patterns is described below. From mid-2014 when prices reached a mark of $105/b, its behavior went down to $40/b by March 2015. That is a $65/b loss in absolute terms (equivalent to a 55 percent downfall) in 9 months. In-depth analysis of last year’s price behavior (and including the first quarter of 2016) identified that during 2015 prices were attempting to shore up at $40/b (with a mean of $53/b). Beginning in 2016, markets are still searching for a floor, although at a lower level (about $30/b plus). The mean for the last 6 months has reached $41/b. Thus, it seems that oil price behavior is searching for some type of floor but that still remains to be seen. The following Graph shows the most recent behavior for oil prices. Prices Searching for a Floor: Zooming Up (2015-16)
There are many positive signs from the demand as well as the supply side that could be briefly mentioned. However, our analysis is far from traditional and aims to incorporate a creative and innovative methodology to give some ideas on how and approximately when prices could recoup themselves.
25
30
35
40
45
50
55
60
65
De
c 27
, 20
14
Jan 0
6, 2
01
5
Jan 1
6, 2
01
5
Jan 2
6, 2
01
5
Feb
05
, 20
15
Feb
15
, 20
15
Feb
25
, 20
15
Mar 0
7, 2
01
5
Mar 1
7, 2
01
5
Mar 2
7, 2
01
5
Ap
r 06
, 20
15
Ap
r 16
, 20
15
Ap
r 26
, 20
15
May 0
6, 2
01
5
May 1
6, 2
01
5
May 2
6, 2
01
5
Jun
05
, 20
15
Jun
15
, 20
15
Jun
25
, 20
15
Jul 0
5, 2
01
5
Jul 1
5, 2
01
5
Jul 2
5, 2
01
5
Au
g 04
, 20
15
Au
g 14
, 20
15
Au
g 24
, 20
15
Sep
03
, 20
15
Sep
13
, 20
15
Sep
23
, 20
15
Oct 0
3, 2
01
5
Oct 1
3, 2
01
5
Oct 2
3, 2
01
5
No
v 02
, 20
15
No
v 12
, 20
15
No
v 22
, 20
15
De
c 02
, 20
15
De
c 12
, 20
15
De
c 22
, 20
15
Jan 0
1, 2
01
6
Jan 1
1, 2
01
6
Jan 2
1, 2
01
6
Jan 3
1, 2
01
6
Feb
10
, 20
16
Feb
20
, 20
16
Mar 0
1, 2
01
6
Mar 1
1, 2
01
6
Mar 2
1, 2
01
6
Mar 3
1, 2
01
6
Ap
r 10
, 20
16
1°sem 2015 2° sem 2015/2016
=41
=53
The Present Crisis

5 GEOPOLITICS OF ENERGY/MARCH 2016
Among those (traditional) factors with positive signs from the demand side are: i) US economic recovery and lower unemployment; ii) Economic growth with relative decline of China counterbalanced by a higher growth in India;
and iii) Europe and Japan with a recovery growth. All these seem to point to an incremental world demand growth for 2016 similar to “her Historical trend” that is about 1.2 Mb/d. While that is the case for the main consumers, on the producers side we have Saudi output that seems to be stabilized at current production of about 10 Mb/d; Russia and the US have exhibited some decline while Iran’s ultimate production is still pending on the lifting of sanctions that could not be implemented immediately but gradually (recall that this country has not experienced new exploratory efforts for the last 35 years) and finally, Iraq still with her ISIS threat ameliorating her production revamping. For all those economic fundamentals of the international oil industry it is not clear if the price floor has been established. Several methodologies are used in an attempt to forecast price behavior. Nevertheless, this analysis shies away from traditional techniques. It attempts to foster a non-deterministic approach based on historical behavior, meaning that future behavior could have some linkage to the past. Under those assumptions, we envision for the outcome of the present crisis three different “Situations” taking similar paths to those of previous crises: i) OPEC adopting a Price Defense Strategy (cutting production alone) and then articulating a
Market Share Strategy due to her production losing ground at the expense of non-OPEC producers
ii) A situation where, after concerted action, All Producers Cut; and iii) Market Forces “operate” by themselves. If Situation (i) (OPEC CUTS ALONE) unfolds it is quite likely that price recovery would take the long path; let’s say 5 years to recoup. If situation (ii) (ALL PRODUCERS CUT) plays out then it is possible for a fast recovery in about a year, year and a half. And finally, if the prevailing situation resembles that of (iii) (MARKET FORCES) then one can expect prices to recover in two years (give and take). As can be seen in the Graph below, our model is non-deterministic because it offers ranges for that price recovery (similar to price bands) instead of giving specific figures for a given time in the future. Oil Prices: Recovery Situations ($/b)
0
20
40
60
80
100
120
140
160
en
e (
1)
abr
jul
oct
en
e (
2)
abr
jul
oct
en
e (
3)
abr
jul
oct
en
e (
4)
abr
jul
oct
en
e (
5)
abr
jul
oct
en
e (
6)
abr
jul
oct
en
e (
7)
abr
jul
oct
en
e (
8)
abr
jul
oct
2014-2015
ALL CUT OPEC ALONEMKT FORCES
What Might the Future Look Like?

GEOPOLITICS OF ENERGY/MARCH 2016 6
Within the global oil environment, it is worth analyzing how these trends may impact the development of non-conventional oil developments in Latin America. For the purpose of this essay, we apply the concept of non-conventional to all those oil developments in the region which require more effort for exploring or producing oil than traditional and conventional plays. Thus, four cases stand out: deep waters in the Gulf of Mexico; extra heavy oils in Orinoco (Venezuela); pre-Salt in deep waters of Brazil; and shale oil in Argentina One of the most promising but difficult plays that MEXICO would currently have to tackle in order to cope with the depletion of Cantarell (one of the reasons for her steep production decline), is to explore (and produce) from the deep waters of the Mexican Gulf. To reach those reservoirs is not an easy task; they have to go through a huge column of water ranging from 1,500 to 7,500 feet deep. Therefore, this entails a high cost operation that would require around $40/b to be profitable. Technically, project viability is not affected by the current low price trend, but it certainly would impact their profitability. Thus, these projects could possibly become the most expensive of the whole portfolio that Mexico has to offer.1 In the current bidding round in the country, the results will let us determine how successful the opening of these areas will be. VENEZUELA is basing her oil recovery on incremental production coming from the Orinoco Oil Belt. This area has the heaviest oil in the world (from 8 to 11 degree API) which requires complex extraction technologies for production. However, many of those technologies have been successfully developed; they are in the public domain and are not as costly as other developing non-conventionals in the rest of Latin America. At the official level, it is argued that these plays would require a price of about $13/b. We tend to believe that it would be relatively more costly, from $15 to $20/b. The current international price floor seems not to have a negative impact on these oil developments, but could deter new investments if prices remain low for the mid- to long-term. Moreover, the problem Venezuela faces is political rather than industrial. The lack of due process, clear rules of the game for investors, and the state oil company going back and forth on their negotiating deals with minority foreign partners (“Equity Control Companies” or “Companias Mixtas” where PDVSA is the controlling shareholder) is the model currently ruling the country. The Pre-Salt is a deep water area that BRAZIL intends to develop. It comprises the Spiritu Santo, Campos and Santos basins. The reservoir could contain about 25 Mb of reserves which is close to double that of conventional reserves in this country.2 The technologies for the extraction of this oil encompasses several challenges: to cope with 6,000 to 8,000 foot columns of water and then go deeper (about 6,000 feet) to reach the reservoir. Petrobras, the state oil company, has a record for this type of technology and offshore platforms. Definitely, this is a very high cost operation valued at first glance at $90/b. In this regard, Petrobras officers have currently assessed that the Pre-salt play would require merely $40/b to develop. According to our own research intelligence, it seems that it would require at least $70/b on average to become profitable when you include royalties and the like. Current low oil prices are forcing delays for these projects. These delays are due to reassessment of cost and profitability. However, at this time some early production is underway because investment was done by Petrobras some time ago when prices were at a much higher level.
Impact on Latin American Non-
Conventional Oil Developments

7 GEOPOLITICS OF ENERGY/MARCH 2016
Finally, ARGENTINA intends to develop shale oil (and gas) in Vaca Muerta (Neuquen Province). The importance of these developments in the country stems from the fact that it is the second largest shale gas reservoir in the world (802 TCF) after China and the largest in Latin America (followed by Mexico and Brazil). The technology to develop these reservoirs is relatively high cost. According to various studies and forecasts (YPF and others), production originally required about $75/b on average to become profitable. Thus, given current prices, these projects seem unviable, and have been experiencing delays due to reassessment of cost and profitability. Due to previous investments made by YPF (state oil company), early shale production is coming on stream from Neuquen Province. Moreover, the Argentine government has put a floor to domestic oil markers Escalante and Medanito with a price of $60 and $55/b, respectively. This subsidy encourages all producers in the country to sell their production domestically instead of exporting it abroad. Local prices are better prices than at the international level. As a consequence and due to cost reductions, shale production costs require about $60/b (give and take) and therefore, price is not an obstacle to produce in Argentina. This seems an ingenious policy that is helping production out in a time of crisis. Still, it remains to be seen if the subsidy burden shared by government, producers and final consumers would last, making the current local market conditions uneconomic. Economically, it appears that the impacts of low oil prices is less than previously thought with respect to some Latin American non-conventional oil developments. However, plummeting prices have had a great impact on some junior companies in the region and in certain countries like Colombia. Nevertheless, there is a light at the end of the tunnel looming ahead; on the one hand it seems prices are searching for a floor and on the other, there is chance for price recovery in the mid-term. About the Author Dr. Alberto Cisneros Lavaller is CEO/President, Global Business Consultants and a member of the Advisory Board of Geopolitics of Energy. Endnotes 1The other promising Mexican play to be developed is Chicontepec. However, that area is also rather expensive but for different reasons. Given the size of the area, there are huge amounts of monies (and possibly dry wells) that need to be invested until they find commercially viable plays. 2There have been some unconfirmed reports stating that reserves on this site could reach over 150 Mb. However, there are no final certifications of those reserves yet.

GEOPOLITICS OF ENERGY/MARCH 2016 8
The removal of the ban on the export of crude oil in late 2015 represented the end of an era. For the first time in almost sixty years, the US government has ceded all control over the flow of petroleum across its borders except in limited circumstances. This paper reviews that history of US government controls over petroleum imports and exports, and the changes to oil markets wrought by the expansion of US production, which led to calls to lift the export ban. It then examines the economic and geopolitical implications of the lifting of the ban, arguing that the end of the ban itself is much less consequential than the US production increases that spurred it. Further, while some commentators have claimed that the removal of the export ban would give the United States a geopolitical advantage, this paper argues that the US government has actually given up a tool that might have been useful in directing oil flows and creating geopolitical leverage. While not providing leverage to the US government, the end of crude export limitations is likely to have certain economic and geopolitical impacts. The crude export ban has a complex history, and the 1973 Arab oil embargo – typically cited as the catalyst for the ban – is only part of that story. The prohibition on crude oil exports was one component of a series of government efforts to manage domestic oil production, import dependence, and the economy before the push for deregulation of the economy began in the late 1970s and 1980s. In 1959, President Dwight D. Eisenhower signed a law that imposed quotas on crude oil imports. The law aimed to ensure that domestic crude production was not undercut by new, cheap oil flowing from the Middle East. Though this policy was meant to protect US production, it also created unintended outcomes: because US import restrictions did not apply to US territories and islands, for example, refineries were constructed in the Virgin Islands that would not have made commercial sense otherwise. After years of gradual growth under the protection of import limitations, oil production peaked in 1970 at 9.6 million barrels per day, then proceeded to decline. Yet at the same time, spurred largely by increasing gasoline demand following completion of the national highway system, oil consumption continued to grow. Crude imports filled the gap between decreasing supply and increasing demand. As crude imports rose, the United States underwent a period of unrelated but severe inflation that caused intervention in the energy sector. Through the Economic Stabilization Act of 1971, the Nixon administration imposed price controls on a wide variety of commodities including crude oil and petroleum products as part of an economy-wide program to combat inflation by freezing wages and prices, including crude and fuel prices.1 These new controls had several effects on the economics of shifting energy markets. Importers could pass the rising cost of foreign products on to consumers, giving foreign refineries an advantage over those located in the United States and benefitting importers at consumers’ expense.2 Furthermore, controlled domestic US oil prices were higher than international prices, incentivizing crude imports, which more than doubled from 1970 levels from 3.2 million barrels per day to over 6 million barrels per day by 1973.3 To mitigate these distortions, the Nixon administration removed mandatory quotas on imports in May 1973 and imposed a total freeze on the price of domestic and imported oil that June.4 Further price controls were introduced in August and September so that any crude or product price increase would have to directly mirror an increase in the cost of inputs in order to prevent profiteering by refiners and importers.5 In its first export limitation, the Nixon administration also temporarily restricted crude exports to ensure availability of supply under the Emergency Petroleum Allocation Act (EPAA).6 To encourage domestic production as a substitute for imports while preventing price increases that might exacerbate inflation, the administration then introduced a mechanism that allowed oil from wells drilled since 1972, but not before, to be sold at market levels.7 The same mechanism also allowed producers who drilled new wells to sell an additional barrel of oil at market prices for every new barrel
Economic and Geopolitical Impacts of the End of Crude Export Restrictions Zachary Cuyler and David Pumphrey
Introduction
History of Oil Export Controls

9 GEOPOLITICS OF ENERGY/MARCH 2016
brought onto the market, further incentivizing domestic production, and was later incorporated into the EPAA. These controls were already in place by the time of the 1973 Arab oil embargo and OPEC’s push to increase oil prices, when crude and product prices on the international market rose dramatically while those under US price controls remained frozen. The two-tiered US crude pricing system led to large price differences within the United States, and lower domestic prices provided incentive to US producers to export their crude rather than sell domestically.8 In 1975, the Ford administration signed a series of bills including the Energy Policy and Conservation Act (EPCA), which included provisions to prevent producers from taking advantage of the discrepancy between domestic and international prices, while also responding to concerns over security of supply generated by the embargo and popular discontent with high profits by international oil companies.9 In order to prevent exports that would undercut government price controls, the EPCA imposed a ban on the export of crude oil unless the President made a determination that such exports would be “consistent with the national interest.”10 The EPCA also set fuel efficiency standards and established the Strategic Petroleum Reserve. It further allowed already-existing price controls on crude oil to remain in place despite the decontrol of other commodity prices in 1974, because OPEC-managed international oil prices remained around four times pre-embargo levels and almost double average US domestic prices.11 In short, export controls were intended to mitigate the distortions caused by government price controls, and served as one component of a larger complex of measures designed to manage the economy through the energy sector. After extending price controls past 1976, the Carter administration began an effort to decontrol oil prices in 1979. Yet although the rationale for export restrictions faded with the end of price controls, low US oil production made lifting the ban seem pointless except when specific projects looked likely to benefit from the ability to export. Under the EPCA, the Department of Commerce (DoC) had the authority both to implement the ban and to grant exemptions, to license exporters, and to define what constituted “crude oil” and what constituted a “petroleum product.” Pursuant to the authority to permit exports determined to correspond with the national interest, the terms of the ban were modified several times to bolster production and to diversify the crude grades available to domestic refiners. Price deregulation began in 1979 and price controls terminated in 1981, and in the same year, the Reagan administration lifted the export ban on petroleum products.12 In 1985, President Reagan also authorized the export of crude to Canada, provided that it would be used for domestic Canadian consumption, creating symmetry in North American crude markets characterized by US imports of Canadian crude.13 The US-Canadian Free Trade Agreement, and later NAFTA, locked-in this bidirectional crude trade. Later in the same year, the DoC determined that the export to any location of crude oil from the Cook Inlet field in Alaska would serve the national interest, and allowed those exports to begin.14 In 1988, up to 50,000 barrels per day were allowed to be exported from Alaska’s North Slope to Canada via the Trans-Alaska Pipeline, and in 1992, the DoC approved the export of up to 25,000 barrels per day of heavy crude oil from California because of the overabundance of that grade in domestic markets.15 Congress and the Clinton administration then permitted the unlimited export of crude oil from Alaska’s North Slope in 1996.16 These measures slowly chipped away at export restrictions for particular projects and specific goals while leaving the overall ban intact because continued import dependence deprived lifting the ban of a strong rationale. Until the shale revolution, there was little discussion in government and industry circles about lifting the crude oil export ban because US domestic production was never anticipated to outpace demand growth. Rather, demand was expected to increase inexorably into the future. However, with the tight oil boom that began in 2008-9, domestic production increased rapidly. Crude production grew from roughly 5 million barrels per day to 9.4 million barrels per day between 2008 and 2015,17 and net crude and products imports fell from roughly 9.7 million barrels per day in 2009 to roughly 4.6 million in 2015.18 The new crude output was disproportionally “light, tight oil” (LTO): low-sulfur, high-gravity crude oil from formations in the Bakken, Eagle Ford, Permian, Niobrara, and other basins. To be clear, production never exceeded demand, but the United States began to produce much more light oil than its refineries were optimized to process. Indeed,
The Removal of the Ban

GEOPOLITICS OF ENERGY/MARCH 2016 10
this new production began affecting markets initially by displacing and dramatically reducing light crude imports. The crude export prohibition also created a set of unique dynamics in the domestic US oil market. Infrastructure bottlenecks including a lack of pipelines between markets and new centers of production, the need to reverse flows through existing pipelines between newly-producing and newly-consuming regions, and a dearth of storage capacity caused domestic crude prices to drop. As the CSIS Energy and National Security Program argued in Delivering the Goods, the “shift in the volume, location, and quality of the continent’s oil supply” required changes to “the direction and modality… of midstream infrastructure and crude and petroleum product flows” which took time to implement.19 A principal challenge created by the growth of the largely light oil production from these tight oil fields was the mismatch with US refinery configurations. US refineries were not optimized to match high-margin product yields, in other words to process the tremendous amount of light oil that reached markets in economically optimal ways, following years of investment in complex refining systems designed to process heavier, imported crude grades. This created technical bottlenecks, since refiners were unable to utilize portions of their refineries designed to run heavier crudes. It also forced refiners to sell the gasoline that light grades favor into an oversupplied market, restraining the economic efficiency of the refining sector. These obstacles to the absorption of the new light oil supplies created a large gap between the prices for West Texas Intermediate (WTI) blend and Brent, the global benchmark. Between 2009 and 2015, the WTI-Brent spread widened from $1.73 in January 2009 to a massive $27.31 in September 2011 before falling back toward $1.83 in November 2015, the month before the ban was lifted.20 Figure 1: WTI-Brent Spread, January 2009-December 2015
Source: US Energy Information Administration
The surplus of oil that developed, as unconventional production expanded, was addressed in several ways. Since petroleum product exporters were not restricted, US refiners took advantage of the extra oil as well as surplus production capacity to sell ever increasing amounts of oil into the global market. With access to relatively cheaper oil in the US, domestic market refiner’s margins rose significantly. For example in 2015, Gulf Coast refiners enjoyed a $10.30 margin, compared to $5.20 in Singapore and $3.99 in Italy.21 Figure 2 shows that the United States went from importing about 2.5 million barrels per day in 2006 to exporting about 2.0 million barrels per day in 2015.

11 GEOPOLITICS OF ENERGY/MARCH 2016
Figure 2: US Net Petroleum Product Exports
Refiners benefitted tremendously from these conditions. US Gulf Coast refiners benefitted from lower feedstock prices and from operating sophisticated refineries, which had been substantially upgraded in recent years. In 2011, the uprising in Libya removed Libyan light, sweet oil production from global markets, increasing global demand for US lighter product exports and rerouting US LTO to East Coast refineries via truck and rail. US domestic production boomed between 2011 and mid-2014, and the isolation of the US crude market created a massive spread between WTI and Brent, improving US refining margins.22 The simultaneous boom in shale gas further benefitted refiners by providing domestically-produced natural gas as an inexpensive fuel, source of hydrogen, and feedstock. When the global price of oil collapsed from mid-2014 through 2015, refining margins improved again, and US refiners continued to enjoy much better margins than their international competitors. Refiners responded by delaying maintenance to keep their facilities running while margins remained high, increasing utilization rates to record-high levels by summer 2015.23 US producers also took advantage of certain exceptions to the crude oil export ban. In these years, US exports of crude oil increased rapidly from about 42,000 barrels per day in 2010 to 458,000 barrels per day in 2015. Nearly all of the increased crude oil went to Canada with the provision that required that the oil be used there (granted in the 1980s by the Reagan administration, as noted above). Additionally, a number of companies discovered that the Bureau of Industry and Security (BIS) defined petroleum products in a way that included minimally-processed “lease condensate,” a light liquid byproduct of natural gas production that effectively constitutes a kind of crude oil. This meant that condensate could be exported as a refined product so long as it passed through a distillation tower.24 This encouraged the construction of inexpensive field separators and stabilizers to prepare condensate for export, and splitters to process condensate into gasoline, diesel, and naphtha.25 BIS never explicitly stated that such operations were permitted, but reviewed each such operation on a case-by-case basis, and granted export licenses to companies that exported lightly refined condensates. Throughout 2015, pressure grew for the government to lift the crude export ban to alleviate the excess of LTO on the US market. Many Republican Congressional representatives and an array of

GEOPOLITICS OF ENERGY/MARCH 2016 12
industry advocates, including the American Petroleum Institute, pushed for the ban to be lifted.26 These voices were joined by the editorial boards of The Wall Street Journal, The Washington Post, the Houston Chronicle, the Boston Globe, the Chicago Tribune, the Financial Times, and The Economist, among others.27 The New York Times, often critical of the oil industry, argued that Congress should lift the ban in exchange for tax breaks for renewable power sources and the removal of such benefits from hydrocarbon producers.28 A sign of the possibility of political compromise, but also in response to requests by the Mexican government and in an attempt to defuse the export debate, the Obama administration began allowing US crude to be sent to Mexico in exchange for equal amounts of crude of other grades in August 2015.29 Yet there was significant resistance to lifting the crude ban in some circles. Many environmentalists were concerned that allowing crude exports would encourage additional fracking, transportation of crude by rail, and worldwide oil consumption, with the attendant local and global environmental consequences.30 Some feared that allowing exports would raise domestic gasoline prices, generating some opposition among Republican lawmakers. For its part, the American Fuel and Petrochemical Manufacturers, the refining sector’s trade organization, reluctantly backed lifting the ban, but warned that it should not be lifted without also eliminating other government interventions in the energy sector, including the Jones Act, the Renewable Fuel Standard, and various “energy subsidies, mandates, or taxes.”31 The consequences of ending export controls for the environment, climate, and US refiners dissuaded most Democrats from supporting the end of the ban despite President Obama’s approval.32 Congress voted to remove the export ban altogether by inserting language into one section of a much larger spending bill, House Resolution 2029, which President Obama signed into law at the end of 2015.33 This law repealed the ban on crude exports included in the EPCA and further directed that the Federal government could no longer limit crude exports under any other statutes. Still, exceptions are allowed, and exports can be restricted in the case of a national emergency or to implement sanctions or an embargo.34 Exports can also be restricted upon a determination that exports have caused supply disruptions or domestic price increases so economically destructive that they demonstrably increased unemployment. With this law in place, the DoC re-designated crude oil as a standard commodity not subject to any special controls, thus removing all requirements for export licensing to all countries or persons, barring restrictions stemming from embargo or sanctions.35 For the first time in over half a century, there was no systematic restriction on the flow of petroleum across US borders. The roughly 4 million barrel per day increase in US domestic oil production after 2008 has had a dramatic impact on global oil markets equivalent to the emergence of a major new oil producer. By way of comparison, Kuwait produces nearly 3 million barrels per day. While it will take time for the global oil market to adjust to a shift of this scale, the repercussions of this shift remain far from obvious. However, it is clear that the United States’ new status as a major oil producer and consumer means that fluctuations in the price of oil will have countervailing effects on the US economy. The short-term economic implications of lifting the crude export ban are not likely to be dramatic, though some benefits will accrue over time. In the near future, US exports will struggle to secure market share given the current low price environment and oversupplied market. Barring a dramatic increase in demand or disruption of supply, lifting the export ban may not even have a significant market impact in the medium term. In the EIA’s September 2015 evaluation of the impact of lifting the crude price ban, the low price case – which assumes 2025 WTI and Brent prices at almost double February 2016 levels – forecasts that lifting the ban will have no impact on domestic production and negligible impact on crude and product imports and exports.36 Other forecasts that show a larger impact, including the EIA’s
Economic Implications of Lifting the Ban
in the Current Market

13 GEOPOLITICS OF ENERGY/MARCH 2016
base case, were prepared before the oil price collapse and therefore assumed much higher prices than currently exist, or are likely to exist in the medium term. The economic impact of the end of the crude export ban is more likely to be felt in the refining sector and in overall global market function. For US refiners, exports will likely bring crude prices closer to global market levels while providing a more-diverse array of crude grades on the domestic market. This would have the contradictory effects of making refining more technically efficient while narrowing the gap between refiners’ input costs and the prices of their products on global markets. The latter consideration is likely to matter more: as the WTI-Brent spread narrowed at the beginning of 2016, refiner margins on the East Coast and Gulf Coast fell below 2015 levels.37 In short, much of the advantage that US refiners enjoyed during the confluence of the shale boom and the export ban is likely to disappear following the end of the ban. A small additional supply of light, sweet crude will also hit global markets. This may impact exporters of crude with comparable grades like Nigeria’s Bonny Light, though much of that damage occurred when tight oil began crowding out Nigerian exports to the United States in 2014. US LTO will also displace some oil exported to refiners in Latin America and Europe whose less-complex facilities are designed to process such low-sulfur, high-gravity grades.38 Overall, integrating the US market fully into the global market through crude exports will add to the amount of crude in global supply, which could put additional downward pressure on prices. Moreover, the perception that the United States could begin exporting large volumes of crude onto global markets in the future could have an impact on market players’ behavior in the present. Whether or not the United States actually begins exporting the majority of its crude rather than refining it, some actors will begin exploring the option of importing crude from the United States. Venezuela, for example, may import light crude from the United States to make up for domestic shortfalls of blendstock.39 It is unclear just how much crude will be sold on global markets, but potential importers are reacting in advance, and the resulting shifts in crude and product flows could be as important as a shift in the volume of crude actually exported by the United States. The long term is much more difficult to predict, but US exports could help fill gaps created by future demand increases or supply disruptions. Though the recent slowdown in Chinese energy demand growth has put the trajectory of global oil demand growth in doubt, India and other growing economies could continue to push global demand up.40 US crude exports could also substitute for a gradual decline in global supply, however unlikely that appears in a world in which both Iraq and Russia are hitting record production levels and Iran struggles to regain lost market share. Perhaps more important is that the United States’ ability to export its abundant unconventional oil resources will also increase the resilience of global supply, potentially insulating the global economy from the shock of minor supply disruptions. In the event that unrest or conflict removes a large exporter from the market, US production may be able to respond relatively quickly to take advantage of higher prices and mitigate the resulting price increase. Even if domestic production continues to mainly meet domestic demand, the United States could become a major swing producer, though one whose lack of centralized control over production volumes would make it fundamentally different than Saudi Arabia or even the United States of the Texas Railroad Commission era. The dramatic increase in US oil production has broad implications for the security and stability of global oil markets. Additional oil in the marketplace has offset the loss of exports from Iran, Libya, Syria, and other minor outages. Without this additional LTO production, global oil prices could have risen significantly and possibly complicated consensus approaches to negotiations with Iran. The geopolitical implications of lifting the crude oil export ban, however, have often been overstated. Because the US government has ceded its control over crude outflows by lifting the ban, and because private ownership characterizes the US oil sector and the US government does not have the ability to compel private companies to reroute crude flows for geopolitical ends, the
Geopolitical Implications of Lifting the Ban

GEOPOLITICS OF ENERGY/MARCH 2016 14
United States can wield virtually no leverage through its oil exports. Likewise, the promise of energy independence from unstable, hostile, or authoritarian oil exporters is illusory. In effect, the United States has shirked employing its newly-abundant hydrocarbon resources for leverage and instead opted to increase the stability of global oil markets, as the CSIS energy program advised in its three-part 2014 report, New Energy, New Geopolitics.41 Though the United States government is essentially disposing of a potential tool of leverage, it is conceivable that US allies could use the possibility of importing freely-exported crude from the United States as a form of leverage. Hypothetically, European allies could threaten to switch away from Russian crudes to higher-cost US exports for political reasons. These countries would have to be willing to pay a higher price for the US exports, so the commercial burden of this course of action makes it unlikely. It is also unclear how effective this tactic would be. Even if exports spur increased domestic production, at the very least the United States will likely continue to import crude of grades that are not abundant within its borders. However much US crude they import, US allies and major economies in Europe and Asia will also remain deeply dependent on imports from high-risk regions like the Middle East, and the United States would not be unaffected by the economic or political consequences of energy supply disruptions. More fundamentally, however, lifting the crude export ban will make the United States more interdependent with global energy markets, not less. Fluctuations in the price of oil, including those caused by political and geopolitical developments abroad, will have slightly more direct impacts on the US economy because the US oil market will be tied more directly to the global market. Predictions that US exports will increase pressure on US rivals such as Russia, Venezuela, and Iran are likewise overblown. The light, sweet crude that the United States is likely to export does not directly compete with the medium, sour grades exported by those particular producers. Moreover, increased US production has already had profound negative effects on US allies that export light, sweet crude like Nigeria, which lost its export market to the United States as a result of the shale revolution and would face intensified competition should the United States ever export LTO in large volumes. But more importantly, if lifting the export ban does in fact increase US production, the most important overall effect would be to lower the price of all crude grades. This would negatively impact the export revenue of all exporting states, regardless of their relationship with Washington, including countries like Saudi Arabia, Mexico, Canada, and Norway. That is not to say that the geopolitical impacts of competition between the United States and other exporters would be negligible; rather, they would be disperse and indeterminate, harming exporters and helping importers whatever their relationship with the United States. As noted, crude exports will also likely improve overall global resiliency against localized supply disruptions. In geopolitical terms, this means that the global market as a whole will be less vulnerable to unrest or conflict in oil-exporting countries. Yet US tight oil would only be unlocked to fill the resulting gap once price signals mobilize the requisite capital and expertise. Moreover, the US response to an abrupt disruption would continue to depend in the short-term on the SPR, which may actually have more difficulty releasing oil onto global markets if too much US export infrastructure is tied up by new export flows. In sum, the geopolitical impacts of lifting the crude export ban are likely to be faint, indeterminate, and contradictory, and will mainly emanate from the economic consequences of removing export restrictions. With the end of the crude export ban, the US government ends almost 60 years of controls on the flow of petroleum into and out of the country. Though it can still reroute petroleum flows in the case of an emergency, the government has ceded its ability to intervene in the petroleum market for non-emergency economic or political reasons. While this is important, it is less important than the boom in US production since 2008. US exports will only take place on a large scale when the price relationship works, based on a complex array of factors including
Conclusions
15 GEOPOLITICS OF ENERGY/MARCH 2016
crude pricing, refining margins, and transportation costs. Until then, the economic implications of the end of the crude ban are likely to be limited, and mainly include improved market function and increased supply resilience. The geopolitical implications of lifting the ban, which emanate from the economic consequences, are more limited and contradictory. The capacity to export will not produce geopolitical leverage for the United States, though it could conceivably give US allies a stronger negotiating position. It will also allow the US to respond more vigorously to supply disruptions, though exports could use up the available export infrastructure needed to release SPR crude onto the market in an emergency. Finally, if US exports meet growing global demand in the long run, the effect could be to encourage global oil consumption by dampening a future increase in oil prices. This could complicate the global effort to limit the growth in carbon emissions and put more pressure on policy makers to take additional climate change mitigation measures, though it could also force oil and gas producers to begin diversifying their economies away from hydrocarbons. About the Authors David Pumphrey is a Senior Associate of the Energy and National Security Program of the Center for Strategic and International Studies (CSIS) where he previously served as Co-Director and Senior Fellow. At CSIS his research has focused on global energy issues, US energy security and climate change. For 35 years he served as an energy policy official with the United States Federal Government where the scope of his work covered the entire globe with particular focus on the Middle East, the Americas and Asia. Zachary Cuyler is a Research Associate with the CSIS Energy and National Security Program, focusing on international oil and gas markets, political economy, and geopolitics.
Endnotes 1Jason Bordoff and Trevor Houser, “Navigating the U.S. Oil Export Debate,” (January 2015), 12 http://energypolicy.columbia.edu/on-the-record/navigating-us-oil-export-debate. 2National Petroleum Council, “Historical Actions and Events Associated with the Energy Crises of the 1970s” in Factors Affecting U.S. Oil and Gas Outlook (February 1987), 42. 3National Petroleum Council, 42; Energy Information Administration, “Refiner Acquisition Cost of Crude Oil,” https://www.eia.gov/dnav/pet/pet_pri_rac2_dcu_nus_m.htm. 4National Petroleum Council, 43-5. 5Erickson, Peters, Spann, and Tese, “The Political Economy of Crude Oil Price Controls,” Natural Resources Journal (October 1978), 787-800. 6John Kemp, “Chronology of controls on U.S. oil exports,” December 16, 2015, http://fingfx.thomsonreuters.com/gfx/ce/1/205/205/CHRONOLOGY%20OF%20CONTROLS%20ON%20US%20OIL%20EXPORTS%20(2).pdf. 7National Petroleum Council, 45. 8Bordoff and Houser, 13. 9Daniel Yergin, The Prize (New York: Free Press, 2009), 642-3. 10The Mineral Lands Leasing Act, Outer Continental Shelf Act, and Export Administration Act also imposed certain limitations on the export of crude oil alongside EPCA. House Resolution 2029, which removed crude export restrictions, did not specifically amend or revoke these laws, but notes that “Notwithstanding any other provision of law… no official of the Federal Government shall impose or enforce any restriction on the export of crude oil.” “Energy Policy and Conservation Act,” January 15, 2014, http://legcounsel.house.gov/Comps/EPCA.pdf; “H.R. 2029 – Consolidated Appropriations Act, 2016,” December 18, 2015, https://www.congress.gov/bill/114th-congress/house-bill/2029/text#toc-H7D131AD3CAE44794ACB8E92F7E7156D1. 11Erickson, Peters, Spann, and Tese. 12Bordoff and Houser, 14; Lisa Murkowski, “Past is Precedent: Executive Power to Authorize Crude Oil Exports, Appendix A,” March 3, 2014, http://www.energy.senate.gov/public/index.cfm/files/serve?File_id=c78fdaf5-04ae-4586-b4d1-6562bb9cdae0. 13Bordoff and Houser, 14; Ronald Reagan, “Presidential Findings on United States-Canadian Crude Oil Transfers,” http://www.presidency.ucsb.edu/ws/?pid=38774. 14Kemp, http://fingfx.thomsonreuters.com/gfx/ce/1/205/205/CHRONOLOGY%20OF%20CONTROLS%20ON%20US%20OIL%20EXPORTS%20(2).pdf. 15George Bush, “Remarks on the National Energy Strategy,” http://www.presidency.ucsb.edu/ws/?pid=19827; Kemp, http://fingfx.thomsonreuters.com/gfx/ce/1/205/205/CHRONOLOGY%20OF%20CONTROLS%20ON%20US%20OIL%20EXPORTS%20(2).pdf; Theodore Kassinger, “U.S. Refining and Crude Oil Exports: An Update,” presentation at the Center for Strategic and International Studies, April 2, 2015, http://csis.org/event/us-refining-and-crude-oil-exports-update. 16Bush, http://www.presidency.ucsb.edu/ws/?pid=19827. 17EIA, “Crude Oil Production,” https://www.eia.gov/dnav/pet/pet_crd_crpdn_adc_mbblpd_a.htm. 18EIA, “U.S. Imports by Country of Origin,” https://www.eia.gov/dnav/pet/pet_move_impcus_a2_nus_ep00_im0_mbblpd_a.htm. 19Frank Verrastro, Sarah Ladislaw, Kevin Book, Michelle Melton, and Lisa Hyland, Delivering the Goods: Making the Most of North America’s Evolving Oil Infrastructure (Washington, DC: CSIS/Rowman & Littlefield, 2015), V. 20EIA, “Spot Prices,” https://www.eia.gov/dnav/pet/pet_pri_spt_s1_a.htm. 21John Auers, “State of the Oil Market,” presentation at CSIS, February 17, 2016, http://csis.org/event/state-oil-market.

GEOPOLITICS OF ENERGY/MARCH 2016 16
Publication Date: April 8, 2016
Submit manuscripts and Letters to the Editor to Jon Rozhon at the address below or via email at [email protected]. Manuscripts dealing with energy and geopolitics, generally between 2,000 and 4,000 words in length, will be considered for publication. Unsolicited manuscripts will undergo peer review by members of the editorial board. Available by subscription for $800 (US) per year; $400 (US) for public libraries universities. For Canadian residents—$800 per year; $400 for public libraries and universities—plus 5% GST. Publisher: Canadian Energy Research Institute, #150, 3512 - 33 Street NW, Calgary, Alberta, Canada T2L 2A6 Telephone: (403) 220-2370; Fax: (403) 220-9579; Email: [email protected]. Reproduction without permission is prohibited.
22EIA, “Low crude oil prices, increased gasoline demand lead to high refiner margins,” May 20, 2015, http://www.eia.gov/todayinenergy/detail.cfm?id=21312&src=email. 23EIA, “U.S. Percent Utilization of Refinery Operable Capacity,” https://www.eia.gov/dnav/pet/hist/LeafHandler.ashx?n=PET&s=MOPUEUS2&f=M; EIA, “U.S. refineries are running at record-high levels,” August 7, 2015, https://www.eia.gov/todayinenergy/detail.cfm?id=22412. 24Nick Snow, “BIS Lists Six Condensate Export Considerations,” Oil and Gas Journal, January 12, 2015, http://www.ogj.com/articles/print/volume-113/issue-1a/general-interest/bis-lists-six-condensate-export-considerations.html. 25Rhiannon Meyers, “Oil exports prompt splitter decisions in Corpus Christi,” Houston Chronicle Fuel Fix, December 22, 2015, http://fuelfix.com/blog/2015/12/22/oil-exports-prompt-splitter-decisions-in-corpus-christi/. 26American Petroleum Institute, “U.S. Crude Oil Exports: Benefits for America’s Economy and Consumers,” September 2015, http://www.americanpetroleuminstitute.com/~/media/Files/Policy/Exports/Crude-Oil-Exports-primer/US-Crude-Oil-Exports-low-res.pdf. 27Producers for American Crude Oil Exports, “What Editorial Boards Are Saying about Lifting the Ban on Crude Oil Exports,” http://oilexports.com/wp-content/uploads/2015/02/Factsheet-WTAS_3.pdf; API, http://www.americanpetroleuminstitute.com/~/media/Files/Policy/Exports/Crude-Oil-Exports-primer/US-Crude-Oil-Exports-low-res.pdf; Editorial Board, “Lifting the export ban on crude oil would be a boon to the U.S. economy,” The Washington Post, August 2, 2015, https://www.washingtonpost.com/opinions/lifting-the-export-ban-on-crude-oil-would-be-a-boon-to-the-us-economy/2015/08/02/32cfcde4-37c8-11e5-b673-1df005a0fb28_story.html. 28Editorial Board, “Oil Exports Should Be Paired With Clean Energy Tax Breaks,” The New York Times, October 12, 2015, http://www.nytimes.com/2015/10/12/opinion/oil-exports-should-be-paired-with-clean-energy-tax-breaks.html. 29Kemp, http://fingfx.thomsonreuters.com/gfx/ce/1/205/205/CHRONOLOGY%20OF%20CONTROLS%20ON%20US%20OIL%20EXPORTS%20(2).pdf. 30350.org, Credo, EarthJustice, Friends of the Earth, Greenpeace, League of Conservation Voters, Natural Resources Defense Council, Sierra Club, “The Crude Oil Export Ban, by the numbers,” http://www.lcv.org/media/crude-oil-export-ban.pdf; Oil Change International, “Lift the Ban, Cook the Climate,” July 2015, http://priceofoil.org/content/uploads/2015/07/OilChangeIntl-crude-export-july-2015.pdf. 31Reuters, “AFPM Goes on the Record on the Crude Export Ban,” October 21, 2015, http://www.reuters.com/article/idUSnGNX2FG65n+1d8+GNW20151021. 32Suzanne Goldenberg, “House cotes to lift crude oil export ban despite opposition from White House,” The Guardian, October 9, 2015, http://www.theguardian.com/business/2015/oct/09/us-crude-oil-exports-house-of-representatives-vote-obama. 33Valerie Volcovici and Catherine Ngai, “Oil companies rush to exploit end of U.S. crude export ban,” Reuters, December 23, 2015, http://www.reuters.com/article/us-enterprise-products-exports-idUSKBN0U61Q920151223; Deirdre Walsh and Ted Barrett, “Deal avoids shutdown, but not everyone is happy,” CNN Politics, December 16, 2015, http://www.cnn.com/2015/12/15/politics/ryan-announces-deal-averting-shutdown/?iid=EL; Bloomberg, “Congressional vote, Obama’s signature end oil export ban,” Houston Chronicle Fuel Fix, December 18, 2015, http://fuelfix.com/blog/2015/12/18/congressional-vote-obamas-signature-end-oil-export-ban/. 34“H.R. 2029 – Consolidated Appropriations Act, 2016,” https://www.congress.gov/bill/114th-congress/house-bill/2029/text#toc-H7D131AD3CAE44794ACB8E92F7E7156D1. 35Bureau of Industry and Security, “Crude Oil Export Licensing Policy,” https://www.bis.doc.gov/index.php/crude-oil-export-licensing-policy; https://www.bis.doc.gov/index.php/regulations/commerce-control-list-ccl 36BIS, “Commerce Control List (CCL),” http://www.eia.gov/analysis/requests/crude-exports/pdf/fullreport.pdf. 37Blake Fernandez and Leonard Raymond, “Weekly Refining Indicators Report,” Scotia Howard Weil, March 30, 2016, http://www.howardweil.com/docs/Reports/WEEKLY%20REPORTS/REFININGReport.pdf. 38Turner, Mason, and Company, “U.S. Light Crude Oil Exports: Likely Destinations,” September 8, 2015, http://www.turnermason.com/wp-content/uploads/2015/09/US-Light-Crude-Oil-Exports_Likely-Destinations1.pdf. 39Alex Nussbaum, “Global Oil Power Venezuela Suddenly Has a Thirst for U.S. Crude,” Bloomberg, March 21, 2016, http://www.bloomberg.com/news/articles/2016-03-21/global-oil-power-venezuela-suddenly-has-a-thirst-for-u-s-crude. 40Luke Kawa, “Deutsche Bank: China’s Oil Demand Growth Could Be Cut in Half by the End of the Decade,” BloombergMarkets, March 9, 2016, http://www.bloomberg.com/news/articles/2016-03-09/deutsche-bank-china-s-oil-demand-growth-could-be-cut-in-half-by-the-end-of-the-decade. 41Sarah O. Ladislaw, Maren Leed, Molly A. Walton, New Energy, New Geopolitics: Background Report 3: Scenarios, Strategies, and Pathways (Washington, DC: CSIS/Rowman & Littlefield, 2014), 35.