georgia environmental protection division atlanta pm2.5 attainment modeling with aermod yan huang,...
TRANSCRIPT

Georgia Environmental Protection Division
Atlanta PM2.5 Attainment Modeling with AERMOD
Yan Huang, James Boylan, Peter Courtney, and Michelle Bergin
(Georgia EPD – Air Protection Branch)
2009 Region 4 Modelers WorkshopMarch 18, 2009

Georgia Environmental Protection Division
Outline
• Background
• Local AERMOD Modeling
• Updated 2012 DVF Projections

Georgia Environmental Protection Division
Background

Georgia Environmental Protection Division
Objective
Elevated PM2.5 concentration in Atlanta non-attainment area:Regional/urban scale sources Local sources
Demonstrate attainment in 2012?

Georgia Environmental Protection Division
F.S.#8
E.Rivers
Jeff. St.
2.2mile
2.9mile
Forest Park
South-DeKalb
Doraville Health
East Point
Location of Core Urban Sites

Georgia Environmental Protection Division
14
15
16
17
18
19
20
21
22
23
24
1999 2000 2001 2002 2003 2004 2005 2006
An
nu
al P
M2
.5 (
ug
/m3
)
Fire Station #8
E. Rivers
Jefferson Street
Annual Average PM2.5 (Stations <3 miles from Fire Station #8)
Georgia Environmental Protection Division
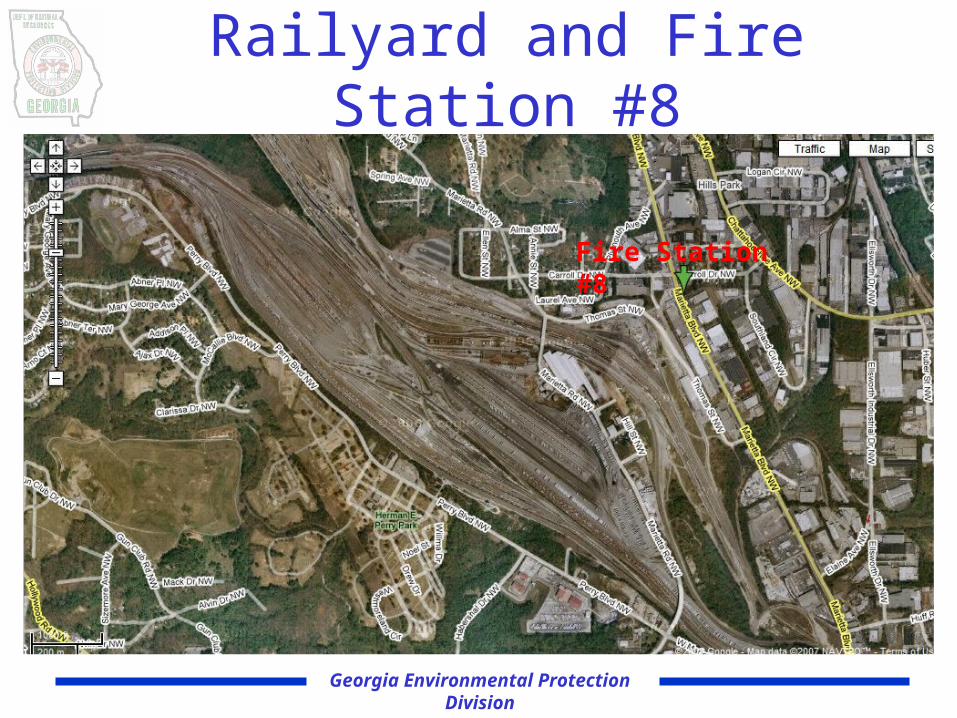
Fire Station #8
Railyard and Fire Station #8

Georgia Environmental Protection Division
CMAQ PM2.5 Projections
AIRS ID County 2002 DVC 2009 DVF 2012 DVF13-063-0091 Clayton 16.5 15.1 14.0
13-067-0003 Cobb 16.3 14.6 13.2
13-067-0004 Cobb 15.2 13.6 12.4
13-089-0002 DeKalb 15.9 14.4 13.3
13-089-2001 DeKalb 16.2 14.4 13.1
13-121-0032 Fulton 16.5 14.9 13.6
13-121-0039 Fulton* 18.3 16.6 15.4
13-135-0002 Gwinnett 16.1 14.3 13.0
13-139-0003 Hall 15.1 13.4 12.1
13-223-0003 Paulding 14.3 12.8 11.5
* Local Increment at Fire Station #8 = 1.8 g/m3

Georgia Environmental Protection Division
CMAQ 12-km Grid Cell

Georgia Environmental Protection Division
AERMOD Modeling for Local Sources

Georgia Environmental Protection Division
Local PM2.5 Sources
• Rail Yards– Inman, Tilford, and Howells
• On-Road Mobile– Marietta Blvd., Marietta St., and Bolton Rd.
• Local Industrial Facilities– Plant McDonough, Meadwestvaco Packaging
Systems, others

Georgia Environmental Protection Division
Model Set-Up• 2002-2006 five year simulation• Elevated terrain (AERMAP)• Five-hundred meter receptors• Seasonal surface parameters with twelve
30-degree wind sectors (AERSURFACE)• Meteorological data
– Peachtree City NWS upper air – Atlanta Hartsfield airport NWS surface
observation

Georgia Environmental Protection DivisionProvided by B. Kim, GA EPD
AERMOD Modeling Domain

Georgia Environmental Protection Division
Locomotive Activity
• Two Class I railroad companies –Norfolk Southern–CSX Transportation
• Two locomotive activity categories–Line-haul –Switching

Georgia Environmental Protection Division
2012 Emission Reductions
• Railyard– 30 Genset replacement by 2012
(currently 42 yard switchers)
– 93% PM2.5 emission reduction per Genset
• Mobile– ARC link-based VMT data
– 50 ~ 60% reduction

Georgia Environmental Protection Division
Locomotive PM2.5 Emission
Railyard 2002# of YS
2002LH
(tons/ year)
2002YS
(tons/ year)
2002Total (tons/ year)
2012# of Gen sets
2012LH
(tons/ year)
2012YS
(tons/ year)
2012Total (tons/ year)
Total reduction (%)
Inman 30 11.41 22.59 34.00 21 9.40 7.88 17.28 49.2
Tilford 11 6.46 8.28 14.74 9 5.32 1.98 7.30 50.5
Howells 1 0 0.75 0.75 0 0 0.75 0.75 0

Georgia Environmental Protection Division
Mobile Emission
Roadway Length (mi.)
2002 (grams/day
)
2012 (grams/day)
Reduction (%)
Bolton Rd. 1.496 1814 727 60
Marietta Rd. 2.727 1032 NA NA
Marietta Blvd. 3.712 6917 3413 51
Georgia Environmental Protection Division
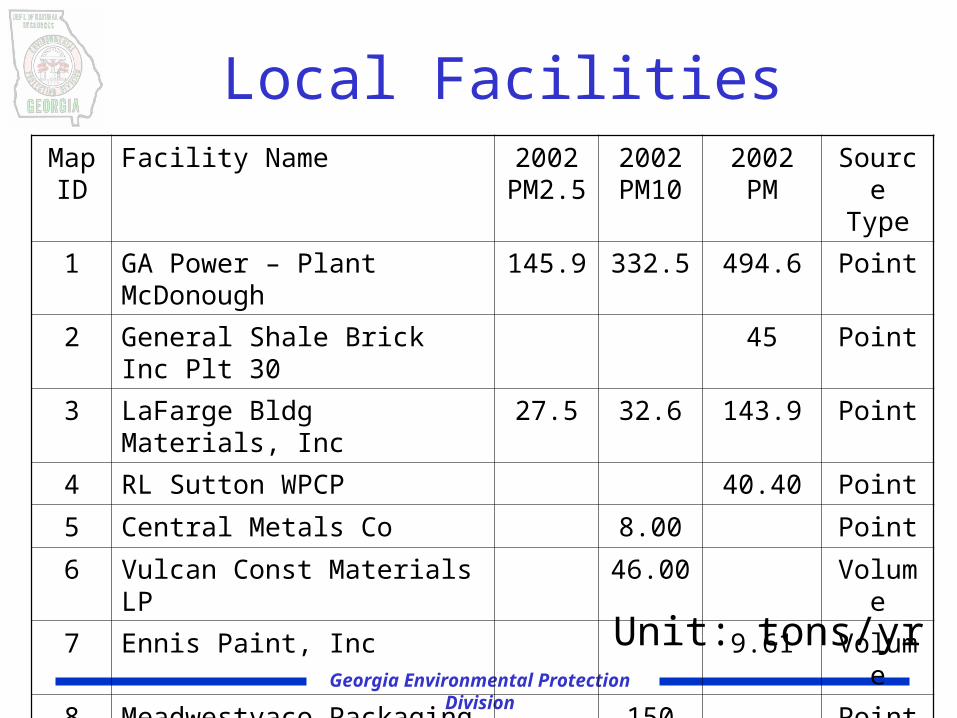
Local FacilitiesMap ID
Facility Name 2002 PM2.5
2002 PM10
2002 PM
Source Type
1 GA Power – Plant McDonough 145.9 332.5 494.6 Point
2 General Shale Brick Inc Plt 30 45 Point
3 LaFarge Bldg Materials, Inc 27.5 32.6 143.9 Point
4 RL Sutton WPCP 40.40 Point
5 Central Metals Co 8.00 Point
6 Vulcan Const Materials LP 46.00 Volume
7 Ennis Paint, Inc 9.61 Volume
8 Meadwestvaco Packaging 150 Point
9 Atlanta R M Clayton WPCP 21.1 Point
Unit: tons/yr

Georgia Environmental Protection Division
Railyard and Mobile Source Contribution* to Annual PM2.5
*Results are presented as 5-year average impact (2002 emissions).

Georgia Environmental Protection Division
Local Facility Contribution* toAnnual PM2.5 at FS#8
0.0
0.5
1.0
1.5
2.0
2.5
Total GaPow er ShaleBrick
LaFarge RL Sutton Ctrl Metal VulcanQuarry*
EnnisPaint*
Mead Pkg RMClayton
PM
2.5
(g
/m3
)
*Results are presented as 5-year average impact (2002 emissions).

Georgia Environmental Protection Division
2002 PM2.5 Contributions
Source FS #8
(g/m3)
E. Rivers (g/m3)
Railyards 2.4533 0.1687
Mobile 0.4454 0.0142
Point Sources 2.3138 0.8858
TOTAL 5.2125 1.0687
Modeled Local Increment = 4.1438 g/m3 Measured Local Increment = 1.8 g/m3

Georgia Environmental Protection Division
Local Contributions at FS #8
Source 2002
(g/m3)
2012
(g/m3)
Railyards 2.4533 1.4070
Mobile 0.4454 0.2205
Point Sources 2.3138 2.3138
TOTAL 5.2125 3.9413
Railyard Reduction (Gensets) = 1.0463 g/m3 Mobile Reduction = 0.2249 g/m3

Georgia Environmental Protection Division
Combining CMAQ and AERMOD Results

Georgia Environmental Protection Division
Railyard Adjustment to DVF
• Percent (%) Reduction in Modeled Local Increment due to Gensets Railyard Controls= (1.0463 g/m3)/(4.1438 g/m3) = 25.25%
• Reduction in Measured Local Increment due to Gensets Railyard Controls= (1.8 g/m3) * (25.25%) = 0.4545 g/m3

Georgia Environmental Protection Division
Mobile Adjustment to DVF
• Percent (%) Reduction in Modeled Local Increment due to Mobile Controls= (0.2249 g/m3)/(4.1438 g/m3) = 5.43%
• Reduction in Measured Local Increment due to Mobile Controls= (1.8 g/m3) * (5.43%) = 0.0977 g/m3

Georgia Environmental Protection Division
Revised 2012 DVF
• Revised 2012 DVF including Local Gensets Railyard & Mobile Controls= Revised 2012 DVF = 2012 DVF – Local
Reductions
= 15.3564 g/m3 - 0.4545 g/m3 - 0.0977 g/m3
= 14.80 g/m3
• Plan to redo calculations based on quarterly local increments & quarterly RRFs from AERMOD.

Georgia Environmental Protection Division
Yan Huang, Ph.D.Georgia Dept. of Natural Resources
4244 International Parkway, Suite 120Atlanta, GA 30354
[email protected] 404-363-7072
Contact Information