geotechnical performance limits - scdot.org 10 performance limits... · scdot geotechnical design...
TRANSCRIPT

Chapter 10
GEOTECHNICAL PERFORMANCE LIMITS
FINAL
SCDOT GEOTECHNICAL DESIGN MANUAL
August 2008


SCDOT Geotechnical Design Manual GEOTECHNICAL PERFORMANCE LIMITS
August 2008 10-i
Table of Contents
Section 10.1 Introduction ..................................................................................................... 10-1
Page
10.2 Performance Limits for LRFD Geotechnical Structures ................................... 10-1 10.2.1 Service Limit State Performance Objectives ........................................ 10-2 10.2.2 Extreme Event Limit State Performance Objectives ............................ 10-5 10.2.3 Performance Limits ............................................................................. 10-7
10.3 Deformations .................................................................................................. 10-8 10.4 Embankment Deformations ............................................................................ 10-8
10.4.1 Embankment Terminology and Deformation Notations........................ 10-8 10.4.2 Global Instability Deformations .......................................................... 10-10 10.4.3 Embankment Settlement ................................................................... 10-12 10.4.4 Transverse Differential Embankment Settlements ............................. 10-14 10.4.5 Embankment/Bridge Transition Settlement ....................................... 10-16
10.5 Bridge Deformations ..................................................................................... 10-17 10.5.1 Bridge Terminology and Deformation Notations ................................ 10-17 10.5.2 End Bent Vertical Deformations ........................................................ 10-19 10.5.3 Interior Bent Vertical Deformations .................................................... 10-19 10.5.4 Lateral Deformations ......................................................................... 10-20 10.5.5 Continuous Bridge Deformations ....................................................... 10-22
10.6 Earth Retaining Structure Deformations ........................................................ 10-23 10.6.1 Earth Retaining Structure Terminology and Deformation Notations ... 10-23 10.6.2 Global Instability Deformations .......................................................... 10-25 10.6.3 Settlement Deformation - Longitudinal .............................................. 10-27 10.6.4 Settlement Deformation - Transverse ................................................ 10-29 10.6.5 Lateral Displacements ....................................................................... 10-30
10.7 Performance Limits For Embankments ......................................................... 10-32 10.7.1 Service Limit State ............................................................................ 10-32 10.7.2 Extreme Event I Limit State ............................................................... 10-34
10.8 Performance Limits for Bridges ..................................................................... 10-36 10.8.1 Service Limit State ............................................................................ 10-36 10.8.2 Extreme Event I Limit State ............................................................... 10-37
10.9 Performance Limits For Earth Retaining Structures ...................................... 10-40 10.9.1 Service Limit State ............................................................................ 10-40 10.9.2 Extreme Event I Limit State ............................................................... 10-43
10.10 References ................................................................................................... 10-48
SCDOT Geotechnical Design Manual GEOTECHNICAL PERFORMANCE LIMITS
10-ii August 2008
List of Tables
Table Table 10-1, Extreme Event Service Level ................................................................... 10-6
Page
Table 10-2, Extreme Event Damage Levels ............................................................... 10-6 Table 10-3, SCDOT Design Earthquakes ................................................................... 10-7 Table 10-4, Embankment Terminology ....................................................................... 10-9 Table 10-5, Embankment Deformation Notations ..................................................... 10-10 Table 10-6, Global Instability Deformations Performance Limits ............................... 10-10 Table 10-7, Embankment Settlement Performance Limits ........................................ 10-12 Table 10-8, Embankment Widening Settlement Performance Limits ........................ 10-15 Table 10-9, Bridge/Embankment Transition Settlement Performance Limits ............ 10-16 Table 10-10, Bridge Terminology ............................................................................. 10-17 Table 10-11, Bridge Deformation Notations .............................................................. 10-18 Table 10-12, End Bent Vertical Deformation Performance Limits ............................. 10-19 Table 10-13, Interior Bent Vertical Deformation Performance Limits ........................ 10-20 Table 10-14, End Bent Lateral Deformation Performance Limits .............................. 10-21 Table 10-15, Interior Bent Lateral Deformation Performance Limits ......................... 10-21 Table 10-16, Earth Retaining Structures Terminology .............................................. 10-23 Table 10-17, Cut – Earth Retaining Structures (ERS) ............................................... 10-24 Table 10-18, Fill – Earth Retaining Structures (ERS)................................................ 10-24 Table 10-19, ERS Deformation Notations ................................................................. 10-25 Table 10-20, ERS Performance Limits for Slope Instability....................................... 10-26 Table 10-21, ERS Settlement (Longitudinal) Performance Limits ............................. 10-28 Table 10-22, ERS Settlement (Transverse) Performance Limits .............................. 10-29 Table 10-23, ERS Lateral Performance Limits .......................................................... 10-31 Table 10-24, Embankment Performance Limits at SLS ............................................ 10-33 Table 10-25, Bridge/Embankment Transition Settlement Performance Limit at SLS. 10-33 Table 10-26, Embankment Widening Performance Limits at SLS............................. 10-33 Table 10-27, Embankment Extreme Event I Performance Objectives ...................... 10-34 Table 10-28, Embankment Global Instability Performance Limits at EE I Limit State 10-34 Table 10-29, Embankment Settlement Performance Limits at EE I Limit State ......... 10-35 Table 10-30, Bridge/Embankment Transition Settlement Performance Limit EE I LS10-35 Table 10-31, Embankment Widening Settl. Performance Limits at EE I Limit State .. 10-35 Table 10-32, Bridge Performance Limits at SLS ....................................................... 10-36 Table 10-33, Bridge System Extreme Event I (Seismic) Performance Objectives ..... 10-37 Table 10-34, Bridge Components Damage Level Objectives .................................... 10-38 Table 10-35, Bridge Substructure Performance Limits at EE I Limit State ................ 10-39 Table 10-36, Bridge Substructure Performance Limits at EE I Limit State ................ 10-40 Table 10-37, Fill ERS Performance Limits at SLS .................................................... 10-41 Table 10-38, Cut ERS Performance Limits at SLS ................................................... 10-42 Table 10-39, Embankment Extreme Event I Performance Objectives ...................... 10-43 Table 10-40, ERS Global Stability Performance Limits at EE I Limit State ................ 10-44 Table 10-41, Fill ERS Settlement Performance Limits at EE I Limit State ................. 10-45 Table 10-42, Fill ERS Lateral Displacement Performance Limits at EE I Limit State 10-46 Table 10-43, Cut ERS Performance Limits at EE I Limit State .................................. 10-47
SCDOT Geotechnical Design Manual GEOTECHNICAL PERFORMANCE LIMITS
August 2008 10-iii
List of Figures
Figure Figure 10-1, Embankment Circular Arc Instability ..................................................... 10-11
Page
Figure 10-2, Embankment Sliding Block Instability ................................................... 10-12 Figure 10-3, Embankment Settlement (Section A–A) ............................................... 10-13 Figure 10-4, Divided Highway (Section A-A) ............................................................ 10-13 Figure 10-5, Embankment Settlement Profile ........................................................... 10-14 Figure 10-6, Embankment Widening Settlement (Section A-A) ................................ 10-15 Figure 10-7, Bridge Approach Embankment Settlement ........................................... 10-16 Figure 10-8, Bridge Layout (Simple or Continuous Span) ......................................... 10-18 Figure 10-9, Bridge End Bent Slope Instability Deformation ..................................... 10-19 Figure 10-10, Bridge Interior Bent Settlement........................................................... 10-20 Figure 10-11, Bridge Lateral Displacement .............................................................. 10-22 Figure 10-12, Continuous Bridge Settlements .......................................................... 10-22 Figure 10-13, ERS Global Instability ......................................................................... 10-26 Figure 10-14, ERS Circular-Arc Instability (Section B-B) .......................................... 10-27 Figure 10-15, ERS Sliding-Wedge Instability (Section B-B) ...................................... 10-27 Figure 10-16, ERS Settlement (Section B–B) ........................................................... 10-28 Figure 10-17, ERS Settlement Profile ....................................................................... 10-29 Figure 10-18, ERS Reinforced Soils - Transverse Differential Settlement ................ 10-30 Figure 10-19, ERS Tieback Anchor - Transverse Differential Settlement .................. 10-30 Figure 10-20, Cut ERS Section C-C Lateral Deformations ....................................... 10-31 Figure 10-21, Fill ERS Section C-C Lateral Deformations ........................................ 10-31 Figure 10-22, ERS Lateral Deformations .................................................................. 10-32


SCDOT Geotechnical Design Manual GEOTECHNICAL PERFORMANCE LIMITS
August 2008 10-1
CHAPTER 10
GEOTECHNICAL PERFORMANCE LIMITS 10.1 INTRODUCTION
LRFD incorporates the use of limit states as a condition beyond which a component/member or foundation of a structure ceases to satisfy the provisions for which it was designed. The Service limit states and the Extreme Event limit states have design boundary conditions for structural performance that account for some acceptable measure of structural movement throughout the structure’s design life. The performance limits for geotechnical structures such as Embankments, Bridge Foundations, and Earth Retaining Structures (ERS) are presented in this Chapter. Performance limits include the design life of the structure, structural performance under Service loads, and structural performance under Extreme Event Loads. The design life for bridge structures is typically 75 years and for geotechnical structures 100 years. Structures that cannot be replaced without significant expense or that may be subject to structural distress due to environmental conditions (corrosion, biological degradation, etc.) may have a design life that exceeds the typical design life. The structural performance under Service and Extreme Event loads are typically expressed in terms of settlement, settlement rate, differential settlement, vertical displacement, lateral displacements, and rotations.
The LRFD geotechnical design philosophy and load factors for geotechnical engineering are provided in Chapter 8. The resistance factors for the Strength, Service, and Extreme Event limit states are provided in Chapter 9. The design methodology to analyze structure performance shall be in accordance with AASHTO design methodology with modifications/deviations as indicated in the appropriate Chapters of this Manual.
10.2 PERFORMANCE LIMITS FOR LRFD GEOTECHNICAL STRUCTURES
Transportation structures are typically thought of as being rigid and stationary, but in reality they deform throughout their service life due to various physical (loads) and environmental (temperature, degradation, etc.) conditions exerted on the structures. The deformations range from the elastic range where no permanent deformations remain after unloading, to the plastic range where deformations become permanent even after unloading, and finally to rupture where the material is permanently severed. The types of loadings that cause these deformations are discussed in Chapter 8. The deformations experienced by geotechnical structures are typically non-linear, dependent on subsurface site variability, influenced by environmental factors, and highly dependent on soil-structure interaction due to strain compatibility (stiffness) between soil, aggregates (stone, gravel, etc.), soil reinforcements/anchors (steel or geosynthetic), reinforced concrete, steel, etc. Soils are considerably more compressible, have essentially no tensile strength, and have shear strengths that occur at considerably larger displacements. Unlike concrete and steel, soil properties are highly variable. Soils found in-place may vary significantly within short distances both vertically and horizontally because soil composition and properties are based on geologic mechanisms. When soils are engineered through material selection and construction control, soil variability in composition and density can still occur as a result of the non-uniformity of the material stockpile, weather, and construction.

SCDOT Geotechnical Design Manual GEOTECHNICAL PERFORMANCE LIMITS
10-2 August 2008
Performance limits presented in this Chapter are the result of the SCDOT first establishing Performance Objectives for typical geotechnical structures such as Embankments, Bridge Foundations, and Earth Retaining Structures. Once the Performance Objectives are established, the Performance Limits for each geotechnical structure were developed to meet the level of functionality defined by the objectives. Performance Objectives and Performance Limits define the level of functionality of the structure for the limit state loading condition being evaluated. The Performance Objectives and Performance Limits for permanent geotechnical structures in this Chapter are based on:
• Limit State:
•
Service I limit state or Extreme Event I limit state load combinations defined in Chapter 8. Geotechnical Structure Importance Classification:
Bridge Operational Classification (OC) or Roadway Structure Operational Classification (ROC) as defined in Chapter 8.
The loadings used in these analyses are typically without adjustment for variability in both the load and resistance portion of the analysis. The load and resistance factors generally used in geotechnical analyses are unity (1.0) unless indicated otherwise in Chapters 8 and 9 of this Manual. When load factors greater than unity (1.0) or resistance factors less than unity (1.0) are used, this is typically due to the variability or uncertainty associated with the load or resistance being computed. The design intent is to analyze the most likely behavior of the structure when subjected to typical loadings for each limit state. The Performance Objectives and Performance Limits for the following geotechnical structures are not provided in this Manual and should be developed on a project specific basis.
• Performance Objectives and Limits for Hydraulic Structures (three-sided culverts, concrete box culverts, etc.) at the Service I and Extreme Event I limit state
• Extreme Event II performance limits for collision loadings • Temporary geotechnical structures (i.e. structures having a life of less than 5 years)
It is the intent of this Chapter to also provide the framework to develop project specific performance objectives and limits for structures subjected to service loadings and Extreme Event loadings that are not included in this Chapter.
When evaluating the performance of hydraulic structures consideration of adjacent structures such as Embankments (Section 10.7) or Earth Retaining Structures (Section 10.9) should be given since the Performance Objectives and Performance Limits of these geotechnical structures may not be compatible with the requirements for hydraulic structures.
10.2.1
The Performance Objective for the Service limit state (SLS) requires that with standard SCDOT maintenance the structure remain fully functional to normal traffic for the design life of the structure. The performance of a structure under Service loads is influenced by many factors that may or may not be within the designer’s control. The following list of considerations will influence the Service performance of the structure over its design life.
Service Limit State Performance Objectives
SCDOT Geotechnical Design Manual GEOTECHNICAL PERFORMANCE LIMITS
August 2008 10-3
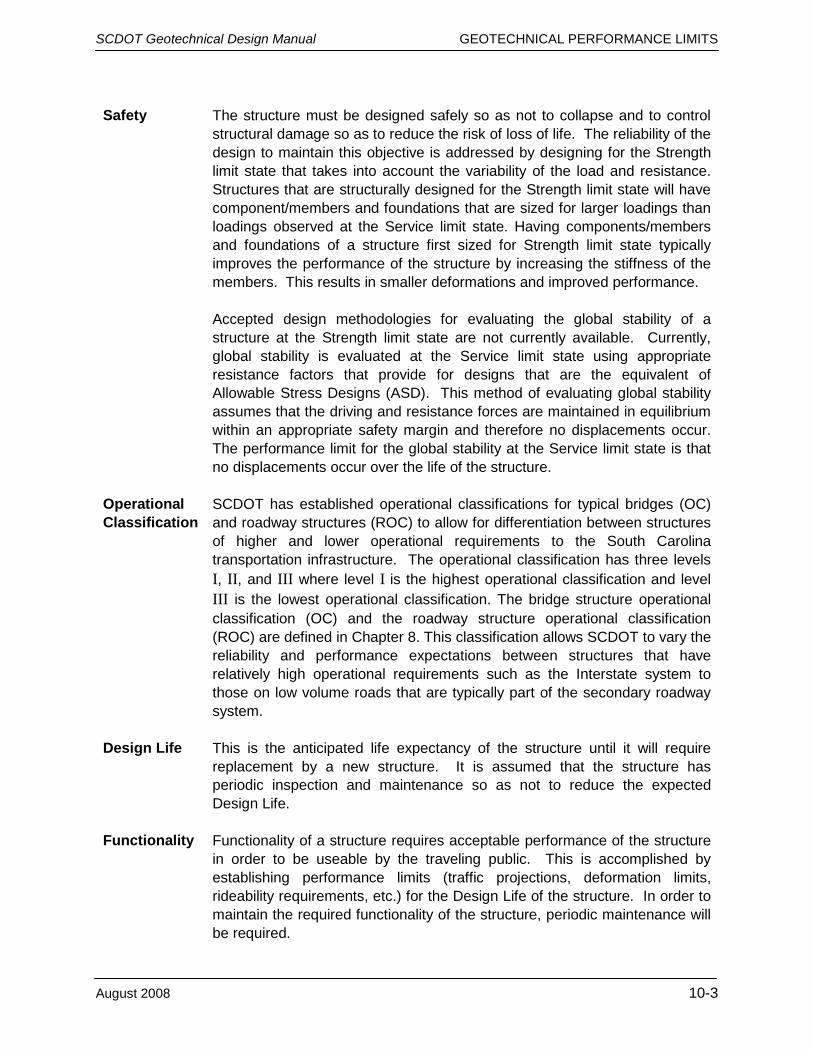
Safety The structure must be designed safely so as not to collapse and to control
structural damage so as to reduce the risk of loss of life. The reliability of the design to maintain this objective is addressed by designing for the Strength limit state that takes into account the variability of the load and resistance. Structures that are structurally designed for the Strength limit state will have component/members and foundations that are sized for larger loadings than loadings observed at the Service limit state. Having components/members and foundations of a structure first sized for Strength limit state typically improves the performance of the structure by increasing the stiffness of the members. This results in smaller deformations and improved performance. Accepted design methodologies for evaluating the global stability of a structure at the Strength limit state are not currently available. Currently, global stability is evaluated at the Service limit state using appropriate resistance factors that provide for designs that are the equivalent of Allowable Stress Designs (ASD). This method of evaluating global stability assumes that the driving and resistance forces are maintained in equilibrium within an appropriate safety margin and therefore no displacements occur. The performance limit for the global stability at the Service limit state is that no displacements occur over the life of the structure.
Operational Classification
SCDOT has established operational classifications for typical bridges (OC) and roadway structures (ROC) to allow for differentiation between structures of higher and lower operational requirements to the South Carolina transportation infrastructure. The operational classification has three levels I, II, and III where level I is the highest operational classification and level III is the lowest operational classification. The bridge structure operational classification (OC) and the roadway structure operational classification (ROC) are defined in Chapter 8. This classification allows SCDOT to vary the reliability and performance expectations between structures that have relatively high operational requirements such as the Interstate system to those on low volume roads that are typically part of the secondary roadway system.
Design Life This is the anticipated life expectancy of the structure until it will require
replacement by a new structure. It is assumed that the structure has periodic inspection and maintenance so as not to reduce the expected Design Life.
Functionality Functionality of a structure requires acceptable performance of the structure
in order to be useable by the traveling public. This is accomplished by establishing performance limits (traffic projections, deformation limits, rideability requirements, etc.) for the Design Life of the structure. In order to maintain the required functionality of the structure, periodic maintenance will be required.

SCDOT Geotechnical Design Manual GEOTECHNICAL PERFORMANCE LIMITS
10-4 August 2008
Aesthetics The Service limit state requires that the aesthetics of a structure be consistent with the environment where the structure will be placed. The aesthetic requirement of a structure located in an urban setting with high visibility will be different from those aesthetic requirements of a structure located in a rural setting with low visibility by the traveling public. Aesthetics of the structure is also defined by public perception of how safe or visually appealing a structure appears. A structure that is structurally stable but has cracks, excessive deformations in the form of bulges, out-of-plumb, etc. is not aesthetically satisfactory. Satisfying aesthetics objectives requires proper planning (public hearings, timely information, etc.), good construction specifications that specify construction tolerances, finish requirements, proper inspection during construction, and periodic maintenance.
Construction The Service limit state requires the development of plans and construction
specifications that are clear and take into account the constructability of the design and any construction monitoring. Construction specifications should include construction tolerances, construction methods, and field performance monitoring of the structure such as settlement monitoring.
Maintenance A Maintenance Plan should be in place that consists of periodic inspections of the structure and communication with designers to evaluate the results of the inspections. The Maintenance Plan should also provide for the development of the appropriate responses required to meet the serviceability requirements of the structure for the remainder of its design life. Design details of the structure should allow for periodic inspection of vital components that would affect the structure’s performance.
Risk The selection of the type of structure to be used in the design should consider
any associated risk that would affect the performance of the structure. Some factors that increase the risk of unsatisfactory structure performance are presented below:
• Construction:
•
Common types of structures are usually associated with less construction risk due to the familiarity of the construction procedures. Structure Selection:
•
Failure to consider the limitations of the structure type selected in relation to the desired performance may lead to unsatisfactory performance. A common misapplication in construction is the use of cantilever sheetpiling for temporary shoring of deep excavations. The deformations typically exceed acceptable performance for adjacent structures. Design/Construction Methodology:
•
Misapplication of methodologies in design (i.e. using unaccepted design methods) or construction (i.e. misapplication of ground improvement method). Design Experience:
Insufficient design experience of either the structure design or any ground improvement required can lead to unsatisfactory performance. Insufficient design experience includes untested designs, new design methodologies, and designer’s inexperience.
SCDOT Geotechnical Design Manual GEOTECHNICAL PERFORMANCE LIMITS
August 2008 10-5
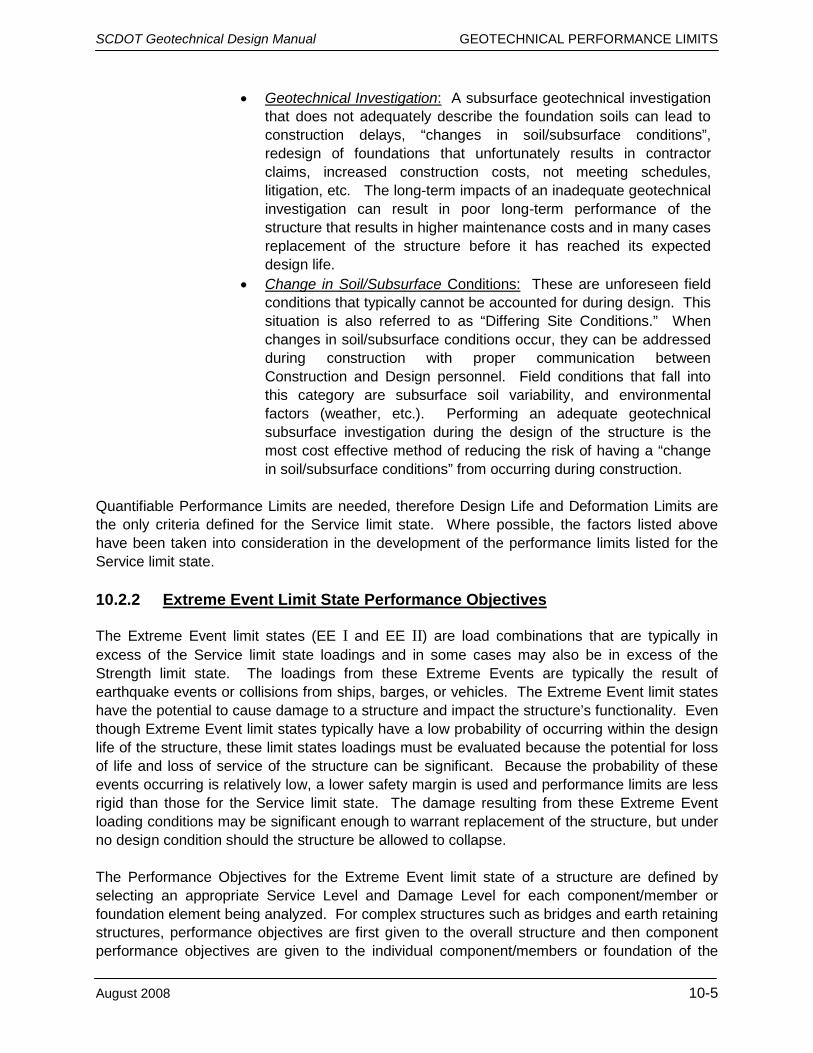
• Geotechnical Investigation:
•
A subsurface geotechnical investigation that does not adequately describe the foundation soils can lead to construction delays, “changes in soil/subsurface conditions”, redesign of foundations that unfortunately results in contractor claims, increased construction costs, not meeting schedules, litigation, etc. The long-term impacts of an inadequate geotechnical investigation can result in poor long-term performance of the structure that results in higher maintenance costs and in many cases replacement of the structure before it has reached its expected design life. Change in Soil/Subsurface Conditions:
These are unforeseen field conditions that typically cannot be accounted for during design. This situation is also referred to as “Differing Site Conditions.” When changes in soil/subsurface conditions occur, they can be addressed during construction with proper communication between Construction and Design personnel. Field conditions that fall into this category are subsurface soil variability, and environmental factors (weather, etc.). Performing an adequate geotechnical subsurface investigation during the design of the structure is the most cost effective method of reducing the risk of having a “change in soil/subsurface conditions” from occurring during construction.
Quantifiable Performance Limits are needed, therefore Design Life and Deformation Limits are the only criteria defined for the Service limit state. Where possible, the factors listed above have been taken into consideration in the development of the performance limits listed for the Service limit state. 10.2.2
The Extreme Event limit states (EE I and EE II) are load combinations that are typically in excess of the Service limit state loadings and in some cases may also be in excess of the Strength limit state. The loadings from these Extreme Events are typically the result of earthquake events or collisions from ships, barges, or vehicles. The Extreme Event limit states have the potential to cause damage to a structure and impact the structure’s functionality. Even though Extreme Event limit states typically have a low probability of occurring within the design life of the structure, these limit states loadings must be evaluated because the potential for loss of life and loss of service of the structure can be significant. Because the probability of these events occurring is relatively low, a lower safety margin is used and performance limits are less rigid than those for the Service limit state. The damage resulting from these Extreme Event loading conditions may be significant enough to warrant replacement of the structure, but under no design condition should the structure be allowed to collapse.
Extreme Event Limit State Performance Objectives
The Performance Objectives for the Extreme Event limit state of a structure are defined by selecting an appropriate Service Level and Damage Level for each component/member or foundation element being analyzed. For complex structures such as bridges and earth retaining structures, performance objectives are first given to the overall structure and then component performance objectives are given to the individual component/members or foundation of the
SCDOT Geotechnical Design Manual GEOTECHNICAL PERFORMANCE LIMITS
10-6 August 2008
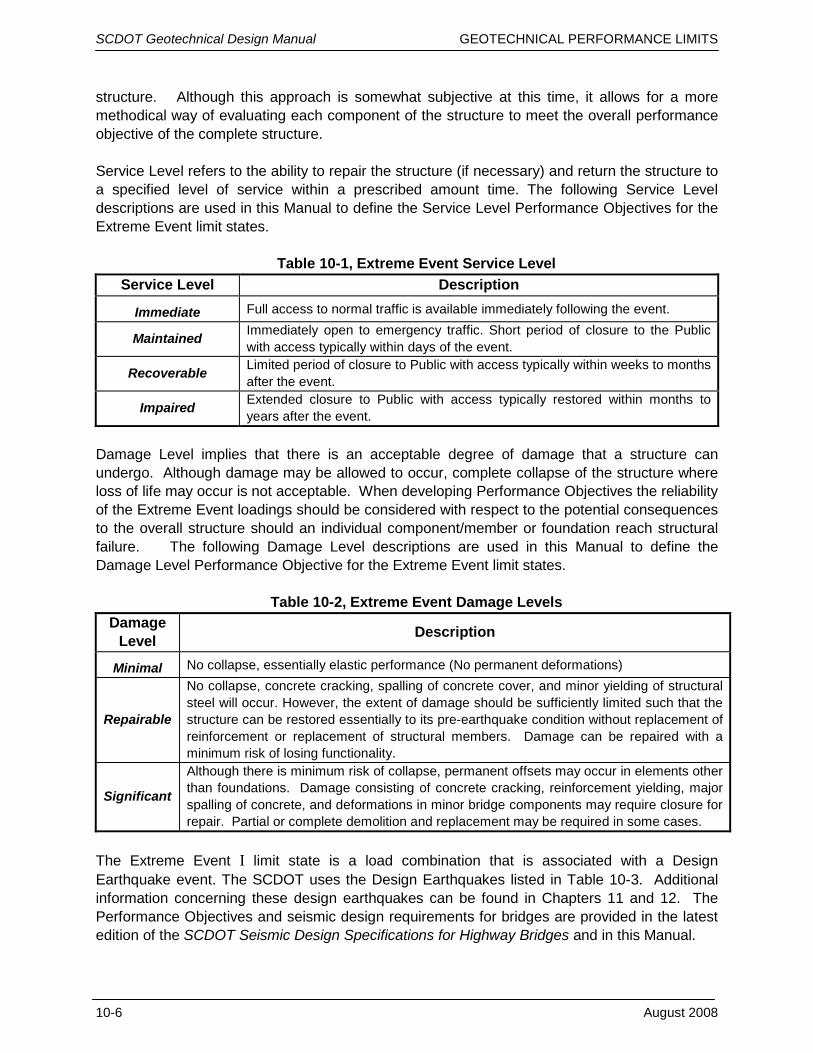
structure. Although this approach is somewhat subjective at this time, it allows for a more methodical way of evaluating each component of the structure to meet the overall performance objective of the complete structure. Service Level refers to the ability to repair the structure (if necessary) and return the structure to a specified level of service within a prescribed amount time. The following Service Level descriptions are used in this Manual to define the Service Level Performance Objectives for the Extreme Event limit states.
Table 10-1, Extreme Event Service Level Service Level Description
Immediate Full access to normal traffic is available immediately following the event.
Maintained Immediately open to emergency traffic. Short period of closure to the Public with access typically within days of the event.
Recoverable Limited period of closure to Public with access typically within weeks to months after the event.
Impaired Extended closure to Public with access typically restored within months to years after the event.
Damage Level implies that there is an acceptable degree of damage that a structure can undergo. Although damage may be allowed to occur, complete collapse of the structure where loss of life may occur is not acceptable. When developing Performance Objectives the reliability of the Extreme Event loadings should be considered with respect to the potential consequences to the overall structure should an individual component/member or foundation reach structural failure. The following Damage Level descriptions are used in this Manual to define the Damage Level Performance Objective for the Extreme Event limit states.
Table 10-2, Extreme Event Damage Levels Damage
Level Description
Minimal No collapse, essentially elastic performance (No permanent deformations)
Repairable
No collapse, concrete cracking, spalling of concrete cover, and minor yielding of structural steel will occur. However, the extent of damage should be sufficiently limited such that the structure can be restored essentially to its pre-earthquake condition without replacement of reinforcement or replacement of structural members. Damage can be repaired with a minimum risk of losing functionality.
Significant
Although there is minimum risk of collapse, permanent offsets may occur in elements other than foundations. Damage consisting of concrete cracking, reinforcement yielding, major spalling of concrete, and deformations in minor bridge components may require closure for repair. Partial or complete demolition and replacement may be required in some cases.
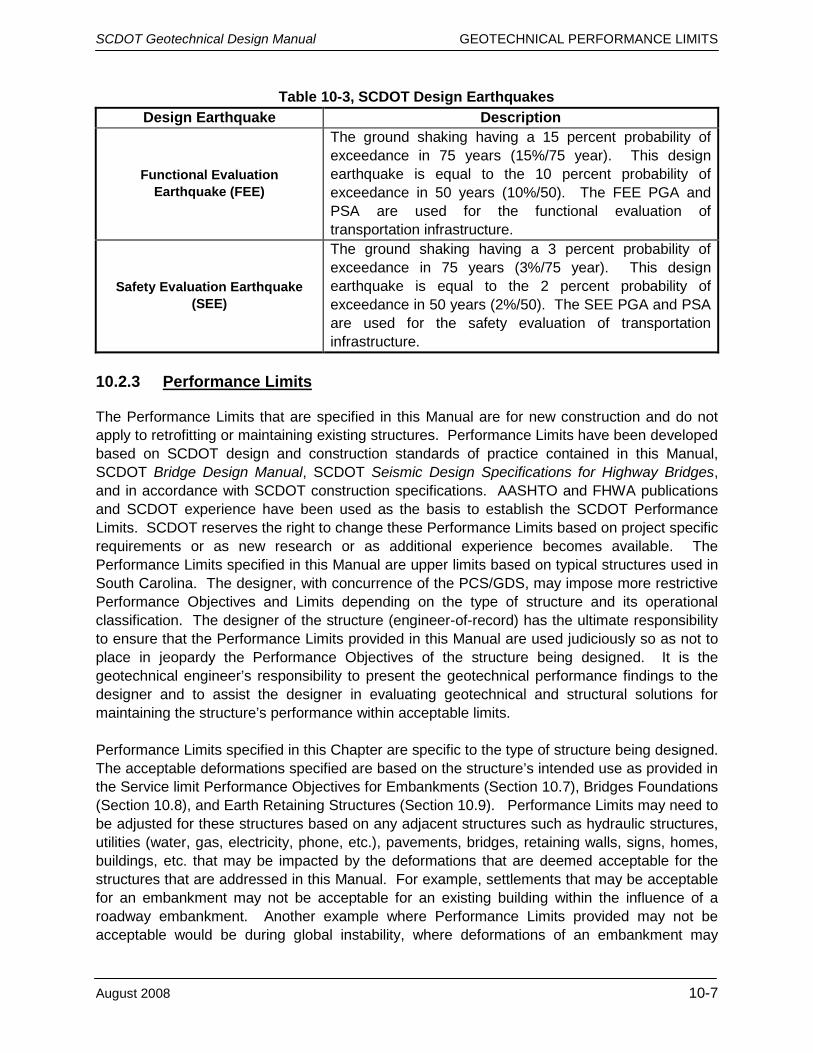
The Extreme Event I limit state is a load combination that is associated with a Design Earthquake event. The SCDOT uses the Design Earthquakes listed in Table 10-3. Additional information concerning these design earthquakes can be found in Chapters 11 and 12. The Performance Objectives and seismic design requirements for bridges are provided in the latest edition of the SCDOT Seismic Design Specifications for Highway Bridges and in this Manual.
SCDOT Geotechnical Design Manual GEOTECHNICAL PERFORMANCE LIMITS
August 2008 10-7
Table 10-3, SCDOT Design Earthquakes Design Earthquake Description
Functional Evaluation Earthquake (FEE)
The ground shaking having a 15 percent probability of exceedance in 75 years (15%/75 year). This design earthquake is equal to the 10 percent probability of exceedance in 50 years (10%/50). The FEE PGA and PSA are used for the functional evaluation of transportation infrastructure.
Safety Evaluation Earthquake (SEE)
The ground shaking having a 3 percent probability of exceedance in 75 years (3%/75 year). This design earthquake is equal to the 2 percent probability of exceedance in 50 years (2%/50). The SEE PGA and PSA are used for the safety evaluation of transportation infrastructure.
10.2.3
The Performance Limits that are specified in this Manual are for new construction and do not apply to retrofitting or maintaining existing structures. Performance Limits have been developed based on SCDOT design and construction standards of practice contained in this Manual, SCDOT Bridge Design Manual, SCDOT Seismic Design Specifications for Highway Bridges, and in accordance with SCDOT construction specifications. AASHTO and FHWA publications and SCDOT experience have been used as the basis to establish the SCDOT Performance Limits. SCDOT reserves the right to change these Performance Limits based on project specific requirements or as new research or as additional experience becomes available. The Performance Limits specified in this Manual are upper limits based on typical structures used in South Carolina. The designer, with concurrence of the PCS/GDS, may impose more restrictive Performance Objectives and Limits depending on the type of structure and its operational classification. The designer of the structure (engineer-of-record) has the ultimate responsibility to ensure that the Performance Limits provided in this Manual are used judiciously so as not to place in jeopardy the Performance Objectives of the structure being designed. It is the geotechnical engineer’s responsibility to present the geotechnical performance findings to the designer and to assist the designer in evaluating geotechnical and structural solutions for maintaining the structure’s performance within acceptable limits.
Performance Limits
Performance Limits specified in this Chapter are specific to the type of structure being designed. The acceptable deformations specified are based on the structure’s intended use as provided in the Service limit Performance Objectives for Embankments (Section 10.7), Bridges Foundations (Section 10.8), and Earth Retaining Structures (Section 10.9). Performance Limits may need to be adjusted for these structures based on any adjacent structures such as hydraulic structures, utilities (water, gas, electricity, phone, etc.), pavements, bridges, retaining walls, signs, homes, buildings, etc. that may be impacted by the deformations that are deemed acceptable for the structures that are addressed in this Manual. For example, settlements that may be acceptable for an embankment may not be acceptable for an existing building within the influence of a roadway embankment. Another example where Performance Limits provided may not be acceptable would be during global instability, where deformations of an embankment may

SCDOT Geotechnical Design Manual GEOTECHNICAL PERFORMANCE LIMITS
10-8 August 2008
distress adjacent structures such as bridges, side ramps, or other structures beyond the Right-of-Way. Performance Limits not covered in this Manual will require that the designer, in conjunction with the SCDOT, first establish Performance Objectives for the structure being analyzed. Once the Performance Objectives have been developed, Performance Limits can be established to meet the Performance Objectives. 10.3 DEFORMATIONS
Performance Limits are specified in terms of acceptable vertical and lateral displacements. Displacements can be a result of direct movements such as settlement of an embankment or as a result of rotations such as embankment instability or foundation rotations due to lateral loadings. Vertical displacements that occur in a downward direction (into the ground) are referred to as settlement. Specifying a Maximum Vertical Settlement can help to control total settlements. Damage or poor performance of a structure most often occurs as a result of excessive differential displacements. An example of this would be a bridge with foundations supported by rock and with the approach embankments supported on very compressible soils. The bridge would remain relatively stationary vertically while the approach embankment would settle substantially relative to the bridge. The vertical differential displacements would affect vehicle rideability and add structural loads to the abutment foundations as a result of downdrag on deep foundations. Specifying a Maximum Vertical Differential Settlement would help to control the differential vertical displacements that occur between the bridge abutment and the bridge approach embankment to an acceptable level of performance. There may be situations where vertical displacements act upward, due to heave or differential movements of a structure. This condition may cause part of the structure to move up when other parts of the structure move downward (settlement). The Maximum Vertical Differential Displacement limits also control these upward and downward displacements to an acceptable level of performance. Lateral displacements (horizontal movements) are identified as occurring in either longitudinal or transverse directions. On bridges and roadways, the longitudinal direction is the same direction as the vehicle travel direction (either travel lane). The transverse direction is the direction that is perpendicular to the vehicle travel direction. Unless otherwise indicated in the performance limit description, the lateral displacements do not have sign convention and may occur in either direction. 10.4 EMBANKMENT DEFORMATIONS
10.4.1
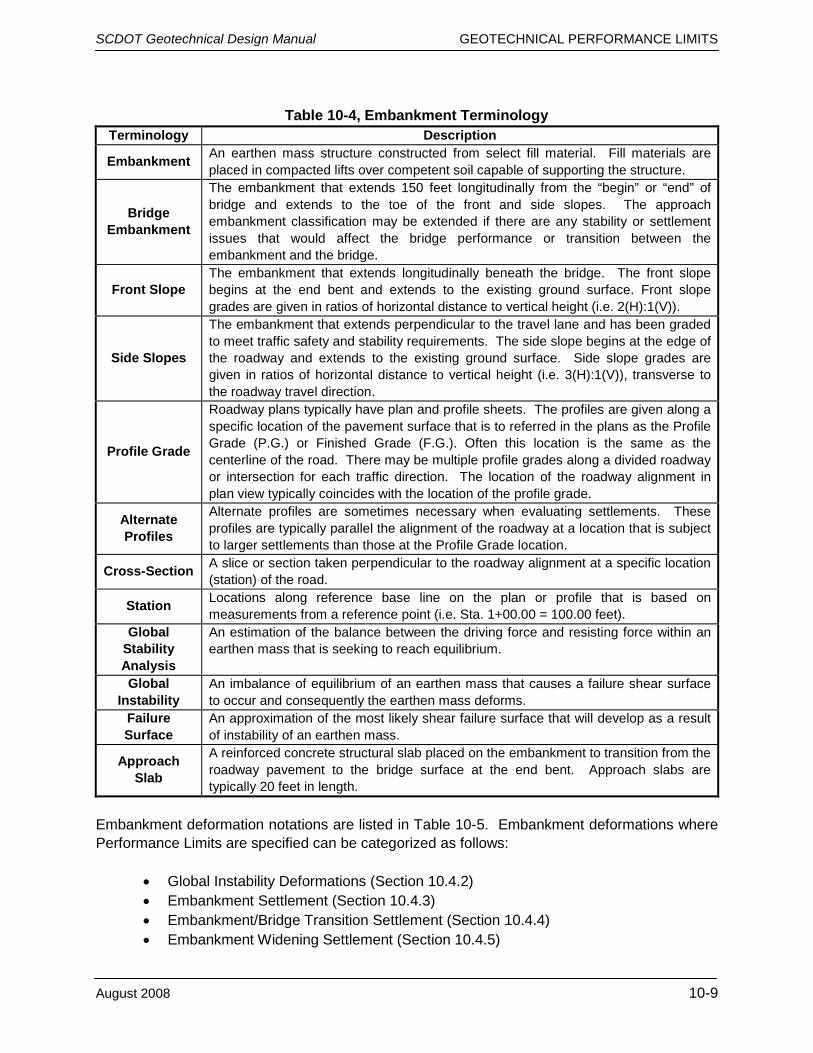
Embankment design with respect to global stability and settlements are discussed in Chapter 17. Terminology used to specify geotechnical performance limits for embankments along roadways and at bridge approaches is presented in Table 10-4.
Embankment Terminology and Deformation Notations
SCDOT Geotechnical Design Manual GEOTECHNICAL PERFORMANCE LIMITS
August 2008 10-9
Table 10-4, Embankment Terminology
Terminology Description
Embankment An earthen mass structure constructed from select fill material. Fill materials are placed in compacted lifts over competent soil capable of supporting the structure.
Bridge Embankment
The embankment that extends 150 feet longitudinally from the “begin” or “end” of bridge and extends to the toe of the front and side slopes. The approach embankment classification may be extended if there are any stability or settlement issues that would affect the bridge performance or transition between the embankment and the bridge.
Front Slope The embankment that extends longitudinally beneath the bridge. The front slope begins at the end bent and extends to the existing ground surface. Front slope grades are given in ratios of horizontal distance to vertical height (i.e. 2(H):1(V)).
Side Slopes
The embankment that extends perpendicular to the travel lane and has been graded to meet traffic safety and stability requirements. The side slope begins at the edge of the roadway and extends to the existing ground surface. Side slope grades are given in ratios of horizontal distance to vertical height (i.e. 3(H):1(V)), transverse to the roadway travel direction.
Profile Grade
Roadway plans typically have plan and profile sheets. The profiles are given along a specific location of the pavement surface that is to referred in the plans as the Profile Grade (P.G.) or Finished Grade (F.G.). Often this location is the same as the centerline of the road. There may be multiple profile grades along a divided roadway or intersection for each traffic direction. The location of the roadway alignment in plan view typically coincides with the location of the profile grade.
Alternate Profiles
Alternate profiles are sometimes necessary when evaluating settlements. These profiles are typically parallel the alignment of the roadway at a location that is subject to larger settlements than those at the Profile Grade location.
Cross-Section A slice or section taken perpendicular to the roadway alignment at a specific location (station) of the road.
Station Locations along reference base line on the plan or profile that is based on measurements from a reference point (i.e. Sta. 1+00.00 = 100.00 feet).
Global Stability Analysis
An estimation of the balance between the driving force and resisting force within an earthen mass that is seeking to reach equilibrium.
Global Instability
An imbalance of equilibrium of an earthen mass that causes a failure shear surface to occur and consequently the earthen mass deforms.
Failure Surface
An approximation of the most likely shear failure surface that will develop as a result of instability of an earthen mass.
Approach Slab
A reinforced concrete structural slab placed on the embankment to transition from the roadway pavement to the bridge surface at the end bent. Approach slabs are typically 20 feet in length.
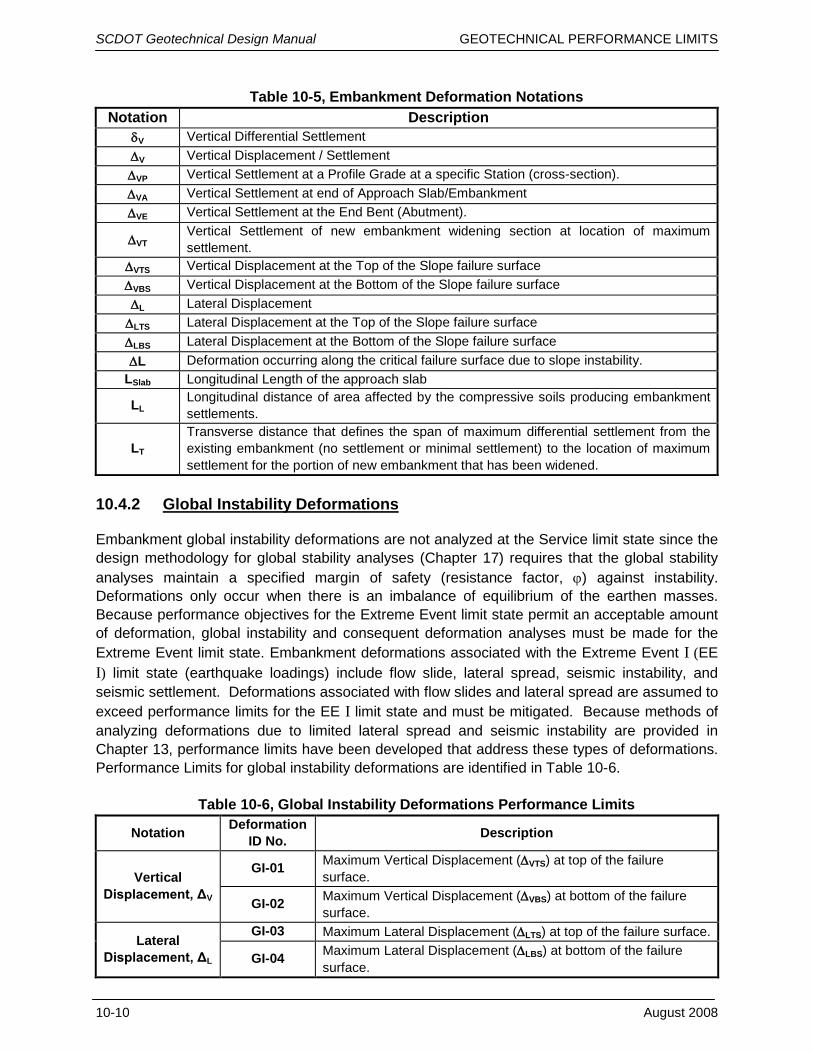
Embankment deformation notations are listed in Table 10-5. Embankment deformations where Performance Limits are specified can be categorized as follows:
• Global Instability Deformations (Section 10.4.2) • Embankment Settlement (Section 10.4.3) • Embankment/Bridge Transition Settlement (Section 10.4.4) • Embankment Widening Settlement (Section 10.4.5)
SCDOT Geotechnical Design Manual GEOTECHNICAL PERFORMANCE LIMITS
10-10 August 2008
Table 10-5, Embankment Deformation Notations Notation Description
δV Vertical Differential Settlement ∆V Vertical Displacement / Settlement ∆VP Vertical Settlement at a Profile Grade at a specific Station (cross-section). ∆VA Vertical Settlement at end of Approach Slab/Embankment ∆VE Vertical Settlement at the End Bent (Abutment).
∆VT Vertical Settlement of new embankment widening section at location of maximum settlement.
∆VTS Vertical Displacement at the Top of the Slope failure surface ∆VBS Vertical Displacement at the Bottom of the Slope failure surface ∆L Lateral Displacement ∆LTS Lateral Displacement at the Top of the Slope failure surface ∆LBS Lateral Displacement at the Bottom of the Slope failure surface ∆L Deformation occurring along the critical failure surface due to slope instability.
LSlab Longitudinal Length of the approach slab
LL Longitudinal distance of area affected by the compressive soils producing embankment settlements.
LT
Transverse distance that defines the span of maximum differential settlement from the existing embankment (no settlement or minimal settlement) to the location of maximum settlement for the portion of new embankment that has been widened.
10.4.2
Embankment global instability deformations are not analyzed at the Service limit state since the design methodology for global stability analyses (Chapter 17) requires that the global stability analyses maintain a specified margin of safety (resistance factor, ϕ) against instability. Deformations only occur when there is an imbalance of equilibrium of the earthen masses. Because performance objectives for the Extreme Event limit state permit an acceptable amount of deformation, global instability and consequent deformation analyses must be made for the Extreme Event limit state. Embankment deformations associated with the Extreme Event I (EE I) limit state (earthquake loadings) include flow slide, lateral spread, seismic instability, and seismic settlement. Deformations associated with flow slides and lateral spread are assumed to exceed performance limits for the EE I limit state and must be mitigated. Because methods of analyzing deformations due to limited lateral spread and seismic instability are provided in Chapter 13, performance limits have been developed that address these types of deformations. Performance Limits for global instability deformations are identified in Table 10-6.
Global Instability Deformations
Table 10-6, Global Instability Deformations Performance Limits
Notation Deformation ID No. Description
Vertical Displacement, ΔV
GI-01 Maximum Vertical Displacement (∆VTS) at top of the failure surface.
GI-02 Maximum Vertical Displacement (∆VBS) at bottom of the failure surface.
Lateral Displacement, ΔL
GI-03 Maximum Lateral Displacement (∆LTS) at top of the failure surface.
GI-04 Maximum Lateral Displacement (∆LBS) at bottom of the failure surface.
SCDOT Geotechnical Design Manual GEOTECHNICAL PERFORMANCE LIMITS
August 2008 10-11
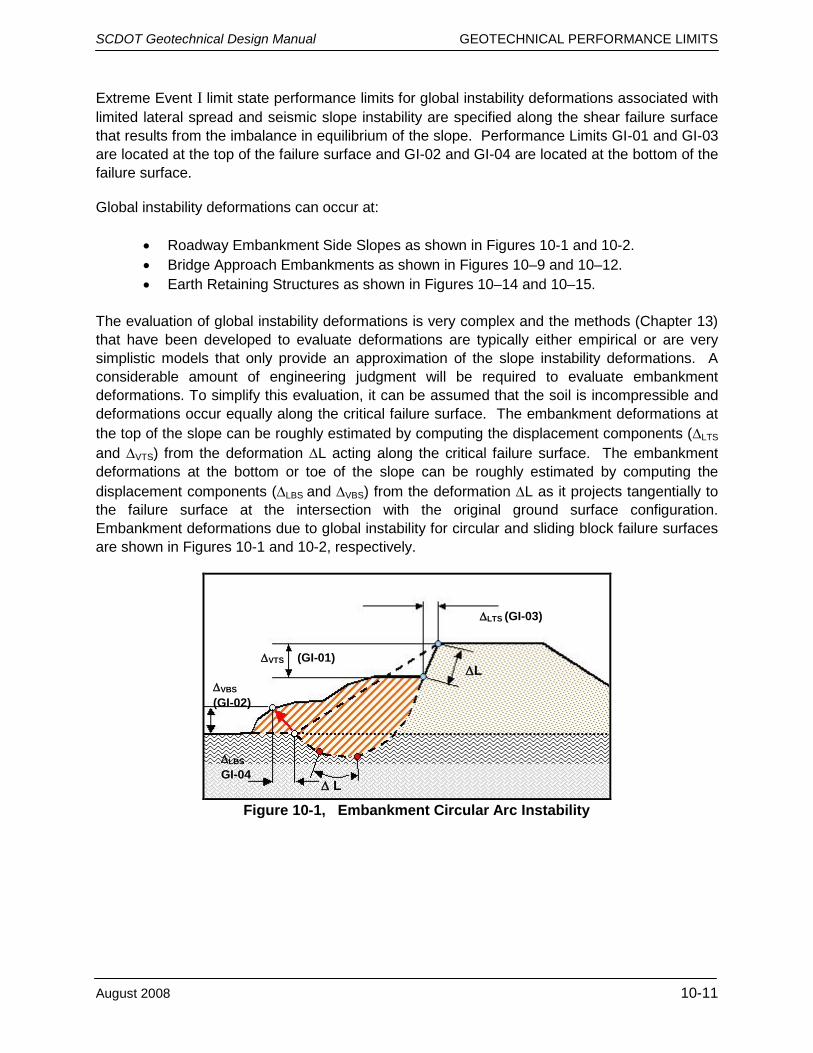
Extreme Event I limit state performance limits for global instability deformations associated with limited lateral spread and seismic slope instability are specified along the shear failure surface that results from the imbalance in equilibrium of the slope. Performance Limits GI-01 and GI-03 are located at the top of the failure surface and GI-02 and GI-04 are located at the bottom of the failure surface.
Global instability deformations can occur at:
• Roadway Embankment Side Slopes as shown in Figures 10-1 and 10-2. • Bridge Approach Embankments as shown in Figures 10–9 and 10–12. • Earth Retaining Structures as shown in Figures 10–14 and 10–15.
The evaluation of global instability deformations is very complex and the methods (Chapter 13) that have been developed to evaluate deformations are typically either empirical or are very simplistic models that only provide an approximation of the slope instability deformations. A considerable amount of engineering judgment will be required to evaluate embankment deformations. To simplify this evaluation, it can be assumed that the soil is incompressible and deformations occur equally along the critical failure surface. The embankment deformations at the top of the slope can be roughly estimated by computing the displacement components (∆LTS
and ∆VTS) from the deformation ∆L acting along the critical failure surface. The embankment deformations at the bottom or toe of the slope can be roughly estimated by computing the displacement components (∆LBS and ∆VBS) from the deformation ∆L as it projects tangentially to the failure surface at the intersection with the original ground surface configuration. Embankment deformations due to global instability for circular and sliding block failure surfaces are shown in Figures 10-1 and 10-2, respectively.
Figure 10-1, Embankment Circular Arc Instability
∆L
∆ L
∆VTS (GI-01)
∆LTS (GI-03)
∆VBS (GI-02)
∆LBS GI-04

SCDOT Geotechnical Design Manual GEOTECHNICAL PERFORMANCE LIMITS
10-12 August 2008
Figure 10-2, Embankment Sliding Block Instability
10.4.3
Embankment vertical settlements are typically due to embankments being constructed over compressible soils that experience soil deformation (elastic compression, primary consolidation, and secondary consolidation) under constant load. Settlement analysis methods are provided in Chapter 17 of this Manual. The vertical settlements that are evaluated under the Service I limit state are as indicated below.
Embankment Settlement
• Maximum Settlement from Elastic Compression + Primary consolidation • Maximum Settlement Rate from Primary Consolidation + Secondary Consolidation • Maximum Differential Settlement from Primary Consolidation + Secondary
Consolidation Under the Extreme Event I limit state, performance limits for embankment settlement are specifically those caused by geotechnical seismic hazards that may affect the embankment or subgrade during or after a seismic event. Methods of analyzing geotechnical seismic hazards due to liquefaction of the subgrade or seismic settlement of the embankment and subgrade are discussed in Chapter 13. Performance limits for embankment settlements are identified in Table 10-7.
Table 10-7, Embankment Settlement Performance Limits
Notation Deformation ID No. Description
Vertical Settlement, ∆V
EV-01
Maximum Settlement from Elastic Compression + Primary consolidation along the profile grade (∆VP) over the design life of the embankment. The design life begins after the pavement has been placed.
EV-02 Maximum Settlement Rate from Primary Consolidation + Secondary Consolidation per year after the roadway has been paved.
Vertical Differential
Settlement, δV EV-03
Maximum Differential Settlement from Primary Consolidation + Secondary Consolidation occurring longitudinally along the profile grade after the roadway has been paved
∆ L ∆LBS
(GI-04)
∆VBS (GI-02)
∆VTS (GI-01)
∆LTS (GI-03)

SCDOT Geotechnical Design Manual GEOTECHNICAL PERFORMANCE LIMITS
August 2008 10-13
The roadway Profile Grade (P.G.) for non-divided highways (highways without medians) is typically located at the center of the roadway as indicated in Figure 10-3. Figure 10-3 is designated as Section A-A that corresponds to an embankment cross-section taken transverse to the travel lane as indicated in Figure 10-5. Embankment settlements are evaluated at the center of embankment sections where the maximum settlements are most likely to occur and consequentially also where the maximum differential settlements occur.
Figure 10-3, Embankment Settlement (Section A–A)
Divided highways may have a Profile Grade (P.G.) elevation for each travel direction as indicated in Figure 10-4. Figure 10-4 is designated as Section A-A that corresponds to an embankment cross-section taken transverse to the travel lane as indicated in Figure 10-5. To differentiate the divided profile grades the color Blue was used to designate the roadway on the left and the color Red was used to designate the roadway on the right. Divided highways should be evaluated separately for each P.G. Settlement analyses must take into account the total embankment cross-section and the construction sequencing.
Figure 10-4, Divided Highway (Section A-A)
∆VP Centerline Profile Grade (C.L. P.G.)
Natural Ground
C.L.
∆VP-Blue ∆VP-Red
∆V-Blue ∆V -Red
C.L. P.G. Blue Lane C.L. P.G Red Lane
∆v

SCDOT Geotechnical Design Manual GEOTECHNICAL PERFORMANCE LIMITS
10-14 August 2008
The Performance Limit EV-01 is for maximum settlement (∆V) that occurs at the profile grade over the design life of the embankment that begins after the pavement has been placed. The Performance Limit EV-02 is the maximum settlement rate that occurs after paving along the profile grade. The maximum settlement rate is specified as a constant rate of settlement that is allowed per year after the roadway has been paved.
Performance Limit EV-03 is specified as the maximum differential settlement (δV) occurring longitudinally along the profile grade. The differential settlement is specified over a distance of 50 feet, measured longitudinally along the embankment. If vertical displacements are encountered at an isolated location such as shown in Figure 10-5, the differential settlement performance limit EV-03 may be pro-rated so that at any point along the distance, L, the tolerances specified are not exceeded. There are no Performance Limits for differential settlements (δV) that occur perpendicular (transverse) to the alignment for new embankments since these displacements are relatively small due to the relatively uniform loading and the assumed low soil variability in the transverse direction not typically investigated. If transverse differential settlement is anticipated, such as is observed during a roadway widening, refer to Section 10.4.4.
Figure 10-5, Embankment Settlement Profile
10.4.4
Existing embankments are often widened to accommodate additional traffic lanes or are widened in order to accommodate a re-alignment of a new bridge being constructed adjacent to an existing bridge. These Performance Limits are used on roadways where differential settlement due to widening of the roadway or to soil variability could adversely affect the roadway pavement. The embankment subject to transverse differential embankment settlement shall be designed for the Performance Limits indicated in Table 10-7 (EV-01, EV-02, and EV-03), and transverse differential embankment settlement Performance Limit provided in Table 10-8.
Transverse Differential Embankment Settlements
A
A
Profile Grade
Natural Ground
Compressible Soil
LL
L1 L2
∆VP
∆V

SCDOT Geotechnical Design Manual GEOTECHNICAL PERFORMANCE LIMITS
August 2008 10-15
Table 10-8, Embankment Widening Settlement Performance Limits
Notation Deformation ID No. Description
Settlement, ∆V
EV-01
Maximum Settlement from Elastic Compression + Primary Consolidation along the profile grade (∆VP) over the design life of the embankment. The design life begins after the pavement has been placed.
EV-02 Maximum Settlement Rate from Primary Consolidation + Secondary Consolidation per year after the roadway has been paved.
Differential Settlement, δV
EV-03 Maximum Differential Settlement from Primary Consolidation + Secondary Consolidation occurring longitudinally along the profile grade after the roadway has been paved
EV-04 Maximum Differential Settlement occurring transverse to the profile grade after the roadway has been paved
When existing embankments are widened, a parallel profile grade is established at the location of maximum vertical settlement for the embankment widening as shown in Figure 10-6. Figure 10-6 is designated as Section A-A that corresponds to an embankment widening cross-section taken transverse to the travel lane as indicated in Figure 10-5. The performance limits, EV-01, EV-02, and EV-03, are computed in the same manner as discussed in section 10.4.3 except that the settlements are computed along the profile of maximum settlement, ∆VT. The maximum vertical differential settlement (EV-04) limits the differential settlements between the existing embankment and the embankment widening section that may affect the paved roadway surface. The differential settlements transverse to the embankment is computed at distance “LT” between the existing embankment (where zero or minimal settlement occurs) and the new embankment at point of maximum settlement as indicated in Figure 10-6.
Figure 10-6, Embankment Widening Settlement (Section A-A)
∆VP
Natural Ground
Compressible Soil
LT
∆V
Profile at Maximum Settlement Existing
Embankment
Embankment Widening

SCDOT Geotechnical Design Manual GEOTECHNICAL PERFORMANCE LIMITS
10-16 August 2008
10.4.5
At the transition between the bridge approach embankments and the bridge ends there is a potential for large differential vertical settlement (δV). The vertical differential settlement can be significant in magnitude because the bridge end bents are typically supported on deep foundations that are relatively stationary in the vertical direction as compared to the approach embankment. If the new bridge approach embankments are placed over compressible soils the approach embankments tend to settle significantly more than the bridge ends. Performance Limits for the Embankment/Bridge transition settlement are identified in Table 10-9.
Embankment/Bridge Transition Settlement
Table 10-9, Bridge/Embankment Transition Settlement Performance Limits
Notation Deformation ID No. Description
Vertical Differential
Settlement, δV EV-05
Maximum Differential Settlement (δV) between the bridge End Bent and the end of the Approach Slab after the roadway has been paved.
Differential vertical settlements between the bridge ends and the approach embankments can significantly affect the roadway rideability at the bridge abutment and at the end of the approach slab as shown in Figure 10–7.
Figure 10-7, Bridge Approach Embankment Settlement
Performance Limit EV-05 is specified as a percentage of the length of the approach slab (LSlab) in feet. The differential settlement (δV) is the absolute value of the difference between the settlement at the end of the approach slab (∆VA) and the settlement at the End Bent (∆VE). The vertical settlement at the End Bent (∆VE) is discussed in Section 10.5.2. The Performance Limit at the Service limit state is used to minimize the displacements typically observed at the bridge ends that are typically referred to as the “bump at the end of the bridge.” The Extreme Event I limit state performance limit is used to maintain Damage and Service Levels required for the design earthquake.
End Bent
Approach Slab
ΔVA Pavement
Bridge Approach Embankment

SCDOT Geotechnical Design Manual GEOTECHNICAL PERFORMANCE LIMITS
August 2008 10-17
10.5 BRIDGE DEFORMATIONS
10.5.1
The design of bridge deep foundations is discussed in Chapter 16. Bridge terminology used to specify geotechnical performance limits for bridge foundations is presented in Table 10-10. For more discussion of the terminology in Table 10-10, prefer to the Bridge Design Manual. In case of conflicts with the terminology in the Bridge Design Manual, the Bridge Design Manual takes precedence for this table only.
Bridge Terminology and Deformation Notations
Table 10-10, Bridge Terminology
Terminology Description
Bent The bridge substructure that supports the bridge superstructure at intervals along the bridge superstructure.
End Bent
The bridge substructure that supports the bridge superstructure at the bridge abutments. This type of structure has three configurations that affect the deformations of the bridge
• Integral • Semi-Integral • Free Standing
Integral End Bent
Superstructure extends into the end wall and the end wall is rigidly connected to the pile cap.
Semi-Integral End Bent
Similar to the Integral End Bent except a bond breaker is placed between the end wall and the pile cap and the beams rest on a bearing.
Free Standing End Bent
Superstructure supported by bearings on pile cap with end wall separating superstructure from fill.
Interior Bent The bridge substructure that supports the bridge superstructure at intervals between the ends of the bridge (End Bents).
Span
The center-to-center distance between bridge supports (Bents). This term is also sometimes used to refer to the bridge superstructure located between supports. The bridge superstructure typically consists of either beams, girders, slabs, trusses, etc.
End Span
The center-to-center distance between the support at the end of the bridge (End Bent) and the first or last interior bridge support (1st or last Interior Bent), at either end of the bridge.
Interior Span The center-to-center distance between two interior bridge supports (Interior Bents).
Simple Span Bridge
A bridge comprised of one or more spans where the superstructure is not connected between adjacent spans. A load applied in one span will not produce any effects on the other spans.
Continuous Span Bridge
A bridge comprised of several spans where the superstructure is fully connected between adjacent spans and a load applied in one span produces an effect on the other spans.
Bridge Deck The vehicle riding platform (typically reinforced concrete) that distributes the traffic live loads to the beams, girders, trusses, etc. of the bridge superstructure.
SCDOT Geotechnical Design Manual GEOTECHNICAL PERFORMANCE LIMITS
10-18 August 2008
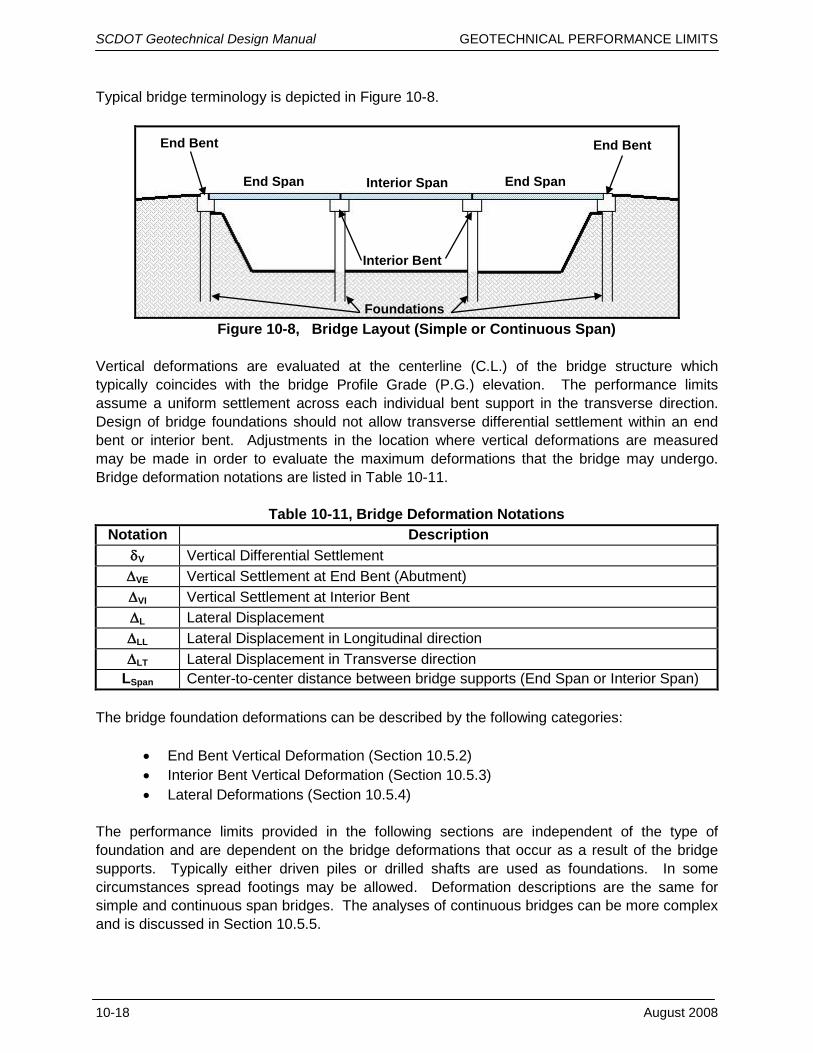
Typical bridge terminology is depicted in Figure 10-8.
Figure 10-8, Bridge Layout (Simple or Continuous Span)
Vertical deformations are evaluated at the centerline (C.L.) of the bridge structure which typically coincides with the bridge Profile Grade (P.G.) elevation. The performance limits assume a uniform settlement across each individual bent support in the transverse direction. Design of bridge foundations should not allow transverse differential settlement within an end bent or interior bent. Adjustments in the location where vertical deformations are measured may be made in order to evaluate the maximum deformations that the bridge may undergo. Bridge deformation notations are listed in Table 10-11.
Table 10-11, Bridge Deformation Notations Notation Description
δV Vertical Differential Settlement ∆VE Vertical Settlement at End Bent (Abutment) ∆VI Vertical Settlement at Interior Bent ∆L Lateral Displacement ∆LL Lateral Displacement in Longitudinal direction ∆LT Lateral Displacement in Transverse direction
LSpan Center-to-center distance between bridge supports (End Span or Interior Span) The bridge foundation deformations can be described by the following categories:
• End Bent Vertical Deformation (Section 10.5.2) • Interior Bent Vertical Deformation (Section 10.5.3) • Lateral Deformations (Section 10.5.4)
The performance limits provided in the following sections are independent of the type of foundation and are dependent on the bridge deformations that occur as a result of the bridge supports. Typically either driven piles or drilled shafts are used as foundations. In some circumstances spread footings may be allowed. Deformation descriptions are the same for simple and continuous span bridges. The analyses of continuous bridges can be more complex and is discussed in Section 10.5.5.
End Bent End Bent
Interior Bent
Interior Span End Span End Span
Foundations

SCDOT Geotechnical Design Manual GEOTECHNICAL PERFORMANCE LIMITS
August 2008 10-19
10.5.2
End bent deformation at bridge abutments is sometimes due to instability of the approach embankments as shown in Figure 10–9. See Section 10.4.2 for more information concerning global instability deformations. End bent deformations may also occur as a result of foundation displacement due to seismic hazards (liquefaction, lateral spreading, etc.), collisions, downdrag forces, foundation settlement, and weak foundation support. Performance limits for end bent vertical deformation are identified in Table 10-12.
End Bent Vertical Deformations
Table 10-12, End Bent Vertical Deformation Performance Limits
Notation Deformation ID No. Description
Vertical Differential
Settlement, δV
EB-01 Maximum Vertical Differential Settlement (∆VE) between an Integral/Semi-Integral End Bent and the first Interior Bent.
EB-02 Maximum Vertical Differential Settlement (∆VE) between a Free Standing End Bent and the first Interior Bent.
The Performance Limit (EB-01 and EB–02) for maximum vertical differential settlement (δV) between the end bent and the first interior bent is specified as a ratio of the length of the end span (LSpan = LEnd Span). The vertical differential settlement (δV) is the absolute value of the difference between the vertical settlement at the end bent, ∆VE, (Figure 10-9) and the vertical settlement of the first interior bent, ∆VI (see Figure 10–10).
Figure 10-9, Bridge End Bent Slope Instability Deformation
10.5.3
Interior bent deformations can occur as a result of foundation displacement due to seismic hazards (Liquefaction, Lateral Spreading, etc.), downdrag forces, foundation settlement, and weak foundation support. Although slope instability affecting interior bridge bents is rare, interior bridge bents can be affected by slope instability and should therefore be analyzed when appropriate. Performance limits for interior bent vertical deformation are identified in Table 10-13.
Interior Bent Vertical Deformations
L Interior Span L End Span L End Span
∆LL
∆VE (EB-01 and EB-02)
(EB-03 and EB-04)

SCDOT Geotechnical Design Manual GEOTECHNICAL PERFORMANCE LIMITS
10-20 August 2008
Table 10-13, Interior Bent Vertical Deformation Performance Limits
Notation Deformation Limit ID No. Description
Vertical Differential
Settlement, δV
IB-01 Maximum Vertical Differential Settlement (∆VI) for Integral/Semi-Integral Interior Bent.
IB-02 Maximum Vertical Differential Settlement (∆VI) for Free Standing Interior Bent.
The Performance Limit (IB-01 and IB–02) for maximum vertical differential settlement (δV) between interior bents and adjacent bents is specified as a ratio of the length of the adjacent spans of the interior bent being analyzed. The span length in feet is determined by using the center-to-center span length (LSpan) between each adjacent bent. Since interior bents have a span on each side, the performance limit and differential settlement should be computed for each adjacent span to insure that all Performance Limits are met. The vertical differential settlement (δV) is the absolute value of the difference between the vertical settlement of the interior bent, ∆VI (see Figure 10-10), being analyzed and the vertical settlement of the adjacent bent. If the first interior bent on the right side of Figure 10-10 is being evaluated the performance limits would need to be evaluated for a span to the right of the bent (LSpan = LEnd
Span) and for the span to the left of the bent (LSpan = LInterior Span).
Figure 10-10, Bridge Interior Bent Settlement
10.5.4
Lateral displacements are typically due to lateral loadings being exerted on the foundation elements or bridge abutments. Lateral loadings are typically exerted during Extreme Events resulting from seismic hazards or collisions, but may be caused by traffic on bridges with horizontal curves. Bridge approach embankment instability discussed in Section 10.4.2 can also exert lateral forces at the bridge end bents (abutment). Lateral displacements can be critical since excessive displacements can lead to collapse of a bridge by damaging bridge bearings and/or by causing structural damage to the foundations. Performance Limits for end bent and interior bent lateral deformation are identified in Table 10-14 and Table 10-15, respectively.
Lateral Deformations
∆VI
L Interior Span L End Span L End Span
SCDOT Geotechnical Design Manual GEOTECHNICAL PERFORMANCE LIMITS
August 2008 10-21
Table 10-14, End Bent Lateral Deformation Performance Limits
Notation Deformation ID No. Description
Lateral Longitudinal
Displacement, ΔLLE
EB-03 Maximum Lateral Longitudinal Displacement for Integral/Semi-Integral End Bent (∆LLE)
EB-04 Maximum Lateral Longitudinal Displacement for Free Standing End Bent (∆LLE)
Lateral Transverse
Displacement, ΔLTE
EB-05 Maximum Lateral Transverse Displacement for Integral/Semi-Integral End Bent (∆LTE)
EB-06 Maximum Lateral Transverse Displacement for Free Standing End Bent (∆LTE)
Table 10-15, Interior Bent Lateral Deformation Performance Limits
Notation Deformation Limit ID No. Description
Lateral Longitudinal
Displacement, ΔLLI
IB-03 Maximum Lateral Longitudinal Displacement for Integral/Semi-Integral Interior Bent (∆LLI)
IB-04 Maximum Lateral Longitudinal Displacement for Free Standing Interior Bent (∆LLI)
Lateral Transverse
Displacement, ΔLTI
IB-05 Maximum Lateral Transverse Displacement for Integral/Semi-Integral Interior Bent (∆LTI)
IB-06 Maximum Lateral Transverse Displacement for Free Standing Interior Bent (∆LTI)
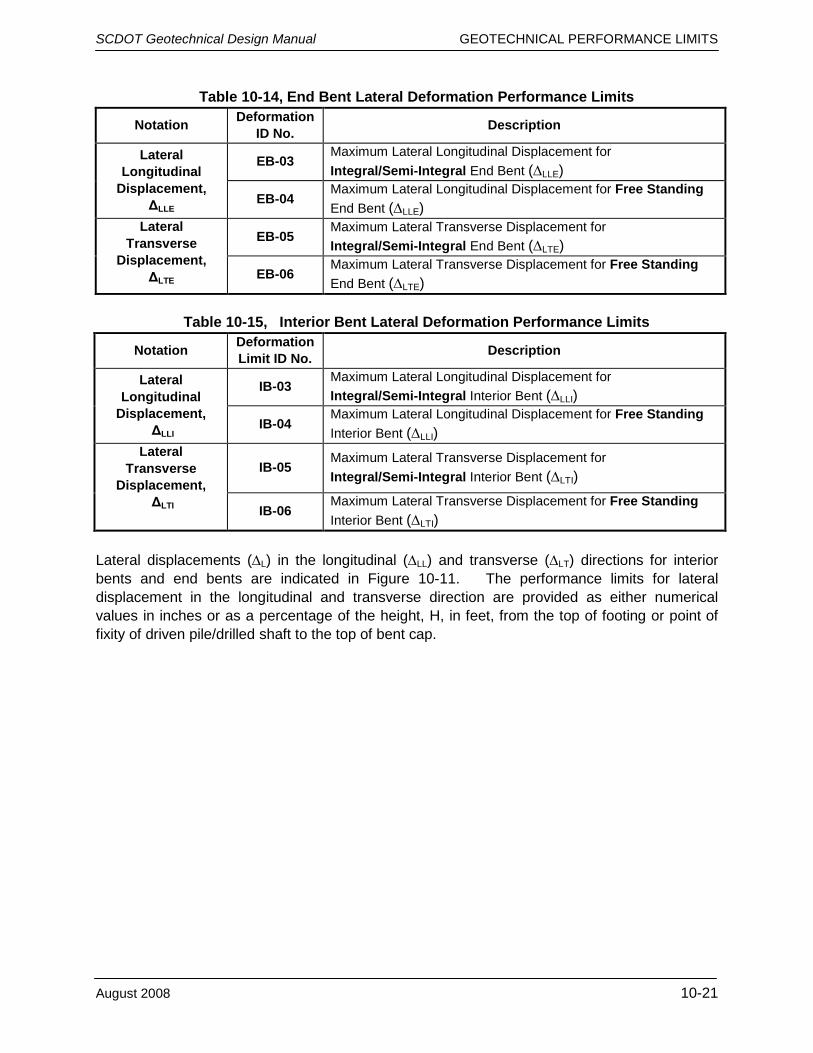
Lateral displacements (∆L) in the longitudinal (∆LL) and transverse (∆LT) directions for interior bents and end bents are indicated in Figure 10-11. The performance limits for lateral displacement in the longitudinal and transverse direction are provided as either numerical values in inches or as a percentage of the height, H, in feet, from the top of footing or point of fixity of driven pile/drilled shaft to the top of bent cap.

SCDOT Geotechnical Design Manual GEOTECHNICAL PERFORMANCE LIMITS
10-22 August 2008
Figure 10-11, Bridge Lateral Displacement
10.5.5
Continuous span bridges such as shown in Figure 10-12 will deform similarly to simple span bridges. The main difference is that because the structure is continuous, the structural behavior of the bridge will be more complex. Vertical deformations in this type of structure tend to induce stresses over the bridge supports (bents) that are considerably higher than if it were a simply supported bridge. This behavior makes it more critical to accurately predict deformations for continuous structures since higher stresses may lead to structural damage at the bridge supports that would then increase the stresses in the bridge superstructure. Lateral deformations also tend to induce larger stresses at the bridge supports than for simply supported structures.
Continuous Bridge Deformations
Figure 10-12, Continuous Bridge Settlements
ΔLLE (EB-03 & EB-04)
ΔLTE (EB-05
& EB-06)
ΔLTI (IB-05 & IB-06)
ΔLLI (IB-03 & IB-04)
H
∆VI
L Interior Span L End Span L End Span ∆VE
∆LLE
ΔLLI (IB-03 & IB-04)
ΔLLE (EB-03 & EB-04)
SCDOT Geotechnical Design Manual GEOTECHNICAL PERFORMANCE LIMITS
August 2008 10-23
10.6 EARTH RETAINING STRUCTURE DEFORMATIONS
10.6.1
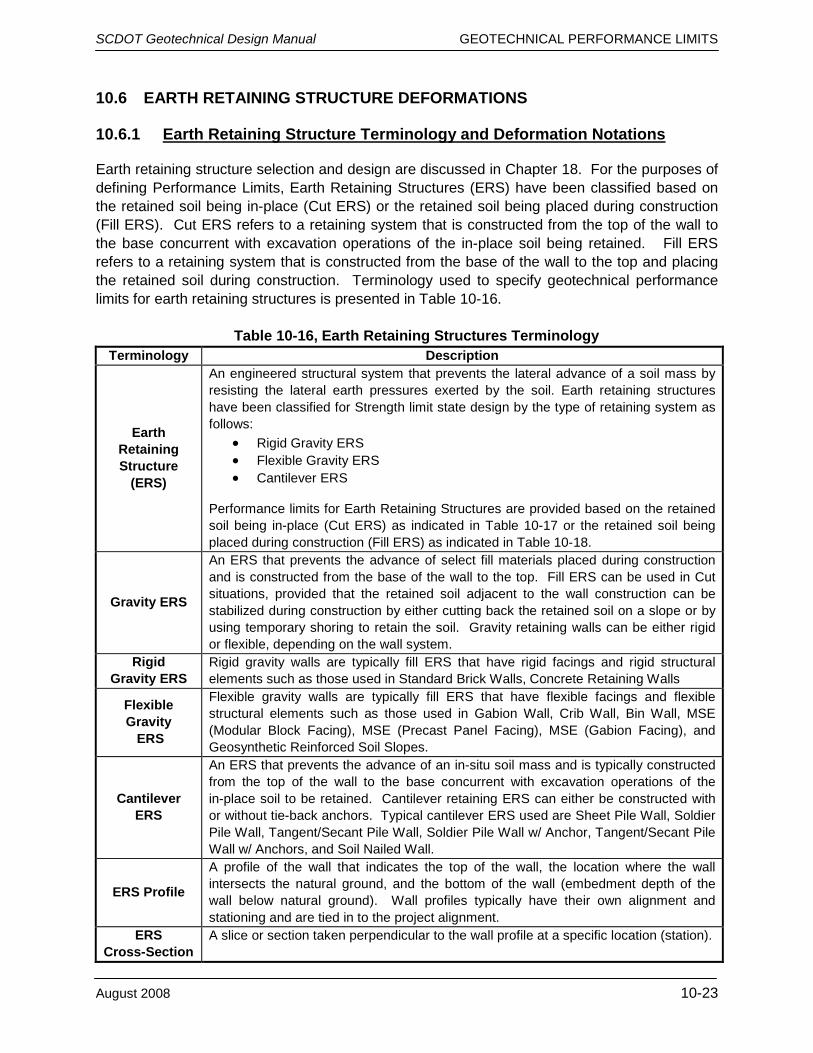
Earth retaining structure selection and design are discussed in Chapter 18. For the purposes of defining Performance Limits, Earth Retaining Structures (ERS) have been classified based on the retained soil being in-place (Cut ERS) or the retained soil being placed during construction (Fill ERS). Cut ERS refers to a retaining system that is constructed from the top of the wall to the base concurrent with excavation operations of the in-place soil being retained. Fill ERS refers to a retaining system that is constructed from the base of the wall to the top and placing the retained soil during construction. Terminology used to specify geotechnical performance limits for earth retaining structures is presented in Table 10-16.
Earth Retaining Structure Terminology and Deformation Notations
Table 10-16, Earth Retaining Structures Terminology
Terminology Description
Earth Retaining Structure
(ERS)
An engineered structural system that prevents the lateral advance of a soil mass by resisting the lateral earth pressures exerted by the soil. Earth retaining structures have been classified for Strength limit state design by the type of retaining system as follows:
• Rigid Gravity ERS • Flexible Gravity ERS • Cantilever ERS
Performance limits for Earth Retaining Structures are provided based on the retained soil being in-place (Cut ERS) as indicated in Table 10-17 or the retained soil being placed during construction (Fill ERS) as indicated in Table 10-18.
Gravity ERS
An ERS that prevents the advance of select fill materials placed during construction and is constructed from the base of the wall to the top. Fill ERS can be used in Cut situations, provided that the retained soil adjacent to the wall construction can be stabilized during construction by either cutting back the retained soil on a slope or by using temporary shoring to retain the soil. Gravity retaining walls can be either rigid or flexible, depending on the wall system.
Rigid Gravity ERS
Rigid gravity walls are typically fill ERS that have rigid facings and rigid structural elements such as those used in Standard Brick Walls, Concrete Retaining Walls
Flexible Gravity ERS
Flexible gravity walls are typically fill ERS that have flexible facings and flexible structural elements such as those used in Gabion Wall, Crib Wall, Bin Wall, MSE (Modular Block Facing), MSE (Precast Panel Facing), MSE (Gabion Facing), and Geosynthetic Reinforced Soil Slopes.
Cantilever ERS
An ERS that prevents the advance of an in-situ soil mass and is typically constructed from the top of the wall to the base concurrent with excavation operations of the in-place soil to be retained. Cantilever retaining ERS can either be constructed with or without tie-back anchors. Typical cantilever ERS used are Sheet Pile Wall, Soldier Pile Wall, Tangent/Secant Pile Wall, Soldier Pile Wall w/ Anchor, Tangent/Secant Pile Wall w/ Anchors, and Soil Nailed Wall.
ERS Profile
A profile of the wall that indicates the top of the wall, the location where the wall intersects the natural ground, and the bottom of the wall (embedment depth of the wall below natural ground). Wall profiles typically have their own alignment and stationing and are tied in to the project alignment.
ERS Cross-Section
A slice or section taken perpendicular to the wall profile at a specific location (station).
SCDOT Geotechnical Design Manual GEOTECHNICAL PERFORMANCE LIMITS
10-24 August 2008
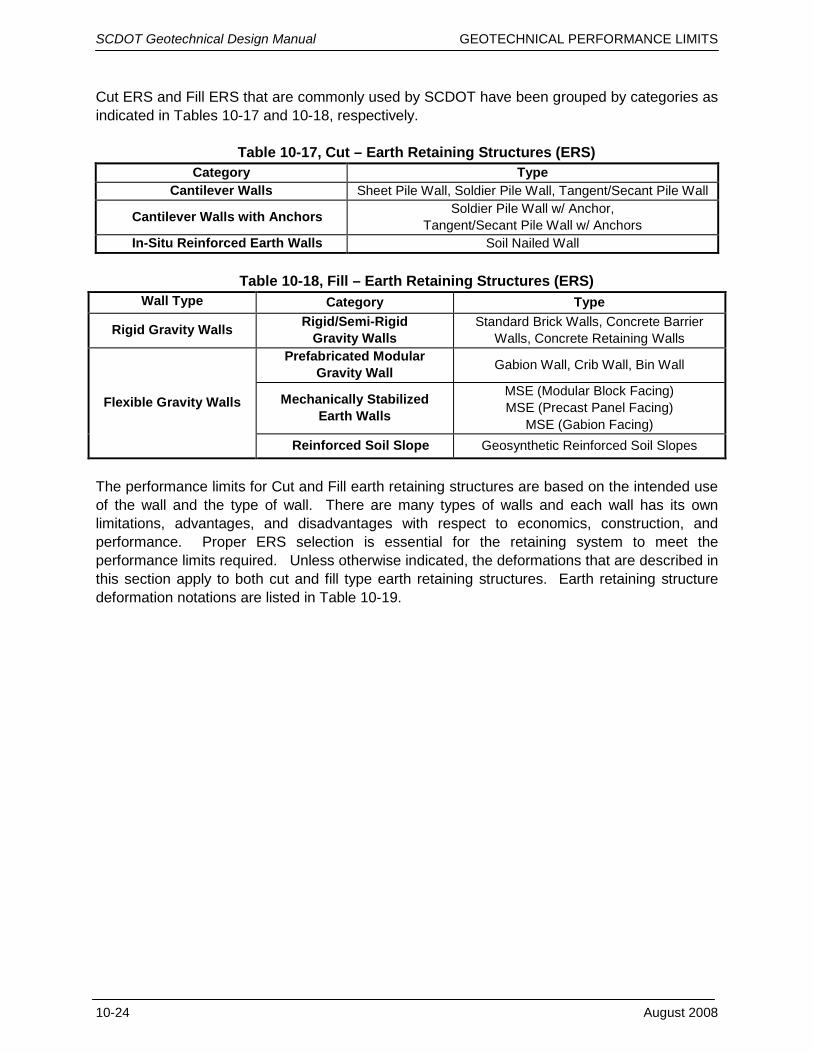
Cut ERS and Fill ERS that are commonly used by SCDOT have been grouped by categories as indicated in Tables 10-17 and 10-18, respectively.
Table 10-17, Cut – Earth Retaining Structures (ERS) Category Type
Cantilever Walls Sheet Pile Wall, Soldier Pile Wall, Tangent/Secant Pile Wall
Cantilever Walls with Anchors Soldier Pile Wall w/ Anchor, Tangent/Secant Pile Wall w/ Anchors
In-Situ Reinforced Earth Walls Soil Nailed Wall
Table 10-18, Fill – Earth Retaining Structures (ERS) Wall Type Category Type
Rigid Gravity Walls Rigid/Semi-Rigid Gravity Walls
Standard Brick Walls, Concrete Barrier Walls, Concrete Retaining Walls
Flexible Gravity Walls
Prefabricated Modular Gravity Wall Gabion Wall, Crib Wall, Bin Wall
Mechanically Stabilized Earth Walls
MSE (Modular Block Facing) MSE (Precast Panel Facing)
MSE (Gabion Facing) Reinforced Soil Slope Geosynthetic Reinforced Soil Slopes
The performance limits for Cut and Fill earth retaining structures are based on the intended use of the wall and the type of wall. There are many types of walls and each wall has its own limitations, advantages, and disadvantages with respect to economics, construction, and performance. Proper ERS selection is essential for the retaining system to meet the performance limits required. Unless otherwise indicated, the deformations that are described in this section apply to both cut and fill type earth retaining structures. Earth retaining structure deformation notations are listed in Table 10-19.

SCDOT Geotechnical Design Manual GEOTECHNICAL PERFORMANCE LIMITS
August 2008 10-25
Table 10-19, ERS Deformation Notations
Notation Description δV Vertical Differential Settlement ∆V Vertical Settlement ∆VTW Vertical Settlement at Top of Wall at a specific location along the wall profile
∆VBW Vertical Settlement at Bottom of Wall or where embedded walls intersect the natural ground at a specific location along the wall profile
∆VTS Vertical Displacement at the Top of the Slope failure surface ∆VBS Vertical Displacement at the Bottom of the Slope failure surface ∆VR Maximum Vertical Displacement of soil reinforcement δL Lateral Differential Displacement along the top of the wall ∆L Lateral Displacement ∆LTW Lateral Displacement at Top of Wall at a specific location along the wall profile
∆LBW Lateral Displacement at the Bottom of the Wall or where embedded walls intersect the natural ground at a specific location along the wall profile
∆LTS Lateral Displacement at the Top of the Slope failure surface ∆LBS Lateral Displacement at the Bottom of the Slope failure surface θ Angle of rotation after slope instability or settlement deformations have occurred ∆L Deformation occurring along the critical failure surface due to slope instability L Distance used to denote boundaries for differential settlement computations
The performance limits for earth retaining structures are specified for the following types of deformations:
• Global Instability Deformations (Section 10.6.2) • Longitudinal Settlement Deformation (Section 10.6.3) • Transverse Settlement Deformation (Section 10.6.4) • Lateral Displacements (Section 10.6.5)
Methods to evaluate stability and deformations are provided in Chapters 13 and 17.
10.6.2
Earth retaining structures are subject to global instability deformations similar to roadway embankments. For an in-depth discussion of global instability deformations see Section 10.4.2. Performance Limits for earth retaining structures due to slope instability deformations are identified in Table 10-20.
Global Instability Deformations
SCDOT Geotechnical Design Manual GEOTECHNICAL PERFORMANCE LIMITS
10-26 August 2008
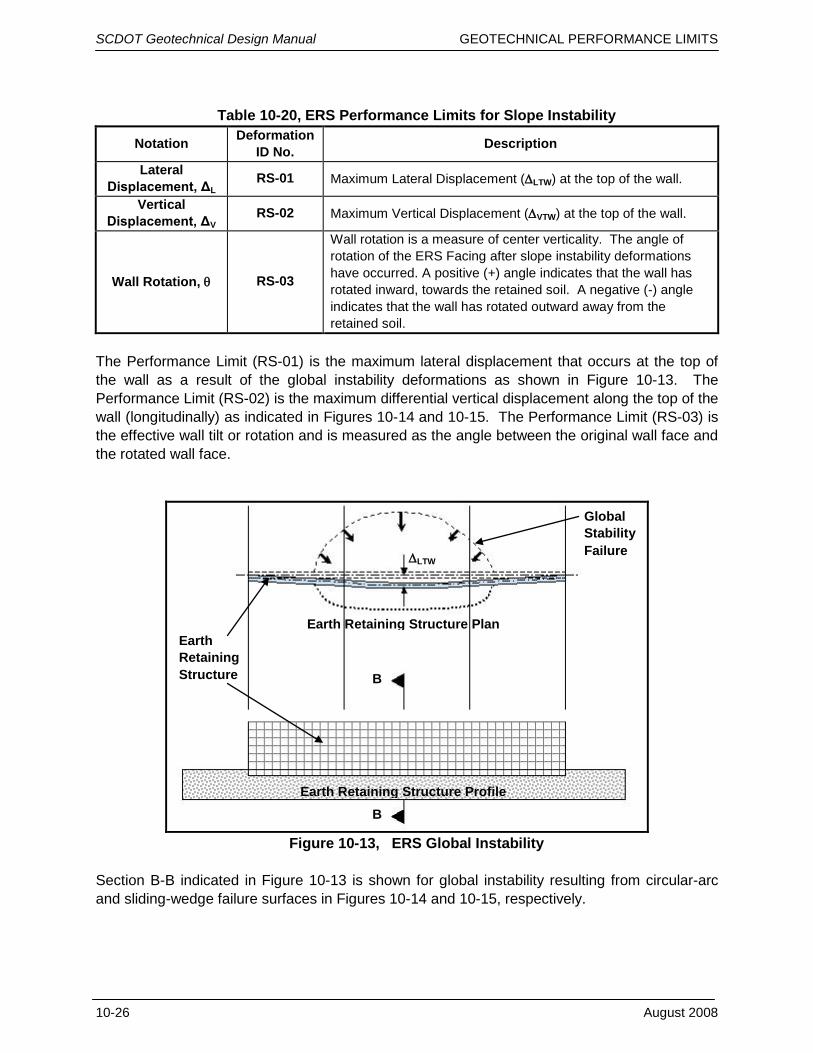
Table 10-20, ERS Performance Limits for Slope Instability
Notation Deformation ID No. Description
Lateral Displacement, ΔL
RS-01 Maximum Lateral Displacement (∆LTW) at the top of the wall.
Vertical Displacement, ΔV
RS-02 Maximum Vertical Displacement (∆VTW) at the top of the wall.
Wall Rotation, θ RS-03
Wall rotation is a measure of center verticality. The angle of rotation of the ERS Facing after slope instability deformations have occurred. A positive (+) angle indicates that the wall has rotated inward, towards the retained soil. A negative (-) angle indicates that the wall has rotated outward away from the retained soil.
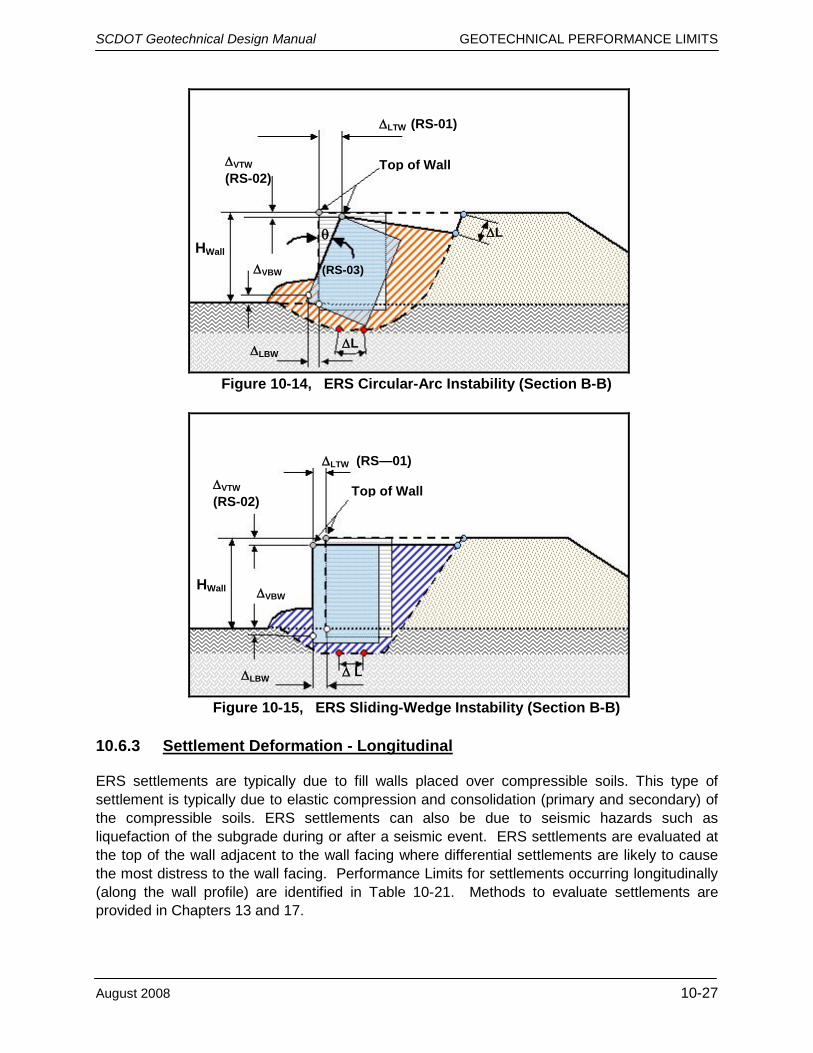
The Performance Limit (RS-01) is the maximum lateral displacement that occurs at the top of the wall as a result of the global instability deformations as shown in Figure 10-13. The Performance Limit (RS-02) is the maximum differential vertical displacement along the top of the wall (longitudinally) as indicated in Figures 10-14 and 10-15. The Performance Limit (RS-03) is the effective wall tilt or rotation and is measured as the angle between the original wall face and the rotated wall face.
Figure 10-13, ERS Global Instability
Section B-B indicated in Figure 10-13 is shown for global instability resulting from circular-arc and sliding-wedge failure surfaces in Figures 10-14 and 10-15, respectively.
∆LTW
Earth Retaining Structure
Global Stability Failure
Earth Retaining Structure Plan
Earth Retaining Structure Profile
B
B
SCDOT Geotechnical Design Manual GEOTECHNICAL PERFORMANCE LIMITS
August 2008 10-27
Figure 10-14, ERS Circular-Arc Instability (Section B-B)
Figure 10-15, ERS Sliding-Wedge Instability (Section B-B)
10.6.3
ERS settlements are typically due to fill walls placed over compressible soils. This type of settlement is typically due to elastic compression and consolidation (primary and secondary) of the compressible soils. ERS settlements can also be due to seismic hazards such as liquefaction of the subgrade during or after a seismic event. ERS settlements are evaluated at the top of the wall adjacent to the wall facing where differential settlements are likely to cause the most distress to the wall facing. Performance Limits for settlements occurring longitudinally (along the wall profile) are identified in Table 10-21. Methods to evaluate settlements are provided in Chapters 13 and 17.
Settlement Deformation - Longitudinal
HWall
Top of Wall
∆ L
Top of Wall
HWall
∆L
∆L
∆LTW (RS—01)
∆LTW (RS-01)
∆VTW (RS-02)
θ (RS-03) ∆VBW
∆LBW
∆LBW
∆VBW
∆VTW (RS-02)

SCDOT Geotechnical Design Manual GEOTECHNICAL PERFORMANCE LIMITS
10-28 August 2008
Table 10-21, ERS Settlement (Longitudinal) Performance Limits
Notation Deformation Limit ID No. Description
Vertical Settlement, ∆V
RV-01 Maximum Vertical Settlement at the top of wall profile grade (∆VTW) over the design life of the embankment.
RV-02 Maximum Settlement Rate per year after the wall has been constructed.
Vertical Differential
Settlement, δV RV-03
Maximum Vertical Differential Settlement observed longitudinally along the top of wall profile grade after the wall has been constructed.
The Performance Limit (RV-01) is the maximum settlement that occurs at the face at the top of the wall profile over the design life of the ERS as indicated in Figure10-16. The Performance Limit (RV-02) is a maximum rate of settlement that occurs after wall facing is constructed along the top of the wall profile. The rate of settlement is measured as the settlement occurring per year after the wall facing has been constructed.
Figure 10-16, ERS Settlement (Section B–B)
Wall distress due to settlements along the top of wall profile, ∆VTW, are limited by specifying a Performance Limit (RV-03) for the maximum differential settlement (δV) observed longitudinally along the top of wall profile after the ERS has been constructed. The differential settlement is specified over a distance of 50 feet, measured longitudinally along the top of wall profile. If vertical displacements are encountered at an isolated location such as shown in Figure 10–17, the differential settlement Performance Limit (RV-03) may be pro-rated so that at any point along the distance, LS, the tolerances specified are not exceeded.
Top of Wall
HWall
∆VTW (RV-01)

SCDOT Geotechnical Design Manual GEOTECHNICAL PERFORMANCE LIMITS
August 2008 10-29
Figure 10-17, ERS Settlement Profile
10.6.4
This Performance Limit is used for differential settlements (δV) that occur perpendicular to the wall alignment and is only applicable to retaining walls that have discrete soil reinforcements (geosynthetic reinforcement, steel reinforcement, soil anchors, etc.) extending perpendicular to the wall facing to the end of the length of the reinforcement, L. The Performance Limit for settlement occurring perpendicular to the wall profile (transverse direction) is identified in Table 10-22.
Settlement Deformation - Transverse
Table 10-22, ERS Settlement (Transverse) Performance Limits
Notation Deformation Limit ID No. Description
Vertical Differential
Settlement, δV RV-04
Maximum Vertical Differential Settlement observed perpendicular (transverse) to the top of wall profile after the wall has been constructed.
Examples of ERS with reinforced soil (MSE walls) and ERS with tieback anchors (cantilever walls w/ tieback anchors) are shown in Figures 10-18 and 10-19, respectively. Excessive differential settlements (transverse) may cause distress and even wall collapse from the added load induced to the wall facing and soil reinforcements. The Performance Limit (RV-04) is the maximum differential settlements perpendicular (transverse) to the adjusted profile over a distance, LR, as indicated in Figure 10-18 and 10-19. Performance Limit (RV-04) is computed along maximum increments of 5 feet.
B
B
Compressible Soil
L2 L1
LS
Natural Ground
Top of Wall
∆VTW

SCDOT Geotechnical Design Manual GEOTECHNICAL PERFORMANCE LIMITS
10-30 August 2008
Figure 10-18, ERS Reinforced Soils - Transverse Differential Settlement
Figure 10-19, ERS Tieback Anchor - Transverse Differential Settlement
10.6.5
ERS lateral displacements are those movements that occur as a result of lateral soil pressures. Lateral soil pressure loadings produce displacements of the structural members of the wall system and also displacements of the soil (soil-structure interaction). ERS lateral displacements can also occur as a result of active seismic loadings that are transmitted laterally to the earth retaining structure. The Performance Limits for lateral displacements occurring perpendicular to the wall profile (transverse direction) are identified in Table 10-23.
Lateral Displacements
LR
LR
HWall
HWall ΔVR (RV-04)
ΔVR (RV-04)
∆VTW
∆VBW
Tieback Anchor
θ
Soil Reinforcement
Compressible Soil
Compressible Soil
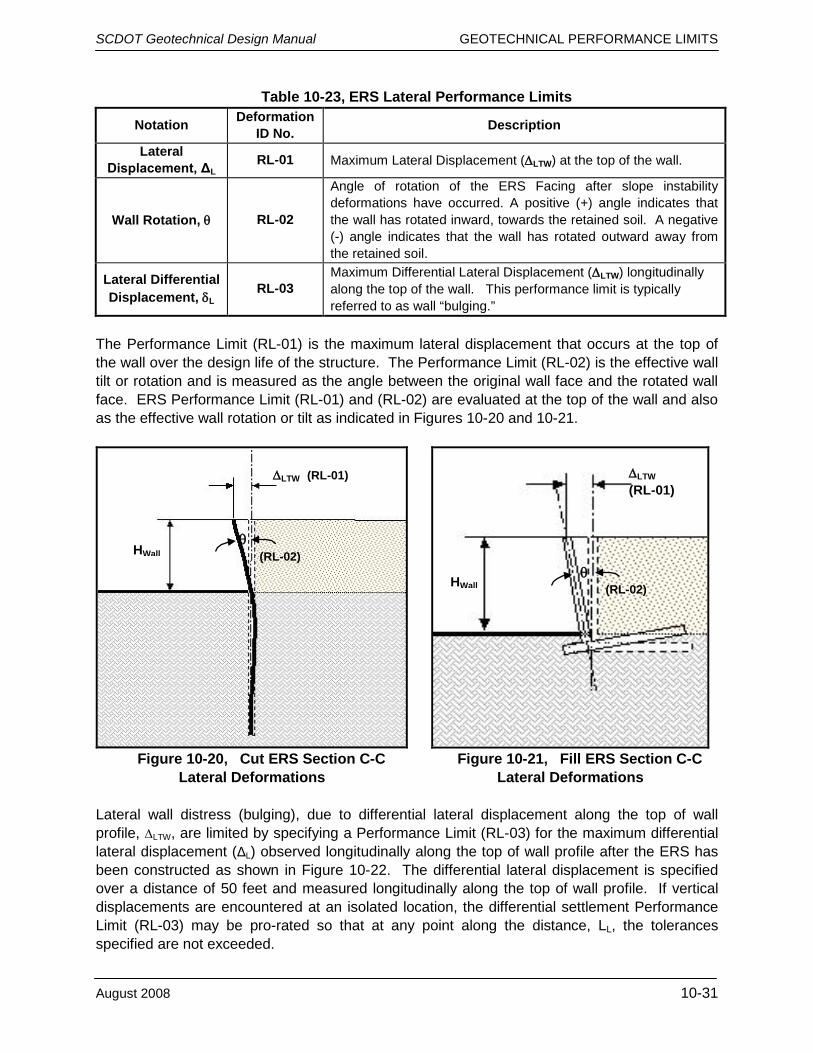
SCDOT Geotechnical Design Manual GEOTECHNICAL PERFORMANCE LIMITS
August 2008 10-31
Table 10-23, ERS Lateral Performance Limits
Notation Deformation ID No. Description
Lateral Displacement, ΔL
RL-01 Maximum Lateral Displacement (∆LTW) at the top of the wall.
Wall Rotation, θ RL-02
Angle of rotation of the ERS Facing after slope instability deformations have occurred. A positive (+) angle indicates that the wall has rotated inward, towards the retained soil. A negative (-) angle indicates that the wall has rotated outward away from the retained soil.
Lateral Differential Displacement, δL
RL-03 Maximum Differential Lateral Displacement (∆LTW) longitudinally along the top of the wall. This performance limit is typically referred to as wall “bulging.”
The Performance Limit (RL-01) is the maximum lateral displacement that occurs at the top of the wall over the design life of the structure. The Performance Limit (RL-02) is the effective wall tilt or rotation and is measured as the angle between the original wall face and the rotated wall face. ERS Performance Limit (RL-01) and (RL-02) are evaluated at the top of the wall and also as the effective wall rotation or tilt as indicated in Figures 10-20 and 10-21.
Figure 10-20, Cut ERS Section C-C
Lateral Deformations Figure 10-21, Fill ERS Section C-C
Lateral Deformations Lateral wall distress (bulging), due to differential lateral displacement along the top of wall profile, ∆LTW, are limited by specifying a Performance Limit (RL-03) for the maximum differential lateral displacement (ΔL) observed longitudinally along the top of wall profile after the ERS has been constructed as shown in Figure 10-22. The differential lateral displacement is specified over a distance of 50 feet and measured longitudinally along the top of wall profile. If vertical displacements are encountered at an isolated location, the differential settlement Performance Limit (RL-03) may be pro-rated so that at any point along the distance, LL, the tolerances specified are not exceeded.
∆LTW (RL-01)
HWall θ (RL-02)
HWall
∆LTW (RL-01)
θ (RL-02)
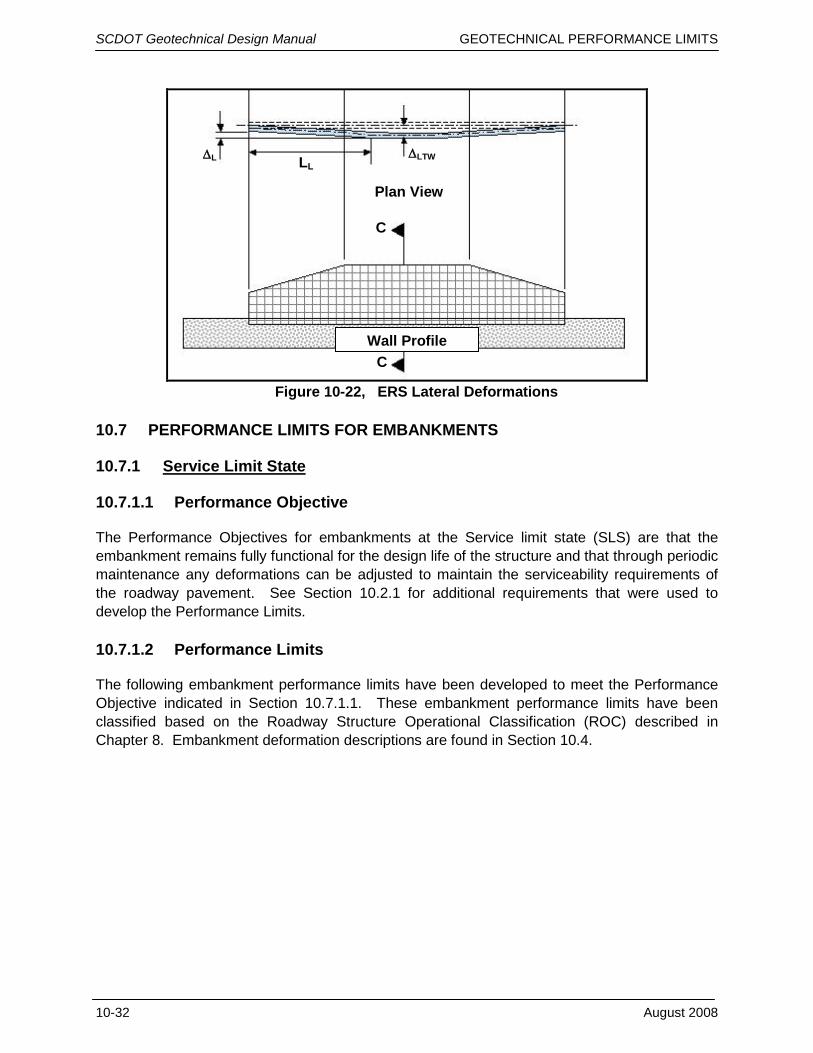
SCDOT Geotechnical Design Manual GEOTECHNICAL PERFORMANCE LIMITS
10-32 August 2008
Figure 10-22, ERS Lateral Deformations
10.7 PERFORMANCE LIMITS FOR EMBANKMENTS
10.7.1
10.7.1.1 Performance Objective
Service Limit State
The Performance Objectives for embankments at the Service limit state (SLS) are that the embankment remains fully functional for the design life of the structure and that through periodic maintenance any deformations can be adjusted to maintain the serviceability requirements of the roadway pavement. See Section 10.2.1 for additional requirements that were used to develop the Performance Limits. 10.7.1.2 Performance Limits
The following embankment performance limits have been developed to meet the Performance Objective indicated in Section 10.7.1.1. These embankment performance limits have been classified based on the Roadway Structure Operational Classification (ROC) described in Chapter 8. Embankment deformation descriptions are found in Section 10.4.
∆LTW LL ∆L
Plan View
Wall Profile
C
C
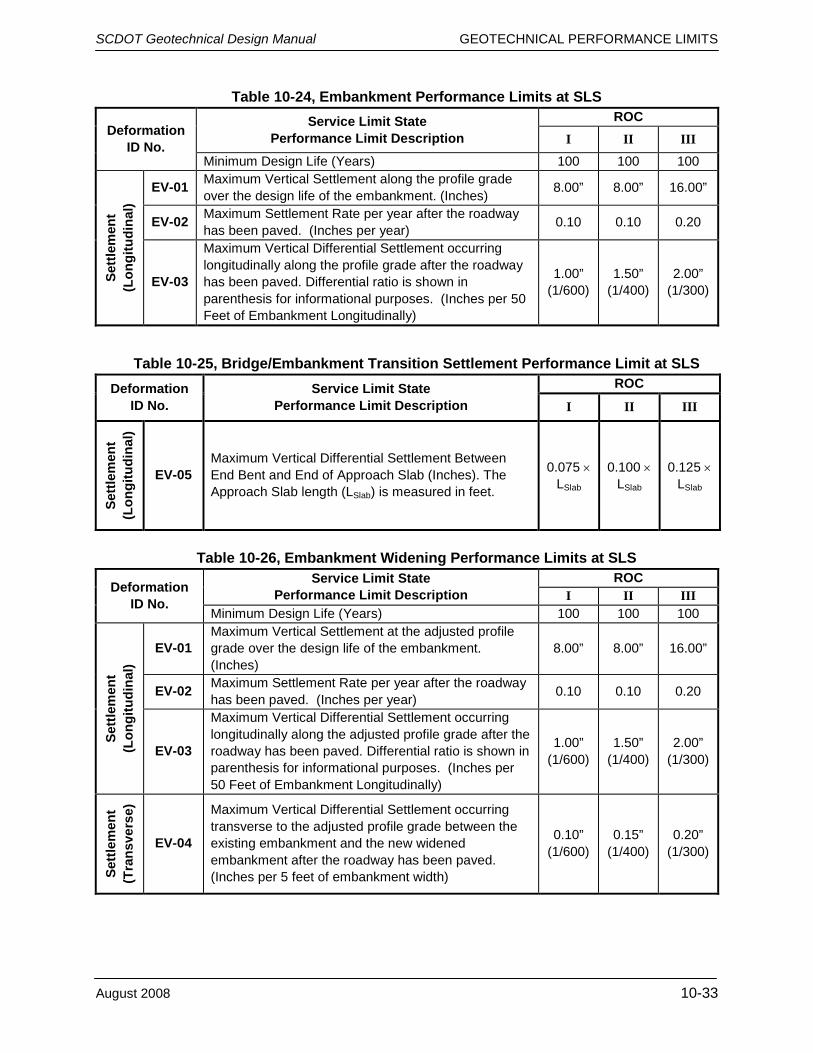
SCDOT Geotechnical Design Manual GEOTECHNICAL PERFORMANCE LIMITS
August 2008 10-33
Table 10-24, Embankment Performance Limits at SLS
Deformation ID No.
Service Limit State Performance Limit Description
ROC I II III
Minimum Design Life (Years) 100 100 100
Settl
emen
t (L
ongi
tudi
nal)
EV-01 Maximum Vertical Settlement along the profile grade over the design life of the embankment. (Inches) 8.00” 8.00” 16.00”
EV-02 Maximum Settlement Rate per year after the roadway has been paved. (Inches per year) 0.10 0.10 0.20
EV-03
Maximum Vertical Differential Settlement occurring longitudinally along the profile grade after the roadway has been paved. Differential ratio is shown in parenthesis for informational purposes. (Inches per 50 Feet of Embankment Longitudinally)
1.00” (1/600)
1.50” (1/400)
2.00” (1/300)
Table 10-25, Bridge/Embankment Transition Settlement Performance Limit at SLS Deformation
ID No. Service Limit State
Performance Limit Description ROC
I II III
Settl
emen
t (L
ongi
tudi
nal)
EV-05 Maximum Vertical Differential Settlement Between End Bent and End of Approach Slab (Inches). The Approach Slab length (LSlab) is measured in feet.
0.075 × LSlab
0.100 × LSlab
0.125 × LSlab
Table 10-26, Embankment Widening Performance Limits at SLS
Deformation ID No.
Service Limit State Performance Limit Description
ROC I II III
Minimum Design Life (Years) 100 100 100
Settl
emen
t (L
ongi
tudi
nal)
EV-01 Maximum Vertical Settlement at the adjusted profile grade over the design life of the embankment. (Inches)
8.00” 8.00” 16.00”
EV-02 Maximum Settlement Rate per year after the roadway has been paved. (Inches per year) 0.10 0.10 0.20
EV-03
Maximum Vertical Differential Settlement occurring longitudinally along the adjusted profile grade after the roadway has been paved. Differential ratio is shown in parenthesis for informational purposes. (Inches per 50 Feet of Embankment Longitudinally)
1.00” (1/600)
1.50” (1/400)
2.00” (1/300)
Settl
emen
t (T
rans
vers
e)
EV-04
Maximum Vertical Differential Settlement occurring transverse to the adjusted profile grade between the existing embankment and the new widened embankment after the roadway has been paved. (Inches per 5 feet of embankment width)
0.10” (1/600)
0.15” (1/400)
0.20” (1/300)

SCDOT Geotechnical Design Manual GEOTECHNICAL PERFORMANCE LIMITS
10-34 August 2008
10.7.2
10.7.2.1 Performance Objective
Extreme Event I Limit State
Performance Objectives for embankments after an Extreme Event I (EE I) has occurred are provided in Table 10-27. These Performance Objectives are based solely on the embankment providing support for the roadway pavement and maintaining the road open to traffic. Descriptions of Service and Damage performance levels are provided in Section 10.2.2.
Table 10-27, Embankment Extreme Event I Performance Objectives
Design Earthquake Performance Level
ROC I II III
Functional Evaluation Earthquake (FEE)
Service Immediate Maintained Recoverable Damage Minimal Repairable Repairable
Safety Evaluation Earthquake (SEE)
Service Maintained Impaired Impaired Damage Repairable Significant Significant
10.7.2.2 Performance Limits
Table 10-28, Embankment Global Instability Performance Limits at EE I Limit State Deformation ID
No. EE I Limit State
Performance Limit Description (1) Design
EQ ROC
I II III
Vert
ical
D
ispl
acem
ent
GI-01 Maximum Vertical Displacement at top of the slope failure surface. (Inches)
FEE 1.00” 2.00” 4.00”
SEE 2.00” 4.00” 8.00”
GI -02 Maximum Vertical Displacement at bottom of the slope failure surface. (Inches)
FEE 1.00” 2.00” 4.00”
SEE 2.00” 4.00” 8.00”
Late
ral (2
)
Dis
plac
emen
t
GI-03 Maximum Lateral Displacement at top of the slope failure surface. (Inches)
FEE 3.00” 6.00” 24.00”
SEE 4.00” 12.00” 60.00”
GI-04 Maximum Lateral Displacement at bottom of the slope failure surface. (Inches)
FEE 3.00” 6.00” 24.00”
SEE 4.00” 12.00” 60.00” (1) Project specific requirements may need to be selected for these performance limits if adjacent structures require more restrictive deformations. The geotechnical and structural engineers should evaluate these performance limits to determine applicability to the specific project. (2) In the direction of global instability.
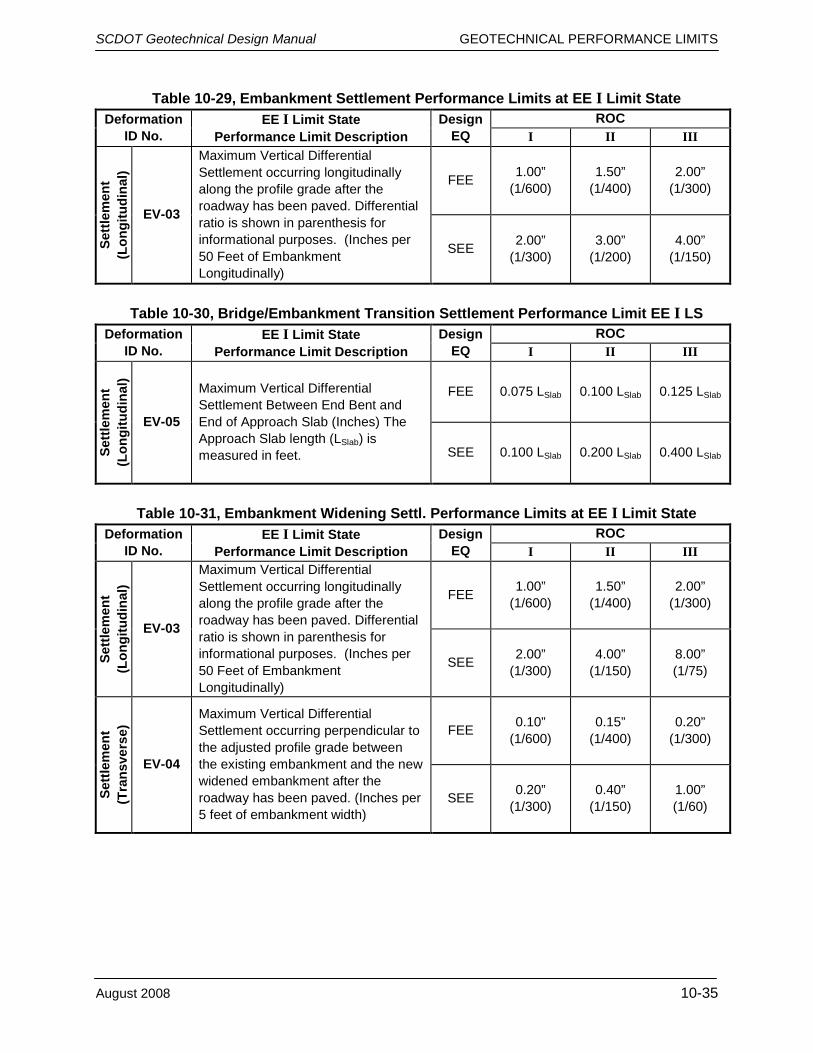
SCDOT Geotechnical Design Manual GEOTECHNICAL PERFORMANCE LIMITS
August 2008 10-35
Table 10-29, Embankment Settlement Performance Limits at EE I Limit State Deformation
ID No. EE I Limit State
Performance Limit Description Design
EQ ROC
I II III
Settl
emen
t (L
ongi
tudi
nal)
EV-03
Maximum Vertical Differential Settlement occurring longitudinally along the profile grade after the roadway has been paved. Differential ratio is shown in parenthesis for informational purposes. (Inches per 50 Feet of Embankment Longitudinally)
FEE 1.00” (1/600)
1.50” (1/400)
2.00” (1/300)
SEE 2.00” (1/300)
3.00” (1/200)
4.00” (1/150)
Table 10-30, Bridge/Embankment Transition Settlement Performance Limit EE I LS
Deformation ID No.
EE I Limit State Performance Limit Description
Design EQ
ROC I II III
Settl
emen
t (L
ongi
tudi
nal)
EV-05
Maximum Vertical Differential Settlement Between End Bent and End of Approach Slab (Inches) The Approach Slab length (LSlab) is measured in feet.
FEE 0.075 LSlab 0.100 LSlab 0.125 LSlab
SEE 0.100 LSlab 0.200 LSlab 0.400 LSlab
Table 10-31, Embankment Widening Settl. Performance Limits at EE I Limit State
Deformation ID No.
EE I Limit State Performance Limit Description
Design EQ
ROC I II III
Settl
emen
t (L
ongi
tudi
nal)
EV-03
Maximum Vertical Differential Settlement occurring longitudinally along the profile grade after the roadway has been paved. Differential ratio is shown in parenthesis for informational purposes. (Inches per 50 Feet of Embankment Longitudinally)
FEE 1.00” (1/600)
1.50” (1/400)
2.00” (1/300)
SEE 2.00” (1/300)
4.00” (1/150)
8.00” (1/75)
Settl
emen
t (T
rans
vers
e)
EV-04
Maximum Vertical Differential Settlement occurring perpendicular to the adjusted profile grade between the existing embankment and the new widened embankment after the roadway has been paved. (Inches per 5 feet of embankment width)
FEE 0.10” (1/600)
0.15” (1/400)
0.20” (1/300)
SEE 0.20” (1/300)
0.40” (1/150)
1.00” (1/60)

SCDOT Geotechnical Design Manual GEOTECHNICAL PERFORMANCE LIMITS
10-36 August 2008
10.8 PERFORMANCE LIMITS FOR BRIDGES
10.8.1
10.8.1.1 Service Limit State Performance Objective
Service Limit State
The Performance Objectives for bridges at the Service limit state (SLS) are that they remain fully functional to normal traffic for the life of the structure. Additional requirements that were used to develop the Performance Limits are provided in Section 10.2.1. Performance limits for bridge foundations are based on the bridge superstructure requirements. 10.8.1.2 Service Limit State Performance Limits
The following Performance Limits have been developed to meet the Performance Objectives indicated in Section 10.8.1.1. Deformation descriptions are found in Section 10.5.
Table 10-32, Bridge Performance Limits at SLS
Deformation ID No.
Service Performance Limit Performance Limit Description
OC I II III
Design Life (Years) 75 75 75
Brid
ge E
nd B
ents
EB-01 Maximum Vertical Differential Settlement for Integral/Semi-Integral End Bent (Inches) (1) 0.020 LSpan 0.020 LSpan 0.020 LSpan
EB-02 Maximum Vertical Differential Settlement for Free Standing End Bent (Inches) (1) 0.040 LSpan 0.040 LSpan 0.040 LSpan
EB-03 Maximum Lateral Longitudinal Displacement for Integral/Semi-Integral End Bent (Inches) 0.25” 0.50” 0.50”
EB-04 Maximum Lateral Longitudinal Displacement for Free Standing End Bent (Inches) 0.50” 0.75” 0.75”
EB-05 Maximum Lateral Transverse Displacement for Integral/Semi-Integral End Bent (Inches) 0.50” 0.50” 0.50”
EB-06 Maximum Lateral Transverse Displacement for Free Standing End Bent (Inches) 0.75” 0.75” 0.75”
Brid
ge In
terio
r Ben
ts
IB-01 Maximum Vertical Differential Settlement for Fixed Bearing Interior Bent (Inches) (1) 0.020 LSpan 0.020 LSpan 0.020 LSpan
IB-02 Maximum Vertical Differential Settlement for Expansion Bearing Interior Bent (Inches) (1) 0.040 LSpan 0.040 LSpan 0.040 LSpan
IB–03 Maximum Lateral Longitudinal Displacement for Fixed Bearing Interior Bent (Inches) 0.50” 0.75” 0.75”
IB–04 Maximum Lateral Longitudinal Displacement for Expansion Bearing Interior Bent (Inches) 0.75” 1.00” 1.00”
IB–05 Maximum Lateral Transverse Displacement for Fixed Bearing Interior Bent (Inches) 0.75” 0.75” 0.75”
IB–06 Maximum Lateral Transverse Displacement for Expansion Bearing Interior Bent (Inches) 1.00” 1.00” 1.00”
(1) Where LSpan is the center-to-center span length measured in feet. Where LSpan is the center-to-center distance of the first interior span adjacent to the end bent. For interior bents, LSpan is the shortest center-to-center span length between adjacent bridge spans.
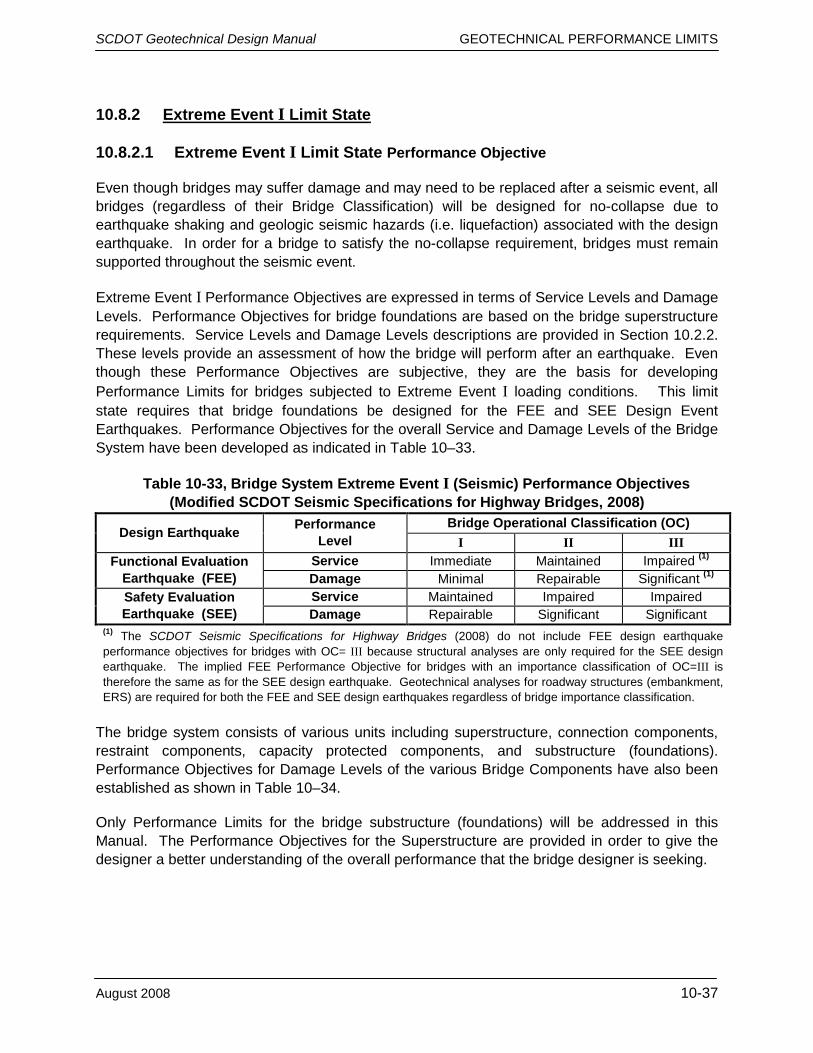
SCDOT Geotechnical Design Manual GEOTECHNICAL PERFORMANCE LIMITS
August 2008 10-37
10.8.2
10.8.2.1 Extreme Event I Limit State Performance Objective
Extreme Event I Limit State
Even though bridges may suffer damage and may need to be replaced after a seismic event, all bridges (regardless of their Bridge Classification) will be designed for no-collapse due to earthquake shaking and geologic seismic hazards (i.e. liquefaction) associated with the design earthquake. In order for a bridge to satisfy the no-collapse requirement, bridges must remain supported throughout the seismic event.
Extreme Event I Performance Objectives are expressed in terms of Service Levels and Damage Levels. Performance Objectives for bridge foundations are based on the bridge superstructure requirements. Service Levels and Damage Levels descriptions are provided in Section 10.2.2. These levels provide an assessment of how the bridge will perform after an earthquake. Even though these Performance Objectives are subjective, they are the basis for developing Performance Limits for bridges subjected to Extreme Event I loading conditions. This limit state requires that bridge foundations be designed for the FEE and SEE Design Event Earthquakes. Performance Objectives for the overall Service and Damage Levels of the Bridge System have been developed as indicated in Table 10–33.
Table 10-33, Bridge System Extreme Event I (Seismic) Performance Objectives (Modified SCDOT Seismic Specifications for Highway Bridges, 2008)
Design Earthquake Performance Level
Bridge Operational Classification (OC) I II III
Functional Evaluation Earthquake (FEE)
Service Immediate Maintained Impaired (1) Damage Minimal Repairable Significant (1)
Safety Evaluation Earthquake (SEE)
Service Maintained Impaired Impaired Damage Repairable Significant Significant
(1) The SCDOT Seismic Specifications for Highway Bridges (2008) do not include FEE design earthquake performance objectives for bridges with OC= III because structural analyses are only required for the SEE design earthquake. The implied FEE Performance Objective for bridges with an importance classification of OC=III is therefore the same as for the SEE design earthquake. Geotechnical analyses for roadway structures (embankment, ERS) are required for both the FEE and SEE design earthquakes regardless of bridge importance classification.
The bridge system consists of various units including superstructure, connection components, restraint components, capacity protected components, and substructure (foundations). Performance Objectives for Damage Levels of the various Bridge Components have also been established as shown in Table 10–34.
Only Performance Limits for the bridge substructure (foundations) will be addressed in this Manual. The Performance Objectives for the Superstructure are provided in order to give the designer a better understanding of the overall performance that the bridge designer is seeking.
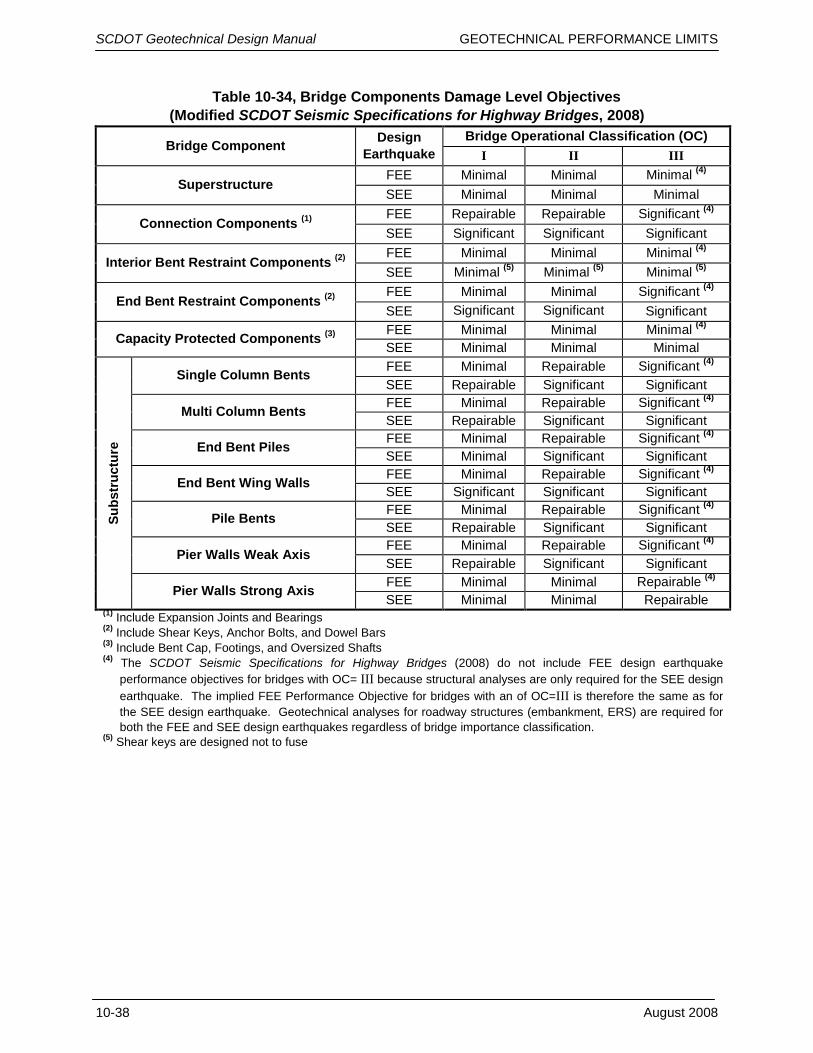
SCDOT Geotechnical Design Manual GEOTECHNICAL PERFORMANCE LIMITS
10-38 August 2008
Table 10-34, Bridge Components Damage Level Objectives (Modified SCDOT Seismic Specifications for Highway Bridges, 2008)
Bridge Component Design Earthquake
Bridge Operational Classification (OC) I II III
Superstructure FEE Minimal Minimal Minimal (4) SEE Minimal Minimal Minimal
Connection Components (1) FEE Repairable Repairable Significant (4) SEE Significant Significant Significant
Interior Bent Restraint Components (2) FEE Minimal Minimal Minimal (4) SEE Minimal (5) Minimal (5) Minimal (5)
End Bent Restraint Components (2) FEE Minimal Minimal Significant (4) SEE Significant Significant Significant
Capacity Protected Components (3) FEE Minimal Minimal Minimal (4) SEE Minimal Minimal Minimal
Subs
truc
ture
Single Column Bents FEE Minimal Repairable Significant (4) SEE Repairable Significant Significant
Multi Column Bents FEE Minimal Repairable Significant (4) SEE Repairable Significant Significant
End Bent Piles FEE Minimal Repairable Significant (4) SEE Minimal Significant Significant
End Bent Wing Walls FEE Minimal Repairable Significant (4) SEE Significant Significant Significant
Pile Bents FEE Minimal Repairable Significant (4) SEE Repairable Significant Significant
Pier Walls Weak Axis FEE Minimal Repairable Significant (4) SEE Repairable Significant Significant
Pier Walls Strong Axis FEE Minimal Minimal Repairable (4) SEE Minimal Minimal Repairable
(1) Include Expansion Joints and Bearings (2) Include Shear Keys, Anchor Bolts, and Dowel Bars (3) Include Bent Cap, Footings, and Oversized Shafts (4) The SCDOT Seismic Specifications for Highway Bridges (2008) do not include FEE design earthquake
performance objectives for bridges with OC= III because structural analyses are only required for the SEE design earthquake. The implied FEE Performance Objective for bridges with an of OC=III is therefore the same as for the SEE design earthquake. Geotechnical analyses for roadway structures (embankment, ERS) are required for both the FEE and SEE design earthquakes regardless of bridge importance classification.
(5) Shear keys are designed not to fuse
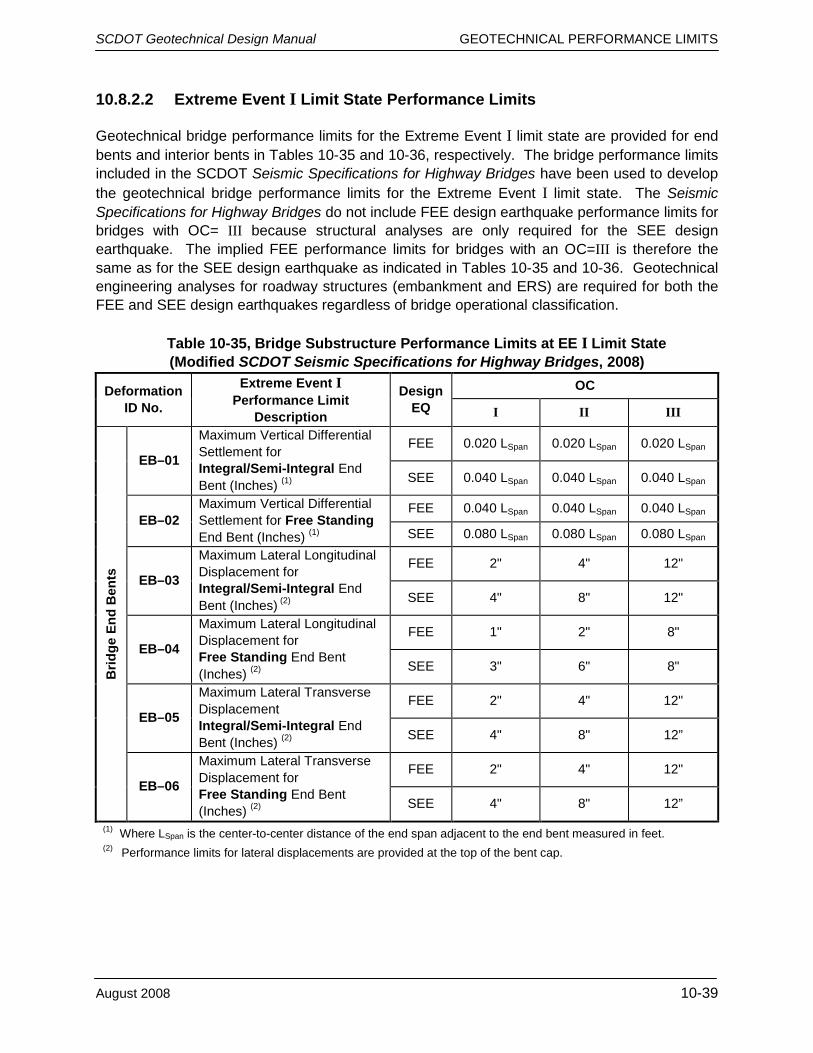
SCDOT Geotechnical Design Manual GEOTECHNICAL PERFORMANCE LIMITS
August 2008 10-39
10.8.2.2 Extreme Event I Limit State Performance Limits
Geotechnical bridge performance limits for the Extreme Event I limit state are provided for end bents and interior bents in Tables 10-35 and 10-36, respectively. The bridge performance limits included in the SCDOT Seismic Specifications for Highway Bridges have been used to develop the geotechnical bridge performance limits for the Extreme Event I limit state. The Seismic Specifications for Highway Bridges do not include FEE design earthquake performance limits for bridges with OC= III because structural analyses are only required for the SEE design earthquake. The implied FEE performance limits for bridges with an OC=III is therefore the same as for the SEE design earthquake as indicated in Tables 10-35 and 10-36. Geotechnical engineering analyses for roadway structures (embankment and ERS) are required for both the FEE and SEE design earthquakes regardless of bridge operational classification.
Table 10-35, Bridge Substructure Performance Limits at EE I Limit State (Modified SCDOT Seismic Specifications for Highway Bridges, 2008)
Deformation ID No.
Extreme Event I Performance Limit
Description
Design EQ
OC
I II III
Brid
ge E
nd B
ents
EB–01
Maximum Vertical Differential Settlement for Integral/Semi-Integral End Bent (Inches) (1)
FEE 0.020 LSpan 0.020 LSpan 0.020 LSpan
SEE 0.040 LSpan 0.040 LSpan 0.040 LSpan
EB–02 Maximum Vertical Differential Settlement for Free Standing End Bent (Inches) (1)
FEE 0.040 LSpan 0.040 LSpan 0.040 LSpan
SEE 0.080 LSpan 0.080 LSpan 0.080 LSpan
EB–03
Maximum Lateral Longitudinal Displacement for Integral/Semi-Integral End Bent (Inches) (2)
FEE 2" 4" 12"
SEE 4" 8" 12"
EB–04
Maximum Lateral Longitudinal Displacement for Free Standing End Bent (Inches) (2)
FEE 1" 2" 8"
SEE 3" 6" 8"
EB–05
Maximum Lateral Transverse Displacement Integral/Semi-Integral End Bent (Inches) (2)
FEE 2" 4" 12"
SEE 4" 8" 12”
EB–06
Maximum Lateral Transverse Displacement for Free Standing End Bent (Inches) (2)
FEE 2" 4" 12"
SEE 4" 8" 12”
(1) Where LSpan is the center-to-center distance of the end span adjacent to the end bent measured in feet. (2) Performance limits for lateral displacements are provided at the top of the bent cap.
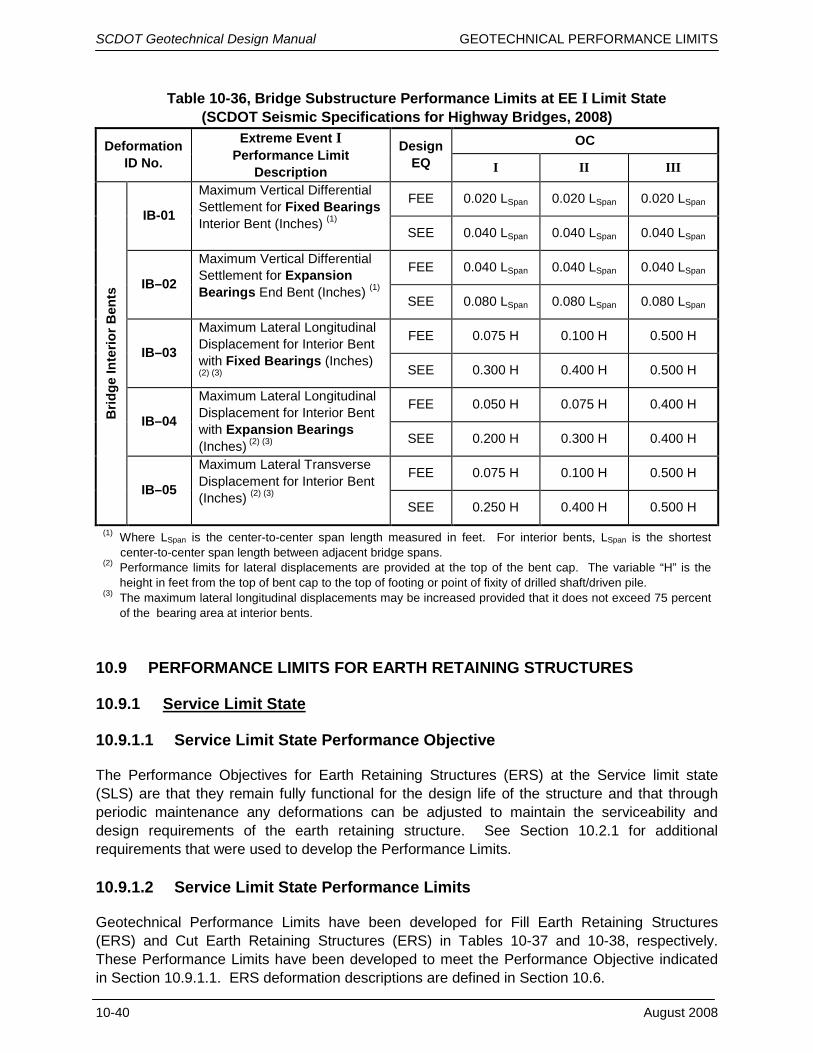
SCDOT Geotechnical Design Manual GEOTECHNICAL PERFORMANCE LIMITS
10-40 August 2008
Table 10-36, Bridge Substructure Performance Limits at EE I Limit State (SCDOT Seismic Specifications for Highway Bridges, 2008)
Deformation ID No.
Extreme Event I Performance Limit
Description
Design EQ
OC
I II III
Brid
ge In
terio
r Ben
ts
IB-01
Maximum Vertical Differential Settlement for Fixed Bearings Interior Bent (Inches) (1)
FEE 0.020 LSpan 0.020 LSpan 0.020 LSpan
SEE 0.040 LSpan 0.040 LSpan 0.040 LSpan
IB–02
Maximum Vertical Differential Settlement for Expansion Bearings End Bent (Inches) (1)
FEE 0.040 LSpan 0.040 LSpan 0.040 LSpan
SEE 0.080 LSpan 0.080 LSpan 0.080 LSpan
IB–03
Maximum Lateral Longitudinal Displacement for Interior Bent with Fixed Bearings (Inches)
(2) (3)
FEE 0.075 H 0.100 H 0.500 H
SEE 0.300 H 0.400 H 0.500 H
IB–04
Maximum Lateral Longitudinal Displacement for Interior Bent with Expansion Bearings (Inches) (2) (3)
FEE 0.050 H 0.075 H 0.400 H
SEE 0.200 H 0.300 H 0.400 H
IB–05
Maximum Lateral Transverse Displacement for Interior Bent (Inches) (2) (3)
FEE 0.075 H 0.100 H 0.500 H
SEE 0.250 H 0.400 H 0.500 H
(1) Where LSpan is the center-to-center span length measured in feet. For interior bents, LSpan is the shortest center-to-center span length between adjacent bridge spans.
(2) Performance limits for lateral displacements are provided at the top of the bent cap. The variable “H” is the height in feet from the top of bent cap to the top of footing or point of fixity of drilled shaft/driven pile.
(3) The maximum lateral longitudinal displacements may be increased provided that it does not exceed 75 percent of the bearing area at interior bents.
10.9 PERFORMANCE LIMITS FOR EARTH RETAINING STRUCTURES
10.9.1
10.9.1.1 Service Limit State Performance Objective
Service Limit State
The Performance Objectives for Earth Retaining Structures (ERS) at the Service limit state (SLS) are that they remain fully functional for the design life of the structure and that through periodic maintenance any deformations can be adjusted to maintain the serviceability and design requirements of the earth retaining structure. See Section 10.2.1 for additional requirements that were used to develop the Performance Limits. 10.9.1.2 Service Limit State Performance Limits
Geotechnical Performance Limits have been developed for Fill Earth Retaining Structures (ERS) and Cut Earth Retaining Structures (ERS) in Tables 10-37 and 10-38, respectively. These Performance Limits have been developed to meet the Performance Objective indicated in Section 10.9.1.1. ERS deformation descriptions are defined in Section 10.6.

ROC Service Limit State Performance Limit Description I II III
Deformation ID No.
Minimum Design Life (Years) (1) 100 100 75
RV-01 Maximum Vertical Settlement at any point on top of the wall profile grade over the design life of the ERS (Inches) 12.00” 12.00” 18.00”
RV-02 Maximum Rate of Settlement per year after the ERS has been constructed (Inches per year) 0.10 0.10 0.20 Rigid/Semi-Rigid walls (2) 1.00” (1/600) 1.25” (1/500) 1.25” (1/500)
Table 10-37, Fill ERS Performance Limits at SLS
(1) The Minimum Design Life for temporary structures that will be in service more than 3 years is 75 years. The Minimum Design Life for temporary earth retaining structures that will be in service for less than 3 years is 3 years.
(2) Rigid/Semi-Rigid retaining walls include reinforced concrete walls and brick walls. (3) The soil reinforcement length (LReinf) is measured in feet. (4) The wall height (HWall) is measured in feet. For the reinforced soil slopes the HWall is the vertical distance from the toe of the slope to shoulder edge.
Full Height Panel Facing 1.00” (1/600) 1.25” (1/500) 1.25” (1/500) Crib Wall, Bin Wall 1.50” (1/400) 2.00” (1/300) 2.50” (1/240)
MSE Panel Facing Joint Spacing < ½” 1.50” (1/400) 2.00” (1/300) 3.00” (1/200) MSE Panel Facing Joint Spacing ≥ ½” 2.00” (1/300) 3.00” (1/200) 4.00” (1/150)
MSE Block Facing 2.50” (1/240) 2.50” (1/240) 3.00” (1/200)
Settl
emen
t (Lo
ngitu
dina
l)
RV-03
Maximum Vertical Differential Settlement at Top of Wall Profile grade over the life of the structure. (Inches/50 feet along the length of ERS) (Maximum settlement ratio indicated in parenthesis for informational purposes only)
Gabion Facing, Reinforced Soil Slope 6.00” (1/100) 12.00” (1/50) 15.00” (1/40) MSE Walls 0.150 LReinf 0.150 LReinf 0.150 LReinf
Settl
emen
t (T
rans
vers
e)
RV-04
Maximum Vertical Differential Settlement Perpendicular to the wall facing profile over the design life of the structure. (3) (Inches/5 feet perpendicular to wall or slope face)
Reinforced Soil Slopes 0.150 LReinf 0.150 LReinf 0.150 LReinf
Rigid Walls, Full Height Panel Facing 0.015 HWall 0.015 HWall 0.025 HWall
Crib Wall, Bin Wall, MSE Walls 0.035 HWall 0.035 HWall 0.045 HWall RL-01 Maximum Lateral Displacement at the top of the wall. (4) (Inches)
Gabion Facing, Reinforced Soil Slope 0.050 HWall 0.050 HWall 0.060 HWall
RL-02 Maximum Differential Lateral Displacement longitudinally along the top of the wall. (Inches/50 feet of wall) All Earth Retaining Structures 1.00” 1.00” 1.00”
Rigid Walls, Full Height Panel Facing 0 - 0.5° 0 - 0.5° 0 - 0.5° Crib Wall, Bin Wall, MSE Walls <2° <2° <2°
Late
ral
Dis
plac
emen
ts
RL-03 Maximum Tilt or Angle of Rotation (θ) of the ERS Facing from the original constructed ERS facing after lateral displacements have occurred. (Degrees) Gabion Facing, Reinforced Soil Slope <3° <3° <3°
August 2008
10-41
SC
DO
T G
eotechnical Design M
anual G
EO
TEC
HN
ICA
L PE
RFO
RM
AN
CE
LIMITS
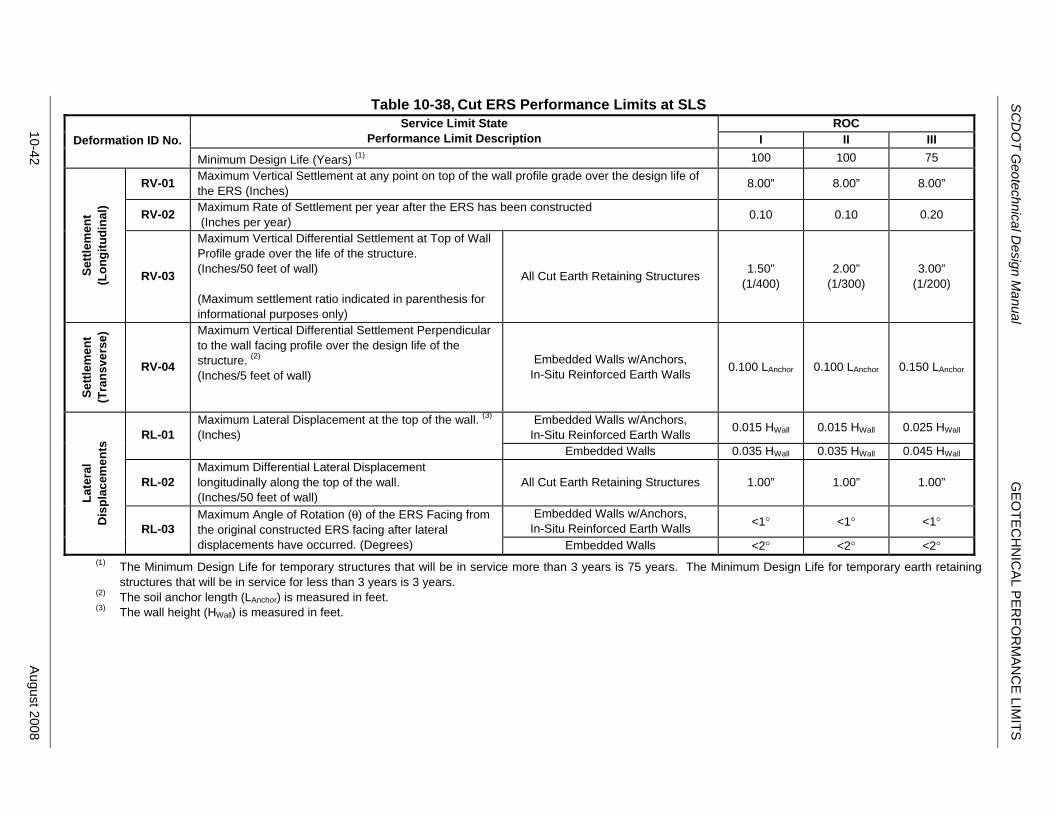
Table 10-38, Cut ERS Performance Limits at SLS
ROC Service Limit State Performance Limit Description I II IIIDeformation ID No.
Minimum Design Life (Years) (1) 100 100 75
RV-01 Maximum Vertical Settlement at any point on top of the wall profile grade over the design life of the ERS (Inches) 8.00” 8.00” 8.00”
RV-02 Maximum Rate of Settlement per year after the ERS has been constructed (Inches per year) 0.10 0.10 0.20
Settl
emen
t (L
ongi
tudi
nal)
RV-03
Maximum Vertical Differential Settlement at Top of Wall Profile grade over the life of the structure. (Inches/50 feet of wall) (Maximum settlement ratio indicated in parenthesis for informational purposes only)
All Cut Earth Retaining Structures 1.50” (1/400)
2.00” (1/300)
3.00” (1/200)
Settl
emen
t (T
rans
vers
e)
RV-04
Maximum Vertical Differential Settlement Perpendicular to the wall facing profile over the design life of the structure. (2) (Inches/5 feet of wall)
Embedded Walls w/Anchors, In-Situ Reinforced Earth Walls 0.100 LAnchor 0.100 LAnchor 0.150 LAnchor
Embedded Walls w/Anchors, In-Situ Reinforced Earth Walls 0.015 HWall 0.015 HWall 0.025 HWall RL-01
Maximum Lateral Displacement at the top of the wall. (3) (Inches)
Embedded Walls 0.035 HWall 0.035 HWall 0.045 HWall
RL-02 Maximum Differential Lateral Displacement longitudinally along the top of the wall. (Inches/50 feet of wall)
All Cut Earth Retaining Structures 1.00” 1.00” 1.00”
Embedded Walls w/Anchors, In-Situ Reinforced Earth Walls <1° <1° <1°
Late
ral
Dis
plac
emen
ts
RL-03 Maximum Angle of Rotation (θ) of the ERS Facing from the original constructed ERS facing after lateral displacements have occurred. (Degrees) Embedded Walls <2° <2° <2°
(1) The Minimum Design Life for temporary structures that will be in service more than 3 years is 75 years. The Minimum Design Life for temporary earth retaining structures that will be in service for less than 3 years is 3 years.
(2) The soil anchor length (LAnchor) is measured in feet. (3) The wall height (HWall) is measured in feet.
10-42 A
ugust 2008
SC
DO
T G
eotechnical Design M
anual G
EO
TEC
HN
ICA
L PE
RFO
RM
AN
CE
LIMITS

SCDOT Geotechnical Design Manual GEOTECHNICAL PERFORMANCE LIMITS
August 2008 10-43
10.9.2
10.9.2.1 Performance Objective
Extreme Event I Limit State
The Performance Objectives for Earth Retaining Structures (ERS) at the Extreme Event I limit state are provided in Table 10-39. Description of Service and Damage performance levels are provided in Section 10.2.2.
Table 10-39, Embankment Extreme Event I Performance Objectives
Design Earthquake Performance Level
Roadway Operational Classification (ROC) I II III
Functional Evaluation Earthquake (FEE)
Service Immediate Maintained Recoverable Damage Minimal Repairable Repairable
Safety Evaluation Earthquake (SEE)
Service Maintained Impaired Impaired Damage Repairable Significant Significant
10.9.2.2 Performance Limits
Geotechnical Performance limits for Earth Retaining Structures (ERS) deformations resulting from global instability are provided in Table 10-40. Geotechnical Performance limits for Settlement of Fill Earth Retaining Structures (ERS) are provided in Table 10-41. The Geotechnical Performance Limits for ERS will typically supercede the geotechnical Performance Limits for embankments provided in Section 10.7.2. Geotechnical Performance Limits for the Extreme Event I limit state have also been developed for Fill Earth Retaining Structures (ERS) and Cut Earth Retaining Structures (ERS) in Tables 10-42 and 10-43, respectively.
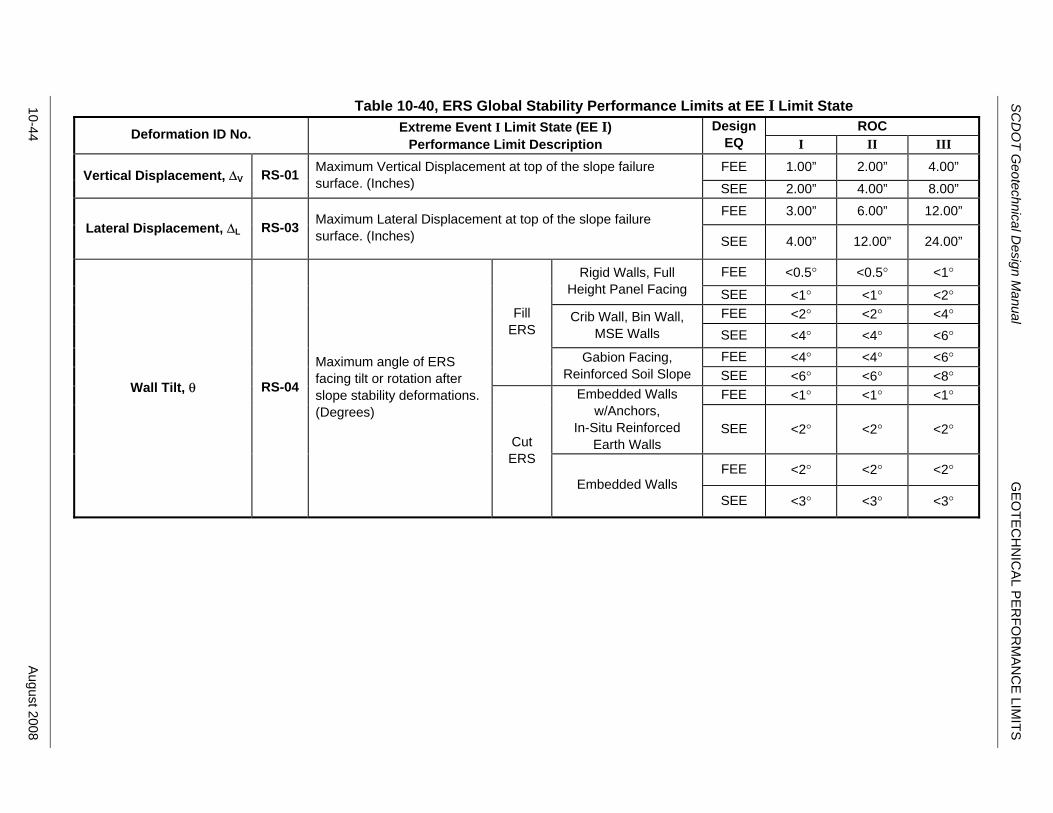
ROC Deformation ID No. Extreme Event I Limit State (EE I) Performance Limit Description
Design EQ I II III
FEE 1.00” 2.00” 4.00” Vertical Displacement, ΔV RS-01 Maximum Vertical Displacement at top of the slope failure surface. (Inches) SEE 2.00” 4.00” 8.00”
FEE 3.00” 6.00” 12.00” Lateral Displacement, ΔL RS-03 Maximum Lateral Displacement at top of the slope failure
surface. (Inches) SEE 4.00” 12.00” 24.00”
FEE <0.5° <0.5° <1° Rigid Walls, Full Height Panel Facing SEE <1° <1° <2°
FEE <2° <2° <4° Crib Wall, Bin Wall, MSE Walls SEE <4° <4° <6°
FEE <4° <4° <6°
Fill ERS
Gabion Facing, Reinforced Soil Slope SEE <6° <6° <8°
FEE <1° <1° <1° Embedded Walls w/Anchors,
In-Situ Reinforced Earth Walls
SEE <2° <2° <2°
FEE <2° <2° <2°
Wall Tilt, θ RS-04
Maximum angle of ERS facing tilt or rotation after slope stability deformations. (Degrees)
Cut ERS
Embedded Walls SEE <3° <3° <3°
10-44
August 2008
SC
DO
T G
eotechnical Design M
anual G
EO
TEC
HN
ICA
L PE
RFO
RM
AN
CE
LIMITS
Table 10-40, ERS Global Stability Performance Limits at EE I Limit State
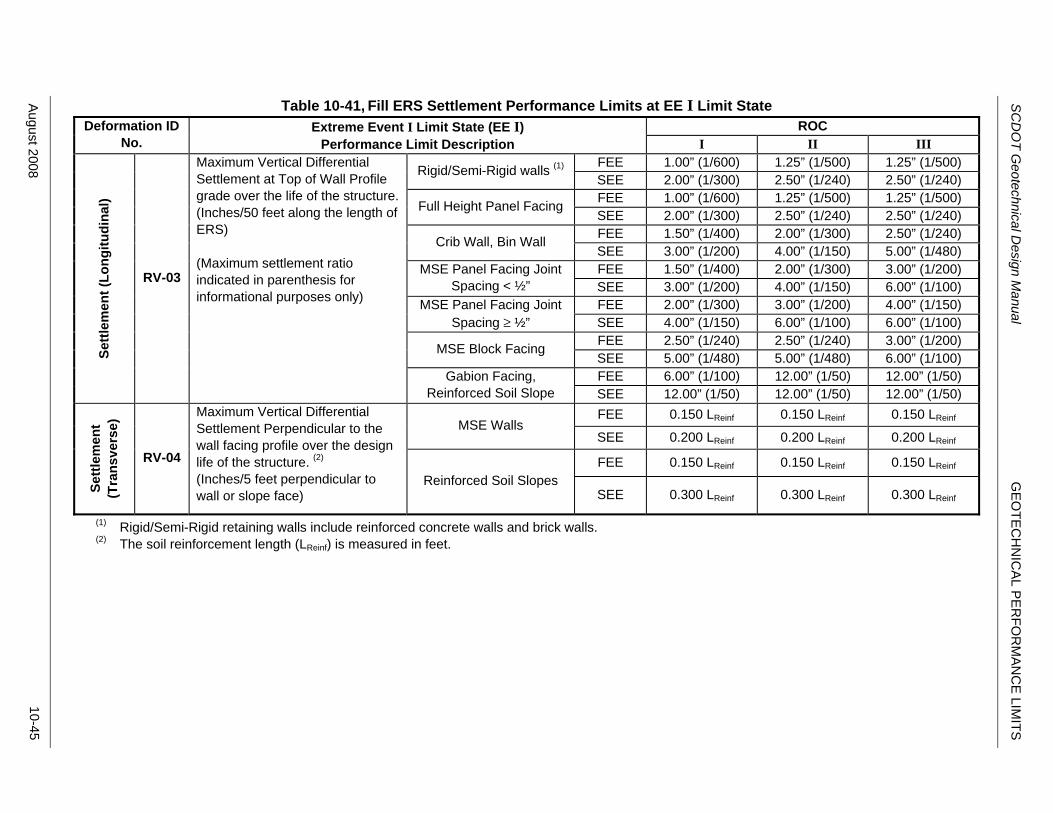
Table 10-41, Fill ERS Settlement Performance Limits at EE I Limit State ROC Deformation ID
No. Extreme Event I Limit State (EE I)
Performance Limit Description I II III FEE 1.00” (1/600) 1.25” (1/500) 1.25” (1/500) Rigid/Semi-Rigid walls (1) SEE 2.00” (1/300) 2.50” (1/240) 2.50” (1/240) FEE 1.00” (1/600) 1.25” (1/500) 1.25” (1/500) Full Height Panel Facing SEE 2.00” (1/300) 2.50” (1/240) 2.50” (1/240) FEE 1.50” (1/400) 2.00” (1/300) 2.50” (1/240) Crib Wall, Bin Wall SEE 3.00” (1/200) 4.00” (1/150) 5.00” (1/480) FEE 1.50” (1/400) 2.00” (1/300) 3.00” (1/200) MSE Panel Facing Joint
Spacing < ½” SEE 3.00” (1/200) 4.00” (1/150) 6.00” (1/100) FEE 2.00” (1/300) 3.00” (1/200) 4.00” (1/150) MSE Panel Facing Joint
Spacing ≥ ½” SEE 4.00” (1/150) 6.00” (1/100) 6.00” (1/100) FEE 2.50” (1/240) 2.50” (1/240) 3.00” (1/200) MSE Block Facing SEE 5.00” (1/480) 5.00” (1/480) 6.00” (1/100) FEE 6.00” (1/100) 12.00” (1/50) 12.00” (1/50)
Settl
emen
t (Lo
ngitu
dina
l)
RV-03
Maximum Vertical Differential Settlement at Top of Wall Profile grade over the life of the structure. (Inches/50 feet along the length of ERS) (Maximum settlement ratio indicated in parenthesis for informational purposes only)
Gabion Facing, Reinforced Soil Slope SEE 12.00” (1/50) 12.00” (1/50) 12.00” (1/50)
FEE 0.150 LReinf 0.150 LReinf 0.150 LReinf MSE Walls
SEE 0.200 LReinf 0.200 LReinf 0.200 LReinf
FEE 0.150 LReinf 0.150 LReinf 0.150 LReinf
Settl
emen
t (T
rans
vers
e)
RV-04
Maximum Vertical Differential Settlement Perpendicular to the wall facing profile over the design life of the structure. (2) (Inches/5 feet perpendicular to wall or slope face)
Reinforced Soil Slopes SEE 0.300 LReinf 0.300 LReinf 0.300 LReinf
(1) Rigid/Semi-Rigid retaining walls include reinforced concrete walls and brick walls. (2) The soil reinforcement length (LReinf) is measured in feet.
August 2008
10-45
SC
DO
T G
eotechnical Design M
anual G
EO
TEC
HN
ICA
L PE
RFO
RM
AN
CE
LIMITS
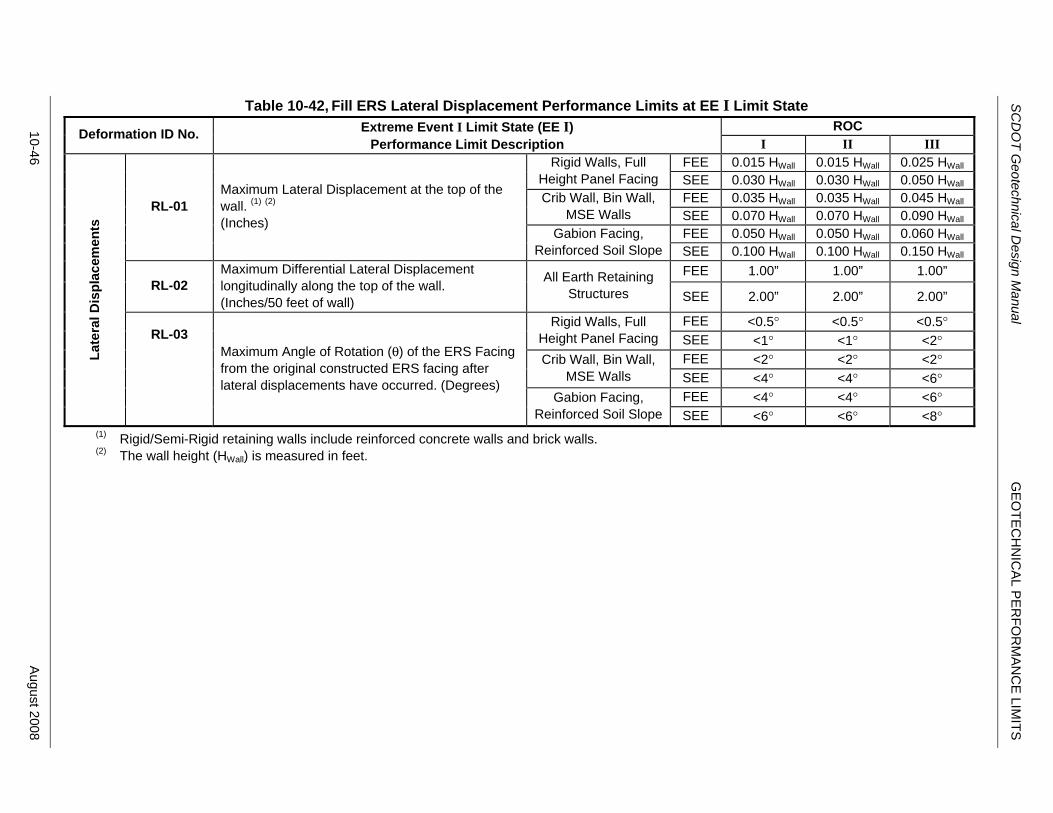
Table 10-42, Fill ERS Lateral Displacement Performance Limits at EE I Limit State ROC Deformation ID No. Extreme Event I Limit State (EE I)
Performance Limit Description I II III FEE 0.015 HWall 0.015 HWall 0.025 HWall Rigid Walls, Full
Height Panel Facing SEE 0.030 HWall 0.030 HWall 0.050 HWall
FEE 0.035 HWall 0.035 HWall 0.045 HWall Crib Wall, Bin Wall, MSE Walls SEE 0.070 HWall 0.070 HWall 0.090 HWall
FEE 0.050 HWall 0.050 HWall 0.060 HWall
RL-01 Maximum Lateral Displacement at the top of the wall. (1) (2) (Inches)
Gabion Facing, Reinforced Soil Slope SEE 0.100 HWall 0.100 HWall 0.150 HWall
FEE 1.00” 1.00” 1.00” RL-02
Maximum Differential Lateral Displacement longitudinally along the top of the wall. (Inches/50 feet of wall)
All Earth Retaining Structures SEE 2.00” 2.00” 2.00”
FEE <0.5° <0.5° <0.5° Rigid Walls, Full Height Panel Facing SEE <1° <1° <2°
FEE <2° <2° <2° Crib Wall, Bin Wall, MSE Walls SEE <4° <4° <6°
FEE <4° <4° <6°
Late
ral D
ispl
acem
ents
RL-03
Maximum Angle of Rotation (θ) of the ERS Facing from the original constructed ERS facing after lateral displacements have occurred. (Degrees)
Gabion Facing, Reinforced Soil Slope SEE <6° <6° <8°
(1) Rigid/Semi-Rigid retaining walls include reinforced concrete walls and brick walls. (2) The wall height (HWall) is measured in feet.
10-46 A
ugust 2008
SC
DO
T G
eotechnical Design M
anual G
EO
TEC
HN
ICA
L PE
RFO
RM
AN
CE
LIMITS
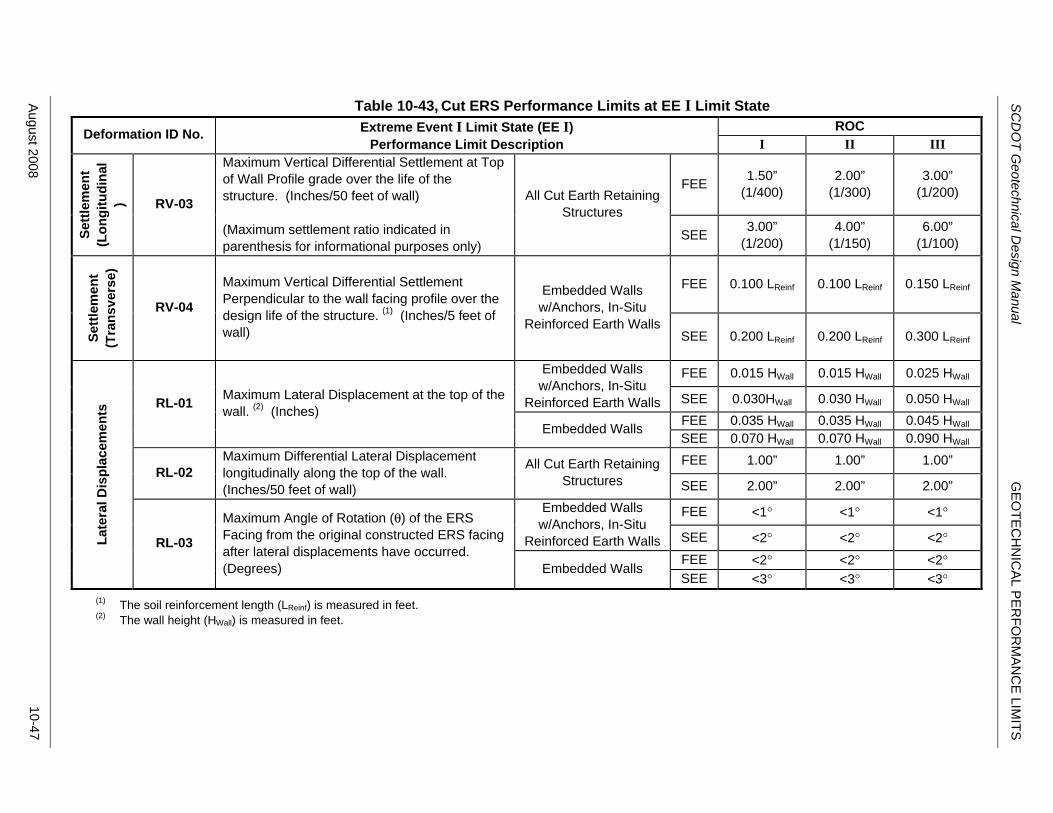
ROC Deformation ID No. Extreme Event I Limit State (EE I) Performance Limit Description I II III
FEE 1.50” (1/400)
2.00” (1/300)
3.00” (1/200)
Settl
emen
t (L
ongi
tudi
nal
) RV-03
Maximum Vertical Differential Settlement at Top of Wall Profile grade over the life of the structure. (Inches/50 feet of wall) (Maximum settlement ratio indicated in parenthesis for informational purposes only)
All Cut Earth Retaining Structures
SEE 3.00” (1/200)
4.00” (1/150)
6.00” (1/100)
FEE 0.100 LReinf 0.100 LReinf 0.150 LReinf
Settl
emen
t (T
rans
vers
e)
RV-04
Maximum Vertical Differential Settlement Perpendicular to the wall facing profile over the design life of the structure. (1) (Inches/5 feet of wall)
Embedded Walls w/Anchors, In-Situ
Reinforced Earth Walls SEE 0.200 LReinf 0.200 LReinf 0.300 LReinf
FEE 0.015 HWall 0.015 HWall 0.025 HWall Embedded Walls w/Anchors, In-Situ
Reinforced Earth Walls SEE 0.030HWall 0.030 HWall 0.050 HWall
FEE 0.035 HWall 0.035 HWall 0.045 HWall
RL-01 Maximum Lateral Displacement at the top of the wall. (2) (Inches)
Embedded Walls SEE 0.070 HWall 0.070 HWall 0.090 HWall
FEE 1.00” 1.00” 1.00” RL-02
Maximum Differential Lateral Displacement longitudinally along the top of the wall. (Inches/50 feet of wall)
All Cut Earth Retaining Structures SEE 2.00” 2.00” 2.00”
FEE <1° <1° <1° Embedded Walls w/Anchors, In-Situ
Reinforced Earth Walls SEE <2° <2° <2° FEE <2° <2° <2°
Late
ral D
ispl
acem
ents
RL-03
Maximum Angle of Rotation (θ) of the ERS Facing from the original constructed ERS facing after lateral displacements have occurred. (Degrees) Embedded Walls
SEE <3° <3° <3°
SC
DO
T G
eotechnical Design M
anual G
EO
TEC
HN
ICA
L PE
RFO
RM
AN
CE
LIMITS
(1) The soil reinforcement length (LReinf) is measured in feet.
Table 10-43, Cut ERS Performance Limits at EE I Limit State
(2) The wall height (HWall) is measured in feet.
August 2008
10-47
SCDOT Geotechnical Design Manual GEOTECHNICAL PERFORMANCE LIMITS
10-48 August 2008
10.10 REFERENCES
The geotechnical information contained in this Manual must be used in conjunction with the SCDOT Seismic Design Specifications for Highway Bridges, SCDOT Bridge Design Manual, and AASHTO LRFD Bridge Design Specifications. The Geotechnical Design Manual will take precedence over all references with respect to geotechnical engineering design. AASHTO LRFD Bridge Design Specifications, U.S. Customary Units, 4th Edition, (2007), American Association of State Highway and Transportation Officials. SCDOT Bridge Design Manual (2006), South Carolina Department of Transportation, http://www.scdot.org/doing/bridge/06design_manual.shtml SCDOT Seismic Design Specifications for Highway Bridges (2008), South Carolina Department of Transportation, http://www.scdot.org/doing/bridge/bridgeseismic.shtml