gis and drought applications keith stellman senior hydrologist lower mississippi river forecast...
Post on 19-Dec-2015
215 views
TRANSCRIPT

GIS and Drought GIS and Drought ApplicationsApplications
Keith StellmanKeith StellmanSenior HydrologistSenior Hydrologist
Lower Mississippi River Forecast CenterLower Mississippi River Forecast CenterSlidell, LASlidell, LA

OutlineOutline
• Overview of CPC products
• History/Background info/Examples
• Validity of the Data
• Gridded Normals?
• Compositing
• Possibilities

Normal CPC Drought GraphicsNormal CPC Drought Graphics
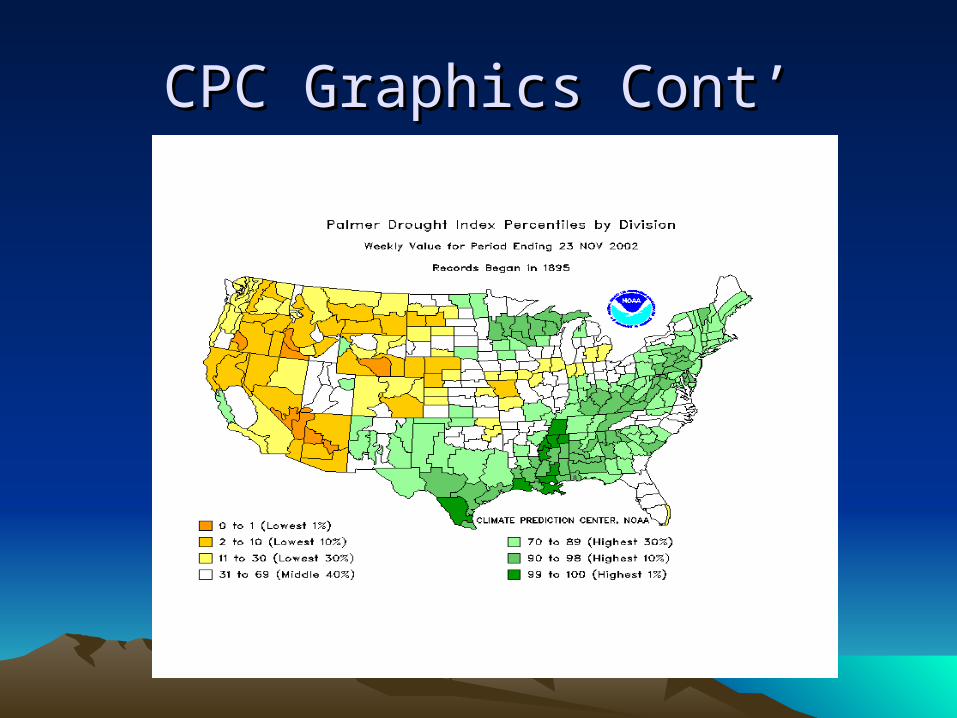
CPC Graphics Cont’CPC Graphics Cont’

CPC Graphics Cont.CPC Graphics Cont.

Overview / HistoryOverview / History• Stage III
– 4 x 4 km resolution– Gridded PRISM data
• ABRFC – Computed daily average from PRISM data– Posted output images to web
• LMRFC– Converted prism grids to HRAP projection in GIS– Computed monthly images on 1st of the month
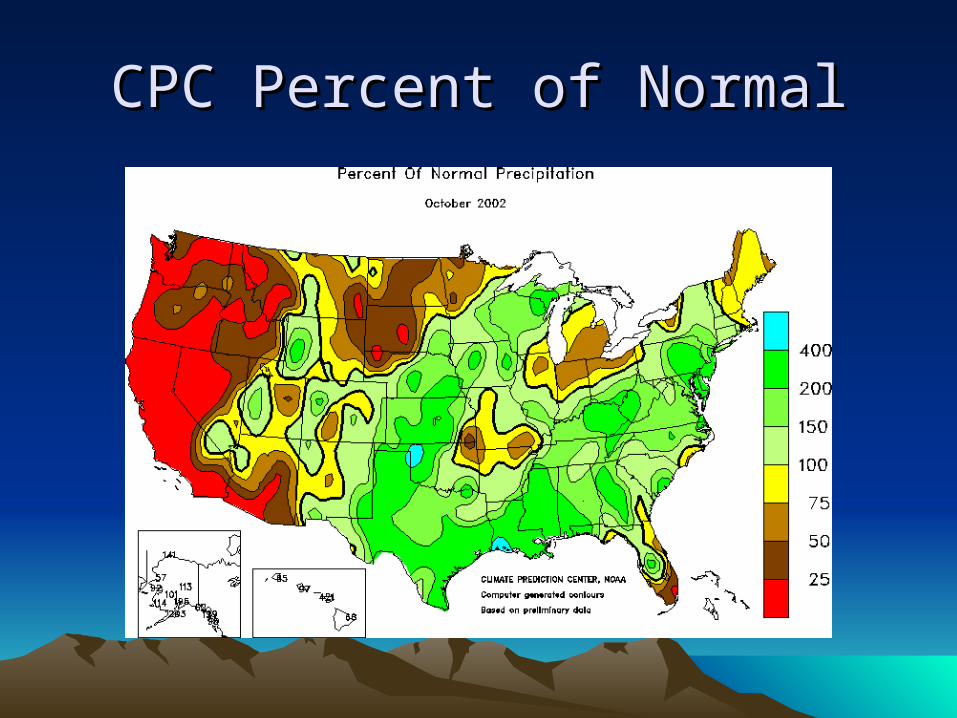
CPC Percent of NormalCPC Percent of Normal

RFC GraphicsRFC Graphics1 Month Stage III1 Month Stage III

RFC GraphicsRFC Graphics

WGRFC/ABRFC/OHRFC WGRFC/ABRFC/OHRFC ExamplesExamples

Detailed RFC ImagesDetailed RFC Images
Details, DetailsDetails, Details
• County to county rainfall surplus/deficits
• Grid to grid comparisons
• Water supply issues from county to county

RFC Observed AnalysisRFC Observed Analysis
• Daily rain gage analysis in GIS using IDW method of interpolation on 4x4 km grid
• Grids are archived
• Grids are summed for monthly totals
• Rain gage analysis can then be used for percent of normal

Observed AnalysisObserved Analysis1 Month Totals1 Month Totals

LMRFC Observed AnalysisLMRFC Observed Analysis

ComparisonsComparisons
Minimums

How Accurate is the Data?How Accurate is the Data?1 month totals for October 20021 month totals for October 2002
ASOS ID Stage III Estimate
Gage Analysis Estimate
ASOS Monthly Total
LCH 21.02 21.45 21.27
LFT 17.43 18.27 18.35
AEX 14.19 12.49 13.37
LIT 5.14 5.09 5.07
MEM 8.49 8.28 8.41
What is Normal?What is Normal?
• PRISM (Parameter-elevation Regressions on Independent Slopes Model)
• Knowledge-based system using point data, digital elevation model, & other spatial data sets
• Generates gridded estimates of climatic parameters (such as precipitation & temperature)
• Accounts for rain shadows, inversions, coastal proximity, and others

Orographic EnhancementOrographic Enhancement

PRISM MapsPRISM Maps
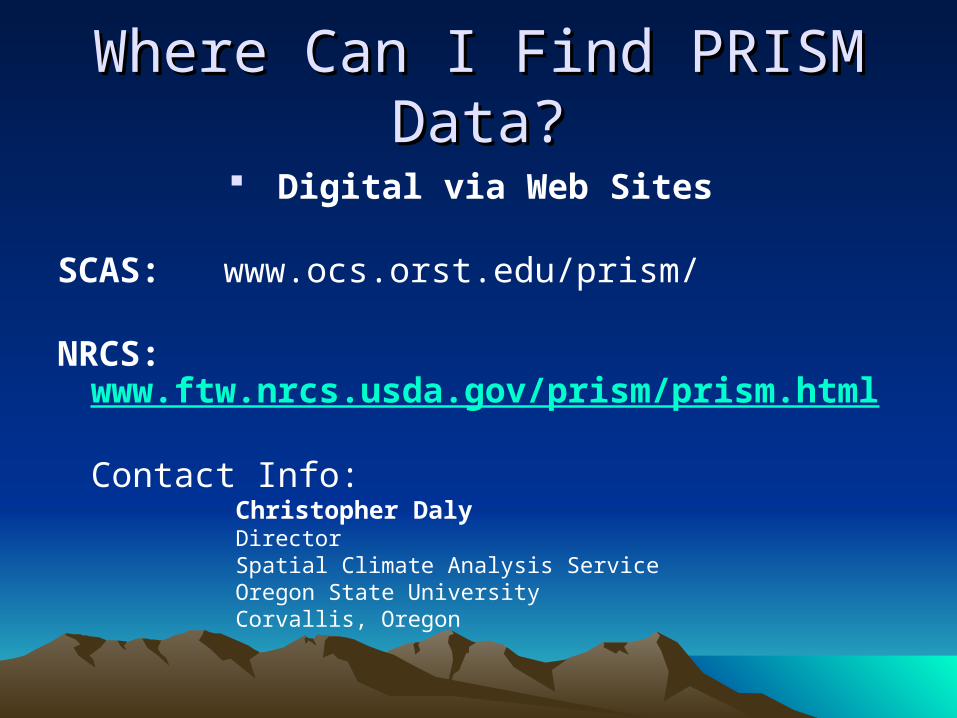
Where Can I Find PRISM Data?Where Can I Find PRISM Data?
Digital via Web Sites
SCAS: www.ocs.orst.edu/prism/
NRCS: www.ftw.nrcs.usda.gov/prism/prism.html
Contact Info:Christopher DalyDirectorSpatial Climate Analysis ServiceOregon State UniversityCorvallis, Oregon

How do we get the resultsHow do we get the results
• PRISM data is on a 4x4 km grid
• Stage III data is on a 4x4 km grid
• ((((StageIII-Prism)/Prism)+1)*100) = % of Normal Precipitation
• GIS Software does grid calculations and exports result as a JPEG
• Program is automatically run on 1st of the month for previous 1,2,3 and 6 months
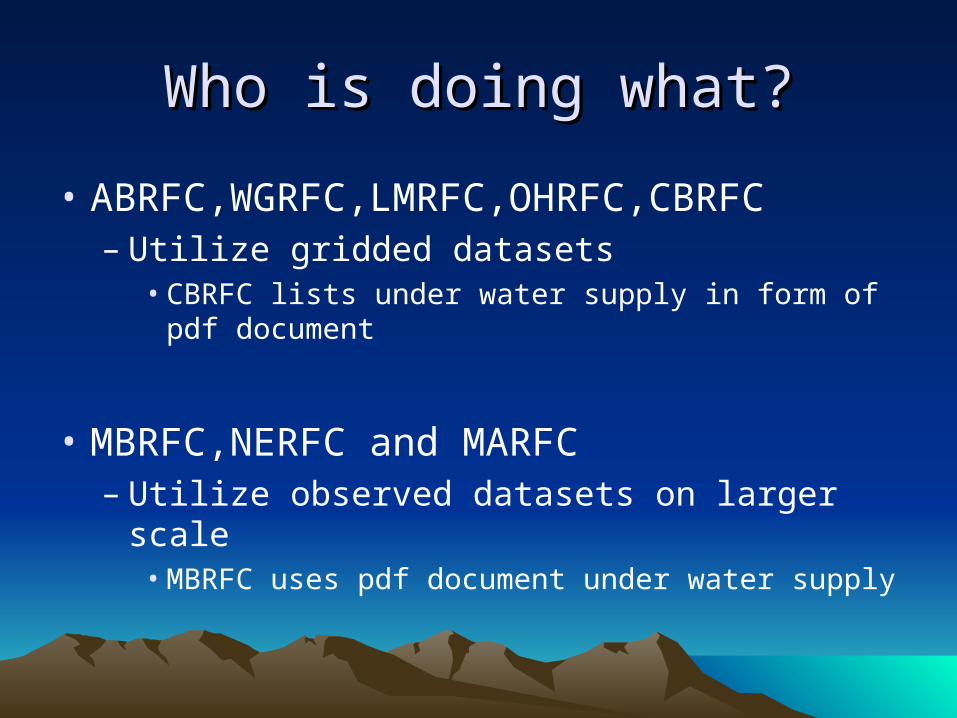
Who is doing what?Who is doing what?
• ABRFC,WGRFC,LMRFC,OHRFC,CBRFC– Utilize gridded datasets
• CBRFC lists under water supply in form of pdf document
• MBRFC,NERFC and MARFC– Utilize observed datasets on larger scale
• MBRFC uses pdf document under water supply

CompositeComposite
• Southern Region RFC Web Team– Goal is to composite graphics with levels of
zoom
• Each SR RFC (SERFC,WGRFC,LMRFC,ABRFC) sends daily StageIII totals to WGRFC
• Data is summed into monthly totals and compared to PRISM data

Coming Very Soon!Coming Very Soon!

Future PossibilitiesFuture Possibilities
• Providing each monthly calculation as a shapefile or ascii grid
• Incorporating more than SR RFC’s into the datasets
• Utilizing gage only datasets across SR