gis ’ s roots in cartography lecture 2 introduction to giss geography 176a department of...
Post on 20-Dec-2015
216 views
TRANSCRIPT

GIS’s Roots in Cartography
Lecture 2
Introduction to GISs
Geography 176A
Department of Geography, UCSB
Summer 06, Session B

Organizing Data and Information
Information can be organized as lists, numbers, tables, text, pictures, maps, or indexes.
Clusters of information called data can be stored together as a database.
A database is stored in a computer as files.

The elements of a GIS. (1) The database (shoebox); (2) the records (baseball cards); (3) the attributes (the categories on the cards, such as batting average, (4) the geographic information (locations of the team’s stadium in latitude and longitude); (5) a means to use the information (the computer).
The Elements of GIS
The GIS Database
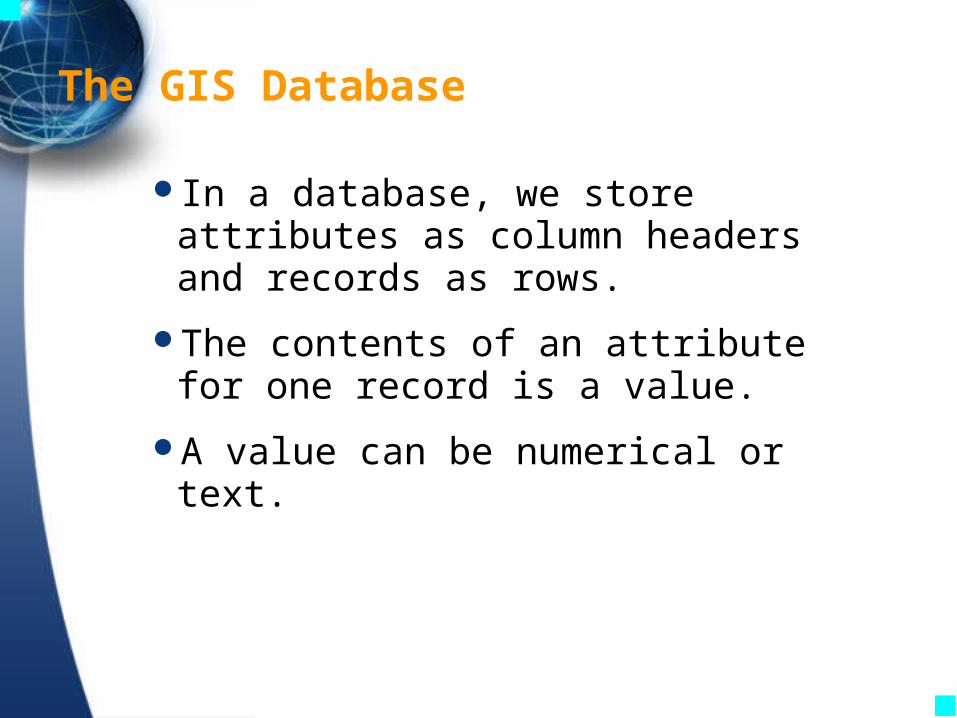
In a database, we store attributes as column headers and records as rows.
The contents of an attribute for one record is a value.
A value can be numerical or text.

Flat File Database
Record 1
Attribute Attribute Attribute
Record 2
Record 3
Value Value Value
Value Value Value
Value Value Value

Attributes have units

The GIS Database (ctd)
Data in a GIS must contain a geographic reference to a map, such as latitude and longitude.
The GIS cross-references the attribute data with the map data, allowing searches based on either or both.
The cross-reference is a link.

Cartography and GIS
Understanding the way maps are encoded to be used in GIS requires knowledge of cartography
Cartography is the science that deals with the construction, use, and principles behind maps
A map is a depiction of all or part of the earth or other geographic phenomenon as a set of symbols and at a scale whose representative fraction is less than one to one

Models of the Earth
The earth can be modeled as a
– sphere, – oblate ellipsoid (“spheroid”)– Geoid– Flat (in Kansas and parts of
Pennsylvania)

Disclaimer: These maps are for entertainment use only! Do not use for navigation purposes!
Equal Time? (Homer, pre 900BC) http://www.ethicalatheist.com/docs/flat_earth_myth_ch8.html
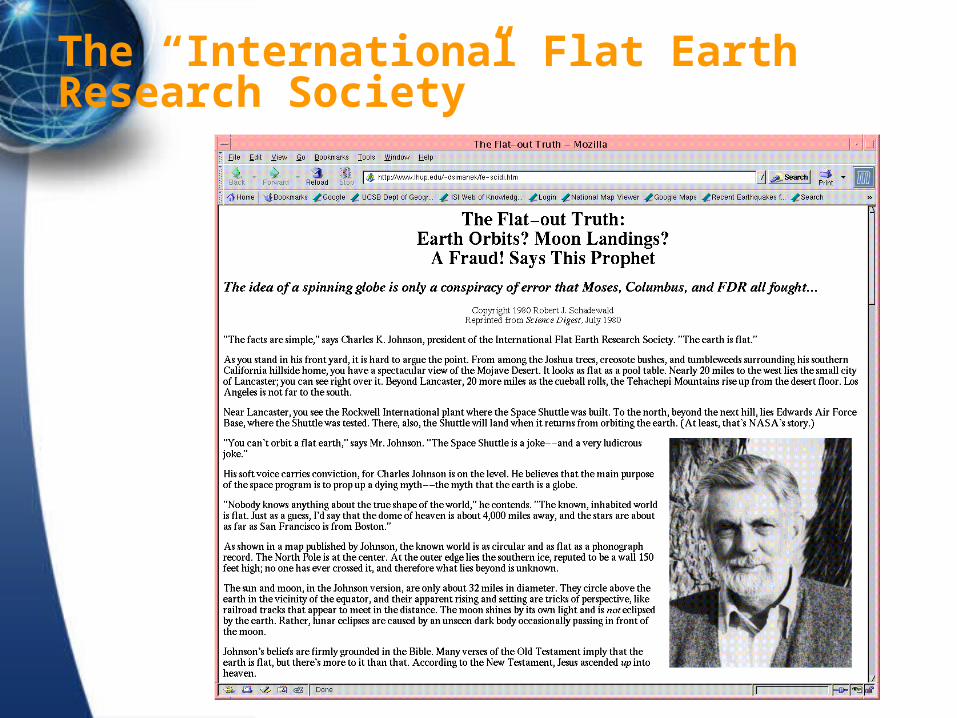
The “International Flat Earth Research Society”
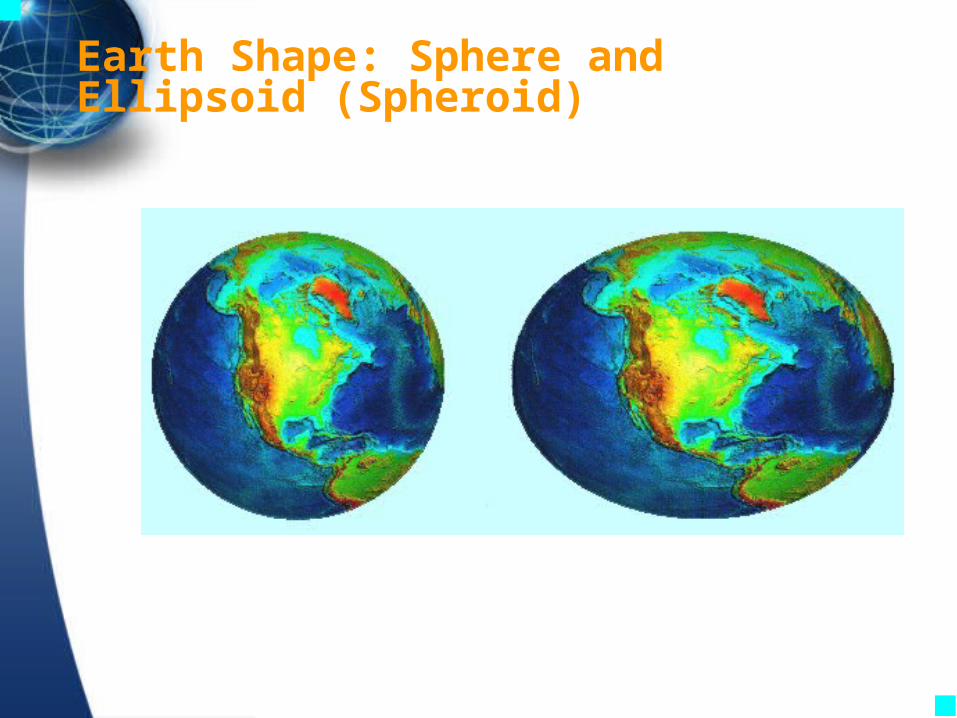
Earth Shape: Sphere and Ellipsoid (Spheroid)

Measuring the Ellipsoid
Oblate ellipsoid predicted by Newton
Existing triangulation in France (Picard-Prolate spheroid)
French Academy of sciences sent expeditions to Lapland and Peru (now in Ecuador) to measure the length of a degree along a meridian
La Condamine sent to Mitad del Mundo, Peru (Equador) (Bouguer, 3 deg.)
Moreau de Maupertuis sent to Tornio River Valley, Finland

Measuring the Ellipsoid (ctd)
Maupertuis reported a meridian degree as 57,437.9 toises (1 toise = 1.949 m)
Meridian degree at Paris was 57,060 toises
Concluded Earth was flatter at poles
Measures were erroneous but conclusions were correct
Published as “La Figure de la Terre” (1738)

La Figure de la Terre (1738)

Earth as Oblate Ellipsoid
Flatter, longer
Curved, shorter

Maupertuis’s Map
River Tornio in modern Finland
14.3 km base line laid out on the ice
Anders Celsius, Swedish physicist, was a member, and had suggested solution by direct measurement

The Spheroid and Ellipsoid
The sphere is about 40 million meters in circumference.
An ellipsoid is an ellipse rotated in three dimensions about its shorter axis.
The earth's ellipsoid is only 1/297 off from a sphere.
Many ellipsoids have been measured, and maps based on each. Examples are WGS84 and GRS80.

Earth as Ellipsoid

Earth Models and Datums
The Datum
An ellipsoid gives the base elevation for mapping, called a datum.
Examples are NAD27 and NAD83.
The geoid is a figure that adjusts the best ellipsoid and the variation of gravity locally.
It is the most accurate, and is used more in geodesy than GIS and cartography.

Geoid

Geoid (exaggerated!)

Map Scale
Map scale is based on the representative fraction, the ratio of a distance on the map to the same distance on the ground.
Most maps in GIS fall between 1:1 million and 1:1000.
A GIS is scaleless because maps can be enlarged and reduced and plotted at many scales other than that of the original data.
To compare or edge-match maps in a GIS, both maps MUST be at the same scale and have the same extent.
The metric system is far easier to use for GIS work.

Scale of a baseball earth
Baseball circumference = 226 mm
Earth circumference approx 40 million meters
RF is : 1:177 million

Length of the Equator at Scale
Rep. Fraction Map Distance Ground Distance
1:400 Million 0.10002 0.328 (3.9 inches)
1:40,000,000 1.0002 3.28
1:1,000,000 40.008 131
1:100,000 400.078 1,312
1:24,000 1,666.99 5,469 (1.036 miles)
1:1,000 40,007.8 131,259 (24.86miles)
Geographic Coordinates

“That it is the opinion of this Congress that it is desirable to adopt a single prime meridian for all nations, in place of the multiplicity of initial meridians which now exist.”
“That the Conference proposes to the Governments here represented the adoption of the meridian passing through the center of the transit instrument at the Observatory of Greenwich as the initial meridian for longitude.”
“That from this meridian longitude shall be counted in twodirections up to 180 degrees, east longitude being plus and west longitude minus.”
The International Meridian Conference (1884: Washington DC)
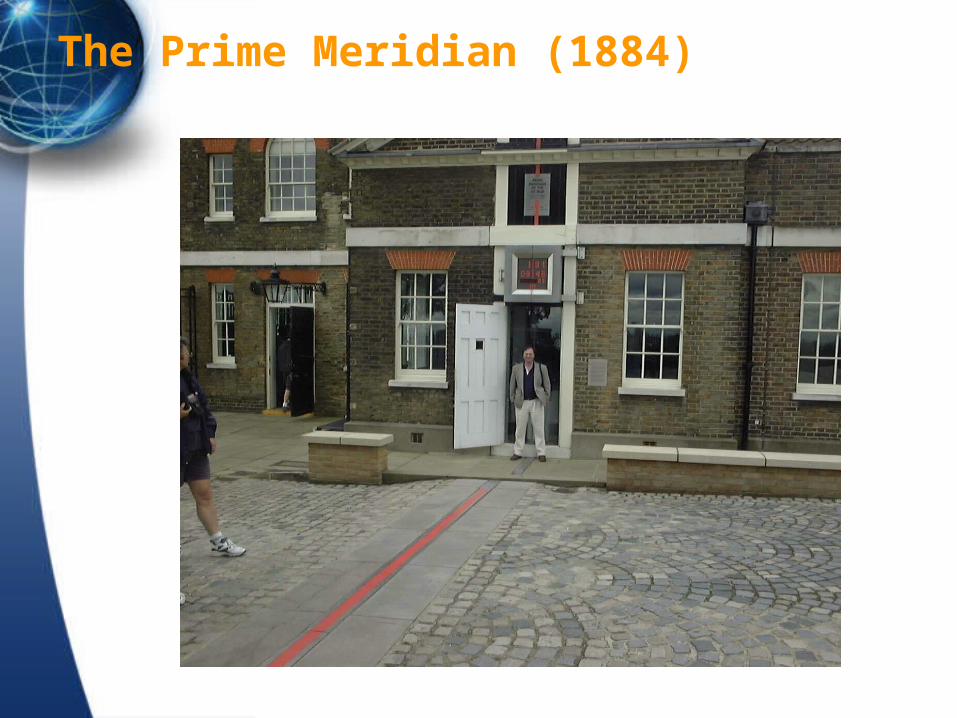
The Prime Meridian (1884)

Geographic Coordinates
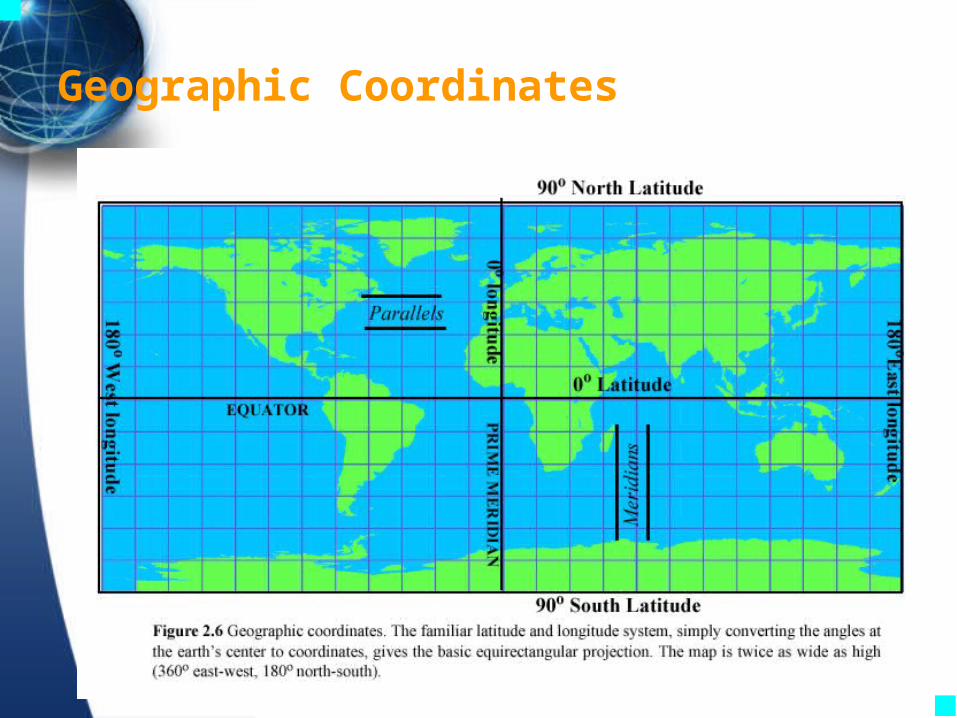
Geographic coordinates are the earth's latitude and longitude system, ranging from 90 degrees south to 90 degrees north in latitude and 180 degrees west to 180 degrees east in longitude.
A line with a constant latitude running east to west is called a parallel.
A line with constant longitude running from the north pole to the south pole is called a meridian.
The zero-longitude meridian is called the prime meridian and passes through Greenwich, England.
A grid of parallels and meridians shown as lines on a map is called a graticule.

Geographic Coordinates as Data
Map Projections
A transformation of the spherical or ellipsoidal earth onto a flat map is called a map projection.
The map projection can be onto a flat surface or a surface that can be made flat by cutting, such as a cylinder or a cone.
If the globe, after scaling, cuts the surface, the projection is called secant. Lines where the cuts take place or where the surface touches the globe have no projection distortion.

Map projections

Standard parallels

Map Projections (ctd)
Projections can be based on axes parallel to the earth's rotation axis (equatorial), at 90 degrees to it (transverse), or at any other angle (oblique).
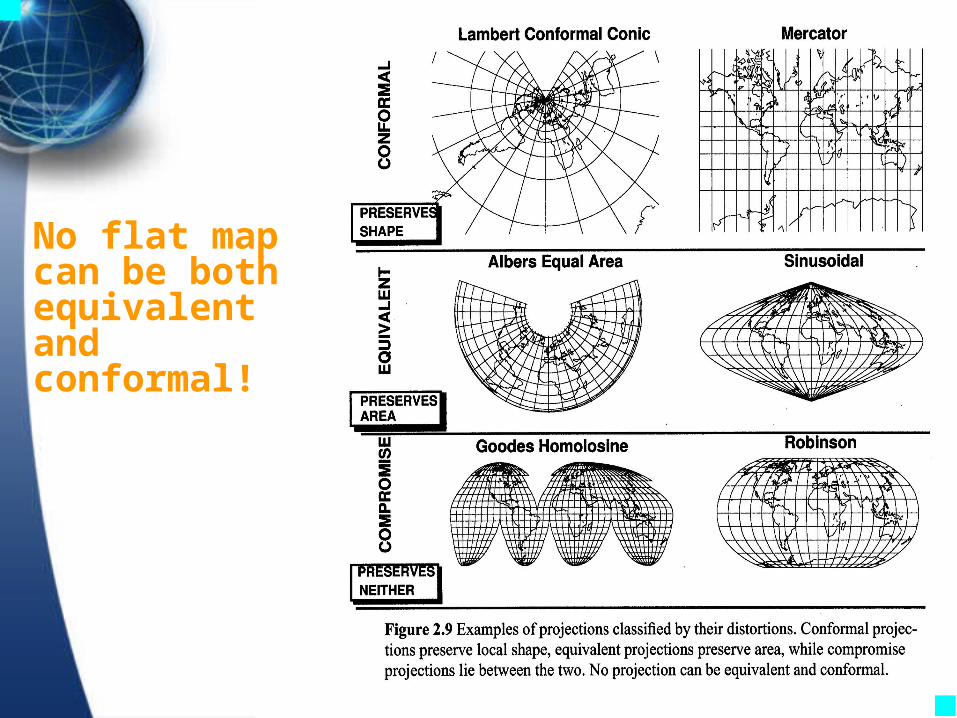
A projection that preserves the shape of features across the map is called conformal.
A projection that preserves the area of a feature across the map is called equal area or equivalent.
No flat map can be both equivalent and conformal. Most fall between the two as compromises.
To compare or edge-match maps in a GIS, both maps MUST be in the same projection.

Secant map projections
Figure 2.9 Variations on the Mercator (pseudocylindrical) projection shown as secant
No flat map can be both equivalent and conformal!

Coordinate Systems
A coordinate system is a standardized method for assigning codes to locations so that locations can be found using the codes alone.
Standardized coordinate systems use absolute locations.
A map captured in the units of the paper sheet on which it is printed is based on relative locations or map millimeters.
In a coordinate system, the x-direction value is the easting and the y-direction value is the northing. Most systems make both values positive.

Coordinate Systems for the US
Some standard coordinate systems used in the United States are
– geographic coordinates– universal transverse Mercator system– military grid– state plane
To compare or edge-match maps in a GIS, both maps MUST be in the same coordinate system.


UTM zones in the lower 48

Military Grid Coordinates

GIS Capability
A GIS package should be able to move between
– map projections, – coordinate systems, – datums, and – ellipsoids.

Geographic information
Characteristics
– volume– dimensionality– continuity

Building complex features
Simple geographic features can be used to build more complex ones.
Areas are made up of lines which are made up of points represented by their coordinates.
Areas = {Lines} = {Points}

Areas are lines are points are coordinates

Properties of Features
size
distribution
pattern
contiguity
neighborhood
shape
scale
orientation.

Basic properties of geographic features
GIS Analysis
Much of GIS analysis and description consists of investigating the properties of geographic features and determining the relationships between them.

Coming next….
Maps as Numbers