glanbia plc annual report/media/files/g/glanbia-plc/documents/... · glanbia plc 3 annual report...
TRANSCRIPT

2010
Glanbia plc Annual Report
Glanbia plc Annual Report 2010

Glanbia plc is an international nutritional solutions and cheese group, headquartered in Ireland. Glanbia is listed on the Irish and London Stock Exchanges (Symbol: GLB). The Group has four segments; US Cheese & Global Nutritionals, Dairy Ireland, Joint Ventures & Associates and Other Business. Including Joint Ventures & Associates, Glanbia has over 4,300 employees worldwide and has manufacturing and processing facilities in seven countries and sales/technical support locations in 14 countries.
Get more online
For more information on the Group please visit our corporate website: www.glanbia.com
This report is also available online: www.glanbia.com/annualreport2010

Divisional performance36 US Cheese & Global Nutritionals38 Dairy Ireland40 Joint Ventures & Associates
36
3Overview3 How we did in 20104 Our performance5 Key Performance Indicators 6 Our global footprint9 How we are structured
10Our strategy10 Our strategy11 Our markets
12Group performance12 Chairman’s statement16 Group Managing Director’s review20 Our business models22 Group Finance Director’s review27 Risk management31 Our responsibilities
42Governance42 Chairman’s introduction to corporate governance44 Board of Directors and senior management48 Applying the principles of the Combined Code54 Other statutory information57 Committee reports – AuditCommitteereport – NominationCommitteereport – RemunerationCommitteereport71 Statement of Director’s responsibilities
72Financial statements74 Independent auditors’ report 76 Group income statement 77 Group statement of comprehensive income 78 Group statement of changes in equity 79 Group statement of financial position 80 Group statement of cash flows 81 Company statement of financial position 82 Company statement of changes in equity 83 Company statement of comprehensive income and
statement of cash flows84Notes to the financial statements
Other information139Shareholders’ information142 Five year trends143 Index
Furtherinformation
This symbol is used throughout the report. It is used to cross reference related information elsewhere within the report.
Pages 3 to 71 make up the Directors’ Report in accordance with the Companies Acts, 1963 to 2009
Glanbia had an excellent year in 2010. We achieved strong revenue and earnings growth and our 2010 performance reflects the strength and diversity of our businesses.
GLANBIA PLC
ANNUAL REPORT 2010 3 DIRECTORS' REPORT:
OVERVIEW
HOW WE DID IN 2010
OUR PERFORMANCE
KEY PERFORMANCE INDICATORS
GLANBIA GLOBAL FOOTPRINT
HOW WE ARE STRUCTURED
FOCUS DELIVERY MOMENTUM
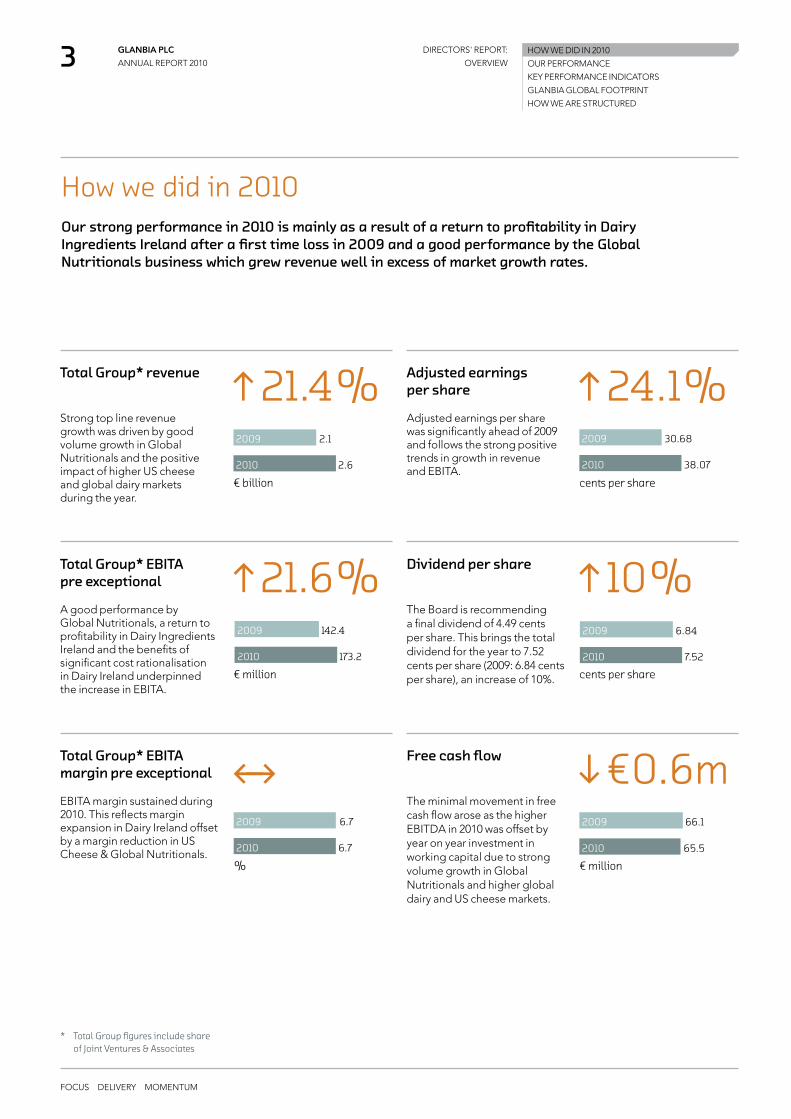
How we did in 2010Our strong performance in 2010 is mainly as a result of a return to profitability in Dairy Ingredients Ireland after a first time loss in 2009 and a good performance by the Global Nutritionals business which grew revenue well in excess of market growth rates.
21.4%Total Group* revenue
Strong top line revenue growth was driven by good volume growth in Global Nutritionals and the positive impact of higher US cheese and global dairy markets during the year.
24.1%Adjusted earnings per share
Adjusted earnings per share was significantly ahead of 2009 and follows the strong positive trends in growth in revenue and EBITA.
21.6%Total Group* EBITA pre exceptional
A good performance by Global Nutritionals, a return to profitability in Dairy Ingredients Ireland and the benefits of significant cost rationalisation in Dairy Ireland underpinned the increase in EBITA.
10%Dividend per share
The Board is recommending a final dividend of 4.49 cents per share. This brings the total dividend for the year to 7.52 cents per share (2009: 6.84 cents per share), an increase of 10%.
Total Group* EBITA margin pre exceptional
EBITA margin sustained during 2010. This reflects margin expansion in Dairy Ireland offset by a margin reduction in US Cheese & Global Nutritionals.
€0.6mFree cash flow
The minimal movement in free cash flow arose as the higher EBITDA in 2010 was offset by year on year investment in working capital due to strong volume growth in Global Nutritionals and higher global dairy and US cheese markets.
2009
2010
2.1
2.6
2009
2010
30.68
38.07
2009
2010
142.4
173.2
2009
2010
6.84
7.52
2009
2010
6.7
6.7
2009
2010
66.1
65.5
€ billion
€ million
%
cents per share
€ million
* Total Group figures include share of Joint Ventures & Associates
cents per share

GLANBIA PLC
ANNUAL REPORT 2010 4 DIRECTORS' REPORT:
OVERVIEW
FOCUS DELIVERY MOMENTUM
HOW WE DID IN 2010
OUR PERFORMANCE
KEY PERFORMANCE INDICATORS
OUR GLOBAL FOOTPRINT
HOW WE ARE STRUCTURED
OurperformanceTheGroupachievedafirstclassoperationalperformancein2010.Keyachievementsfortheyearincludethe40%expansionofSouthwestCheeseintheUSAandthemajorplannedrefurbishmentoftheTwinFallscheeseplantinIdaho;bothdeliveredontimeandonbudget.Inaddition,strategiccostmanagementprogrammesdeliveredtargetedcostsavings,processre-engineeringandproductivitybenefits.
JointVentures&AssociatesGlanbia has three principal international joint ventures – Southwest Cheese in the USA, Glanbia Cheese in the UK and Nutricima in Nigeria – as well as a number of smaller Irish based joint ventures and associates.
DairyIrelandDairy Ireland links the Group’s relationship with its Irish farmer supplier base. Agribusiness produces and supplies inputs to farmers who produce the key raw material for both Dairy Ingredients Ireland and Consumer Products. Dairy Ireland has well invested facilities serving global and local markets.
USCheese&GlobalNutritionalsUS Cheese is one of the leading producers of American-style cheddar cheese for the US and export markets from its large scale manufacturing facilities in Idaho. Global Nutritionals operates from facilities in the USA, Canada, EU and Asia and incorporates the Group’s three nutritionals businesses – Ingredient Technologies, Customised Premix Solutions and Performance Nutrition.
€1 billion revenue
€104.5 million EBITA
10.2% EBITA margin
1,570 employees
13 manufacturing/processing locations
€1.1 billion revenue
€47.9 million EBITA
4.2% EBITA margin
1,682 employees
8 manufacturing/processing locations
€417 million revenue
€21.6 million EBITA
5.2% EBITA margin
1,002 employees
6 manufacturing/processing locations
2010performanceand2011outlook
Businessmodel
36
20
2010performanceand2011outlook
Businessmodel
38
21
2010performance 40
JointVentures&Associates12%
DairyIreland28%
TotalGrouprevenue€billion GroupEBITApreexceptional€million
USCheese&GlobalNutritionals60%
USCheese&GlobalNutritionals40%
Total:€2.6billion Total:€173.2million
JointVentures&Associates16%
DairyIreland44%
FOCUS DELIVERY MOMENTUM
GLANBIA PLC
ANNUAL REPORT 2010 5 DIRECTORS' REPORT:
OVERVIEW
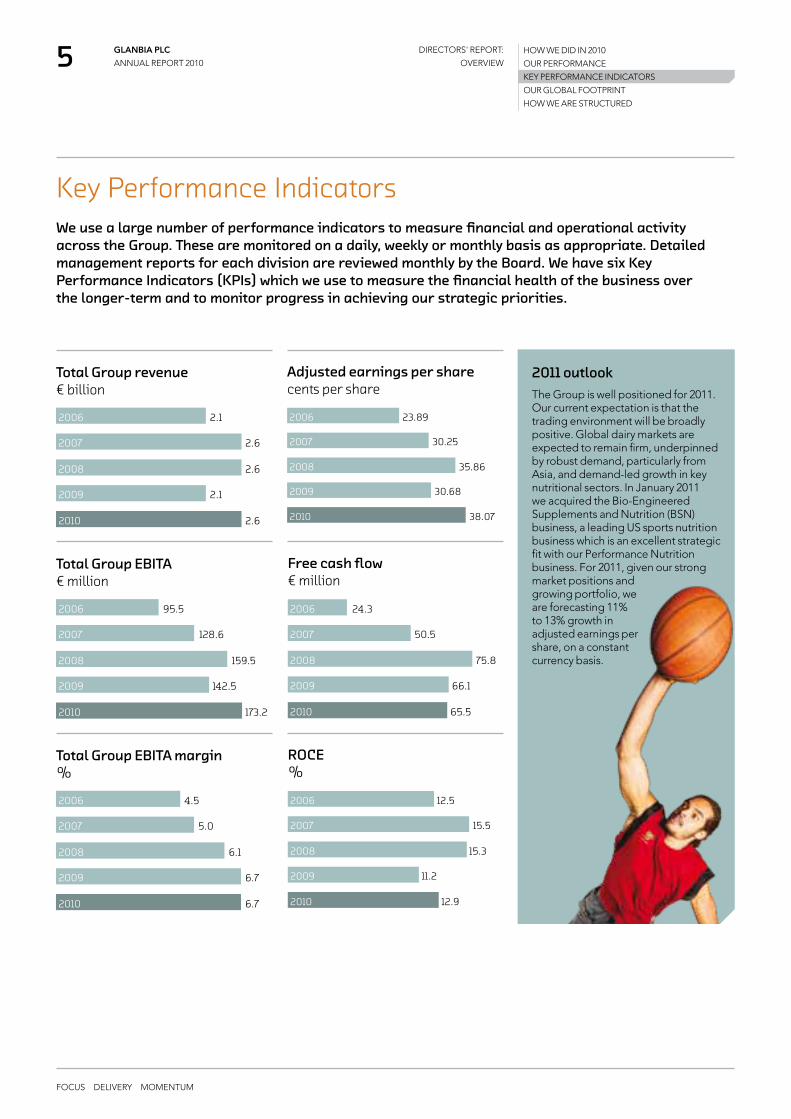
KeyPerformanceIndicatorsWeusealargenumberofperformanceindicatorstomeasurefinancialandoperationalactivityacrosstheGroup.Thesearemonitoredonadaily,weeklyormonthlybasisasappropriate.DetailedmanagementreportsforeachdivisionarereviewedmonthlybytheBoard.WehavesixKeyPerformanceIndicators(KPIs)whichweusetomeasurethefinancialhealthofthebusinessoverthelonger-termandtomonitorprogressinachievingourstrategicpriorities.
2009
2010
2007
2008
2006
38.07
30.68
35.86
30.25
23.89
TotalGrouprevenue€billion
Adjustedearningspersharecentspershare
2009
2010
2007
2008
2006
173.2
142.5
159.5
128.6
95.5
2009
2010
2007
2008
2006
65.5
66.1
75.8
50.5
24.3
TotalGroupEBITA€million
Freecashflow€million
2009
2010
2007
2008
2006
6.7
6.7
6.1
5.0
4.5
2009
2010
2007
2008
2006
12.9
11.2
15.3
15.5
12.5
TotalGroupEBITAmargin%
ROCE%
HOW WE DID IN 2010
OUR PERFORMANCE
KEY PERFORMANCE INDICATORS
OUR GLOBAL FOOTPRINT
HOW WE ARE STRUCTURED
2011outlookThe Group is well positioned for 2011. Our current expectation is that the trading environment will be broadly positive. Global dairy markets are expected to remain firm, underpinned by robust demand, particularly from Asia, and demand-led growth in key nutritional sectors. In January 2011 we acquired the Bio-Engineered Supplements and Nutrition (BSN) business, a leading US sports nutrition business which is an excellent strategic fit with our Performance Nutrition business. For 2011, given our strong market positions and growing portfolio, we are forecasting 11% to 13% growth in adjusted earnings per share, on a constant currency basis.
2009
2010
2007
2008
2006
2.6
2.1
2.6
2.6
2.1

GLANBIA PLC
ANNUAL REPORT 2010 6 DIRECTORS' REPORT:
OVERVIEW
FOCUS DELIVERY MOMENTUM
HOW WE DID IN 2010
OUR PERFORMANCE
KEY PERFORMANCE INDICATORS
OUR GLOBAL FOOTPRINT
HOW WE ARE STRUCTURED
OurglobalfootprintWehaveastrongglobalpresenceinkeyfoodmarketsandsectorsaroundtheworld.TheGrouphasmanufacturingoperationsinsevencountries,salesandtechnicalsupportlocationsin14countriesandourproductsaresoldtoover130countriesworldwide.
Sales/technicalsupportlocations
Manufacturing&processingandsales/technicalsupportlocations
Export/productdistributionlocations
NorthAmerica
LeadingAmerican-stylecheddarcheesebusiness(including50:50jointventure)
LeadingUSsportsnutritionbusiness
Globalsupplierofwheyproteinisolates
Globalsupplierofmicronutrientpremixesandsolutions
LargestNorthAmericanprocessorofspecialityflaxseedingredients
USinnovationcentreandcustomercollaborationcentre
12manufacturing/processinglocations
6salesandtechnicalsupportlocations
1innovationandcustomercollaborationcentre
120+export/distributionmarkets
1,527employees
SouthAmerica
Keyexportmarketsandopportunity:
•PerformanceNutritionproducts
•USCheeseproducts
•DairyIngredientsfromIreland
•Specialityflaxseedingredients
1salesandtechnicalsupportlocation
54employees

FOCUS DELIVERY MOMENTUM
GLANBIA PLC
ANNUAL REPORT 2010 7 DIRECTORS' REPORT:
OVERVIEW
HOW WE DID IN 2010
OUR PERFORMANCE
KEY PERFORMANCE INDICATORS
OUR GLOBAL FOOTPRINT
HOW WE ARE STRUCTURED
Ireland
Glanbiaplcheadoffice
GlobalNutritionalsmainoffice
Groupinnovationcentre
Largestdairyprocessorandcheeseproducer
MarketleadershippositionsacrosstheIrishgrocerymarket
Leadingfeedmilling,grainprocessingandfarminputssupplier
8manufacturing/processinglocations
3salesandtechnicalsupportlocations
1innovationcentre
51Agribusinessbranches
50+exportmarkets
1,870employees
Europe
Globalsupplierofmicronutrientpremixesandsolutions
LeadingEuropeanpizzacheesemanufacturer;50:50jointventure
4manufacturing/processinglocations
5salesandtechnicalsupportlocations
30+export/distributionmarkets
481employees
Africa
Supplierofconsumerdairyproducts;50:50jointventureinNigeria
ExportmarketforDairyIngredientsIreland
2manufacturing/processinglocations
1salesandtechnicalsupportlocation
345employees
AsiaPacific
Keyexportmarketsandgrowthopportunity:
•PerformanceNutritionproducts
•USCheeseproducts
•DairyIngredientsfromIreland
PremixmanufacturingfacilityinSuzhou,China
1manufacturingfacility
5salesandtechnicalsupportlocations
36employees

FOCUS DELIVERY MOMENTUM
GLANBIA PLC
ANNUAL REPORT 2010 8 DIRECTORS' REPORT:
OVERVIEW
HOW WE DID IN 2010
OUR PERFORMANCE
KEY PERFORMANCE INDICATORS
OUR GLOBAL FOOTPRINT
HOW WE ARE STRUCTURED
5.8billionlitresofmilkprocessed9%
477,000tonnesofcheeseproduced8%
262,000tonnesofdairy-basedingredientsmanufactured17%
JointVentures&Associates
USCheese&GlobalNutritionals
DairyIreland
MomentumGlobal Nutritionals is the fastest growing business unit in the Group, driven in particular by the momentum in Performance Nutrition. This was established in 2008 with the acquisition of Optimum Nutrition in the USA and today ON is a leading sports nutrition brand in 20 countries.
JointVentures&Associates
USCheese&GlobalNutritionals
DairyIreland
JointVentures&Associates
USCheese&GlobalNutritionals
DairyIreland
37Performance Nutrition: 2010 performance and 2011 outlook

Howwearestructured
DairyIreland
Businessmodel
Divisionalperformanceandoutlook
DairyIngredientsDairy Ingredients is the largest dairy business in Ireland, processing approximately 25% of the Irish milk pool and 40% of the Irish whey pool.
ConsumerProductsConsumer Products is one of the largest branded food suppliers in the Irish grocery sector.
AgribusinessAgribusiness produces and retails a large range of farm inputs to the Group’s Irish farmer supplier base in Ireland.
USCheeseUS Cheese is a leading producer of American-style cheddar cheese.
IngredientTechnologiesIngredient Technologies is a business-to-business nutritional ingredients solutions development and marketing business.
PerformanceNutritionPerformance Nutrition is a business-to-consumer manufacturer and marketer of performance nutrition and health & wellness products.
CustomisedPremixSolutionsCustomised Premix Solutions is a business-to-business premix (vitamins and minerals) solutions provider.
USCheese&GlobalNutritionals
Businessmodel
Divisionalperformanceandoutlook
JointVentures&Associates
Glanbiahasthreeprincipalinternationaljointventures
Divisionalperformanceandoutlook
SouthwestCheeseSouthwest Cheese operates one of the largest natural American-style cheddar cheese and high-protein whey processing facilities in the USA.
GlanbiaCheeseGlanbia Cheese is a leading supplier of mozzarella cheese for the European pizza market.
NutricimaNutricima is developing a portfolio of branded milk powder-based products for the Nigerian market.
21
38
20
36
40
DIRECTORS' REPORT:
OVERVIEW
GLANBIA PLC
ANNUAL REPORT 2010 9
FOCUS DELIVERY MOMENTUM
HOW WE DID IN 2010
OUR PERFORMANCE
KEY PERFORMANCE INDICATORS
OUR GLOBAL FOOTPRINT
HOW WE ARE STRUCTURED
GLANBIA PLC
ANNUAL REPORT 2010 10 DIRECTORS' REPORT:
OUR STRATEGY
OUR STRATEGY
OUR MARKETS
FOCUS DELIVERY MOMENTUM
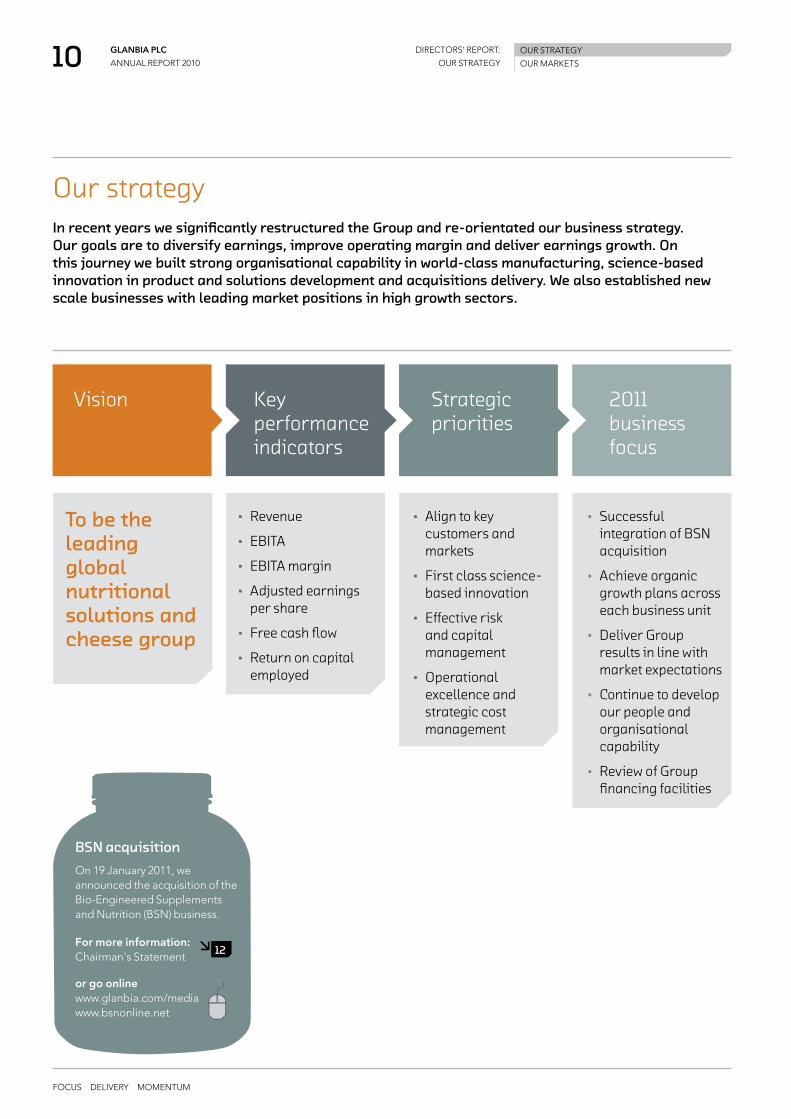
OurstrategyInrecentyearswesignificantlyrestructuredtheGroupandre-orientatedourbusinessstrategy.Ourgoalsaretodiversifyearnings,improveoperatingmarginanddeliverearningsgrowth.Onthisjourneywebuiltstrongorganisationalcapabilityinworld-classmanufacturing,science-basedinnovationinproductandsolutionsdevelopmentandacquisitionsdelivery.Wealsoestablishednewscalebusinesseswithleadingmarketpositionsinhighgrowthsectors.
Vision Keyperformanceindicators
Strategicpriorities
2011businessfocus
Tobetheleadingglobalnutritionalsolutionsandcheesegroup
• Revenue
• EBITA
• EBITAmargin
• Adjustedearningspershare
• Freecashflow
• Returnoncapitalemployed
• Aligntokeycustomersandmarkets
• Firstclassscience-basedinnovation
• Effectiveriskandcapitalmanagement
• Operationalexcellenceandstrategiccostmanagement
• SuccessfulintegrationofBSNacquisition
• Achieveorganicgrowthplansacrosseachbusinessunit
• DeliverGroupresultsinlinewithmarketexpectations
• Continuetodevelopourpeopleandorganisationalcapability
• ReviewofGroupfinancingfacilities
BSNacquisition
On 19 January 2011, we announced the acquisition of the Bio-Engineered Supplements and Nutrition (BSN) business.
For more information:Chairman's Statement
or go onlinewww.glanbia.com/mediawww.bsnonline.net
12
FOCUS DELIVERY MOMENTUM
GLANBIA PLC
ANNUAL REPORT 2010 11 DIRECTORS' REPORT:
OUR STRATEGY
OUR STRATEGY
OUR MARKETS
2010overview
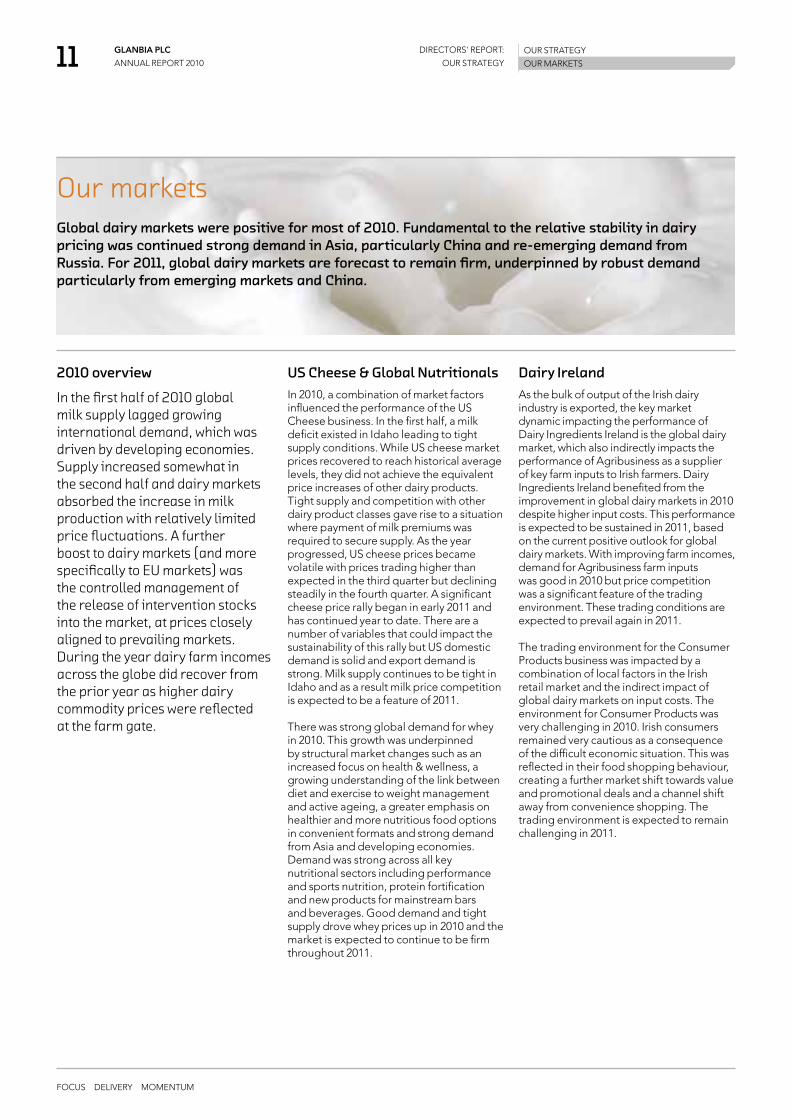
Inthefirsthalfof2010globalmilksupplylaggedgrowinginternationaldemand,whichwasdrivenbydevelopingeconomies.Supplyincreasedsomewhatinthesecondhalfanddairymarketsabsorbedtheincreaseinmilkproductionwithrelativelylimitedpricefluctuations.Afurtherboosttodairymarkets(andmorespecificallytoEUmarkets)wasthecontrolledmanagementofthereleaseofinterventionstocksintothemarket,atpricescloselyalignedtoprevailingmarkets.Duringtheyeardairyfarmincomesacrosstheglobedidrecoverfromtheprioryearashigherdairycommoditypriceswerereflectedatthefarmgate.
USCheese&GlobalNutritionalsIn 2010, a combination of market factors influenced the performance of the US Cheese business. In the first half, a milk deficit existed in Idaho leading to tight supply conditions. While US cheese market prices recovered to reach historical average levels, they did not achieve the equivalent price increases of other dairy products. Tight supply and competition with other dairy product classes gave rise to a situation where payment of milk premiums was required to secure supply. As the year progressed, US cheese prices became volatile with prices trading higher than expected in the third quarter but declining steadily in the fourth quarter. A significant cheese price rally began in early 2011 and has continued year to date. There are a number of variables that could impact the sustainability of this rally but US domestic demand is solid and export demand is strong. Milk supply continues to be tight in Idaho and as a result milk price competition is expected to be a feature of 2011.
There was strong global demand for whey in 2010. This growth was underpinned by structural market changes such as an increased focus on health & wellness, a growing understanding of the link between diet and exercise to weight management and active ageing, a greater emphasis on healthier and more nutritious food options in convenient formats and strong demand from Asia and developing economies. Demand was strong across all key nutritional sectors including performance and sports nutrition, protein fortification and new products for mainstream bars and beverages. Good demand and tight supply drove whey prices up in 2010 and the market is expected to continue to be firm throughout 2011.
DairyIrelandAs the bulk of output of the Irish dairy industry is exported, the key market dynamic impacting the performance of Dairy Ingredients Ireland is the global dairy market, which also indirectly impacts the performance of Agribusiness as a supplier of key farm inputs to Irish farmers. Dairy Ingredients Ireland benefited from the improvement in global dairy markets in 2010 despite higher input costs. This performance is expected to be sustained in 2011, based on the current positive outlook for global dairy markets. With improving farm incomes, demand for Agribusiness farm inputs was good in 2010 but price competition was a significant feature of the trading environment. These trading conditions are expected to prevail again in 2011.
The trading environment for the Consumer Products business was impacted by a combination of local factors in the Irish retail market and the indirect impact of global dairy markets on input costs. The environment for Consumer Products was very challenging in 2010. Irish consumers remained very cautious as a consequence of the difficult economic situation. This was reflected in their food shopping behaviour, creating a further market shift towards value and promotional deals and a channel shift away from convenience shopping. The trading environment is expected to remain challenging in 2011.
OurmarketsGlobaldairymarketswerepositiveformostof2010.FundamentaltotherelativestabilityindairypricingwascontinuedstrongdemandinAsia,particularlyChinaandre-emergingdemandfromRussia.For2011,globaldairymarketsareforecasttoremainfirm,underpinnedbyrobustdemandparticularlyfromemergingmarketsandChina.

GLANBIA PLC
ANNUAL REPORT 2010 12 DIRECTORS' REPORT:
GROUP PERFORMANCE
FOCUS DELIVERY MOMENTUM
Adjusted earnings per share increased 24.1% to 38.07 cents per share (2009: 30.68 cents per share) driven mainly by the improved performance of Dairy Ingredients Ireland and strong organic revenue growth in Global Nutritionals.
Glanbia has a 10 year record of steady dividend increases and the Group continued its progressive dividend policy in 2010 with a 10% increase in total dividend for the year, compared with a 5% increase in 2009.
The Board is recommending a final dividend of 4.49 cents per share (2009: final dividend 3.95 cents per share). This brings the total dividend for the year to 7.52 cents per share (2009: 6.84 cents per share).
Subject to approval at the Annual General Meeting (AGM) dividends will be paid on 20 May 2011 to shareholders on the register of members as at 8 April 2011. Irish withholding tax will be deducted at the standard rate where appropriate.
The Group will hold its AGM on Wednesday, 11 May 2011 in Lyrath Estate Hotel, Kilkenny. On the same day Glanbia will issue an Interim Management Statement in accordance with the reporting requirements of the EU Transparency Directive.
Chairman'sstatement
“�While�our�2010�results�clearly�benefited�from�a�more�favourable�trading�environment�compared�with�a�very�difficult�2009,�they�also�reflect�a�very�strong�operational�performance�across�the�Group.”�
LiamHerlihyChairman
Resultsanddividends
Glanbiahadanexcellentyearin2010.ThekeycharacteristicsunderpinningtheGroup’sstrongperformancewereawelcomerecoveryinglobaldairymarketsafteranunprecedented2009andgooddemandinkeynutritionalmarkets.Overallwedeliveredgoodgrowthinrevenueandearnings.
Total Group EBITA analysis
CHAIRMAN’S STATEMENT
GROUP MANAGING DIRECTOR’S REVIEW
OUR BUSINESS MODELS
GROUP FINANCE DIRECTOR’S REVIEW
RISK MANAGEMENT
OUR RESPONSIBILITIES
0
20
40
60
80
100
120
140
160
180
Recovery in pricing for Dairy Ingredients Ireland
Cost savings in Dairy Ireland
Volume growth in Global Nutritionals
Higher milk costs
Higher operating costs in US Cheese & Global Nutritionals – investment in resources (people, services, brand)
Price competition in Consumer Products
€142.4m
2009 2010
€173.2m
€ m
illio
n
21.6%

FOCUS DELIVERY MOMENTUM
GLANBIA PLC
ANNUAL REPORT 2010 13 DIRECTORS' REPORT:
GROUP PERFORMANCE
Board changesThere were a number of Board changes during the year. John Fitzgerald retired as a non-executive Director and vice-Chairman of the Board. He was replaced by Brendan Hayes as a member of the Board. Martin Keane was elected vice-Chairman of the Board. Christopher Hill and Nicholas Dunphy also retired this year as non-executive Directors and were replaced by John Murphy and Michael Keane. All appointments and retirements to the Board were made on 29 June 2010. I would like to thank retiring Board members for their contribution to Glanbia and to welcome Brendan, Michael and John to the Glanbia Board and wish them every success.
Proposed disposal of the Irish Dairy and Agri businessesFollowing an approach from Glanbia Co-operative Society Limited (“the Society”), the Group’s 54.5% shareholder, on 20 April 2010, Glanbia announced a proposal to dispose of its Irish Dairy and Agri businesses to the Society.
The transaction was conditional in the first instance upon the approval of the members of the Society. At a special general meeting on 10 May 2010 the required approval of the Society members was not achieved and therefore the transaction did not proceed. It is important to stress that neither the Society nor the Board and management undertook this process lightly. While the outcome was a disappointment, it is gratifying to see that as the transaction was
progressing it was business as usual for the Group and the proposal was addressed without impacting business performance for the year.
Glanbia believes that this project is unlikely to be re-visited by the Society in the medium term. The significant improvement in global dairy markets has shifted the focus of Society members to dairy expansion opportunities in a post EU milk quota environment in 2015.
38.07
2009
2010
30.68
Adjusted earnings per share
24.1%2009
2010
6.84
7.52
Total dividend per share
10%Full details of the Group’s performance
Group Managing Director’s review
Finance Director’s review
Divisional performance
16
22
36
CHAIRMAN’S STATEMENT
GROUP MANAGING DIRECTOR’S REVIEW
OUR BUSINESS MODELS
GROUP FINANCE DIRECTOR’S REVIEW
RISK MANAGEMENT
OUR RESPONSIBILITIES
cents per share cents per share
Customer collaboration centre
In 2009, Global Nutritionals opened a customer collaboration centre in Idaho, USA to support the activities of the Group's main innovation centre in Ireland. This centre comprises a full-scale applications laboratory for beverages and bars and a processing laboratory and separate facilities to run bench-top experiments such as blending and texture analysis. The centre allows us to work side-by-side with customers to develop nutritional solutions and is a great catalyst for exploring and acting on new product concepts. Collaboration has already contributed to building joint development plans with key customers, supporting business growth.

GLANBIA PLC
ANNUAL REPORT 2010 14 DIRECTORS' REPORT:
GROUP PERFORMANCE
FOCUS DELIVERY MOMENTUM
Southwest Cheese, USA Along with acquisition capability, the development of our Southwest Cheese joint venture is another strong example of one of the Group’s core competencies. In 2004, we formed a 50:50 joint venture partnership with The Greater Southwest Agency. The structure of this partnership is that Glanbia built the plant and is responsible for running the business and selling the cheese and whey products manufactured, while our partner ensures that the facility has a secure milk supply. In 2005 and 2006 a $200 million plant was built and commissioned on time and on budget by the Glanbia team. In 2007 and 2008 production ramped-up to full capacity. During 2009 and 2010 a 40% expansion of production capacity, costing $90 million was approved, built and fully commissioned by Glanbia; again on time and on budget. Southwest Cheese is now one of the largest cheese and high protein whey processing facilities in the USA; processing approximately 4.6 million litres of milk per day and producing approximately 500 tonnes of cheese per day.
CHAIRMAN’S STATEMENT
GROUP MANAGING DIRECTOR’S REVIEW
OUR BUSINESS MODELS
GROUP FINANCE DIRECTOR’S REVIEW
RISK MANAGEMENT
OUR RESPONSIBILITIES
Events since year-end
Acquisition of Bio-Engineered Supplements and Nutrition (BSN)
On 19 January 2011, Glanbia announced the acquisition of the BSN business for a total consideration of $144 million (€108 million). BSN significantly enhances and extends Glanbia’s Performance Nutrition portfolio and continues to develop Glanbia in line with its growth strategy. The business was acquired on a debt free basis
and was funded through Glanbia’s existing banking facilities. BSN is a leading developer, provider and distributor of nutritional products and builds on the Group’s scale position in the attractive, high growth, higher margin, sports nutrition sector. The integration of this business is progressing well and it is expected to be earnings enhancing in 2011.

FOCUS DELIVERY MOMENTUM
GLANBIA PLC
ANNUAL REPORT 2010 15 DIRECTORS' REPORT:
GROUP PERFORMANCE
US Cheese, including Southwest Cheese, won 11 medals at the US Cheese Championships, including four gold medals.
Pictured left to right: Dave Perry, Rudy Jozelic, John Lanigan, Tim Hesby, Jake Dorman and Oscar Salinas.
US Cheese awards A selection of our 2010 awardsAcross the Group, we won a number of prestigious awards during the year:
• Dairy Ingredients Ireland was recognised as ‘Innovation Exporter of the Year’ by the Irish Exporters Association for its successful commercialisation of the specialist milk protein product Solmiko;
• Consumer Products was the first Irish business to be awarded a multi-site award for IS 16001 energy management;
• Glanbia Ingredient Technologies was voted best overall supplier in the category of whey by Food Processing magazine readers and the best overall supplier of whey protein and hydrolysates by Wellness Food magazine readers; establishing the business as the preeminent supplier in this category; and
• Performance Nutrition, through its ON brand, won four prestigious industry awards for best protein powder, best supplement, best new supplement and best brand.
OutlookThe Group is well positioned for 2011. Our current expectation is that the trading environment for 2011 will be broadly positive. Global dairy markets are expected to remain firm, underpinned by robust demand, particularly from Asia, and demand-led growth in key nutritional sectors. In January 2011 we acquired BSN, a leading US sports nutrition business which is an excellent strategic fit with our Performance Nutrition business. For 2011, given our strong market positions and growing portfolio, we are forecasting 11% to 13% growth in adjusted earnings per share, on a constant currency basis.
Committed to good governance
Glanbia’s strong commitment to high standards of conduct and good governance is set out in the corporate governance section of this report. This year we made a number of enhancements to increase transparency and improve shareholder understanding of the Group. Enhancements include more detail on our governance and risk framework and enhanced Committee reports.
Key governance milestones for 2010 include;
• Independent process with good governance structures in place to review and progress the proposal by Glanbia Co-operative Society Limited to acquire the Group’s Irish Dairy and Agri businesses, and post the conclusion of this process demonstrating that Glanbia is a strong organisation, ensuring all parties are fully committed to driving the business forward for all stakeholders;
• Detailed review of all US businesses and site visits to US Cheese in Idaho, Performance Nutrition in Chicago and the Southwest Cheese joint venture in New Mexico;
• Approval of the 2011-2013 business plan and objectives; and
• Continuing to develop Glanbia in line with the Group’s growth strategy through progression of a strategic acquisition in Performance Nutrition finalised in January 2011.
The Board’s 2011 objectives and targets are set out in the section: Chairman's introduction to corporate governance.
For more information see corporate governance
Governance highlights
42
Liam HerlihyChairman
CHAIRMAN’S STATEMENT
GROUP MANAGING DIRECTOR’S REVIEW
OUR BUSINESS MODELS
GROUP FINANCE DIRECTOR’S REVIEW
RISK MANAGEMENT
OUR RESPONSIBILITIES
Further information
32
Our responsibilities
GLANBIA PLC
ANNUAL REPORT 2010 16 DIRECTORS' REPORT:
GROUP PERFORMANCE
FOCUS DELIVERY MOMENTUM
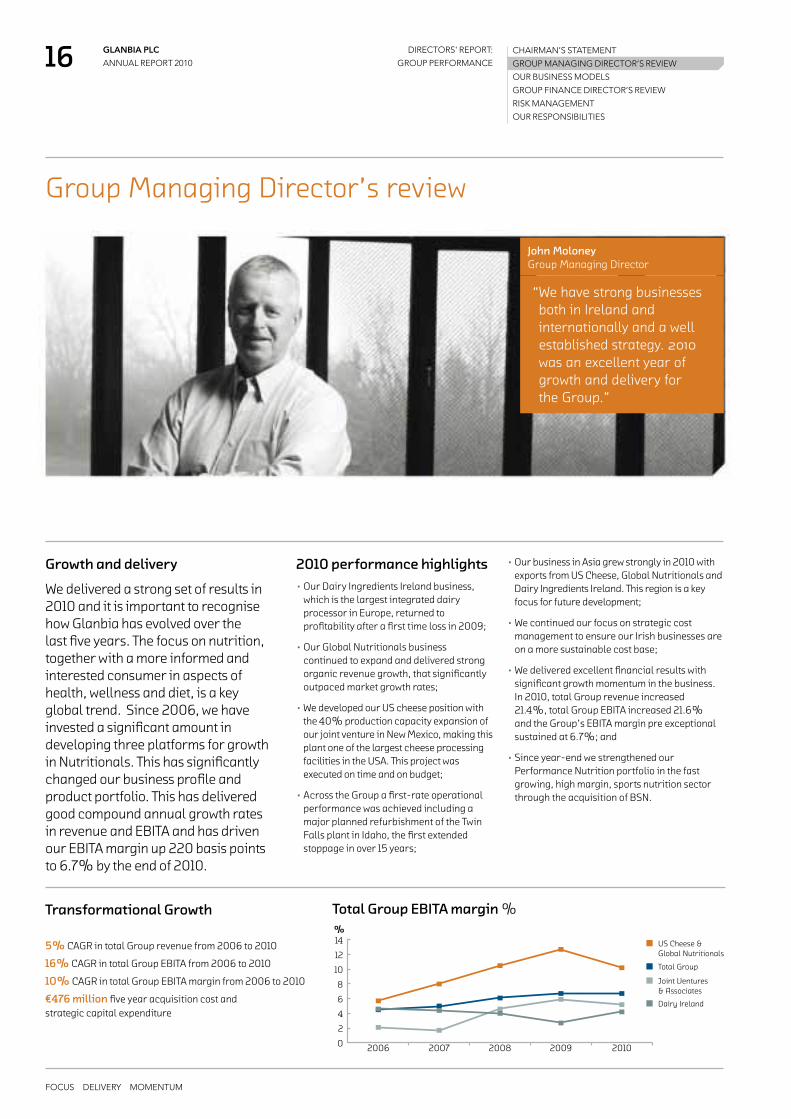
Growth and delivery
We delivered a strong set of results in 2010 and it is important to recognise how Glanbia has evolved over the last five years. The focus on nutrition, together with a more informed and interested consumer in aspects of health, wellness and diet, is a key global trend. Since 2006, we have invested a significant amount in developing three platforms for growth in Nutritionals. This has significantly changed our business profile and product portfolio. This has delivered good compound annual growth rates in revenue and EBITA and has driven our EBITA margin up 220 basis points to 6.7% by the end of 2010.
Group Managing Director’s review
2010 performance highlights• Our Dairy Ingredients Ireland business,
which is the largest integrated dairy processor in Europe, returned to profitability after a first time loss in 2009;
• Our Global Nutritionals business continued to expand and delivered strong organic revenue growth, that significantly outpaced market growth rates;
• We developed our US cheese position with the 40% production capacity expansion of our joint venture in New Mexico, making this plant one of the largest cheese processing facilities in the USA. This project was executed on time and on budget;
• Across the Group a first-rate operational performance was achieved including a major planned refurbishment of the Twin Falls plant in Idaho, the first extended stoppage in over 15 years;
• Our business in Asia grew strongly in 2010 with exports from US Cheese, Global Nutritionals and Dairy Ingredients Ireland. This region is a key focus for future development;
• We continued our focus on strategic cost management to ensure our Irish businesses are on a more sustainable cost base;
• We delivered excellent financial results with significant growth momentum in the business. In 2010, total Group revenue increased 21.4%, total Group EBITA increased 21.6% and the Group’s EBITA margin pre exceptional sustained at 6.7%; and
• Since year-end we strengthened our Performance Nutrition portfolio in the fast growing, high margin, sports nutrition sector through the acquisition of BSN.
0
2
4
6
8
10
12
14
2006 2007 2008 2009 2010
US Cheese & Global Nutritionals
Total Group
Joint Ventures & Associates
Dairy Ireland
%
Transformational Growth
5% CAGR in total Group revenue from 2006 to 2010
16% CAGR in total Group EBITA from 2006 to 2010
10% CAGR in total Group EBITA margin from 2006 to 2010
€476 million five year acquisition cost and strategic capital expenditure
Total Group EBITA margin %
CHAIRMAN’S STATEMENT
GROUP MANAGING DIRECTOR’S REVIEW
OUR BUSINESS MODELS
GROUP FINANCE DIRECTOR’S REVIEW
RISK MANAGEMENT
OUR RESPONSIBILITIES
John MoloneyGroup Managing Director
“�We�have�strong�businesses�both�in�Ireland�and�internationally�and�a�well�established�strategy.�2010�was�an�excellent�year�of�growth�and�delivery�for�the�Group.”�

FOCUS DELIVERY MOMENTUM
GLANBIA PLC
ANNUAL REPORT 2010 17 DIRECTORS' REPORT:
GROUP PERFORMANCE
The Glanbia teamThe quality of our people continues to be a core strength for Glanbia and I am delighted that we have further enhanced our capabilities in many parts of our business. In 2010, we invested in operations and supply chain management, marketing, research and development, enhanced technical services for customers and risk management services to suppliers.
We also instigated a series of changes to the leadership organisation across the Group. This included the formation of a Group Operating Executive which includes the Office of the Group Managing Director and executive Directors, with support from Group Secretariat and Group Human Resources and Operations Development.
The Group Management Committee brings together Chief Executive Officers from the business units as well as the Group Operating Executive.
The Group Senior Leadership Team includes the Group’s Operating Executive and Management Committee and business unit senior management teams and Group function heads. This brings together experienced senior leadership from across the Group to drive the business forward to achieve our vision and strategic objectives.
Our 2010 results were excellent. This is due to the strong performance of management and all our employees who have been building the Glanbia business year by year. In 2010, everyone worked extremely hard and gave enormous commitment to the Group. I would like to thank them for their skill and effort.
Proposed disposal of the Irish Dairy and Agri businessesThis time last year the Group was reviewing the proposal of Glanbia Co-operative Society Limited (“the Society”) to acquire our Irish Dairy and Agri businesses. This transaction did not proceed as it did not receive the required approval of Society members. This was a disappointing outcome at the time, however, our performance this year clearly demonstrates that Glanbia is a strong organisation with excellent businesses both in Ireland and internationally. We have a well established strategy that continues to deliver growth and opportunity.
42
Governance and risk framework
Further information
32
Our responsibilities
38
Dairy Ireland
CHAIRMAN’S STATEMENT
GROUP MANAGING DIRECTOR’S REVIEW
OUR BUSINESS MODELS
GROUP FINANCE DIRECTOR’S REVIEW
RISK MANAGEMENT
OUR RESPONSIBILITIES
The Group’s main innovation centre, is in Ireland. We have a second innovation and customer collaboration centre in the USA and both offer key strategic points of differentiation in areas such as:
• New ingredient development in protein solutions and mineral premixes;
• Nutrient profiling through scientific analysis;
• Applications research in nutritional bars, Ready-to-Drink beverages, Ready-to-Mix beverages and product prototypes;
• Clinical research into muscle physiology, bone health, weight management, immune health and vascular health; and
• Intellectual property where we develop patented technology to protect nutritional and functional research discoveries.
Innovation

GLANBIA PLC
ANNUAL REPORT 2010 18 DIRECTORS' REPORT:
GROUP PERFORMANCE
FOCUS DELIVERY MOMENTUM
Glanbia is a member of the US Dairy Sustainability Committee set up by the Innovation Centre for US Dairy. The Committee’s objective is to show industry stakeholders and interested parties progress towards the goal of ‘reducing greenhouse gas emissions (GHG) for fluid milk by 25% by the year 2020’. More than 500 dairy stakeholders – including environmental, academic and scientific experts are working on 10 projects that aim to capitalise on opportunities for efficiency and innovation across the value chain which will help to reduce emissions and build real business value.
Energy management is one example which aims to reduce energy use and GHG emissions on farms, in processing plants and in the transport and distribution of milk and dairy products. Research is also being focused on reducing GHG emissions in areas such as feed production, packaging and processing. We are working to ensure that Glanbia is engaged with industry effort and this is how we can have the greatest impact on helping to reduce the carbon footprint of dairy products in the USA.
Further information: US Cheese & Global Nutritionals
US Dairy Sustainability Committee
Download the report at www.usdairy.com/sustainability
36
CHAIRMAN’S STATEMENT
GROUP MANAGING DIRECTOR’S REVIEW
OUR BUSINESS MODELS
GROUP FINANCE DIRECTOR’S REVIEW
RISK MANAGEMENT
OUR RESPONSIBILITIES

FOCUS DELIVERY MOMENTUM
GLANBIA PLC
ANNUAL REPORT 2010 19 DIRECTORS' REPORT:
GROUP PERFORMANCE
Consumer Products supply chain has won a prestigious environmental award from the Irish Chartered Institute of Transport and Logistics. This peer reviewed award is in recognition of the work conducted on implementing a best in class transport routing and scheduling system in the chilled distribution business. It is a world class system that takes customer requirements, adds in any over-riding delivery constraints and optimises the transport costs via construction of logical routes.
This award recognises the positive impact on carbon emissions that optimal routes and schedules can play in reducing carbon footprint. The green agenda is now part of Consumer Products corporate and social responsibility policy. Consumer Products also made the final nominations in the category of “Supply Chain Integration” for their work on network modelling.
Our strategyGlanbia is organised around two different business models, one for the US Cheese & Global Nutritionals division and one for the Dairy Ireland division. These business models are strategically aligned to and strengthened by our key joint ventures in the USA, the UK and Nigeria. In this report we have set out our group strategy, our KPIs, our business models and our business priorities in 2011.
Maximising our performance and delivering our strategic objectives requires us to allocate our resources, people and capital to business segments where the growth potential and capability to deliver is greatest. For Glanbia this means driving the Global Nutritionals business forward and this is at the core of our growth strategy. We have successfully developed our Global Nutritionals business in the last five years through organic growth and acquisition. Our objective this year is to integrate BSN into our Performance Nutrition business and drive the ON and BSN brands forward, particularly internationally. On a proforma 2010 basis, including the acquisition of BSN, Global Nutritionals now represents approximately 23% of total Group revenue, inclusive of Joint Ventures & Associates. It is a scale business, with well developed science-based innovation capability and leading market positions.
In our US Cheese business, combined with our Southwest Cheese joint venture, we have world class capability in cheese processing and are one of the largest manufacturers of American-style cheddar cheese in the USA, processing 3.6 billion litres of milk and producing 379,000 tonnes of cheese in 2010. Our cheese business gives us access to a large, high quality whey pool, which underpins our Ingredient Technologies business within Global Nutritionals.
In addition, we have substantial businesses in Ireland, which are operationally excellent and well invested. We have leading brands in our Consumer Products and Agribusiness portfolios. Through disciplined strategic cost saving programmes in recent years we have put the Dairy Ireland division on a more sustainable and competitive cost base. This is vital as our Dairy Ingredients Ireland business exports to more than 50 countries world-wide. Within Dairy Ireland there is considerable work underway to assess the potential of milk output expansion which can occur when EU milk quotas are eliminated in 2015. It is early days in this process but opportunities do exist for business growth and development.
SummaryOur strategy is clear and consistent. It is to deliver attractive and growing returns to shareholders, excellent solutions and service to our customers, value adding routes to market for our milk suppliers and to provide rewarding careers to our employees.
We have growth opportunities across our portfolio, particularly in our US Cheese & Global Nutritionals division. We have great people and a range of competencies that ensure we are well positioned to continue to grow and develop the Group. We look forward to the future with confidence.
Consumer Products logistics award
Further information
Our strategy
Our business models
10
20
John MoloneyGroup Managing Director
CHAIRMAN’S STATEMENT
GROUP MANAGING DIRECTOR’S REVIEW
OUR BUSINESS MODELS
GROUP FINANCE DIRECTOR’S REVIEW
RISK MANAGEMENT
OUR RESPONSIBILITIES

GLANBIA PLC
ANNUAL REPORT 2010 20 DIRECTORS' REPORT:
GROUP PERFORMANCE
FOCUS DELIVERY MOMENTUM
Glanbia’s US Cheese & Global Nutritionals business model incorporates cheese and nutritional solutions. US Cheese is a business-to-business, large scale, low cost, world-class producer that we operate 24/7, 365 days of the year. US Cheese has a strong relationship with our 50:50 joint venture in New Mexico, Southwest Cheese.
US Cheese & Global Nutritionals business modelWe have successfully grown our US Cheese & Global Nutritionals businesses and there are further strategic opportunities to continue to expand in our areas of focus. This is underpinned by strong structural market drivers, growing global demand for nutritional products and increased consumer awareness of the link between diet, exercise and health & wellness. All elements of this business have the ability to develop on a global basis.
Derived from cheese processing is a large captive whey pool which is a key raw material for Global Nutritionals. Through the use of innovation, a focus on growth sectors and markets and expansion in nutritional solutions, Global Nutritionals is building a global business.
€1 billionrevenue
10.8% EBITA margin pre exceptionalon a constant currency basis
36For divisional performance
CHAIRMAN’S STATEMENT
GROUP MANAGING DIRECTOR’S REVIEW
OUR BUSINESS MODELS
GROUP FINANCE DIRECTOR’S REVIEW
RISK MANAGEMENT
OUR RESPONSIBILITIES
US Cheese
Performance Nutrition
Customised Premix Solutions
Ingredient Technologies
Large captive whey pool
Sust
aina
ble
high
er m
argi
n
Incr
easi
ng in
nova
tion
rate
Stro
ng m
arke
t gro
wth
rate
s
Global Nutritionals

FOCUS DELIVERY MOMENTUM
GLANBIA PLC
ANNUAL REPORT 2010 21 DIRECTORS' REPORT:
GROUP PERFORMANCE
Dairy Ireland business modelGlanbia has three businesses based in Ireland aligned through their relationships with the Group's Irish farmer supply base. Agribusiness produces and sells a wide range of farm inputs, including animal feed, to the Group’s farmer suppliers who produced 1.8 billion litres of milk in 2010. This is the key raw material for Glanbia’s Dairy Ingredients and Consumer Products businesses. 83% of the milk supplied is processed by Dairy Ingredients primarily for export markets while 17% is processed by Consumer Products into fresh dairy products and liquid milk for the Irish market.
Dairy Ireland is a well invested, cost efficient business with growth potential. In the local market Consumer Products has leading market positions in liquid milk and fresh dairy products. EU market reform is creating new opportunities for growing milk supply and Ireland has a natural grassland advantage that can be exploited. The abolition of the quota system in April 2015 is the first opportunity to expand
milk output since 1984 and it also creates other opportunities in broader farming activities. Expansion is underpinned by growing global demand for dairy products supported by demographics and emerging economies. Fulfilling this demand requires a presence in international markets and the Group has established routes-to-market for dairy ingredients in more than 50 countries worldwide.
€1.1 billionrevenue
4.2% EBITA margin pre exceptional
38For divisional performance
CHAIRMAN’S STATEMENT
GROUP MANAGING DIRECTOR’S REVIEW
OUR BUSINESS MODELS
GROUP FINANCE DIRECTOR’S REVIEW
RISK MANAGEMENT
OUR RESPONSIBILITIES
>5,000 farmer suppliers in Ireland
>1.8 billion litres
of milk produced
Consumer Products
2.5 million consumer packs per day
Exports to more than 50 countries
83%
17%
Agribusiness
Production and sale of farm inputs
Dairy Ingredients
1.5 billion litres of milk processed into 214,000 tonnes of cheese and dairy-based ingredients
0.3 billion litres of milk processed into fresh dairy products and liquid milk

GLANBIA PLC
ANNUAL REPORT 2010 22 DIRECTORS' REPORT:
GROUP PERFORMANCE
FOCUS DELIVERY MOMENTUM
Results as reported 2010 2009 Change
Revenue(1) €2,166.7m €1,830.3m + 18.4%
EBITA €151.6m €125.0m + 21.3%
EBITA margin 7.0% 6.8% + 20 bps
Operating profit €136.5m €111.2m + 22.8%
Operating margin 6.3% 6.1% + 20bps
Net finance cost (€22.1m) (€24.0m) - €1.9m
Share of results of Joint Ventures & Associates(1) €10.1m €10.2m - €0.1m
Profit before taxation €124.5m €97.4m + 27.8%
Income taxes (€25.5m) (€19.1m) + €6.4m
Profit for the year €99.0m €78.3m + 26.4%
Exceptional items €10.2m €45.7m -€35.5m
Basic earnings per share 36.86c 38.46c - 4.2%
Adjusted earnings per share(2) 38.07c 30.68c + 24.1%
Dividend per share in respect of the full year 7.52c 6.84c + 10%
(1) Revenue including Glanbia’s share of the revenue of Joint Ventures & Associates was €2.6 billion for the full year, compared with €2.1 billion for 2009. Share of results of Joint Ventures & Associates is an after interest and tax amount.
(2) Adjusted earnings per share is calculated as the profit for the year attributable to the equity holders of the Parent before exceptional items and amortisation of intangible assets (net of tax).
2010 finance reviewGlanbia delivered a strong performance in 2010:
• Dairy Ingredients Ireland returned to profitability after a first time loss in 2009;
• Strategic cost management programmes in Dairy Ireland delivered targeted annualised savings;
• Organic revenue growth in Global Nutritionals significantly outpaced market growth rates;
• Revenue increased 18.4%; up 15.6% on a constant currency basis;
• EBITA increased 21.3%; up 21.4% on a constant currency basis;
• EBITA margin grew 20 basis pvoints to 7.0%; up 40 basis points to 7.2% on a constant currency basis;
• Adjusted earnings per share (Adjusted EPS) increased by 24.1% to 38.07 cents per share; and
• Dividends increased by 10% to 7.52 cents per share.
Group Finance Director's review
“�We�delivered�a�strong�performance�in�2010�underpinned�by�the��recovery�in�our�Dairy�Ingredients�Ireland��business�and�strong�organic�revenue�growth�in��Global�Nutritionals.”�
Siobhán TalbotGroup Finance Director
Total Group EBITA including�Joint��Ventures�&�Associates
US Cheese & Global Nutritionals 60%
Dairy Ireland 28%
Joint Ventures & Associates 12%
Total
€173.2 million
CHAIRMAN’S STATEMENT
GROUP MANAGING DIRECTOR’S REVIEW
OUR BUSINESS MODELS
GROUP FINANCE DIRECTOR’S REVIEW
RISK MANAGEMENT
OUR RESPONSIBILITIES

FOCUS DELIVERY MOMENTUM
GLANBIA PLC
ANNUAL REPORT 2010 23 DIRECTORS' REPORT:
GROUP PERFORMANCE
Segmental analysisGroup revenue increased 18.4% to €2.2 billion (2009: €1.8 billion). Total Group revenue, including share of Joint Ventures & Associates, grew 21.4% to €2.6 billion (2009: €2.1 billion). The strong growth in revenue is attributable mainly to the improvements in global dairy and US cheese markets in 2010 and continued strong organic volume growth in Global Nutritionals. Revenue in US Cheese & Global Nutritionals was up 29.0% to €1.0 billion (2009: €792.4 million). Revenue in Dairy Ireland grew 10.7% to €1.1 billion (2009: €1.0 billion). Revenue in Joint Ventures & Associates grew 40.0% to €416.6 million (2009: €297.6 million).
Group EBITA increased 21.3% to €151.6 million (2009: €125.0 million). Total Group EBITA, including Joint Ventures & Associates, grew 21.6% to €173.2 million (2009: €142.4 million). This improvement in performance is driven by the return to profitability of Dairy Ingredients Ireland with EBITA for Dairy Ireland improving by 74.2% to €47.9 million (2009: €27.5 million).
US Cheese & Global Nutritionals delivered reasonable year-on-year EBITA growth, underpinned in particular by a good performance by Global Nutritionals. US Cheese & Global Nutritionals EBITA grew 4.2% to €104.5 million (2009: €100.3 million).
Group EBITA margin grew 20 basis points to 7.0% (2009: 6.8%). Total Group EBITA margin, including Joint Ventures & Associates, was in line with 2009 at 6.7%.
Dairy Ireland EBITA margin at 4.2% grew 150 basis points (2009: 2.7%), driven by the strong recovery in Dairy Ingredients Ireland following a loss in 2009, offset by margin pressures in Consumer Products. US Cheese & Global Nutritionals EBITA margin declined 250 basis points to 10.2% (2009: 12.7%). Lower margins were as a result of higher input costs, significant brand and people investment by Global Nutritionals and volatile market conditions and milk cost premiums in US Cheese.
Group operating profit, including Joint Ventures & Associates, increased by 22.9% to €158.1 million (2009: €128.6 million). Group operating margin, including Joint Ventures & Associates, increased 10 basis points to 6.1% (2009: 6.0%).
Joint Ventures & AssociatesGlanbia has three principal international joint ventures – Southwest Cheese in the USA, Glanbia Cheese in the UK and Nutricima in Nigeria – and a number of smaller Irish based Joint Ventures & Associates. Joint Ventures & Associates had a reasonable year. Revenue and operating profit improved primarily as a result of market price increases in US cheese and European mozzarella markets. Glanbia expanded its cheese position in 2010 to become one of the largest US manufacturers of American-style cheddar cheese, following the 40% expansion in production capacity of Southwest Cheese in New Mexico. This project was delivered on time and on budget.
The Group’s share of results of Joint Ventures & Associates was €10.1 million, down marginally from €10.2 million in 2009. A table is set out on page 40, which reconciles Joint Ventures & Associates operating profit with share of results, as reported in the income statement.
Segmental revenue, profitability and margins(1) – pre exceptional 2010 2009
Revenue
€m
Operating profit
€m
Operating margin EBITA(2)
€mEBITA
margin Revenue
€m
Operating profit
€m
Operating margin
EBITA(2)
€m
EBITA margin
US Cheese & Global Nutritionals 1,021.9 93.8 9.2% 104.5 10.2% 792.4 90.0 11.4% 100.3 12.7%
Dairy Ireland 1,138.6 43.5 3.8% 47.9 4.2% 1,028.8 24.0 2.3% 27.5 2.7%
Other Business 6.2 (0.8) (12.9%) (0.8) (12.9%) 9.1 (2.8) (30.8%) (2.8) (30.8%)
Group as reported(3) 2,166.7 136.5 6.3% 151.6 7.0% 1,830.3 111.2 6.1% 125.0 6.8%
JVs & Associates 416.6 21.6 5.2% 21.6 5.2% 297.6 17.4 5.8% 17.4 5.8%
Total including JVs & Associates 2,583.3 158.1 6.1% 173.2 6.7% 2,127.9 128.6 6.0% 142.4 6.7%
(1) Pre exceptional items.(2) Given the nature of Group acquisitions in recent years, EBITA is an accurate reflection of underlying cash generative operating performance.(3) Reported results exclude Joint Ventures & Associates. Share of results of Joint Ventures & Associates in the income statement is an after interest and tax amount.
Further information
Joint Ventures & Associates 40
CHAIRMAN’S STATEMENT
GROUP MANAGING DIRECTOR’S REVIEW
OUR BUSINESS MODELS
GROUP FINANCE DIRECTOR’S REVIEW
RISK MANAGEMENT
OUR RESPONSIBILITIES
GLANBIA PLC
ANNUAL REPORT 2010 24 DIRECTORS' REPORT:
GROUP PERFORMANCE
FOCUS DELIVERY MOMENTUM
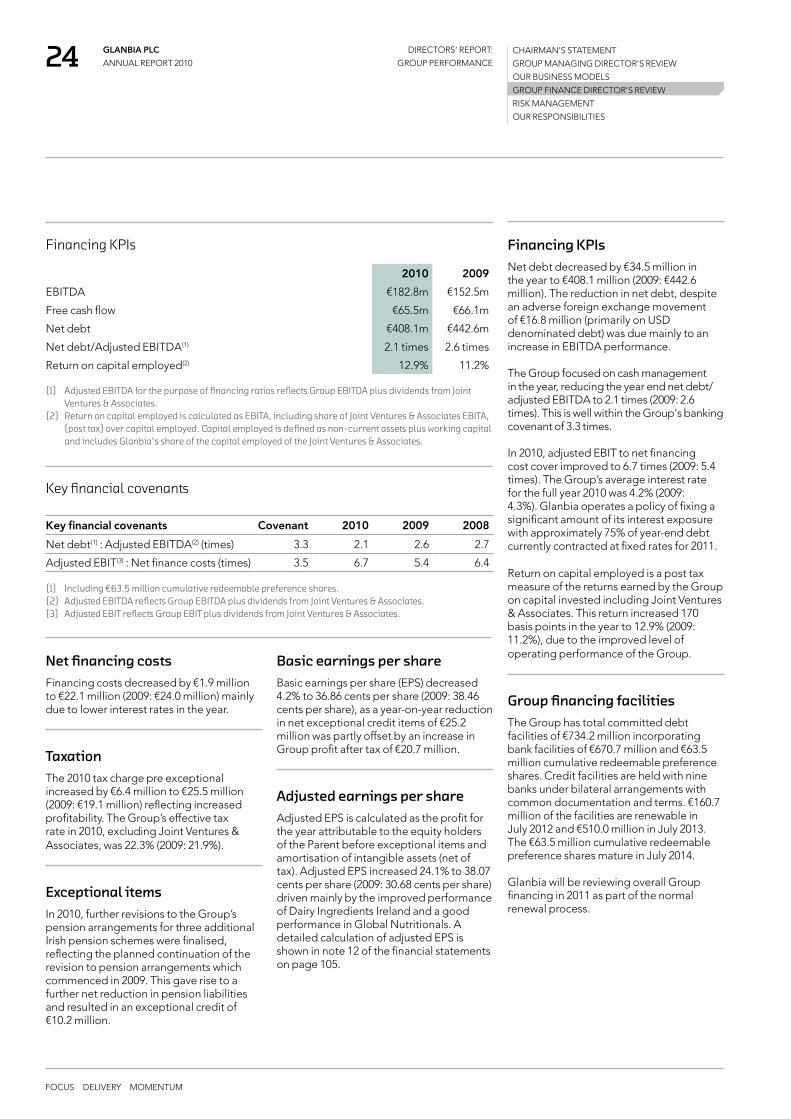
Basic earnings per shareBasic earnings per share (EPS) decreased 4.2% to 36.86 cents per share (2009: 38.46 cents per share), as a year-on-year reduction in net exceptional credit items of €25.2 million was partly offset by an increase in Group profit after tax of €20.7 million.
Adjusted earnings per shareAdjusted EPS is calculated as the profit for the year attributable to the equity holders of the Parent before exceptional items and amortisation of intangible assets (net of tax). Adjusted EPS increased 24.1% to 38.07 cents per share (2009: 30.68 cents per share) driven mainly by the improved performance of Dairy Ingredients Ireland and a good performance in Global Nutritionals. A detailed calculation of adjusted EPS is shown in note 12 of the financial statements on page 105.
Financing KPIs Net debt decreased by €34.5 million in the year to €408.1 million (2009: €442.6 million). The reduction in net debt, despite an adverse foreign exchange movement of €16.8 million (primarily on USD denominated debt) was due mainly to an increase in EBITDA performance.
The Group focused on cash management in the year, reducing the year end net debt/adjusted EBITDA to 2.1 times (2009: 2.6 times). This is well within the Group's banking covenant of 3.3 times.
In 2010, adjusted EBIT to net financing cost cover improved to 6.7 times (2009: 5.4 times). The Group’s average interest rate for the full year 2010 was 4.2% (2009: 4.3%). Glanbia operates a policy of fixing a significant amount of its interest exposure with approximately 75% of year-end debt currently contracted at fixed rates for 2011.
Return on capital employed is a post tax measure of the returns earned by the Group on capital invested including Joint Ventures & Associates. This return increased 170 basis points in the year to 12.9% (2009: 11.2%), due to the improved level of operating performance of the Group.
Group financing facilitiesThe Group has total committed debt facilities of €734.2 million incorporating bank facilities of €670.7 million and €63.5 million cumulative redeemable preference shares. Credit facilities are held with nine banks under bilateral arrangements with common documentation and terms. €160.7 million of the facilities are renewable in July 2012 and €510.0 million in July 2013. The €63.5 million cumulative redeemable preference shares mature in July 2014.
Glanbia will be reviewing overall Group financing in 2011 as part of the normal renewal process.
Financing KPIs
2010 2009
EBITDA €182.8m €152.5m
Free cash flow €65.5m €66.1m
Net debt €408.1m €442.6m
Net debt/Adjusted EBITDA(1) 2.1 times 2.6 times
Return on capital employed(2) 12.9% 11.2% (1) Adjusted EBITDA for the purpose of financing ratios reflects Group EBITDA plus dividends from Joint
Ventures & Associates. (2) Return on capital employed is calculated as EBITA, including share of Joint Ventures & Associates EBITA,
(post tax) over capital employed. Capital employed is defined as non-current assets plus working capital and includes Glanbia's share of the capital employed of the Joint Ventures & Associates.
Net financing costsFinancing costs decreased by €1.9 million to €22.1 million (2009: €24.0 million) mainly due to lower interest rates in the year.
TaxationThe 2010 tax charge pre exceptional increased by €6.4 million to €25.5 million (2009: €19.1 million) reflecting increased profitability. The Group’s effective tax rate in 2010, excluding Joint Ventures & Associates, was 22.3% (2009: 21.9%).
Exceptional itemsIn 2010, further revisions to the Group’s pension arrangements for three additional Irish pension schemes were finalised, reflecting the planned continuation of the revision to pension arrangements which commenced in 2009. This gave rise to a further net reduction in pension liabilities and resulted in an exceptional credit of €10.2 million.
Key financial covenants
Key financial covenants Covenant 2010 2009 2008
Net debt(1) : Adjusted EBITDA(2) (times) 3.3 2.1 2.6 2.7
Adjusted EBIT(3) : Net finance costs (times) 3.5 6.7 5.4 6.4 (1) Including €63.5 million cumulative redeemable preference shares.(2) Adjusted EBITDA reflects Group EBITDA plus dividends from Joint Ventures & Associates. (3) Adjusted EBIT reflects Group EBIT plus dividends from Joint Ventures & Associates.
CHAIRMAN’S STATEMENT
GROUP MANAGING DIRECTOR’S REVIEW
OUR BUSINESS MODELS
GROUP FINANCE DIRECTOR’S REVIEW
RISK MANAGEMENT
OUR RESPONSIBILITIES

FOCUS DELIVERY MOMENTUM
GLANBIA PLC
ANNUAL REPORT 2010 25 DIRECTORS' REPORT:
GROUP PERFORMANCE
Summary cash flowFree cash flow decreased year-on-year by €0.6 million to €65.5 million (2009: €66.1 million). Free cash flow is after charging working capital movements and business sustaining capital expenditure, but before dividends received from Joint Ventures, loans repaid by/advanced to Joint Ventures, strategic capital expenditure, restructuring costs, and equity dividends.
The minimal movement in free cash flow arose as the higher EBITDA in 2010 was offset by year on year investment in working capital due to strong volume growth in Global Nutritionals and higher global dairy and US cheese markets.
In 2010, dividends received from joint ventures were €11.2 million (2009: €17.9 million) and reflect a sustainable level of cash return to the Group from key strategic joint ventures. Loans advanced to Southwest Cheese during 2009 of €21.5 million, to fund the capacity expansion, were repaid during 2010.
As the Group conserved cash during 2010, strategic capital expenditure reduced by €7.4 million to €16.2 million (2009: €23.6 million).
PensionAt 1 January 2011 the Group’s net pension liability under IAS 19 ‘Employee Benefits’, before deferred tax, decreased by €37.2 million to €48.6 million (2009: €85.8 million). A strategic review of the Group’s pension arrangements was completed during 2009 following which the Group revised benefits under the main Irish defined benefit schemes giving rise to an exceptional gain and corresponding reduction in the pension deficit of €100.1 million. During 2010, revisions to the Group’s pension scheme arrangements for three additional Irish pension schemes, consistent with the revisions made in the Group’s main pension schemes, have been finalised. This gave rise to an exceptional gain in the year of €10.2 million. The fair value of the assets of the pension schemes at 1 January 2011 was €389.3 million (2009: €349.2 million) and the value of the scheme liabilities was €437.9 million (2009: €435.0 million).
Summary cash flow
2010 €m
2009 €m
Change €m
EBITDA pre exceptional 182.8 152.5 + 30.3
Working capital movement (53.6) (18.8) - 34.8
Net interest and tax paid (34.5) (30.7) - 3.8
Business sustaining capital investment (17.3) (20.1) + 2.8
Other outflows (11.9) (16.8) + 4.9
Free cash flow 65.5 66.1 - 0.6
Dividends from joint ventures 11.2 17.9 - 6.7
Loans repaid by/(advanced to) joint ventures 23.3 (21.5) + 44.8
Strategic capital expenditure (16.2) (23.6) + 7.4
Restructuring costs (9.8) (14.1) + 4.3
Equity dividends (20.5) (19.5) - 1.0
Cash flow pre currency exchange/fair value adjustments 53.5 5.3 + 48.2
Currency exchange/fair value adjustments (19.0) 4.2 - 23.2
Net decrease in debt during the year 34.5 9.5 + 25.0
Net debt at the beginning of the year (442.6) (452.1) + 9.5
Net debt at the end of the year (408.1) (442.6) + 34.5
Movement in the liability for retirement benefit obligations
2010 €m
2009 €m
At the beginning of the year (85.8) (164.4)
Exchange differences (1.0) (1.8)
Disposed operations – (1.3)
Total expense (7.1) (12.8)
Curtailment gains and negative past service costs 10.2 100.1
Actuarial gain/(loss) 13.4 (31.2)
Employer contributions 21.7 25.6
At the end of the year (48.6) (85.8)
CHAIRMAN’S STATEMENT
GROUP MANAGING DIRECTOR’S REVIEW
OUR BUSINESS MODELS
GROUP FINANCE DIRECTOR’S REVIEW
RISK MANAGEMENT
OUR RESPONSIBILITIES

GLANBIA PLC
ANNUAL REPORT 2010 26 DIRECTORS' REPORT:
GROUP PERFORMANCE
FOCUS DELIVERY MOMENTUM
Glanbia Co-operative Society 54.5%
Investor relationsIn 2010, Glanbia senior management participated in over 100 investor meetings in Ireland, the UK, Europe and North America. In addition, the Group attended five capital market conferences and hosted capital market investor events in Ireland and the UK, focused on US Cheese & Global Nutritionals.
Glanbia’s largest shareholder is Glanbia Co-operative Society Limited, which own 54.5% of the Group. The investor relations programme for 2010 included a series of meetings of Glanbia plc senior management with the Council of the Society.
In 2010, the share price increased 27.4%. The share price high was €3.68 at year-end and the share price low during the year was €2.43. Total Shareholder Return (TSR) for the year was 30.2%. The share price outperformed the Irish Stock Exchange index by 30.4%, the FTSE E300 Index by 20.1%, the S&P 500 Index by 14.6% and the FTSE E300 Food Producers Index by 7.7%.
Events after the reporting periodOn 19 January 2011, Glanbia announced the acquisition of the Bio-Engineered Supplements and Nutrition business (BSN) for a total consideration of $144 million (€108 million). The business was acquired on a debt free basis and is expected to be earnings enhancing in 2011. The acquisition was funded from Glanbia’s existing banking facilities.
On 12 January 2011, the Group acquired the business and assets of Kerry Group plc’s Limerick based liquid milk business, subject to regulatory approval.
2011 outlookThe current 2011 outlook for the Group is good. Including BSN, adjusted earnings per share growth is expected to be in the range of 11% to 13% for the year, on a constant currency basis. Following the acquisition of BSN, 2011 will be a period of consolidation as we ensure this business is integrated well and we continue to drive organic opportunities across the Group. We will continue to focus on costs, so that our operations are on a sustainable and competitive cost base. We will also be reviewing the Group's financing facilities during 2011 as part of the normal facility renewal cycle. Overall, we look forward to another year of growth.
Siobhán TalbotGroup Finance Director
Dividends The Board is recommending a final dividend of 4.49 cents per share (2009: final dividend 3.95 cents per share). This brings the total dividend for the year to 7.52 cents per share (2009: 6.84 cents per share), an increase of 10%.
Financial risk managementThe conduct of Glanbia’s ordinary business operations necessitates the holding and issuing of financial instruments and derivative financial instruments by the Group. The main risks, arising from issuing, holding and managing these financial instruments, typically include liquidity risk, interest rate risk and currency risk. The Group does not trade in financial instruments. The Group’s treasury policies and guidelines are designed to mitigate the impact of fluctuations in interest rates and exchange rates and to manage the Group’s financial risks.
The Board agrees and regularly reviews these policies and guidelines. More detailed information on financial risk is contained in note 3.1 ‘Financial risk factors’ in the notes to the financial statements and in the risk management section of this report.
Financial statements Note 3.1
Risk management
90
27
Shareholder analysis December 2010
Ireland* 5%UK* 10%
Europe* 5%North America* 3.5%
Retail 22%
40
Further information on Divisional performance
US Cheese & Global Nutritionals
Dairy Ireland
Joint Ventures & Associates
36
40
38
CHAIRMAN’S STATEMENT
GROUP MANAGING DIRECTOR’S REVIEW
OUR BUSINESS MODELS
GROUP FINANCE DIRECTOR’S REVIEW
RISK MANAGEMENT
OUR RESPONSIBILITIES
* Institutional/other
FOCUS DELIVERY MOMENTUM
GLANBIA PLC
ANNUAL REPORT 2010 27 DIRECTORS' REPORT:
GROUP PERFORMANCE
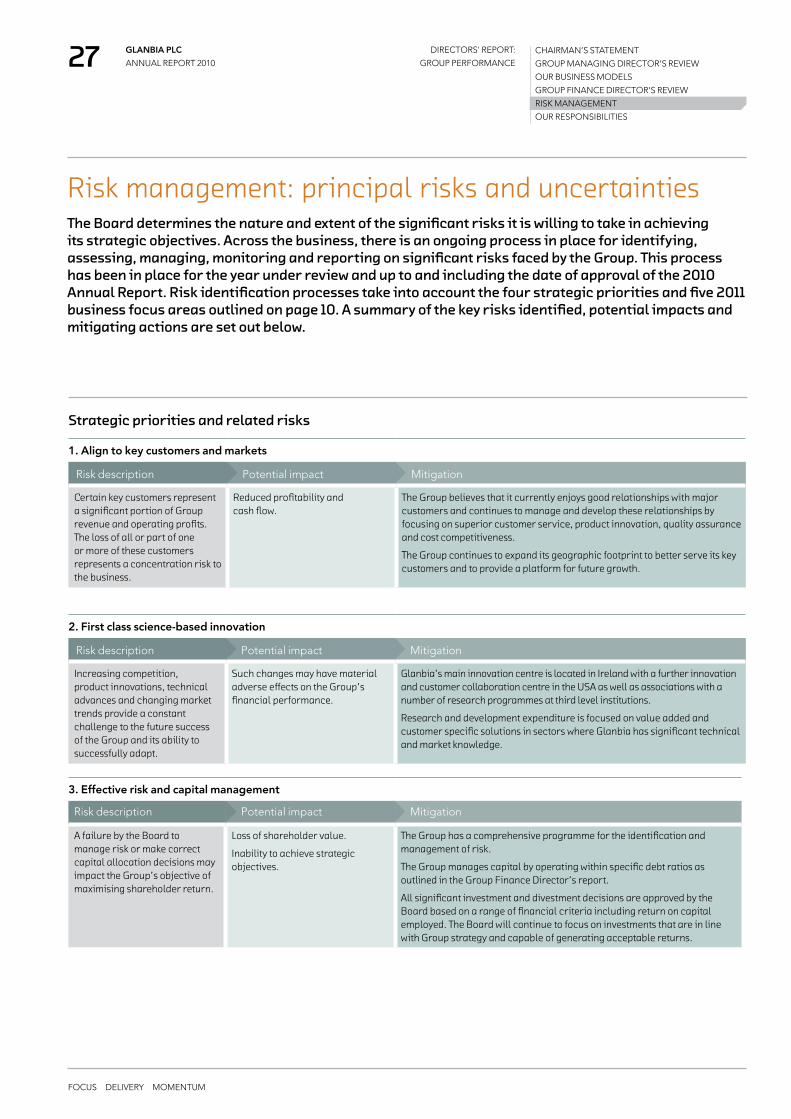
Strategic priorities and related risks
1. Align to key customers and markets
Risk description Potential impact Mitigation
Certain key customers represent a significant portion of Group revenue and operating profits. The loss of all or part of one or more of these customers represents a concentration risk to the business.
Reduced profitability and cash flow.
The Group believes that it currently enjoys good relationships with major customers and continues to manage and develop these relationships by focusing on superior customer service, product innovation, quality assurance and cost competitiveness.
The Group continues to expand its geographic footprint to better serve its key customers and to provide a platform for future growth.
2. First class science-based innovation
Risk description Potential impact Mitigation
Increasing competition, product innovations, technical advances and changing market trends provide a constant challenge to the future success of the Group and its ability to successfully adapt.
Such changes may have material adverse effects on the Group’s financial performance.
Glanbia’s main innovation centre is located in Ireland with a further innovation and customer collaboration centre in the USA as well as associations with a number of research programmes at third level institutions.
Research and development expenditure is focused on value added and customer specific solutions in sectors where Glanbia has significant technical and market knowledge.
3. Effective risk and capital management
Risk description Potential impact Mitigation
A failure by the Board to manage risk or make correct capital allocation decisions may impact the Group’s objective of maximising shareholder return.
Loss of shareholder value.
Inability to achieve strategic objectives.
The Group has a comprehensive programme for the identification and management of risk.
The Group manages capital by operating within specific debt ratios as outlined in the Group Finance Director’s report.
All significant investment and divestment decisions are approved by the Board based on a range of financial criteria including return on capital employed. The Board will continue to focus on investments that are in line with Group strategy and capable of generating acceptable returns.
Risk management: principal risks and uncertaintiesThe Board determines the nature and extent of the significant risks it is willing to take in achieving its strategic objectives. Across the business, there is an ongoing process in place for identifying, assessing, managing, monitoring and reporting on significant risks faced by the Group. This process has been in place for the year under review and up to and including the date of approval of the 2010 Annual Report. Risk identification processes take into account the four strategic priorities and five 2011 business focus areas outlined on page 10. A summary of the key risks identified, potential impacts and mitigating actions are set out below.
CHAIRMAN’S STATEMENT
GROUP MANAGING DIRECTOR’S REVIEW
OUR BUSINESS MODELS
GROUP FINANCE DIRECTOR’S REVIEW
RISK MANAGEMENT
OUR RESPONSIBILITIES

GLANBIA PLC
ANNUAL REPORT 2010 28 DIRECTORS' REPORT:
GROUP PERFORMANCE
FOCUS DELIVERY MOMENTUM
4. Operational excellence and strategic cost management
Risk description Potential impact Mitigation
A breach of existing environmental laws and regulations or the introduction of new more onerous legislation.
Reputational damage and regulatory penalties including restrictions on operations, damages or fines.
Increased cost of compliance with modified or new legislation.
Adverse operational consequences.
The Group is committed to compliance with regulations. We continue to invest in energy efficiency advancements, carbon reduction and emission programmes and recycling.
A breach of food safety legislation or the introduction of more stringent regulations.
Reputational damage and regulatory penalties including restrictions on operations, damages or fines.
Product recall costs.
Additional labelling requirements.
Damage to customer relationships.
The Group conforms to international and local food safety, quality and environmental regulations and employs best practice across all its production facilities to maintain the highest standards.
The Group maintains product liability insurance.
Key sites have quality accreditations from external parties.
Contamination of products and/or raw materials.
Reputational damage and regulatory. penalties.
Product recall costs, lost revenues and reduced growth prospects.
The Group conforms to international and local food safety, quality and environmental regulations and employs best practice across all its production facilities to maintain the highest standards.
Key sites have quality accreditations from external parties.
A breach of health and safety regulations.
Reputational damage and regulatory penalties.
An independent risk consulting firm conducts an annual health and safety audit for the Group’s main locations the results of which are presented to and considered by the Audit Committee.
Loss of capacity at a major site.
Inability to service customer requirements.
Adverse impact on reputation.
Reduced profitability and cash flow.
All business operations have business continuity plans in place including where relevant identification of alternative production locations.
The Group monitors overall safety and loss prevention performance through the Glanbia risk management system (GRMS) to assist operational management responsible for the day to day management of business risk.
A comprehensive insurance programme is in place for all significant insurable risks and major catastrophes.
One of our major ingredient suppliers being unable to fulfill product demand requirements.
Inability to service new and existing customer requirements.
Operational efficiencies impacted.
A broad supplier base is maintained where possible.
Management continuously seeks out and assesses additional sources of supply for key raw materials.
The Group has invested heavily in supply chain resources and systems.
Regular quality control assessments including supplier site audits are conducted to ensure the areas of greatest social, political and economic exposure are identified.
A significant increase in energy costs impacting the Group’s large scale processing operations.
Adverse impact on cash flow and earnings. Energy efficiency programmes are operated across all sites.
When required the Group will enter into fixed price arrangements to cover certain future energy requirements.
Further information
42
Chairman's introduction to corporate governance
10
Our strategy
20
Our business models
CHAIRMAN’S STATEMENT
GROUP MANAGING DIRECTOR’S REVIEW
OUR BUSINESS MODELS
GROUP FINANCE DIRECTOR’S REVIEW
RISK MANAGEMENT
OUR RESPONSIBILITIES
FOCUS DELIVERY MOMENTUM
GLANBIA PLC
ANNUAL REPORT 2010 29 DIRECTORS' REPORT:
GROUP PERFORMANCE
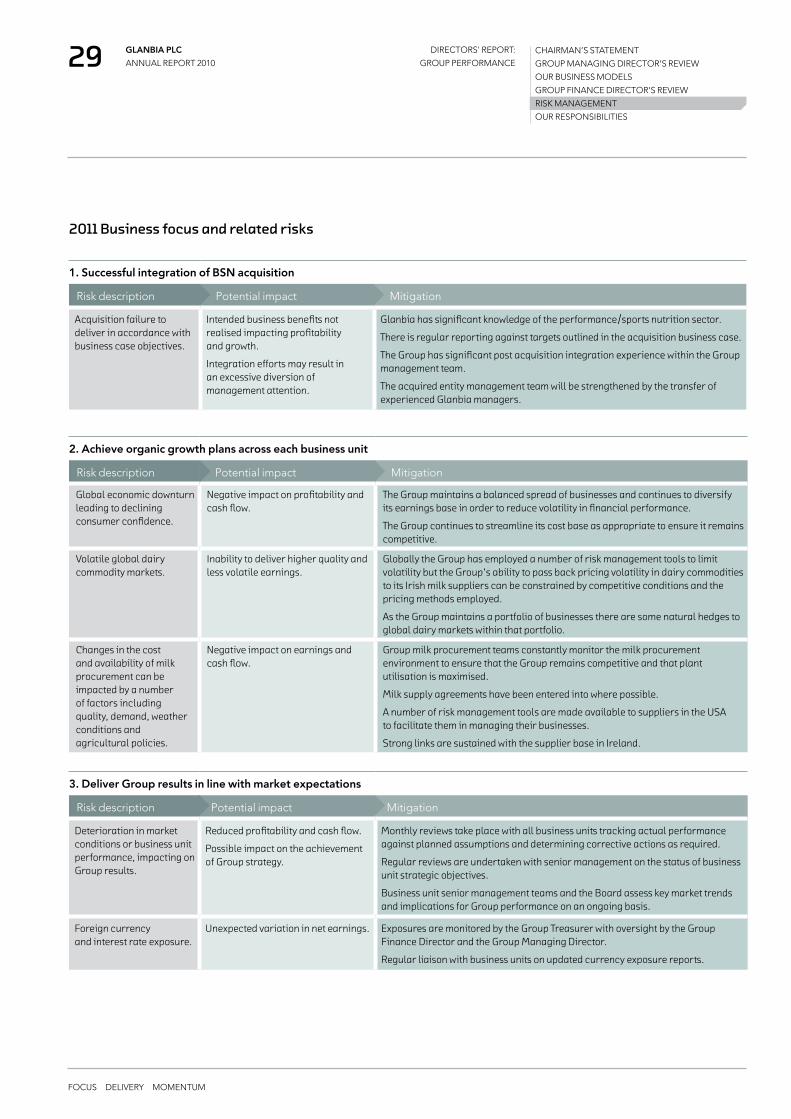
2011 Business focus and related risks
1. Successful integration of BSN acquisition
Risk description Potential impact Mitigation
Acquisition failure to deliver in accordance with business case objectives.
Intended business benefits not realised impacting profitability and growth.
Integration efforts may result in an excessive diversion of management attention.
Glanbia has significant knowledge of the performance/sports nutrition sector.
There is regular reporting against targets outlined in the acquisition business case.
The Group has significant post acquisition integration experience within the Group management team.
The acquired entity management team will be strengthened by the transfer of experienced Glanbia managers.
2. Achieve organic growth plans across each business unit
Risk description Potential impact Mitigation
Global economic downturn leading to declining consumer confidence.
Negative impact on profitability and cash flow.
The Group maintains a balanced spread of businesses and continues to diversify its earnings base in order to reduce volatility in financial performance.
The Group continues to streamline its cost base as appropriate to ensure it remains competitive.
Volatile global dairy commodity markets.
Inability to deliver higher quality and less volatile earnings.
Globally the Group has employed a number of risk management tools to limit volatility but the Group’s ability to pass back pricing volatility in dairy commodities to its Irish milk suppliers can be constrained by competitive conditions and the pricing methods employed.
As the Group maintains a portfolio of businesses there are some natural hedges to global dairy markets within that portfolio.
Changes in the cost and availability of milk procurement can be impacted by a number of factors including quality, demand, weather conditions and agricultural policies.
Negative impact on earnings and cash flow.
Group milk procurement teams constantly monitor the milk procurement environment to ensure that the Group remains competitive and that plant utilisation is maximised.
Milk supply agreements have been entered into where possible.
A number of risk management tools are made available to suppliers in the USA to facilitate them in managing their businesses.
Strong links are sustained with the supplier base in Ireland.
3. Deliver Group results in line with market expectations
Risk description Potential impact Mitigation
Deterioration in market conditions or business unit performance, impacting on Group results.
Reduced profitability and cash flow.
Possible impact on the achievement of Group strategy.
Monthly reviews take place with all business units tracking actual performance against planned assumptions and determining corrective actions as required.
Regular reviews are undertaken with senior management on the status of business unit strategic objectives.
Business unit senior management teams and the Board assess key market trends and implications for Group performance on an ongoing basis.
Foreign currency and interest rate exposure.
Unexpected variation in net earnings. Exposures are monitored by the Group Treasurer with oversight by the Group Finance Director and the Group Managing Director.
Regular liaison with business units on updated currency exposure reports.
CHAIRMAN’S STATEMENT
GROUP MANAGING DIRECTOR’S REVIEW
OUR BUSINESS MODELS
GROUP FINANCE DIRECTOR’S REVIEW
RISK MANAGEMENT
OUR RESPONSIBILITIES

GLANBIA PLC
ANNUAL REPORT 2010 30 DIRECTORS' REPORT:
GROUP PERFORMANCE
FOCUS DELIVERY MOMENTUM
4. Continue to develop people and organisation capability
Risk description Potential impact Mitigation
Recruitment and retention. The Group is dependent upon the quality, ability and commitment of key personnel in order to sustain, develop and grow the business.
The ongoing success of the Group being put at risk by failing to attract and retain high quality management and staff throughout the business.
The Group mitigates risk exposure through sustained succession management, strong recruitment processes, long term incentives and retention initiatives.
The Group also operates management development programmes to ensure that there is a continuous pipeline of talent within the Group to support the ongoing growth and development of the business.
The leadership structure provides a platform for management information to be relayed and discussed on a timely basis.
5. Review of Group financing facilities
Risk description Potential impact Mitigation
Refinancing of Group debt facilities is key to underpinning the liquidity requirements of the Group.
Lack of liquidity to sustain and grow the Group.
Strong current relationships with debt providers.
Tight management of debt on a daily basis with significant headroom maintained against current covenants.
New financing arrangements typically negotiated at least twelve months prior to expiration.
The BoardSets risk appetite and tolerance
Assurance/self assessment
Risk
man
agem
entOperational
Framework
Assurance/self assessment
• Group Operating Executive reporting Monthly performance reports and quarterly risk assessment
• Financial reportingOngoing procedures in place designed to ensure financial reporting reliability
• Management representation letter Bi-annual process to assess the effectiveness of internal controls over financial reporting
• Control self assessmentBi-annual programme to assess internal control and fraud prevention processes
• Internal Audit functionAudit plan and output reviewed by the Audit Committee
Risk management
• Review & IdentifyQuarterly key risk review by each business unit CEO and function head
• EvaluateRisks analysed for impact and probability to determine the exposure
• RespondRisk owners and action plans identified to manage key risks
• ReportRisk exposure, risk velocity and mitigation reviewed by the Group Risk Committee and the Board
Operational framework
• The Group risk management structures operate within a framework of defined organisation structure, mandated policies and processes and delegated authority to key personnel.
CHAIRMAN’S STATEMENT
GROUP MANAGING DIRECTOR’S REVIEW
OUR BUSINESS MODELS
GROUP FINANCE DIRECTOR’S REVIEW
RISK MANAGEMENT
OUR RESPONSIBILITIES
Company culture Code of Conduct
Risk management governance

FOCUS DELIVERY MOMENTUM
GLANBIA PLC
ANNUAL REPORT 2010 31 DIRECTORS' REPORT:
GROUP PERFORMANCE
CHAIRMAN’S STATEMENT
GROUP MANAGING DIRECTOR’S REVIEW
OUR BUSINESS MODELS
GROUP FINANCE DIRECTOR’S REVIEW
RISK MANAGEMENT
OUR RESPONSIBILITIES
4. Continue to develop people and organisation capability
Risk description Potential impact Mitigation
Recruitment and retention. The Group is dependent upon the quality, ability and commitment of key personnel in order to sustain, develop and grow the business.
The ongoing success of the Group being put at risk by failing to attract and retain high quality management and staff throughout the business.
The Group mitigates risk exposure through sustained succession management, strong recruitment processes, long term incentives and retention initiatives.
The Group also operates management development programmes to ensure that there is a continuous pipeline of talent within the Group to support the ongoing growth and development of the business.
The leadership structure provides a platform for management information to be relayed and discussed on a timely basis.
5. Review of Group financing facilities
Risk description Potential impact Mitigation
Refinancing of Group debt facilities is key to underpinning the liquidity requirements of the Group.
Lack of liquidity to sustain and grow the Group.
Strong current relationships with debt providers.
Tight management of debt on a daily basis with significant headroom maintained against current covenants.
New financing arrangements typically negotiated at least twelve months prior to expiration.
Our responsibilitiesOver 60 Irish employees climbed Ireland’s highest mountain in September 2010 and raised almost €23,000 for Barretstown summer camp for sick children
FOCUS DELIVERY MOMENTUM
GLANBIA PLC
ANNUAL REPORT 2010 31

GLANBIA PLC
ANNUAL REPORT 2010 32 DIRECTORS' REPORT:
GROUP PERFORMANCE
FOCUS DELIVERY MOMENTUM
Our peopleWe employed an average of 4,313 people, including Joint Ventures & Associates, during 2010. While our average number of employees was very similar to 2009, there have been some significant changes by division.
Employee numbers reduced in Dairy Ireland by 148 people during the year following a reduction of 210 people in 2009. This reflects the rationalisation and change programme we implemented to put our Irish operations on a more sustainable and competitive base. This restructuring saw changes in operations, sales and administration, supply chain management and the implementation of significant new technology and automation. A key task for Human Resources (HR) throughout this period has been to ensure that the restructuring delivered effective change and productivity gains. In recognition of the delivery of this programme and to bring clarity and stability to the pay environment, a modest pay increase will be implemented this year for our Irish businesses following a pay freeze which was in place for 2009 and 2010.
In US Cheese & Global Nutritionals we have increased employee numbers by almost 7% to an average of 1,570 people. This is to enhance our capabilities and ensure we are appropriately resourced to take advantage of market growth opportunities as we expand the geographic reach and business horizons for these business units. We invested across a broad range of business areas including operations, business development, supply chain management, marketing, research and development.
Our responsibilities Our corporate responsibilities include appropriate business conduct and accountability, fairness and respect for employees, health and safety, respect for the environment and community involvement. Our goal is to develop a sustainable business and to contribute to the communities in which we operate.
2010 HR agendaHR had clear business objectives in 2010. In the first instance it was to ensure successful delivery of the restructuring of the Irish businesses. In addition, during the first half of the year in particular it was to manage the uncertainty created by the proposed disposal of the Group’s Irish Dairy and Agri businesses and to support the requirement to keep the business focused on performance delivery in 2010. Throughout the year, there were many employee communication initiatives to ensure that there was open and transparent dialogue.
A strategic review of the Group’s pension scheme arrangements was completed during 2009 following which the Group revised benefits under the main Irish defined benefit schemes. During 2010, revisions to the Group’s pension scheme arrangements for three additional Irish pension schemes, consistent with the revisions made in the Group’s main pension scheme, have been finalised. These changes were necessary as a consequence of significant funding deficits experienced by these schemes and it is anticipated that the changes will place the defined benefit pension schemes on a firmer platform for the future.
Project PerformPerform, which is a SAP based HR system, was rolled out across the Group in 2009. 2010 was a period of consolidation for this project to ensure that Perform was being used extensively within the business. Perform gives HR and business unit managers everything they need in relation to employees, salary and benefits, and puts performance/succession management processes at their fingertips. It also ensures that all essential HR processes are uniform across Glanbia. Feedback on Perform from business units has been very positive. The system is providing better quality information, performance management and manager/employee engagement.
“ The new HR system has been a great help to my team and me. It saves us effort as everything is recorded electronically, and I now have all the information I need at my fingertips, so it is very empowering. I can now manage our Performance Development and Succession Management processes using the interactive workflow. My team is up to date on their development objectives and my boss is in the loop at all times. The focus is now around performance and the delivery of the strategy rather than chasing paper.”
Jeff Williams, President & CEO, US Cheese
People strategyOur HR strategy is consistent and has two core priorities:
1 Sustained succession management, which identifies people who have the potential to develop to the next level and focuses on making sure that the Group has the right mix of people, experience and skills to deliver its business plans and strategic objectives; and
2 Ensuring an effective HR organisation and systems to support the global scale of Glanbia’s operations.
During the year we made a series of changes to the leadership organisation of Glanbia, strengthening how we manage our business and the Group’s governance and risk framework. Externally facilitated coaching is being provided to members of the new leadership organisation to improve their effectiveness and increase their value and contribution to the organisation.
CHAIRMAN’S STATEMENT
GROUP MANAGING DIRECTOR’S REVIEW
OUR BUSINESS MODELS
GROUP FINANCE DIRECTOR’S REVIEW
RISK MANAGEMENT
OUR RESPONSIBILITIES
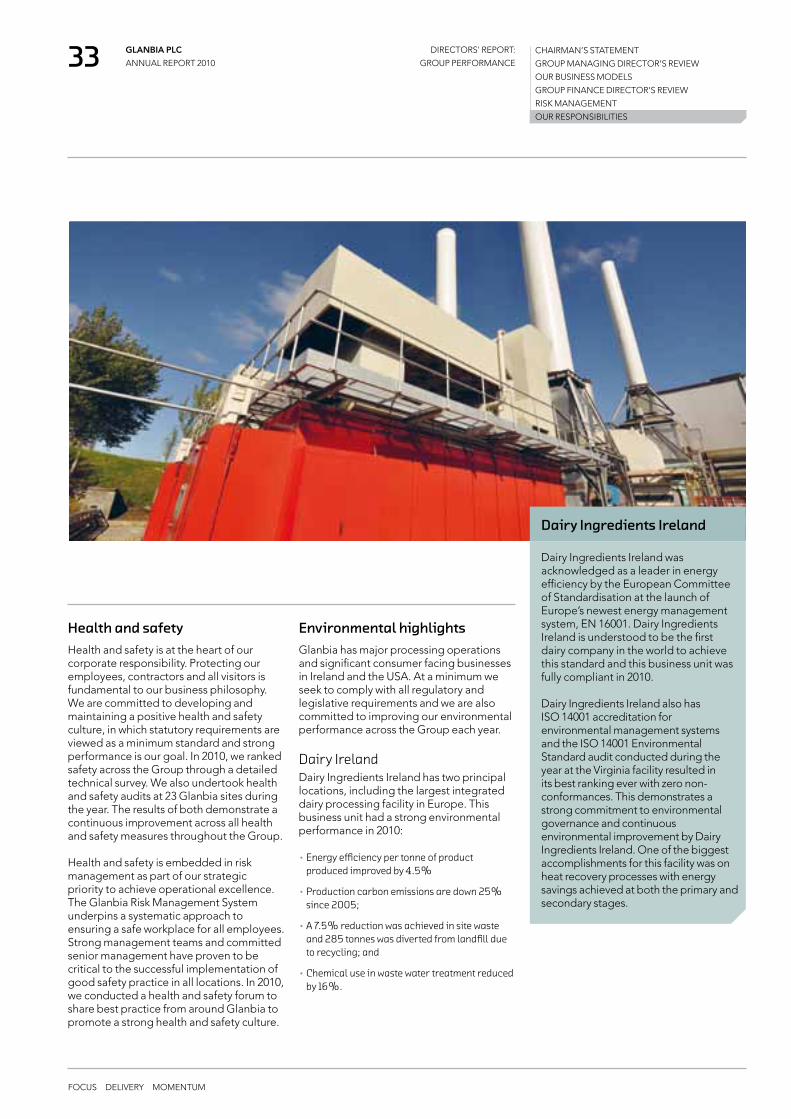
FOCUS DELIVERY MOMENTUM
GLANBIA PLC
ANNUAL REPORT 2010 33 DIRECTORS' REPORT:
GROUP PERFORMANCE
Health and safetyHealth and safety is at the heart of our corporate responsibility. Protecting our employees, contractors and all visitors is fundamental to our business philosophy. We are committed to developing and maintaining a positive health and safety culture, in which statutory requirements are viewed as a minimum standard and strong performance is our goal. In 2010, we ranked safety across the Group through a detailed technical survey. We also undertook health and safety audits at 23 Glanbia sites during the year. The results of both demonstrate a continuous improvement across all health and safety measures throughout the Group.
Health and safety is embedded in risk management as part of our strategic priority to achieve operational excellence. The Glanbia Risk Management System underpins a systematic approach to ensuring a safe workplace for all employees. Strong management teams and committed senior management have proven to be critical to the successful implementation of good safety practice in all locations. In 2010, we conducted a health and safety forum to share best practice from around Glanbia to promote a strong health and safety culture.
Environmental highlightsGlanbia has major processing operations and significant consumer facing businesses in Ireland and the USA. At a minimum we seek to comply with all regulatory and legislative requirements and we are also committed to improving our environmental performance across the Group each year.
Dairy IrelandDairy Ingredients Ireland has two principal locations, including the largest integrated dairy processing facility in Europe. This business unit had a strong environmental performance in 2010:
• Energy efficiency per tonne of product produced improved by 4.5%
• Production carbon emissions are down 25% since 2005;
• A 7.5% reduction was achieved in site waste and 285 tonnes was diverted from landfill due to recycling; and
• Chemical use in waste water treatment reduced by 16%.
Dairy Ingredients Ireland was acknowledged as a leader in energy efficiency by the European Committee of Standardisation at the launch of Europe’s newest energy management system, EN 16001. Dairy Ingredients Ireland is understood to be the first dairy company in the world to achieve this standard and this business unit was fully compliant in 2010.
Dairy Ingredients Ireland also has ISO 14001 accreditation for environmental management systems and the ISO 14001 Environmental Standard audit conducted during the year at the Virginia facility resulted in its best ranking ever with zero non-conformances. This demonstrates a strong commitment to environmental governance and continuous environmental improvement by Dairy Ingredients Ireland. One of the biggest accomplishments for this facility was on heat recovery processes with energy savings achieved at both the primary and secondary stages.
Dairy Ingredients Ireland
CHAIRMAN’S STATEMENT
GROUP MANAGING DIRECTOR’S REVIEW
OUR BUSINESS MODELS
GROUP FINANCE DIRECTOR’S REVIEW
RISK MANAGEMENT
OUR RESPONSIBILITIES

GLANBIA PLC
ANNUAL REPORT 2010 34 DIRECTORS' REPORT:
GROUP PERFORMANCE
FOCUS DELIVERY MOMENTUM
Consumer ProductsConsumer Products energy management system was successfully accredited to the EN 16001 standard in 2010. This is the first multi site accreditation to the EN 16001 standard in Ireland. This management system complements the environmental management system ISO 14001 which is in place since 2003. The energy management system is fundamental to reducing the carbon dioxide (CO2) emissions and simultaneously decreasing fossil fuel consumption and associated costs. Consumer Products reduced CO2 emissions in 2010 by 9%.
Packaging formats and the materials used in packaging are continuously evaluated with a view to improving their impact on the environment. To this end, the liquid milk production facilities have ceased the use of phosphorous based detergents and the weight of some packaging formats has been reduced by 3%. Working with suppliers, Consumer Products are using only cartons which are produced from independently sustainable forests verified by organisations such as Forest Stewardship Council.
The business unit is currently recycling 60% of all its waste and in conjunction with its suppliers, Consumer Products is developing reuse and recycle loops which will enable a further 5% improvement in recycling rates.
US CheeseOur US Cheese operations had a successful environmental performance this year improving water conservation, emissions and energy usage.
In 2010, our cheese operations in Idaho had one of the most successful water conservation years in recent history. This business unit reduced water usage across all operations by 12%. Several major projects related to condensate and polished water reuse, closed circuit cooling systems, and efficient utilisation of water during cleaning and sanitation processes resulted in over 74 million gallons of water being conserved. Connected to the successful water conservation is a continued reduction in carbon dioxide-equivalent (CO2-e) emissions as a result of less water being pumped from natural sources and more energy efficient operations overall. CO2-e emissions show a downward trend reflecting the implementation of numerous energy efficiency projects undertaken at the Idaho facilities. Emissions per tonne of product produced reduced by 7% since 2008. In 2010, US Cheese also continued to fully utilise its own renewable biogas energy resource. Biogas is generated as a result of treating wastewater at the Gooding facility. In 2010, over 1 billion cubic feet of biogas was used as fuel in the Gooding facility boilers.
In 2010, Glanbia signed a new three-year sponsorship deal with Kilkenny senior hurlers to continue what has become one of the most successful sponsorships in Irish sport. Under the Avonmore brand, Glanbia and Kilkenny hurling have enjoyed a particularly successful partnership over the last ten years. During this period Kilkenny has become one of the most successful teams of all time winning seven All Ireland titles (including four in a row).
Since 2005, under the Avonmore Supermilk brand, Glanbia is the sole sponsor of Munster Schools & Youths Rugby. The sponsorship includes Munster Schools Senior & Junior Cups, sponsorship of Munster Schools Interprovincial Team and the U17 & U19 Munster Youths Cups as well as the Munster Youths Interprovincial team. These competitions cover all schools in the province along with all senior and junior clubs. Sport sponsorships are an ideal fit for Glanbia in promoting a healthy and active lifestyle.
Sponsorship in the community
CHAIRMAN’S STATEMENT
GROUP MANAGING DIRECTOR’S REVIEW
OUR BUSINESS MODELS
GROUP FINANCE DIRECTOR’S REVIEW
RISK MANAGEMENT
OUR RESPONSIBILITIES
Pictured left to right: Tommy Walsh, Jackie Tyrell,Colin Gordon,CEO, Consumer Products, TJ Reid and Michael Rice

FOCUS DELIVERY MOMENTUM
GLANBIA PLC
ANNUAL REPORT 2010 35 DIRECTORS' REPORT:
GROUP PERFORMANCE
Southwest Cheese joint ventureIn 2010, there was a 40% expansion of production capacity at Southwest Cheese and in conjunction with this expansion many sustainability improvement projects are being implemented to improve efficiency of those operations. This is an ongoing process.
In 2010, the amount of water used to process a pound of milk has reduced by 16% and further gains are expected in 2011 on foot of the new facilities and related sustainability improvement projects. CO2 emissions declined year on year by 15% per pound of product processed, reflecting the positive benefits of the various environmental initiatives undertaken in 2010. Southwest Cheese achieved biogas generation and usage of 61 million cubic feet of biogas in 2010. In 2011, the target is 1 billion cubic feet.
Local community initiativesGlanbia has a long tradition of working with local communities through corporate giving, sponsorship and employee volunteering. 2010 was another strong year of support.
IrelandGlanbia’s collaboration with Barretstown commenced in 2008 and has proven to be a highly successful three tiered partnership incorporating the Group, the Avonmore
brand and employee fundraising. The association of Barretstown with the Avonmore brand aligns our corporate and employee giving with our business strategy. A corporate donation of €250,000 plus employee fundraising of €60,000 saw Glanbia donate €310,000 to the charity in 2010. Avonmore’s sponsorship of weather forecasts on Irish television as part of its brand strategy is being used to highlight Glanbia’s association with the charity and on-pack promotions gives Barretstown substantial exposure across Ireland on a daily basis.
During 2010 there was a lot of team spirit and dedication among employees in support of Barretstown, who rowed in behind their business unit ‘Champions’ and volunteered their personal time and money for the benefit of the many sick children and families that attend Barretstown camp. Record numbers participated in the many events organised throughout the year in an effort to achieve the fundraising goal, including:
• Over 420 cyclists who took part in the Tour de Kilkenny in August; and
• Over 60 Irish employees climbed Ireland’s highest mountain in September 2010 and raised almost €23,000.
The money raised by Glanbia is a significant contribution to the running of Barretstown and the Group’s contribution helped 220 sick children attend a 10-day summer camp this year.
USAIt is a million dollars ago that the US Cheese team started an annual charity golf event to raise money for local charities. $20,000 was raised in the first year and over the past 17 years over $1 million has been donated to more than 50 local non-profit groups in the Magic Valley in Idaho. With the help of golfers, sponsors and Glanbia volunteers, a million dollar event has been created. $115,000 was raised in 2010.
Following the end of a two year partnership with Shriner’s Hospitals in the USA, US Cheese decided to work with community projects in the town of Gooding, Idaho where they have a major facility. A committee was established consisting of employees and representatives from the town to explore the community’s needs. The first project was Christmas decorations for the streets of Gooding as the old lights dated back to the 1950’s. The team also distributed cheese to the teachers, staff and administrators of local schools, in recognition of their contribution and the importance of their work in the community. This partnership will be developed further during 2011.
“ We are so thankful to Glanbia and all its fantastic employees who have made a tremendous contribution to life at Barretstown since this partnership began over two years ago. Glanbia has proven to be such fantastic supporters of the camp on so many levels and we look forward to continuing this relationship in the coming years. The Glanbia ‘Champions’ and employees all over Ireland should be so proud and know that they have made a direct impact on over 2,000 children and their families who are living and dealing with childhood cancer. On behalf of the camp, the children and families I would sincerely like to thank Glanbia and its employees for their tremendous contribution”. Dee Ahearn, Chief Executive of Barretstown
CHAIRMAN’S STATEMENT
GROUP MANAGING DIRECTOR’S REVIEW
OUR BUSINESS MODELS
GROUP FINANCE DIRECTOR’S REVIEW
RISK MANAGEMENT
OUR RESPONSIBILITIES
Brian Phelan, Group Human Resources & Operations Development Director, Maria Porter, Glanbia Consumer Products ‘Champion’, Dee Ahearn, Chief Executive Barretstown with the Mulvey family, former Barretstown campers at the presentation by Glanbia staff of €60,000 to the charity.

GLANBIA PLC
ANNUAL REPORT 2010 36 DIRECTORS' REPORT:
DIVISIONAL PERFORMANCE
FOCUS DELIVERY MOMENTUM
US CHEESE & GLOBAL NUTRITIONALS
DAIRY IRELAND
JOINT VENTURES & ASSOCIATES
Results overview on a constant currency basisIn 2010, US Cheese & Global Nutritionals revenue increased 22.6% to €971.5 million (2009: €792.4 million). Operating profit pre exceptional increased 4.3% to €93.9 million (2009: €90.0 million). Operating margin pre exceptional decreased 170 basis points to 9.7% (2009: 11.4%). EBITA pre exceptional increased 4.3% to €104.6 million (2009: €100.3 million). EBITDA pre exceptional increased 6.2% to €116.8 million (2009: €110.0 million).
US CheeseGiven the trading environment, US Cheese performed reasonably well in 2010, however profits and margins were lower than 2009. Good revenue growth was achieved mainly as a result of better cheese market prices, which improved on the historical lows reached in 2009. Market demand was solid and export demand grew strongly from a relatively low base. Production volumes were lower in 2010 as a consequence of the planned major refurbishment of the smaller of the Idaho cheese plants in the first half. In addition, following a very difficult farming environment in 2009, milk production was tight particularly in the first half. This placed pricing pressure on securing supply, necessitating the payment of milk premiums during the year. Overheads were also higher as the business invested in supply chain management, technical services to cheese customers and risk management services to milk suppliers. While supply pressures eased somewhat into the second half,
US Cheese & Global Nutritionals
cheese markets were volatile and difficult, particularly in the fourth quarter when markets declined sharply. This was due to a combination of relatively high US cheese stocks and softer buyer demand.
The Twin Falls plant refurbishment project was a significant operational success for the US Cheese team in 2010. The project involved upgrading the plants infrastructure and processing equipment. The timing of this project coincided with the commissioning of Southwest Cheese’s capacity expansion, which enabled US Cheese to seamlessly continue to meet our customers’ product requirements.
Strategically, the business is well positioned to continue to grow. This will be achieved through increasing added value services and products for customers, further improving the industry-leading level of efficiency and taking advantage of long term, scale growth opportunities internationally for US Cheese.
2011 outlookA strong rally commenced in US cheese markets in early 2011, as a result of a perceived overcorrection in the fourth quarter of 2010. While overall milk supply is expected to grow modestly in 2011, we expect other dairy product prices to outpace cheese prices and as a result the milk procurement environment will remain very competitive. US Cheese continuously monitors the balance of milk cost to milk availability as part of risk management and has continued its strategy of reducing its exposure to US cheese market price volatility through hedging mechanisms. Glanbia is forecasting steady domestic US demand with expanding exports to international markets in 2011. Overall, an improved performance is expected for US Cheese this year.
Global NutritionalsGlobal Nutritionals had a good year, with strong volume and revenue growth outpacing general market growth rates in all three business units. There was strong demand globally for sports nutrition and protein fortified products for weight management, active ageing, infant formula and fortified bar and beverage products.
Ingredient TechnologiesIngredient Technologies had a good year in 2010 as higher and broader demand, both geographically and by sector, together with higher global whey prices drove good revenue, profit growth and higher margins. Key factors in the 2010 market environment were increasing demand from the sports nutrition sector, more mainstream uptake of whey in bars and beverages, demand in new sectors such as processed and natural meats, prepared foods and yoghurts and growing consumer requirements for clean labelling and use of natural ingredients. The trends during 2010 are anticipated to continue through 2011.
Constant Currency Reported
2010 2009 Change 2010 Change
Revenue €971.5m €792.4m + 22.6% €1,021.9m + 29.0%
Operating profit €93.9m €90.0m + 4.3% €93.8m + 4.2%
Operating margin 9.7% 11.4% - 170bps 9.2% - 220bps
EBITA €104.6m €100.3m + 4.3% €104.5m + 4.2%
EBITA margin 10.8% 12.7% - 190bps 10.2% - 250bps
EBITDA €116.8m €110.0m + 6.2% €116.7m + 6.1% Results are stated pre exceptional items
47For details of US Cheese & Global Nutritionals management
For further information:www.glanbianutritionals.comwww.glanbiausa.comwww.optimumnutrition.comwww.bsnonline.net

FOCUS DELIVERY MOMENTUM
GLANBIA PLC
ANNUAL REPORT 2010 37 DIRECTORS' REPORT:
DIVISIONAL PERFORMANCE
US CHEESE AND GLOBAL NUTRITIONALS
DAIRY IRELAND
JOINT VENTURES & ASSOCIATES
Highlights for Ingredient Technologies for the year include:
• Strong innovation and product development with:
• good success in the growing lifestyle/granola and bar sector;
• numerous launches globally to sports nutrition customers;
• a range of novel functional whey propositions for processed food applications; and
• partnering with customers to develop different protein beverage offerings and new whey ingredients to facilitate the development of complex beverage solutions;
• Formulation success by incorporating an increasing level of non-dairy ingredients into ingredient solutions to expand the range of offerings to customers; and
• Restructuring of the regional business to drive growth in value-added solutions in key markets.
2011 priorities for this business are to continue to grow value-added solutions, leverage Glanbia’s scale and regional spread, develop complementary ingredient opportunities, continue to drive international development and further enhance R&D to focus on customer partnering.
Performance NutritionPerformance Nutrition also had a good year, driven by strong volumes and innovation. Revenue growth significantly outpaced market rates but margins declined due to increased investment in marketing and management together with the impact of higher input costs. The business continued to perform strongly both in the USA and internationally and key new product launches for 2010 exceeded expectations. The ABB brand was successfully repackaged and relaunched. A new product in the growing pre-workout energy category – Amino Energy – was also successfully launched. The business won a number of industry awards including four prestigious supplement awards for best protein powder, best supplement, best new supplement and best brand. In addition, ON brand athletes were voted the top male and female BodySpace spokes models for the year. BodySpace is the largest online fitness forum in the world with over 700,000 active profiles.
Internationally, Performance Nutrition established a clear route-to-market in key territories and has developed distribution relationships across the EMEA and Asia Pacific regions. Another key milestone was the launch of a transactional website enabling e-commerce in selected markets. At the moment this capability is live in Ireland, the UK and South Korea and we plan to roll it out to a wider audience over time.
Market growth in the sports nutrition sector both in the USA and internationally is estimated to be approximately 7% in 2011and total market size at retail selling price is in the region of $3 billion in the USA and $1.5 billion internationally. The powder sub-sector, where ON is particularly strong, is estimated to represent 85% of the total sports nutrition market.
Key priorities in 2011 for Performance Nutrition are:
• Seamlessly integrate BSN and evaluate growth opportunities;
• Enhance customer service through best in class operational efficiency;
• Continue to drive new product commercialisation;
• Continue to develop key brands in both the premium protein category and the energy category; and
• Investment in resources and facilities to drive business growth momentum.
Customised Premix SolutionsCustomised Premix Solutions achieved good revenue growth in key market segments and continued to develop customer specific solutions for core end markets globally. Revenue, profits and margins were ahead of 2009. This business unit achieved very solid growth across all regions with both organic growth and new business development. In the market environment, there was an increasing rate of product innovation demand from customers, beginning a shift away from the product renovation and cost saving projects of recent years. Customised Premix Solutions is increasingly being recognised by multinational companies as a global provider with a broad product offering.
Key priorities for this business unit in 2011 are to continue to deliver exceptional service to our key customers, increase geographic coverage and deepen the customer base.
2011 outlookGlanbia’s core nutritionals sectors have strong structural market growth drivers that are expected to continue to gather pace in 2011 and beyond. The new customer collaboration centre in Idaho is contributing to building joint development plans with key customers for Global Nutritionals and supporting business growth objectives. Expectations are that Global Nutritionals will perform well overall in 2011.

GLANBIA PLC
ANNUAL REPORT 2010 38 DIRECTORS' REPORT:
DIVISIONAL PERFORMANCE
FOCUS DELIVERY MOMENTUM
US CHEESE & GLOBAL NUTRITIONALS
DAIRY IRELAND
JOINT VENTURES & ASSOCIATES
Results overviewDairy Ireland made a good recovery in 2010, compared with a very difficult 2009. Revenue grew 10.7% to €1.1 billion (2009: €1.0 billion). Operating profit pre exceptional increased 81.3% to €43.5 million (2009: €24.0 million) and the operating margin pre exceptional increased 150 basis points to 3.8% (2009: 2.3%). EBITA pre exceptional increased 74.2% to €47.9 million (2009: €27.5 million). EBITDA pre exceptional increased 48.0% to €66.9 million (2009: €45.2 million).
Dairy Ireland 2010 2009 Change
Revenue €1,138.6m €1,028.8m + 10.7%
Operating profit €43.5m €24.0m + 81.3%
Operating margin 3.8% 2.3% + 150bps
EBITA €47.9m €27.5m + 74.2%
EBITA margin 4.2% 2.7% + 150bps
EBITDA €66.9m €45.2m + 48.0% Results are stated pre exceptional items
Dairy Ingredients IrelandIn 2010, market conditions improved across all global dairy product categories in line with firm demand and tight supply conditions. This delivered an improved performance in Dairy Ingredients Ireland, despite higher milk costs during the year. This business recovered from being loss making for the first time in 2009 but margins were at the lower end of the historical range.
There was a strong focus on cost management during the year and targeted saving initiatives both at gross margin and overhead level were achieved. A significant number of people exited the business resulting in considerable reorganisation of resources and reshaping of work systems. A reallocation of management and technical resources coupled with the first full year’s operation of a new manufacturing execution system facilitated by SAP, the Group’s IT platform, resulted in a step change in operational performance of the processing facilities. Cost reduction and value creation are on-going aims within the business and the focus on these areas will continue into 2011.
Dairy Ingredients Ireland was recognised as ‘Innovation Exporter of the Year’ by The Irish Exporters Association for its successful commercialisation of the specialist milk protein product called Solmiko. Significant progress was also made in developing the Middle East as a market for cheese and fat-filled milk powders through having a dedicated sales team in the region and offering customised cheese solutions for local processing by key customers.
Dairy Ingredients Ireland continues to examine methods for reducing the effects of global dairy market price volatility on both the business and its supplier base. Towards the end of 2010 a fixed milk price scheme for a period of three years was discussed with milk suppliers. The concept was well received and the business will seek to develop the scheme further to reflect more closely current market conditions.
Global dairy markets have risen further to date in 2011 and are currently expected to remain firm throughout the year. Dairy Ingredients Ireland is expected to perform well in 2011.
Love Irish FoodOver 25 of Ireland’s leading food and drink brands formed a new independent organisation called Love Irish Food. This was established to promote Irish manufactured food and drink brands to consumers, in a bid to help enhance the future of Ireland’s largest indigenous industry which offers direct and indirect employment to over 230,000 workers. Consumer Products is a key supporter of this initiative, which celebrated its first anniversary in 2010.
47For details of Dairy Ireland management
For further information:www.glanbia.comwww.avonmoresupermilk.iewww.glanbiaagribusiness.ie

FOCUS DELIVERY MOMENTUM
GLANBIA PLC
ANNUAL REPORT 2010 39 DIVISIONAL PERFORMANCE US CHEESE & GLOBAL NUTRITIONALS
DAIRY IRELAND
JOINT VENTURES & ASSOCIATES
Consumer ProductsMarket conditions for Consumer Products remained very challenging in 2010 and overall revenue, operating profit and margins were lower than 2009. Consumer confidence in Ireland declined as the year progressed and value remains the key focus in all food categories.
Consumer Products had a mixed year across its portfolio. The highlights include market share gains for Avonmore milk and a good performance in particular by the value added branded milk products. The innovations in Avonmore ‘Easy Pour’ jug and Supermilk continued to underpin branded milk volumes in 2010, with household penetration of Avonmore ‘Easy Pour’ jug increasing by 50% in the year. 2010 also saw Consumer Products achieve national distribution for the Avonmore milk range. Subject to regulatory approval, Consumer Products has agreed to acquire the Limerick-based liquid milk business of Kerry Group plc. This will enable Consumer Products expand its successful liquid milk business.
The trading environment for fresh dairy products was difficult in 2010 driven by intensive price promotion activity. For the food business overall it was a difficult year with margin pressure both on pricing and input costs.Significant cost reductions were achieved in the operational cost base driven primarily by headcount and process re-engineering. Consumer Products continued to invest in supply chain management in 2010 and now has the most advanced route-to-market capability within the chilled grocery sector in Ireland. While Consumer Products performance was lower year-on-year, this business is now on a more sustainable operating platform given the prevailing market conditions.
While underlying volume trends have stabilised for Consumer Products the market remains fragile and the trading environment for 2011 is expected to continue to be difficult. In 2011, Consumer Products plans to continue to drive cost reductions to offset input and promotional cost pressures. Overall performance for 2011 is expected to be broadly in line with 2010.
CountryLife Garden CentresFrom a standing start three years ago Agribusiness has developed a niche garden centre offering in our CountryLife retail outlets. This business has strong growth prospects centered on excellent customer service supported by horticultural expertise, strong product quality and competitive pricing. Just one year after opening, the CountryLife Garden Centre in Castlecomer, Co. Kilkenny, has been awarded the prestigious Bord Bia ̀ 2010 Best DIY/Garden Centre of the Year Award´ and the ̀ 2010 Best New Garden Centre of the Year Award´ and 4 Star Accreditation.
Consumer Products 2010 awards:
• The Supermilk marketing campaign won a gold medal in ‘advertising effectiveness’ from The Institute of Advertising Practitioners in Ireland;
• A Gold Medal from the Marketing Institute of Ireland for Avonmore’s Corporate Social Responsibility (CSR) programme with Barretstown camp for sick children;
For more on this see Our responsibilities
• The milk production facility in Ballitore was shortlisted as a finalist in the National Standards Authority of Ireland Environmental awards;
• Consumer Products became the first Irish business to be awarded a multi-site award for IS 16001 energy management; and
• Consumer Products supply chain won a prestigious environmental award from the Chartered Institute of Transport and Logistics.
31
AgribusinessIn 2010, the recovery in milk and grain prices boosted farm incomes. This supported good volume growth across key categories of feed and fertiliser in Agribusiness during the year. Throughout 2010 the business focused on:
• cost reduction programmes to achieve a more sustainable and competitive cost base; and
• enhanced customer offering by developing focused business manager teams with capability to add value for farmer customers.
In 2010, the business performed broadly in line with 2009. In 2011, the Group expects a marginal improvement in performance through an improved product mix and continued tight management of the cost base.
Pictured receiving the Marketing Institute of Ireland award were – L to R – Aidan Power, EBS Building Society and Robert Jordan, Marketing Manager, Glanbia Beverages.
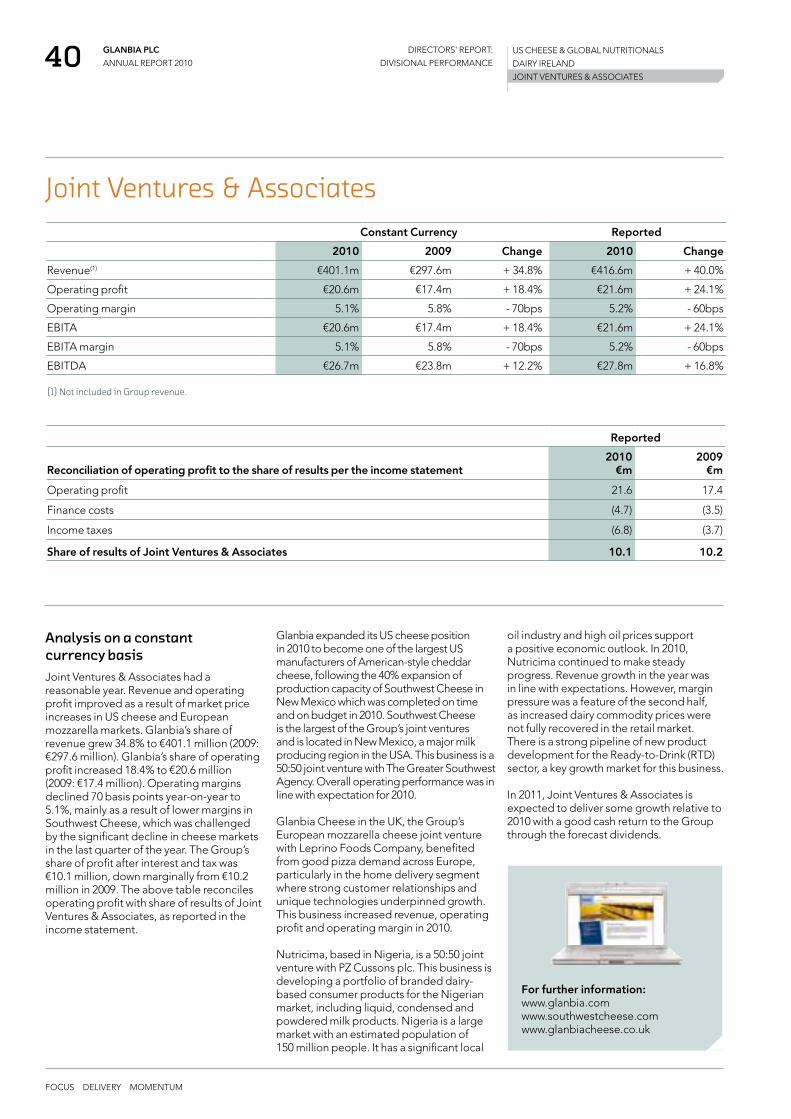
GLANBIA PLC
ANNUAL REPORT 2010 40 DIRECTORS' REPORT:
DIVISIONAL PERFORMANCE
FOCUS DELIVERY MOMENTUM
US CHEESE & GLOBAL NUTRITIONALS
DAIRY IRELAND
JOINT VENTURES & ASSOCIATES
Analysis on a constant currency basisJoint Ventures & Associates had a reasonable year. Revenue and operating profit improved as a result of market price increases in US cheese and European mozzarella markets. Glanbia’s share of revenue grew 34.8% to €401.1 million (2009: €297.6 million). Glanbia’s share of operating profit increased 18.4% to €20.6 million (2009: €17.4 million). Operating margins declined 70 basis points year-on-year to 5.1%, mainly as a result of lower margins in Southwest Cheese, which was challenged by the significant decline in cheese markets in the last quarter of the year. The Group’s share of profit after interest and tax was €10.1 million, down marginally from €10.2 million in 2009. The above table reconciles operating profit with share of results of Joint Ventures & Associates, as reported in the income statement.
Joint Ventures & AssociatesConstant Currency Reported
2010 2009 Change 2010 Change
Revenue(1) €401.1m €297.6m + 34.8% €416.6m + 40.0%
Operating profit €20.6m €17.4m + 18.4% €21.6m + 24.1%
Operating margin 5.1% 5.8% - 70bps 5.2% - 60bps
EBITA €20.6m €17.4m + 18.4% €21.6m + 24.1%
EBITA margin 5.1% 5.8% - 70bps 5.2% - 60bps
EBITDA €26.7m €23.8m + 12.2% €27.8m + 16.8% (1) Not included in Group revenue.
Reported
Reconciliation of operating profit to the share of results per the income statement2010
€m2009
€m
Operating profit 21.6 17.4
Finance costs (4.7) (3.5)
Income taxes (6.8) (3.7)
Share of results of Joint Ventures & Associates 10.1 10.2
Glanbia expanded its US cheese position in 2010 to become one of the largest US manufacturers of American-style cheddar cheese, following the 40% expansion of production capacity of Southwest Cheese in New Mexico which was completed on time and on budget in 2010. Southwest Cheese is the largest of the Group’s joint ventures and is located in New Mexico, a major milk producing region in the USA. This business is a 50:50 joint venture with The Greater Southwest Agency. Overall operating performance was in line with expectation for 2010.
Glanbia Cheese in the UK, the Group’s European mozzarella cheese joint venture with Leprino Foods Company, benefited from good pizza demand across Europe, particularly in the home delivery segment where strong customer relationships and unique technologies underpinned growth. This business increased revenue, operating profit and operating margin in 2010.
Nutricima, based in Nigeria, is a 50:50 joint venture with PZ Cussons plc. This business is developing a portfolio of branded dairy-based consumer products for the Nigerian market, including liquid, condensed and powdered milk products. Nigeria is a large market with an estimated population of 150 million people. It has a significant local
oil industry and high oil prices support a positive economic outlook. In 2010, Nutricima continued to make steady progress. Revenue growth in the year was in line with expectations. However, margin pressure was a feature of the second half, as increased dairy commodity prices were not fully recovered in the retail market. There is a strong pipeline of new product development for the Ready-to-Drink (RTD) sector, a key growth market for this business.
In 2011, Joint Ventures & Associates is expected to deliver some growth relative to 2010 with a good cash return to the Group through the forecast dividends.
For further information:www.glanbia.comwww.southwestcheese.comwww.glanbiacheese.co.uk

FOCUS DELIVERY MOMENTUM
GLANBIA PLC
ANNUAL REPORT 2010 41
Southwest Cheese is one of the largest cheese and high protein whey processing facilities in the USA. In 2010, a 40% expansion of production capacity, costing $90 million, was fully commissioned on time and on budget.

GLANBIA PLC
ANNUAL REPORT 2010 42 DIRECTORS' REPORT:
GOVERNANCE
FOCUS DELIVERY MOMENTUM
"�The�Board�and�management�of�Glanbia�are�committed�to�achieving�the�highest�standards�of�corporate�governance.�We�take�governance�seriously�at�all�levels�of�the�organisation�and�a�robust�governance�structure�underpins�the�delivery�of�the�Group’s�strategy.�I�set�out�below�what�governance�means�to�Glanbia�and�those�approaches�that�work�for�us,�in�the�context�of�our�business�and�culture."
Chairman’s introduction to corporate governance
Liam HerlihyChairman 44
Biography
We focus on governance in a way that promotes:• Transparency, giving our shareholders
the information they need to assess our performance;
• Effective decision-making, risk management and control;
• A good balance between executive, senior management and non-executive Director's roles and responsibilities;
• Keeping the interests of the shareholders aligned with how we manage the business; and
• Maintaining a good dialogue with other stakeholder groups who are associated with our business such as employees, customers, suppliers, regulators and the communities where we operate.
In keeping with the above, this year we have undertaken a review of our annual report and made changes in key areas such as setting out our strategy and business models in more detail; explaining how we manage the business and how governance and risk management is embedded in the organisation; giving greater detail on the risks Glanbia faces; and an enhancement in governance reporting and information.
Board effectivenessEvery three years we conduct an external evaluation of Board effectiveness and the last external review was completed in 2009. In 2010, I undertook a structured internal review through one-on-one interviews with each Director. Full details of this process are set out on page 50 of this report. Overall the results showed a high level of satisfaction amongst the Directors regarding Board processes and decision-making. In my view this is a very positive outcome in a year of significant strategic initiatives and very high levels of engagement by the Board. There are some recommendations from this review process, including more frequent reporting of risk to the Board and more Board meetings hosted at key Group locations. Both of these recommendations will be addressed this year.
Shareholder engagementThere was a high level of investor relations activity undertaken by senior management in 2010 and over 100 individual investor meetings were held. Whenever possible, all Directors attend the AGM and shareholders are invited to ask questions during the meeting and have the opportunity to meet with the Directors following the conclusion of the formal part of the meeting.
There were a number of meetings with the Council of Glanbia Co-operative Society Limited, including formal presentations to the Council on results and major strategic decisions such as the acquisition of Bio-Engineered Supplements and Nutrition business (BSN) in January 2011.
Looking ahead to 2011As set out in corporate governance highlights on page 15 of my Chairman’s statement, the Board has a strong commitment to high standards of conduct and good governance. Our 2011 governance objectives and targets include:
• Delivery of earnings growth in line with market expectations;
• Successful integration of the BSN acquisition;
• Ongoing assessment of key risks and uncertainties;
• Enhance Board relationships with key business units and personnel through on-site Board meetings at Irish and US business locations;
• Implement regulatory and governance changes at an appropriate level for the Group;
• Review and update of the Group remuneration policy framework.
CHAIRMAN’S INTRODUCTION
BOARD OF DIRECTORS & SENIOR MANAGEMENT
APPLYING THE PRINCIPLES OF THE COMBINED CODE
OTHER STATUTORY INFORMATION
COMMITTEE REPORTS
STATEMENT OF DIRECTORS RESPONSIBILITIES

FOCUS DELIVERY MOMENTUM
GLANBIA PLC
ANNUAL REPORT 2010 43 DIRECTORS' REPORT:
GOVERNANCE
Group Operating ExecutiveMonthly meetingsPurpose is to monitor performance and make key strategic recommendations to the Board. This forum is also the Group Risk Committee.
Audit CommitteeKey activities include review of financial statements and auditor’s independence, internal control and risk management systems, and the effectiveness of the Internal Audit function.
Remuneration CommitteeKey activities include review of executive Directors and senior management salaries and benefits, approval of annual bonus targets and long term incentive plan awards.
Nomination CommitteeKey activities include making recommendations on the appointment of the Chairman, vice-Chairmen and new non-executive Directors, planning for the orderly succession of Directors and review of the independence and time commitment of non-executive Directors.
Group Management CommitteeQuarterly meetingsThe Group Management Committee brings together key business unit CEOs and the Group Operating Executive and has responsibility for delivery of Glanbia’s annual business plans and strategy.
Risk managementThe Board has ultimate responsibility for risk, which includes the Group’s risk governance structure and maintaining appropriate internal controls. The Audit Committee has responsibility for reviewing the effectiveness of the Group internal control and risk management systems.
Group Senior Leadership TeamBi-annual meetingsThis brings together the Group Operating Executive, Group Management Committee members, senior business unit teams and Group functional heads. The focus is to drive shared understanding of Glanbia's goals and objectives and the role of each business unit in delivering the annual business plan and strategy and to build on Group-wide capabilities, initiatives and collaboration opportunities.
Board of Directors
Non-executive Chairman
Two non-executive vice-Chairmen
Senior Independent Director
Three executive Directors
Fourteen non-executive Directors
Find out more
How we are structured
Group Managing Director’s review
Group Finance Director’s review
Risk management
Divisional performance
Board of Directors and senior management
Audit Committee report
Nomination Committee report
Remuneration Committee report
Go online www.glanbia.com/report
44
57
59
61
16
Governance & risk framework
CHAIRMAN’S INTRODUCTION
BOARD OF DIRECTORS & SENIOR MANAGEMENT
APPLYING THE PRINCIPLES OF THE COMBINED CODE
OTHER STATUTORY INFORMATION
COMMITTEE REPORTS
STATEMENT OF DIRECTORS RESPONSIBILITIES
9
22
27
36

GLANBIA PLC
ANNUAL REPORT 2010 44 DIRECTORS' REPORT:
GOVERNANCE
FOCUS DELIVERY MOMENTUM
Jerry Liston Chairman of Remuneration Committee
Jerry Liston (B.A., MBA) (aged 70) was appointed to the Board in 2002. He was formerly Chief Executive of United Drug plc and past Executive Chairman of the Michael Smurfit Graduate School of Business.
Chair: Remuneration Committee
Member: Nomination Committee/ Audit Committee
John Callaghan Senior Independent Director
John Callaghan (FCA, FIB) (aged 68) was appointed to the Board in 1998 and is the Senior Independent Director. He is a director of a number of companies including Topaz Energy Group, ACC Bank plc and Rabobank Ireland plc. He was formerly Managing Partner of KPMG (Ireland), Chief Executive of Fyffes plc and Chairman of First Active plc.
Chair: Audit Committee
Member: Nomination Committee/ Remuneration Committee
Victor Quinlan1 Vice-Chairman
Victor Quinlan (B.Agr.Sc.) (aged 65) is vice-Chairman. He was first appointed to the Board in 1996 and was appointed vice-Chairman in 2005. He is Chairman of Irish Co-operative Society Limited and the Malting Company of Ireland Limited and a director of D Walsh & Sons Limited and a number of other Irish companies. He farms at Baptistgrange, Lisronagh, Clonmel, Co. Tipperary.
Member: Audit Committee/ Remuneration Committee
Martin Keane Vice-Chairman
Martin Keane (aged 55) is vice-Chairman. He was appointed to the Board in 2006 and vice-Chairman on 29 June 2010. He is a director of Co-operative Animal Health Limited and Donaghmore Famine Work House and Agricultural Museum Co-operative Society Limited. He farms at Errill, Portlaoise, Co. Laois.
Member: Audit Committee/ Remuneration Committee
Liam Herlihy1 Chairman
Liam Herlihy (aged 59) is Chairman. He was appointed to the Board in 1997, vice-Chairman in 2001 and Chairman in May 2008. He is also Chairman of Glanbia Co-operative Society Limited and a director of the Irish Dairy Board Co-operative Limited and Irish Co-operative Organisation Society Limited. He completed the Institute of Directors Development Programme (2006) and holds a certificate of merit in Corporate Governance at UCD. He farms at Headborough, Knockanore, Tallow, Co. Waterford.
Chair: Nomination Committee
Member: Audit Committee/ Remuneration Committee
Board of Directors and senior management
Martin KeaneJohn CallaghanJerry Liston Victor Quinlan Liam Herlihy
Non-executive Directors
1 Completed the University College Cork Diploma in Corporate Direction
CHAIRMAN’S INTRODUCTION
BOARD OF DIRECTORS & SENIOR MANAGEMENT
APPLYING THE PRINCIPLES OF THE COMBINED CODE
OTHER STATUTORY INFORMATION
COMMITTEE REPORTS
STATEMENT OF DIRECTORS RESPONSIBILITIES
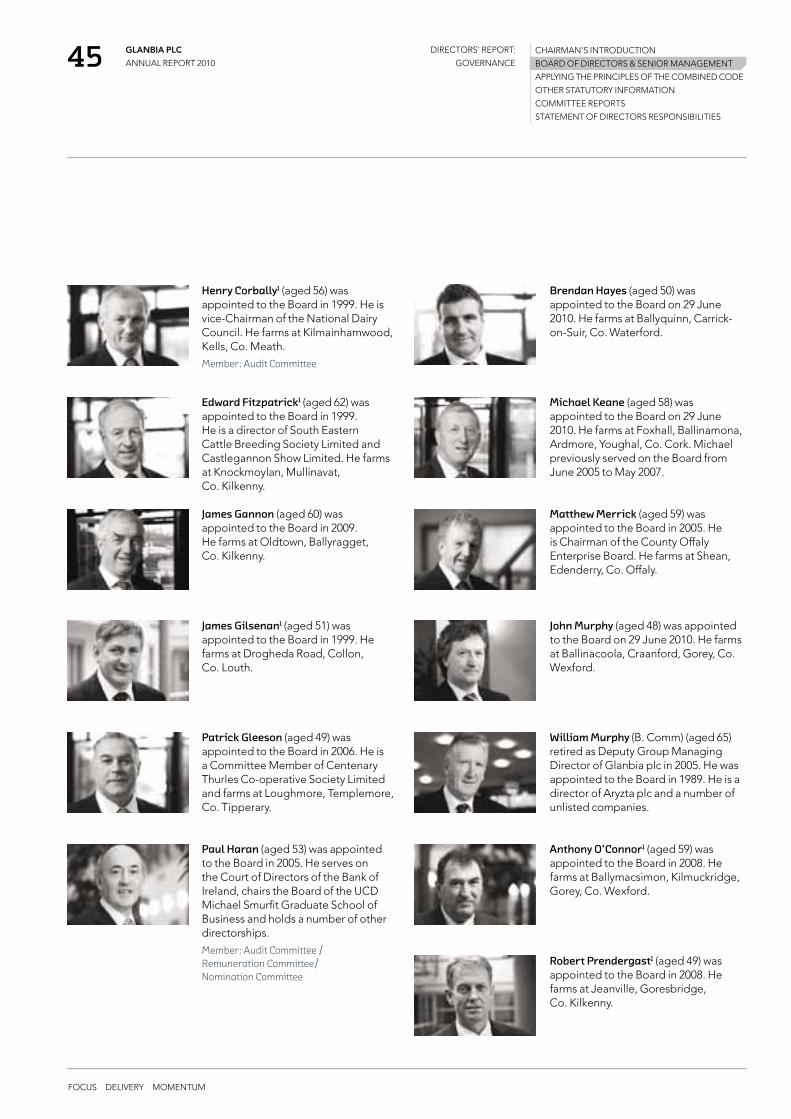
FOCUS DELIVERY MOMENTUM
GLANBIA PLC
ANNUAL REPORT 2010 45 DIRECTORS' REPORT:
GOVERNANCE
Robert Prendergast1 (aged 49) was appointed to the Board in 2008. He farms at Jeanville, Goresbridge, Co. Kilkenny.
Henry Corbally1 (aged 56) was appointed to the Board in 1999. He is vice-Chairman of the National Dairy Council. He farms at Kilmainhamwood, Kells, Co. Meath.
Member: Audit Committee
Brendan Hayes (aged 50) was appointed to the Board on 29 June 2010. He farms at Ballyquinn, Carrick-on-Suir, Co. Waterford.
Edward Fitzpatrick1 (aged 62) was appointed to the Board in 1999. He is a director of South Eastern Cattle Breeding Society Limited and Castlegannon Show Limited. He farms at Knockmoylan, Mullinavat, Co. Kilkenny.
James Gilsenan1 (aged 51) was appointed to the Board in 1999. He farms at Drogheda Road, Collon, Co. Louth.
Patrick Gleeson (aged 49) was appointed to the Board in 2006. He is a Committee Member of Centenary Thurles Co-operative Society Limited and farms at Loughmore, Templemore, Co. Tipperary.
Paul Haran (aged 53) was appointed to the Board in 2005. He serves on the Court of Directors of the Bank of Ireland, chairs the Board of the UCD Michael Smurfit Graduate School of Business and holds a number of other directorships.
Member: Audit Committee / Remuneration Committee/ Nomination Committee
Matthew Merrick (aged 59) was appointed to the Board in 2005. He is Chairman of the County Offaly Enterprise Board. He farms at Shean, Edenderry, Co. Offaly.
John Murphy (aged 48) was appointed to the Board on 29 June 2010. He farms at Ballinacoola, Craanford, Gorey, Co. Wexford.
William Murphy (B. Comm) (aged 65) retired as Deputy Group Managing Director of Glanbia plc in 2005. He was appointed to the Board in 1989. He is a director of Aryzta plc and a number of unlisted companies.
Anthony O’Connor1 (aged 59) was appointed to the Board in 2008. He farms at Ballymacsimon, Kilmuckridge, Gorey, Co. Wexford.
James Gannon (aged 60) was appointed to the Board in 2009. He farms at Oldtown, Ballyragget, Co. Kilkenny.
Michael Keane (aged 58) was appointed to the Board on 29 June 2010. He farms at Foxhall, Ballinamona, Ardmore, Youghal, Co. Cork. Michael previously served on the Board from June 2005 to May 2007.
CHAIRMAN’S INTRODUCTION
BOARD OF DIRECTORS & SENIOR MANAGEMENT
APPLYING THE PRINCIPLES OF THE COMBINED CODE
OTHER STATUTORY INFORMATION
COMMITTEE REPORTS
STATEMENT OF DIRECTORS RESPONSIBILITIES

GLANBIA PLC
ANNUAL REPORT 2010 46 DIRECTORS' REPORT:
GOVERNANCE
FOCUS DELIVERY MOMENTUM
John Moloney Siobhán Talbot Kevin TolandBrian Phelan Michael Horan
Group Operating Executive
John Moloney Group Managing Directorand Executive Director
John Moloney (B.Agr.Sc., MBA) (aged 56) is Group Managing Director since 2001, having been appointed to the Board in 1997. He joined the Group in 1987 and held a number of senior management positions including Chief Executive of Food Ingredients and Agribusiness. He was appointed Deputy Group Managing Director in 2000 and assumed the responsibilities of Chief Operating Officer in 2001. Prior to joining the Group he worked with the Department of Agriculture, Food and Forestry and in the meat industry in Ireland. He is a director of the Irish Dairy Board Co-operative Limited, DCC plc and a Council Member of the Irish Business and Employers Confederation.
Brian Phelan Group Human Resources & Operations Development Director
Brian Phelan (B. Comm, FCA) (aged 44), is Group Human Resources & Operations Development Director of Glanbia plc. Brian was appointed to his Human Resources role in 2004 and his role was expanded in May 2007 to include Operations Development and in July 2009 to include the Group Purchasing and Group Business Service areas. Prior to this he was CFO of the Consumer Foods Division. He also worked in Glanbia Ingredients in Ireland and the USA. Prior to joining the Group in 1993 he worked with KPMG.
Kevin Toland CEO and President of Glanbia USA and Global Nutritionals and Executive Director
Kevin Toland (FCMA) (aged 45) was appointed to the Board in 2003. He is CEO and President of Glanbia USA and Nutritionals, having previously held the positions of Group Development Director and Chief Executive of the Consumer Foods Division. Prior to joining Glanbia in 1999, he held a number of senior management positions with Coca-Cola Bottlers in Russia and with Grand Metropolitan plc in Ireland and Central Europe.
Michael Horan Group Secretary
Michael Horan (B.Comm, FCA) (aged 46), was appointed Group Secretary of Glanbia plc in June 2005, having previously held the position of Group Financial Controller since June 2002. He joined the Glanbia Group in 1998 as Financial Controller of the Fresh Pork business in Ireland. Michael previously worked with Almarai Company Ltd in Saudi Arabia and BDO Simpson Xavier.
Siobhán Talbot Group Finance Director and Executive Director
Siobhán Talbot (B.Comm, FCA) (aged 47), joined the Board as Group Finance Director in July 2009. She was appointed Deputy Group Finance Director of Glanbia plc in June 2005. She was formerly Group Secretary and also held a number of senior finance positions, since she joined the Group in 1992. Prior to joining the Group she worked with PricewaterhouseCoopers in Dublin and Sydney, Australia.
CHAIRMAN’S INTRODUCTION
BOARD OF DIRECTORS & SENIOR MANAGEMENT
APPLYING THE PRINCIPLES OF THE COMBINED CODE
OTHER STATUTORY INFORMATION
COMMITTEE REPORTS
STATEMENT OF DIRECTORS RESPONSIBILITIES

FOCUS DELIVERY MOMENTUM
GLANBIA PLC
ANNUAL REPORT 2010 47 DIRECTORS' REPORT:
GOVERNANCE
Hugh McGuireCEOPerformanceNutrition
Hugh McGuire (M.Sc, Dip Finance) (aged 40), is Chief Executive of Glanbia Performance Nutrition. He joined the Group in 2003 and was appointed as Chief Executive of Performance Nutrition in 2008. He previously worked for McKinsey & Co. as a consultant across a range of industry sectors. Prior to this he worked in the consumer products industry with Nestle and Leaf.
Group Management Committee
Jim Bergin CEODairyIngredientsIreland
Jim Bergin (B. Comm, M. Sc. Mngt. Practice) (aged 48), is Chief Executive of Dairy Ingredients Ireland. He joined the Group in 1984 and has held a number of senior positions including Finance Director Agribusiness and subsequently Group Business Process Director. He joined the Ingredients Business as Operations Manager in May 2003 and was appointed Chief Executive of Dairy Ingredients Ireland in March 2005.
Jerry O’Dea CEO&PresidentIngredientTechnologies
Jerry O’Dea (B. Sc Dy., MBA) (age 51), is the President and Chief Executive of Glanbia Nutritionals Ingredient Technologies. He joined the Group in 1981 and has held a number of senior positions including General Manager of Glanbia Ingredients USA and President of Glanbia Nutritionals. He was appointed Chief Executive of Glanbia Nutritionals Ingredient Technologies in 2008.
Colm Eustace CEOAgribusiness
Colm Eustace (B. Ag. Sc, C Dip AF, MBA ) (aged 49 ), is Chief Executive of Agribusiness. He joined the Group in 1985 and has held a number of senior positions within Agribusiness (including Commercial Manager since 1997). He has been Chief Executive of Agribusiness since October 2005 and is a director of Co-operative Animal Health Limited.
Colin Gordon CEOConsumerProducts
Colin Gordon (BBS, MBS, FMII) (aged 49), is Chief Executive of Consumer Foods since his appointment to the Group in 2006. He previously worked in C&C Group plc, the drinks and snack food company where he held a number of senior positions, including Managing Director of C&C (Ireland) Ltd. Colin is currently a member of the Consumer Foods Board of Bord Bia and Chairman of the Consumer Foods Council of the Irish Business and Employers Confederation.
Raimund C. Hoenes CEOCustomisedPremixSolutions
Raimund C. Hoenes (Ph.D., M.Sc.) (aged 44) is Chief Executive of Glanbia Nutritionals Customised Premix Solutions. He joined the Group in 2008 and was appointed Chief Executive of Glanbia Nutritionals Customised Premix Solutions in 2009. He previously worked in a variety of senior roles in the ingredients sector and held positions in several countries.
Jeff WilliamsCEO&PresidentUSCheese
Jeff Williams (BA, MBA) (aged 54), is the President and Chief Executive of US Cheese and has management responsibilities for Glanbia’s joint venture Southwest Cheese. He joined the Group in 1989 and has held many positions in the US Cheese business including Chief Operations Officer and Executive Vice President. Jeff was appointed President and Chief Executive of US Cheese in 2005. Jeff previously worked for six years in the banking industry.
Find out more
Divisional performance: US Cheese & Global Nutritionals
Divisional performance: Dairy Ireland
Divisional performance: Joint Ventures & Associates
36
38
40
CHAIRMAN’S INTRODUCTION
BOARD OF DIRECTORS & SENIOR MANAGEMENT
APPLYING THE PRINCIPLES OF THE COMBINED CODE
OTHER STATUTORY INFORMATION
COMMITTEE REPORTS
STATEMENT OF DIRECTORS RESPONSIBILITIES

GLANBIA PLC
ANNUAL REPORT 2010 48 DIRECTORS' REPORT:
GOVERNANCE
FOCUS DELIVERY MOMENTUM
Our BoardOur Board consists of the Chairman (Liam Herlihy), two vice-Chairmen (Martin Keane and Victor Quinlan); fifteen other non-executive Directors (including John Callaghan, the Senior Independent Director) and three executive Directors (John Moloney, the Group Managing Director, Siobhán Talbot, the Group Finance Director and Kevin Toland, the CEO and President of Glanbia USA and Global Nutritionals).
The roles of the Chairman and Managing Director are separate, with clear written guidance to support the division of responsibility.
Glanbia Co-operative Society Limited (“the Society”), an Irish industrial and provident society, owns 54.5% of the share capital of the Company. The Society nominates from its Board of Directors, which is elected on a three-year basis, fourteen non-executive Directors for appointment to our Board. All of the Directors nominated for appointment by the Society are full time farmers whose involvement in farming has brought them into the agricultural co-operative movement in Ireland. All have significant expertise in the dairy and agricultural industry in Ireland and a significant majority of them have overseen the growth of Glanbia plc into an international nutritional solutions and cheese group over the last number of years.
Compliance with the CodeIt is our view that except in relation to the representation of the majority shareholder on the Board, the Company has been compliant throughout 2010 with the provisions set down in Section 1 of the 2008 Combined Code on Corporate Governance as this applies to all accounting periods beginning before 29 June 2010.
We have noted the changes made in the 2010 UK Corporate Governance Code which has replaced the 2008 Combined Code on Corporate Governance for accounting periods beginning on or after 29 June 2010 and the recommendations of the Irish Stock Exchange contained in the Irish Corporate Governance Annex (which is publicly available on the Irish Stock Exchange's website www.ise.ie), which will not impact the Company until 2011, and are reviewing our current corporate governance practices to ensure that the Company remains compliant and high standards are maintained.
Applying the principles of the Combined Code on Corporate Governance and the 2010 UK Corporate Governance CodeWe conduct our business with due regard for applicable laws, regulations and internal policies. This includes the main and supporting principles in the UK 2008 Combined Code on Corporate Governance (the “Code”). We also acknowledge that laws, regulations and policies do not provide guidance on all types of behaviour. As a result, we have a Code of Conduct for everybody in Glanbia. The Glanbia Code of Conduct is intended as a code of best practice and provides a broad range of guidance about the expected standards of integrity and business conduct. The Code of Conduct is not intended to be a substitute for our responsibility and accountability to exercise good judgment and obtain guidance on proper business conduct. Glanbia employees are encouraged and expected to seek additional guidance and support from others when in doubt.
Board effectivenessWe consider that, to function effectively, all members of our Board need appropriate knowledge of the Group and access to its operations and staff. By reviewing the Group’s operating performance at each Board meeting Directors are kept informed of its progress.
Between Board meetings, Directors are supplied with monthly performance reports, including detailed commentary and analysis. Additionally, presentations and reports on commercial initiatives, the Group’s markets, the Group’s competitive position and general economic indicators are given periodically to our Board.
We also hold a number of Board meetings away from the head office, which provide our Directors with the opportunity to broaden their understanding of the business and key markets and to gain invaluable insights through direct contact with business managers and the operations. The September 2010 Board meeting was held in the US. Our Directors used this opportunity to meet the management of the US Performance Nutrition business, the US Cheese business and the Southwest Cheese business and inspect these facilities.
The Code is referred to in the Listing Rules, applicable to Irish and UK listed companies and is publicly available on the Financial Reporting Council’s website www.frc.org.uk/corporate/ukcgcode.cfm
CHAIRMAN’S INTRODUCTION
BOARD OF DIRECTORS & SENIOR MANAGEMENT
APPLYING THE PRINCIPLES OF THE COMBINED CODE
OTHER STATUTORY INFORMATION
COMMITTEE REPORTS
STATEMENT OF DIRECTORS RESPONSIBILITIES

FOCUS DELIVERY MOMENTUM
GLANBIA PLC
ANNUAL REPORT 2010 49 DIRECTORS' REPORT:
GOVERNANCE
• Group strategy and business plans including responsibility for the overall leadership of the Group, approval of the Group’s long-term objectives and commercial strategy, oversight of the Group’s operations and review of performance in the light of our strategy, objectives, business plans and budgets and ensuring that any necessary corrective action is taken.
• Acquisitions, disposals and other transactions outside delegated limits.The Group Operating Executive considers all major acquisitions, disposals and other transactions prior to its consideration by the Board.
• Financial reporting and controls including approval of the half-yearly report, interim management statements and preliminary announcement of the final results. Approval of the annual report and financial statements, including this corporate governance statement and Committee reports. Approval of any significant changes in accounting policies or practices, ensuring maintenance of a sound system of internal control and risk management including: receiving reports on, and reviewing the effectiveness of, the Group’s risk and control processes to support its strategy and objectives. Undertaking an annual assessment of these processes and approving an appropriate statement for inclusion in this annual report.
• Capital expenditureincluding the annual approval of the operating and capital expenditure budgets and any material changes to them and the implementation of a Group wide policy on capital expenditure which defines limits on expenditure.
• Dividend policyincluding the annual review of our dividend policy and declaration of the interim dividend and recommendation of the final dividend.
• Shareholder documentationincluding approval of resolutions and corresponding documentation to be put forward to shareholders at a general meeting, approval of all circulars, prospectuses and listing particulars and approval of all press releases concerning matters decided by the Board.
• Key business policiesincluding approval of the remuneration, treasury and risk policies.
Following appointment to our Board, Directors undertake an induction programme aimed at familiarising themselves with the Company and the Group. The programme for Directors who joined during 2010 included a review of the following:
• Directors’ duties, corporate governance and Board procedures. The Company has a corporate manual which is issued to all Directors and is regularly updated for new legislation and procedures;
• Business planning and internal control processes;
• Strategy and planning;
• Metrics used to monitor business performance;
• Investor relations;
• Corporate responsibility (including ethical business conduct, and health and safety); and
• Internal Audit.
In addition to the above, as part of the induction process, the new Directors visited the Group’s largest processing plant in Ireland at Ballyragget in order to meet employees and gain an understanding of our products and services.
Briefing sessions on legislative and accounting developments are held for our Board when appropriate. Our Board has received updates from the Group Secretary regarding regulatory changes and new legislation, including, amongst other things, the changes adopted in the 2010 UK Corporate Governance Code, the Irish Stock Exchange Annex, the new UK Stewardship Code and the European Communities (Directive 2006/46/EC) Regulations 2009.
All Directors also have access to the advice and services of the Group Secretary, who is also responsible for advising our Board on all governance matters. The Directors also have access to external advice, if required, at the expense of the Group.
Key matters reserved to the Board
Our Board is responsible for the leadership, direction and control of the Company and its subsidiary companies and is accountable to shareholders for financial performance.
CHAIRMAN’S INTRODUCTION
BOARD OF DIRECTORS & SENIOR MANAGEMENT
APPLYING THE PRINCIPLES OF THE COMBINED CODE
OTHER STATUTORY INFORMATION
COMMITTEE REPORTS
STATEMENT OF DIRECTORS RESPONSIBILITIES

GLANBIA PLC
ANNUAL REPORT 2010 50 DIRECTORS' REPORT:
GOVERNANCE
FOCUS DELIVERY MOMENTUM
CHAIRMAN’S INTRODUCTION
BOARD OF DIRECTORS & SENIOR MANAGEMENT
APPLYING THE PRINCIPLES OF THE COMBINED CODE
OTHER STATUTORY INFORMATION
COMMITTEE REPORTS
STATEMENT OF DIRECTORS RESPONSIBILITIES
Evaluation of the effectiveness of our Board We have established a formal process for the annual evaluation of the performance of the Board, its principal Committees and individual Directors. Questionnaires are drawn up, which provide the framework for the evaluation process. Each member of the Board and appropriate Committee is invited to comment on the performance of the individual, the Board and appropriate Committee and submits replies to the questionnaires which are then collated. The Chairman then meets with each Director individually to discuss the performance of the Board and appropriate Committee and individual Directors and reports his findings to the Board.
It is the practice that evaluation of the performance of the Board be externally facilitated every three years. An external review was completed in 2009.
During 2010 our Board and/or its Committees conducted an evaluation of its own performance, its principal Committees and individual Directors. In completing the annual performance evaluation, the Chairman met each Director individually
to discuss the performance of the Board and individual Directors. The results showed a high level of satisfaction amongst the Directors as to the effectiveness of our Board, its individual Directors and Committees. Arising from the review, our Board has agreed to:
• enhance our risk monitoring policies to include more regular reporting of the status of risks to the Audit Committee and our Board
• ensure that more Board meetings are held at on-site locations to enhance our Directors opportunities to broaden their understanding of the business and key markets
The Chairman wishes to confirm that, following the completion of the performance evaluation process, the members of the entire Board who are all being proposed for re-appointment continue to be effective and continue to demonstrate commitment to their roles. The Senior Independent Director, John Callaghan confirms that the Chairman, also standing for re-appointment at this year’s Annual General Meeting, continues to perform effectively and demonstrates commitment to his role.
IndependenceDuring the year, the Nomination Committee reviewed the independence of the non-executive Directors in accordance with the guidance in the Code and reported its recommendations to the Board.
Our Board determined that throughout the reporting period, John Callaghan, Paul Haran and Jerry Liston were independent. We recognised, however, that the remaining non-executive Directors did not throughout the entire reporting period meet the criteria for independence as specified in the Code. We, however, considered that they are independent in character and judgement.
All of the non-executive Directors bring an independent perspective to their advisory and monitoring roles.
Board and Committee attendanceThe Board held 10 scheduled Board meetings in 2010 (2009: 10) and as in 2009 also held a two day planning and strategy session. The attendance of each Director at the scheduled Board meetings and the two day planning and strategy session
Evaluation of the effectiveness of our Board Internal control and risk management
Find out more 52
Boardprocess
Board culture &relationships
Non-executiveDirectors
Board composition
Overallperformance
Additionalissues
Boardperformance
Report to Board
Actio
n ag
reed
Questionnaires
Implementation
One to one meetings
Risk assessmentThe controlenvironment
Identify &evaluate risks& controlobjectives
Information &communication
Controlprocedures
Monitoring
Glanbiaobjectives
The Board
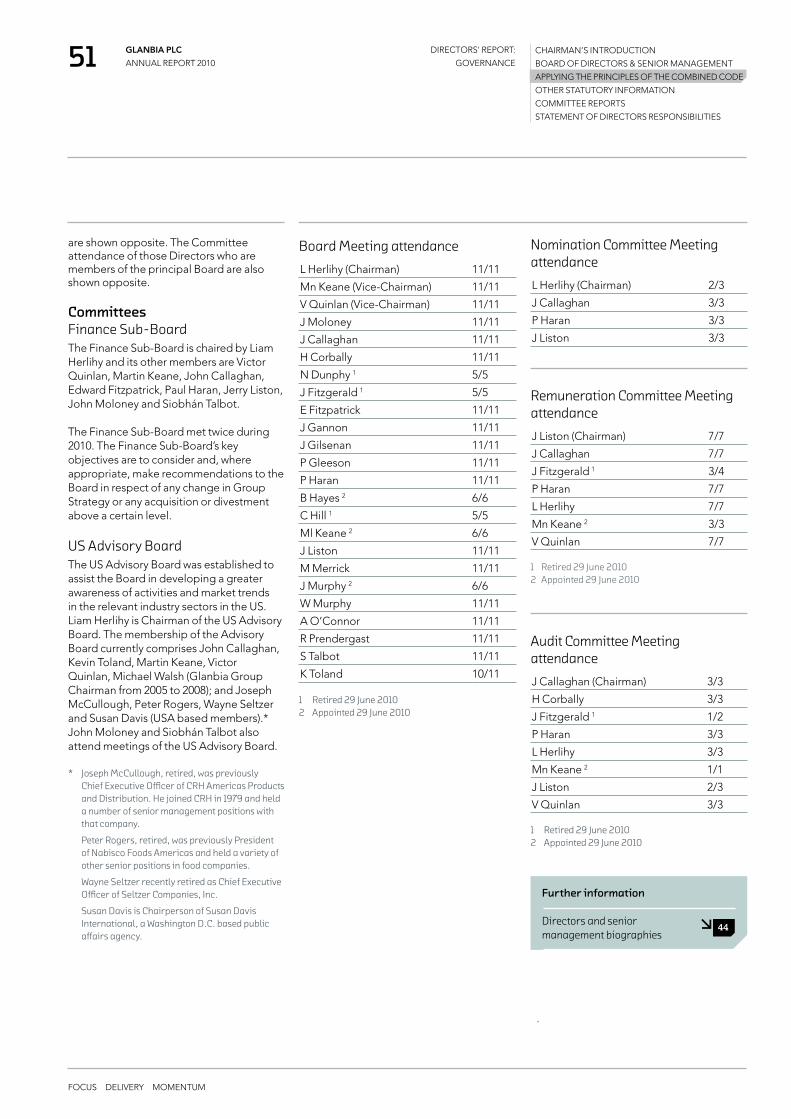
FOCUS DELIVERY MOMENTUM
GLANBIA PLC
ANNUAL REPORT 2010 51 DIRECTORS' REPORT:
GOVERNANCE
CHAIRMAN’S INTRODUCTION
BOARD OF DIRECTORS & SENIOR MANAGEMENT
APPLYING THE PRINCIPLES OF THE COMBINED CODE
OTHER STATUTORY INFORMATION
COMMITTEE REPORTS
STATEMENT OF DIRECTORS RESPONSIBILITIES
Nomination Committee Meeting attendanceL Herlihy (Chairman) 2/3
J Callaghan 3/3
P Haran 3/3
J Liston 3/3
Remuneration Committee Meeting attendanceJ Liston (Chairman) 7/7
J Callaghan 7/7
J Fitzgerald 1 3/4
P Haran 7/7
L Herlihy 7/7
Mn Keane 2 3/3
V Quinlan 7/7
1 Retired 29 June 2010 2 Appointed 29 June 2010
Audit Committee Meeting attendanceJ Callaghan (Chairman) 3/3
H Corbally 3/3
J Fitzgerald 1 1/2
P Haran 3/3
L Herlihy 3/3
Mn Keane 2 1/1
J Liston 2/3
V Quinlan 3/3
1 Retired 29 June 2010 2 Appointed 29 June 2010
Board Meeting attendance L Herlihy (Chairman) 11/11
Mn Keane (Vice-Chairman) 11/11
V Quinlan (Vice-Chairman) 11/11
J Moloney 11/11
J Callaghan 11/11
H Corbally 11/11
N Dunphy 1 5/5
J Fitzgerald 1 5/5
E Fitzpatrick 11/11
J Gannon 11/11
J Gilsenan 11/11
P Gleeson 11/11
P Haran 11/11
B Hayes 2 6/6
C Hill 1 5/5
Ml Keane 2 6/6
J Liston 11/11
M Merrick 11/11
J Murphy 2 6/6
W Murphy 11/11
A O’Connor 11/11
R Prendergast 11/11
S Talbot 11/11
K Toland 10/11
1 Retired 29 June 2010 2 Appointed 29 June 2010
are shown opposite. The Committee attendance of those Directors who are members of the principal Board are also shown opposite.
CommitteesFinance Sub-BoardThe Finance Sub-Board is chaired by Liam Herlihy and its other members are Victor Quinlan, Martin Keane, John Callaghan, Edward Fitzpatrick, Paul Haran, Jerry Liston, John Moloney and Siobhán Talbot.
The Finance Sub-Board met twice during 2010. The Finance Sub-Board’s key objectives are to consider and, where appropriate, make recommendations to the Board in respect of any change in Group Strategy or any acquisition or divestment above a certain level.
US Advisory BoardThe US Advisory Board was established to assist the Board in developing a greater awareness of activities and market trends in the relevant industry sectors in the US. Liam Herlihy is Chairman of the US Advisory Board. The membership of the Advisory Board currently comprises John Callaghan, Kevin Toland, Martin Keane, Victor Quinlan, Michael Walsh (Glanbia Group Chairman from 2005 to 2008); and Joseph McCullough, Peter Rogers, Wayne Seltzer and Susan Davis (USA based members).* John Moloney and Siobhán Talbot also attend meetings of the US Advisory Board.
* Joseph McCullough, retired, was previously Chief Executive Officer of CRH Americas Products and Distribution. He joined CRH in 1979 and held a number of senior management positions with that company.
Peter Rogers, retired, was previously President of Nabisco Foods Americas and held a variety of other senior positions in food companies.
Wayne Seltzer recently retired as Chief Executive Officer of Seltzer Companies, Inc.
Susan Davis is Chairperson of Susan Davis International, a Washington D.C. based public affairs agency.
Further information
Directors and senior management biographies
44

GLANBIA PLC
ANNUAL REPORT 2010 52 DIRECTORS' REPORT:
GOVERNANCE
FOCUS DELIVERY MOMENTUM
Group SecretaryThe appointment and removal of the Group Secretary is a matter for the Board. All Directors have access to the advice and services of the Group Secretary, who is responsible to the Board for ensuring compliance with Board procedures.
Internal control and risk managementThe Board has overall responsibility for the Group’s system of internal control, for reviewing its effectiveness and for confirming that a process exists for the identification, evaluation and management of risk in order to ensure that the Group’s strategic objectives are achieved. The Board also has responsibility for determining the Group’s risk appetite. This process has been in place for the year covered in this Annual Report and financial statements and up to the date of its approval. The Turnbull Guidance sets out best practice on internal control for Irish and UK listed companies to assist them in assessing the application of the Code’s principles and compliance with the Code’s provisions with regard to internal control. In accordance with Section 91(6)(b) of the EC (Directive
2006/43) Regulations 2010, responsibility for monitoring the effectiveness of the Group’s risk management and internal control systems has been delegated to the Audit Committee. The Group’s systems of internal control are regularly reviewed by the Audit Committee and the Board and accord with the Turnbull Guidance which the Board has fully adopted.
While acknowledging its responsibility for the system of internal control, we are aware that such a system is designed to manage rather than eliminate the risk of failure to achieve business objectives, and can only provide reasonable and not absolute assurance against material misstatement or loss.
Our Board has reviewed the effectiveness of the current systems of internal control specifically for the purpose of this statement. In judging the effectiveness of the Group’s controls, our Board monitors the reports of the Audit Committee and management. Without diminishing its own responsibilities the Board has delegated certain acts to the Audit Committee. These include detailed reviews of key risks inherent in the business and of the systems for managing these risks.
The Chairman of the Audit Committee reports to the Board after each meeting of the Committee. In addition, the Board has also taken assurance through the work of the various other Board Committees. We are satisfied that the Group internal controls systems are properly reviewed and effective.
The Directors, through the use of appropriate procedures and systems, have also ensured that measures are in place to secure compliance with the Company’s obligation to keep proper books of account. These books of account are kept at the registered office of the Company.
Share ownership and dealingIn order to maintain investor confidence in the stock markets, quoted companies have an obligation to ensure that their Directors and employees, and anyone closely associated or connected to them, do not place themselves in positions where investors might suspect them of abusing inside information. For this reason, the Company has issued rules covering share dealings by Directors and employees who regularly, or even occasionally, have access to inside information.
• a Code of Conduct that defines a set of agreed standards and guidelines for corporate behaviour;
• a clearly defined organisation structure and lines of authority including appropriate terms of reference for Board committees;
• Group-wide risk assessment process which is maintained by business unit management reporting to the Group Operating Executive and Board;
• the Audit Committee, a formally constituted committee of the Board comprising non-executive Directors only. It meets with internal and external auditors to satisfy itself that control procedures are in place and are being followed;
• a Group Internal Audit function, which is regulated by an Internal Audit Charter which monitors financial, operational and regulatory controls and reports to the Audit Committee and management. The annual audit plan is approved by the Audit Committee;
• a Control Self Assessment programme has been implemented which assesses internal control and fraud prevention processes;
• Internal control and risk management systems in relation to the process for preparing consolidated accounts and financial reporting which includes the following main features:
1 Board approval of the annual business plan following Group and business unit strategy plan reviews;
2 Monitoring of performance against the plan through monthly board reports detailing actual versus budgeted results, analysis of material variances, review of key performance indicators and re-forecasting where required;
3 Audit Committee review of the integrity of the half-year and annual financial statements. Any resulting recommendations are included in the Audit Committee Chairman’s Board report;
4 Board review and approval of the Group consolidated half-year accounts, consolidated annual accounts, interim management statements and any formal announcements;
5 The establishment of clearly defined guidelines for capital expenditure, including detailed budgeting, appraisal and post-investment reviews;
6 Board approval of acquisitions and divestments;
7 The use of a Group finance management manual that clearly sets out Group accounting policies and financial control procedures; and
8 Board approved treasury risk management policies, designed to ensure that Group foreign exchange and interest rate exposures are managed within defined parameters.
Our key systems of internal control and risk management are summarised below:
CHAIRMAN’S INTRODUCTION
BOARD OF DIRECTORS & SENIOR MANAGEMENT
APPLYING THE PRINCIPLES OF THE COMBINED CODE
OTHER STATUTORY INFORMATION
COMMITTEE REPORTS
STATEMENT OF DIRECTORS RESPONSIBILITIES

FOCUS DELIVERY MOMENTUM
GLANBIA PLC
ANNUAL REPORT 2010 53 DIRECTORS' REPORT:
GOVERNANCE
The main principle underlying the rules is that no one should trade in shares of the Company while in possession of inside information about the Company and the Group. Likewise, no one should deal in the shares of the Company, if it would give rise to a suspicion that they are abusing inside information. As a safeguard against any actual or potential abuse of these rules, the Company has appointed as Compliance Officers, the Group Secretary and the Group Finance Director from whom approval must be obtained, in advance, for any share dealings by persons to whom the rules apply.
Communication with shareholdersThe Company has a well-developed investor relations programme managed by the Group Finance Director, which includes regular meetings with investors and Glanbia Co-operative Society Limited, its main shareholder, the annual general meeting and our corporate website.
The Company is committed to maintaining and improving dialogue with shareholders in order to ensure that the objectives of both the Group and the shareholders are understood.
Institutional shareholders, fund managers and analystsA programme of meetings with institutional shareholders, fund managers and analysts takes place each year. The Company also makes presentations to analysts and investors around the time of the half-year and full-year results announcements. In addition, the Board consults with shareholders in connection with specific issues where it considers this appropriate.
During the year, in a number of additional meetings preceding the proposed disposal of the Irish Dairy and Agribusinesses to Glanbia Co-operative Society Limited, various members of the Board met with institutional shareholders and representative bodies, reinforcing the continuation of open dialogue and discussion of strategy between the Board and its shareholders.
The Board receives reports on matters that have been raised with executive Directors at the regular meetings held with investors.
The Senior Independent Director is available to meet with major shareholders to discuss any areas of concern that cannot be resolved through normal channels of investor communication and arrangements can be made to meet with the Senior Independent Director through the Group Secretary. Similarly, arrangements can be made for major shareholders to meet with newly appointed Directors or any of the other Directors.
Glanbia Co-operative Society LimitedA programme of meetings with Glanbia Co-operative Society Limited takes place each year. This includes presentations at the time of the half-year and full-year results announcement.
Private shareholders The Board is equally interested in the concerns of private shareholders and, on its behalf, the Group Secretary oversees communication with these investors. All material information reported to the regulatory news services is simultaneously published on the Company’s website affording all shareholders full access to Company announcements.
Corporate websitePresentations and webcasts on the development of the business are available to all shareholders on the Company’s corporate website. The Company also uses email alerts and actively promotes downloading of all reports enhancing speed and equality of shareholder communication. The Company has availed of the provisions within the Transparency (Directive 2004/109/EC) Regulations 2007 allowing the website to be used as the primary means of communication with shareholders where they have not requested hard copy documentation. The shareholder information section on pages 139 to 141 contains further details on electronic shareholder communications together with more general information of interest to shareholders which is also included on the Company’s corporate website.
Annual General Meeting (AGM)The Board views the AGM, which is held in Kilkenny, as an opportunity to communicate with investors and sets aside time at these meetings for shareholders to ask questions of the Board. At the AGM, the Group Managing Director provides a brief summary of the Company’s activities for the previous year to the shareholders. At the meeting, the Company complies with the Code as it relates to voting, the separation of resolutions and the attendance of Committee chairmen. Whenever possible, all Directors attend the AGM and shareholders are invited to ask questions during the meeting and have an opportunity to meet with the Directors following the conclusion of the formal part of the meeting. In line with the Code, details of proxy voting by shareholders, including votes withheld, are made available on request and are placed on the Company’s website following the meeting.
To ensure shareholders have time to consider the annual report and accounts and notice of the AGM and lodge their proxy votes they are mailed more than 20 working days prior to the meeting. The Group offers all shareholders the choice of submitting proxy votes either electronically or in paper format. It also offers them the ability to abstain.
Annual ReportThe Company’s annual report and accounts and annual review, together with the Company’s half-yearly reports, interim management statements and other public announcements are designed to present a balanced and understandable view of the Group’s activities and prospects and are available on the Company’s website. The Chairman’s statement, Group Managing Director’s review, the Group Finance Director's review and Divisional performance review provide an assessment of the Group’s affairs and are supported by a presentation to be made at the AGM.
CHAIRMAN’S INTRODUCTION
BOARD OF DIRECTORS & SENIOR MANAGEMENT
APPLYING THE PRINCIPLES OF THE COMBINED CODE
OTHER STATUTORY INFORMATION
COMMITTEE REPORTS
STATEMENT OF DIRECTORS RESPONSIBILITIES
GLANBIA PLC
ANNUAL REPORT 2010 54 DIRECTORS' REPORT:
GOVERNANCE
FOCUS DELIVERY MOMENTUM
Principal activitiesGlanbia plc is an international nutritional solutions and cheese group, headquartered in Ireland. Further detail can be found in the Overview section
The Company has set out in this report a fair review of the business of the Group during the financial year ended 1 January 2011 including an analysis of the position of the Group at the end of the financial year, and a description of the principal risks and uncertainties facing the Group (known as a ‘Business review’).The information that fulfils the Business review requirements can be found in the Group and Divisional Performance sections of this report on pages 12 to 41.
Other statutory information
• renew the Directors’ authority to allot relevant securities, within the meaning of Section 20 of the Companies (Amendment) Act, 1983, up to an aggregate nominal amount equal to the authorised but unissued share capital of the Company of the date of the AGM which currently represents 4.14% of the nominal value of the Company’s issued share capital.
• renew the authority to disapply the strict statutory pre-emption provisions in the event of a rights issue or in any other issue up to an aggregate amount equal to the nominal value of the Company's authorised but unissued share capital as at 11 May 2011 which is currently equal to 4.14% of the nominal value of the Company's issued share capital.
• extend the authority to purchase up to 10% of its own shares until the earlier of the close of business on 10 August 2012 or the date of the AGM of the Company in 2012.
• pass a resolution authorising the Company to reissue such shares purchased by it and not cancelled as treasury shares.
• approve a resolution to permit an Extraordinary General Meeting to be called on 14 days notice.
Powers of the DirectorsThe Directors are responsible for the management of the business of the Company and may exercise all powers of the Company subject to applicable legislation and regulation, and the Articles of Association.
At the 2010 AGM, the Directors were given the power to issue new shares up to a nominal amount of €746,658.96. This power will expire on the earlier of the conclusion of the 2011 AGM or 24 August 2011. Accordingly, a resolution will be proposed at the 2011 AGM to renew the Company’s authority to issue further new shares. At the 2010 AGM, the Directors were also given the power to disapply the strict statutory pre-emption provisions in the event of a rights issue or in any other issue up to an aggregate nominal amount of €746,658.96. This authority too will expire on the earlier of the conclusion of the 2011 AGM or 24 August 2011, and a resolution will be proposed at the 2011 AGM to renew this additional authority.
At the 2010 AGM, the Directors were given the power to buy back a maximum number of 29,355,568 ordinary shares at a minimum price of €0.06 each. The maximum price was
Annual General Meeting (AGM)The Company’s AGM will be held on 11 May 2011. Full details of the AGM, together with explanations of the resolutions to be proposed, are contained in the Notice of Meeting available on the Company’s website www.glanbia.com and posted with this report. In addition to the routine ordinary business of an AGM, shareholders are being asked to:
• authorise the Directors to fix the ordinary remuneration of the non-executive Directors from time to time up to an aggregate amount not exceeding #600,000 in any financial year.
• approve the re-election of all the Directors of the Board which is now required by the 2010 UK Corporate Governance Code.
an amount equal to 105% of the average of the middle market quotations of the Company’s ordinary shares as derived from the Irish Stock Exchange Daily Official List for the five business days immediately preceding the day on which such ordinary shares are contracted to be purchased. This power will expire at the earlier of the conclusion of the 2011 AGM or 24 August 2011 and a resolution will be proposed at the 2011 AGM to renew this power. A special resolution will be proposed at the 2011 AGM to renew the Company’s authority to acquire its own shares. At the 2010 AGM, shareholders also authorised the maximum and minimum prices at which the Company may reissue off-market such shares as it may purchase. This authority will expire at the earlier of the conclusion of the 2011 AGM or 24 August 2011 and a resolution will be proposed at the 2011 AGM to renew this authority.
DividendsAn interim dividend of 3.03 cent per share was paid on 29 September 2010 to shareholders on the register at the close of business on 10 September 2010.
The Directors propose a final dividend of 4.49 cents per share. Subject to shareholder approval, the final dividend will be paid on 20 May 2011 to shareholders on the register of members on 8 April 2011.
All dividend payments will be made by direct credit transfer into a nominated Bank or Financial institution. If a shareholder has not provided his/her account details prior to the payment of the dividend, a shareholder will be sent the normal tax voucher advising a shareholder of the amount of his/her dividend and that the amount is being held because his/her direct credit transfer instructions had not been received in time. A shareholder’s dividends will not accrue interest while they are held. Payment will be transferred to a shareholder’s account as soon as possible on receipt of his/her direct credit transfer instructions.
Additionally, if a shareholder’s registered address is in the UK and a shareholder has not previously provided the Company with a mandate form for an Irish Euro account, a shareholder will default to a Sterling payment. All other shareholders will default to a Euro payment.
3
DirectorsThe current Directors who served during the 2010 financial year are listed on pages 44 to 46.
Brendan Hayes, Michael Keane and John Murphy were appointed to the Board on 29 June 2010 following the retirement of John Fitzgerald, Nicholas Dunphy and Christopher Hill.
Retirement of DirectorsIn accordance with the 2010 UK Corporate Governance Code, all Directors will retire at the 2011 Annual General Meeting and, being eligible, offer themselves for re-appointment.
44
CHAIRMAN’S INTRODUCTION
BOARD OF DIRECTORS & SENIOR MANAGEMENT
APPLYING THE PRINCIPLES OF THE COMBINED CODE
OTHER STATUTORY INFORMATION
COMMITTEE REPORTS
STATEMENT OF DIRECTORS RESPONSIBILITIES

FOCUS DELIVERY MOMENTUM
GLANBIA PLC
ANNUAL REPORT 2010 55 DIRECTORS' REPORT:
GOVERNANCE
Political donationsThe Electoral Act, 1997 requires companies to disclose all political donations over €5,079 in aggregate made during the financial year. The Directors, on enquiry, have satisfied themselves that no such donations in excess of this amount have been made by the Group.
Issued share capitalAt 1 January 2011 the authorised share capital of the Company was 306,000,000 ordinary shares of €0.06 each and the issued share capital was 293,835,684 (2009: 293,555,684) ordinary shares of €0.06 each, of which 54.5% was held by Glanbia Co-operative Society Limited. All the Company’s shares are fully paid up and quoted on the Irish and London Stock Exchanges. During the year 280,000 ordinary shares of €0.06 each were allotted to Geoff Meagher, former Finance Director, upon the exercise of his outstanding share options, for a total consideration of €522,125 (205,000 shares at €1.55 each and 75,000 shares at €2.725 each). The prices at which the shares were allotted were fixed on 29 August 2002 and 9 December 2004, the date of the grant of the options (being the market price at close of business on the day preceding the grant of the options).
Details of the Company’s share capital and shares under option or award at 1 January 2011 are given in note 22 and note 23 to the financial statements.
Rights and obligations of ordinary sharesOn a show of hands at a general meeting every holder of ordinary shares present in person or by proxy and entitled to vote shall have one vote. On a poll, every member present in person or by proxy, shall have one vote for every ordinary share held. In accordance with the provisions of the Articles of Association, holders of ordinary shares are entitled to a dividend where declared or paid out of profits available for such purposes. On return of capital on a winding up, holders of ordinary shares are entitled to participate in such a return.
Restrictions on transfer of sharesWith the exception of restrictions on transfer of shares under the Company’s share schemes while the shares are subject to the schemes, there are no restrictions on the voting rights attaching to the Company’s ordinary shares or the transfer of securities in the Company. Under the articles of association of the Company, the Directors have the power to impose restrictions on the exercise of rights attaching to shares where the holder of the share fails to disclose the identity of any person who may have an interest in those shares. No person holds securities in the Company carrying special rights with regard to control of the Company. The Company is not aware of any agreements between holders of securities that may result in restrictions in the transfer of securities or voting rights.
Exercise of rights of shares in employee share schemesAs detailed in note 22 to the financial statements at 1 January 2011, 485,304 ordinary shares were held in an employee benefit trust for the purpose of the Company’s employee share schemes.
The Trustees of the employee trust do not seek to exercise voting rights on shares held in the employee trust other than on the direction of the underlying beneficiaries. No voting rights are exercised in relation to shares unallocated to individual beneficiaries.
Rights under the Shareholders’ Rights Directive 2007/36/EC Regulations 2009 Members have the right to ask questions related to items on the agenda of a general meeting and to receive answers, subject to certain qualifications.
Members (s) holding 3% of the issued share capital of the Company, representing at least 3% of its total voting rights, will have the right to put items on the agenda and to table draft resolutions at AGMs. The request must be received by the Company at least 42 days before the relevant meeting.
Further details of shareholders rights under the Shareholders’ Rights (Directive 2007/36/EC) Regulations 2009 are contained in the notice of the 2011 AGM available on the Company website www.glanbia.com and posted with this report.
Restrictions on voting deadlinesThe notice of any general meeting shall specify the deadline for exercising voting rights and appointing a proxy or proxies to vote in relation to resolutions to be proposed at the general meeting. The number of proxy votes for, against or withheld in respect of each resolution are published on the Company’s website after the meeting.
Substantial interests
As at 1 March 2011, the Company has been advised of the following notifiable interests in its ordinary share capital:
Shareholder No. of ordinary
shares
% of issued share
capital
Glanbia Co-operative Society Limited
160,277,308 54.5%
Memorandum and Articles of Association The Company’s Memorandum and Articles of Association set out the objects and powers of the Company. The Articles detail the rights attaching to each share class; the method by which the Company’s shares can be purchased or re-issued; the provisions which apply to the holding of and voting at general meetings; and the rules relating to the Directors, including their appointment, retirement, re-election, duties and powers. A copy of the Memorandum and Articles of Association can be obtained from the Company’s website, www.glanbia.com.
Unless expressly specified to the contary, the Company’s Memorandum and Articles of Association may be amended by a special resolution at a general meeting of shareholders.
CHAIRMAN’S INTRODUCTION
BOARD OF DIRECTORS & SENIOR MANAGEMENT
APPLYING THE PRINCIPLES OF THE COMBINED CODE
OTHER STATUTORY INFORMATION
COMMITTEE REPORTS
STATEMENT OF DIRECTORS RESPONSIBILITIES

GLANBIA PLC
ANNUAL REPORT 2010 56 DIRECTORS' REPORT:
GOVERNANCE
FOCUS DELIVERY MOMENTUM
Change of control provisionsThe Group has certain debt facilities which may require repayment in the event that a change in control occurs with respect to the Group.
There are also a number of agreements that take effect, alter or terminate upon a change of control of the Group, which include the Group’s joint ventures with Leprino Foods Company and PZ Cussons plc. If a third party were to acquire control of the Group, Leprino Foods Company could elect to terminate its joint venture with the Group and if this were to occur, the Group could then be required to sell its shareholding in the joint venture to Leprino Foods at a price equal to its fair value. In the same circumstances PZ Cussons plc can also elect to terminate its Nutricima joint venture with the Group and if this were to occur, the Group could then be required to sell to PZ Cussons plc at a nominal price certain trade marks which had been originally transferred from the PZ Cussons group to the Nutricima business. The Nutricima joint venture company would then be wound up.
In addition, the Company’s long term incentive plans contain change of control provisions which can allow for the acceleration of the exercisability of share options and the vesting of share awards in the event that a change of control occurs.
Corporate social responsibilityAs the Group grows and develops as a leading international nutritional solutions and cheese Group, so also does the Group’s commitment to conducting its business in a way that is economically, socially and environmentally sustainable. During 2010 the Group made further progress in its corporate citizenship objectives.
Research and developmentThe Group’s key business objectives include central ownership of its worldwide intellectual property (IP) in Ireland, whether acquired IP or developed organically, to facilitate central management and control over IP development and its commercial exploitation. Accordingly, the Group’s principal research and development centre is Global Nutritionals’ Glanbia Innovation Centre, Kilkenny (the “GIC”) and it has direct responsibility for overall Group research and development activity, including that undertaken at the Group’s other substantial research and development centre at Twin Falls, Idaho where it also operates a Customer Collaboration Centre.
The Group is committed to achieving the highest standards of best practice in relation to science-based innovation and to an ongoing and extensive innovation programme to support a consumer-led business and marketing approach. The programme is directed towards the development of technically superior dairy-based food ingredients, nutritional products, cheese and high value consumer food products, using proprietary technologies and processes.
Through its research and development facilities at the GIC and Idaho, the Group has developed and launched advanced, differentiated and branded ingredients and consumer products, bringing a range of nutritional benefits that enhance physiological wellbeing, texture and flavour enhancements in foods.
In Kilkenny, the R&D activity has focused on the customer-led areas of sports nutrition, beverages, protein and energy bars, food texture and functionality, dietetic products, weight management, healthy aging, and medical nutrition. These developments cut across the Group’s global business by collaboration with the Customer Collaboration Centre at Idaho. The GIC has performed a key role in connecting the Glanbia Research & Development Community with Food for Health Ireland (FHI), a joint development programme between Enterprise Ireland, Irish dairy research universities (UCC, UCD, UL) and organisations (Moorepark), and the Irish dairy industry. In 2010, the collaboration with FHI focused on Glanbia-produced milk and whey products that were screened for a variety of physiological functions. These
programme collaborations will continue through 2011.
The work programme performed at the Collaboration Centre in Twin Falls, Idaho for the GIC during 2010 consisted of developments in sports nutrition and beverages, protein and energy bars, food texture and functionality, weight management, healthy aging, medical nutrition, and a move into the US health-food, retail markets under the beveri brand. These development areas are being addressed through both whey and flax-derived ingredients and solutions. The US Collaboration Centre has become a focal point for joint research with US customers, particularly in beverage and bar applications and, mediated through the GIC, it was also able to connect to the FHI programme.
Subsidiary and associated undertakingsA list of the principal subsidiary and associated undertakings is included in note 40 to the financial statements.
Responsibility Statement Directors’ responsibilities for preparing the financial statements for the Company and the Group are detailed on page 71. The auditors’ report details the respective responsibilities of Directors and auditors.
Going concernAfter making enquiries the Directors have a reasonable expectation that the Company and the Group have adequate resources to continue in operation and existence for the foreseeable future, and accordingly they continue to adopt a going concern basis in preparing the financial statements.
AuditorsThe auditors, PricewaterhouseCoopers, have expressed their willingness to continue in office in accordance with Section 160(2) of the Companies Act, 1963.
31
More particular details of which are summarised in the Our responsibilities section
CHAIRMAN’S INTRODUCTION
BOARD OF DIRECTORS & SENIOR MANAGEMENT
APPLYING THE PRINCIPLES OF THE COMBINED CODE
OTHER STATUTORY INFORMATION
COMMITTEE REPORTS
STATEMENT OF DIRECTORS RESPONSIBILITIES

FOCUS DELIVERY MOMENTUM
GLANBIA PLC
ANNUAL REPORT 2010 57 DIRECTORS' REPORT:
GOVERNANCE
CHAIRMAN’S INTRODUCTION
BOARD OF DIRECTORS & SENIOR MANAGEMENT
APPLYING THE PRINCIPLES OF THE COMBINED CODE
OTHER STATUTORY INFORMATION
COMMITTEE REPORTS
STATEMENT OF DIRECTORS RESPONSIBILITIES
Key responsibilities • Monitor and review the effectiveness of the
Group’s financial reporting process, the Group’s systems of internal control and risk management processes.
• Monitor and review the role and effectiveness of the Internal Audit function, including the review of the Internal Audit programme, the review of all Internal Audit reports and the monitoring and review of management’s responses to the findings and recommendations of the Internal Audit function.
• Monitoring the statutory audit of the annual and consolidated financial statements and reviewing significant financial reporting issues and application of accounting policies.
• Considering and making recommendations to the Board on the appointment of the auditors.
• Keeping the relationship with the auditors under review, including the terms of their engagement and fees, their independence (in particular the provision of non-audit services), expertise, resources and qualification, and assessing the effectiveness of the audit process.
The full terms of reference of the Audit Committee can be found on the Company’s website or can be obtained from the Group Secretary.
Members
Audit Committee report
John CallaghanAuditCommitteeChairmanandSeniorIndependentDirector
44Biography
Governance The Committee was in place throughout 2010.
John Callaghan is the current chairman of the Committee. He is a fellow of the Institute of Chartered Accountants in Ireland and formerly Managing Partner of KPMG (Ireland), an international provider of audit, tax and advisory services in Ireland.
At the invitation of the Committee, the Group Managing Director, the Group Finance Director, Group Head of Internal Audit, the Group Financial Controller and external auditor regularly attend meetings. During the year the Group Managing Director, the Group Finance Director, Group Head of Internal Audit and external auditor attended all meetings. The Group Financial Controller attended two of the three meetings. The Group Secretary acts as secretary to the Committee.
The Committee comprises seven non-executive Directors and three members constitute a quorum. Membership of the Committee is reviewed by the Chairman of the Committee and the Group Chairman and they recommend new appointments to the Nomination Committee for onward recommendation to the Board. Martin Keane joined the Committee on 29 June 2010 following the retirement of John Fitzgerald.
The Committee may obtain at the Company’s expense independent professional advice on any matters covered by its terms of reference.
The external auditors and Group Head of Internal Audit have direct access to the Chairman of the Committee and the Chairman of the Board.
Relationship with the auditorsThe Committee believes that it is not appropriate to limit the level of work undertaken by the auditors by reference to a set percentage of the audit work fee, as this does not take into account important estimates that need to be made concerning the nature of work undertaken, to help safeguard the auditors’ independence. It has in place an approved Auditor Relationship and Independence Policy which governs the relationship between the Company and its auditors and recognises that certain work of a non-audit nature is best undertaken by the external auditors.
As part of its responsibilities, the Committee reviews annually the independence of the auditors and the amount and nature of non-audit work they perform. The Committee has agreed that the external auditors may provide audit and audit related services provided that any individual audit related service to be undertaken by the auditors in excess of €100,000 does not impair their independence and is approved by the Chairman of the Audit Committee in advance.
The following services are prohibited unless approved under the terms of the Policy:
• bookkeeping or other administrative services related to the Group’s accounting records or financial statements;
• financial information systems design and implementation;
• internal audit services;
• management functions;
• executive searches for the Group Managing Director or Group Finance Director; and
• legal services.
101
Auditors fees are detailed in note 6 of the financial statements.
• John Callaghan (Chairman)
• Henry Corbally
• Paul Haran
• Liam Herlihy (Group Chairman)
• Martin Keane (Vice-Chairman)
• Jerry Liston
• Victor Quinlan (Vice-Chairman)
In 2010, the Committee met three times and details of attendance at these meetings are provided in the Applying the Principles of the Combined Code section
51

GLANBIA PLC
ANNUAL REPORT 2010 58 DIRECTORS' REPORT:
GOVERNANCE
CHAIRMAN’S INTRODUCTION
BOARD OF DIRECTORS & SENIOR MANAGEMENT
APPLYING THE PRINCIPLES OF THE COMBINED CODE
OTHER STATUTORY INFORMATION
COMMITTEE REPORTS
STATEMENT OF DIRECTORS RESPONSIBILITIES
FOCUS DELIVERY MOMENTUM
ActivitiesThe principal activities undertaken by the Committee in the period under review are set out below.
Risk management• The Committee terms of reference include
monitoring of the financial reporting process and the effectiveness of the Group internal control, internal audit and risk management systems.
• In fulfilling this responsibility the Committee continued its programme of evaluating the key areas of risk for Glanbia through a series of risk report presentations on the steps taken to manage such risks from the relevant responsible individuals within the Group.
• During 2010 the Committee also approved the introduction of a quarterly, formal, documented key risk review process to identify and analyse the principal risks across each business unit and Group function.
• This process is aimed at the early identification of key risks to the Group’s businesses and the Group’s overall strategy, followed by an understanding of the nature of those risks, the probability of them occurring and their likely impact if they did occur.
• Risk owners and robust action plans are developed and implemented with the aim of reducing or removing the likelihood of the risk occurring or managing the impact if the risk cannot be avoided. The results of the year end risk review are outlined in the risk management section of this report on pages 27 to 30.
• A full and half yearly assessment of the Board’s performance against regulatory requirements and best practice guidance was completed following which the Committee reported to the Board expressing their level of satisfaction with the Group’s internal control and risk management systems.
Internal controls• The Committee received and considered reports
during the year from the Group’s auditors, PricewaterhouseCoopers, which included reports on any key matters arising from the statutory audit and on any material weaknesses in internal control in relation to the financial reporting process. The Committee also received and considered reports from the Group’s Internal Audit function on the work undertaken in reviewing and auditing the control environment, in order to assess the quality and effectiveness of the internal control system.
• A comprehensive Internal Audit programme is agreed annually and is designed to ensure that all business units and key Group functions are audited on a regular basis. Internal Audit reports are issued to relevant senior management following the completion of the reviews which set out agreed Management Action Plans (MAPs) to address recommended areas of improvement. Members of the Committee receive an executive summary of all such Internal Audit reports.
• All MAPs are kept under review by the Internal Audit team until they are resolved. The Group Head of Internal Audit provides an update on the status of the resolution of the MAPs at regular intervals.
• Internal controls were assessed in detail as part of the bi-annual Control Self-Assessment (CSA) process. This assessment is approved by senior management and reviewed by Internal Audit for completeness.
• The Committee assessed the effectiveness of the Group’s internal controls and reviewed the related disclosures in the Annual Report.
• As part of the Board and the Committee’s programme to gain a greater awareness of the Group’s operations, during 2010 the Board (which also comprised the Committee’s members) met with senior executives from all US businesses in the USA and inspected the facilities of the Performance Nutrition business in the USA, US Cheese and Southwest Cheese, one of the Group’s principal joint ventures.
Financial reportingThe Committee monitored the statutory audit of the annual and consolidated financial statements and:
• reviewed the financial statements and, as part of this process, the significant financial reporting estimates contained within them;
• reviewed the basis for preparing the Group accounts on a going concern basis, including the analysis supporting the going concern statement and disclosures in the financial statements; and
• reviewed the financial statements in the 2009 Annual Report and the 2010 Half-Yearly Report, and received a report from the auditors on the statements.
Internal AuditThe Committee:
• approved the Internal Audit Charter which sets out the framework for the Internal Audit department, its role and responsibilities, its authority, the conduct of the function and how it will operate to accomplish its mission;
• approved the Internal Audit programme for 2010;
• reviewed output from the Internal Audit programme during the year and considered progress against the programme; and
• reviewed the effectiveness of the Group’s Internal Audit function.
External auditorsThe Committee:
• agreed the approach and scope of the audit work to be undertaken by the auditors;
• reviewed the Group’s processes for disclosing information to the auditors;
• reviewed the effectiveness and independence of the auditors. Based on the results of this review the Committee proposed to the Board that it recommend that the shareholders support the re-appointment of the auditors at the 2010 Annual General Meeting; and
• agreed the auditors’ fees in respect of the 2011 audit work.
Terms of referenceThe Board engaged a leading external governance expert to review the terms of reference of the Committee. This review indicated that the terms of reference met very high standards of corporate governance. Some opportunities for minor incremental improvement were noted and have now been incorporated into the terms of reference which are available for inspection on the Company’s website.
Review of Committee performanceThe Board and Committee assessed its performance, covering terms of reference, composition, procedures, contribution and effectiveness. As a result of that assessment, the Committee is satisfied that it is functioning effectively and it has met its terms of reference.
On behalf of the Audit Committee
John Callaghan Audit Committee Chairman

FOCUS DELIVERY MOMENTUM
GLANBIA PLC
ANNUAL REPORT 2010 59 DIRECTORS' REPORT:
GOVERNANCE
CHAIRMAN’S INTRODUCTION
BOARD OF DIRECTORS & SENIOR MANAGEMENT
APPLYING THE PRINCIPLES OF THE COMBINED CODE
OTHER STATUTORY INFORMATION
COMMITTEE REPORTS
STATEMENT OF DIRECTORS RESPONSIBILITIES
Responsibilities• Making recommendations to the Board
on the appointment and re-appointment of the Directors. Glanbia Co-operative Society Limited (“the Society”), which owns 54.5% of the Company, nominates from its Board of Directors fourteen of the eighteen non-executive Directors for appointment to our Board. The Nomination Committee recommendations are made with due regard to these nominations.
• Planning for the orderly succession of new Directors to the Board.
• Recommending to the Board the appointment of the Chairman and vice-Chairmen.
• Keep under review the leadership needs of the Group both executive and non-executive, with a view to ensuring the continued ability of the Group to compete effectively in the market place.
• Recommending to the Board the membership and chairmanship of the Audit and Remuneration Committees.
• Keep the extent of Directors’ other interests under review to ensure that the effectiveness of the Board is not compromised
The full terms of reference of the Nomination Committee can be found on the Company’s website or can be obtained from the Group Secretary.
Members
Nomination Committee report
Liam Herlihy NominationCommitteeChairmanandGroupChairman
44Biography
Governance The Committee was in place throughout 2010. Liam Herlihy, the Chairman of the Group, has been Chairman of the Committee since 2008.
The Committee comprises four non-executive directors and two members constitute a quorum.The Group Managing Director and vice-Chairmen attend certain meetings at the invitation of the Nomination Committee. During the year, the Group Managing Director attended one Meeting. The Group Secretary acts as secretary to the Committee.
When dealing with any matters concerning his membership of the Board the Group Chairman will absent himself from the meeting of the Committee as required and meetings will accordingly be chaired by the Senior Independent Director, John Callaghan.
ActivitiesThe principal activities undertaken by the Committee in the period under review are set out below.
Review of Directors’ independence The Nomination Committee reviewed the independence of the non-executive Directors in accordance with the guidance in the UK 2008 Combined Code on Corporate Governance.
The Committee’s review took into consideration the fact that:
• John Callaghan had served on the Board for thirteen years and Jerry Liston had served on the Board for eight years.
• Fourteen of the non-executive Directors are nominated by the Board of the Society, for appointment to the Board of the Company, of which each of Henry Corbally, Edward Fitzpatrick, James Gilsenan, Liam Herlihy and Victor Quinlan had served as Directors for nine years or more.
• William Murphy, who retired as Deputy Group Managing Director in September 2005, remains on the Board as a non-executive Director.
Provision A.3.1 of the Code suggests that the following could be relevant to the determination of a non-executive Director’s independence:
• serving more than nine years from the date of their first election.
• represents a significant shareholder.
• has been an employee of the company or Group within the last five years.
The Committee concluded that:
• Jerry Liston and John Callaghan, in the same manner as the other non-executive Directors, continued to demonstrate the essential characteristics of independence expected by the Board and that there are no relationships or circumstances that are likely to affect, or could appear to affect, their judgment. Futhermore, they continue to constructively and appropriately challenge the executive Directors and the Board
• throughout the reporting period, John Callaghan, Paul Haran and Jerry Liston were independent
• William Murphy demonstrates the essential characteristics of independence and from September 2010, the fifth anniversary of his retirement from the Group, was independent
• the remaining non-executive Directors did not meet the criteria for independence as specified in the Code but considered that they were independent in character and judgement
The Committee reported its conclusions to the Board for final determination.
• Liam Herlihy (Group Chairman)
• John Callaghan (Senior Independent Director)
• Paul Haran
• Jerry Liston
In 2010, the Committee met three times and details of attendance at these meetings are provided in the Applying the Principles of the Combined Code section 51

GLANBIA PLC
ANNUAL REPORT 2010 60 DIRECTORS' REPORT:
GOVERNANCE
CHAIRMAN’S INTRODUCTION
BOARD OF DIRECTORS & SENIOR MANAGEMENT
APPLYING THE PRINCIPLES OF THE COMBINED CODE
OTHER STATUTORY INFORMATION
COMMITTEE REPORTS
STATEMENT OF DIRECTORS RESPONSIBILITIES
FOCUS DELIVERY MOMENTUM
Appointment of vice-ChairmanThe Committee considered the appointment of Martin Keane as vice-Chairman of the Company and recommended his appointment to the Board. As part of their consideration, the Committee noted that Martin Keane had been appointed as vice-Chairman of Glanbia Co-operative Society Limited and while there was no obligation on the Board of the Company to appoint the same candidate as the Society to the position of vice-Chairman, the custom and practice to-date had been that the vice-Chairman of the Society is also appointed vice-Chairman of the Company. The Committee considered the merits of the custom and practice in this regard and the quality of the candidate elected by the Society. The Committee noted the experience of Mr. Keane and his suitability for the role of vice-Chairman of the Company and recommended his appointment to the Board of the Company which was subsequently approved.
Review of the time required from a non-executive DirectorThe Committee assessed the time dedicated to the Company by each non-executive Director. Each of the Directors at the time of appointment agrees to a minimum time commitment of one to two days per month (after the induction phase). This will include attendance at monthly board meetings, the Annual General Meeting, two annual board away days, and at least one site visit per year and appropriate preparation time ahead of each meeting. The nature of the Directors appointments is, however, such that the Directors are required to be flexible in terms of their availability. Sometimes they can be required to work part-time, and sometimes significant time input is required depending on the criticality of the issues and challenges facing the Group. This review also considers the extent of the Directors’ other interests to ensure that the effectiveness of the Board is not compromised by such interests.
The Board and Committee are satisfied that the Chairman and each of the non-executive Directors commit sufficient time to the fulfilment of their duties as Chairman and Directors of the Company respectively.
The Chairman holds a number of other directorships including the Irish Dairy Board Co-operative Society Limited and Irish Co-operative Organisation Society Limited and farms at Headborough, Knockanore, Tallow, Co. Waterford, but the Committee and the Board considers that these do not interfere with the discharge of his duties to the Group.
Board committee membership The Committee is responsible for recommending appropriate individuals for membership of the Board’s committees to ensure that the committees are comprised of individuals with the necessary skills, knowledge and experience. During the year the Committee recommended to the Board that Martin Keane be appointed to the Audit and Remuneration Committees following the retirement of John Fitzgerald. This was implemented during the year by the Board.
Review of committee performanceThe Board and Committee assessed its performance, covering terms of reference, composition, procedures, contribution and effectiveness. As a result of that assessment, the Committee is satisfied that it is functioning effectively and it has met its terms of reference. Arising from the review, our Board has agreed to review the terms of appointment of the non-executive Directors arising from the changes to the UK Corporate Governance Code and other related matters.
The Nomination Committee did not use an external search consultancy or open advertising in the appointment of the new non-executive Directors, Brendan Hayes, Michael Keane and John Murphy, as they were nominated by the Board of the Society for appointment to the Board.
On behalf of the Nomination Committee
Liam Herlihy Chairman

FOCUS DELIVERY MOMENTUM
GLANBIA PLC
ANNUAL REPORT 2010 61 DIRECTORS' REPORT:
GOVERNANCE
CHAIRMAN’S INTRODUCTION
BOARD OF DIRECTORS & SENIOR MANAGEMENT
APPLYING THE PRINCIPLES OF THE COMBINED CODE
OTHER STATUTORY INFORMATION
COMMITTEE REPORTS
STATEMENT OF DIRECTORS RESPONSIBILITIES
Members
Remuneration Committee report
Jerry ListonRemunerationCommitteeChairman
44Biography
Responsibilities • Determine and agree with the Board
the framework or broad policy for the remuneration of the Chairman, the Group Managing Director, executive Directors, members of the Group Operating Executive, the Group Management Committee, the Group Secretary and other senior executives, as required.
• Within the agreed policy, determining individual total compensation packages for the Chairman, the Group Managing Director, executive Directors, members of the Group Operating Executive, the Group Management Committee, the Group Secretary and other senior executives, as required.
• Recommending to the Board any employee share-based incentive schemes and any performance conditions to be used for such schemes.
The full terms of reference of the Remuneration Committee (the “Committee”), can be found on the Company’s website or can be obtained from the Group Secretary.
a GovernanceThe Committee comprises six non-executive Directors and three members constitute a quorum. Following John Fitzgerald’s retirement from the Board on 29 June 2010, the Board, on the recommendation of the Nomination Committee, appointed Martin Keane in his place.
The Group Managing Director and the Group Human Resources and Operations Development Director attend Committee meetings by invitation only. They do not attend where their remuneration is discussed and no Director is involved in deciding his own remuneration. The Group Secretary acts as secretary to the Committee.
During the year the Committee received material assistance and advice on remuneration policy from the Group Human Resources and Operations Development Director, Mr. Brian Phelan. External consultants provide advice to the Committee on market trends and competitive positioning of remuneration packages as required.
Legal advice to the Committee has been provided by Arthur Cox, who also provided services to the Company during the year. The Committee is satisfied that the services provided to it by Arthur Cox are of a technical nature and did not create any conflict of interest. If a conflict of interest were to arise in the future, the Committee would appoint separate legal advisors from those used by the Company.
The Board engaged a leading external governance expert to review the terms of reference of the Committee. This review indicated that the terms of reference met very high standards of corporate governance whilst making recommendations for further incremental improvement and fine-tuning which have now been incorporated into the terms of reference. An updated version of the terms of reference are available for inspection on the Company’s website.
ActivitiesDuring the period under review, the Committee:
• considered and approved executive Directors and other senior executives bonus arrangements for 2010.
• assessed and agreed the level of achievement against bonus objectives for 2009 under the approved Annual Incentive Plan.
• reviewed and approved the 2010 grant under the 2008 Long Term Incentive Plan (“2008 LTIP”) to executive Directors and other senior executives.
• considered the outcome of the performance conditions for the 2007 LTIP share awards and the real growth in Adjusted Earnings Per Share1 (“EPS”) and Total Shareholder Return2 (“TSR”) over the three-year performance and determined the level of shares to be vested.
• initiated an external remuneration consultant selection process to assist the Committee in formulating an updated executive remuneration policy to be put to the Board for approval in 2011.
• undertook a review of executive Directors and other senior executives base salaries.
• assessed its performance, covering terms of reference, composition, procedures, contribution and effectiveness. As a result of that assessment, the Committee is satisfied that it is functioning effectively and has met its terms of reference.
• Jerry Liston (Chairman)
• John Callaghan
• Paul Haran
• Liam Herlihy
• Martin Keane
• Victor Quinlan
In 2010, the Committee met seven times and details of attendance at these meetings are provided in the Applying the Principles of the Combined Code section
The Remuneration report is structured as follows:a Governanceb Remuneration reporting: 1 Remuneration strategy and policy 2 Chairman’s appointment 3 Non-executive Directors c Tabular information on Directors’ shareholdings, share-based incentives, emoluments and pensions
51
1 Adjusted EPS is calculated as the profit for the year attributable to the equity holders of the Parent before exceptional items and amortisation of intangible assets (net of tax).
2 TSR represents the change in capital value of a listed/quoted company over a period, plus dividends, expressed as a plus or minus percentage of the opening value.

GLANBIA PLC
ANNUAL REPORT 2010 62 DIRECTORS' REPORT:
GOVERNANCE
CHAIRMAN’S INTRODUCTION
BOARD OF DIRECTORS & SENIOR MANAGEMENT
APPLYING THE PRINCIPLES OF THE COMBINED CODE
OTHER STATUTORY INFORMATION
COMMITTEE REPORTS
STATEMENT OF DIRECTORS RESPONSIBILITIES
FOCUS DELIVERY MOMENTUM
b Remuneration reporting
1 Remuneration strategy and policy
Remuneration policy is based on attracting, retaining and motivating executives to ensure that they perform in the best interests of the Group and its shareholders. Performance-related elements of remuneration are designed to form an appropriate portion of the total remuneration package of executive Directors. These link remuneration to individual performance and the Group’s performance and align the interests of executive Directors with those of shareholders.
This framework is applied to the most senior executives within the Group globally (Business unit CEOs and their senior teams) to create a consistent global approach to reward. The principles of the remuneration strategy are also applied consistently across the Group below this level, taking account of seniority and local market practice. Executive remuneration policy is generally reviewed by the Committee on a three year basis and is planned to be reviewed in 2011, with the assistance of an external advisor. The updated policy will be put to the Board for consideration and approval during 2011 and is to be effective from 2012.
Remuneration policyThe Board determines the remuneration policy for executive Directors and other senior executives. Key elements of the policy are as follows:
• setting base salary by reference to the market median based on an external evaluation of the role.
• incentivising executive Directors and senior executives to achieve specific performance goals which are linked to the Group’s business plans.
• incentivising executive Directors and senior executives to deliver performance exceeding business plans.
• aligning the interests of executive Directors, senior executives and shareholders.
• provide an appropriate balance between:
• short-term and long-term reward
• fixed and variable reward
• provide a competitive benefits package
IncentivesThe Group’s strategy is set out in the Strategic Review along with the Group Strategic Framework. The remuneration strategy incentivises and rewards executives to deliver the Group’s strategy through the combination of short-term and long-term incentives.
Annual incentive planThe Group operates a performance-related bonus scheme for executive Directors and senior executives. Payments under the scheme for executive Directors depend on the achievement of pre-determined financial targets for the Group or business unit performance and an assessment of individual performance against pre-agreed objectives relevant to their business unit or area of responsibility.
Elements Purpose
Base salary Recognise market value of role and the stage of professional consolidation of the role holder.
Annual incentive plan Incentivise executives to achieve specific short term business and personal performance goals during a one year period.
Long term incentive plan Aligns senior executives’ interests with those of shareholders and incentivise them to pursue superior results over a three year period within the limits of the Group’s risk appetite. The TSR metric measures the relative return from the Company’s shares against an agreed group of comparator companies, providing alignment with shareholders interests. The EPS metric is also a key performance measure aligned with shareholders’ interests.
Pension provision Provide competitive, affordable and sustainable retirement benefits.
Other benefits Provide a car benefit or equivalent. Provide suitable medical insurance.
The financial targets are derived from the annual business plan as approved by the Board and are based on growth in annual Group EPS or business unit planned profitability as appropriate.
Long-term incentive plans (LTIPs)The Company has operated three LTIPs – the 2002 LTIP (the “2002 Share Option Scheme”), the 2007 LTIP and the 2008 LTIP. The principal plan for executives is the 2008 LTIP which has received shareholder approval.
The combination of the annual incentive plan and the LTIPs (which are designed to link reward to the key long term drivers of the business and to align the interests of the executive Directors and senior executives with the long term interests of the shareholders through a long-term reward being delivered in shares) provide a balance between short-term cash reward and longer-term share-based reward as per recommended best practice.
LTIP awards under the 2008 LTIP are granted annually and vesting is dependent on the achievement of TSR and EPS performance conditions, full details of which are contained in the Summary of Long-Term Incentive Plans on page 63. The TSR and EPS performance conditions are designed to ensure that an appropriate proportion of an executive Directors’ and senior executives’ total incentive package is delivered through longer-term performance.
To the extent that any performance condition is not met the relevant part of the award will lapse.
Remuneration package
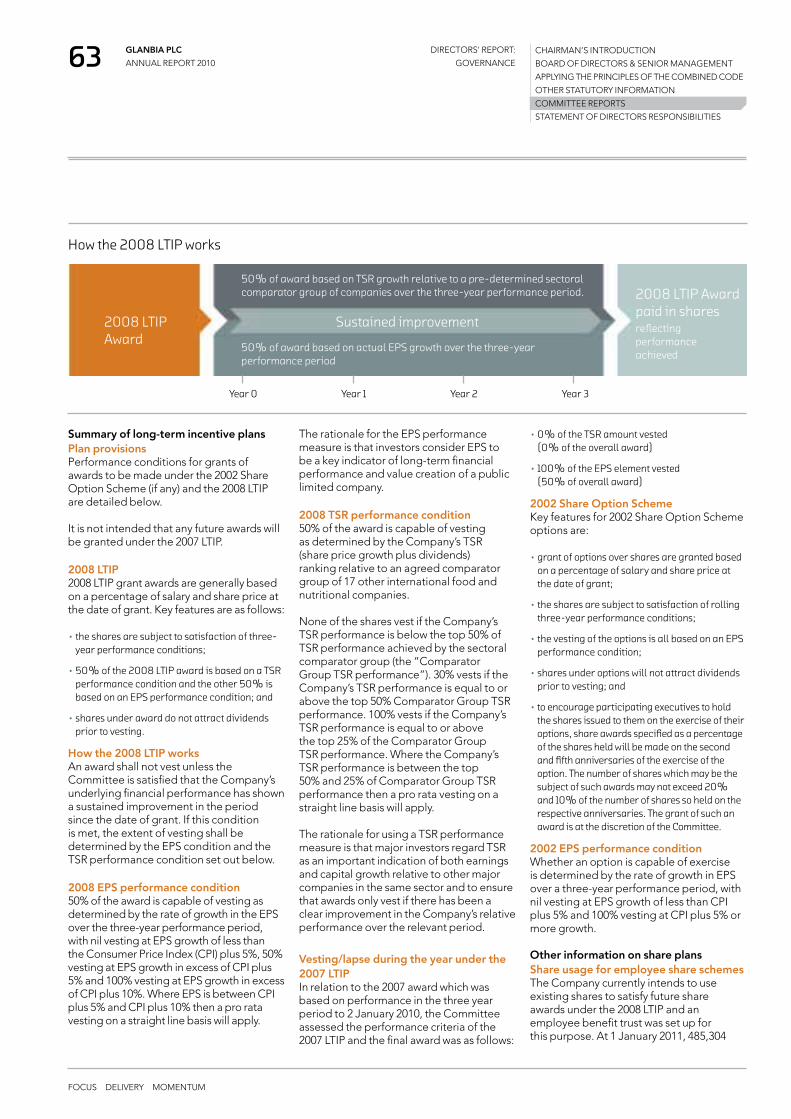
FOCUS DELIVERY MOMENTUM
GLANBIA PLC
ANNUAL REPORT 2010 63 DIRECTORS' REPORT:
GOVERNANCE
CHAIRMAN’S INTRODUCTION
BOARD OF DIRECTORS & SENIOR MANAGEMENT
APPLYING THE PRINCIPLES OF THE COMBINED CODE
OTHER STATUTORY INFORMATION
COMMITTEE REPORTS
STATEMENT OF DIRECTORS RESPONSIBILITIES
Summary of long-term incentive plansPlan provisionsPerformance conditions for grants of awards to be made under the 2002 Share Option Scheme (if any) and the 2008 LTIP are detailed below.
It is not intended that any future awards will be granted under the 2007 LTIP.
2008 LTIP2008 LTIP grant awards are generally based on a percentage of salary and share price at the date of grant. Key features are as follows:
• the shares are subject to satisfaction of three-year performance conditions;
• 50% of the 2008 LTIP award is based on a TSR performance condition and the other 50% is based on an EPS performance condition; and
• shares under award do not attract dividends prior to vesting.
How the 2008 LTIP worksAn award shall not vest unless the Committee is satisfied that the Company’s underlying financial performance has shown a sustained improvement in the period since the date of grant. If this condition is met, the extent of vesting shall be determined by the EPS condition and the TSR performance condition set out below.
2008 EPS performance condition50% of the award is capable of vesting as determined by the rate of growth in the EPS over the three-year performance period, with nil vesting at EPS growth of less than the Consumer Price Index (CPI) plus 5%, 50% vesting at EPS growth in excess of CPI plus 5% and 100% vesting at EPS growth in excess of CPI plus 10%. Where EPS is between CPI plus 5% and CPI plus 10% then a pro rata vesting on a straight line basis will apply.
The rationale for the EPS performance measure is that investors consider EPS to be a key indicator of long-term financial performance and value creation of a public limited company.
2008 TSR performance condition50% of the award is capable of vesting as determined by the Company’s TSR (share price growth plus dividends) ranking relative to an agreed comparator group of 17 other international food and nutritional companies.
None of the shares vest if the Company’s TSR performance is below the top 50% of TSR performance achieved by the sectoral comparator group (the “Comparator Group TSR performance”). 30% vests if the Company’s TSR performance is equal to or above the top 50% Comparator Group TSR performance. 100% vests if the Company’s TSR performance is equal to or above the top 25% of the Comparator Group TSR performance. Where the Company’s TSR performance is between the top 50% and 25% of Comparator Group TSR performance then a pro rata vesting on a straight line basis will apply.
The rationale for using a TSR performance measure is that major investors regard TSR as an important indication of both earnings and capital growth relative to other major companies in the same sector and to ensure that awards only vest if there has been a clear improvement in the Company’s relative performance over the relevant period.
Vesting/lapse during the year under the 2007 LTIPIn relation to the 2007 award which was based on performance in the three year period to 2 January 2010, the Committee assessed the performance criteria of the 2007 LTIP and the final award was as follows:
• 0% of the TSR amount vested (0% of the overall award)
• 100% of the EPS element vested (50% of overall award)
2002 Share Option SchemeKey features for 2002 Share Option Scheme options are:
• grant of options over shares are granted based on a percentage of salary and share price at the date of grant;
• the shares are subject to satisfaction of rolling three-year performance conditions;
• the vesting of the options is all based on an EPS performance condition;
• shares under options will not attract dividends prior to vesting; and
• to encourage participating executives to hold the shares issued to them on the exercise of their options, share awards specified as a percentage of the shares held will be made on the second and fifth anniversaries of the exercise of the option. The number of shares which may be the subject of such awards may not exceed 20% and 10% of the number of shares so held on the respective anniversaries. The grant of such an award is at the discretion of the Committee.
2002 EPS performance condition Whether an option is capable of exercise is determined by the rate of growth in EPS over a three-year performance period, with nil vesting at EPS growth of less than CPI plus 5% and 100% vesting at CPI plus 5% or more growth.
Other information on share plansShare usage for employee share schemesThe Company currently intends to use existing shares to satisfy future share awards under the 2008 LTIP and an employee benefit trust was set up for this purpose. At 1 January 2011, 485,304
2008 LTIP Award paid in shares reflecting performance achieved
2008 LTIP Award
50% of award based on TSR growth relative to a pre-determined sectoral comparator group of companies over the three-year performance period.
50% of award based on actual EPS growth over the three-year performance period
Sustained improvement
Year 0 Year 1 Year 2 Year 3
How the 2008 LTIP works
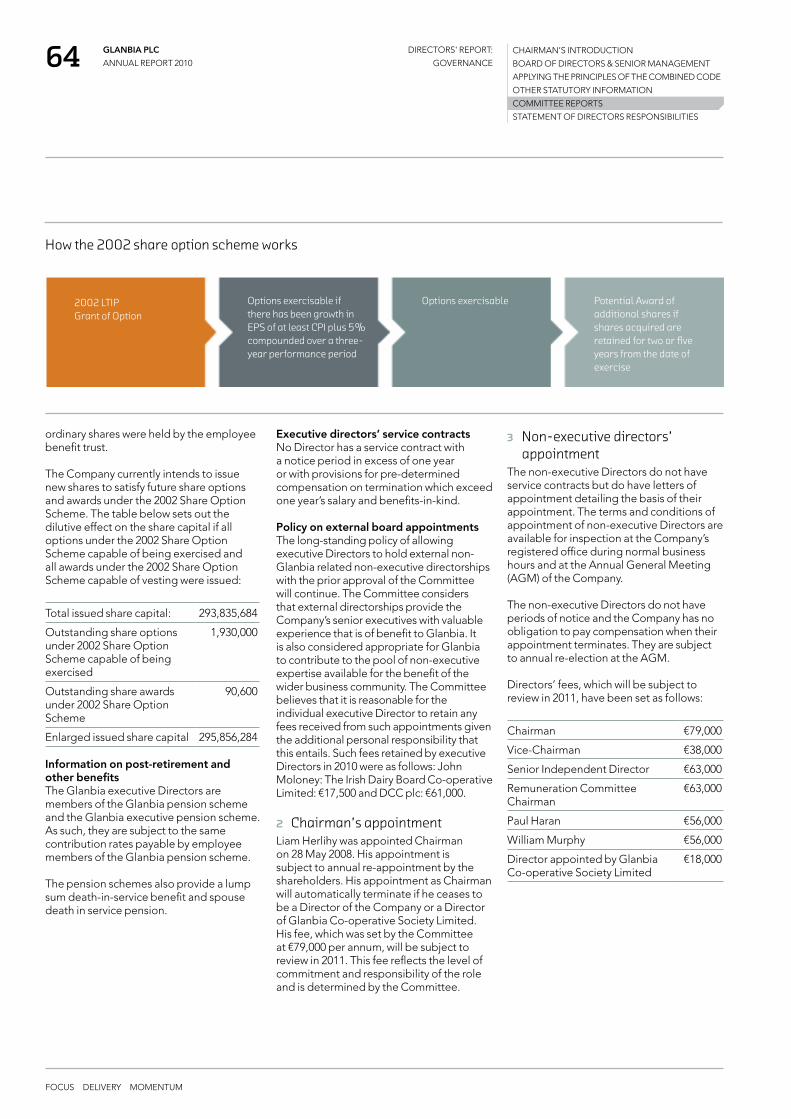
GLANBIA PLC
ANNUAL REPORT 2010 64 DIRECTORS' REPORT:
GOVERNANCE
CHAIRMAN’S INTRODUCTION
BOARD OF DIRECTORS & SENIOR MANAGEMENT
APPLYING THE PRINCIPLES OF THE COMBINED CODE
OTHER STATUTORY INFORMATION
COMMITTEE REPORTS
STATEMENT OF DIRECTORS RESPONSIBILITIES
FOCUS DELIVERY MOMENTUM
Executive directors’ service contractsNo Director has a service contract with a notice period in excess of one year or with provisions for pre-determined compensation on termination which exceed one year’s salary and benefits-in-kind.
Policy on external board appointmentsThe long-standing policy of allowing executive Directors to hold external non-Glanbia related non-executive directorships with the prior approval of the Committee will continue. The Committee considers that external directorships provide the Company’s senior executives with valuable experience that is of benefit to Glanbia. It is also considered appropriate for Glanbia to contribute to the pool of non-executive expertise available for the benefit of the wider business community. The Committee believes that it is reasonable for the individual executive Director to retain any fees received from such appointments given the additional personal responsibility that this entails. Such fees retained by executive Directors in 2010 were as follows: John Moloney: The Irish Dairy Board Co-operative Limited: €17,500 and DCC plc: €61,000.
2 Chairman’s appointment Liam Herlihy was appointed Chairman on 28 May 2008. His appointment is subject to annual re-appointment by the shareholders. His appointment as Chairman will automatically terminate if he ceases to be a Director of the Company or a Director of Glanbia Co-operative Society Limited. His fee, which was set by the Committee at €79,000 per annum, will be subject to review in 2011. This fee reflects the level of commitment and responsibility of the role and is determined by the Committee.
ordinary shares were held by the employee benefit trust.
The Company currently intends to issue new shares to satisfy future share options and awards under the 2002 Share Option Scheme. The table below sets out the dilutive effect on the share capital if all options under the 2002 Share Option Scheme capable of being exercised and all awards under the 2002 Share Option Scheme capable of vesting were issued:
Total issued share capital: 293,835,684
Outstanding share options under 2002 Share Option Scheme capable of being exercised
1,930,000
Outstanding share awards under 2002 Share Option Scheme
90,600
Enlarged issued share capital 295,856,284
Information on post-retirement and other benefitsThe Glanbia executive Directors are members of the Glanbia pension scheme and the Glanbia executive pension scheme. As such, they are subject to the same contribution rates payable by employee members of the Glanbia pension scheme.
The pension schemes also provide a lump sum death-in-service benefit and spouse death in service pension.
How the 2002 share option scheme works
2002 LTIP Grant of Option
Options exercisable if there has been growth in EPS of at least CPI plus 5% compounded over a three-year performance period
Options exercisable Potential Award of additional shares if shares acquired are retained for two or five years from the date of exercise
3 Non-executive directors’ appointment
The non-executive Directors do not have service contracts but do have letters of appointment detailing the basis of their appointment. The terms and conditions of appointment of non-executive Directors are available for inspection at the Company’s registered office during normal business hours and at the Annual General Meeting (AGM) of the Company. The non-executive Directors do not have periods of notice and the Company has no obligation to pay compensation when their appointment terminates. They are subject to annual re-election at the AGM.
Directors’ fees, which will be subject to review in 2011, have been set as follows:
Chairman €79,000
Vice-Chairman €38,000
Senior Independent Director €63,000
Remuneration Committee Chairman
€63,000
Paul Haran €56,000
William Murphy €56,000
Director appointed by Glanbia Co-operative Society Limited
€18,000

FOCUS DELIVERY MOMENTUM
GLANBIA PLC
ANNUAL REPORT 2010 65 DIRECTORS' REPORT:
GOVERNANCE
CHAIRMAN’S INTRODUCTION
BOARD OF DIRECTORS & SENIOR MANAGEMENT
APPLYING THE PRINCIPLES OF THE COMBINED CODE
OTHER STATUTORY INFORMATION
COMMITTEE REPORTS
STATEMENT OF DIRECTORS RESPONSIBILITIES
c Information subject to audit
As at 1 January 2011 As at 3 January 2010*
Ordinary shares
2008 LTIP awards
2007 LTIP awards
2002 LTIP options
2002 LTIP awards
Ordinary shares
2008 LTIP awards
2007 LTIP awards
2002 LTIP options
2002 LTIP awards
Directors
L Herlihy 91,804 – – – – 91,804 – – – –
V Quinlan 31,347 – – – – 31,347 – – – –
Mn Keane 20,000 – – – – 20,000 – – – –
J Moloney 1 104,593 484,000 – 510,000 38,900 104,593 284,000 – 510,000 38,900
J Callaghan 35,000 – – – – 35,000 – – – –
H Corbally 7,495 – – – – 7,495 – – – –
E Fitzpatrick 50,501 – – – – 50,501 – – – –
J Gannon 12,552 – – – – 12,552 – – – –
J Gilsenan 5,842 – – – – 5,842 – – – –
P Gleeson 24,923 – – – – 24,923 – – – –
P Haran 7,462 – – – – 7,462 – – – –
B Hayes 2 18,920 – – – – 18,920 – – – –
Ml Keane 2 22,104 – – – – 22,104 – – – –
J Liston 15,000 – – – – 15,000 – – – –
M Merrick 3,600 – – – – 3,600 – – – –
J Murphy 2 4,000 – – – – 4,000 – – – –
W Murphy 230,827 – – – – 230,827 – – – –
A O'Connor 15,743 – – – – 15,743 – – – –
R Prendergast 4,007 – – – – 4,007 – – – –
S Talbot 1 29,693 221,000 – 75,000 7,900 17,693 101,000 24,000 75,000 7,900
K Toland 1 23,243 337,000 – 312,000 16,400 23,243 192,000 – 312,000 16,400
Secretary
M Horan 10,093 110,000 – – – 4,593 48,000 11,000 – –
1 Executive Director 2 Appointed 29 June 2010 * Or at date of appointment if later
The table above and the tables on pages 66 to 68 give details of the interests in shares in Glanbia plc and Glanbia Co-operative Society held by Directors, Secretary and their connected persons for those individuals who were Directors and Secretary of the Company as at 1 January 2011. There have been no changes in the interests of the current Directors listed in the table above between 1 January 2011 and 1 March 2011.
Table A: Directors and Secretary’s interests in Glanbia plc
The market price of the ordinary shares as at 1 January 2011 was €3.68 and the range during the year was €2.43 to €3.68. The average price for the year was €3.12.
The Company’s register of Directors’ and Secretary’s interests (which is open to inspection) contains full details of Directors’ share interests.
The information in Tables A, A(1), B and C are covered by the Independent auditors’ report 74
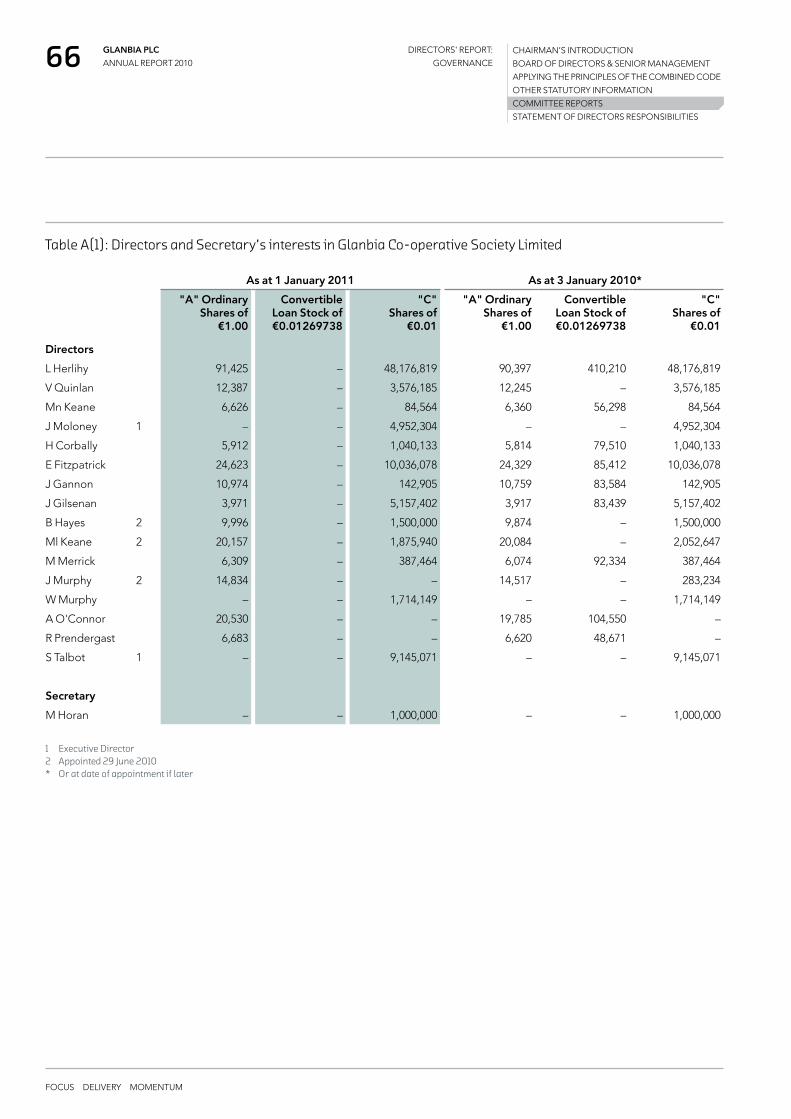
GLANBIA PLC
ANNUAL REPORT 2010 66 DIRECTORS' REPORT:
GOVERNANCE
CHAIRMAN’S INTRODUCTION
BOARD OF DIRECTORS & SENIOR MANAGEMENT
APPLYING THE PRINCIPLES OF THE COMBINED CODE
OTHER STATUTORY INFORMATION
COMMITTEE REPORTS
STATEMENT OF DIRECTORS RESPONSIBILITIES
FOCUS DELIVERY MOMENTUM
As at 1 January 2011 As at 3 January 2010*
"A" Ordinary Shares of
€1.00
Convertible Loan Stock of €0.01269738
"C" Shares of
€0.01
"A" Ordinary Shares of
€1.00
Convertible Loan Stock of €0.01269738
"C" Shares of
€0.01
Directors
L Herlihy 91,425 – 48,176,819 90,397 410,210 48,176,819
V Quinlan 12,387 – 3,576,185 12,245 – 3,576,185
Mn Keane 6,626 – 84,564 6,360 56,298 84,564
J Moloney 1 – – 4,952,304 – – 4,952,304
H Corbally 5,912 – 1,040,133 5,814 79,510 1,040,133
E Fitzpatrick 24,623 – 10,036,078 24,329 85,412 10,036,078
J Gannon 10,974 – 142,905 10,759 83,584 142,905
J Gilsenan 3,971 – 5,157,402 3,917 83,439 5,157,402
B Hayes 2 9,996 – 1,500,000 9,874 – 1,500,000
Ml Keane 2 20,157 – 1,875,940 20,084 – 2,052,647
M Merrick 6,309 – 387,464 6,074 92,334 387,464
J Murphy 2 14,834 – – 14,517 – 283,234
W Murphy – – 1,714,149 – – 1,714,149
A O'Connor 20,530 – – 19,785 104,550 –
R Prendergast 6,683 – – 6,620 48,671 –
S Talbot 1 – – 9,145,071 – – 9,145,071
Secretary
M Horan – – 1,000,000 – – 1,000,000
1 Executive Director 2 Appointed 29 June 2010 * Or at date of appointment if later
Table A(1): Directors and Secretary’s interests in Glanbia Co-operative Society Limited
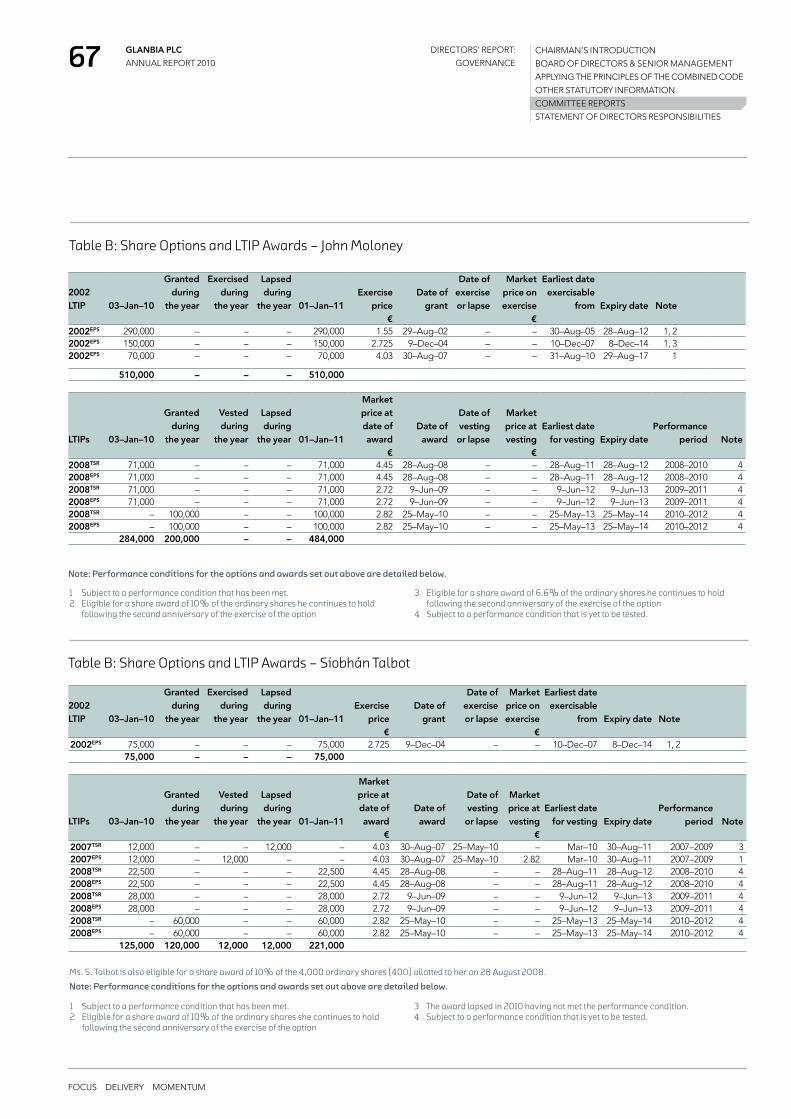
FOCUS DELIVERY MOMENTUM
GLANBIA PLC
ANNUAL REPORT 2010 67 DIRECTORS' REPORT:
GOVERNANCE
CHAIRMAN’S INTRODUCTION
BOARD OF DIRECTORS & SENIOR MANAGEMENT
APPLYING THE PRINCIPLES OF THE COMBINED CODE
OTHER STATUTORY INFORMATION
COMMITTEE REPORTS
STATEMENT OF DIRECTORS RESPONSIBILITIES
2002 LTIP
03–Jan–10
Granted during
the year
Exercised during
the year
Lapsed during
the year
01–Jan–11 Exercise
price €
Date of
grant
Date of exercise or lapse
Market price on exercise
€
Earliest date exercisable
from
Expiry date
Note
2002EPS 290,000 – – – 290,000 1.55 29–Aug–02 – – 30–Aug–05 28–Aug–12 1, 22002EPS 150,000 – – – 150,000 2.725 9–Dec–04 – – 10–Dec–07 8–Dec–14 1, 32002EPS 70,000 – – – 70,000 4.03 30–Aug–07 – – 31–Aug–10 29–Aug–17 1
510,000 – – – 510,000
LTIPs
03–Jan–10
Granted
during the year
Vested during
the year
Lapsed during
the year
01–Jan–11
Market price at date of award
€
Date of award
Date of vesting or lapse
Market price at vesting
€
Earliest date for vesting
Expiry date
Performance period
Note
2008TSR 71,000 – – – 71,000 4.45 28–Aug–08 – – 28–Aug–11 28–Aug–12 2008–2010 42008EPS 71,000 – – – 71,000 4.45 28–Aug–08 – – 28–Aug–11 28–Aug–12 2008–2010 42008TSR 71,000 – – – 71,000 2.72 9–Jun–09 – – 9–Jun–12 9–Jun–13 2009–2011 42008EPS 71,000 – – – 71,000 2.72 9–Jun–09 – – 9–Jun–12 9–Jun–13 2009–2011 42008TSR – 100,000 – – 100,000 2.82 25–May–10 – – 25–May–13 25–May–14 2010–2012 42008EPS – 100,000 – – 100,000 2.82 25–May–10 – – 25–May–13 25–May–14 2010–2012 4
284,000 200,000 – – 484,000
Table B: Share Options and LTIP Awards – John Moloney
1 Subject to a performance condition that has been met.2 Eligible for a share award of 10% of the ordinary shares he continues to hold
following the second anniversary of the exercise of the option
3 Eligible for a share award of 6.6% of the ordinary shares he continues to hold following the second anniversary of the exercise of the option
4 Subject to a performance condition that is yet to be tested.
2002 LTIP
03–Jan–10
Granted during
the year
Exercised during
the year
Lapsed during
the year
01–Jan–11 Exercise
price €
Date of
grant
Date of exercise or lapse
Market price on exercise
€
Earliest date exercisable
from
Expiry date
Note
2002EPS 75,000 – – – 75,000 2.725 9–Dec–04 – – 10–Dec–07 8–Dec–14 1, 275,000 – – – 75,000
LTIPs
03–Jan–10
Granted
during the year
Vested during
the year
Lapsed during
the year
01–Jan–11
Market price at date of award
€
Date of award
Date of vesting or lapse
Market price at vesting
€
Earliest date for vesting
Expiry date
Performance period
Note
2007TSR 12,000 – – 12,000 – 4.03 30–Aug–07 25–May–10 – Mar–10 30–Aug–11 2007–2009 32007EPS 12,000 – 12,000 – – 4.03 30–Aug–07 25–May–10 2.82 Mar–10 30–Aug–11 2007–2009 12008TSR 22,500 – – – 22,500 4.45 28–Aug–08 – – 28–Aug–11 28–Aug–12 2008–2010 42008EPS 22,500 – – – 22,500 4.45 28–Aug–08 – – 28–Aug–11 28–Aug–12 2008–2010 42008TSR 28,000 – – – 28,000 2.72 9–Jun–09 – – 9–Jun–12 9–Jun–13 2009–2011 42008EPS 28,000 – – – 28,000 2.72 9–Jun–09 – – 9–Jun–12 9–Jun–13 2009–2011 42008TSR – 60,000 – – 60,000 2.82 25–May–10 – – 25–May–13 25–May–14 2010–2012 42008EPS – 60,000 – – 60,000 2.82 25–May–10 – – 25–May–13 25–May–14 2010–2012 4
125,000 120,000 12,000 12,000 221,000
Table B: Share Options and LTIP Awards – Siobhán Talbot
1 Subject to a performance condition that has been met.2 Eligible for a share award of 10% of the ordinary shares she continues to hold
following the second anniversary of the exercise of the option
3 The award lapsed in 2010 having not met the performance condition.4 Subject to a performance condition that is yet to be tested.
Ms. S. Talbot is also eligible for a share award of 10% of the 4,000 ordinary shares (400) allotted to her on 28 August 2008.
Note: Performance conditions for the options and awards set out above are detailed below.
Note: Performance conditions for the options and awards set out above are detailed below.

GLANBIA PLC
ANNUAL REPORT 2010 68 DIRECTORS' REPORT:
GOVERNANCE
CHAIRMAN’S INTRODUCTION
BOARD OF DIRECTORS & SENIOR MANAGEMENT
APPLYING THE PRINCIPLES OF THE COMBINED CODE
OTHER STATUTORY INFORMATION
COMMITTEE REPORTS
STATEMENT OF DIRECTORS RESPONSIBILITIES
FOCUS DELIVERY MOMENTUM
LTIPs
03–Jan–10
Granted
during the year
Vested during
the year
Lapsed during
the year
01–Jan–11
Market price at date of award
€
Date of award
Date of vesting or lapse
Market price at vesting
€
Earliest date for vesting
Expiry date
Performance period
Note
2007TSR 5,500 – – 5,500 – 4.03 30–Aug–07 25–May–10 – Mar–10 30–Aug–11 2007–2009 22007EPS 5,500 – 5,500 – – 4.03 30–Aug–07 25–May–10 2.82 Mar–10 30–Aug–11 2007–2009 12008TSR 12,000 – – – 12,000 4.45 28–Aug–08 – – 28–Aug–11 28–Aug–12 2008–2010 32008EPS 12,000 – – – 12,000 4.45 28–Aug–08 – – 28–Aug–11 28–Aug–12 2008–2010 32008TSR 12,000 – – – 12,000 2.72 9–Jun–09 – – 9–Jun–12 9–Jun–13 2009–2011 32008EPS 12,000 – – – 12,000 2.72 9–Jun–09 – – 9–Jun–12 9–Jun–13 2009–2011 32008TSR – 31,000 – – 31,000 2.82 25–May–10 – – 25–May–13 25–May–14 2010–2012 32008EPS – 31,000 – – 31,000 2.82 25–May–10 – – 25–May–13 25–May–14 2010–2012 3
59,000 62,000 5,500 5,500 110,000
Table B: Share Options and LTIP Awards – Michael Horan
2002 LTIP
03–Jan–10
Granted during
the year
Exercised during
the year
Lapsed during
the year
01–Jan–11 Exercise
price €
Date of
grant
Date of exercise or lapse
Market price on exercise
€
Earliest date exercisable
from
Expiry date
Note
2002EPS 164,000 – – – 164,000 1.55 29–Aug–02 – – 30–Aug–05 28–Aug–12 1, 22002EPS 100,000 – – – 100,000 2.725 9–Dec–04 – – 10–Dec–07 8–Dec–14 12002EPS 48,000 – – – 48,000 4.03 30–Aug–07 – – 31–Aug–10 29–Aug–17 1
312,000 – – – 312,000
LTIPs
03–Jan–10
Granted
during the year
Vested during
the year
Lapsed during
the year
01–Jan–11
Market price at date of award
€
Date of award
Date of vesting or lapse
Market price at vesting
€
Earliest date for vesting
Expiry date
Performance period
Note
2008TSR 48,000 – – – 48,000 4.45 28–Aug–08 – – 28–Aug–11 28–Aug–12 2008–2010 32008EPS 48,000 – – – 48,000 4.45 28–Aug–08 – – 28–Aug–11 28–Aug–12 2008–2010 32008TSR 48,000 – – – 48,000 2.72 9–Jun–09 – – 9–Jun–12 9–Jun–13 2009–2011 3
2008EPS 48,000 – – – 48,000 2.72 9–Jun–09 – – 9–Jun–12 9–Jun–13 2009–2011 32008TSR – 72,500 – – 72,500 2.82 25–May–10 – – 25–May–13 25–May–14 2010–2012 32008EPS – 72,500 – – 72,500 2.82 25–May–10 – – 25–May–13 25–May–14 2010–2012 3
192,000 145,000 – – 337,000
Table B: Share Options and LTIP Awards – Kevin Toland
1 Subject to a performance condition that has been met.2 Eligible for a share award of 10% of the ordinary shares he continues to hold
following the second anniversary of the exercise of the option3 Subject to a performance condition that is yet to be tested.
Note: Performance conditions for the options and awards set out above are detailed below.
1 Subject to a performance condition that has been met.2 The award lapsed in 2010 having not met the performance condition.3 Subject to a performance condition that is yet to be tested.
Note: Performance conditions for the options and awards set out above are detailed below.
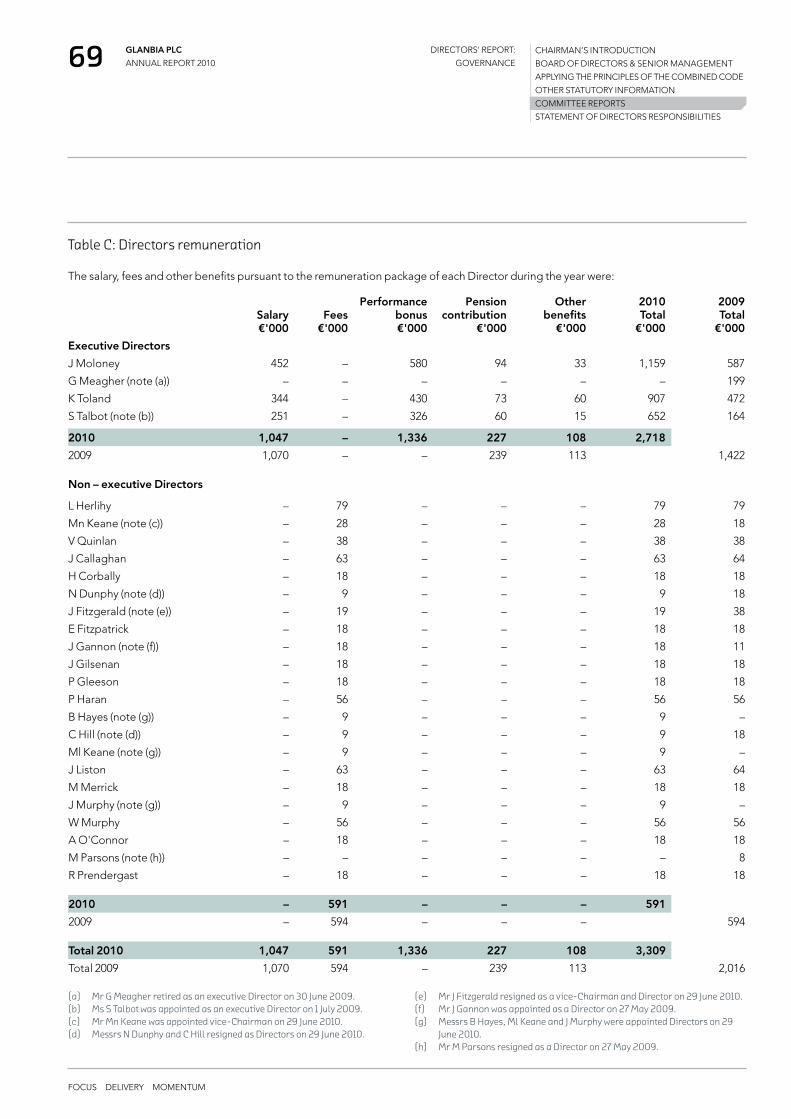
FOCUS DELIVERY MOMENTUM
GLANBIA PLC
ANNUAL REPORT 2010 69 DIRECTORS' REPORT:
GOVERNANCE
CHAIRMAN’S INTRODUCTION
BOARD OF DIRECTORS & SENIOR MANAGEMENT
APPLYING THE PRINCIPLES OF THE COMBINED CODE
OTHER STATUTORY INFORMATION
COMMITTEE REPORTS
STATEMENT OF DIRECTORS RESPONSIBILITIES
Table C: Directors remuneration
The salary, fees and other benefits pursuant to the remuneration package of each Director during the year were:
Salary €'000
Fees
€'000
Performance bonus €'000
Pension contribution
€'000
Other benefits
€'000
2010 Total
€'000
2009 Total
€'000
Executive Directors
J Moloney 452 – 580 94 33 1,159 587
G Meagher (note (a)) – – – – – – 199
K Toland 344 – 430 73 60 907 472
S Talbot (note (b)) 251 – 326 60 15 652 164
2010 1,047 – 1,336 227 108 2,718
2009 1,070 – – 239 113 1,422
Non – executive Directors
L Herlihy – 79 – – – 79 79
Mn Keane (note (c)) – 28 – – – 28 18
V Quinlan – 38 – – – 38 38
J Callaghan – 63 – – – 63 64
H Corbally – 18 – – – 18 18
N Dunphy (note (d)) – 9 – – – 9 18
J Fitzgerald (note (e)) – 19 – – – 19 38
E Fitzpatrick – 18 – – – 18 18
J Gannon (note (f)) – 18 – – – 18 11
J Gilsenan – 18 – – – 18 18
P Gleeson – 18 – – – 18 18
P Haran – 56 – – – 56 56
B Hayes (note (g)) – 9 – – – 9 –
C Hill (note (d)) – 9 – – – 9 18
Ml Keane (note (g)) – 9 – – – 9 –
J Liston – 63 – – – 63 64
M Merrick – 18 – – – 18 18
J Murphy (note (g)) – 9 – – – 9 –
W Murphy – 56 – – – 56 56
A O'Connor – 18 – – – 18 18
M Parsons (note (h)) – – – – – – 8
R Prendergast – 18 – – – 18 18
2010 – 591 – – – 591
2009 – 594 – – – 594
Total 2010 1,047 591 1,336 227 108 3,309
Total 2009 1,070 594 – 239 113 2,016
(a) Mr G Meagher retired as an executive Director on 30 June 2009.(b) Ms S Talbot was appointed as an executive Director on 1 July 2009.(c) Mr Mn Keane was appointed vice-Chairman on 29 June 2010.(d) Messrs N Dunphy and C Hill resigned as Directors on 29 June 2010.
(e) Mr J Fitzgerald resigned as a vice-Chairman and Director on 29 June 2010.(f) Mr J Gannon was appointed as a Director on 27 May 2009.(g) Messrs B Hayes, Ml Keane and J Murphy were appointed Directors on 29
June 2010.(h) Mr M Parsons resigned as a Director on 27 May 2009.

GLANBIA PLC
ANNUAL REPORT 2010 70 DIRECTORS' REPORT:
GOVERNANCE
CHAIRMAN’S INTRODUCTION
BOARD OF DIRECTORS & SENIOR MANAGEMENT
APPLYING THE PRINCIPLES OF THE COMBINED CODE
OTHER STATUTORY INFORMATION
COMMITTEE REPORTS
STATEMENT OF DIRECTORS RESPONSIBILITIES
FOCUS DELIVERY MOMENTUM
Table C: Directors remuneration (continued)
The pension benefits of each of the executive Directors during the year were as follows:
Transfer value of increase in
accrued pension €' 000
Annual pension accrued in 2010 in excess of inflation
€' 000
Total annual accrued pension 1 January 2011
€' 000
J Moloney 77 9 338
K Toland 51 9 118
S Talbot 35 6 117
2010 163 24 573
2009 219 28 784
The benefits received by the Irish executive Directors include, where applicable, the provision of a car and suitable medical insurance.
The benefits received by the US-based executive Director include a cash allowance for a car, medical examination, dental benefits and insured life benefits.
On behalf of the Remuneration Committee
Jerry ListonRemuneration Committee Chairman
The Remuneration Committee of the Board, which comprises solely of non-executive Directors, determines the Company's policy on executive Director remuneration and sets the remuneration package of each of the executive Directors. There are no contracts of service for executive Directors which are required to be made available for inspection.
All emoluments and compensation paid to the Directors during the year are shown above. Where the individual was appointed during the year the amount shown is for the period from appointment.

FOCUS DELIVERY MOMENTUM
GLANBIA PLC
ANNUAL REPORT 2010 71 DIRECTORS' REPORT:
GOVERNANCE
The Directors are responsible for preparing the annual report and the financial statements in accordance with applicable law and regulations.
Irish company law requires the Directors to prepare financial statements for each financial year. Under that law the Directors have prepared the financial statements in accordance with International Financial Reporting Standards (IFRSs) as adopted by the European Union. The financial statements are required by law to give a true and fair view of the state of affairs of the Company and the Group and of the profit or loss of the Group.
In preparing these financial statements the Directors are required to:
• Select suitable accounting policies and then apply them consistently;
• Make judgements and estimates that are reasonable and prudent;
• State that the financial statements comply with IFRSs as adopted by the European Union; and
• Prepare the financial statements on the going concern basis, unless it is inappropriate to presume that the Group will continue in business, in which case there should be supporting assumptions or qualifications as necessary.
The Directors are also required by applicable law and the Listing Rules issued by the Irish Stock Exchange to prepare a Directors’ report and reports relating to Directors’ remuneration and report on corporate governance in accordance with the European Communities (Directive 2006/46/EC) Regulations 2009 (as amended) and the Directors are required to include a management report containing a fair review of the business and a description of the principal risks and uncertainties facing the Group in accordance with the Transparency (Directive 2004/109/EC) Regulations 2007.
The Directors are responsible for keeping proper books of account that disclose with reasonable accuracy at any time the financial position of the Company and the Group and to enable them to ensure that the financial statements comply with the Companies Acts 1963 to 2009 and, as regards the group financial statements, article 4 of the IAS Regulation. They are also responsible for safeguarding the assets of the Company and the Group and hence for taking reasonable steps for the prevention and detection of fraud and other irregularities.
The Directors are responsible for the maintenance and integrity of the corporate and financial information included on the Company’s website. Legislation in the Republic of Ireland concerning the preparation and dissemination of financial statements may differ from legislation in other jurisdictions.
Directors’ statement pursuant to the Transparency (Directive 2004/109/EC) Regulations 2007
Each of the Directors, executive and non-executive, whose names and functions are listed on pages 44 to 46 confirms that to the best of each person’s knowledge and belief:
• the financial statements prepared in accordance with IFRS as adopted by the EU give a true and fair view of the assets, liabilities and financial position of the Company and the Group and of the profit of the Group; and
• the Directors’ report contained in the annual report includes a fair review of the development and performance of the business and the position of the Company and Group, together with a description of the principal risks and uncertainties that they face.
Statement of Directors’ responsibilities
CHAIRMAN’S INTRODUCTION
BOARD OF DIRECTORS & SENIOR MANAGEMENT
APPLYING THE PRINCIPLES OF THE COMBINED CODE
OTHER STATUTORY INFORMATION
COMMITTEE REPORTS
STATEMENT OF DIRECTORS RESPONSIBILITIES
Directors' Report
On behalf of the Board L Herlihy J Moloney S TalbotDirectors 1 March 2011

GLANBIA PLC
ANNUAL REPORT 2010 72 DIRECTORS' REPORT:
GOVERNANCE
CHAIRMAN’S INTRODUCTION
BOARD OF DIRECTORS & SENIOR MANAGEMENT
APPLYING THE PRINCIPLES OF THE COMBINED CODE
OTHER STATUTORY INFORMATION
COMMITTEE REPORTS
STATEMENT OF DIRECTORS RESPONSIBILITIES
FOCUS DELIVERY MOMENTUM
Financial statements

FOCUS DELIVERY MOMENTUM
GLANBIA PLC
ANNUAL REPORT 2010 73 DIRECTORS' REPORT:
GOVERNANCE
CHAIRMAN’S INTRODUCTION
BOARD OF DIRECTORS & SENIOR MANAGEMENT
APPLYING THE PRINCIPLES OF THE COMBINED CODE
OTHER STATUTORY INFORMATION
COMMITTEE REPORTS
STATEMENT OF DIRECTORS RESPONSIBILITIES
Independent auditors’ report to the members of Glanbia plc 74
Group income statement 76
Group statement of comprehensive income 77
Group statement of changes in equity 78
Group statement of financial position 79
Group statement of cash flows 80
Company statement of financial position 81
Company statement of changes in equity 82
Company statement of comprehensive income and statement of cash flows 83
Notes to the financial statements
1. General information 84
2. Summary of significant accounting polices 84
3. Financial risk management 90
4. Critical accounting estimates and judgements 95
5. Segment information 96
6. Operating expenses 101
7. Exceptional items 102
8. Employee benefit expense 103
9. Directors’ remuneration 103
10. Finance income and costs 103
11. Income taxes 104
12. Earnings per share 105
13. Dividends 106
14. Property, plant and equipment 106
15. Intangible assets 107
16. Investments in associates 110
17. Investments in joint ventures 111
18. Available for sale financial assets 112
19. Trade and other receivables 113
20. Inventories 115
21. Cash and cash equivalents 115
22. Other reserves 116
23. Share capital and share premium 120
24. Retained earnings 121
25. Non-controlling interests 121
26. Borrowings 122
27. Deferred income taxes 124
28. Retirement benefit obligations 126
29. Provisions for other liabilities and charges 129
30. Capital grants 130
31. Trade and other payables 130
32. Derivative financial instruments 130
33. Contingent liabilities 131
34. Commitments 132
35. Cash generated from operations 132
36. Business combinations 133
37. Related party transactions 134
38. Events after the reporting period 135
39. Comparatives 136
40. Principal subsidiary and associated undertakings 136
73 FINANCIAL STATEMENTSGLANBIA PLC
ANNUAL REPORT 2010

74 GLANBIA PLC
ANNUAL REPORT 2010
FINANCIAL STATEMENTS
We have audited the Group and Parent Company financialstatements (the “financial statements”) of Glanbia plc for the yearended 1 January 2011, which comprise the Group incomestatement, the Group and Parent Company statements of financialposition, the Group and Parent Company statements of changesin equity, the Group and Parent Company statements of cashflows, the Group and Parent Company statements ofcomprehensive income and the related notes. These financialstatements have been prepared under the accounting policies setout therein.
Respective responsibilities of Directorsand auditorsThe Directors’ responsibilities for preparing the Annual Reportand the financial statements, in accordance with applicable Irishlaw and International Financial Reporting Standards (IFRSs) asadopted by the European Union, are set out in the statementof Directors’ responsibilities.
Our responsibility is to audit the financial statements inaccordance with relevant legal and regulatory requirements andInternational Standards on Auditing (UK and Ireland). This report,including the opinion, has been prepared for and only for theParent Company’s members as a body in accordance with section193 of the Companies Act, 1990 and for no other purpose. We donot, in giving this opinion, accept or assume responsibility for anyother purpose or to any other person to whom this report isshown or into whose hands it may come save where expresslyagreed by our prior consent in writing.
We report to you our opinion as to whether the Group financialstatements give a true and fair view, in accordance with IFRSs asadopted by the European Union. We report to you our opinionas to whether the Parent Company financial statements give atrue and fair view, in accordance with IFRSs as adopted by theEuropean Union, as applied in accordance with the provisionsof the Companies Acts, 1963 to 2009. We also report to youwhether the financial statements have been properly preparedin accordance with Irish statute comprising the Companies Acts,1963 to 2009 and Article 4 of the IAS Regulation. We state whetherwe have obtained all the information and explanations weconsider necessary for the purposes of our audit, and whetherthe Parent Company statement of financial position is inagreement with the books of account. We also report to you ouropinion as to:
� whether the Parent Company has kept proper books ofaccount;
� whether the Directors’ report is consistent with the financialstatements; and
� whether at the reporting date there existed a financial situationwhich may require the Parent Company to convene anextraordinary general meeting of the Parent Company; such afinancial situation may exist if the net assets of the ParentCompany, as stated in the Parent Company statement offinancial position are not more than half of its called-up sharecapital.
We also report to you if, in our opinion, any information specifiedby law or the Listing Rules of the Irish Stock Exchange regardingDirectors’ remuneration and Directors’ transactions is notdisclosed and, where practicable, include such information inour report.
We are required by law to report to you our opinion as to whetherthe description in the statement on corporate governance of themain features of the internal control and risk management systemsin relation to the process for preparing the Group financialstatements is consistent with the Group financial statements.
In addition, we review whether the statement on corporategovernance reflects the Company's compliance with the nineprovisions of the June 2008 Combined Code specified for ourreview by the Listing Rules of the Irish Stock Exchange, and reportif it does not. We are not required to consider whether theBoard’s statements on internal controls cover all risks andcontrols, or form an opinion on the effectiveness of the Group’scorporate governance procedures or its risk and controlprocedures.
We read the other information contained in the Annual Reportand consider whether it is consistent with the audited financialstatements. The other information comprises of the followingsections: our strategy, Group performance, divisional performanceand governance. We consider the implications for our report if webecome aware of any apparent misstatements or materialinconsistencies with the financial statements. Our responsibilitiesdo not extend to any other information.
Basis of audit opinionWe conducted our audit in accordance with InternationalStandards on Auditing (UK and Ireland) issued by the AuditingPractices Board. An audit includes examination, on a test basis, ofevidence relevant to the amounts and disclosures in the financialstatements. It also includes an assessment of the significantestimates and judgments made by the Directors in thepreparation of the financial statements, and of whether theaccounting policies are appropriate to the Group’s and ParentCompany’s circumstances, consistently applied and adequatelydisclosed.
We planned and performed our audit so as to obtain all theinformation and explanations which we considered necessary inorder to provide us with sufficient evidence to give reasonableassurance that the financial statements are free from materialmisstatement, whether caused by fraud or other irregularity orerror. In forming our opinion we also evaluated the overalladequacy of the presentation of information in the financialstatements.
OpinionIn our opinion:
� the Group financial statements give a true and fair view, inaccordance with IFRSs as adopted by the European Union, ofthe state of the Group’s affairs as at 1 January 2011 and of itsprofit and cash flows for the year then ended;
� the Parent Company financial statements give a true and fairview, in accordance with IFRSs as adopted by the EuropeanUnion, as applied in accordance with the provisions of theCompanies Acts, 1963 to 2009 of the state of the ParentCompany’s affairs as at 1 January 2011 and cash flows for theyear then ended; and
� the financial statements have been properly prepared inaccordance with the Companies Acts, 1963 to 2009 and Article4 of the IAS Regulation.
Independent auditors’ report to the members of Glanbia plc

75 GLANBIA PLC
ANNUAL REPORT 2010
FINANCIAL STATEMENTS
We have obtained all the information and explanations which weconsider necessary for the purposes of our audit. In our opinionproper books of account have been kept by the Parent Company.The Parent Company statement of financial position is inagreement with the books of account.
In our opinion the information given in the Directors’ report isconsistent with the financial statement, and the description in thestatements on corporate governance of the main features of theinternal control and risk management systems in relation to theprocess for preparing the Group financial statements is consistentwith the Group financial statements
The net assets of the Parent Company, as stated in the ParentCompany statement of financial position are more than half of theamount of its called-up share capital and, in our opinion, on thatbasis there did not exist at 1 January 2011 a financial situationwhich under section 40 (1) of the Companies (Amendment) Act,1983 would require the convening of an extraordinary generalmeeting of the Company.
PricewaterhouseCoopersChartered Accountants and Registered AuditorsWaterford, Ireland1 March 2011
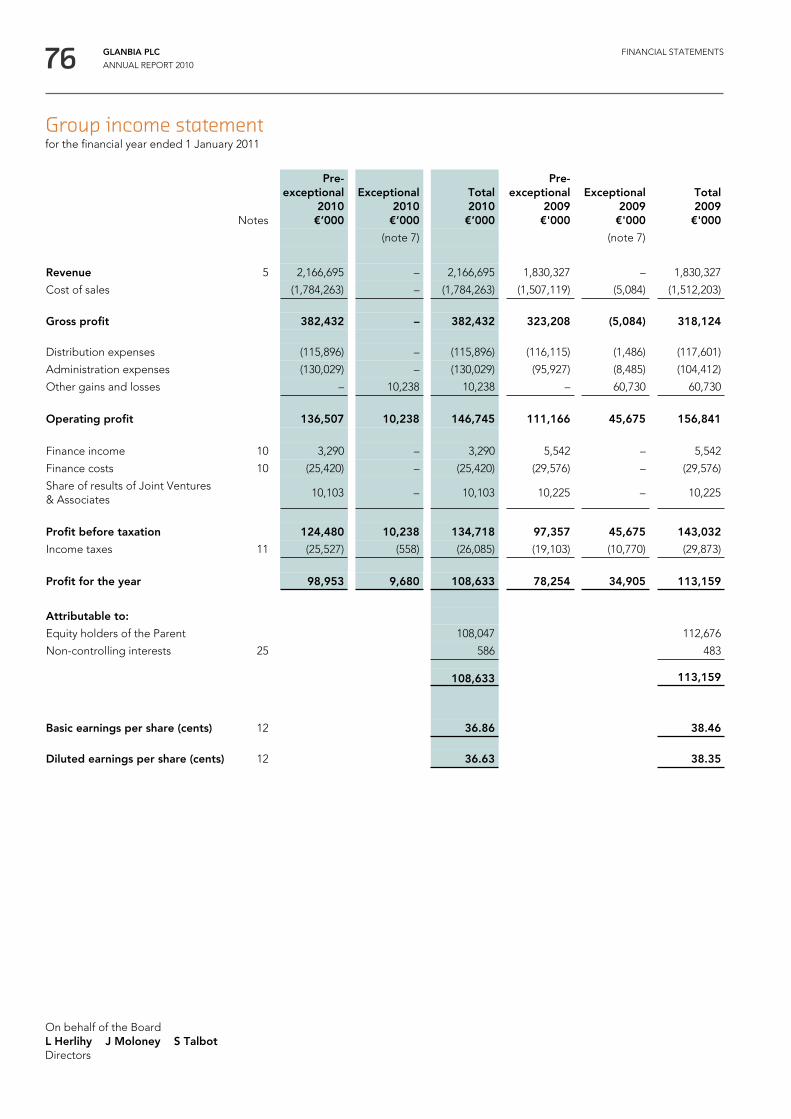
76 GLANBIA PLC
ANNUAL REPORT 2010
FINANCIAL STATEMENTS
Notes
Pre-exceptional
2010€’000
Exceptional2010€’000
Total2010€’000
Pre-exceptional
2009€'000
Exceptional2009€'000
Total2009€'000
(note 7) (note 7)
Revenue 5 2,166,695 – 2,166,695 1,830,327 – 1,830,327
Cost of sales (1,784,263) – (1,784,263) (1,507,119) (5,084) (1,512,203)
Gross profit 382,432 – 382,432 323,208 (5,084) 318,124
Distribution expenses (115,896) – (115,896) (116,115) (1,486) (117,601)
Administration expenses (130,029) – (130,029) (95,927) (8,485) (104,412)
Other gains and losses – 10,238 10,238 – 60,730 60,730
Operating profit 136,507 10,238 146,745 111,166 45,675 156,841
Finance income 10 3,290 – 3,290 5,542 – 5,542
Finance costs 10 (25,420) – (25,420) (29,576) – (29,576)
Share of results of Joint Ventures& Associates
10,103 – 10,103 10,225 – 10,225
Profit before taxation 124,480 10,238 134,718 97,357 45,675 143,032
Income taxes 11 (25,527) (558) (26,085) (19,103) (10,770) (29,873)
Profit for the year 98,953 9,680 108,633 78,254 34,905 113,159
Attributable to:
Equity holders of the Parent 108,047 112,676
Non-controlling interests 25 586 483
108,633 113,159
Basic earnings per share (cents) 12 36.86 38.46
Diluted earnings per share (cents) 12 36.63 38.35
Group income statementfor the financial year ended 1 January 2011
On behalf of the BoardL Herlihy J Moloney S TalbotDirectors

77 GLANBIA PLC
ANNUAL REPORT 2010
FINANCIAL STATEMENTS
Notes2010€'000
2009€'000
Profit for the year 108,633 113,159
Other comprehensive income/(expense)
Actuarial gain/(loss) – defined benefit schemes 28 13,379 (31,215)
Deferred tax (charge)/credit on actuarial gain/loss 27 (1,250) 2,684
Share of actuarial gain/(loss) – Joint Ventures & Associates 24 2,760 (1,730)
Deferred tax (charge)/credit on actuarial gain/loss – Joint Ventures & Associates 24 (316) 366
Currency translation differences 22 20,169 6,258
Revaluation of available for sale financial assets 22 (5,381) (3,367)
Fair value movements on cash flow hedges 22 3,936 5,114
Deferred tax on cash flow hedges and revaluation of available for sale financial assets 27 2,267 (503)
Other comprehensive income/(expense) for the year, net of tax 35,564 (22,393)
Total comprehensive income for the year 144,197 90,766
Total comprehensive income attributable to:
Equity holders of the Parent 143,611 90,283
Non-controlling interests 25 586 483
144,197 90,766
Group statement of comprehensive incomefor the financial year ended 1 January 2011

78 GLANBIA PLC
ANNUAL REPORT 2010
FINANCIAL STATEMENTS
Attributable to equity holders of the Parent
Share capitaland sharepremium
€'000
Otherreserves
€'000
Retainedearnings
€'000Total€'000
Non-controlling
interests€'000
Total€'000
(note 23) (note 22) (note 24) (note 25)
Balance at 3 January 2009 99,219 100,983 19,707 219,909 8,010 227,919
Profit for the year – – 112,676 112,676 483 113,159
Other comprehensive income/(expense)
Actuarial loss – defined benefit schemes – – (31,215) (31,215) – (31,215)
Deferred tax on actuarial loss – – 2,684 2,684 – 2,684
Share of actuarial loss – Joint Ventures & Associates – – (1,364) (1,364) – (1,364)
Fair value movements – 1,747 – 1,747 – 1,747
Deferred tax on fair value movements – (503) – (503) – (503)
Exceptional non-cash foreign exchange loss – 18,280 – 18,280 – 18,280
Currency translation differences – (12,022) – (12,022) – (12,022)
Total comprehensive income for the year – 7,502 82,781 90,283 483 90,766
Dividends paid during the year – – (19,484) (19,484) (2,000) (21,484)
Cost of share based payments – 187 – 187 – 187
Balance at 2 January 2010 99,219 108,672 83,004 290,895 6,493 297,388
Profit for the year – – 108,047 108,047 586 108,633
Other comprehensive income/(expense)
Actuarial gain – defined benefit schemes – – 13,379 13,379 – 13,379
Deferred tax on actuarial gain – – (1,250) (1,250) – (1,250)
Share of actuarial gain – Joint Ventures & Associates – – 2,444 2,444 – 2,444
Fair value movements – (1,445) – (1,445) – (1,445)
Deferred tax on fair value movements – 2,267 – 2,267 – 2,267
Currency translation differences – 20,169 – 20,169 – 20,169
Total comprehensive income for the year – 20,991 122,620 143,611 586 144,197
Dividends paid during the year – – (20,453) (20,453) (187) (20,640)
Cost of share based payments – 2,937 – 2,937 – 2,937
Transfer on exercise, forfeit or lapse of share basedpayments that have vested
– (373) 373 – – –
Shares issued 17 – – 17 – 17
Premium on shares issued 505 – – 505 – 505
Balance at 1 January 2011 99,741 132,227 185,544 417,512 6,892 424,404
Goodwill previously written off amounting to €93.0 million (2009: €93.0 million) is included in opening and closing retained earnings.
Group statement of changes in equityfor the financial year ended 1 January 2011

79 GLANBIA PLC
ANNUAL REPORT 2010
FINANCIAL STATEMENTS
Group statement of financial positionas at 1 January 2011
Notes2010€'000
2009€'000
ASSETSNon-current assetsProperty, plant and equipment 14 369,346 363,152Intangible assets 15 356,830 342,112Investments in associates 16 11,757 10,041Investments in joint ventures 17 58,945 58,276Trade and other receivables 19 23,084 50,555Deferred tax assets 27 7,388 12,022Available for sale financial assets 18 14,127 20,397Derivative financial instruments 32 1,643 2,718
843,120 859,273Current assetsInventories 20 303,881 201,577Trade and other receivables 19 246,831 204,326Derivative financial instruments 32 3,912 7,501Cash and cash equivalents 21 229,101 152,789
783,725 566,193
Total assets 1,626,845 1,425,466
EQUITYIssued capital and reserves attributable to equity holders of the ParentShare capital and share premium 23 99,741 99,219Other reserves 22 132,227 108,672Retained earnings 24 185,544 83,004
417,512 290,895
Non-controlling interests 25 6,892 6,493
Total equity 424,404 297,388
LIABILITIESNon-current liabilitiesBorrowings 26 636,251 594,462Derivative financial instruments 32 3,315 5,631Deferred tax liabilities 27 75,966 66,337Retirement benefit obligations 28 48,560 85,765Provisions for other liabilities and charges 29 22,392 20,133Capital grants 30 18,609 18,582
805,093 790,910Current liabilitiesTrade and other payables 31 366,246 295,481Current tax liabilities 2,538 2,816Borrowings 26 972 945Derivative financial instruments 32 6,487 10,615Provisions for other liabilities and charges 29 21,105 27,311
397,348 337,168
Total liabilities 1,202,441 1,128,078
Total equity and liabilities 1,626,845 1,425,466
On behalf of the BoardL Herlihy J Moloney S TalbotDirectors

80 GLANBIA PLC
ANNUAL REPORT 2010
FINANCIAL STATEMENTS
Group statement of cash flowsfor the financial year ended 1 January 2011
2010 2009
Notes €'000 €'000
Cash flows from operating activitiesCash generated from operations 35 107,214 104,710Interest received 3,054 5,352Interest paid (25,613) (30,484)Tax paid (11,955) (5,533)
Net cash inflow from operating activities 72,700 74,045
Cash flows from investing activitiesAcquisition of subsidiary, net of cash acquired – (521)
Payment of deferred consideration on acquisition of subsidiaries (644) (762)
Purchase of property, plant and equipment (31,631) (47,463)
Purchase of intangible assets (4,333) (3,724)Dividends received from joint ventures 17 11,210 17,924Loans repaid by/(advanced to) joint ventures 23,280 (21,508)
Decrease in available for sale financial assets 438 433Proceeds from sale of property, plant and equipment 1,163 1,609
Net cash outflow from investing activities (517) (54,012)
Cash flows from financing activitiesProceeds from issue of ordinary shares 23 522 –Increase in borrowings 21,823 16,642Finance lease principal payments (926) (908)Dividends paid to Company shareholders 13 (20,453) (19,484)Dividends paid to non-controlling interests 25 (187) (2,000)Capital grants received 1,432 6,793
Net cash inflow from financing activities 2,211 1,043
Net increase in cash and cash equivalents 74,394 21,076
Cash and cash equivalents at the beginning of the year 152,789 132,572Effects of exchange rate changes on cash and cash equivalents 1,918 (859)
Cash and cash equivalents at the end of the year 21 229,101 152,789
Reconciliation of net cash flow to movement in net debt 2010 2009€'000 €'000
Net increase in cash and cash equivalents 74,394 21,076Cash movements from debt financing (20,897) (15,734)
53,497 5,342
Fair value movement of interest rate swaps qualifying as fair value hedges (2,165) 597Exchange translation adjustment on net debt (16,836) 3,526
Movement in net debt in the year 34,496 9,465Net debt at the beginning of the year (442,618) (452,083)
Net debt at the end of the year (408,122) (442,618)
Net debt comprises:Borrowings 26 (637,223) (595,407)Cash and cash equivalents 21 229,101 152,789
(408,122) (442,618)

81 GLANBIA PLC
ANNUAL REPORT 2010
FINANCIAL STATEMENTS
2010 2009
Notes €'000 €'000
ASSETS
Non-current assets
Investments in associates 16 2,298 1,395
Available for sale financial assets 18 265 740
Investments in subsidiaries 18 599,325 452,814
601,888 454,949
Current assets
Trade and other receivables 19 109 76,327
Cash and cash equivalents 21 8,200 –
8,309 76,327
Total assets 610,197 531,276
EQUITY
Issued capital and reserves attributable to equity holders of the Company
Share capital and share premium 23 455,009 454,487
Retained earnings 24 40,578 59,913
Other reserves 7,340 4,545
Total equity 502,927 518,945
LIABILITIES
Current liabilities
Trade and other payables 31 107,270 2,781
Borrowings 26 – 9,550
Total liabilities 107,270 12,331
Total equity and liabilities 610,197 531,276
Company statement of financial positionas at 1 January 2011
As permitted by section 148(8) of the Companies Act, 1963 and section 7(1A) of the Companies (Amendment) Act, 1986 the ParentCompany is availing of the exemption from presenting its separate income statement in these financial statements and from filing itwith the Registrar of Companies. The profit for the year dealt with in the financial statements of Glanbia plc, amounts to €0.7 million(2009: €43.3 million).
On behalf of the BoardL Herlihy J Moloney S TalbotDirectors

82 GLANBIA PLC
ANNUAL REPORT 2010
FINANCIAL STATEMENTS
Other reserves
Sharecapital
and sharepremium
€'000
Retainedearnings
€'000
Capitalreserve
€'000
Ownshares€'000
Sharebased
paymentreserve
€'000Total€'000
(note 23) (note 24) (note 22 a) (note 22 f) (note 22 g)
Balance at 3 January 2009 454,487 36,056 4,227 (1,899) 1,612 494,483
Profit for the year – 43,341 – – – 43,341
Dividends paid during the year – (19,484) – – – (19,484)
Cost of share based payments – – – – 167 167
Transfer from trade and other payables – share based payments – – – – 438 438
Balance at 2 January 2010 454,487 59,913 4,227 (1,899) 2,217 518,945
Profit for the year – 745 – – – 745
Dividends paid during the year – (20,453) – – – (20,453)
Cost of share based payments – – – – 2,937 2,937
Transfer on exercise, forfeit or lapse of share basedpayments that have vested
– 373 – 283 (656) –
Transfer of reserves between Group companies – – – – 231 231
Shares issued 17 – – – – 17
Premium on shares issued 505 – – – – 505
Balance at 1 January 2011 455,009 40,578 4,227 (1,616) 4,729 502,927
Company statement of changes in equityfor the financial year ended 1 January 2011
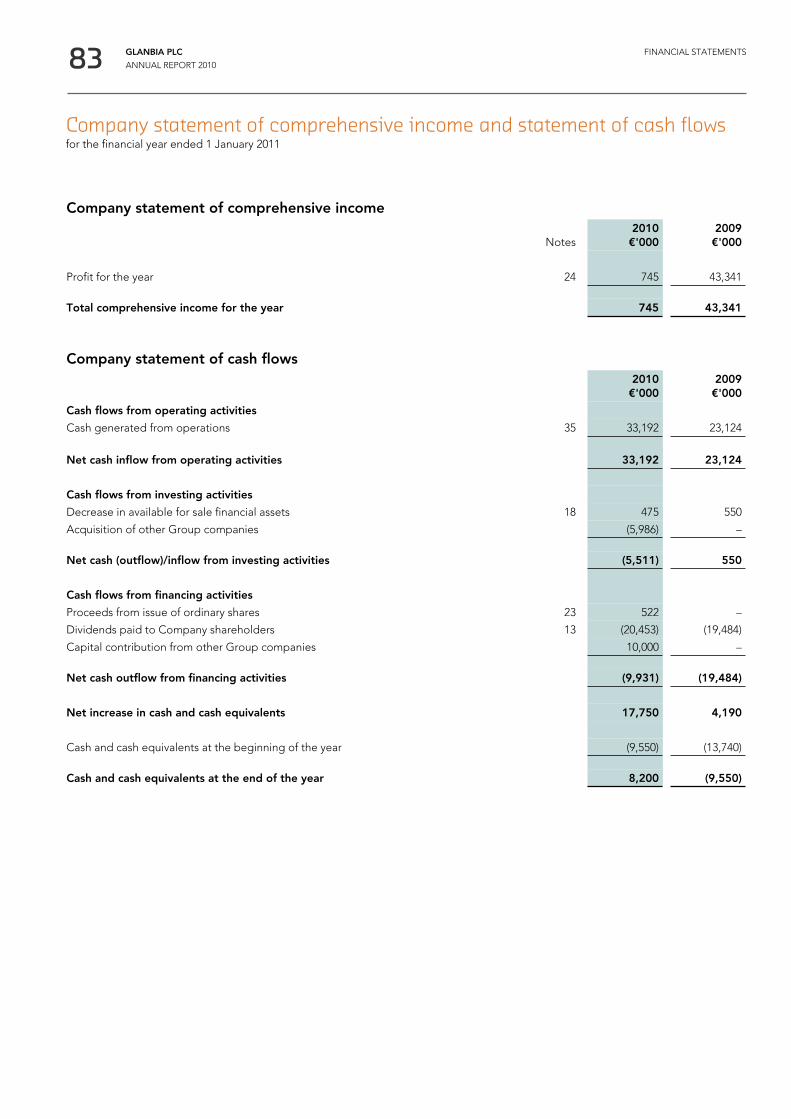
83 GLANBIA PLC
ANNUAL REPORT 2010
FINANCIAL STATEMENTS
Company statement of comprehensive income
Notes2010€'000
2009€'000
Profit for the year 24 745 43,341
Total comprehensive income for the year 745 43,341
Company statement of cash flows2010€'000
2009€'000
Cash flows from operating activities
Cash generated from operations 35 33,192 23,124
Net cash inflow from operating activities 33,192 23,124
Cash flows from investing activities
Decrease in available for sale financial assets 18 475 550
Acquisition of other Group companies (5,986) –
Net cash (outflow)/inflow from investing activities (5,511) 550
Cash flows from financing activities
Proceeds from issue of ordinary shares 23 522 –
Dividends paid to Company shareholders 13 (20,453) (19,484)
Capital contribution from other Group companies 10,000 –
Net cash outflow from financing activities (9,931) (19,484)
Net increase in cash and cash equivalents 17,750 4,190
Cash and cash equivalents at the beginning of the year (9,550) (13,740)
Cash and cash equivalents at the end of the year 8,200 (9,550)
Company statement of comprehensive income and statement of cash flowsfor the financial year ended 1 January 2011

84 GLANBIA PLC
ANNUAL REPORT 2010
FINANCIAL STATEMENTS
1. General informationGlanbia plc (“the Company”) and its subsidiaries (together“the Group”) is a global nutritional solutions and cheese Groupwith its main operations in Ireland, Europe, the USA, Canada, Asiaand Nigeria.
The Company is a public limited company incorporated anddomiciled in Ireland. The address of its registered office is GlanbiaHouse, Kilkenny, Ireland. The Group is controlled by Glanbia Co-operative Society Limited (“the Society”), which holds 54.5% ofthe issued share capital of the Company and is the ultimate parentof the Group.
The Company shares are quoted on the Irish and London StockExchanges.
These consolidated financial statements have been approved forissue by the Board of Directors on 1 March 2011.
2. Summary of significant accounting policesNew accounting standards and IFRIC interpretations adopted bythe Group during the year ended 1 January 2011 are dealt with insection (z) below. The adoption of these standards andinterpretations had no significant impact on the results or financialposition of the Group during the year.
The other principal accounting policies adopted in thepreparation of these financial statements are set out below.These policies have been consistently applied to all yearspresented, unless otherwise stated.
(a) Basis of preparationThese consolidated financial statements have been prepared inaccordance with EU adopted International Financial ReportingStandards (IFRS), IFRIC interpretations and those parts of theCompanies Acts, 1963 to 2009 applicable to companies reportingunder IFRS. The consolidated financial statements have beenprepared under the historical cost convention as modified by useof fair values for available for sale financial assets and derivativefinancial instruments.
The preparation of the financial statements in conformity with IFRSrequires the use of estimates, judgements and assumptions thataffect the reported amounts of assets and liabilities at the date ofthe financial statements and the reported amounts of revenuesand expenses during the reporting period. Although theseestimates are based on management’s best knowledge of theamount, event or actions, actual results ultimately may differ fromthese estimates.
Amounts are stated in euro thousands (€’000) unless otherwisestated.
These financial statements are prepared for a 52 week periodending on 1 January 2011, comparatives are for the 52 weekperiod ended 2 January 2010. The statements of financial positionfor 2010 and 2009 have been drawn up as at 1 January 2011 and2 January 2010 respectively.
(b) ConsolidationThe Group financial statements incorporate:
(i) The financial statements of Glanbia plc (“the Company”) andenterprises controlled by the Company (“its subsidiaries”).Control is achieved where the Company has the power togovern the financial and operating policies of an entity soas to obtain benefits from its activities.
Subsidiaries are consolidated from the date on which controlis transferred to the Group and are no longer consolidatedfrom the date that control ceases.
The Group uses the acquisition method of accounting toaccount for business combinations. The considerationtransferred for the acquisition of a subsidiary is the fair valuesof the assets transferred, the liabilities incurred and theequity interests issued by the Group. The considerationtransferred includes the fair value of any asset or liabilityresulting from a contingent consideration arrangement.Acquisition-related costs are expensed as incurred.Identifiable assets acquired and liabilities and contingentliabilities assumed in a business combination are measuredinitially at their fair values at the acquisition date. On anacquisition-by-acquisition basis, the Group recognises anynon-controlling interest in the acquiree either at fair value orat the non-controlling interest's proportionate share of theacquiree's net assets. Investments in subsidiaries areaccounted for at cost less impairment. Cost is adjusted toreflect changes in consideration arising from contingentconsideration amendments. Costs also includes directattributable costs of investment. The excess of theconsideration transferred, the amount of any non-controllinginterest in the acquiree and the acquisition-date fair value ofany previous equity interest in the acquiree over the fairvalue of the Group's share of the identifiable net assetsacquired is recorded as goodwill. If this is less than the fairvalue of the net assets of the subsidiary acquired in the caseof a bargain purchase, the difference is recognised directly inthe income statement.
Inter-company transactions, balances and unrealised gainson transactions between Group companies are eliminated.Where necessary, the accounting policies for subsidiarieshave been changed to ensure consistency with the policiesadopted by the Group.
(ii) The Group’s share of the results and net assets of associatedcompanies and joint ventures are included based on theequity method of accounting. An associate is an enterpriseover which the Group has significant influence, but notcontrol, through participation in the financial and operatingpolicy decisions of the investee. A joint venture is an entitysubject to joint control by the Group and other parties.Under the equity method of accounting, the Group’s shareof the post-acquisition profits and losses of associates andjoint ventures is recognised in the income statement and itsshare of post acquisition movements in reserves isrecognised directly in other comprehensive income. Thecumulative post acquisition movements are adjusted againstthe cost of the investment. Unrealised gains on transactionsbetween the Group and its associates and joint ventures areeliminated to the extent of the Group’s interest in theassociate or joint venture. Unrealised losses are alsoeliminated unless the transaction provides evidence of animpairment of the asset transferred. When the Group’s shareof losses in an associate or joint venture equals or exceedsits interest in the associate or joint venture, the Group doesnot recognise further losses, unless the Group has incurredobligations or made payments on behalf of the associate orjoint venture.
Notes to the financial statementsfor the financial year ended 1 January 2011

85 GLANBIA PLC
ANNUAL REPORT 2010
FINANCIAL STATEMENTS
(c) Segment reportingIn accordance with the requirements of IFRS 8 – SegmentReporting, operating segments are reported in a mannerconsistent with the internal reporting provided to the ChiefOperating Decision Maker. The Chief Operating Decision Makerresponsible for allocating resources and assessing performance ofthe operating segments has been identified as the GlanbiaOperating Executive Committee who make strategic decisions.
(d) Foreign currency translation(i) Functional and presentation currency
Items included in the financial statements of each of theGroup’s entities are measured using the currency of theprimary economic environment in which the entity operates(the ‘functional currency’). The consolidated financialstatements are presented in euro, which is the Company’sfunctional and Group’s presentation currency.
(ii) Transactions and balancesForeign currency transactions are translated into thefunctional currency using the exchange rates prevailing at thedate of the transactions. Foreign exchange gains and lossesresulting from the settlement of such transactions arerecognised in the income statement, except when deferredin equity as qualifying cash flow hedges. Monetary assets andliabilities denominated in foreign currencies are retranslatedat the rate of exchange ruling at the reporting date. Currencytranslation differences on monetary assets and liabilities aretaken to the income statement, except when deferred inequity in the currency translation reserve as (i) qualifying cashflow hedges or (ii) exchange gains or losses on long termintra-group loans and on foreign currency borrowings usedto finance or provide a hedge against Group equityinvestments in non-euro denominated operations to theextent that they are neither planned nor expected to berepaid in the foreseeable future or are expected to providean effective hedge of the net investment. When long termintra-group loans are repaid the related cumulative currencytranslation recognised in the currency reserve is not recycledthrough the income statement.
Translation differences on non-monetary financial assets andliabilities held at fair value through profit or loss arerecognised in the income statement as part of the fair valuegain or loss. Translation differences on non-monetaryfinancial assets such as equities classified as available for saleare included in the fair value reserve in equity.
(iii) Group companiesThe income statement and statement of financial position ofGroup companies that have a functional currency differentfrom the presentation currency are translated into thepresentation currency as follows:
– assets and liabilities at each reporting date are translated atthe closing rate at the reporting date of the statement offinancial position.
– income and expenses in the income statement aretranslated at average exchange rates for the year, or for theperiod since acquisition, if appropriate.
Resulting exchange differences are taken to a separatecurrency reserve within equity. When a foreign entity is sold,outside the Group such exchange differences are recognised inthe income statement as part of the gain or loss on sale.
Goodwill and fair value adjustments arising on the acquisitionof a foreign entity are treated as local currency assets and
liabilities of the foreign entity and are translated at theexchange rate at the end of the reporting period. Inaccordance with IFRS 1, the cumulative translationdifferences on foreign subsidiaries was set to zero on IFRStransition date (4 January 2004).
The Group uses the direct method of consolidation forrevaluation of the net investments in foreign operationswhere the financial statements of the foreign operationare translated directly into the functional currency of theultimate parent.
(e) Property, plant and equipmentProperty, plant and equipment is stated at cost or deemed costless subsequent depreciation less any impairment loss. Historiccost includes expenditure that is directly attributable to theacquisition of the assets. Cost may also include transfers fromequity of any gains/losses on qualifying cash flow hedges offoreign currency purchases of property, plant and equipment.
Certain items of property, plant and equipment that had beenrevalued prior to the date of transition to IFRS (4 January 2004)are measured on the basis of deemed cost, being the revaluedamount depreciated to date of transition. Items of property, plantand equipment that were fair valued at date of transition are alsomeasured at deemed cost, being the fair value at date oftransition.
Depreciation is calculated on the straight-line method to write-offthe cost of each asset over their estimated useful life at thefollowing rates:
%Land NilBuildings 2.5 – 5Plant and equipment 4 – 33Motor vehicles 20 – 25
The assets residual values and useful lives are reviewed, andadjusted if appropriate, at each reporting date.
Assets held under finance leases are depreciated over theirexpected useful lives on the same basis as owned assets or,where shorter, the term of the relevant lease.
Property, plant and equipment is tested for impairment whenindicators arise. Where the carrying amount of an asset is greaterthan its estimated recoverable amount, it is written downimmediately to its recoverable amount.
Gains and losses on disposals are determined by comparingproceeds with carrying amount and are included in operatingprofit.
Repairs and maintenance expenditure is charged to the incomestatement during the financial period in which they are incurred.The cost of major renovations is included in the carrying amountof the asset when it is probable that future economic benefits inexcess of the originally assessed standard of performance of theexisting asset will flow to the Group. Major renovations aredepreciated over the remaining useful life of the related asset.
(f) Intangible assets(i) Goodwill
Goodwill represents the excess of the cost of an acquisitionover the fair value of the Group’s share of the netidentifiable assets of the acquired subsidiary or associate atthe date of acquisition. Goodwill on acquisitions ofsubsidiaries is included in intangible assets. Goodwillassociated with the acquisition of associates is includedwithin the investment in associates.

86 GLANBIA PLC
ANNUAL REPORT 2010
FINANCIAL STATEMENTS
Goodwill is carried at cost less accumulated impairmentlosses, if applicable. Goodwill is tested for impairment onan annual basis. Goodwill impairments are not reversed.
In accordance with IFRS 1 - First time adoption ofInternational Financial Reporting Standards, goodwill writtenoff to reserves prior to date of transition to IFRS remainswritten off. In respect of goodwill capitalised and amortisedat transition date, its carrying value at date of transition toIFRS remains unchanged. Goodwill is allocated to cashgenerating units for the purpose of impairment testing. Theallocation is made to those cash generating units or groupsof cash generating units that are expected to benefit from thebusiness combination in which the goodwill arose.
(ii) Research and development costsResearch expenditure is recognised as an expense asincurred. Costs incurred on development projects (relatingto the design and testing of new or improved products)are recognised as intangible assets when it is probable thatthe project will be a success, considering its commercialand technological feasibility, and costs can be measuredreliably. Development costs are amortised using the straightline method over their estimated useful lives, which isnormally 6 years.
(iii) Brands/know-how, customer relationships and otherintangiblesExpenditure to acquire brands/know-how, customerrelationships and other intangibles is capitalised andamortised using the straight-line method over its useful life,which is normally between 10 and 20 years. Indefinite lifeintangible assets are those for which there is no foreseeablelimit to their expected useful life. Indefinite life intangibleassets are carried at cost less accumulated impairment losses,if applicable, and are not amortised on an annual basis.
(iv) Computer softwareCosts incurred on the acquisition of computer software arecapitalised, as are costs directly associated with developingcomputer software programmes, if they meet the recognitioncriteria of IAS 38 – Intangible Assets. Computer softwarecosts recognised as assets are written off over their estimateduseful lives, which is normally between 5 and 10 years.
(g) Available for sale financial assetsAvailable for sale financial assets are non-derivatives that areeither designated in this category or not classified in any of theother categories. They are included in non-current assets unlessmanagement intends to dispose of the available for sale financialasset within 12 months of the reporting date. They are initiallyrecognised at fair value plus transaction costs and aresubsequently adjusted to fair value at each reporting date.Unrealised gains and losses arising from changes in the fair valueof the available for sale financial assets classified as available forsale are recognised in other comprehensive income. When suchavailable for sale assets are sold or impaired, the accumulated fairvalue adjustments are included in the income statement as gainsor losses from available for sale financial assets.
The fair values of quoted investments are based on current bidprices. If the market for a financial asset is not active the Groupestablishes fair value using valuation techniques. Where the rangeof reasonable fair values is significant and the probability ofvarious estimates cannot be reasonably assessed, the Groupmeasures the investment at cost.
Investments in subsidiaries held by the Company are carriedat cost.
Impairment losses recognised in the income statement on equityinstruments are not reversed through the income statement.
(h) LeasesLeases of assets where the Group has substantially all the risksand rewards of ownership are classified as finance leases. Adetermination is also made as to whether the substance of anarrangement could equate to a finance lease, consideringwhether fulfilment of the arrangement is dependant upon the useof a specific asset and the arrangement contains the right to usean asset. If the specified criteria are met, the arrangement isclassified as a finance lease. Finance leases are capitalised at theinception of the lease at the lower of the fair value of the leasedasset or the present value of the minimum lease payments. Eachlease payment is allocated between the liability and financecharges so as to achieve a constant rate on the finance balanceoutstanding. The corresponding rental obligation, net of financecharges is included in borrowings and split between current andnon-current, as appropriate. The interest element of the financecost is charged to the income statement over the lease period.The property, plant and equipment acquired under financeleases is depreciated over the shorter of the useful life of theasset or the lease term.
Leases where a significant portion of the risks and rewards ofownership are retained by the lessor are classified as operatingleases. Payments made under operating leases (net of anyincentives received from the lessor) are charged to the incomestatement on a straight-line basis over the period of the lease.
(i) InventoriesInventories are stated at the lower of cost or net realisable value.Cost is determined by the first-in, first-out (“FIFO”) method. Thecost of finished goods and work in progress comprises rawmaterials, direct labour, other direct costs and related productionoverheads (based on normal capacity). Net realisable value is theestimated selling price in the ordinary course of business, less theestimated costs of completion and the costs of selling expenses.Costs of inventories include the transfer from equity of anygains/losses on qualifying cash flow hedges which relate topurchases of raw materials.
(j) Trade and loan receivablesTrade receivables are recognised initially at fair value andsubsequently measured at amortised cost using the effectiveinterest method less provision for impairment.
Loan receivables are initially recognised at fair value andsubsequently measured at amortised cost using the effectiveinterest method, less provision for impairment. These areclassified as non-current assets, except for those maturing within12 months of the reporting date.
A provision for impairment of receivables is established whenthere is objective evidence that the Group will not be able tocollect all amounts due according to the original terms of thereceivables. If collectability appears unlikely according to theoriginal terms of the receivable the Group will determine theappropriate provision based on the available evidence at thattime. Significant financial difficulties of the trade/loan receivable,probability that the trade/loan receivable will enter bankruptcy orfinancial reorganisation, and default or delinquency in paymentsare considered indicators that the receivable is impaired. Theamount of the provision is the difference between the asset’scarrying value and the estimated future cash flows. The carryingamount of the asset is reduced through the use of a provisionaccount and the amount of the loss is recognised in the incomestatement within distribution costs. When a receivable isuncollectible, it is written off against the provision account forreceivables. Subsequent recoveries of amounts previously written

87 GLANBIA PLC
ANNUAL REPORT 2010
FINANCIAL STATEMENTS
off are credited against distribution costs in the income statement.Where risks associated with receivables are transferred out of theGroup under debt purchase agreements, such receivables arerecognised on the statement of financial position to the extent ofthe Group’s continued involvement and retained risk.
(k) Cash and cash equivalentsCash and cash equivalents comprise cash on hand, deposits heldon call with banks, other short-term highly liquid investments withoriginal maturities of 3 months or less and bank overdrafts. In thestatement of financial position, bank overdrafts, if applicable, areincluded in borrowings in current liabilities.
(l) Income taxesCurrent tax represents the expected tax payable or recoverableon the taxable profit for the year, taking into account adjustmentsrelating to prior years.
Deferred income tax is provided in full, using the liability method,on temporary differences arising between the tax bases of assetsand liabilities and their carrying amounts in the financialstatements. Tax rates enacted or substantively enacted by thereporting date are used to determine deferred income tax.
Deferred tax assets are recognised to the extent that it isprobable that future taxable profit will be available against whichthe temporary differences can be utilised.
Deferred income tax is provided on temporary differences arisingon investments in subsidiaries, associates and joint ventures,except where the timing of the reversal of the temporarydifference can be controlled and it is probable that the temporarydifference will not reverse in the foreseeable future. Deferredincome tax is not accounted for if it arises from initial recognitionof an asset or liability in a transaction other than a businesscombination that at the time of the transaction affects neitheraccounting nor taxable profit or loss.
(m) Employee benefits(i) Pension obligations
Group companies operate various pension schemes. Theschemes are generally funded through payments toinsurance companies or trustee-administered funds,determined by periodic actuarial calculations. The Group hasboth defined benefit and defined contribution plans.
The liability recognised in the statement of financial positionin respect of defined benefit pension plans is the presentvalue of the defined benefit obligation at the reporting dateless the fair value of the plan assets, together withadjustments for unrecognised past-service costs. The definedbenefit obligation is calculated annually by independentactuaries using the projected unit credit method. The presentvalue of the defined benefit obligation is determined bydiscounting the estimated future cash outflows using interestrates of high-quality corporate bonds that are denominatedin the currency in which the benefits will be paid, and thathave terms to maturity approximating to the terms of therelated pension liability. The fair value of plan assets aremeasured at their bid value.
Actuarial gains and losses arising from experienceadjustments and changes in actuarial assumptions arecharged or credited to other comprehensive income. Past-service costs, negative or positive, are recognisedimmediately in the income statement, unless the changes tothe pension plan are conditional on the employeesremaining in service for a specified period of time (thevesting period). In this case, the past-service costs areamortised on a straight line basis over the vesting period.
A curtailment arises when the Group is demonstrablycommitted to make a significant reduction in the number ofemployees covered by a plan or amends the terms of adefined benefit plan, so that a significant element of futureservice by current employees will no longer qualify forbenefits or will qualify for reduced benefits. A past servicecost, negative or positive, arises following a change in thepresent value of the defined benefit obligation for employeeservice in prior periods, resulting in the current period fromthe introduction of, or changes to, post employment benefits.A settlement arises where the Group is relieved ofresponsibility for a pension obligation and eliminatessignificant risk relating to the obligation and the assets usedto effect the settlement. Losses arising on settlement orcurtailment not allowed for in the actuarial assumptions aremeasured at the date on which the Group becomesdemonstrably committed to the transaction. Gains arising ona settlement or curtailment are measured at the date onwhich all parties whose consent is required are irrevocablycommitted to the transaction. Curtailment and settlementgains and losses are dealt with in the income statement.
Payments to defined contribution schemes are charged asan expense when they fall due.
(ii) Share based paymentsThe Group operates a number of equity settled share basedcompensation plans which include executive share optionschemes and share awards.
The charge to the income statement in respect of share-based payments is based on the fair value of the equityinstruments granted and is spread over the vesting period ofthe instrument. The fair value of the instruments iscalculated using the Trinomial Model. In accordance withthe transition arrangements set out in IFRS 2 – Share BasedPayments, this standard has been applied in respect ofshare options granted after 7 November 2002 which had notvested by the date of transition to IFRS (4 January 2004).
Non-market vesting conditions are included in assumptionsabout the number of options that are expected to vest. Ateach reporting date, the Group revises its estimates of thenumber of options that are expected to vest. It recognisesthe impact of the revision to original estimates, if any, in theincome statement, with a corresponding adjustment toother comprehensive income. The proceeds received net ofany directly attributable transaction costs are credited toshare capital (nominal value) and share premium when theoptions are exercised.
In accordance with IFRS 2 (Amendment), vesting conditionsare service conditions and performance conditions only. Anyother features do not impact the number of awardsexpected to vest or valuation thereof subsequent to grantdate. In addition, all cancellations, whether by the entity orother parties, receive similar accounting treatment.
(iii) Awards under the 2007 Long Term Incentive Plan and2008 Long Term Incentive PlanThe fair value of shares awarded under the 2007 LTIP and2008 LTIP schemes are determined using a Monte Carlosimulation technique. The LTIP contains inter-alia a TotalShareholder Return (TSR) based (and hence market-based)vesting condition, and accordingly, the fair value assigned tothe related equity instruments on initial application of IFRS 2is adjusted so as to reflect the anticipated likelihood at thegrant date of achieving the market-based vesting condition.

88 GLANBIA PLC
ANNUAL REPORT 2010
FINANCIAL STATEMENTS
(n) Government grantsGrants from the government are recognised at their fair valuewhere there is a reasonable assurance that the grant will bereceived and the Group will comply with all attached conditions.Government grants relating to costs are deferred and recognisedin the income statement over the period necessary to match themwith the costs they are intended to compensate. Governmentgrants relating to the purchase of property, plant and equipmentare included in non-current liabilities and are credited to theincome statement on a straight-line basis over the expected livesof the related assets. Research and development taxation creditsare recognised at their fair value in operating profit where there isreasonable assurance that the credit will be received.
(o) Revenue recognitionRevenue comprises the fair value of the consideration receivablefor the sale of goods and services to external customers net ofvalue-added tax, rebates and discounts. The Group recognisesrevenue when the amount of revenue can be reliably measured, itis probable that future economic benefit will flow to the entity andwhen specific criteria have been met for each of the Group’sactivities. Revenue from the sale of goods is recognised whensignificant risks and rewards of ownership of the goods aretransferred to the buyer, in the ordinary course of the Group’sbusiness which generally arises on delivery, or in accordance withspecific terms and conditions agreed with customers. The timingof recognition of services revenue equals the timing of when theservices are rendered. Interest income is recognised using theeffective interest method. Dividends are recognised when theright to receive payment is established. Revenue from the sale ofproperty is recognised when there is an unconditional andirrevocable contract for sale.
(p) Impairment of assets(i) Financial assets
The Group assesses at each reporting date whether there isobjective evidence that a financial asset or a group offinancial assets is impaired. In the case of equity securitiesclassified as available for sale, a significant or prolongeddecline in the fair value of the security below its cost isconsidered an indicator that the securities are impaired. If anysuch evidence exists for available for sale financial assets, thecumulative loss is measured as the difference between theacquisition cost and the current fair value, less anyimpairment loss on that financial asset previously recognisedin the income statement is removed from equity andrecognised in the income statement. Impairment lossesrecognised in the income statement on equity instrumentsare not reversed through the income statement. Impairmenttesting of trade receivables is described in (j) above.
(ii) Non-financial assetsAssets that have an indefinite useful life are not subject toamortisation and are tested annually for impairment. Assetswhich have a finite useful life are subject to amortisation andreviewed for impairment when events or changes incircumstance indicate that the carrying value may not berecoverable. Goodwill is reviewed at least annually forimpairment. An impairment loss is recognised to the extentthat the carrying value of the assets exceed their recoverableamount. The recoverable amount is the higher of the assetsfair value less costs to sell and its value in use. For thepurposes of assessing impairment, assets are grouped at thelowest levels for which there are separately identifiable cashflows (cash generating units).
(q) Share capitalOrdinary shares are classified as equity. Incremental costs directlyattributable to the issue of new shares or options are shown inequity as a deduction from the proceeds.
Own sharesThe cost of own shares, held by an Employee Share Trust inconnection with the Company’s Sharesave Scheme, is deductedfrom equity. Ordinary shares purchased under the terms of the2007 LTIP and 2008 LTIP schemes are accounted for as ownshares and recorded as a deduction from equity.
(r) DividendsDividends to the Company’s shareholders are recognised asa liability of the Company when approved by the Company’sshareholders.
(s) Derivative financial instrumentsThe activities of the Group expose it primarily to the financialrisks of changes in foreign currency exchange rates and interestrates. The Group uses derivative financial instruments such asforeign exchange contracts, interest rate swap contracts andforward rate agreements to hedge these exposures.
The Group accounts for financial instruments under IAS 32(Amendment), ‘Financial Instruments: Presentation’, IAS 39(Amendment), ‘Financial Instruments: Recognition andMeasurement’ and IFRS 7 – Financial Instruments Disclosures.Derivatives are initially recognised at fair value on the date aderivative contract is entered into and are subsequentlyremeasured at their fair value at the reporting date.
The fair value of forward foreign currency contracts is estimatedby discounting the difference between the contractual forwardprice and the current forward price for the residual maturity ofthe contract using the European Central Bank interest rate at themeasurement date.
The fair value of interest rate swaps is based on discountingestimated future cash flows based on the terms and maturityof each contract and using market interest rates for a similarinstrument at the measurement date.
The fair value of commodity contracts is estimated bydiscounting the difference between the contracted futures priceand the current forward price for the residual maturity of thecontracts using the European Central Bank and US FederalReserve interest rates.
The method of recognising the resulting gain or loss depends onwhether the derivative is designated as a hedging instrument,and if so, the nature of the item being hedged. The Groupdesignates certain derivatives as either: (1) hedges of the fairvalue of recognised assets or liabilities or a firm commitment (fairvalue hedge); (2) hedges of a particular risk associated with arecognised asset or liability or a highly probable forecasttransaction (cash flow hedge).
The Group documents at the inception of the transaction therelationship between hedging instruments and hedged items,as well as its risk management objective and strategy forundertaking various hedge transactions. The Group alsodocuments its assessment, both at hedge inception and on anongoing basis, of whether the derivatives that are used inhedging transactions are highly effective in offsetting changesin fair values or cash flows of hedged items.
The fair values of various derivative instruments used for hedgingpurposes are disclosed in note 32. Movements on the fair valuereserve are shown in note 22. The full fair value of a hedgingderivative is classified as a non-current asset or liability if theremaining maturity of the hedged item is more than 12 months,

89 GLANBIA PLC
ANNUAL REPORT 2010
FINANCIAL STATEMENTS
and as a current asset or liability, if the remaining maturity of thehedged item is less than 12 months. Trading derivatives areclassified as a current asset or liability.
(i) Fair value hedgeChanges in the fair value of derivatives that are designated
and qualify as fair value hedges are recorded in the income statement, together with any changes in the fair value of the hedged asset or liability that are attributable to the hedged risk. If the hedge no longer meets the criteria for hedge accounting, the adjustment to the carrying amount of a hedged item for which the effective interest method is used is amortised to the income statement.
(ii) Cash flow hedgeThe effective portion of changes in the fair value ofderivatives that are designated and qualify as cash flowhedges are recognised in other comprehensive income. Thegain or loss relating to the ineffective portion is recognisedimmediately in the income statement.
Amounts accumulated in equity are recycled in the incomestatement in the periods when the hedged item affects profitor loss (for instance when the forecast sale that is hedgedtakes place). The recycled gain or loss relating to the effectiveportion of interest rate swaps hedging variable interest rateson borrowings is recognised in the income statement within‘finance costs’. The recycled gain or loss relating to theeffective portion of forward foreign exchange contractshedging export sales is recognised in the income statementwithin revenue. However, when the forecast transaction thatis hedged results in the recognition of a non-financial asset(for example, inventory) or a non-financial liability, the gainsand losses previously deferred in equity are transferred fromequity and included in the initial measurement of the cost ofthe asset or liability.
When a hedging instrument expires or is sold, or when ahedge no longer meets the criteria for hedge accounting, anycumulative gain or loss existing in equity at that time remainsin equity and is recognised when the forecast transaction isultimately recognised in the income statement. When aforecast transaction is no longer expected to occur, thecumulative gain or loss that was reported in othercomprehensive income is immediately transferred to theincome statement.
(iii) Derivatives that do not qualify for hedge accountingCertain derivative instruments do not qualify for hedgeaccounting. Changes in the fair value of any derivativeinstruments that do not qualify for hedge accounting arerecognised immediately in the income statement.
(iv) Financial guarantee contractsFinancial guarantee contracts are issued to bankinginstitutions by the entity Glanbia plc on behalf of certain of itssubsidiaries. These subsidiaries engage in ongoing financingarrangements with these banking institutions. Under theterms of IAS 39 – Financial Instruments: Recognition andMeasurement,financial guarantee contracts are required tobe recognised at fair value at inception and subsequentlymeasured as a provision under IAS 37 – Provisions,Contingent Liabilities and Contingent Assets on the companystatement of financial position.
Guarantees provided by Glanbia plc, the entity, over thepayment of employer contributions in respect of the UKdefined benefit pension schemes are treated as insurancecontracts.
(t) Earnings per shareEarnings per share represents the profit in cents attributable toowners of the parent, divided by the weighted average numberof ordinary shares in issue in respect of the period.
Adjusted earnings per share is calculated on the net profitattributable to the owners of the Parent, pre exceptional itemsand intangible asset amortisation (net of related tax). Dilutedearnings per share is calculated by adjusting the weightedaverage number of ordinary shares outstanding to assumeconversion of all dilutive potential ordinary shares.
(u) Borrowing costsIn accordance with IAS 23 (Revised), ‘Borrowing Costs’, borrowingcosts directly attributable to the acquisition, construction orproduction of a qualifying asset are capitalised. Other borrowingcosts are expensed.
(v) BorrowingsBorrowings are recognised initially at fair value, net of transactioncosts incurred. Borrowings are subsequently stated at amortisedcost; any difference between the proceeds (net of transactioncosts) and the redemption value is recognised in the incomestatement over the period of the borrowings using the effectiveinterest method.
Preference shares, which are mandatorily redeemable on aspecific date, are classified as borrowings. The dividends onthese preference shares are recognised in the income statementas a finance cost. Borrowings are classified as current liabilitiesunless the Group has an unconditional right to defer settlementof the liability for at least 12 months after the reporting date.
(w) ProvisionsProvisions are recognised when the Group has a constructive orlegal obligation as a result of past events, it is more likely thannot that an outflow of resources will be required to settle theobligation and the amount has been reliably estimated.Provisions are measured at the present value of the expendituresexpected to be required to settle the obligation using a pre-taxrate that reflects current market assessments of the time value ofmoney and the risks specific to the obligation. The increase inprovision due to passage of time is recognised as an interestexpense.
(x) Termination benefitsTermination benefits are payable when employment isterminated by the Group before the normal retirement date, orwhenever an employee accepts voluntary redundancy inexchange for these benefits. The Group recognises terminationbenefits when it is demonstrably committed to either terminatingthe employment of current employees according to a detailedformal plan without possibility of withdrawal; or providingtermination benefits as a result of an offer made to encouragevoluntary redundancy.
(y) Exceptional itemsThe Group has adopted an income statement format, whichseeks to highlight significant items within the Group results forthe year. Such items may include restructuring, impairment ofassets, profit or loss on disposal or termination of operations,litigation settlements, legislative changes and profit or loss ondisposal of investments. Judgement is used by the Group inassessing the particular items, which by virtue of their scale andnature, should be disclosed in the income statement and notesas exceptional items.
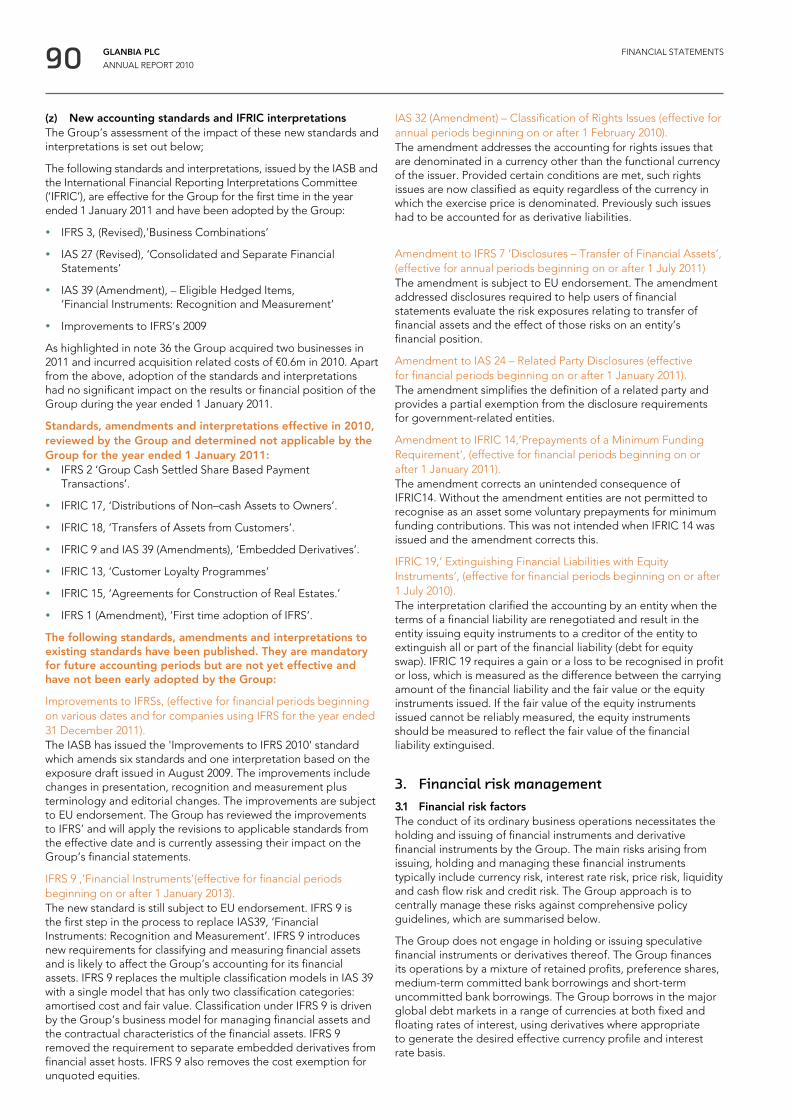
90 GLANBIA PLC
ANNUAL REPORT 2010
FINANCIAL STATEMENTS
(z) New accounting standards and IFRIC interpretationsThe Group’s assessment of the impact of these new standards andinterpretations is set out below;
The following standards and interpretations, issued by the IASB andthe International Financial Reporting Interpretations Committee(‘IFRIC’), are effective for the Group for the first time in the yearended 1 January 2011 and have been adopted by the Group:
� IFRS 3, (Revised),’Business Combinations’
� IAS 27 (Revised), ‘Consolidated and Separate FinancialStatements’
� IAS 39 (Amendment), – Eligible Hedged Items,’Financial Instruments: Recognition and Measurement’
� Improvements to IFRS’s 2009
As highlighted in note 36 the Group acquired two businesses in2011 and incurred acquisition related costs of €0.6m in 2010. Apartfrom the above, adoption of the standards and interpretationshad no significant impact on the results or financial position of theGroup during the year ended 1 January 2011.
Standards, amendments and interpretations effective in 2010,reviewed by the Group and determined not applicable by theGroup for the year ended 1 January 2011:� IFRS 2 ‘Group Cash Settled Share Based Payment
Transactions’.
� IFRIC 17, ‘Distributions of Non–cash Assets to Owners’.
� IFRIC 18, ‘Transfers of Assets from Customers’.
� IFRIC 9 and IAS 39 (Amendments), ‘Embedded Derivatives’.
� IFRIC 13, ‘Customer Loyalty Programmes’
� IFRIC 15, ‘Agreements for Construction of Real Estates.’
� IFRS 1 (Amendment), ‘First time adoption of IFRS’.
The following standards, amendments and interpretations toexisting standards have been published. They are mandatoryfor future accounting periods but are not yet effective andhave not been early adopted by the Group:
Improvements to IFRSs, (effective for financial periods beginningon various dates and for companies using IFRS for the year ended31 December 2011).The IASB has issued the 'Improvements to IFRS 2010' standardwhich amends six standards and one interpretation based on theexposure draft issued in August 2009. The improvements includechanges in presentation, recognition and measurement plusterminology and editorial changes. The improvements are subjectto EU endorsement. The Group has reviewed the improvementsto IFRS’ and will apply the revisions to applicable standards fromthe effective date and is currently assessing their impact on theGroup’s financial statements.
IFRS 9 ,’Financial Instruments’(effective for financial periodsbeginning on or after 1 January 2013).The new standard is still subject to EU endorsement. IFRS 9 isthe first step in the process to replace IAS39, ‘FinancialInstruments: Recognition and Measurement’. IFRS 9 introducesnew requirements for classifying and measuring financial assetsand is likely to affect the Group’s accounting for its financialassets. IFRS 9 replaces the multiple classification models in IAS 39with a single model that has only two classification categories:amortised cost and fair value. Classification under IFRS 9 is drivenby the Group’s business model for managing financial assets andthe contractual characteristics of the financial assets. IFRS 9removed the requirement to separate embedded derivatives fromfinancial asset hosts. IFRS 9 also removes the cost exemption forunquoted equities.
IAS 32 (Amendment) – Classification of Rights Issues (effective forannual periods beginning on or after 1 February 2010).The amendment addresses the accounting for rights issues thatare denominated in a currency other than the functional currencyof the issuer. Provided certain conditions are met, such rightsissues are now classified as equity regardless of the currency inwhich the exercise price is denominated. Previously such issueshad to be accounted for as derivative liabilities.
Amendment to IFRS 7 ‘Disclosures – Transfer of Financial Assets’,(effective for annual periods beginning on or after 1 July 2011)The amendment is subject to EU endorsement. The amendmentaddressed disclosures required to help users of financialstatements evaluate the risk exposures relating to transfer offinancial assets and the effect of those risks on an entity’sfinancial position.
Amendment to IAS 24 – Related Party Disclosures (effectivefor financial periods beginning on or after 1 January 2011).The amendment simplifies the definition of a related party andprovides a partial exemption from the disclosure requirementsfor government-related entities.
Amendment to IFRIC 14,’Prepayments of a Minimum FundingRequirement’, (effective for financial periods beginning on orafter 1 January 2011).The amendment corrects an unintended consequence ofIFRIC14. Without the amendment entities are not permitted torecognise as an asset some voluntary prepayments for minimumfunding contributions. This was not intended when IFRIC 14 wasissued and the amendment corrects this.
IFRIC 19,’ Extinguishing Financial Liabilities with EquityInstruments’, (effective for financial periods beginning on or after1 July 2010).The interpretation clarified the accounting by an entity when theterms of a financial liability are renegotiated and result in theentity issuing equity instruments to a creditor of the entity toextinguish all or part of the financial liability (debt for equityswap). IFRIC 19 requires a gain or a loss to be recognised in profitor loss, which is measured as the difference between the carryingamount of the financial liability and the fair value or the equityinstruments issued. If the fair value of the equity instrumentsissued cannot be reliably measured, the equity instrumentsshould be measured to reflect the fair value of the financialliability extinguised.
3. Financial risk management3.1 Financial risk factorsThe conduct of its ordinary business operations necessitates theholding and issuing of financial instruments and derivativefinancial instruments by the Group. The main risks arising fromissuing, holding and managing these financial instrumentstypically include currency risk, interest rate risk, price risk, liquidityand cash flow risk and credit risk. The Group approach is tocentrally manage these risks against comprehensive policyguidelines, which are summarised below.
The Group does not engage in holding or issuing speculativefinancial instruments or derivatives thereof. The Group financesits operations by a mixture of retained profits, preference shares,medium-term committed bank borrowings and short-termuncommitted bank borrowings. The Group borrows in the majorglobal debt markets in a range of currencies at both fixed andfloating rates of interest, using derivatives where appropriateto generate the desired effective currency profile and interestrate basis.

91 GLANBIA PLC
ANNUAL REPORT 2010
FINANCIAL STATEMENTS
Risk management, other than credit risk management, is carried outby a central treasury department (Group Treasury) under policiesapproved by the Board of Directors. Group Treasury identifies,evaluates and hedges financial risks in close co-operation with theGroup’s operating units.
The Board provides written principles for overall risk management,as well as written policies covering specific areas, such as liquidityrisk, foreign exchange risk, interest rate risk, credit risk, use ofderivative financial instruments and non-derivative financialinstruments, and investment of excess liquidity.
Market risk(a) Currency riskAlthough the Group is based in Ireland and has extensive eurooperations, it has significant investment in overseas operationsprimarily in the USA. As a result movements in US dollar/euroexchange rate can significantly affect the Group’s euro statementof financial position and income statement. The Group seeks tomatch, to a certain extent, the currency of its borrowings, with thatof its assets. The Group also has transactional currency exposuresthat arise from sales or purchases by an operating unit incurrencies other than the operating unit’s functional currency.Management has set up a policy to require Group companies tomanage their foreign exchange risk against their functionalcurrency. The Group companies are required to hedge foreignexchange risk exposure through Group Treasury.
Group Treasury reviews exposure reports on a regular basis.To manage foreign exchange risk arising from future commercialtransactions, recognised assets and liabilities and profits earned inforeign currency entities, the Group use forward contracts orcurrency options, administered by Group Treasury. Foreignexchange risk arises when future commercial transactions orrecognised assets or liabilities are denominated in a currency thatis not the entity’s functional currency.
Group Treasury’s risk management practice is to hedge upto 100% of anticipated cash flows (mainly export sales andpurchase of inventory) in each major foreign currency to which theGroup is exposed for the following financial year. The Group doesnot take out cover unless the prospective sale or purchase ishighly probable.
The Group has certain investments in foreign operations, whosenet assets are exposed to foreign currency translation risk.Currency exposure arising from the net assets of the Group’sforeign operations is managed primarily through borrowingsdenominated in the relevant foreign currencies.
At 1 January 2011 and 2 January 2010, if the euro had weakened/strengthened by 5% against the US dollar with all other variablesheld constant, post-tax profit for the year would not have beenmaterially impacted as a result of foreign exchange gains/losseson translation of US dollar denominated non-hedged tradereceivables, and cash and cash equivalents.
A weakening/strengthening of the euro against the US dollar by 5%as at 1 January 2011 would have resulted in a currency translationgain/loss of approximately €19.7 million (2009: €16.1 million), whichwould be recognised directly in other comprehensive income.
At 1 January 2011 and 2 January 2010, if the euro hadweakened/strengthened by 5% against the UK pound with allother variables held constant, post-tax profit for the year wouldnot have been materially impacted as a result of foreign exchangegains/losses on translation of UK pound-denominated non-hedged trade receivables, and cash and cash equivalents.
A weakening/strengthening of the euro against the UK pound by5% as at 1 January 2011 would have resulted in a currency
translation gain/loss of approximately €1.0 million (2009: €1.1million), which would be recognised directly in othercomprehensive income.
(b) Interest rate riskThe Group’s objective in relation to interest rate management isto minimise the impact of interest rate volatility on interest costsin order to protect reported profitability. This is achieved bydetermining a long-term strategy against a number of policyguidelines, which focus on (a) the amount of floating rateindebtedness anticipated over such a period and (b) theconsequent sensitivity of interest costs to interest ratemovements on this indebtedness and the resultant impact onreported profitability. The Group borrows at both fixed andfloating rates of interest and uses interest rate swaps to managethe Group’s exposure to interest rate fluctuations.
Borrowings issued at floating rates expose the Group to cashflow interest rate risk. Borrowings issued at fixed rates expose theGroup to fair value interest rate risk. Group policy is to maintainno more than one third of its projected debt exposure on afloating rate basis over any succeeding 12 month period.
The Group, on a continuous basis, maintains a level of fixed ratecover dependent on prevailing fixed market rates, projecteddebt and market informed interest rate outlook.
Based on the Group’s unhedged variable rate debt in allcurrencies throughout 2010, a 1% increase in prevailing marketinterest rates would have resulted in a €1.8 million loss (2009: €1.3million loss), with no impact on other comprehensive income.
The Group manages its cash flow interest rate risk by usingfloating to fixed interest rate swaps. Such interest rate swapshave the economic effect of converting borrowings from floatingrates to fixed rates. Under these interest rate swaps, the Groupagrees with other parties to exchange at specified intervals,the difference between fixed interest rate amounts and floatingrate interest amounts calculated by reference to the agreednotional amounts.
Occasionally the Group enters into fixed to floating interest rateswaps to hedge the fair value interest rate risk arising where ithas borrowed at fixed rates.
(c) Price riskThe Group is exposed to equity securities price risk becauseof investments held by the Group in listed and unlisted securitiesand classified on the consolidated statement of financial positionas available for sale financial assets. Certain securities are carriedat cost and therefore are not exposed to price risk.
To manage its price risk arising from investments in listed equitysecurities, the Group does not maintain a significant balance withany one entity.
Diversification of the portfolio must be done in accordance withthe limits set by the Group. The impact of a 5% increase ordecrease in equity indexes across the eurozone countries wouldnot have any significant impact on Group operating profit.
To manage its exposure to certain commodity markets theGroup enters commodity futures contracts.
For further details regarding the Group’s price risk see note 32 –derivative financial instruments.

92 GLANBIA PLC
ANNUAL REPORT 2010
FINANCIAL STATEMENTS
(d) Liquidity and cash flow riskThe Group’s objective is to maintain a balance between thecontinuity of funding and flexibility through the use of borrowingswith a range of maturities. In order to preserve continuity offunding, the Group’s policy is that, at a minimum, committedfacilities should be available at all times to meet the full extentof its anticipated finance requirements, arising in the ordinarycourse of business, during the succeeding 12 month period.This means that at any time the lenders providing facilities in
respect of this finance requirement are required to give at least12 months notice of their intention to seek repayment of suchfacilities. At the year end, the Group had multi-currencycommitted term facilities of €734.2 million (2009: €729.1 million)of which €101.2 million (2009: €138.8 million) was undrawn.The weighted average maturity of these facilities was 2.2 years(2009: 3.2 years).
For further details regarding the Group’s borrowing facilities seenote 26 – borrowings.
The table below analyses the Group’s financial liabilities which will be settled on a net basis into relevant maturity groupings based onthe remaining period from the reporting date to the contractual maturity date. The amounts disclosed in the table are the contractualundiscounted cash flows. Balances due within one year equal their carrying value balances as the impact of discounting is notsignificant.
Financial liabilities
At 1 January 2011
Less than1 year€'000
Between 1and 2 years
€'000
Between 2and 5 years
€'000Total€'000
Borrowings 972 205,853 426,423 633,248
Future finance costs 25,307 20,107 10,328 55,742
Derivative financial instruments 6,487 2,221 1,155 9,863
Trade and other payables* 186,612 – – 186,612
219,378 228,181 437,906 885,465Less future finance costs (25,307) (20,107) (10,328) (55,742)
194,071 208,074 427,578 829,723
At 2 January 2010
Less than1 year€'000
Between 1and 2 years
€'000
Between 2and 5 years
€'000Total€'000
Borrowings 945 982 589,237 591,164
Future finance costs 29,375 29,376 35,094 93,845
Derivative financial instruments 10,615 3,297 2,544 16,456
Trade and other payables* 176,055 – – 176,055
216,990 33,655 626,875 877,520Less future finance costs (29,375) (29,376) (35,094) (93,845)
187,615 4,279 591,781 783,675
* Excludes accrued expenses and social security costs.
The Company has cash at bank of €8.2 million at year end (2009: €9.6 million overdraft). The contractual undiscounted cash flows equalthe balance as at 1 January 2011.

93 GLANBIA PLC
ANNUAL REPORT 2010
FINANCIAL STATEMENTS
Foreign exchange contracts
Less than1 year€'000
Between 1and 2 years
€'000
Between 2and 5 years
€'000Total€'000
At 1 January 2011
Foreign exchange contracts – cash flow hedges
Outflow (10) – – (10)
Less than1 year€'000
Between 1and 2 years
€'000
Between 2and 5 years
€'000Total€'000
At 2 January 2010
Foreign exchange contracts – cash flow hedges
Outflow (956) – – (956)
The table below analyses the Group’s foreign exchange contracts which will be settled on a gross basis into relevant maturity groupingsbased on the remaining period from the reporting date to the contractual maturity date. The amounts disclosed in the table are thecontractual undiscounted cash flows.
(e) Credit riskCredit risk is managed on a Group basis. Credit risk arises fromcash and cash equivalents, derivative financial instruments anddeposits with banks and financial institutions, as well as creditexposures to customers, including outstanding receivables andcommitted transactions. For banks and financial institutions, onlyindependently rated parties with a minimum credit rating of A-are accepted or whose obligations are covered by equivalentlyrated sovereign guarantee. The minimum credit rating applicableto a counterparty used for derivative financial instruments is A-.
The Group’s credit risk management policy in relation to tradereceivables involves periodically assessing the financial reliabilityof customers, taking into account their financial position, pastexperience and other factors. The utilisation of credit limits isregularly monitored and where appropriate, credit risk is coveredby credit insurance and by holding appropriate security or liens.
The Group enters into debt purchase agreements with certainfinancial institutions for part of its trade receivable balances.Where this is done the credit risk is transferred but in some casesthe late payment risk is retained.
For further details regarding the Group’s credit risk see note 19 –trade and other receivables.
3.2 Capital risk managementThe Group’s objectives when managing capital are to safeguardthe Group’s ability to continue as a going concern in order toprovide returns for shareholders and benefits for otherstakeholders and to maintain an optimal capital structure toreduce the cost of capital. Total capital is calculated basedon equity as shown in the statement of financial position andnet debt.
In order to maintain or adjust the capital structure, the Group mayadjust the amount of dividends paid to shareholders, returncapital to shareholders, issue new shares or sell assets to increaseor reduce debt or buy back shares.
The Group monitors debt capital on the basis of interest coverand debt to EBITDA ratios. At 1 January 2011, the Group’sdebt/adjusted EBITDA ratio was 2.1 times (2009: 2.6 times), whichis deemed by management to be prudent and in line withindustry norms. Adjusted EBITDA for the purpose of financingratios is Group EBITDA plus dividends received from JointVentures & Associates.
3.3 Fair value estimationThe fair value of financial instruments traded in active markets(such as available for sale securities) is based on quoted marketprices at the reporting date. The quoted market price used forfinancial assets held by the Group is the current bid price.
The fair value of financial instruments that are not traded in anactive market (for example, over the counter derivatives) isdetermined by using valuation techniques. The Group uses avariety of methods and makes assumptions that are based onmarket conditions existing at each reporting date. Quoted marketprices or dealer quotes for similar instruments are used for long-term debt. Other techniques, such as estimated discounted cashflows, are used to determine fair value for the remaining financialinstruments. The fair value of interest rate swaps is calculated asthe present value of the estimated future cash flows. The fairvalue of forward foreign exchange contracts is determined usingquoted forward exchange rates at the reporting date.
The carrying value less impairment provision of trade receivablesand payables are assumed to approximate their fair values due tothe short-term nature of trade receivables and trade payables.The fair value of financial liabilities for disclosure purposes isestimated by discounting the future contractual cash flows atcurrent market interest rates that are available to the Group forsimilar financial instruments.
In accordance with IFRS 7 – Financial Instruments: Disclosures, theGroup has disclosed the fair value of instruments by the followingfair value measurement hierarchy:
� quoted prices (unadjusted) in active markets for identicalassets and liabilities (level 1)
� inputs, other than quoted prices included in level 1, that areobservable for the asset and liability, either directly (that is, asprices) or indirectly (that is, derived from prices) (level 2)
� inputs for the asset or liability that are not based onobservable market data (that is, unobservable inputs) (level 3)
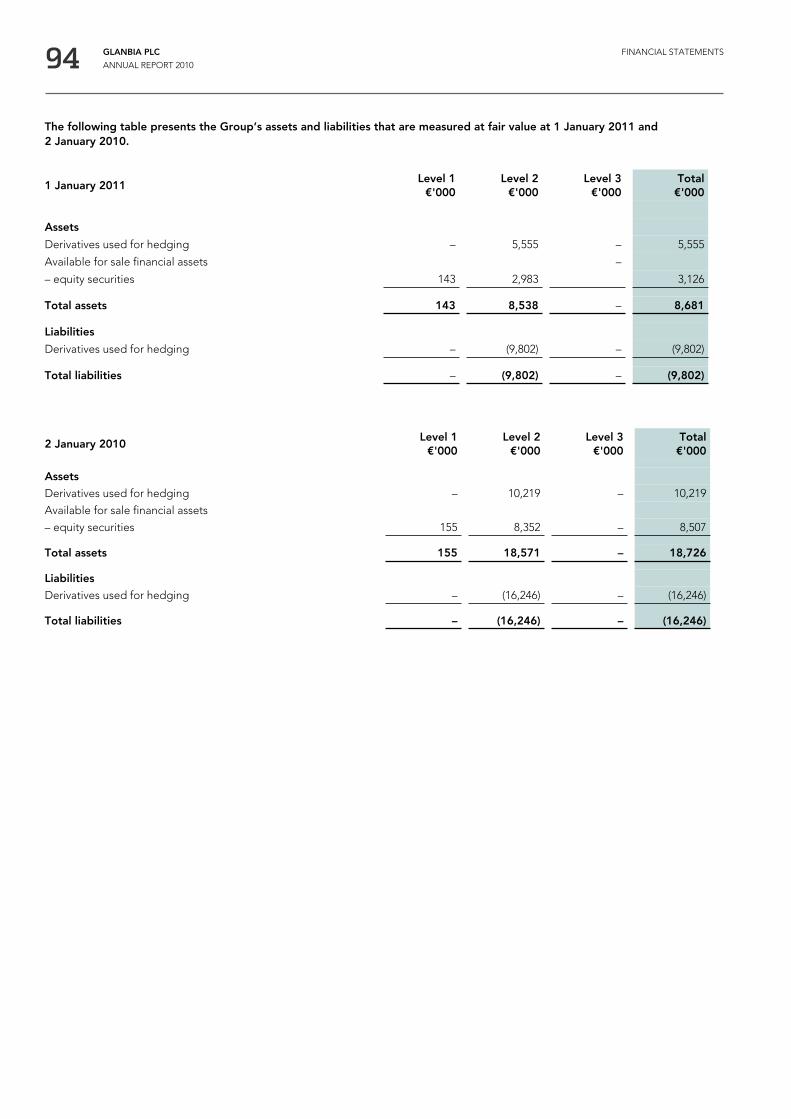
94 GLANBIA PLC
ANNUAL REPORT 2010
FINANCIAL STATEMENTS
The following table presents the Group’s assets and liabilities that are measured at fair value at 1 January 2011 and2 January 2010.
1 January 2011Level 1
€'000Level 2
€'000Level 3
€'000Total€'000
Assets
Derivatives used for hedging – 5,555 – 5,555
Available for sale financial assets –
– equity securities 143 2,983 3,126
Total assets 143 8,538 – 8,681
Liabilities
Derivatives used for hedging – (9,802) – (9,802)
Total liabilities – (9,802) – (9,802)
2 January 2010Level 1
€'000Level 2
€'000Level 3
€'000Total€'000
Assets
Derivatives used for hedging – 10,219 – 10,219
Available for sale financial assets
– equity securities 155 8,352 – 8,507
Total assets 155 18,571 – 18,726
Liabilities
Derivatives used for hedging – (16,246) – (16,246)
Total liabilities – (16,246) – (16,246)

95 GLANBIA PLC
ANNUAL REPORT 2010
FINANCIAL STATEMENTS
4. Critical accounting estimates and judgementsEstimates and judgements are continually evaluated and arebased on historical experience and other factors, includingexpectations of future events that are believed to be reasonableunder the circumstances.
The Group makes estimates and assumptions concerning thefuture. The resulting accounting estimates will, by definition,seldom equal the related actual results. The estimates andassumptions that could have a significant risk of causing a materialadjustment to the carrying amounts of assets and liabilities withinthe next financial year are discussed below.
(a) Impairment reviews of goodwill and indefinite life intangiblesThe Group tests annually whether goodwill has suffered anyimpairment, in accordance with the accounting policy stated innote 2 (f). The recoverable amounts of cash generating units havebeen determined based on value in use calculations. Thesecalculations require the use of estimates.
The intangible assets of Glanbia Nutritionals (NA), Inc., OptimumNutrition, Inc. and Glanbia Nutritionals Deutschland GmbH,including goodwill arising on acquisition of €229.1 million (2009:€212.3 million), were tested for impairment using projected cashflows over a 10 year period. A reduction in projected EBITDA of10% or an increase in the discount factor used by 1% would notresult in an impairment of the assets. A rate of zero percent hasbeen used to estimate cash flow growth between three and tenyears. Indefinite life intangible assets are those for which there isno foreseeable limit to their expected useful life. The classificationof intangible assets as indefinite is reviewed annually.
(b) Income taxesThe Group is subject to income tax in numerous jurisdictions.Significant judgement is required in determining the worldwideprovision for income taxes. There are many transactions andcalculations for which the ultimate tax determination is uncertainduring the ordinary course of business. The Group recognisesliabilities for anticipated tax audit issues based on estimates ofwhether additional taxes will be due. Where the final tax outcomeof these matters is different from the amounts that were initiallyrecorded, such differences will impact the income tax and deferredtax provisions in the period in which such determination is made.
Deferred tax assets are recognised to the extent that it isprobable that future taxable profit will be available against whichthe unused tax losses and unused tax credits can be utilised. TheGroup estimates the most probable amount of future taxableprofits, using assumptions consistent with those employed inimpairment calculations, and taking into consideration applicabletax legislation in the relevant jurisdiction. These calculations alsorequire the use of estimates.
An increase in the Group’s effective tax rate by 1% would reduceprofit after tax by €1.1 million (2009: €1.3 million).
(c) Post-employment benefitsThe Group operates a number of post employment definedbenefit plans. The rates of contributions payable, the pension costand the Group’s total obligation in respect of defined benefitplans is calculated and determined by independent qualifiedactuaries and updated at least annually. The Group has planassets totalling €389.3 million (2009: €349.2 million) and planliabilities of €437.9 million (2009: €435.0 million) giving a netpension deficit of €48.6 million (2009: €85.8 million) for the Group.The size of the obligation and cost of the benefits are sensitive toactuarial assumptions. These include demographic assumptionscovering mortality and longevity, and economic assumptionscovering price inflation, benefit and salary increases together withthe discount rate used. The Group has reviewed the impact of achange in the discount rate used and concluded that based on
the pension deficit at 1 January 2011, an increase in the discountrates applied of 10 basis points across the various defined benefitplans, would have the impact of decreasing the pension deficitfor the Group by €6.7 million (2009: €5.2 million).
The curtailment gains and negative past service costs have beencalculated by management using certain estimates andjudgements, primary among these being the inflation rate,investment strategy approach and discount rate assumed, thefinal determination of which may be different as actual resultsbecome certain.
(d) Estimating lives for depreciation of property, plant and equipment and intangible assetsLong-lived assets comprising primarily property, plant andequipment and intangible assets, represent a significant portionof total assets. The annual depreciation and amortisation chargedepends primarily on the estimated lives of each type of assetand, in certain circumstances, estimates of fair values and residualvalues. The Directors regularly review these useful lives andchange them as necessary to reflect current thinking onremaining lives in light of technological change, pattern ofconsumption, the physical condition and expected economicutilisation of the asset. Changes in the useful lives can have asignificant impact on the depreciation and amortisation chargefor the period. Details of the useful lives are included in theaccounting policies 2 (e) and 2 (f) above. The impact of anychange could vary significantly depending on the individualchanges in assets and the classes of assets impacted. The Grouphas reviewed the impact of a change in useful lives on land andbuildings and a one year reduction in useful lives would have a€0.2 million (2009: €0.2 million) reduction impact on operatingprofit. The Group has also reviewed the impact of a change inuseful lives in plant and equipment and a one year reduction inuseful lives would have a €2.2 million (2009: €2.1 million)reduction impact on operating profit.
The Group has reviewed the impact of a change in theamortisation period of customer relationships and a one yearreduction in the write off period would result in a €0.7 million(2009: €0.7 million) reduction in operating profit.
The Group has reviewed the impact on indefinite life intangibleassets by assigning a finite life to these assets and a 20 yearuseful life estimate would have a €4.5 million (2009: €4.4 million)reduction impact on operating profit.
(e) Fair value of derivatives and other financial instrumentsThe fair value of financial instruments that are not traded in anactive market (for example, over-the-counter derivatives) isdetermined by using valuation techniques. The Group uses itsjudgement to select a variety of methods and make assumptionsthat are mainly based on market conditions existing at eachreporting date. The Group has used discounted cash flowanalysis for various available for sale financial assets that are nottraded in active markets. The carrying amount of available forsale financial assets would not be materially different were thediscounted rate used in the discounted cash flow analysis todiffer by 10% from management’s estimates.
(f) ProvisionsProvisions are recognised when the Group has a constructive orlegal obligation as a result of past events; it is more likely than notthat an outflow of resources will be required to settle theobligation; and the amount has been reliably estimated. Theamount recognised as a provision is the best estimate of theamount required to settle the present obligation at the reportingdate, taking account of the risks and uncertainties surrounding theobligation and actual results may also differ from these estimates.

96 GLANBIA PLC
ANNUAL REPORT 2010
FINANCIAL STATEMENTS
5. Segment informationIn accordance with IFRS 8 the Group has four segments as follows: US Cheese & Global Nutritionals, Dairy Ireland, Joint Ventures &Associates and Other Business. These segments align with the Group’s internal financial reporting system and the way in which theChief Operating Decision Maker assesses performance and allocates the Group’s resources. A segment manager is responsible foreach segment and is directly accountable for the performance of that segment to the Glanbia Operating Executive Committee whichacts as the Chief Operating Decision Maker for the Group.
Each segment derives their revenues as follows: US Cheese & Global Nutritionals earns its revenue from the manufacture and sale ofcheese, whey protein and other nutritional solutions; Dairy Ireland incorporates the manufacture and sale of a range of dairy productsand the sale of feed, fertiliser and other farm inputs; Joint Ventures & Associates revenue arises due to the manufacture and sale ofcheese, whey proteins and dairy consumer products. The Other Business segment refers to all other businesses which comprise theProperty business unit and a small dairy processing operation in Mexico which was disposed of in September 2010. Each segment isreviewed in its totality by the Chief Operating Decision Maker.
The Glanbia Operating Executive Committee assesses the trading performance of operating segments based on a measure ofearnings before interest and tax. This measure excludes exceptional items.
US Cheese &Global
Nutritionals€'000
Dairy Ireland€'000
JV's &Associates
€'000
OtherBusiness
€'000
Groupincluding JV's
& Associates€'000
Total gross segment revenue (a) 1,024,653 1,154,023 416,564 6,244 2,601,484
Inter-segment revenue (2,752) (15,473) – – (18,225)
Segment external revenue 1,021,901 1,138,550 416,564 6,244 2,583,259
Segment earnings before interest, tax andexceptional items
(b) 93,795 43,543 21,554 (831) 158,061
Exceptional items – defined benefit pensions – 10,238 – – 10,238
Segment earnings before interest and tax 93,795 53,781 21,554 (831) 168,299
Included in external revenue are related party sales between Dairy Ireland and Joint Ventures & Associates of €69.2 million and relatedparty sales between US Cheese & Global Nutritionals and Joint Ventures & Associates of €9.4 million.
Inter-segment transfers or transactions are entered into under the normal commercial terms and conditions that would also beavailable to unrelated third parties.
5.1 (a): Segment revenue is reconciled to reported external revenue as follows:
2010€'000
Segment revenue 2,601,484
Inter-segment revenue (18,225)
Joint Ventures & Associates revenue (416,564)
Reported external revenue 2,166,695

97 GLANBIA PLC
ANNUAL REPORT 2010
FINANCIAL STATEMENTS
5.1 (b): Segment earnings before interest, tax and exceptional items are reconciled to reported profit before tax and profit after tax as follows:
2010€'000
Segment earnings before interest, tax and exceptional items 158,061
Exceptional items – defined benefit pension schemes 10,238
Joint Ventures & Associates interest and tax (11,451)
Finance income 3,290
Finance costs (25,420)
Reported profit before tax 134,718
Income taxes (26,085)
Reported profit after tax 108,633
Finance income, finance costs and income taxes are not allocated to segments as this type of activity is driven by the central treasuryand taxation functions, which manage the cash and taxation position of the Group.
Other segment items included in the income statement for the year ended 1 January 2011 are as follows:
US Cheese &Global
Nutritionals€'000
Dairy Ireland€'000
JV's &Associates
€'000
OtherBusiness
€'000
Groupincluding JV's
& Associates€'000
Depreciation of property, plant and equipment 12,514 19,997 6,823 58 39,392
Amortisation of intangibles 10,711 4,400 6 – 15,117
Capital grants released to the income statement (330) (1,089) (526) – (1,945)
Exceptional items – defined benefit pension schemes – (10,238) – – (10,238)
The segment assets and liabilities at 1 January 2011 and segment capital expenditure and acquisitions for the year then endedare as follows:
US Cheese &Global
Nutritionals€'000
Dairy Ireland€'000
JV's &Associates
€'000
OtherBusiness
€'000
Groupincluding JV's
& Associates€'000
Segment assets (c) 725,960 556,455 87,362 17,041 1,386,818
Segment liabilities (d) 200,380 288,125 – 1,536 490,041
Segment capital expenditure and acquisitions (e) 23,085 13,522 11,901 124 48,632
5.1 (c): Segment assets are reconciled to reported assets as follows:
2010€'000
Segment assets 1,386,818
Unallocated assets 240,027
Reported assets 1,626,845
Unallocated assets primarily include taxation, cash and cash equivalents, available for sale financial assets and derivatives.

98 GLANBIA PLC
ANNUAL REPORT 2010
FINANCIAL STATEMENTS
2010€'000
Segment liabilities 490,041
Unallocated liabilities 712,400
Reported liabilities 1,202,441
Unallocated liabilities primarily include items such as taxation, borrowings and derivatives.
US Cheese &Global
Nutritionals€'000
Dairy Ireland€'000
JV's &Associates
€'000
OtherBusiness
€'000
Groupincluding JV's& Associates
€'000
Total gross segment revenue (a) 795,974 1,037,473 297,587 9,168 2,140,202
Inter-segment revenue (3,581) (8,707) – – (12,288)
Segment external revenue 792,393 1,028,766 297,587 9,168 2,127,914
Segment earnings before interest,tax and exceptional items (b) 89,982 24,004 17,453 (2,820) 128,619
Exceptional item – segment rationalisation costs (219) (13,738) – (84) (14,041)
Segment earnings before interest and tax 89,763 10,266 17,453 (2,904) 114,578
Included in external revenue are related party sales between Dairy Ireland and Joint Ventures & Associates of €58.1 million and relatedparty sales between US Cheese & Global Nutritionals and Joint Ventures & Associates of €2.2 million.
Inter-segment transfers or transactions are entered into under the normal commercial terms and conditions that would also beavailable to unrelated third parties.
5.1 (d): Segment liabilities are reconciled to reported liabilities as follows:
5.2 The segment results for the year ended 2 January 2010 are as follows:
2010€'000
Segment capital expenditure and acquisitions 48,632
Joint Ventures & Associates capital expenditure (11,901)
Unallocated capital expenditure 466
Reported capital expenditure and acquisitions 37,197
5.1 (e): Segment capital expenditure and acquisitions are reconciled to reported capital expenditure and acquisitions as follows:

99 GLANBIA PLC
ANNUAL REPORT 2010
FINANCIAL STATEMENTS
5.2 (a): Segment revenue is reconciled to reported external revenue as follows:
2009€'000
Segment revenue 2,140,202
Inter-segment revenue (12,288)
Joint Ventures & Associates revenue (297,587)
Reported external revenue 1,830,327
5.2 (b): Segment earnings before interest, tax and exceptional items are reconciled to reported profit before tax and profit after tax as follows:
Finance income, finance costs and income taxes are not allocated to segments as this type of activity is driven by the central treasuryand taxation functions, which manage the cash and taxation position of the Group.
Other segment items included in the income statement for the year ended 2 January 2010 are as follows:
The segment assets and liabilities at 2 January 2010 and segment capital expenditure and acquisitions for the year then endedare as follows:
2009€'000
Segment earnings before interest, tax and exceptional items 128,619
Exceptional items – segment rationalisation costs (14,041)
Exceptional items – unallocated 59,716
Joint Ventures & Associates interest and tax (7,228)
Finance income 5,542
Finance costs (29,576)
Reported profit before tax 143,032
Income taxes (29,873)
Reported profit after tax 113,159
US Cheese &Global
Nutritionals€'000
Dairy Ireland€'000
JV's &Associates
€'000
OtherBusiness
€'000
Groupincluding JV's
& Associates€'000
Depreciation of property, plant and equipment 9,692 18,964 6,691 79 35,426
Amortisation of intangibles 10,364 3,494 6 – 13,864
Capital grants released to the income statement (11) (1,226) (396) – (1,633)
Exceptional items – segment rationalisation costs 219 13,738 – 84 14,041
Exceptional items – unallocated – – – – (59,716)
US Cheese &Global
Nutritionals€'000
Dairy Ireland€'000
JV's &Associates
€'000
OtherBusiness
€'000
Groupincluding JV's
& Associates€'000
Segment assets (c) 630,530 475,423 102,035 23,809 1,231,797
Segment liabilities (d) 164,351 264,743 – 1,202 430,296
Segment capital expenditure and acquisitions (e) 24,704 21,907 29,993 3,435 80,039
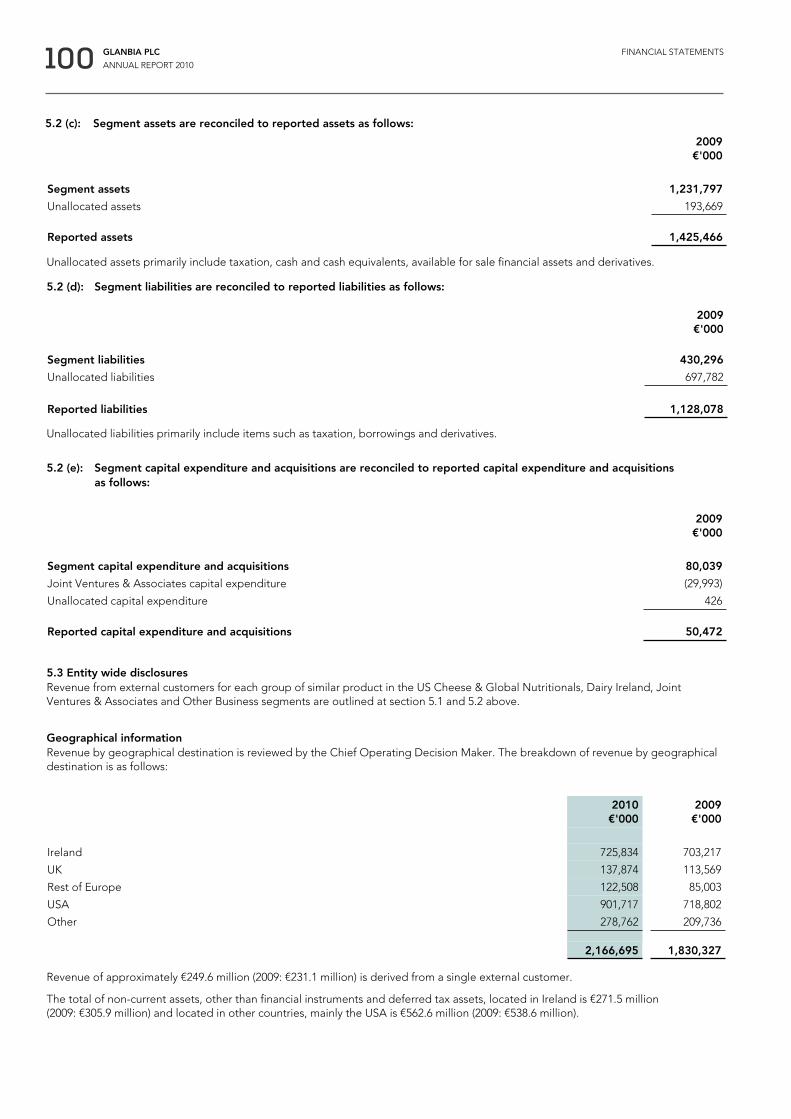
100 GLANBIA PLC
ANNUAL REPORT 2010
FINANCIAL STATEMENTS
5.2 (c): Segment assets are reconciled to reported assets as follows:
2009€'000
Segment assets 1,231,797
Unallocated assets 193,669
Reported assets 1,425,466
Unallocated assets primarily include taxation, cash and cash equivalents, available for sale financial assets and derivatives.
5.2 (d): Segment liabilities are reconciled to reported liabilities as follows:
Unallocated liabilities primarily include items such as taxation, borrowings and derivatives.
2010€'000
2009€'000
Ireland 725,834 703,217
UK 137,874 113,569
Rest of Europe 122,508 85,003
USA 901,717 718,802
Other 278,762 209,736
2,166,695 1,830,327
Revenue of approximately €249.6 million (2009: €231.1 million) is derived from a single external customer.
The total of non-current assets, other than financial instruments and deferred tax assets, located in Ireland is €271.5 million(2009: €305.9 million) and located in other countries, mainly the USA is €562.6 million (2009: €538.6 million).
5.3 Entity wide disclosuresRevenue from external customers for each group of similar product in the US Cheese & Global Nutritionals, Dairy Ireland, JointVentures & Associates and Other Business segments are outlined at section 5.1 and 5.2 above.
Geographical informationRevenue by geographical destination is reviewed by the Chief Operating Decision Maker. The breakdown of revenue by geographicaldestination is as follows:
5.2 (e): Segment capital expenditure and acquisitions are reconciled to reported capital expenditure and acquisitions as follows:
2009€'000
Segment liabilities 430,296
Unallocated liabilities 697,782
Reported liabilities 1,128,078
2009€'000
Segment capital expenditure and acquisitions 80,039
Joint Ventures & Associates capital expenditure (29,993)
Unallocated capital expenditure 426
Reported capital expenditure and acquisitions 50,472
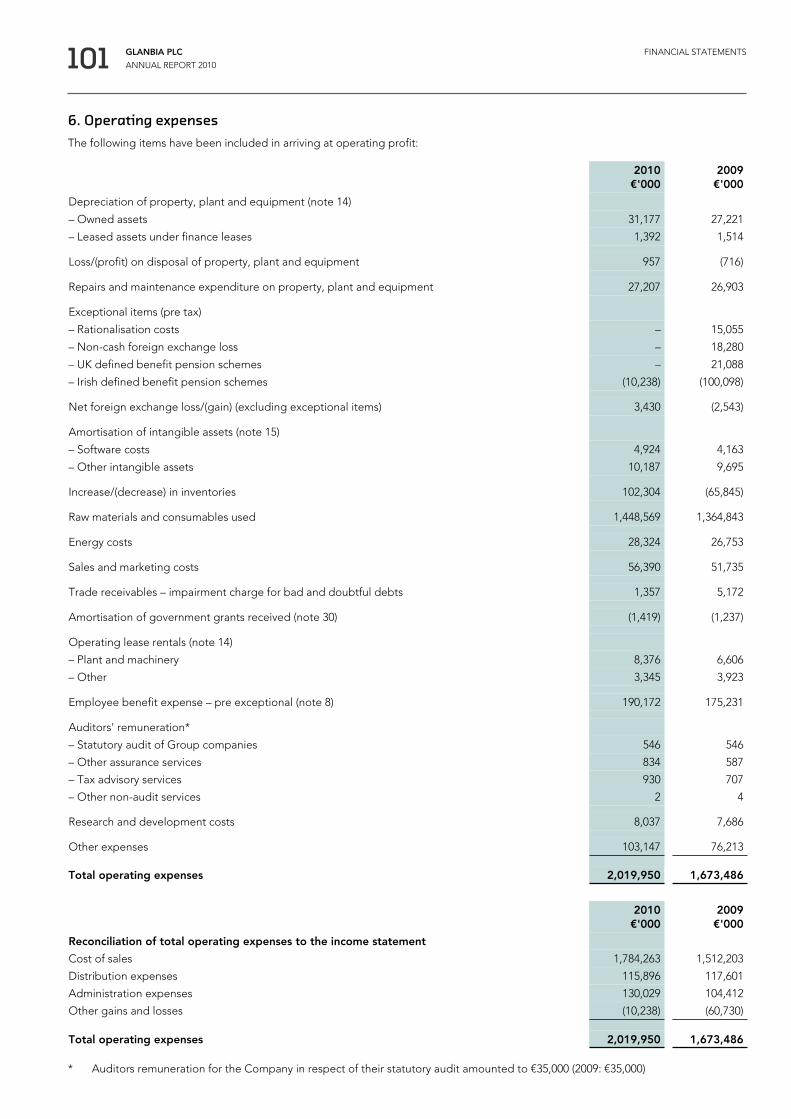
101 GLANBIA PLC
ANNUAL REPORT 2010
FINANCIAL STATEMENTS
6. Operating expensesThe following items have been included in arriving at operating profit:
2010€'000
2009€'000
Depreciation of property, plant and equipment (note 14)
– Owned assets 31,177 27,221
– Leased assets under finance leases 1,392 1,514
Loss/(profit) on disposal of property, plant and equipment 957 (716)
Repairs and maintenance expenditure on property, plant and equipment 27,207 26,903
Exceptional items (pre tax)
– Rationalisation costs – 15,055
– Non-cash foreign exchange loss – 18,280
– UK defined benefit pension schemes – 21,088
– Irish defined benefit pension schemes (10,238) (100,098)
Net foreign exchange loss/(gain) (excluding exceptional items) 3,430 (2,543)
Amortisation of intangible assets (note 15)
– Software costs 4,924 4,163
– Other intangible assets 10,187 9,695
Increase/(decrease) in inventories 102,304 (65,845)
Raw materials and consumables used 1,448,569 1,364,843
Energy costs 28,324 26,753
Sales and marketing costs 56,390 51,735
Trade receivables – impairment charge for bad and doubtful debts 1,357 5,172
Amortisation of government grants received (note 30) (1,419) (1,237)
Operating lease rentals (note 14)
– Plant and machinery 8,376 6,606
– Other 3,345 3,923
Employee benefit expense – pre exceptional (note 8) 190,172 175,231
Auditors' remuneration*
– Statutory audit of Group companies 546 546
– Other assurance services 834 587
– Tax advisory services 930 707
– Other non-audit services 2 4
Research and development costs 8,037 7,686
Other expenses 103,147 76,213
Total operating expenses 2,019,950 1,673,486
2010€'000
2009€'000
Reconciliation of total operating expenses to the income statement
Cost of sales 1,784,263 1,512,203
Distribution expenses 115,896 117,601
Administration expenses 130,029 104,412
Other gains and losses (10,238) (60,730)
Total operating expenses 2,019,950 1,673,486
* Auditors remuneration for the Company in respect of their statutory audit amounted to €35,000 (2009: €35,000)

102 GLANBIA PLC
ANNUAL REPORT 2010
FINANCIAL STATEMENTS
7. Exceptional items
Notes2010€'000
2009€'000
Rationalisation costs (a) – (15,055)
Non-cash foreign exchange loss (b) – (18,280)
Defined benefit schemes– Irish defined benefit pension schemes (c) 10,238 100,098
– UK defined benefit pension schemes (d) – (21,088)
Total exceptional credit before tax 10,238 45,675
Exceptional tax charge (note 11) (558) (10,770)
Net exceptional credit 9,680 34,905
(a) An exceptional charge of €15.1 million was incurred during the prior year, primarily relating to redundancy costs due to the on-going rationalisation programmes in the Dairy Ireland segment.
(b) During the prior year, a review of the internal corporate structures of the Group was completed. This gave rise to an exceptional non- cash charge of €18.3 million on the repayment of certain sterling inter-group loans. This loss, which was previously recognised in the Group’s currency reserve was recycled to the Group’s income statement.
(c) The Group undertook a review of pension arrangements during 2009 which resulted in the recognition of a gain on the main Irish defined benefit pension schemes of €100.1 million. In 2010, further revisions to the Group’s pension arrangements for three additional Irish defined benefit schemes, consistent with the revisions made to the Group’s main pension schemes, have been finalised giving rise to an exceptional gain, in accordance with IAS 19, in the year of €10.2 million. This gain relates to curtailment gains and negative past service costs of €1.7 million and €10.9 million respectively offset by a change in the estimate of the prior year curtailment of €2.4 million.
(d) The Group’s UK defined benefit schemes exceptional charge of €21.1 million in the prior year relates to the scheme’s administration and certain other costs associated with businesses disposed of in prior years.

103 GLANBIA PLC
ANNUAL REPORT 2010
FINANCIAL STATEMENTS
8. Employee benefit expense2010€'000
2009€'000
Wages and salaries 159,434 144,518Termination costs 749 –Social security costs 17,234 15,613Cost of share based payments (note 22) 2,937 187Pension costs – defined contribution schemes (note 28) 2,750 2,146Pension costs – defined benefit schemes (note 28) 7,068 12,767
190,172 175,231
Exceptional item – curtailment gains and negative past service costs (4,651) (60,400)
Exceptional item – rationalisation costs (note 7 a) – 15,055
185,521 129,886
The average number of employees, excluding the Group’s Joint Ventures & Associates in 2010 was 3,311 (2009: 3,418) and is analysedinto the following categories:
2010 2009
US Cheese & Global Nutritionals 1,570 1,471Dairy Ireland 1,682 1,852
Other 59 95
3,311 3,418
10. Finance income and costs
2010€'000
2009€'000
Finance income
Interest income 3,008 4,662
Interest income on deferred consideration 282 880
Total finance income 3,290 5,542
Finance costs
Bank borrowings repayable within five years (13,001) (16,756)
Interest cost on deferred consideration (80) (67)
UK pension provision (121) –
Finance lease costs (256) (241)
Interest rate swaps, transfer from equity (7,613) (8,163)
Interest rate swaps, fair value hedges 2,733 1,524
Fair value adjustment to borrowings attributable to interest rate risk (2,733) (1,524)
Finance cost of preference shares (4,349) (4,349)
Total finance costs (25,420) (29,576)
Net finance costs (22,130) (24,034)
9. Directors’ remunerationThe Directors’ remuneration information is shown on pages 65 to 70 in the governance section of this report.
Net finance costs exclude borrowing costs attributable to the acquisition, construction or production of a qualifying asset which hasbeen capitalised, as disclosed in note 14.

104 GLANBIA PLC
ANNUAL REPORT 2010
FINANCIAL STATEMENTS
11. Income taxes
Notes2010€'000
2009€'000
Current tax
Irish current tax 11,620 3,044
Adjustments in respect of prior years (422) (1,623)
Irish current tax on income for the year 11,198 1,421
Foreign current tax 2,285 4,727
Adjustments in respect of prior years 1,050 215
Foreign current tax on income for the year 3,335 4,942
Total current tax 14,533 6,363
Deferred tax (note 27) 10,994 12,740
Pre exceptional tax charge 25,527 19,103
Exceptional tax charge/(credit)
Current (a) – (1,742)
Deferred (b) 558 12,512
Total tax charge 26,085 29,873
(a) The restructuring provision charged in the prior year resulted in an exceptional current tax credit in 2009 of €1.7 million.
(b) The curtailment gains and negative past service costs recognised in the defined benefit pension schemes during the year resulted in an exceptional deferred tax charge of €0.6 million (2009: €12.5 million).
The exceptional net tax charges and credits in 2010 and 2009, by virtue of their nature and size, have been separately disclosed above.
The tax on the Group’s profit before tax differs from the theoretical amount that would arise using the corporation tax rate in Ireland,as follows:
2010€'000
2009€'000
Profit before tax 134,718 143,032
Tax calculated at Irish rate of 12.5% (2009: 12.5%) 16,840 17,879
Earnings at reduced Irish rates (902) (2,067)
Difference due to overseas tax rates 6,999 13,001
Adjustment to tax charge in respect of previous periods (1,811) (1,071)
Tax on profits of Joint Ventures & Associates included in profit before tax (1,263) (1,278)
Expenses not deductible for tax purposes and other differences 6,222 3,409
Total tax charge 26,085 29,873
Details of deferred tax charged or credited directly to other comprehensive income during the year are outlined in note 27.
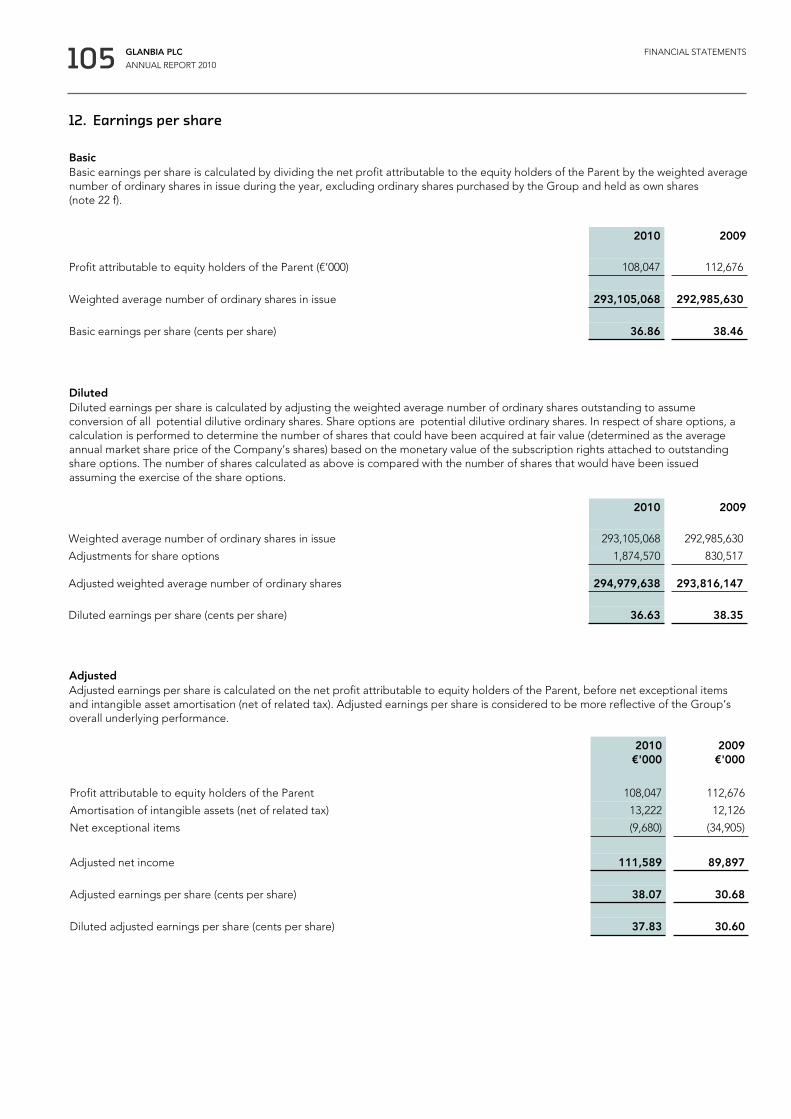
105 GLANBIA PLC
ANNUAL REPORT 2010
FINANCIAL STATEMENTS
12. Earnings per share
BasicBasic earnings per share is calculated by dividing the net profit attributable to the equity holders of the Parent by the weighted averagenumber of ordinary shares in issue during the year, excluding ordinary shares purchased by the Group and held as own shares(note 22 f).
2010 2009
Profit attributable to equity holders of the Parent (€’000) 108,047 112,676
Weighted average number of ordinary shares in issue 293,105,068 292,985,630
Basic earnings per share (cents per share) 36.86 38.46
DilutedDiluted earnings per share is calculated by adjusting the weighted average number of ordinary shares outstanding to assumeconversion of all potential dilutive ordinary shares. Share options are potential dilutive ordinary shares. In respect of share options, acalculation is performed to determine the number of shares that could have been acquired at fair value (determined as the averageannual market share price of the Company’s shares) based on the monetary value of the subscription rights attached to outstandingshare options. The number of shares calculated as above is compared with the number of shares that would have been issuedassuming the exercise of the share options.
2010 2009
Weighted average number of ordinary shares in issue 293,105,068 292,985,630
Adjustments for share options 1,874,570 830,517
Adjusted weighted average number of ordinary shares 294,979,638 293,816,147
Diluted earnings per share (cents per share) 36.63 38.35
AdjustedAdjusted earnings per share is calculated on the net profit attributable to equity holders of the Parent, before net exceptional itemsand intangible asset amortisation (net of related tax). Adjusted earnings per share is considered to be more reflective of the Group’soverall underlying performance.
2010€'000
2009€'000
Profit attributable to equity holders of the Parent 108,047 112,676
Amortisation of intangible assets (net of related tax) 13,222 12,126
Net exceptional items (9,680) (34,905)
Adjusted net income 111,589 89,897
Adjusted earnings per share (cents per share) 38.07 30.68
Diluted adjusted earnings per share (cents per share) 37.83 30.60

106 GLANBIA PLC
ANNUAL REPORT 2010
FINANCIAL STATEMENTS
13. DividendsThe dividends paid in 2010 and 2009 were €20.5 million (6.98 cents per share) and €19.5 million (6.65 cents per share) respectively. On29 September 2010 an interim dividend of 3.03 cents per share on the ordinary shares amounting to €8.9 million was paid toshareholders on the register of members as at 10 September 2010. The Directors have recommended the payment of a final dividendof 4.49 cents per share on the ordinary shares which amounts to €13.2 million. Subject to shareholders approval this dividend will bepaid on 20 May 2011 to shareholders on the register of members at 8 April 2011, the record date. These financial statements do notreflect this final dividend.
14. Property, plant and equipment
Land andbuildings
€'000
Plant andequipment
€'000
Motorvehicles
€'000Total€'000
Year ended 2 January 2010Opening net book amount 132,995 227,623 513 361,131Exchange differences (1,396) (2,971) 3 (4,364)Additions 14,779 28,857 262 43,898Disposals (7,476) (1,216) (11) (8,703)Reclassification (note 15) (2,218) 2,143 – (75)Depreciation charge (4,678) (23,650) (407) (28,735)
Closing net book amount 132,006 230,786 360 363,152
At 2 January 2010
Cost 197,267 612,295 19,036 828,598
Accumulated depreciation (65,261) (381,509) (18,676) (465,446)
Net book amount 132,006 230,786 360 363,152
Year ended 1 January 2011Opening net book amount 132,006 230,786 360 363,152Exchange differences 4,105 7,103 66 11,274Additions 4,082 25,746 215 30,043Disposals (417) (1,648) (55) (2,120)Reclassification (note 15) – (434) – (434)Depreciation charge (5,158) (27,052) (359) (32,569)
Closing net book amount 134,618 234,501 227 369,346
At 1 January 2011
Cost 205,037 643,062 19,262 867,361
Accumulated depreciation (70,419) (408,561) (19,035) (498,015)
Net book amount 134,618 234,501 227 369,346
Depreciation expense of €32.6 million (2009: €28.7 million) has been charged as follows: cost of sales €28.7 million (2009: €25.1 million),distribution expenses €1.1 million (2009: €1.2 million) and administration expenses €2.8 million (2009: €2.4 million).
Included in the cost of plant and equipment is an amount of €4.9 million (2009: €8.9 million) incurred in respect of assets underconstruction.
Borrowing costs incurred directly attributable to the acquisition, construction or production of a qualifying asset are capitalised.The amount capitalised, using the Group’s incremental cost of borrowing amounted to nil (2009: €0.3 million). Capitalised borrowingcosts will be depreciated through the income statement and will be deducted in determining taxable profit over the lifeof the underlying asset.
The Group does not have any assets secured against borrowings.
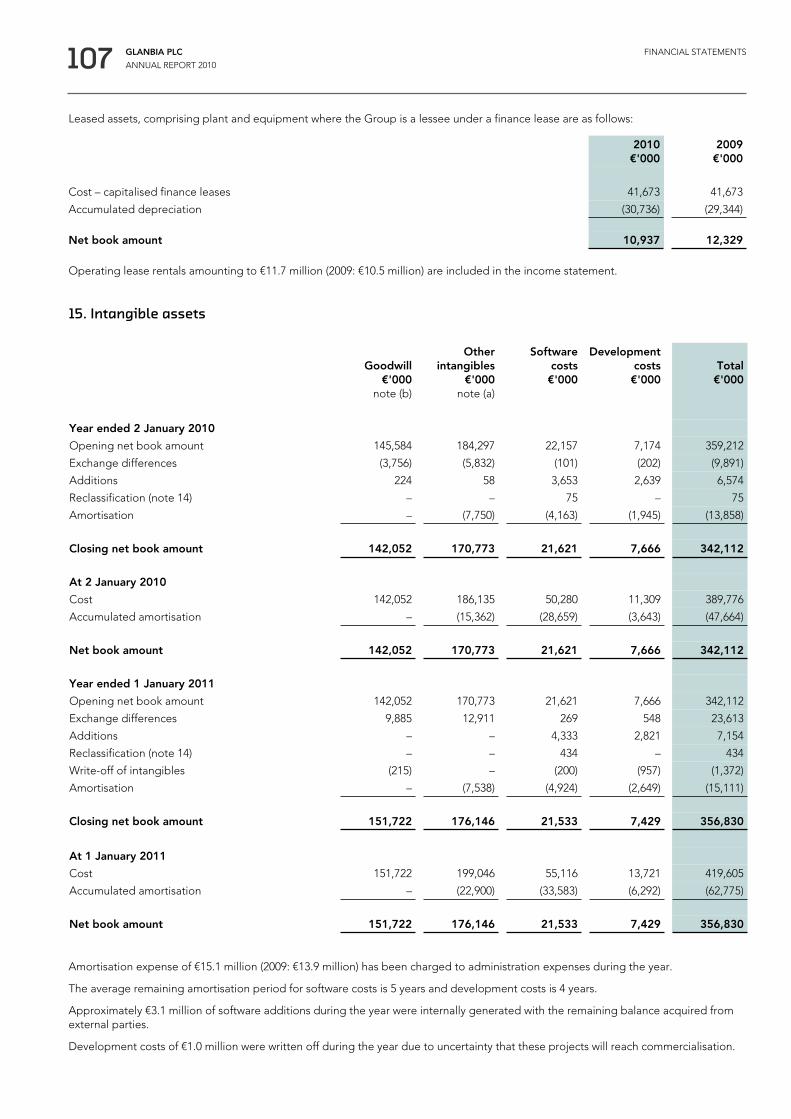
107 GLANBIA PLC
ANNUAL REPORT 2010
FINANCIAL STATEMENTS
Leased assets, comprising plant and equipment where the Group is a lessee under a finance lease are as follows:
2010€'000
2009€'000
Cost – capitalised finance leases 41,673 41,673
Accumulated depreciation (30,736) (29,344)
Net book amount 10,937 12,329
Operating lease rentals amounting to €11.7 million (2009: €10.5 million) are included in the income statement.
15. Intangible assets
Goodwill€'000
note (b)
Otherintangibles
€'000note (a)
Softwarecosts€'000
Developmentcosts€'000
Total€'000
Year ended 2 January 2010
Opening net book amount 145,584 184,297 22,157 7,174 359,212
Exchange differences (3,756) (5,832) (101) (202) (9,891)
Additions 224 58 3,653 2,639 6,574
Reclassification (note 14) – – 75 – 75
Amortisation – (7,750) (4,163) (1,945) (13,858)
Closing net book amount 142,052 170,773 21,621 7,666 342,112
At 2 January 2010
Cost 142,052 186,135 50,280 11,309 389,776
Accumulated amortisation – (15,362) (28,659) (3,643) (47,664)
Net book amount 142,052 170,773 21,621 7,666 342,112
Year ended 1 January 2011
Opening net book amount 142,052 170,773 21,621 7,666 342,112
Exchange differences 9,885 12,911 269 548 23,613
Additions – – 4,333 2,821 7,154
Reclassification (note 14) – – 434 – 434
Write-off of intangibles (215) – (200) (957) (1,372)
Amortisation – (7,538) (4,924) (2,649) (15,111)
Closing net book amount 151,722 176,146 21,533 7,429 356,830
At 1 January 2011
Cost 151,722 199,046 55,116 13,721 419,605
Accumulated amortisation – (22,900) (33,583) (6,292) (62,775)
Net book amount 151,722 176,146 21,533 7,429 356,830
Amortisation expense of €15.1 million (2009: €13.9 million) has been charged to administration expenses during the year.
The average remaining amortisation period for software costs is 5 years and development costs is 4 years.
Approximately €3.1 million of software additions during the year were internally generated with the remaining balance acquired fromexternal parties.
Development costs of €1.0 million were written off during the year due to uncertainty that these projects will reach commercialisation.
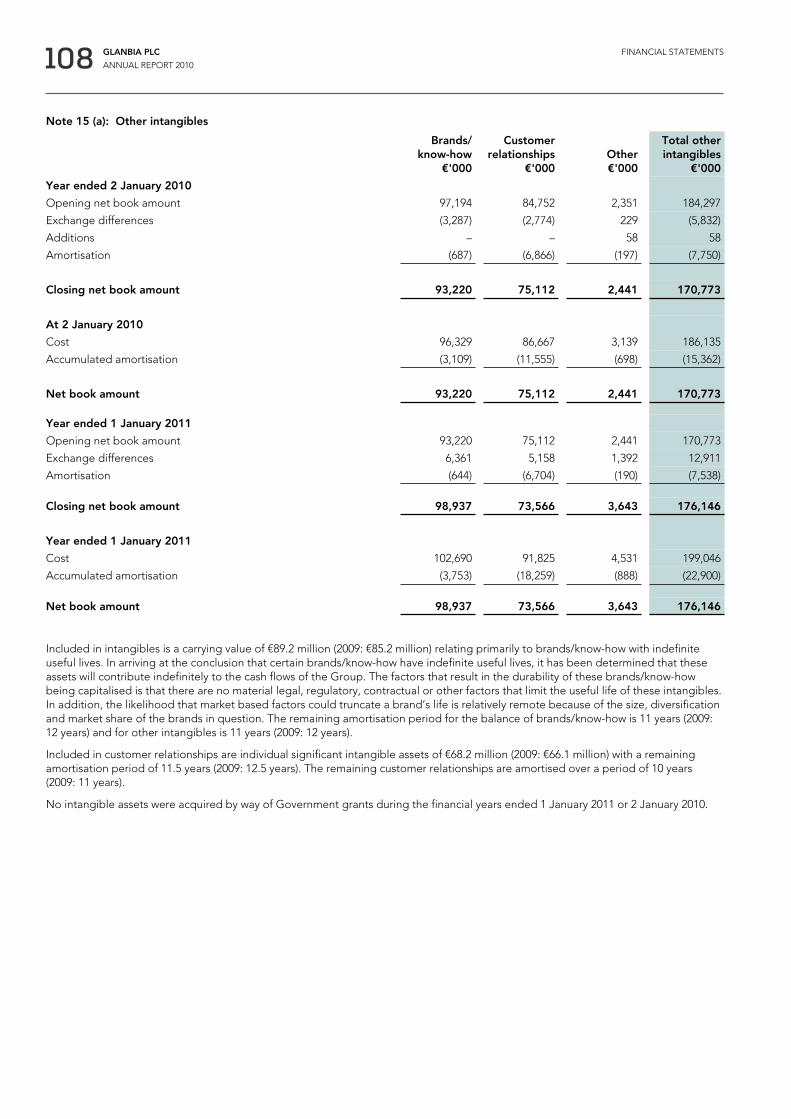
108 GLANBIA PLC
ANNUAL REPORT 2010
FINANCIAL STATEMENTS
Note 15 (a): Other intangibles
Brands/know-how
€'000
Customerrelationships
€'000Other€'000
Total otherintangibles
€'000
Year ended 2 January 2010
Opening net book amount 97,194 84,752 2,351 184,297
Exchange differences (3,287) (2,774) 229 (5,832)
Additions – – 58 58
Amortisation (687) (6,866) (197) (7,750)
Closing net book amount 93,220 75,112 2,441 170,773
At 2 January 2010
Cost 96,329 86,667 3,139 186,135
Accumulated amortisation (3,109) (11,555) (698) (15,362)
Net book amount 93,220 75,112 2,441 170,773
Year ended 1 January 2011
Opening net book amount 93,220 75,112 2,441 170,773
Exchange differences 6,361 5,158 1,392 12,911
Amortisation (644) (6,704) (190) (7,538)
Closing net book amount 98,937 73,566 3,643 176,146
Year ended 1 January 2011
Cost 102,690 91,825 4,531 199,046
Accumulated amortisation (3,753) (18,259) (888) (22,900)
Net book amount 98,937 73,566 3,643 176,146
Included in intangibles is a carrying value of €89.2 million (2009: €85.2 million) relating primarily to brands/know-how with indefiniteuseful lives. In arriving at the conclusion that certain brands/know-how have indefinite useful lives, it has been determined that theseassets will contribute indefinitely to the cash flows of the Group. The factors that result in the durability of these brands/know-howbeing capitalised is that there are no material legal, regulatory, contractual or other factors that limit the useful life of these intangibles.In addition, the likelihood that market based factors could truncate a brand’s life is relatively remote because of the size, diversificationand market share of the brands in question. The remaining amortisation period for the balance of brands/know-how is 11 years (2009:12 years) and for other intangibles is 11 years (2009: 12 years).
Included in customer relationships are individual significant intangible assets of €68.2 million (2009: €66.1 million) with a remainingamortisation period of 11.5 years (2009: 12.5 years). The remaining customer relationships are amortised over a period of 10 years(2009: 11 years).
No intangible assets were acquired by way of Government grants during the financial years ended 1 January 2011 or 2 January 2010.

109 GLANBIA PLC
ANNUAL REPORT 2010
FINANCIAL STATEMENTS
Note 15 (b): Impairment tests for goodwill and indefinite life intangibles
Goodwill is allocated to the Group’s cash generating units. A summary of the goodwill allocation by principal cash generating units isas follows:
2010€'000
2009€'000
Glanbia Nutritionals Deutschland GmbH 11,297 11,297
Glanbia Nutritionals (NA), Inc. 60,201 55,838
Optimum Nutrition, Inc. 68,411 59,918
139,909 127,053
Multiple units without individual significant amounts of goodwill 11,813 14,999
151,722 142,052
Indefinite life intangibles amounting to €89.2 million (2009: €85.2 million) are in the Optimum Nutrition, Inc. cash generating unit within“brands/know-how”.
The recoverable amount of goodwill and indefinite life intangibles allocated to a cash generating unit is determined based on value inuse calculations. These calculations use cash flow projections based on financial budgets approved by management covering a threeyear period. Cash flows beyond the three year period are extrapolated using estimated growth rates which are not in excess of forecastinflation. A rate of zero percent has been used to estimate cash flow growth between three and ten years, which is consistent with prioryears. Key assumptions include management's estimates of future profitability, replacement capital expenditure requirements andworking capital investment. Capital expenditure requirements and profitability are based on the Group's strategic plans and broadlyassume that historic investment patterns will be maintained. Working capital requirements are forecast to increase in line with activity.
The value in use calculations are prepared using a pre tax discount rate of 5.25%, which is the Group's weighted average cost of capitaldepending on the cash generating unit, and incorporates terminal values. In forecasting terminal values, a multiple of between five andten times EBITDA is generally used.
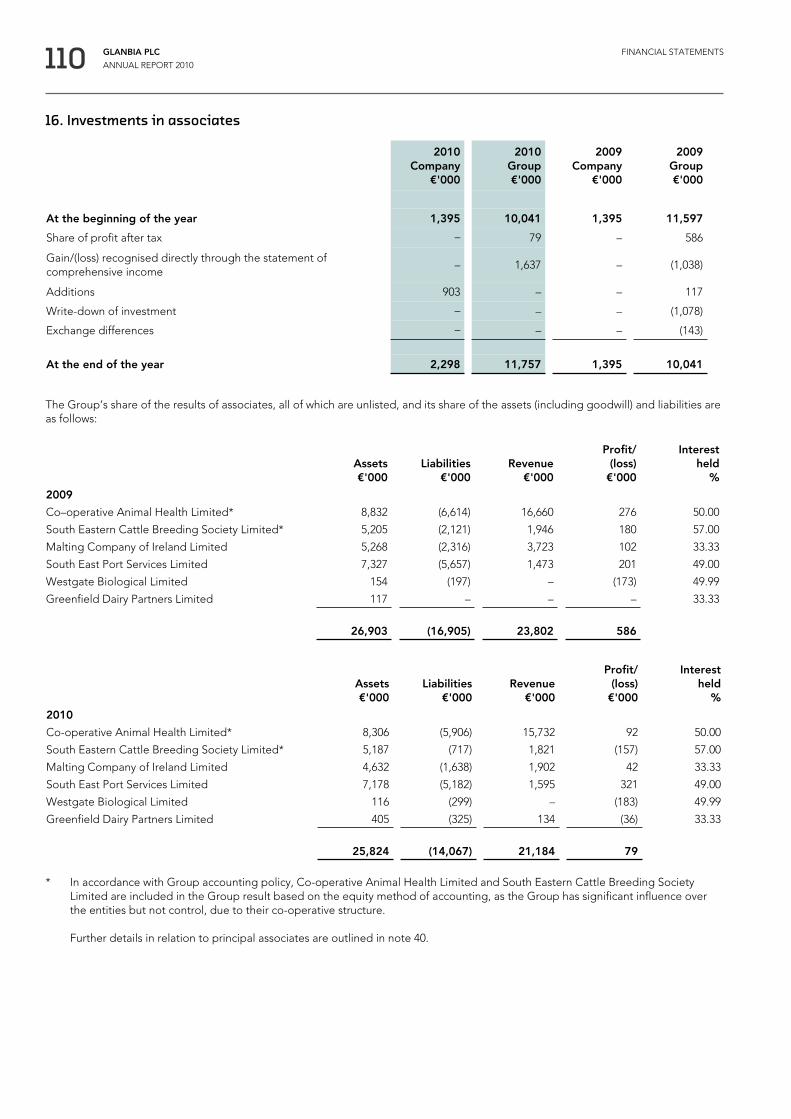
110 GLANBIA PLC
ANNUAL REPORT 2010
FINANCIAL STATEMENTS
The Group’s share of the results of associates, all of which are unlisted, and its share of the assets (including goodwill) and liabilities areas follows:
Assets€'000
Liabilities€'000
Revenue€'000
Profit/(loss)
€'000
Interestheld
%
2009
Co–operative Animal Health Limited* 8,832 (6,614) 16,660 276 50.00
South Eastern Cattle Breeding Society Limited* 5,205 (2,121) 1,946 180 57.00
Malting Company of Ireland Limited 5,268 (2,316) 3,723 102 33.33
South East Port Services Limited 7,327 (5,657) 1,473 201 49.00
Westgate Biological Limited 154 (197) – (173) 49.99
Greenfield Dairy Partners Limited 117 – – – 33.33
26,903 (16,905) 23,802 586
Assets€'000
Liabilities€'000
Revenue€'000
Profit/(loss)
€'000
Interestheld
%
2010
Co-operative Animal Health Limited* 8,306 (5,906) 15,732 92 50.00
South Eastern Cattle Breeding Society Limited* 5,187 (717) 1,821 (157) 57.00
Malting Company of Ireland Limited 4,632 (1,638) 1,902 42 33.33
South East Port Services Limited 7,178 (5,182) 1,595 321 49.00
Westgate Biological Limited 116 (299) – (183) 49.99
Greenfield Dairy Partners Limited 405 (325) 134 (36) 33.33
25,824 (14,067) 21,184 79
* In accordance with Group accounting policy, Co-operative Animal Health Limited and South Eastern Cattle Breeding SocietyLimited are included in the Group result based on the equity method of accounting, as the Group has significant influence overthe entities but not control, due to their co-operative structure.
Further details in relation to principal associates are outlined in note 40.
2010Company
€'000
2010Group€'000
2009Company
€'000
2009Group€'000
At the beginning of the year 1,395 10,041 1,395 11,597
Share of profit after tax – 79 – 586
Gain/(loss) recognised directly through the statement ofcomprehensive income
– 1,637 – (1,038)
Additions 903 – – 117
Write-down of investment – – – (1,078)
Exchange differences – – – (143)
At the end of the year 2,298 11,757 1,395 10,041
16. Investments in associates

111 GLANBIA PLC
ANNUAL REPORT 2010
FINANCIAL STATEMENTS
17. Investments in joint ventures
2010€'000
2009€'000
At the beginning of the year 58,276 64,895
Share of profit after tax 10,024 9,639
Additions 399 –
Gains recognised directly through the statement of comprehensive income 1,295 1,457
Deferred tax movement (3,054) 3,445
Dividends received (11,210) (17,924)
Exchange differences 3,215 (3,236)
At the end of the year 58,945 58,276
The following amounts represent the Group’s share of the assets and liabilities, revenue and results in joint ventures:
2010€'000
2009€'000
Assets
Non-current assets 135,903 120,033
Current assets 59,588 60,143
195,491 180,176
Liabilities
Non-current liabilities 78,340 69,686
Current liabilities 58,206 52,214
136,546 121,900
Net assets 58,945 58,276
2010€'000
2009€'000
Revenue 395,380 273,785
Expenses (385,356) (264,146)
Share of profit after tax 10,024 9,639
Proportionate interest in joint ventures’ commitments 4,930 8,939
A listing and description of interests in significant joint ventures is outlined in note 40.
The Group holds 51% of the share capital of Glanbia Cheese but this is considered to be a joint venture as the Group does not havecontrol of the company, as it only controls 50% of the voting rights and is only entitled to appoint 50% of the total number of directors.Therefore, the Group does not have the power to govern the financial or operating policies of the entity.
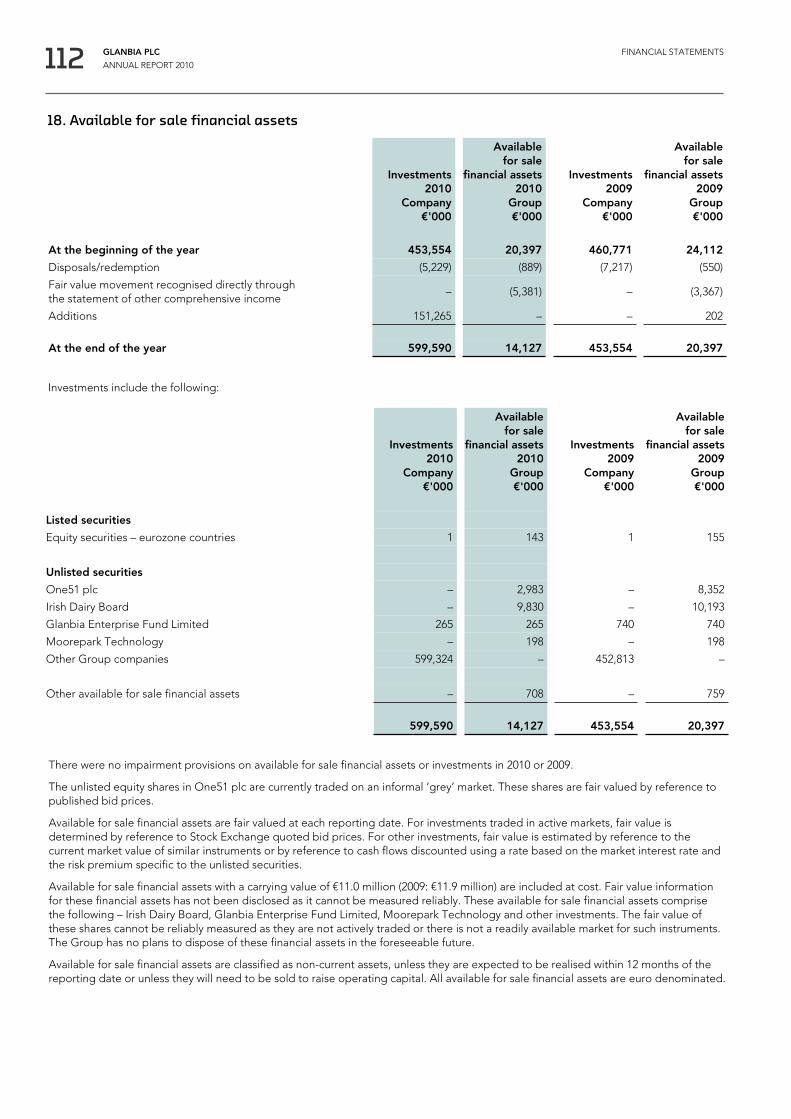
112 GLANBIA PLC
ANNUAL REPORT 2010
FINANCIAL STATEMENTS
18. Available for sale financial assets
Investments2010
Company€'000
Availablefor sale
financial assets2010
Group€'000
Investments2009
Company€'000
Availablefor sale
financial assets 2009
Group €'000
At the beginning of the year 453,554 20,397 460,771 24,112
Disposals/redemption (5,229) (889) (7,217) (550)
Fair value movement recognised directly throughthe statement of other comprehensive income
– (5,381) – (3,367)
Additions 151,265 – – 202
At the end of the year 599,590 14,127 453,554 20,397
Investments include the following:
Investments2010
Company€'000
Availablefor sale
financial assets2010
Group€'000
Investments2009
Company€'000
Availablefor sale
financial assets 2009
Group €'000
Listed securities
Equity securities – eurozone countries 1 143 1 155
Unlisted securities
One51 plc – 2,983 – 8,352
Irish Dairy Board – 9,830 – 10,193
Glanbia Enterprise Fund Limited 265 265 740 740
Moorepark Technology – 198 – 198
Other Group companies 599,324 – 452,813 –
Other available for sale financial assets – 708 – 759
599,590 14,127 453,554 20,397
There were no impairment provisions on available for sale financial assets or investments in 2010 or 2009.
The unlisted equity shares in One51 plc are currently traded on an informal ‘grey’ market. These shares are fair valued by reference topublished bid prices.
Available for sale financial assets are fair valued at each reporting date. For investments traded in active markets, fair value isdetermined by reference to Stock Exchange quoted bid prices. For other investments, fair value is estimated by reference to thecurrent market value of similar instruments or by reference to cash flows discounted using a rate based on the market interest rate andthe risk premium specific to the unlisted securities.
Available for sale financial assets with a carrying value of €11.0 million (2009: €11.9 million) are included at cost. Fair value informationfor these financial assets has not been disclosed as it cannot be measured reliably. These available for sale financial assets comprisethe following – Irish Dairy Board, Glanbia Enterprise Fund Limited, Moorepark Technology and other investments. The fair value ofthese shares cannot be reliably measured as they are not actively traded or there is not a readily available market for such instruments.The Group has no plans to dispose of these financial assets in the foreseeable future.
Available for sale financial assets are classified as non-current assets, unless they are expected to be realised within 12 months of thereporting date or unless they will need to be sold to raise operating capital. All available for sale financial assets are euro denominated.

113 GLANBIA PLC
ANNUAL REPORT 2010
FINANCIAL STATEMENTS
19. Trade and other receivables
2010Company
€'000
2010Group€'000
2009Company
€'000
2009Group€'000
Trade receivables – 230,794 – 194,424
Less provision for impairment of receivables – (12,802) – (12,035)
Trade receivables – net – 217,992 – 182,389
Prepayments 22 6,344 30 14,569
Receivables from Joint Ventures & Associates (note 37) – 6,882 – 2,357
Loans to joint ventures (note 37) – 13,060 – 33,718
Amounts due from subsidiary companies 87 – 76,297 –
Value added tax – 4,505 – 5,113
Other receivables – 21,132 – 16,735
109 269,915 76,327 254,881
Less non-current trade receivables:
Other receivables – (6,424) – (16,837)
Receivables from Joint Ventures & Associates – (3,600) – –
Loans to joint ventures (note 37) – (13,060) – (33,718)
109 246,831 76,327 204,326
In 2010, under a debt purchase agreement with a financial institution, the Group has transferred credit risk and retained late paymentrisk on certain trade receivables, amounting to €32.1 million (2009: €34.0 million). The Group has continued to recognise an asset of€0.4 million (2009: €0.4 million), representing the extent of its continuing involvement, and an associated liability of a similar amount.
The carrying value of receivables are a reasonable approximation of fair value. The net movement in the provision for impairmentof receivables has been included in distribution expenses in the income statement.
As shown in note 5.3, the Group has one significant external customer. Management are satisfied that they have satisfactory creditcontrol procedures in place in respect of this customer.
The Group’s objective is to minimise credit risk by carrying out credit checks where appropriate by the use of credit insurance in certainsituations and by active credit management. Management does not expect any significant losses of receivables that have not beenprovided for.

114 GLANBIA PLC
ANNUAL REPORT 2010
FINANCIAL STATEMENTS
The carrying amounts of the Group’s trade and other receivables are denominated in the following currencies:
2010Company
€'000
2010Group€'000
2009Company
€'000
2009Group€'000
Euro 109 126,725 76,327 101,144
US dollar – 113,506 – 95,888
GBP sterling – 5,323 – 3,325
Other – 1,277 – 3,969
109 246,831 76,327 204,326
Movement on the Group’s provision for impairment of trade receivables is as follows:
2010€'000
2009€'000
At the beginning of the year 12,035 8,091
Provision for receivables impairment 1,481 4,696
Receivables written off during the year as uncollectible (261) (356)
Unused amounts reversed (453) (396)
At the end of the year 12,802 12,035
As of 1 January 2011, trade receivables of €18.1 million (2009: €20.5 million) were impaired. Trade receivable balances are generallyconsidered for an impairment review when falling due outside trade terms and are normally partially or wholly provided for. Theamount of the provision was €12.8 million (2009: €12.0 million).
The breakdown of impaired trade receivables is as follows:
2010€'000
2009€'000
Past due:
Up to 3 months 1,652 2,987
3 to 6 months 2,863 4,533
Over 6 months 13,597 13,008
18,112 20,528
The maximum exposure to credit risk at the reporting date is the carrying value of each class of receivable mentioned above.The Group holds charges on property and other assets of certain trade debtors, valued at €9.6 million (2009: €8.0 million).
As of 1 January 2011, trade receivables of €39.5 million (2009: €31.3 million) were past due but not impaired, as they are consideredrecoverable.
2010€'000
2009€'000
Past due not impaired:
Up to 3 months 36,100 25,494
3 to 6 months 2,580 4,267
Over 6 months 838 1,572
39,518 31,333

115 GLANBIA PLC
ANNUAL REPORT 2010
FINANCIAL STATEMENTS
20. Inventories
2010€'000
2009€'000
Raw materials 57,142 29,573
Finished goods 230,140 159,480
Consumables 16,599 12,524
303,881 201,577
21. Cash and cash equivalents
2010Company
€’000
2010Group€'000
2009Company
€'000
2009Group€'000
Cash at bank and in hand 8,200 59,554 – 38,831
Short term bank deposits – 169,547 – 113,958
8,200 229,101 – 152,789
The fair value of cash and cash equivalents are not materially different to their book values. The maximum exposure to credit risk at thereporting date is the carrying value of the cash and cash equivalent balances.
Included in the above are inventories carried at net realisable value amounting to €8.1 million (2009: €26.1 million). The amount writtenoff in respect of these inventories was €2.0 million (2009: €4.1 million).

116 GLANBIA PLC
ANNUAL REPORT 2010
FINANCIAL STATEMENTS
22. Other reserves
Capitalreserve
€'000
Mergerreserve
€'000
Currencyreserve
€'000
Hedgingreserve
€'000
Availablefor sale
financialassets
reserve€'000
Ownshares€'000
Sharebased
paymentreserve
€'000Total€'000
(note a) (note b) (note c) (note d) (note e) (note f) (note g)
Balance at 3 January 2009 2,825 113,148 (5,230) (18,727) 9,253 (1,899) 1,613 100,983
Currency translation differences – – (12,022) – – – – (12,022)Exceptional foreign exchange loss – – 18,280 – – – – 18,280Revaluation of interest rate swaps – loss in year – – – (3,690) – – – (3,690)Foreign exchange contracts – loss in year – – – (983) – – – (983)Transfers to income statement– Foreign exchange contracts – loss in year – – – 903 – – – 903– Forward commodity contracts – loss in year – – – 716 – – – 716– Interest rate swaps – loss in year – – – 8,163 – – – 8,163Revaluation of forward commodity contracts – gain in year – – – 5 – – – 5Revaluation of available for sale financial assets – loss in year – – – – (3,367) – – (3,367)Deferred tax on fair value movements – – – (988) 485 – – (503)Cost of share based payments – – – – – – 187 187Transfer between reserves – – (648) – – – 648 –
Balance at 2 January 2010 2,825 113,148 380 (14,601) 6,371 (1,899) 2,448 108,672
Currency translation differences – – 20,169 – – – – 20,169Revaluation of interest rate swaps – loss in year – – – (4,180) – – – (4,180)Foreign exchange contracts – gain in year – – – 38 – – – 38Transfers to income statement– Foreign exchange contracts – loss in year – – – 743 – – – 743– Forward commodity contracts – gain in year – – – (202) – – – (202)– Interest rate swaps – loss in year – – – 7,613 – – – 7,613Revaluation of forward commodity contracts – loss in year – – – (76) – – – (76)Revaluation of available for sale financial assets – loss in year – – – – (5,381) – – (5,381)Deferred tax on fair value movements – – – 922 1,345 – – 2,267Cost of share based payments – – – – – – 2,937 2,937Transfer on exercise, forfeit or lapse of share basedpayments that have vested (note 24)
– – – – – 283 (656) (373)
Balance at 1 January 2011 2,825 113,148 20,549 (9,743) 2,335 (1,616) 4,729 132,227
Note 22 (a): Capital reserve
2010Company
€'000
2010Group€'000
2009Company
€'000
2009Group€'000
At the beginning and the end of the year 4,227 2,825 4,227 2,825
The capital reserve comprises a capital redemption reserve and a capital reserve which arose due to the re-nominalisation of theCompany’s share capital on conversion to the euro.
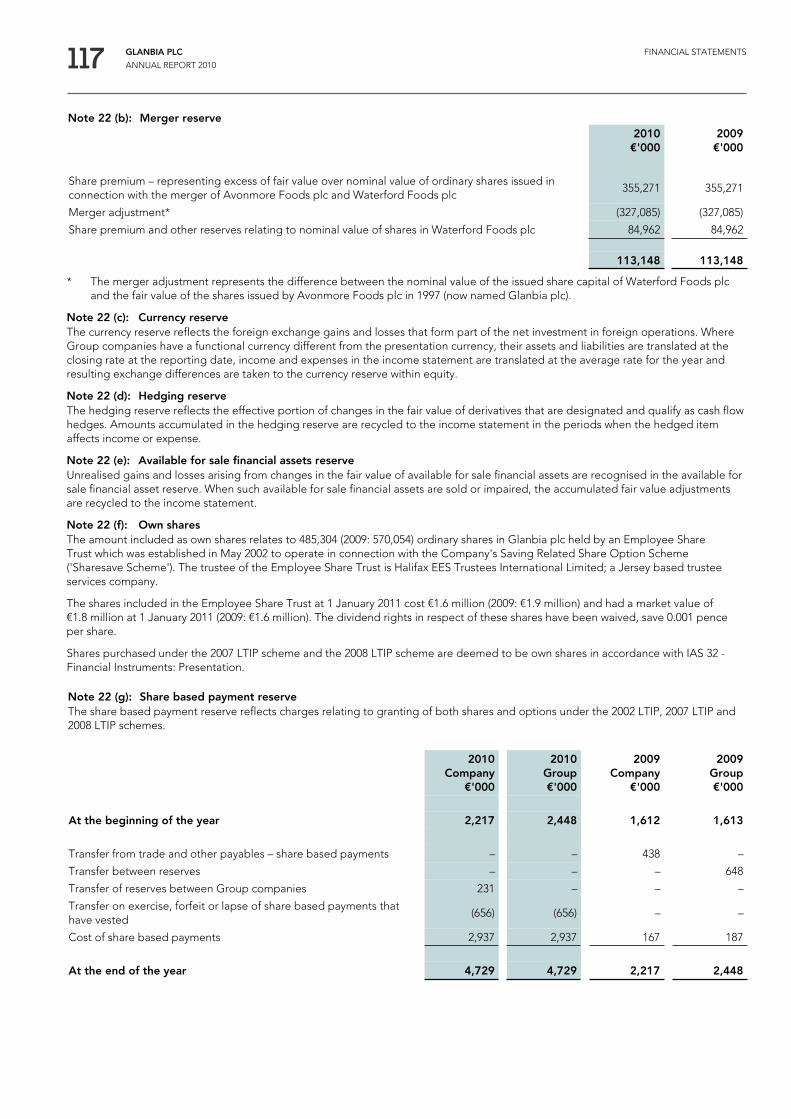
117 GLANBIA PLC
ANNUAL REPORT 2010
FINANCIAL STATEMENTS
2010€'000
2009€'000
Share premium – representing excess of fair value over nominal value of ordinary shares issued inconnection with the merger of Avonmore Foods plc and Waterford Foods plc
355,271 355,271
Merger adjustment* (327,085) (327,085)
Share premium and other reserves relating to nominal value of shares in Waterford Foods plc 84,962 84,962
113,148 113,148
Note 22 (b): Merger reserve
* The merger adjustment represents the difference between the nominal value of the issued share capital of Waterford Foods plc and the fair value of the shares issued by Avonmore Foods plc in 1997 (now named Glanbia plc).
Note 22 (c): Currency reserveThe currency reserve reflects the foreign exchange gains and losses that form part of the net investment in foreign operations. WhereGroup companies have a functional currency different from the presentation currency, their assets and liabilities are translated at theclosing rate at the reporting date, income and expenses in the income statement are translated at the average rate for the year andresulting exchange differences are taken to the currency reserve within equity.
Note 22 (d): Hedging reserveThe hedging reserve reflects the effective portion of changes in the fair value of derivatives that are designated and qualify as cash flowhedges. Amounts accumulated in the hedging reserve are recycled to the income statement in the periods when the hedged itemaffects income or expense.
Note 22 (e): Available for sale financial assets reserveUnrealised gains and losses arising from changes in the fair value of available for sale financial assets are recognised in the available forsale financial asset reserve. When such available for sale financial assets are sold or impaired, the accumulated fair value adjustmentsare recycled to the income statement.
Note 22 (f): Own sharesThe amount included as own shares relates to 485,304 (2009: 570,054) ordinary shares in Glanbia plc held by an Employee ShareTrust which was established in May 2002 to operate in connection with the Company's Saving Related Share Option Scheme('Sharesave Scheme'). The trustee of the Employee Share Trust is Halifax EES Trustees International Limited; a Jersey based trusteeservices company.
The shares included in the Employee Share Trust at 1 January 2011 cost €1.6 million (2009: €1.9 million) and had a market value of€1.8 million at 1 January 2011 (2009: €1.6 million). The dividend rights in respect of these shares have been waived, save 0.001 penceper share.
Shares purchased under the 2007 LTIP scheme and the 2008 LTIP scheme are deemed to be own shares in accordance with IAS 32 -Financial Instruments: Presentation.
Note 22 (g): Share based payment reserveThe share based payment reserve reflects charges relating to granting of both shares and options under the 2002 LTIP, 2007 LTIP and2008 LTIP schemes.
2010Company
€'000
2010Group€'000
2009Company
€'000
2009Group€'000
At the beginning of the year 2,217 2,448 1,612 1,613
Transfer from trade and other payables – share based payments – – 438 –
Transfer between reserves – – – 648
Transfer of reserves between Group companies 231 – – –
Transfer on exercise, forfeit or lapse of share based payments thathave vested
(656) (656) – –
Cost of share based payments 2,937 2,937 167 187
At the end of the year 4,729 4,729 2,217 2,448
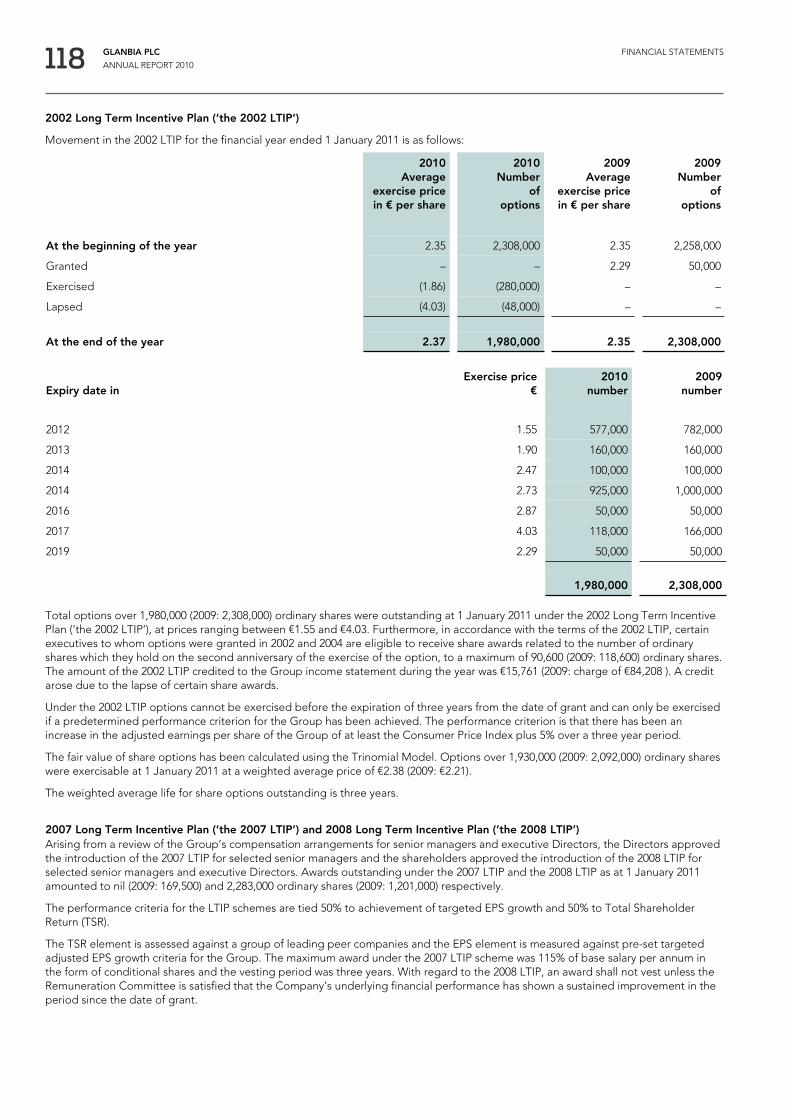
118 GLANBIA PLC
ANNUAL REPORT 2010
FINANCIAL STATEMENTS
2002 Long Term Incentive Plan (‘the 2002 LTIP’)
Movement in the 2002 LTIP for the financial year ended 1 January 2011 is as follows:
2010Average
exercise pricein € per share
2010Number
ofoptions
2009Average
exercise pricein € per share
2009Number
ofoptions
At the beginning of the year 2.35 2,308,000 2.35 2,258,000
Granted – – 2.29 50,000
Exercised (1.86) (280,000) – –
Lapsed (4.03) (48,000) – –
At the end of the year 2.37 1,980,000 2.35 2,308,000
Expiry date inExercise price
€2010
number2009
number
2012 1.55 577,000 782,000
2013 1.90 160,000 160,000
2014 2.47 100,000 100,000
2014 2.73 925,000 1,000,000
2016 2.87 50,000 50,000
2017 4.03 118,000 166,000
2019 2.29 50,000 50,000
1,980,000 2,308,000
Total options over 1,980,000 (2009: 2,308,000) ordinary shares were outstanding at 1 January 2011 under the 2002 Long Term IncentivePlan (‘the 2002 LTIP’), at prices ranging between €1.55 and €4.03. Furthermore, in accordance with the terms of the 2002 LTIP, certainexecutives to whom options were granted in 2002 and 2004 are eligible to receive share awards related to the number of ordinaryshares which they hold on the second anniversary of the exercise of the option, to a maximum of 90,600 (2009: 118,600) ordinary shares.The amount of the 2002 LTIP credited to the Group income statement during the year was €15,761 (2009: charge of €84,208 ). A creditarose due to the lapse of certain share awards.
Under the 2002 LTIP options cannot be exercised before the expiration of three years from the date of grant and can only be exercisedif a predetermined performance criterion for the Group has been achieved. The performance criterion is that there has been anincrease in the adjusted earnings per share of the Group of at least the Consumer Price Index plus 5% over a three year period.
The fair value of share options has been calculated using the Trinomial Model. Options over 1,930,000 (2009: 2,092,000) ordinary shareswere exercisable at 1 January 2011 at a weighted average price of €2.38 (2009: €2.21).
The weighted average life for share options outstanding is three years.
2007 Long Term Incentive Plan (‘the 2007 LTIP’) and 2008 Long Term Incentive Plan (‘the 2008 LTIP’)Arising from a review of the Group’s compensation arrangements for senior managers and executive Directors, the Directors approvedthe introduction of the 2007 LTIP for selected senior managers and the shareholders approved the introduction of the 2008 LTIP forselected senior managers and executive Directors. Awards outstanding under the 2007 LTIP and the 2008 LTIP as at 1 January 2011amounted to nil (2009: 169,500) and 2,283,000 ordinary shares (2009: 1,201,000) respectively.
The performance criteria for the LTIP schemes are tied 50% to achievement of targeted EPS growth and 50% to Total ShareholderReturn (TSR).
The TSR element is assessed against a group of leading peer companies and the EPS element is measured against pre-set targetedadjusted EPS growth criteria for the Group. The maximum award under the 2007 LTIP scheme was 115% of base salary per annum inthe form of conditional shares and the vesting period was three years. With regard to the 2008 LTIP, an award shall not vest unless theRemuneration Committee is satisfied that the Company’s underlying financial performance has shown a sustained improvement in theperiod since the date of grant.

119 GLANBIA PLC
ANNUAL REPORT 2010
FINANCIAL STATEMENTS
Granted in 2007
Share priceat date
of award€
Period toearliest
release dateNumber
of shares Fair value€
Expense inGroup income
statement2010€'000
Expense inGroup income
statement2009
€'000
2007 Long Term Incentive Plan 4.03 – 169,500 3.85 129 63
Shares awarded under the Group’s LTIP schemes are equity settled share based payments as defined in IFRS 2 – Share BasedPayments. The IFRS requires that a recognised valuation methodology be employed to determine the fair value of shares awarded andstipulates that this methodology should be consistent with methodologies used for pricing of financial instruments. The combinedexpense of €2,953,071 (2008 LTIP: €2,823,605, 2007 LTIP: €129,466) charged in the Group income statement has been arrived at throughapplying a Monte Carlo simulation technique to model the combination of market and non-market based performance conditions ofthe plan.
The 2007 LTIPImpact on Group income statement
Shares awarded under the 2007 LTIP are equity settled share-based payments as defined in IFRS 2-Share Based Payment. On 25 May2010, 50% of the share options above vested and the balance has lapsed.
The fair value of the shares awarded was determined using a Monte Carlo simulation technique taking account of peer group totalshare return volatilities and correlations together with the following assumptions:
Risk-free interest rate 4%
Expected volatility 25%
Dividend yield 2%
Expected volatility was determined by calculating the historical volatility of the Company’s share price over a period equivalent to theexpected life of the option.
The 2008 LTIPImpact on Group income statementThe total expense is analysed as follows:
Share priceat date
of award€
Period toearliest
release dateNumber
of shares Fair value€
Expense inGroup income
statement2010€'000
Expense inGroup income
statement2009€'000
Granted in 2008
2008 Long Term Incentive Plan 4.45 1 year 583,000 3.54 1,332 (153)
Granted in 2009
2008 Long Term Incentive Plan 2.72 2 years 618,000 2.22 659 193
Granted in 2010
2008 Long Term Incentive Plan 2.82 3 years 1,082,000 2.31 833 –
Shares awarded under the 2008 LTIP are equity settled share-based payments as defined in IFRS 2-Share Based Payment. The 2008,2009 and 2010 awards will expire in 2011 (583,000 shares), 2012 (618,000 shares) and 2013 (1,082,000 shares) respectively.
The number of options granted in 2008 and 2009, expected to vest has increased, resulting in an increased charge to the incomestatement during the year.
The fair value of the shares awarded were determined using a Monte Carlo simulation technique taking account of peer group totalshare return volatilities and correlations together with the following assumptions:
Granted in2010
Granted in2009
Granted in2008
Risk-free interest rate 1% 2% 4%
Expected volatility 47% 35% 29%
Dividend yield 1% 2% 1%
Expected volatility was determined by calculating the historical volatility of the Company’s share price over a period equivalent to theexpected life of the option.

120 GLANBIA PLC
ANNUAL REPORT 2010
FINANCIAL STATEMENTS
Company
Number ofshares
(thousands)
Ordinaryshares€'000
Share premium€'000
Total€'000
At 3 January 2009 and 2 January 2010 293,556 17,613 436,874 454,487
Shares issued 280 17 505 522
At 1 January 2011 293,836 17,630 437,379 455,009
Group
Number ofshares
(thousands)
Ordinaryshares€'000
Share premium€'000
Total€'000
At 3 January 2009 and 2 January 2010 293,556 17,613 81,606 99,219
Shares issued 280 17 505 522
At 1 January 2011 293,836 17,630 82,111 99,741
23. Share capital and share premium
The total authorised number of ordinary shares is 306 million shares (2009: 306 million shares) with a par value of €0.06 per share (2009:€0.06 per share). All issued shares are fully paid.

121 GLANBIA PLC
ANNUAL REPORT 2010
FINANCIAL STATEMENTS
24. Retained earnings
Companyretainedearnings
€'000
Groupretainedearnings
€'000
Groupgoodwillwrite-off
€'000
GroupTotal€'000
Balance at 3 January 2009 36,056 112,668 (92,961) 19,707
Profit for the year 43,341 112,676 – 112,676
Other comprehensive income/(expense)
Actuarial loss – defined benefit schemes – (31,215) – (31,215)
Deferred tax on actuarial loss – 2,684 – 2,684
Share of actuarial loss – Joint Ventures & Associates – (1,364) – (1,364)
Total comprehensive income for the year 43,341 82,781 – 82,781
Dividends paid during the year (19,484) (19,484) – (19,484)
Balance at 2 January 2010 59,913 175,965 (92,961) 83,004
Profit for the year 745 108,047 – 108,047
Other comprehensive income/(expense)
Actuarial gain – defined benefit schemes – 13,379 – 13,379
Deferred tax on actuarial gain – (1,250) – (1,250)
Share of actuarial gain – Joint Ventures & Associates – 2,444 – 2,444
Total comprehensive income for the year 745 122,620 – 122,620
Dividends paid during the year (20,453) (20,453) – (20,453)
Transfer on exercise, forfeit or lapse of share based payments thathave vested (note 22) 373 373 – 373
Balance at 1 January 2011 40,578 278,505 (92,961) 185,544
25. Non-controlling interests
2010€'000
2009€'000
At the beginning of the year 6,493 8,010
Share of profit for the year 586 483
Dividends paid to non-controlling interests during the year (187) (2,000)
At the end of the year 6,892 6,493
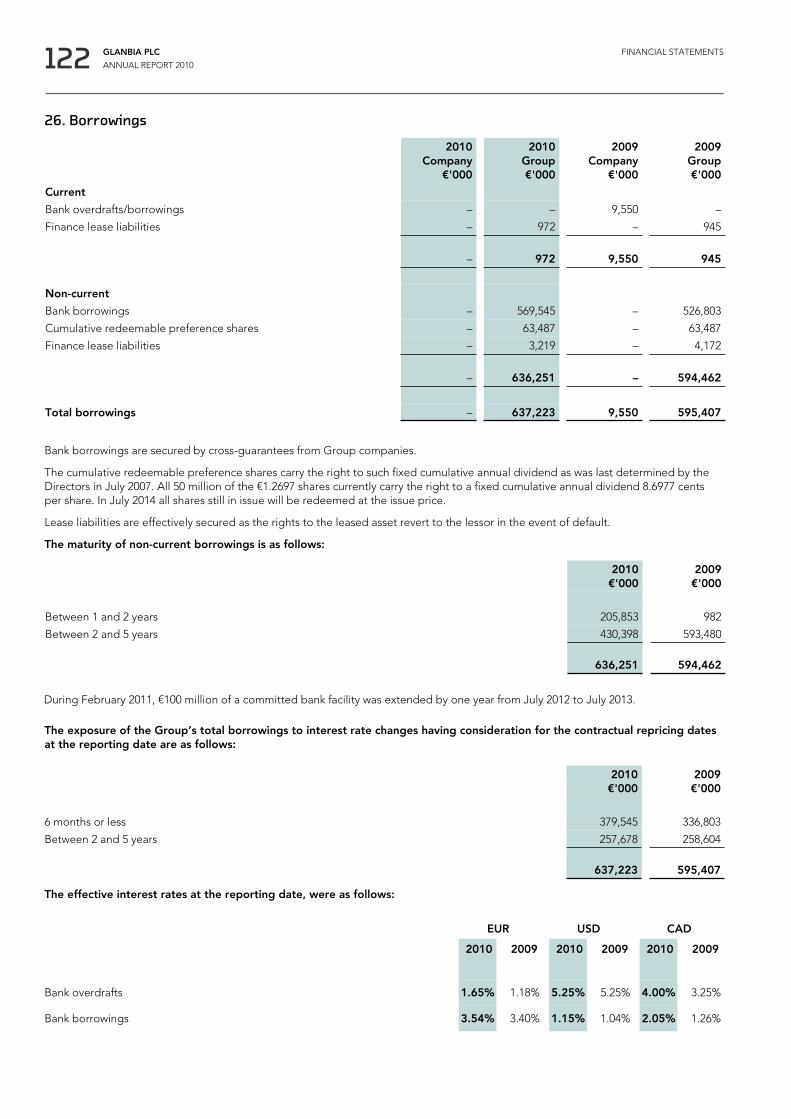
122 GLANBIA PLC
ANNUAL REPORT 2010
FINANCIAL STATEMENTS
26. Borrowings
2010Company
€'000
2010Group€'000
2009Company
€'000
2009Group€'000
Current
Bank overdrafts/borrowings – – 9,550 –
Finance lease liabilities – 972 – 945
– 972 9,550 945
Non-current
Bank borrowings – 569,545 – 526,803
Cumulative redeemable preference shares – 63,487 – 63,487
Finance lease liabilities – 3,219 – 4,172
– 636,251 – 594,462
Total borrowings – 637,223 9,550 595,407
Bank borrowings are secured by cross-guarantees from Group companies.
The cumulative redeemable preference shares carry the right to such fixed cumulative annual dividend as was last determined by theDirectors in July 2007. All 50 million of the €1.2697 shares currently carry the right to a fixed cumulative annual dividend 8.6977 centsper share. In July 2014 all shares still in issue will be redeemed at the issue price.
Lease liabilities are effectively secured as the rights to the leased asset revert to the lessor in the event of default.
The maturity of non-current borrowings is as follows:
2010€'000
2009€'000
Between 1 and 2 years 205,853 982
Between 2 and 5 years 430,398 593,480
636,251 594,462
The exposure of the Group’s total borrowings to interest rate changes having consideration for the contractual repricing datesat the reporting date are as follows:
2010€'000
2009€'000
6 months or less 379,545 336,803
Between 2 and 5 years 257,678 258,604
637,223 595,407
The effective interest rates at the reporting date, were as follows:
EUR USD CAD
2010 2009 2010 2009 2010 2009
Bank overdrafts 1.65% 1.18% 5.25% 5.25% 4.00% 3.25%
Bank borrowings 3.54% 3.40% 1.15% 1.04% 2.05% 1.26%
During February 2011, €100 million of a committed bank facility was extended by one year from July 2012 to July 2013.

123 GLANBIA PLC
ANNUAL REPORT 2010
FINANCIAL STATEMENTS
The carrying amounts and fair values of non-current borrowings are as follows:
Carryingamount
2010€'000
Carryingamount
2009€'000
Fairvalues2010€'000
Fairvalues2009€'000
Non-current borrowings 636,251 594,462 632,008 589,283
The carrying value of current borrowings approximates their fair value.
The carrying amounts of the Group’s total borrowings are denominated in the following currencies:
2010€'000
2009€'000
Euro 445,620 458,168
US dollar 179,527 126,605
Canadian dollar 12,076 10,634
637,223 595,407
The Group has the following undrawn borrowing facilities:
2010€'000
2009€'000
Expiring within 1 year 16,646 16,286
Expiring beyond 1 year 101,178 138,795
117,824 155,081
Finance lease liabilities – minimum lease payments:
2010€'000
2009€'000
12 months or less 1,181 1,149
Between 1 and 2 years 1,181 1,149
Between 2 and 5 years 2,362 3,447
4,724 5,745
Future finance charges on finance leases (533) (628)
Present value of finance lease liabilities 4,191 5,117
The present value of finance lease liabilities is as follows:
2010€'000
2009€'000
12 months or less 972 945
Between 1 and 2 years 1,021 982
Between 2 and 5 years 2,198 3,190
4,191 5,117
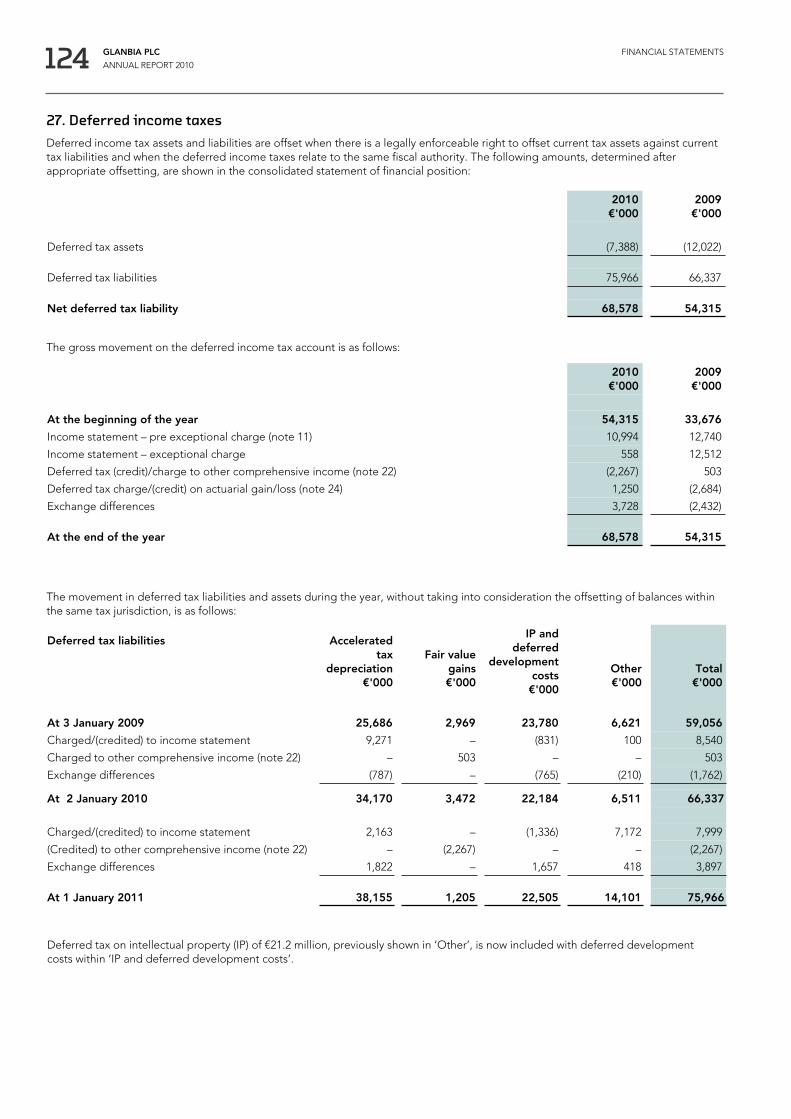
124 GLANBIA PLC
ANNUAL REPORT 2010
FINANCIAL STATEMENTS
27. Deferred income taxesDeferred income tax assets and liabilities are offset when there is a legally enforceable right to offset current tax assets against currenttax liabilities and when the deferred income taxes relate to the same fiscal authority. The following amounts, determined afterappropriate offsetting, are shown in the consolidated statement of financial position:
2010€'000
2009€'000
Deferred tax assets (7,388) (12,022)
Deferred tax liabilities 75,966 66,337
Net deferred tax liability 68,578 54,315
The gross movement on the deferred income tax account is as follows:
2010€'000
2009€'000
At the beginning of the year 54,315 33,676
Income statement – pre exceptional charge (note 11) 10,994 12,740
Income statement – exceptional charge 558 12,512
Deferred tax (credit)/charge to other comprehensive income (note 22) (2,267) 503
Deferred tax charge/(credit) on actuarial gain/loss (note 24) 1,250 (2,684)
Exchange differences 3,728 (2,432)
At the end of the year 68,578 54,315
The movement in deferred tax liabilities and assets during the year, without taking into consideration the offsetting of balances withinthe same tax jurisdiction, is as follows:
Deferred tax liabilities Acceleratedtax
depreciation€'000
Fair valuegains€'000
IP anddeferred
developmentcosts€'000
Other€'000
Total€'000
At 3 January 2009 25,686 2,969 23,780 6,621 59,056
Charged/(credited) to income statement 9,271 – (831) 100 8,540
Charged to other comprehensive income (note 22) – 503 – – 503
Exchange differences (787) – (765) (210) (1,762)
At 2 January 2010 34,170 3,472 22,184 6,511 66,337
Charged/(credited) to income statement 2,163 – (1,336) 7,172 7,999
(Credited) to other comprehensive income (note 22) – (2,267) – – (2,267)
Exchange differences 1,822 – 1,657 418 3,897
At 1 January 2011 38,155 1,205 22,505 14,101 75,966
Deferred tax on intellectual property (IP) of €21.2 million, previously shown in ‘Other’, is now included with deferred developmentcosts within ‘IP and deferred development costs’.

125 GLANBIA PLC
ANNUAL REPORT 2010
FINANCIAL STATEMENTS
Deferred tax assets Retirementobligations
€'000
Taxlosses€'000
Total€'000
At 3 January 2009 (17,087) (8,293) (25,380)
Charged to income statement 13,684 3,028 16,712
(Credited) to other comprehensive income (note 24) (2,684) – (2,684)
Exchange differences – (670) (670)
At 2 January 2010 (6,087) (5,935) (12,022)
Charged to income statement 1,300 2,253 3,553
Charged to other comprehensive income (note 24) 1,250 – 1,250
Exchange differences 2 (171) (169)
At 1 January 2011 (3,535) (3,853) (7,388)
The deferred tax credited to other comprehensive income during the year is as follows:
2010€'000
2009€'000
Available for sale financial assets (note 22) (1,345) (485)
Hedging reserve (note 22) (922) 988
Impact of decrease/(increase) in retirement benefit obligations due to actuarial gain/loss (note 24) 1,250 (2,684)
(1,017) (2,181)
The decrease in the retirement benefit obligation has given rise to a decrease in the related deferred tax asset. A deferred tax assethas been recognised on the basis that the realisation of the related tax benefit through future taxable profits is probable.
Deferred tax assets are recognised for tax losses carried forward to the extent that realisation of the related tax benefit through futuretaxable profits is probable. The Group has tax losses of €72.6 million (2009: €14.8 million) to carry forward against future taxable incomeon which a deferred tax asset has not been recognised. Deferred tax liabilities have not been recognised for withholding tax and othertaxes that would be payable on the unremitted earnings of certain subsidiaries, associates and joint ventures.

126 GLANBIA PLC
ANNUAL REPORT 2010
FINANCIAL STATEMENTS
28. Retirement benefit obligationsPension benefitsThe Group operates a number of defined benefit and defined contribution schemes which provide retirement and death benefits forthe majority of employees. The schemes are funded through separate Trustee controlled funds.
The contributions paid to the defined benefit schemes are in accordance with the advice of professionally qualified actuaries. The latestactuarial valuation reports for these schemes, which are not available for public inspection, are dated between 1 January 2008 and 1January 2010. The contributions paid to the scheme in 2010 are in accordance with the contribution rates recommended in the actuarialvaluation reports.
The discount rate applied to the UK pension schemes changed from Merrill Lynch AA Bonds in 2009 to Towers Watson Global Rate:Link Model in 2010. This decreased the pension liability at year end by approximately €1.8 million. The inflation rate applied to the UKpension scheme changed from the Consumer Price Index for both schemes in 2009 to the Consumer Price Index and Retail Price Indexin 2010, depending on the rules of the scheme. This decreased the pension liability at year end by approximately €2.6 million.
The amounts recognised in the statement of financial position are determined as follows:
2010€'000
2009€'000
Present value of funded obligations (437,911) (435,010)
Fair value of plan assets 389,351 349,245
Liability in the Group statement of financial position (48,560) (85,765)
The amounts recognised in the Group income statement are as follows:
2010€'000
2009€'000
Defined benefit pension schemes
– Service costs – current (4,803) (5,515)
– Interest costs (24,153) (23,635)
– Expected return on plan assets 21,888 16,383
Total expense pre curtailment gains and negative past service costs (7,068) (12,767)
Exceptional item – curtailment gains and negative past service cost (note 7 and note 8) 10,238 100,098
Total gain 3,170 87,331
Defined contribution pension schemes (2,750) (2,146)
The actual return on plan assets was a profit of €29.8 million (2009: €28.7 million).
The movement in the liability recognised in the Group statement of financial position over the year is as follows:
2010€'000
2009€'000
At the beginning of the year (85,765) (164,410)
Exchange differences (972) (1,821)
Movements relating to disposed operations (38) (1,280)
Total expense pre curtailment gains and negative past service costs (7,068) (12,767)
Curtailment gains and negative past service costs 10,238 100,098
Actuarial gain/(loss) on defined benefit schemes 13,379 (31,215)
Contributions paid by employer 21,666 25,630
At the end of the year (48,560) (85,765)

127 GLANBIA PLC
ANNUAL REPORT 2010
FINANCIAL STATEMENTS
The movement in obligations during the year is as follows:
2010€'000
2009€'000
At the beginning of the year (435,010) (465,909)
Exchange differences (2,431) (4,800)
Movements relating to disposed operations (38) (4,131)
Current service costs (4,803) (5,515)
Interest costs (24,153) (23,635)
Actuarial gains/(losses)
– Experience gains 8,442 5,366
– Change in assumptions (2,992) (48,895)
Contributions by plan participants (2,963) (3,796)
Curtailment gains and negative past service costs 10,238 100,098
Benefits paid 15,799 16,207
At the end of the year (437,911) (435,010)
The movement in the fair value of plan assets over the year is as follows:
2010€'000
2009€'000
At the beginning of the year 349,245 301,499
Exchange differences 1,459 2,979
Movements relating to disposed operations – 2,851
Expected return on plan assets 21,888 16,383
Actuarial gain 7,929 12,314
Contributions by plan participants 2,963 3,796
Contributions paid by employer 21,666 25,630
Benefits paid (15,799) (16,207)
At the end of the year 389,351 349,245
The principal actuarial assumptions used were as follows:
2010IRL
2010UK
2009IRL
2009UK
Discount rate 5.40% 5.45%–5.50% 5.65% 5.80%
Expected return on plan assets
– Equities 7.70% 8.20% 7.75% 8.25%
– Corporate bonds 4.90% 5.45% 5.80% 5.80%
– Government bonds and gilts 4.40% 4.20% 4.45% 4.50%
– Cash 2.00% 3.70% 2.50% 4.10%
– Property 6.50% 7.70% 6.50% 8.00%
– Other assets 7.70% n/a 7.75% n/a
Inflation rate* 2.00% 2.75%–3.45% 2.25% 3.45%
Future salary increases* 3.00% 4.20% 2.25%–3.25% 4.20%
Future pension increases 2.75%–3.45% 3.25% 0%–3.50% 3.25%
Cumulative actuarial losses:2010€'000
2009€'000
Actuarial (gain)/loss for the year (13,379) 31,215
Cumulative actuarial losses 141,827 155,206
* The Irish inflation rate and future salary increase assumptions have been decreased for the next three years by 1% to reflect the current economic conditions in Ireland. The rates set out above are the longer term assumptions.

128 GLANBIA PLC
ANNUAL REPORT 2010
FINANCIAL STATEMENTS
Plan assets are comprised as follows:
2010€'000
2010%
2009€'000
2009%
Equities 218,484 56 177,273 50
Corporate bonds 33,664 9 34,522 10
Government bonds and gilts 90,341 23 86,426 25
Property 20,456 5 20,638 6
Cash 26,406 7 30,386 9
389,351 100 349,245 100
The expected return on plan assets was determined by considering the expected returns available on the assets underlying the currentinvestment policies. Expected yields on fixed interest investments are based on gross redemption yields at the reporting date.Expected returns on equity and property investments reflect long-term real rates of return experienced in the respective markets.
Following a detailed review of the Group’s schedule of contributions during the year, contributions to post-employment benefit plansare expected to be €20.4 million in 2011 (2010: €20.0 million).
Mortality rates
Assumptions regarding future mortality experience are set based on actuarial advice in accordance with published statistics andexperience in each territory.
The mortality assumptions imply the following life expectancies in years of an active member on retiring at age 65, 20 years from now:
2010Irish
mortalityrates
2010UK
mortalityrates
2009Irish
mortalityrates
2009UK
mortalityrates
Male 21.5 23.9 21.5 24.8
Female 24.2 27.0 24.2 27.4
The mortality assumptions imply the following life expectancies in years of an active member, aged 65, retiring now:
2010Irish
mortalityrates
2010UK
mortalityrates
2009Irish
mortalityrates
2009UK
mortalityrates
Male 19.2 21.8 19.2 23.0
Female 21.9 24.9 21.9 25.8
Five year summary 2010€'000
2009€'000
2008€'000
2007€'000
2006€'000
At the end of the year
Fair value of plan assets 389,351 349,245 301,499 382,521 376,585
Present value of funded obligations (437,911) (435,010) (465,909) (496,769) (501,473)
Deficit (48,560) (85,765) (164,410) (114,248) (124,888)
Experience adjustments on plan liabilities 8,442 5,366 (3,175) (7,160) (12,651)
Experience adjustments on plan assets 7,929 12,314 (104,229) (32,542) 11,575

129 GLANBIA PLC
ANNUAL REPORT 2010
FINANCIAL STATEMENTS
Sensitivity analysis for principal assumptions used to measure scheme liabilitiesThere are inherent uncertainties surrounding the financial assumptions adopted in calculating the actuarial valuation of the Group’sdefined benefit pension schemes. The following table analyses, for the Group’s Irish and UK pension schemes, the estimated impact onthe plan liabilities resulting from changes to key actuarial assumptions, whilst holding all other assumptions constant.
2010
Assumption Change in assumption Impact on Irish plan liabilities Impact on UK plan liabilities
Discount rate Increase/decrease 0.25% Decrease/increase by 3.7% Decrease/increase by (4.1%)/4.4%
Price inflation Increase/decrease 0.25% Increase/decrease by 1.6% Increase/decrease by 3.0%/(2.9%)
Mortality Increase/decrease by one year Increase/decrease by 2.2% Increase/decrease by 3.1%
2009
Assumption Change in assumption Impact on Irish plan liabilities Impact on UK plan liabilities
Discount rate Increase/decrease 0.25% Decrease/increase by 3.8% Decrease/increase by 4.7%
Price inflation Increase/decrease 0.25% Increase/decrease by 1.4% Increase/decrease by 3.1%
Mortality Increase/decrease by one year Increase/decrease by 3.8% Increase/decrease by 2.1%
29. Provisions for other liabilities and charges
(a) The restructuring provision relates mainly to the rationalisation programme Glanbia is currently undertaking. The provision whichrelates mainly to redundancy is expected to be fully utilised during 2011.
(b) The UK pension provision relates to administration and certain costs associated with pension schemes relating to businessesdisposed of in prior years. This provision is expected to be fully utilised over the next 33 years.
(c) Included in ‘Other’ above are provisions in respect of property lease commitments, deferred consideration in respect of recentacquisitions, insurance and certain legal claims pending against the Group. It is expected that €9.4 million of this provision will beutilised during 2011, with the balance being utilised over a further five year period. Due to the nature of these items, there is someuncertainty around the amount and timing of payments.
Restructuring€'000
UK pension€'000
Other€'000
Total€'000
note (a) note (b) note (c)
At 2 January 2010 20,356 20,086 7,002 47,444
Provided in the year 400 – 7,140 7,540
Utilised in the year (9,828) (1,124) (1,645) (12,597)
Exchange differences – 637 381 1,018
Unwinding of discounts – 121 (29) 92
Reclassifications (457) – 457 –
At 1 January 2011 10,471 19,720 13,306 43,497
Non-current – 18,484 3,908 22,392
Current 10,471 1,236 9,398 21,105
10,471 19,720 13,306 43,497

130 GLANBIA PLC
ANNUAL REPORT 2010
FINANCIAL STATEMENTS
31. Trade and other payables
2010Company
€'000
2010Group€'000
2009Company
€'000
2009Group€'000
Trade payables 66 128,645 14 113,002
Amounts due to Joint Ventures & Associates (note 37) – 30,059 – 31,095
Amounts due to other related parties (note 37) – 235 – 510
Amounts due to other Group companies 104,682 – – –
Social security costs – 3,262 – 3,153
Accrued expenses 2,522 176,372 2,767 116,273
Other payables – 27,673 – 31,448
107,270 366,246 2,781 295,481
The carrying value of payables is a reasonable approximation of fair value.
32. Derivative financial instruments
2010Assets€'000
2010Liabilities
€'000
2009Assets€'000
2009Liabilities
€'000
Non-hedging instruments – (77) – –
Interest rate swaps – cash flow hedges – (8,076) – (11,057)Interest rate swaps – fair value hedges 3,975 – 5,848 (1,606)Forward foreign exchange contracts – cash flow hedges 590 (600) 2,085 (3,041)Commodity futures – cash flow hedges 267 (326) 1,933 (189)Commodity futures – fair value hedges 723 (723) 353 (353)
Total 5,555 (9,802) 10,219 (16,246)
Less non-current portion:Interest rate swaps – cash flow hedges – (3,315) – (5,631)Interest rate swaps – fair value hedges 1,643 – 2,718 –
Non-current portion 1,643 (3,315) 2,718 (5,631)
Current portion 3,912 (6,487) 7,501 (10,615)
2010€'000
2009€'000
At 2 January 2010 18,582 12,694
Receivable for the year 1,440 7,114
Exchange differences 6 11
Released to income statement (1,419) (1,237)
At 1 January 2011 18,609 18,582
30. Capital grants
131 GLANBIA PLC
ANNUAL REPORT 2010
FINANCIAL STATEMENTS
Interest rate swapsThe notional principal amounts of the outstanding interest rate swap contracts, qualifying as cash flow hedges at 1 January 2011 were€148.5 million (2009: €236.2 million).
The notional principal amounts of the outstanding interest rate swap contracts, qualifying as fair value hedges at 1 January 2011 were€100.0 million (2009: €265.1 million).
At 1 January 2011, the fixed interest rates vary from 3.79% to 4.94% (2009: 3.665% to 4.94%) and the main floating rates are set inadvance by reference to inter-bank interest rates 1.143% EURIBOR, 0.45631% $LIBOR (2009: 1.153% EURIBOR, 0.45575% $LIBOR).
Gains and losses recognised in the hedging reserve in other comprehensive income on interest rate swap contracts at 1 January 2011will be continuously released to the income statement until repayment of the bank borrowings.
Foreign exchange contractsThe notional principal amounts of the outstanding foreign exchange contracts at 1 January 2011 are €51.7 million (2009: €225.9 million).
Gains and losses recognised in the hedging reserve in other comprehensive income on foreign exchange contracts at 1 January 2011will be released to the income statement at various dates within one year from the reporting date.
Commodity futuresThe notional principal amounts of the outstanding commodity (milk, gas, oil and propane) futures, qualifying as cash flow hedges andfair value hedges at 1 January 2011 were €4.2 million and €61.4 million respectively (2009: €6.4 million and €36.8 million). Gains andlosses recognised in the hedging reserve in other comprehensive income on these futures as at 1 January 2011 will be released to theincome statement at various dates within one year from the reporting date.
Financial guarantee contractsIn accordance with Group accounting policy, management has reviewed the fair values associated with financial guarantee contracts, asdefined within IAS 39 – Financial Instruments: Recognition and Measurement, issued in the name of Glanbia plc (the Company) and hasdetermined that their value is not significant. No adjustment has been made to the Glanbia plc company statement of financial positionto reflect fair value of the financial guarantee contracts issued in its name.
33. Contingent liabilitiesCompanyThe Company has guaranteed the liabilities of certain subsidiaries in Ireland in respect of any losses or liabilities (as defined in section5(c) of the Companies (Amendment) Act, 1986) for the year ended 1 January 2011 and the Directors are of the opinion that no losseswill arise thereon. These subsidiaries avail of the exemption from the filing of audited financial statements, as permitted by section 17of the Companies (Amendment) Act, 1986.
The Group recognises a defined benefit liability and incurs administration and certain other costs in relation to its UK pension schemesfor businesses disposed of in prior years, as outlined in note 28 and note 29. In addition, the Company has guaranteed the payment ofa proportion of employer contributions in respect of these UK pension schemes. The Company considers these guarantees to beinsurance contracts and accounts for them as such. The Company treats the guarantee contract as a contingent liability until such timeas it becomes probable that the Company will be required to make a payment under the guarantee.
GroupBank guarantees amounting to €7.1 million (2009: €10.5 million) are outstanding as at 1 January 2011, mainly in respect of payment ofEU subsidies. The Group does not expect any material loss to arise from these guarantees. The Group has contingent liabilities inrespect of legal claims arising in the ordinary course of business. It is not anticipated that any material liability will arise from thesecontingent liabilities other than those provided for.
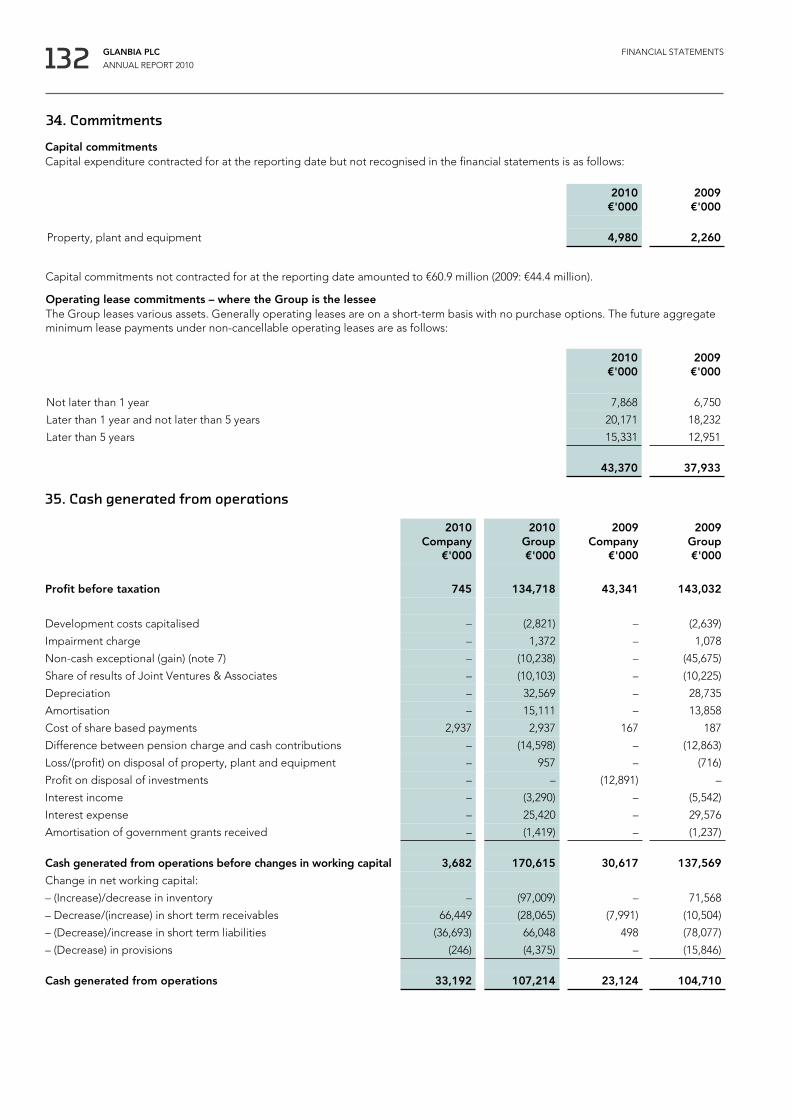
132 GLANBIA PLC
ANNUAL REPORT 2010
FINANCIAL STATEMENTS
35. Cash generated from operations
2010Company
€'000
2010Group€'000
2009Company
€'000
2009Group€'000
Profit before taxation 745 134,718 43,341 143,032
Development costs capitalised – (2,821) – (2,639)
Impairment charge – 1,372 – 1,078
Non-cash exceptional (gain) (note 7) – (10,238) – (45,675)
Share of results of Joint Ventures & Associates – (10,103) – (10,225)
Depreciation – 32,569 – 28,735
Amortisation – 15,111 – 13,858
Cost of share based payments 2,937 2,937 167 187
Difference between pension charge and cash contributions – (14,598) – (12,863)
Loss/(profit) on disposal of property, plant and equipment – 957 – (716)
Profit on disposal of investments – – (12,891) –
Interest income – (3,290) – (5,542)
Interest expense – 25,420 – 29,576
Amortisation of government grants received – (1,419) – (1,237)
Cash generated from operations before changes in working capital 3,682 170,615 30,617 137,569
Change in net working capital:
– (Increase)/decrease in inventory – (97,009) – 71,568
– Decrease/(increase) in short term receivables 66,449 (28,065) (7,991) (10,504)
– (Decrease)/increase in short term liabilities (36,693) 66,048 498 (78,077)
– (Decrease) in provisions (246) (4,375) – (15,846)
Cash generated from operations 33,192 107,214 23,124 104,710
2010€'000
2009€'000
Property, plant and equipment 4,980 2,260
Capital commitments not contracted for at the reporting date amounted to €60.9 million (2009: €44.4 million).
Operating lease commitments – where the Group is the lesseeThe Group leases various assets. Generally operating leases are on a short-term basis with no purchase options. The future aggregateminimum lease payments under non-cancellable operating leases are as follows:
2010€'000
2009€'000
Not later than 1 year 7,868 6,750
Later than 1 year and not later than 5 years 20,171 18,232
Later than 5 years 15,331 12,951
43,370 37,933
34. Commitments
Capital commitmentsCapital expenditure contracted for at the reporting date but not recognised in the financial statements is as follows:

133 GLANBIA PLC
ANNUAL REPORT 2010
FINANCIAL STATEMENTS
36. Business combinationsOn 19 January 2011 the Group acquired the business and assets of a leading US based performance nutrition business – Bio-EngineeredSupplements and Nutrition (“BSN”). BSN is a leading developer, provider and distributor of nutritional products designed for health,physique development and training.
Details of net assets acquired and goodwill arising from the acquisition is as follows:
€'000
Purchase consideration – cash paid 107,696
Less: Fair value of assets acquired 90,271
Goodwill 17,425
Fairvalue€'000
Property, plant and equipment 1,700
Other intangible assets 83,614
Inventories 9,666
Receivables 7,523
Payables (12,232)
Fair value of assets acquired 90,271
The fair value of assets and liabilities arising from the acquisition is as follows:
Acquisition related costs included in administration expenses in the Group’s consolidated income statement for the year ended1 January 2011 amounted to €0.6 million.
The fair values assigned to identifiable assets and liabilities have been determined provisionally due to the proximity of the acquisitiondate to the approval of the Annual Report. Any adjustments to these provisional valuations will be recognised within 12 months of theacquisition date.
The acquisition of BSN significantly enhances the Group’s Performance Nutrition portfolio and delivers further growth opportunities inthis area. The goodwill is attributable to the profitability and development opportunities through combined R&D and the benefitsassociated with the extension of Glanbia's scale and specific capabilities to the acquired business.

134 GLANBIA PLC
ANNUAL REPORT 2010
FINANCIAL STATEMENTS
37. Related party transactionsThe Group is controlled by Glanbia Co-operative Society Limited (‘the Society’), which holds 54.5% of the issued share capital of theCompany and is the ultimate parent of the Group.
The following transactions were carried out with related parties:
(a) Sales of goods and services
2010Company
€'000
2010Group€'000
2009Company
€'000
2009Group€'000
Sales of goods:– Associates – 2,498 – 5,497– Joint ventures – 64,077 – 52,613– Key management* – 791 – 659
– 67,366 – 58,769
Sales of services:– The Society – 336 – 395– Associates – 17 – 18– Joint ventures – 11,977 – 7,503– Subsidiaries 16,068 – 11,241 –
16,068 12,330 11,241 7,916
Sales to related parties were carried out under normal commercial terms and conditions.
(b) Purchases of goods and services
2010Company
€'000
2010Group€'000
2009Company
€'000
2009Group€'000
Purchases of goods:– Associates – 9,721 – 10,431– Joint ventures – 3,090 – 3,339– Key management* – 2,083 – 1,737
– 14,894 – 15,507
Purchases of services:– The Society – 290 – 290– Associates – 2,174 – 1,660– Joint ventures – 8 – 19– Subsidiaries 2,086 – 1,996 –
2,086 2,472 1,996 1,969
Purchases from related parties were carried out under normal commercial terms and conditions.
(c) Key management compensation1
2010Company
€'000
2010Group€'000
2009Company
€'000
2009Group€'000
Salaries and other short-term employee benefits – 3,671 – 2,041Post-employment benefits – 354 – 376Share based payments – 2,004 – 114
– 6,029 – 2,531
1 Key management compensation includes the Glanbia Operating Executive Committee.

135 GLANBIA PLC
ANNUAL REPORT 2010
FINANCIAL STATEMENTS
(d) Year-end balances arising from sales/purchases of goods/services
2010Company
€'000
2010Group€'000
2009Company
€'000
2009Group€'000
Receivables from related parties:
– The Society – 682 – 502
– Associates – 118 – 509
– Joint ventures – 6,764 – 1,848
– Key management* – 207 – 134
– Subsidiaries – – 79,346 –
– 7,771 79,346 2,993
Payables to related parties:
– The Society – 31 – 360
– Associates – 1,972 – 2,822
– Joint ventures – 28,087 – 28,273
– Key management* – 204 – 150
– Subsidiaries 101,249 – – –
101,249 30,294 – 31,605
(e) Loans to joint ventures
2010Company
€'000
2010Group€'000
2009Company
€'000
2009Group€'000
Loan to Southwest Cheese Company, LLC – 7,484 – 28,313
Loan to Milk Ventures (UK) Limited – 5,576 – 5,405
– 13,060 – 33,718
* Purchases, sales and related year-end balances to key management refer to trading balances with Directors who are engagedin farming activities.
38. Events after the reporting periodOn 19 January 2011 the Group announced the acquisition of the business and assets of a leading US based performance nutritionbusiness – Bio-Engineered Supplements and Nutrition (“BSN”). For further details regarding this acquisition see note 36 – businesscombinations.
On 12 January 2011, the Group also acquired the business and assets of Kerry Group plc’s Limerick based liquid milk business subjectto regulatory approval.

136 GLANBIA PLC
ANNUAL REPORT 2010
FINANCIAL STATEMENTS
40. Principal subsidiary and associated undertakings(a) Subsidiaries
Incorporated and operating in Principal place of business Principal activities Group interest %
Ireland
Glanbia Foods Ireland Limited Ballyragget, Co. Kilkenny andCitywest, Dublin 24
Dairying, liquid milk, consumerfood products and general trading
100.00
Glanbia Consumer Foods Limited Inch, Co. Wexford and Kilkenny Fresh dairy products and soups 100.00
Glanbia Ingredients (Ballyragget) Limited Ballyragget, Co. Kilkenny Milk products 100.00
Glanbia Ingredients (Virginia) Limited Virginia, Co. Cavan Milk products 100.00
Glanbia Nutritionals (Ireland) Limited Kilkenny Nutritional products 100.00
Glanbia Nutritionals (Blending) Limited Kilkenny Nutritional products 100.00
ON Optimum Nutrition Limited Kilkenny Nutritional products 100.00
Glanbia Nutritionals (Europe) Limited Kilkenny Nutritional products 100.00
Glanbia Nutritionals (Research) Limited Kilkenny Research and development 100.00
Glanbia Feeds Limited Enniscorthy, Co. Wexford andPortlaoise, Co. Laois
Manufacture of animal feedproducts
100.00
Glanbia Estates Limited Kilkenny Property and land dealing 100.00
Avonmore Proteins Limited Kilkenny Financing 100.00
Glanbia Financial Services Kilkenny Financing 100.00
Glanbia Investments (Ireland) Limited Kilkenny Investment company 100.00
Glassonby Kilkenny Holding company 100.00
Waterford Foods plc Kilkenny Holding company 100.00
Grassland Fertilisers (Kilkenny) Limited Palmerstown, Co. Kilkenny Fertilisers 73.00
D. Walsh & Sons Limited Palmerstown, Co. Kilkenny Grain and fertilisers 60.00
Eilish Oils Limited Newtown Mount Kennedy,Co. Wicklow
Biofuels 80.00
39. ComparativesCertain comparatives in the statement of financial position have been restated to reflect the current year classifications as shown below:
Group aspreviously
reported2009€'000
Reclassified2009€’000
Grouprestated
2009€’000
Trade and other receivables – non current 33,718 16,837 50,555
Trade and other receivables – current 191,594 12,732 204,326
Trade and other payables – current (265,912) (29,569) (295,481)
Share capital and share premium (97,320) (1,899) (99,219)
Other reserves (110,571) 1,899 (108,672)

137 GLANBIA PLC
ANNUAL REPORT 2010
FINANCIAL STATEMENTS
Incorporated and operating in Principal place of business Principal activities Group Interest %
Britain and Northern Ireland
Glanbia (UK) Limited Victoria Square, Birmingham Holding company 100.00
Glanbia Holdings Limited Victoria Square, Birmingham Holding company 100.00
Glanbia Investments (UK) Limited Victoria Square, Birmingham Holding company 100.00
Glanbia Nutritionals (UK) Limited Middlesbrough Sports nutrition products 100.00
Glanbia Foods (NI) Limited Portadown, Co. Armagh Consumer food products 100.00
Glanbia Feedstuffs Limited Victoria Square, Birmingham Supply of animal feeds 100.00
Optimum Nutrition EMEA Limited London, England Sports nutrition products 100.00
United States
Glanbia, Inc. Delaware Holding company 100.00
Glanbia Foods, Inc. Twin Falls, Idaho Milk products 100.00
Optimum Nutrition, Inc. Illinois, South Carolina, Florida Sports nutrition products 100.00
Glanbia Nutritionals (NA), Inc. Carlsbad, California Nutrient delivery systems 100.00
Glanbia Nutritionals, Inc. Madison, Wisconsin Nutritional distribution 100.00
Canada
Glanbia Nutritionals (Canada), Inc. Angusville, Manitoba Nutrient delivery systems 100.00
Germany
Glanbia Nutritionals Deutschland GmbH Orsingen-Nensingen, Germany Nutrient delivery systems 100.00
Netherlands
Glanbia Foods B.V. Moergestel, Netherlands Holding company 100.00
Asia
Glanbia Nutritionals (Suzhou)Company Limited
Suzhou, China Nutrient delivery systems 100.00
GN Life Science (Shanghai) Co. Ltd Shanghai, China Nutrient ingredient trading 100.00
Glanbia Nutritionals Singapore Pte Ltd Singapore Customer service office 100.00
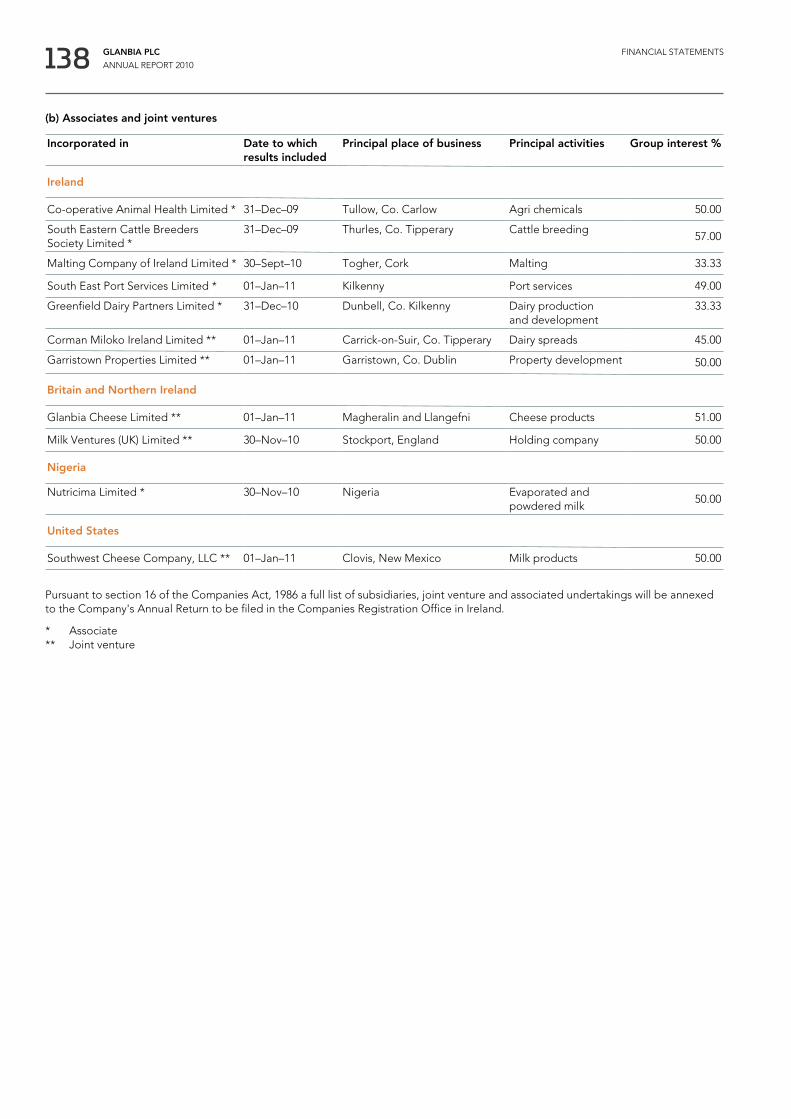
138 GLANBIA PLC
ANNUAL REPORT 2010
FINANCIAL STATEMENTS
(b) Associates and joint ventures
Incorporated in Date to whichresults included
Principal place of business Principal activities Group interest %
Ireland
Co-operative Animal Health Limited * 31–Dec–09 Tullow, Co. Carlow Agri chemicals 50.00
South Eastern Cattle BreedersSociety Limited *
31–Dec–09 Thurles, Co. Tipperary Cattle breeding57.00
Malting Company of Ireland Limited * 30–Sept–10 Togher, Cork Malting 33.33
South East Port Services Limited * 01–Jan–11 Kilkenny Port services 49.00
Greenfield Dairy Partners Limited * 31–Dec–10 Dunbell, Co. Kilkenny Dairy productionand development
33.33
Corman Miloko Ireland Limited ** 01–Jan–11 Carrick-on-Suir, Co. Tipperary Dairy spreads 45.00
Garristown Properties Limited ** 01–Jan–11 Garristown, Co. Dublin Property development 50.00
Britain and Northern Ireland
Glanbia Cheese Limited ** 01–Jan–11 Magheralin and Llangefni Cheese products 51.00
Milk Ventures (UK) Limited ** 30–Nov–10 Stockport, England Holding company 50.00
Nigeria
Nutricima Limited * 30–Nov–10 Nigeria Evaporated andpowdered milk
50.00
United States
Southwest Cheese Company, LLC ** 01–Jan–11 Clovis, New Mexico Milk products 50.00
Pursuant to section 16 of the Companies Act, 1986 a full list of subsidiaries, joint venture and associated undertakings will be annexedto the Company's Annual Return to be filed in the Companies Registration Office in Ireland.
* Associate** Joint venture

139 GLANBIA PLC
ANNUAL REPORT 2010
OTHER INFORMATION
Stock exchange listingsThe Company’s shares are listed on the main market of the IrishStock Exchange as well as having a premium listing on the mainmarket of the London Stock Exchange.
Managing your shareholdingComputershare Investor Services (Ireland) Limited(“Computershare”) maintains the Company’s register ofmembers. Should a shareholder have any queries in respectof their shareholding, they should contact Computersharedirectly using the contact details provided below:
Computershare Investor Services (Ireland) Limited, Heron House,Corrig Road, Sandyford Industrial Estate, Dublin 18, Ireland.
Contact details: telephone number 01 2475349 (within Ireland),00353 1 247 5349 (outside Ireland), or by logging on towww.investorcentre.com/ie/contactus.
Share capitalThe authorised share capital of the Company at 1 January 2011was 306,000,000 ordinary shares at €0.06 each. The issued sharecapital at 1 January 2011 was 293,835,684 ordinary shares of€0.06 each.
2010 2009
Share price data € €
Share price as at 1 January 2011 3.68 2.89
Market capitalisation 1,081m 848m
Share price movements during the year:
– high 3.68 3.00
– low 2.43 1.84
The current share price of Glanbia plc ordinary shares can beaccessed at http://www.glanbia.ie/prices-delayed
Employee share schemesThe Company operates a number of employee share schemes.At 1 January 2011, 485,304 ordinary shares were held in anemployee benefit trust for the purpose of the Group’s employeeshare schemes. Whilst any shares in the Company are held bythe Trustees, the Trustees shall refrain from exercising any votingrights which may attach to the shares save that if the beneficialinterest in any share has been vested in any beneficiary theTrustees shall seek and comply with any direction from suchbeneficiary as to the exercise of voting rights attaching tosuch shares.
Dividend payments direct to your bank accountAn interim dividend of 3.03 cents per share was paid in respectof ordinary shares on 29 September 2010.
Subject to shareholders approval, a final dividend of 4.49cents per share will be paid in respect of ordinary shares on20 May 2011 to shareholders on the register of members on8 April 2011. If a shareholder’s registered address is in the UK anda shareholder has not previously provided the company with amandate form for an Irish Euro account, a shareholder will defaultto a sterling payment. All other shareholders will default to a Europayment.
Dividend Withholding Tax (DWT) is deductible from dividendspaid by an Irish resident company, unless the shareholder isentitled to an exemption and has submitted a properlycompleted exemption form to the Company's Registrars,Computershare. DWT applies to dividends paid by way of cashand is deducted at the standard rate of income tax (currently20%). Non-resident shareholders and certain Irish companies,trusts, pension schemes, investment undertakings and charitiesmay be entitled to claim exemption from DWT and are therebyrequired to send the relevant form to Computershare. Copies ofthis form may be obtained from Computershare.
In order to continue to improve the security of dividend paymentsto shareholders and reduce costs, the Company proposes, to payfuture dividend payments on its ordinary shares only by credittransfer into a nominated bank or building society account.
Shareholders will continue to receive tax vouchers in respect ofdividend payments. The Company takes data security issues veryseriously. Required bank account details supplied to theCompany and its Registrars will be used only for dividenddistribution and the information will not be used for any purposeor supplied to any third party.
Shareholders’ information
Shareholder No. ofordinary shares
% of issuedshare capital
Glanbia Co-operativeSociety Limited 160,277,308 54.5%
Substantial shareholdingsThe table below details the significant holding (3% or more) inthe Company’s ordinary share capital that has been disclosed tothe Company at 1 March 2011 in accordance with therequirements of Rule 7.1 of the Transparency Rules issued by theFinancial Regulator under section 22 of the Investment Funds,Companies and Miscellaneous Provisions Act, 2006.

140 GLANBIA PLC
ANNUAL REPORT 2010
OTHER INFORMATION
www.glanbia.comShareholders may visit www.glanbia.ie/shareholder-centre for up-to-date investor information. An electronic copy of current andpast annual and half-yearly reports can be downloaded from thewebsite. Current and historic share prices, news, updates andpresentations may also be obtained. Shareholders may alsoregister to receive future shareholder communicationselectronically.
Electronic communicationsThe changes brought about by the Transparency (Directive2004/109/EC) Regulations 2007 recognises the growingimportance of electronic communications. The Group thereforeprovides documentation and communications to all shareholdersvia our website unless a shareholder has specifically elected toreceive a hard copy.
Using electronic communications enables fast receipt ofdocuments, helps the environment by significantly reducing theamount of paper used to communicate with shareholders andreduces associated printing, mailing and distribution costs.
Shareholders can also vote online for the next Annual GeneralMeeting (“AGM”). This is a quick and easy option, using the proxyvoting service provided by Computershare. Shareholders may usethis facility by visiting www.eproxyappointment.com.
Financial calendar
AGMThe AGM will be held on 11 May 2011.
The Notice of Meeting, together with details of the business to beconducted at the Meeting is available on www.glanbia.ie/agm
The voting results for the 2011 AGM, including proxy votes andvotes withheld will be available on our website shortly after themeeting at the following address: www.glanbia.ie/agm
Conditions for participating in a meetingEvery shareholder, irrespective of how many Glanbia shares theyhold has the right to attend, speak, ask questions and vote at theAGM. Completion of proxy form will not affect a shareholder’sright to attend, speak, ask questions and/or vote at the meetingin person.
The quorum for a general meeting of the Company is constitutedby three persons entitled to vote upon the business of themeeting, each being a shareholder or a proxy or corporaterepresentative for a shareholder.
The right to participate in the AGM is subject to the registration ofthe shares prior to the date of the meeting (the record date). Forthe 2011 AGM the record date is 5:00 pm on 09 May 2011 (or inthe case of an adjournment 5:00 pm, on the day prior to the daybefore the time fixed for the adjourned meeting).
Appointment of proxyWhere a shareholder is unable to attend the AGM in person,a proxy (or proxies) may be appointed to attend, speak, askquestions and vote on their behalf. For this purpose a form ofproxy is posted to all shareholders. Copies of these documentsmay be requested by telephoning the Company’s Registrar on01 2475349 (within Ireland), 00353 1 247 5349 (outside Ireland),or by logging on to www.investorcentre.com/ie/contactus orby writing to the Group Secretary at Glanbia plc, GlanbiaHouse, Kilkenny.
Alternatively, a shareholder may appoint a proxy electronically,by visiting www.eproxyappointment.com and submitting theirproxy details. They will be asked to enter the Control Number, theShareholder Reference Number (SRN) and PIN and agree tocertain terms and conditions. The Control Number, theshareholder Reference Number (SRN) and the PIN can be foundon the top of the form of proxy.
CREST members who wish to appoint a proxy or proxies throughthe CREST electronic proxy appointment service may do so for theMeeting and any adjournment(s) thereof by using the proceduresdescribed in the CREST manual.
How to exercise shareholders rightsShareholders have several ways to exercise their right to vote:
� by attending the AGM in person;
� by appointing the Chairman or another person as a proxy tovote on their behalf; or
� by appointing a proxy via the CREST system.
The passing of resolutions at a meeting of the Company, otherthan special resolutions, requires a simple majority. To be passed,a special resolution requires at least 75% of the votes cast to be infavour of the resolution.
Tabling agenda itemsA shareholder, or a group of shareholders acting together, whohold at least 3% of the issued share capital of the Company, has theright to put an item on the agenda of the AGM. In order to exercisethis right, written details of the item to be included on the 2011AGM agenda together with a written explanation why the item is tobe included on the agenda and evidence of the shareholding mustbe received by the Group Secretary at Glanbia plc, Glanbia House,Kilkenny, Ireland or by email to [email protected] /[email protected] nolater than 29 March 2011 (i.e. 42 days before the AGM meeting).An item cannot be included on the AGM agenda unless it isaccompanied by the written explanation and received at either ofthese addresses by this deadline.
Tabling draft resolutionsA shareholder, or a group of shareholders acting together, whohold at least 3% of the issued share capital of the Company, hasthe right to table a draft resolution for inclusion on the agenda ofthe 2011 AGM subject to any contrary provision in company law.
In order to exercise this right, the text of the draft resolutionand evidence of shareholding must be received by no later than29 March 2011 (i.e. 42 days before the AGM meeting) by post tothe Group Secretary at Glanbia plc, Glanbia House, Kilkenny,Ireland or by email to [email protected] /[email protected]. A resolutioncannot be included on the 2011 AGM agenda unless it is receivedat either of these addresses by this deadline. Furthermore,shareholders are reminded that there are provisions in companylaw which impose other conditions on the right of shareholders topropose resolutions at the general meeting of a company.
Announcement of final results for 2010 02 March 2011
Ex-dividend date 06 April 2011
Record date for dividend 08 April 2011
Date for receipt of proxy forms 09 May 2011
Record date for AGM 09 May 2011
AGM 11 May 2011
Dividend payment date 20 May 2011
141 GLANBIA PLC
ANNUAL REPORT 2010
OTHER INFORMATION
How to ask a question before or at the meetingThe AGM is an opportunity for shareholders to put a question tothe Chairman during the question and answer session. Before the2011 AGM, a shareholder may also submit a question in writing bysending a letter, and evidence of your shareholding at least fourbusiness days before the 2011 AGM (i.e. 5 May 2011) to the GroupSecretary, Glanbia plc, Glanbia House, Kilkenny, Ireland or byemail to [email protected] /[email protected].
Advisors:AuditorsPricewaterhouseCoopers, Ballycar House, Newtown,Waterford, Ireland.
Principal bankersThe Royal Bank of Scotland N.V., Allied Irish Banks, p.l.c., TheGovernor & Company of the Bank of Ireland, BNP Paribas S.A.,Barclays Bank Ireland plc, Citibank Europe plc, KBC Bank Irelandplc, Danske Bank A/S trading as National Irish Bank, RabobankIreland plc, Ulster Bank Ireland Limited.
SolicitorsArthur Cox, Earlsfort Centre, Earlsfort Terrace, Dublin 2, Ireland.
Pinsent Masons, 3 Colmore Circus, Birmingham B4 6BH, UK.
StockbrokersDavy Stockbrokers, 49 Dawson Street, Dublin 2, Ireland (jointbroker).
RBS Hoare Govett Limited, 250 Bishopsgate, London EC2M 4AA(joint broker).
Additional shareholder informationDividend rightsThe Company may, by ordinary resolution declare dividends inaccordance with the respective rights of shareholders, but nodividend shall exceed the amount recommended by the Directors.The Directors may also declare and pay interim dividends if itappears to them that they are justified by the profits of theCompany available for distribution.
Distribution on winding upIf the Company shall be wound up and the assets available fordistribution among shareholders shall be insufficient to repay thewhole of the paid up or credited as paid up share capital, suchassets shall be distributed so that, as nearly as may be, the lossesshall be borne by shareholders in proportion to the capital paid upor credited as paid up at the commencement of the winding up onthe shares held by them respectively. Further if, in a winding up,the assets available for distribution among shareholders shall bemore than sufficient to repay the whole of the share capital paid upor credited as paid up at the commencement of the winding up,the excess shall be distributed among shareholders in proportionto the capital at the commencement of the winding up paid up orcredited as paid up on the said shares held by them respectively.
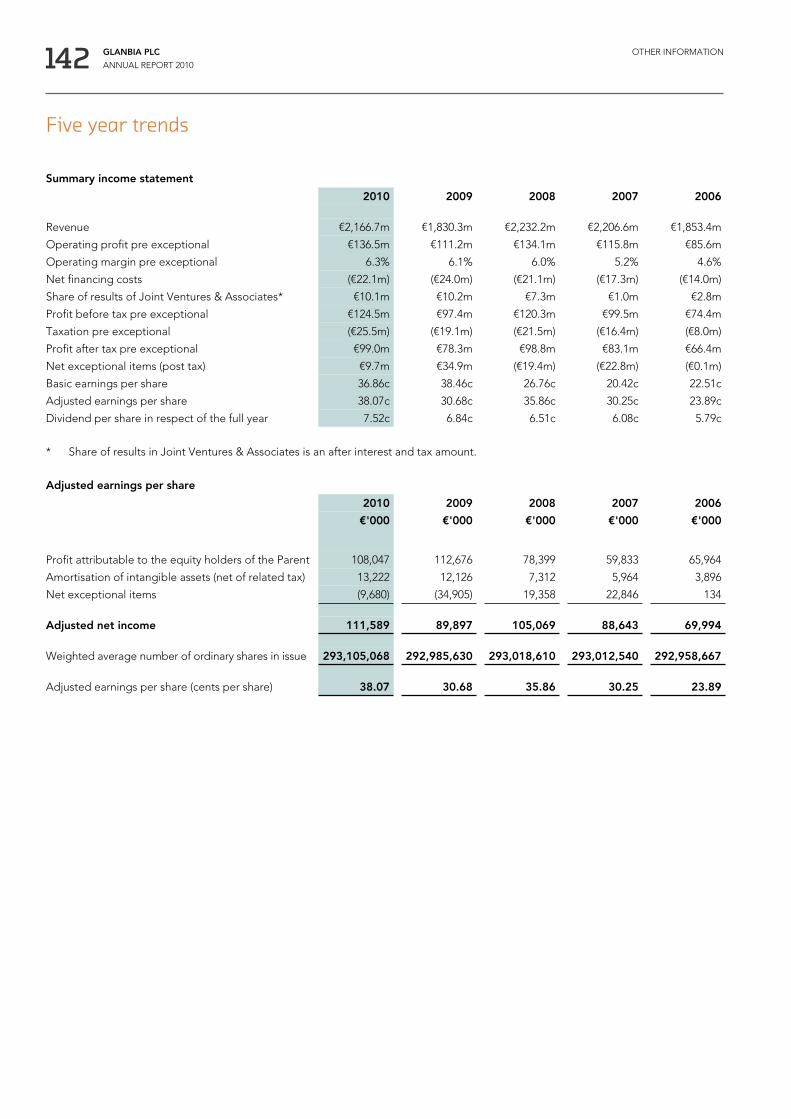
142 GLANBIA PLC
ANNUAL REPORT 2010
OTHER INFORMATION
Summary income statement
2010 2009 2008 2007 2006
Revenue €2,166.7m €1,830.3m €2,232.2m €2,206.6m €1,853.4m
Operating profit pre exceptional €136.5m €111.2m €134.1m €115.8m €85.6m
Operating margin pre exceptional 6.3% 6.1% 6.0% 5.2% 4.6%
Net financing costs (€22.1m) (€24.0m) (€21.1m) (€17.3m) (€14.0m)
Share of results of Joint Ventures & Associates* €10.1m €10.2m €7.3m €1.0m €2.8m
Profit before tax pre exceptional €124.5m €97.4m €120.3m €99.5m €74.4m
Taxation pre exceptional (€25.5m) (€19.1m) (€21.5m) (€16.4m) (€8.0m)
Profit after tax pre exceptional €99.0m €78.3m €98.8m €83.1m €66.4m
Net exceptional items (post tax) €9.7m €34.9m (€19.4m) (€22.8m) (€0.1m)
Basic earnings per share 36.86c 38.46c 26.76c 20.42c 22.51c
Adjusted earnings per share 38.07c 30.68c 35.86c 30.25c 23.89c
Dividend per share in respect of the full year 7.52c 6.84c 6.51c 6.08c 5.79c
* Share of results in Joint Ventures & Associates is an after interest and tax amount.
Adjusted earnings per share
2010 2009 2008 2007 2006
€'000 €'000 €'000 €'000 €'000
Profit attributable to the equity holders of the Parent 108,047 112,676 78,399 59,833 65,964
Amortisation of intangible assets (net of related tax) 13,222 12,126 7,312 5,964 3,896
Net exceptional items (9,680) (34,905) 19,358 22,846 134
Adjusted net income 111,589 89,897 105,069 88,643 69,994
Weighted average number of ordinary shares in issue 293,105,068 292,985,630 293,018,610 293,012,540 292,958,667
Adjusted earnings per share (cents per share) 38.07 30.68 35.86 30.25 23.89
Five year trends

GLANBIA PLC
ANNUAL REPORT 2010 143 INDEX
Index
AApplying the principles of the Combined Code 48Audit Committee report 57Available for sale financial assets 112
BBoard of Directors and senior management 44Borrowings 122Business combinations 133
CCapital grants 130Cash and cash equivalents 115Cash generated from operations 132Chairman’s introduction to corporate governance 42Chairman’s statement 12Commitments 132Company statement of changes in equity 82Company statement of comprehensive income and statement of cash flows 83Company statement of financial position 81Comparatives 136Contingent liabilities 131Critical accounting estimates and judgements 95
DDairy Ireland – business model 21Dairy Ireland – divisional performance 38Deferred income taxes 124Derivative financial instruments 130Directors’ remuneration 103Dividends 106
EEarnings per share 105Employee benefit expense 103Events after the reporting date 135Exceptional items 102
FFinance income and costs 103Financial risk management 90Financial statements contents 73Five year trends 142
GGeneral information 84Group Finance Director’s review 22Group income statement 76Group Managing Director’s review 16 Group statement of cash flows 80Group statement of changes in equity 78Group statement of comprehensive income 77Group statement of financial position 79
HHow we are structured 9How we did in 2010 3
IIncome taxes 104Independent auditors’ report 74Intangible assets 107Inventories 115Investments in associates 110Investments in joint ventures 111
JJoint Ventures & Associates – divisional performance 40
KKey Performance Indicators (KPIs) 5
NNomination Committee report 59Non-controlling interests 121Notes to the financial statements 84
OOperating expenses 101Other reserves 116Other statutory information 54Our business models 20Our global footprint 6Our markets 11Our performance 4Our responsibilities 31Our strategy 10
PPrincipal subsidiary and associated undertakings 136Property, plant and equipment 106Provisions for other liabilities and charges 129
RRelated party transactions 134Remuneration Committee report 61Retained earnings 121Retirement benefit obligations 126Risk management 27
SSegment information 96Share capital and share premium 120Shareholders’ information 139Statement of Directors’ responsibilities 71Summary of significant accounting policies 84
TTrade and other payables 130Trade and other receivables 113
UUS Cheese & Global Nutritionals – business model 20US Cheese & Global Nutritionals – divisional performance 36

Text paper used: UPM Fine.
UPM focuses on reducing the impact on water, air, soil and groundwater.
UPM complies with the principles of sustainable forestry wherever it operates.

Cautionary statementThe 2010 Annual Report contains forward-looking statements. These statements have been made by the Directors in good faith, based on the information available to them up to the time of their approval of this report. Due to the inherent uncertainties, including both economic and business risk factors, underlying such forward-looking information, actual results may differ materially from those expressed or implied by these forward-looking statements. The Directors undertake no obligation to update any forward-looking statements contained in this report, whether as a result of new information, future events, or otherwise.
desig
n_w
ww
.redd
og
.ie

Glanbia plc, Glanbia House, Kilkenny, Ireland.Tel +353 56 777 2200Fax +353 56 777 2222
www.glanbia.com
Glanbia plc Annual Report 2010