fuelling ambition - glanbia/media/files/g/glanbia-plc... · 2019-03-06 · glanbia plc | annual...
TRANSCRIPT

Fuelling ambitionGlanbia plc Annual Report and Financial Statements 2018
Glanb
ia plc A
nnual Rep
ort and Financial Statem
ents 2018

Glanbia is a global nutrition group dedicated to delivering better nutrition
for every step of life’s journey. Read more on page 4
Forward-looking statements Glanbia plc (the ‘Group’) has made forward-looking statements in this Annual Report that are based on management’s beliefs and assumptions and on information currently available to management. Forward-looking statements include, but are not limited to, information concerning the Group’s possible or assumed future results of operations, business strategies, financing plans, competitive position, potential growth opportunities, potential operating performance improvements, the effects of competition and the effects of future legislation or regulations. Forward-looking statements include all statements that are not historical facts and can be identified by the use of forward-looking terminology such as the words ‘believe,’ ‘develop,’ ‘ensure,’ ‘arrive,’ ‘achieve,’ ‘anticipate,’ ‘maintain,’ ‘grow,’ ‘aim,’ ‘deliver,’ ‘sustain,’ ‘should’ or the negative of these terms or similar expressions. Forward-looking statements involve risks, uncertainties and assumptions.
Actual results may differ materially from those expressed in these forward-looking statements. You should not place undue reliance on any forward-looking statements. The risk factors included at pages 50 to 53 of this Annual Report could cause the Group’s results to differ materially from those expressed in forward-looking statements. There may be other risks and uncertainties that the Group is unable to predict at this time or that the Group currently does not expect to have a material adverse effect on its business. These forward-looking statements are made as of the date of this Annual Report. The Group expressly disclaims any obligation to update these forward-looking statements other than as required by law.
The forward-looking statements in this Annual Report do not constitute reports or statements published in compliance with any of Regulations 4 to 9 and 26 of the Transparency (Directive 2004/109/EC) Regulations 2007.
As an Irish incorporated group, the Strategic report does not constitute a strategic report for the purposes of the UK Companies Act 2006 (Strategic Report and Directors’ Report) Regulations 2013 and the Large and Medium-sized Companies and Groups (Accounts and Reports) (Amendment) Regulations 2013, and the Remuneration Committee report does not constitute a remuneration report for the purposes of the UK Large and Medium-sized Companies and Groups (Accounts and Reports) (Amendment) Regulations.
Read more on page 24
Glanbia Nutritionals
Glanbia Nutritionals (GN) comprises: Nutritional Solutions (NS) and US Cheese. Through its extensive portfolio of ingredients
and capabilities, NS is a global provider of nutritional and functional solutions. In an innovative model with our US dairy
partners, US Cheese is the #1 producer and marketer of American-style cheddar cheese.
Read more on page 28
Glanbia Ireland is the largest Irish-based integrated dairy nutrition and agri-food business.
Southwest Cheese/Michigan is a US-based cheese and whey manufacturing business with an existing plant in New Mexico
and a new plant under construction in Michigan.
Glanbia Cheese UK is the largest mozzarella cheese manufacturer in Europe.
Glanbia Cheese EU established in 2018 is constructing a new mozzarella cheese plant in Ireland.
Read more on page 18
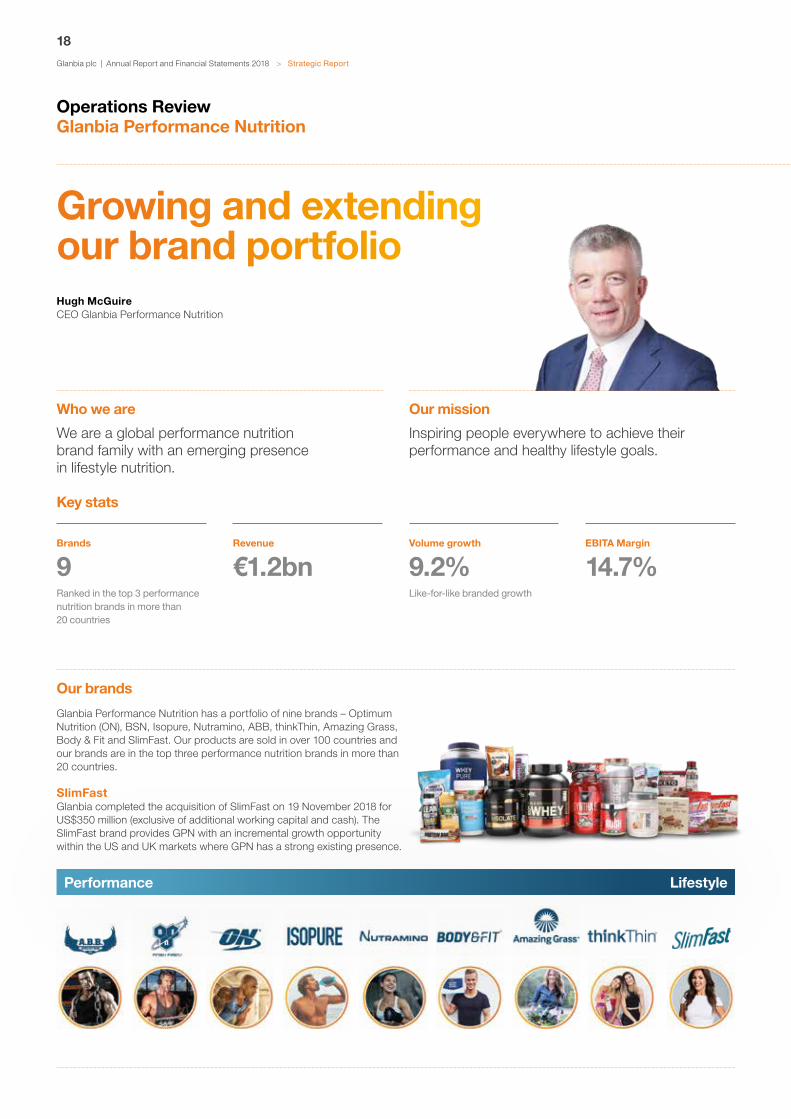
Glanbia Performance Nutrition
Glanbia Performance Nutrition (GPN) is a global leader in the performance nutrition business. GPN has
a portfolio of nine brands ranging in appeal from consumers looking to improve their athletic performance to those seeking
on-the-go snacks and beverages to support weight management and a healthy lifestyle.
Joint Ventures

Glanbia plc | Annual Report and Financial Statements 2018
1
Highlights of 2018
Adjusted Earnings Per Share
91.01c+4.5%1 +9.0%2
EBITA margin
11.9% 0bps1 +10bps2
Share of joint venture profit after tax
€45.3m +5.8% +€2.5m*
Cash conversion
92.0%OCF as a % of EBITDA
Revenue from continuing operations
€2.4bn+0.0%1 +4.1%2
Acquisition
SlimFastIn November 2018, Glanbia acquired SlimFast, a leading weight management and health and wellness brand. Headquartered in Florida, US, SlimFast’s major markets are in the US and the UK.
Read more on page 18
Acquisition
WatsonSubsequent to year end, the Group agreed to acquire Watson, a value-added non-dairy solutions business and a highly complementary addition to our Nutritional Solutions business. Watson is headquartered in Connecticut, US.
Read more on page 26
EBITA
€284.9m+0.6%1 +5.2%2
Profit after tax
€234.0m+1.1% +€2.6m*
Sales volumes
+9.2% GPN like-for-like branded
+8.5%Nutritional Solutions
“2018 was another strong year for Glanbia plc with an exciting acquisition and strategic progression across all business segments. We have set an ambitious and clear path for the years ahead.”
Siobhán Talbot Group Managing Director
Financial Highlights Strategic Highlights
Strategic Report
Group Chairman’s Statement 02
Group Managing Director’s Review 04
Business Model 08
Our Strategy 10
Key Performance Indicators 14
Operations Review 18
Group Finance Director’s Review 30
Our People and Our Sustainability 38
Risk Management 46
Principal Risks and Uncertainties 50
Directors’ Report
Corporate Governance Report 55-69
Introduction from the Chairman 55
Board of Directors and Senior Management 57
Board Leadership and Company Purpose 62
Division of Responsibilities 64
Composition, Succession and Evaluation 66
Audit, Risk, Internal Control and Remuneration 68
Compliance Statements 69
Audit Committee Report 70
Nomination and Governance Committee Report 76
Remuneration Committee Report 80
Other Statutory Information 102
Directors’ Responsibility Statement 107
Financial Statements
Independent Auditor’s Report 110
Group Financial Statements 118
Company Financial Statements 124
Notes to the Financial Statements 127
Other Information
Glossary of KPIs and non-IFRS Performance Measures 203
Shareholder Information 213
Contacts 217
1 Reported 2 Constant currency * Prior movement compared to 2017 results on a pre-exceptional basis
www.glanbia.com
For definitions and more information on constant currency and other performance measures see the glossary on pages 203 to 212.

Glanbia plc | Annual Report and Financial Statements 2018
2
> Strategic Report
Group Chairman’s Statement
Talbot, and the Group Finance Director, Mark Garvey, effective from 1 January 2019. Further details are set out in the Remuneration Committee Report on page 81.
Total Shareholder Return Total Shareholder Return (TSR) is a key performance indicator (KPI) for Glanbia as it reflects our key objective of maximising returns to our shareholders. Our executive and senior management incentive programmes are also linked to TSR, aligning the Glanbia long-term incentive plan with shareholder interests. It was a strong year for TSR with an 11.4% return. The share price rose 9.7% from €14.90 at the prior year-end to €16.35 at the 2018 financial year-end. This performance reflects the benefits of the Group’s growth strategy and the focus on our two global growth platforms, Glanbia Performance Nutrition and Glanbia Nutritionals.
Governance At Glanbia we are firmly committed to maintaining the highest standards of corporate governance. We are very supportive of the revised UK Corporate Governance Code (2018) (the Code) and we restructured our Corporate Governance Report to reflect how the Group has applied many of the updated principles of the Code that emphasise the value of good corporate governance to long-term sustainable success. Details of our approach are set out on pages 55 and 56.
Furthermore, in 2018 we continued our internal Board evaluation focusing on the overall effectiveness of the Board and its Committees. The results of this evaluation were very positive, and recommendations arising have been incorporated into the work of the Board. More details on the evaluation is set out on page 67.
Board changes Board renewal is a key area of focus and crucial to the Group’s success. The Company plans to reorganise the composition of its Board of Directors effective 1 May 2019.
It is planned that the Board will be comprised as follows:• Two Executive Directors; Group Managing
Director and Group Finance Director;• Six Independent Non-Executive Directors; and• Eight Non-Executive Directors nominated by
Glanbia Co-operative Society Limited (the ‘Society’). This is in accordance with the amended and restated relationship agreement dated 2 July 2017 (the ‘Relationship Agreement’) between the Company and the Society.
Martin Keane Group Chairman
Dear ShareholderI am delighted, in my first year as Group Chairman, to report another good set of results for Glanbia plc.
Group revenue at €2.4 billion was in line with last year (+4.1% constant currency). Wholly-owned EBITA increased 0.6% to €284.9 million (5.2% constant currency) and pro-forma adjusted Earnings Per Share (EPS) grew by 4.5% (9.0% constant currency).
Based on these good set of results, the Board is pleased to recommend a 10% increase in dividend for the year. Subject to approval at the Annual General Meeting (AGM), this will result in a final dividend of 14.49c per share and a payout ratio of 26.6% in line with our revised dividend policy of 25% to 35% of adjusted EPS.
2022 strategic roadmap Our purpose to deliver better nutrition for every step of life’s journey is more relevant than ever as the global movement toward healthier and more active lifestyles continues apace.
Our comprehensive portfolio of GPN’s performance and lifestyle brands, and GN’s nutritional ingredients and solutions, ensures we are well positioned to benefit from this growing global trend. The more mindful and active consumer has also inspired the growth of weight management and wellbeing products. In 2018, we strategically invested in this category, a natural adjacency to our branded lifestyle nutrition portfolio with the acquisition of the weight management and health and wellness brand SlimFast. In line with our strategy of continually pursuing value creation opportunities through acquisitions and efficient capital allocation, subsequent to year-end, we also agreed to acquire Watson, a US-based, value-added non-dairy solutions business. Watson is an exciting acquisition for the Group and is a highly complementary addition to the Nutritional Solutions component of the GN’s business. Watson specialises in vitamin and mineral premix solutions, edible films and material conditioning for global and regional customers in the food, supplement and personal care categories.
Glanbia’s success is grounded in a compelling and consistent strategy focused on sustainable value creation. In May 2018 we refreshed our strategy and set out our 2022 ambition and the roadmap to achieving these goals. I am pleased to report that the Group has agreed a new three year, renewable, service agreement with the Group Managing Director, Siobhan
Embedding a purpose-led culture
Glanbia plc | Annual Report and Financial Statements 2018
3
values programme; and the formation of Glanbia Ireland in 2017. Henry has made an enormous contribution to Glanbia plc and on behalf of the Board and myself, I would like to thank him sincerely and to wish him and his family the very best for the future.
Culture and engagementCentral to the long-term delivery of our strategy is the Group’s culture, which remains true to our values and the behaviours which underpin them. In 2018, the Board met with the Group’s executive leadership teams to discuss strategy and performance. In addition to giving us commercial insights, such activities allow us to gain an understanding of Glanbia’s culture, something which the Board places great value on, and is firmly on our agenda.
We remain proactive in our engagement and look forward to answering any questions you have at our Annual General Meeting which will be held on 24 April 2019 in the Lyrath Estate Hotel, Old Dublin Road, Kilkenny, Ireland. More details on Board engagement are set out on pages 62 and 63.
OutlookThe fast growing nutrition sectors which we serve are quite dynamic at the moment driven by major health and wellness trends, mindful consumers and digital disruption. Our strategy has been developed to benefit from the opportunities offered by these long-term growth drivers. Brexit, coupled with international trade challenges, means that the political landscape in which we operate has never been so uncertain but, by staying true to our strategic focus and our 2022 roadmap, I am confident we can continue to deliver consistent and sustained value for all our stakeholders.
Martin KeaneGroup Chairman
The customers champion
We truly value the central role our customers and consumers play in our success and we strive to constantly deliver above and beyond their expectations.
Performance matters Our people’s dedication to excellence, safety, quality, growth and brand performance gives us our competitive edge.
Find a better way Striving to be the best, we are shaping the future of nutrition through continuous innovation – better solutions, products and outcomes for our customers and consumers.
Winning together Our inquisitive mindset means that we constantly join forces across Glanbia, working together to build our future.
Showing respect Valuing all our people, our producers, our customers and our communities is at our core and builds a better business.
Mary Minnick and Richard Laube will join the Board as Independent Non-Executive Directors on 1 May 2019.Paul Haran, Senior Independent Director, will retire immediately upon completion of the appointment of a third new Independent Non-Executive Director which is expected to be completed during 2019. Following Mr Haran’s retirement, Dan O’Connor will take up the position of Senior Independent Director. In addition, we have expanded the role of Donard Gaynor an Independent Non-Executive Director to include oversight of workforce engagement to further improve our Board involvement in this area.
To facilitate the reorganisation and the broadening of the external perspective of the Board, Hugh McGuire and Brian Phelan will not be putting themselves forward for re-election at the 2019 Annual General Meeting (AGM). Their key executive roles are unaltered and they will continue in their executive leadership positions as CEOs of the Group’s two global growth platforms, Glanbia Performance Nutrition and Glanbia Nutritionals respectively.
Diversity and succession are important considerations for the Board. The unique structure of our Board due to our Relationship Agreement with the ‘Society’ somewhat restricts the composition of our Board.
During 2018, there were a number of changes to the Society Nominee Directors. These changes resulted in the reduction in the number of Society Nominee Directors on the Board from ten to eight and are described in full on page 78.
I wish to pay tribute to my predecessor Henry Corbally, who retired as Group Chairman and Board Director in June 2018. Henry joined the Board of Glanbia plc in June 1999 and was appointed Group Chairman in June 2015. Under his stewardship, Glanbia plc has grown significantly and Henry’s depth of experience and knowledge of the Group provided strong and focused Board leadership. Key strategic highlights under his chairmanship include the completion of three acquisitions in Glanbia Performance Nutrition; the delivery of a significant capital investment programme in Glanbia Nutritionals including the formation of a new dairy joint venture in Michigan; the rollout and embedding of the Group’s refreshed purpose, vision and
Our Values

Glanbia plc | Annual Report and Financial Statements 2018
4
> Strategic Report
Group Managing Director’s Review
Dear Shareholder 2018 was another exciting year for Glanbia. Our vision is to be one of the World’s top performing nutrition companies trusted to enrich lives every day. In 2018 our global and ambitious team of 6,900 employees continued to further develop and evolve the Glanbia journey.
We had many highlights in the year as we navigated what is an increasingly uncertain and complex world. Many of these complexities will continue into 2019. However our strong market positions, great people and strong financial capability will continue to drive future long-term sustainable growth.
Global nutrition trends continue to shape our operating environment and our strategic focus areas are grounded in the nutrition trends that are most relevant to Glanbia. Therefore we have distilled the key global consumer trends into four strategic growth drivers: • Health and wellness;• On-the-go food and beverages; • Clean label; and • Digitally connected.
These strategic drivers will focus and fuel our ambition. In May 2018, we communicated our long-term value creation model when we set out our growth strategy and ambitions at a Capital Markets Day in Chicago.
Our strategy and financial targets are clear andunderscore our commitment to the right balance ofrevenue growth and earnings performance. Our strategyto date has delivered, with 10.2% growth in adjusted Earnings Per Share (EPS) on a constant currency basis, over the past five years. Our ambition as set out in 2018, is to be a €6bn total revenue group in 2022 with an average five year adjusted EPS growth of 5% to 10% on a constant currency basis. We aim to deliver this revenue and earnings momentum through both organic growth and acquisition activity while also meeting other financial metrics such as cash conversion and Return on Capital Employed.
Fuelling ambitions for growth and developmentSiobhán Talbot Group Managing Director
Highlights of 2018
New ambitious growth strategy set to 2022
Read more on pages 10 and 11
Strong volume momentum across all business segments
Read more on page 18 to 29
Acquired SlimFast – the fastest growing US weight management and health & wellness brand
Read more on page 18
Created a new dairy joint venture which will invest US$470m in a new cheese and whey plant in Michigan, US
Read more on page 29
Continued alignment of our talent and development programmes to our values
Read more on page 40 and 41

Glanbia plc | Annual Report and Financial Statements 2018
5
Strengthening our ability to meet consumer trends For Glanbia Performance Nutrition (GPN) the evolution of consumer trends has been the catalyst for our clear prioritisation of a number of areas. Some of the 2018 highlights include:• The extension of our existing expertise in
performance nutrition to the ‘lifestyle’ category with strong innovation across existing brands including Optimum Nutrition, Amazing Grass and thinkThin. The heritage and depth of our brands continue to broaden our appeal to the health conscious lifestyle consumer seeking both dairy and plant-based nutrition.
• The exciting addition of SlimFast into the GPN portfolio. We recognise the strength of the strategic adjacency that the weight management category shares with our existing performance and lifestyle categories.
• The prioritisation of investment in building our Direct-to-Consumer (D2C) capability. Since the acquisition of Body & Fit we have invested in people and infrastructure as we bring a whole new digital capability to GPN. We are confident that by building our people and system capabilities in this space we will be able to leverage the platform to deepen consumer reach and engagement across the GPN portfolio.
In Glanbia Nutritionals (GN) and in particular within its Nutritional Solutions division (NS), we are very focused on optimising our ability to adapt to meet our customers and consumer needs. From a consumer perspective, key positive trends include the global rise in dairy consumption and the ever increasing recognition of the positive role of protein (dairy and non-dairy) in a healthy balanced diet.
As an ingredient partner we are also increasingly seeing a trend where brand owners wish to simplify their supply chains, particularly where they operate across multiple geographies. At GN we aim to exceed our customer requirements as we combine high-quality and sustainable supply chains with an innovative mindset bringing differentiated offerings to our customers across many nutrition categories and formats. Our deep market insights and strong customer relationships ensure that our offerings meet their quality, authenticity, taste and nutritional desires across many convenient and accessible formats.
A clear path forwardAs a Group we assess our progress across three strategic pillars:• Protect and grow the core;• Selectively build and scale beyond the core; and• Embed enablers across the business.
As I have outlined on pages 10 to 13, these strategic pillars guide us in achieving our long-term growth ambitions.
Within our core pillar, we focus on building and investing in capabilities to enable us to deliver growth in markets where we have market leading capability and the right to win.
2018 was an exciting year in that respect. We achieved all of our guided metrics. We delivered 9.0% growth in adjusted Earnings Per Share constant currency (guided 5-8%), like-for-like branded volume growth in GPN of 9.2% (guided mid-to-high single digit) and volume growth in GN’s Nutritional Solutions division of 8.5% (guided mid-to-high single digit). In US Cheese we maintained our position as #1 producer of American-style cheddar cheese.
We operate in a competitive environment, particularly GPN, and in 2018 we invested to support our brands in key categories and markets. This investment included our Ready-To-Eat (RTE) formats where the market has been particularly competitive and in the non-US markets where we insulated our customers and consumers from the impact of volatile foreign exchange and trade tariffs. We continued to grow our portfolios outside the US with strong growth across both the GPN and GN Nutritional Solutions portfolios. Key regions of growth in 2018 included South East Asia, Mexico, India and Oceania.
Continuous innovation is pivotal for Glanbia fuelling growth from within the Group. In 2018, we accelerated our innovation agenda in GN with new and sophisticated capabilities in flavours, proteins and packaging. In GPN we overachieved our innovation target by achieving an internal innovation metric of 19.8% of net sales (target 15%).
Furthermore, we invested as planned in building longer term capabilities across our organisation, investment that spanned both new talent and new system infrastructures particularly in the D2C space.
“Our future growth journey will leverage our current strengths with a deliberate emphasis on investment to drive top line volume momentum in our two key growth pillars of Glanbia Performance Nutrition and Glanbia Nutritionals, augmented by selective M&A.”
Global MegatrendsHealth & Wellness: Global health &wellness sales hit a record high of US$1tr in 2017.––––––––
US$1tr Health & Wellness sales Source: Statistica––––––––
Glanbia plc | Annual Report and Financial Statements 2018
6
> Strategic Report
Building on our success A second pillar of our strategy is to strategically invest to extend our portfolio. In 2018, we continued to progress this growth strategy through strategic investments and complementary acquisitions. In November 2018 we acquired SlimFast, enabling GPN to enter the adjacent US$8 billion weight management category. The SlimFast brand provides GPN with an incremental growth opportunity within the US and UK markets where GPN has a strong existing presence. Furthermore, it will provide GPN with scale in the growing FDMC channel via its Ready-to-Drink (RTD) products in particular. GPN will also use its existing capability to further develop SlimFast across channels and geographies.
Equally NS has strong growth ambitions and aims to achieve this via a combination of organic growth and complementary acquisitions. In February 2019 we announced the agreement to acquire Watson, a family-owned US-based business focused on non-dairy ingredient solutions. Watson specialises in vitamin and mineral premix solutions, edible films and material conditioning for global and regional customers in the food, nutritional, supplement and personal care categories. This acquisition is highly complementary to GN’s portfolio and consistent with our strategy to develop our premix capabilities. In addition, Watson enables GN to further support its customers with a wider breadth of technical capabilities and an expanded portfolio of ingredients.
In primary dairy we continue to extend our footprint with our partners within the existing robust joint venture business models. A number of investments were approved in 2018: • We extended our relationship with our existing
Southwest Cheese joint venture partners; Dairy Farmers of America (DFA) and Select Milk Producers (Select). This expanded joint venture will own the existing cheese and whey manufacturing facilities in Clovis, New Mexico, and the new US$470m cheese and whey plant in Michigan, which is scheduled for commissioning in 2021;
• With Leprino Foods, we approved the creation of a new joint venture which will invest €130m
in a mozzarella cheese plant in Portlaoise, Ireland which is scheduled for commissioning in 2020; and
• Together with Glanbia Co-operative Society Limited, our partner in Glanbia Ireland, we approved further investment to support the growth of the Irish milk pool, by entering into a strategic partnership with Royal A-ware, a leading global cheese and dairy producer in the Netherlands. This partnership plans to invest €140m in building a new continental cheese plant in Kilkenny, Ireland with commissioning expected by 2022.
These joint venture investments are largely funded on a non-recourse basis within the joint venture businesses underpinned by robust business models and management for each operation.
Organisational effectiveness In setting out our 2022 ambitions, an important third strategic pillar is centred on ensuring that the organisation is fit for purpose, with an agile operating model and key enablers that support the execution of our growth strategy. In considering organisational effectiveness two important dimensions do not change – our purpose and our values. Our purpose is to deliver better nutrition for every step of life’s journey. Our values, rooted in respect, guide our high-performing culture where our employees are empowered to deliver to their full potential. In 2018, while remaining focused on rigorous cost management, we continued to optimise our operating model to meet current and future business needs and support wider services, digital delivery and internationalisation as efficiently as possible. For example, GN has now fully embedded its integrated customer-focused operating structure. This enables GN to deliver the full suite of its capability to customers, supported by centres of excellence across areas such as product supply, innovation and strategy. We also remained focused on driving customer and consumer engagement, and in GPN, we further invested in our e-commerce and digital capabilities to increase our omni-platform reach and engagement.
While our strategic pillars, as outlined above, guide us in achieving our long-term growth ambitions, it is the translation of these pillars into strategic priorities that provide the roadmap for our success. Our strategic priorities are outlined on pages 12 and 13.
OutlookWe made strong progress in 2018 and have set out our 2022 growth ambition. We are excited about our future journey and confident in achieving this compelling strategy. While there will be challenges to navigate, the Group continues to remain well-positioned to benefit from the global growth opportunities continuously emerging from mindful, health conscious andtech-savvy consumers who want to lead healthier and more active lives.
Looking to 2019, we expect adjusted Earnings Per Share to grow between 5% to 8%, constant currency. We further expect to deliver on our guided metrics for Return on Capital Employed and cash conversion in 2019.
Siobhán TalbotGroup Managing Director
Sustainability
Global Megatrends60% of consumers believe it’s important that the food they purchase is produced in a sustainable way, an increase from 50% who said the same in 2017.––––––––
60% Source: Foodinsight. ––––––––
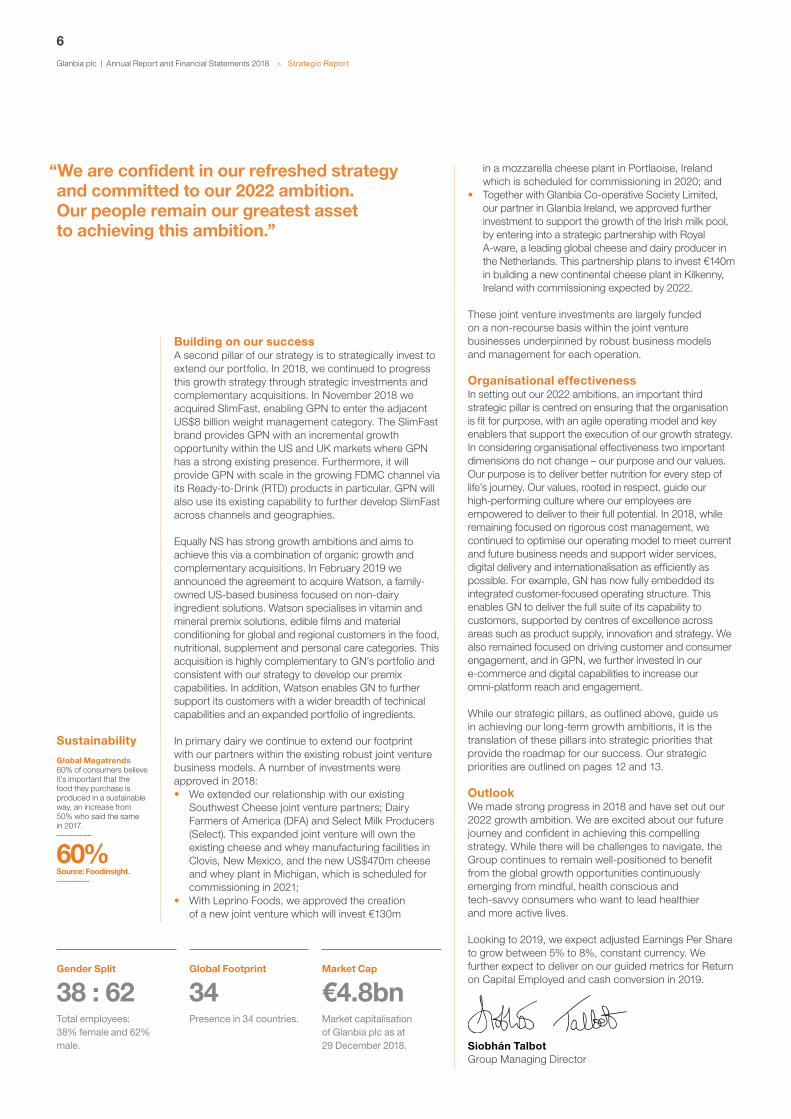
“We are confident in our refreshed strategy and committed to our 2022 ambition. Our people remain our greatest asset to achieving this ambition.”
Gender Split
38 : 62Total employees: 38% female and 62% male.
Global Footprint
34Presence in 34 countries.
Market Cap
€4.8bnMarket capitalisation of Glanbia plc as at 29 December 2018.
Glanbia plc | Annual Report and Financial Statements 2018
7
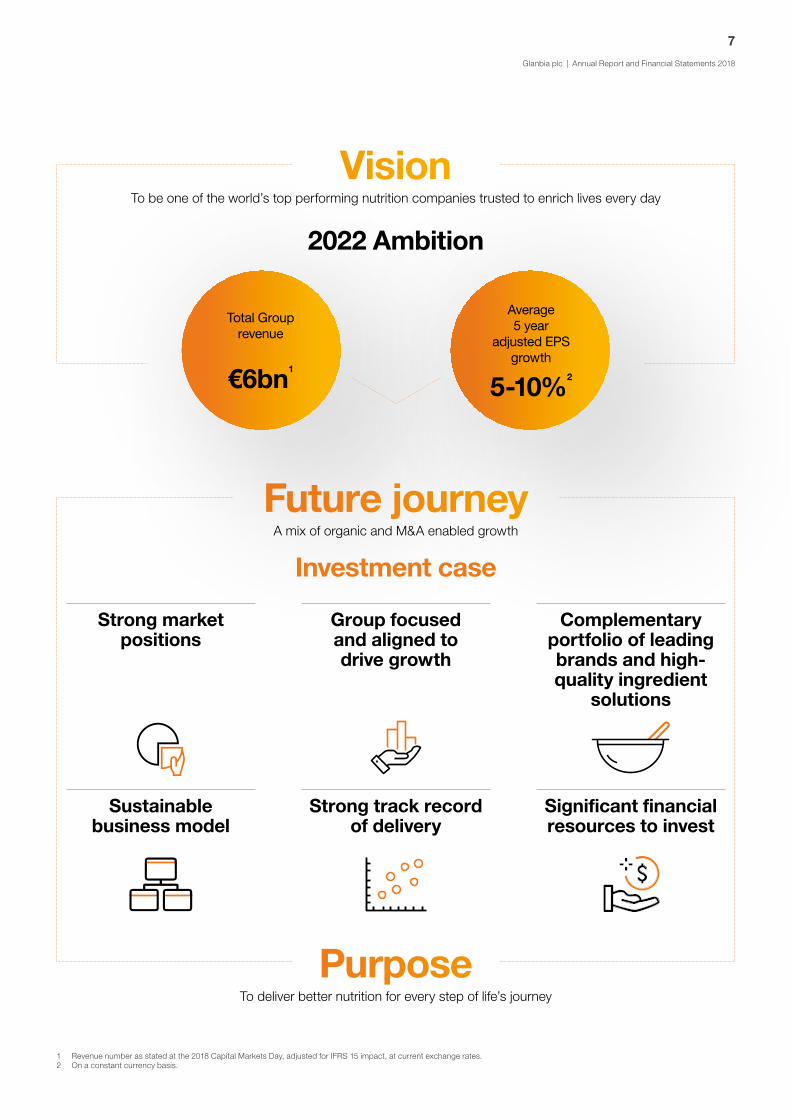
VisionTo be one of the world’s top performing nutrition companies trusted to enrich lives every day
2022 Ambition
Future journeyA mix of organic and M&A enabled growth
PurposeTo deliver better nutrition for every step of life’s journey
Total Group revenue
€6bn1
Average 5 year
adjusted EPS growth
5-10%2
Investment case
Strong market positions
Sustainable business model
Group focused and aligned to drive growth
Strong track record of delivery
Complementary portfolio of leading brands and high-quality ingredient
solutions
Significant financial resources to invest
1 Revenue number as stated at the 2018 Capital Markets Day, adjusted for IFRS 15 impact, at current exchange rates. 2 On a constant currency basis.

Glanbia plc | Annual Report and Financial Statements 2018
8
> Strategic Report
Outputs
Committed peopleWe attract and retain talented employees through management training and development programmes aligned with our purpose, vision and behavioural values.
CommunitiesOur business makes a difference in the communities in which we operate with a significant economic multiplier effect supporting local employment and prosperity. As individuals and a collective organisation we support voluntary endeavour and nominated charities that resonate with our culture and value system.
Loyal customers and consumers We deliver better nutrition through leading brands across multiple convenient formats and high-quality nutritional ingredients for our customers and consumers that assist them in the achievement of their lifestyle and performance goals.
Engaged shareholdersWe have a progressive dividend policy and during 2018 the Group adopted a revised dividend policy of an annual dividend payout ratio of between 25% and 35% of adjusted Earnings Per Share. This represents a return of €71.6 million to shareholders from 2018 earnings.
Environmental awarenessAs a global nutrition group we are conscious of the impact of our organisation on the broader community. In 2018 we further evolved our sustainability strategy to make substantive progress against our KPIs while adopting a group-wide environmental management system.
Inputs
Disciplined capital management F
We display a strong track record of efficient capital allocation and portfolio management, setting appropriate internal targets for rates of return. We deploy a variety of structures including joint ventures to optimise the deployment of our shareholders capital.
Talent development H
People lie at the heart of the business. With 6,900 employees, we aim to attract, retain and develop high-quality employees through an integrated, values-led approach to talent management and career development.
Operational excellence M We have a proven ability, demonstrated over decades, of running large-scale manufacturing facilities. We have 27 production facilities, including our joint ventures.
Innovation I
With four R&D innovation centres we focus on customer-led, science-backed innovation that produces better solutions, better products and better outcomes for our customers and consumers.
Relationship focused S We work as a proactive and long-term business partner with all participants in our supply chain, delivering nutritional solutions based on market foresight and contributing to better business for our partners.
Natural resources N We source clean, traceable ingredients. We are dedicated to achieving high-quality products to meet customer food safety and quality standards. Through our sustainability programmes we are focused on regulatory compliance and good environmental stewardship.
Business Model
We have built a resilient business model that enables the Group to prosper and grow.
Related informationOur strategyThe main elements of our strategyare outlined on pages 10-13.
Our principal risksOur approach to risk management and our principal risks are described on pages 50-53.
GovernanceHow we govern the Group is described on pages 55-69.
Our vision is to be one of the world’s top performing nutrition companies trusted to enrich lives every day.
Our business model focuses on leveraging our strategic assets and distinctive capabilities to create world-leading performance and lifestyle nutrition brands and innovative nutritional and functional ingredients.
We do this while maintaining strong financial discipline and efficient capital deployment which generates consistent and attractive returns for shareholders. We benefit from the diversity of our end-users, broad product range and our wide geographic spread.
IIRC CapitalsThis key provides a mapping to the ‘capitals’ of the International Integrated Reporting Councils (IIRC) framework.
F FinancialH HumanM ManufacturedI IntellectualS SocialN Natural
You can find out more at: www.theiirc.org

Glanbia plc | Annual Report and Financial Statements 2018
9
Innovation Supported by four innovation centres, we create greater value from our pool of raw materials through collaborative long-term partnerships, customer focused innovation and investment in consumer-facing products and brands in high-growth markets.
Solid supply chains Through worldwide facilities that meet the most stringent standards and our supplier partnerships around the globe, we ensure flexibility, responsiveness and solid, sustainable supply chains.
DeliverWe source clean ingredients from both primary producers and other food manufacturers. This requires an in-depth understanding of our raw ingredients markets and the development of long-term mutually beneficial relationships with producers to secure supply.
DevelopWe apply our deep sector knowledge, collaborative approach and innovative thinking to transform raw ingredients into branded consumer products and high-quality functional ingredients and products for our customers and consumers worldwide.
B2C: innovation sits at the heart of our business. We continuously develop new performance and lifestyle nutrition products. Our brands include a range of formats such as powders, drinks, capsules, tablets and bars.
B2B: our Nutritional Solutions business is a leading marketer of advanced-technology whey protein, specialist vitamin and mineral blends, plant-based ingredients and functional beverages. Our US Cheese business is the leading manufacturer and marketer of American-style cheddar cheese.
D2C: the acquisition of Body & Fit is enabling us to build a platform for our online capability and develop powerful e-commerce and digital tools to support our performance nutrition brands.
GrowWe are the global leader in the performance nutrition industry with a portfolio of performance and lifestyle nutrition brands. As a nutritional solutions provider in the B2B arena, we commercialise specialty nutritional and functional ingredients and precision premixes to meet our customer needs.
B2C: each of our own brands has its own consumer appeal. We are the #1 global sports nutrition brand with a growing presence in lifestyle nutrition.
B2B: our portfolio of both nutritional ingredients and cheese products gives us strong market reach and customer relevance. We work closely with our customers to develop products that exceed their expectations.
D2C: our new digital platform will enhance engagement with our consumers at multiple touch points throughout their purchasing decision journey. We will continue to connect with consumers through creative excellence and new digital layers of services.
Culture and valuesOur culture seeks to unify our people,leaders, partners and stakeholders
in a common goal: to deliver better nutrition for every step
of life’s journey.

Glanbia plc | Annual Report and Financial Statements 2018
10
> Strategic Report
Our Strategy
Our 2022 AmbitionOur aim is to deliver this ambition through
organic growth and acquisition
€6bn1 total group revenue
5-10%2 average 5 year adjusted EPS growth
Growth drivers
While consumers expectations around their nutritional requirements are constantly evolving the demand for healthy lifestyles, convenience food and beverages,
sustainable living and technology-enabled routines continues unabated.
Health and wellness Read more on page 17
On-the-go food and beverages
Read more on page 23
Clean labelling
Read more on page 37
Digitally connected
Read more on page 20
GPN€1.8bn revenue
13-15%3 EBITA margin
GNNutritional Solutions:
€1.0bn1 revenue
13-15%3,4 EBITA margin
Cheese:
€2bn1 revenue
Low single-digit3,4 EBITA margin
JVs€1.2bn1 revenue
Low to mid-single digits3 EBITA margin
Growth Ambition
1 Revenue number as stated at the 2018 Capital Markets Day, adjusted for IFRS 15 impact, at current exchange rates. 2 On a constant currency basis.3 Average margin over the period 2018-2022. 4 GN margins as stated at the 2018 Capital Markets Day, adjusted for IFRS 15 impact, at current exchange rates.

Glanbia plc | Annual Report and Financial Statements 2018
11
Protect and grow the core
Concentrate our focus on growing markets where we have market leading capability
and the right to win
Invest in capability to capture these market opportunities
Selectively build beyond the core
Invest to drive organic growth across core platforms and adjacent
growth platforms
Build scale internationally
Deliver complementary M&A
Embed enablers across the business
Leverage our strong operating model
Drive customer and consumer engagement
Develop and retain top talent
Develop sustainability programmes
Rigorous cost management
Maintain and grow our global leadership in
performance and lifestyle nutrition
Sustain current, and drive further, ingredient market
leadership positions in nutritional ingredients
Grow through organic investment programme and
acquisition/partnership with complementary
businesses
Develop talent, culture and values in line with our
global growth ambition
Strategic priorities
Our roadmap is built around four key strategic priorities which provide clarity and direction on how we will achieve our 2022 ambition.
We have set measurable goals against these priorities which will able us evaluate our progress.
Strategic Pillars
With our roots in primary dairy processing both in Ireland and the US, Glanbia’s core capability today spans a broad spectrum of high-quality, sustainable, dairy and non-dairy functional and nutritional ingredients and branded consumer products. Our ingredients and consumer products focus on
consumers seeking high-quality convenient nutrition to support their healthy lifestyle choices.
Glanbia plc | Annual Report and Financial Statements 2018
12
> Strategic Report
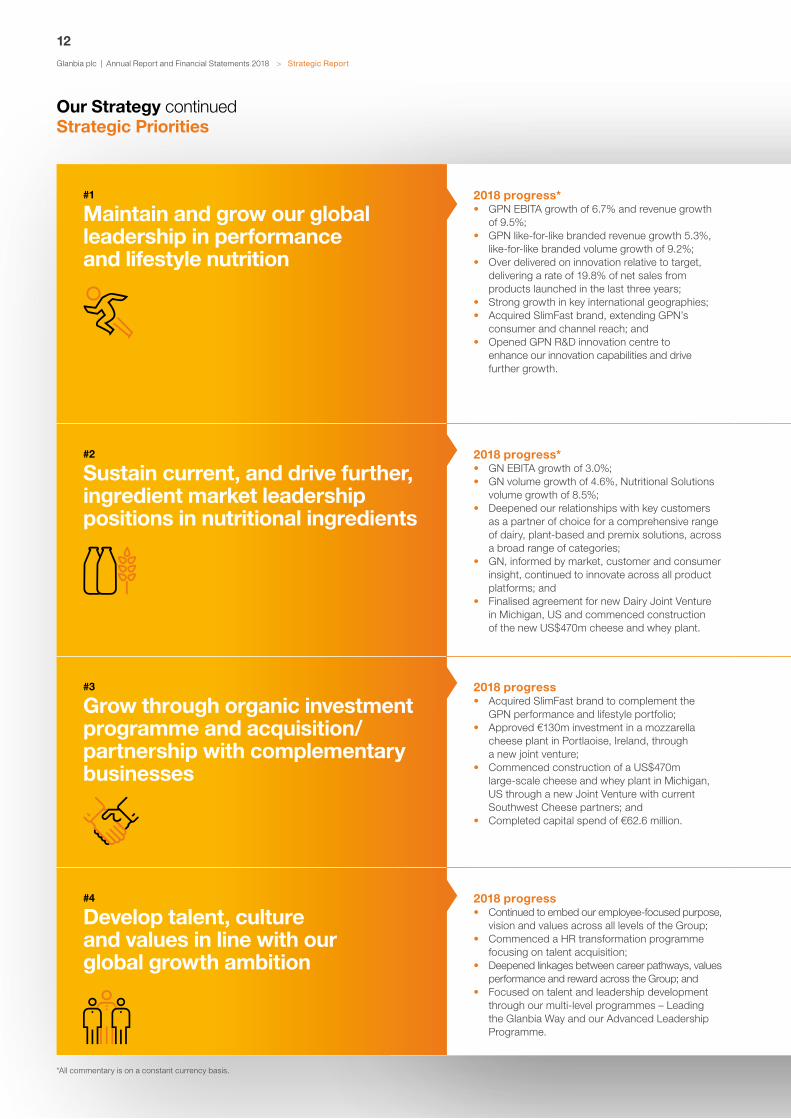
#1
Maintain and grow our global leadership in performance and lifestyle nutrition
2018 progress*• GPN EBITA growth of 6.7% and revenue growth
of 9.5%;• GPN like-for-like branded revenue growth 5.3%,
like-for-like branded volume growth of 9.2%;• Over delivered on innovation relative to target,
delivering a rate of 19.8% of net sales from products launched in the last three years;
• Strong growth in key international geographies;• Acquired SlimFast brand, extending GPN’s
consumer and channel reach; and• Opened GPN R&D innovation centre to
enhance our innovation capabilities and drive further growth.
Looking forward• Capture full scale potential of Optimum
Nutrition (ON) as a global flagship brand developing an omni-channel strategy across key markets;
• Drive regional flagship brands across key markets to achieve full portfolio potential;
• Accelerate growth internationally by selectively scaling in attractive markets;
• Innovate beyond core products and formats to pursue healthy lifestyle and weight management adjacencies to meet the full needs of active and lifestyle consumers;
• Redefine consumer engagement by developing digital capabilities; and
• Hire and develop the best people.
Key risks• A deterioration in economic
growth or consumer confidence;• Competitor activity; • Potential pace of change in
consumer behaviour relative to business capability; and
• International trade unrest (tariffs).
Link to remuneration• Linked to short and long-term
incentive plans for GPN CEO and his management team.
Key metrics:• EBITA growth;• Operating Cash Flow to EBITDA
conversion %;• Return on Capital Employed;• Like-for-like branded revenue growth; • Rolling three-year Innovation rate.
#2
Sustain current, and drive further, ingredient market leadership positions in nutritional ingredients
2018 progress*• GN EBITA growth of 3.0%;• GN volume growth of 4.6%, Nutritional Solutions
volume growth of 8.5%;• Deepened our relationships with key customers
as a partner of choice for a comprehensive range of dairy, plant-based and premix solutions, across a broad range of categories;
• GN, informed by market, customer and consumer insight, continued to innovate across all product platforms; and
• Finalised agreement for new Dairy Joint Venture in Michigan, US and commenced construction of the new US$470m cheese and whey plant.
Looking forwardNutritional Solutions• Build on core strength in premix
and bioactives;• Innovate to leverage extensive protein
capability into healthy snacking segment;• Scale plant nutrition and flavours
capabilities.Cheese• Solidify our #1 position in the US cheese
market (including US Cheese JVs);• Deepen our strategic relationships with
customers and suppliers through innovative partnership models; and
• Continue market leading innovation.
Key risks• A failure to adapt to new market
challenges or innovate at a faster pace than our competitors;
• The loss or significant deterioration in commercial terms with one of our key customers; and
• Competitor activity.
Link to remuneration• Linked to short and long-term
incentive plans for GN CEO and his management team.
Key metrics:• EBITA growth;• Operating Cash Flow to EBITDA
conversion %;• Return on Capital Employed; and• Volume growth in Nutritional Solutions.
#3
Grow through organic investment programme and acquisition/partnership with complementary businesses
2018 progress• Acquired SlimFast brand to complement the
GPN performance and lifestyle portfolio;• Approved €130m investment in a mozzarella
cheese plant in Portlaoise, Ireland, through a new joint venture;
• Commenced construction of a US$470m large-scale cheese and whey plant in Michigan, US through a new Joint Venture with current Southwest Cheese partners; and
• Completed capital spend of €62.6 million.
Looking forward• Complete the acquisition of Watson,
a US-based non-dairy ingredient solutions business;
• Focus on M&A opportunities that enhance the portfolio or capabilities of GPN or GN Nutritional Solutions; and
• Working with our joint venture partners, continue to develop the new cheese and whey plant in Michigan, US, and the mozzarella cheese plant in Portlaoise, Ireland.
Key risks• The Group may fail to identify
suitable acquisition targets or conduct effective due diligence; and
• Management’s attention may be unduly diverted to acquisition integration efforts with a resulting impact on organic growth objectives.
Link to remuneration• Linked to short and long-term incentive
plans for all members of the Group Operating Executive.
Key metrics:• Group adjusted Earnings Per Share
growth;• Group Return on Capital Employed;• Group Operating Cash Flow to EBITDA
conversion %; and• Total Shareholder Return (TSR).
#4
Develop talent, culture and values in line with ourglobal growth ambition
2018 progress• Continued to embed our employee-focused purpose,
vision and values across all levels of the Group;• Commenced a HR transformation programme
focusing on talent acquisition;• Deepened linkages between career pathways, values
performance and reward across the Group; and• Focused on talent and leadership development
through our multi-level programmes – Leading the Glanbia Way and our Advanced Leadership Programme.
Looking forward• Accelerate focus on talent, succession
and leadership development across the organisation;
• Continue to invest in hiring new capabilities and skills to underpin growth ambitions; and
• Continue to focus on embedding our values across the Group.
Key risks• Competitive dynamics potentially
impacting ability to recruit key new talent;
• Any failure to invest in developing or retaining our people will impact the delivery of our strategic objectives; and
• Ability to recruit and integrate talent in new geographies.
Link to remuneration• Linked to short-term incentive plan for
all members of the Group Operating Executive.
Key objectives: • Leadership and talent development
plans;• Succession plans for key roles; and • Recruitment and retention plans.
Our Strategy continuedStrategic Priorities
*All commentary is on a constant currency basis.

Glanbia plc | Annual Report and Financial Statements 2018
13
#1
Maintain and grow our global leadership in performance and lifestyle nutrition
2018 progress*• GPN EBITA growth of 6.7% and revenue growth
of 9.5%;• GPN like-for-like branded revenue growth 5.3%,
like-for-like branded volume growth of 9.2%;• Over delivered on innovation relative to target,
delivering a rate of 19.8% of net sales from products launched in the last three years;
• Strong growth in key international geographies;• Acquired SlimFast brand, extending GPN’s
consumer and channel reach; and• Opened GPN R&D innovation centre to
enhance our innovation capabilities and drive further growth.
Looking forward• Capture full scale potential of Optimum
Nutrition (ON) as a global flagship brand developing an omni-channel strategy across key markets;
• Drive regional flagship brands across key markets to achieve full portfolio potential;
• Accelerate growth internationally by selectively scaling in attractive markets;
• Innovate beyond core products and formats to pursue healthy lifestyle and weight management adjacencies to meet the full needs of active and lifestyle consumers;
• Redefine consumer engagement by developing digital capabilities; and
• Hire and develop the best people.
Key risks• A deterioration in economic
growth or consumer confidence;• Competitor activity; • Potential pace of change in
consumer behaviour relative to business capability; and
• International trade unrest (tariffs).
Link to remuneration• Linked to short and long-term
incentive plans for GPN CEO and his management team.
Key metrics:• EBITA growth;• Operating Cash Flow to EBITDA
conversion %;• Return on Capital Employed;• Like-for-like branded revenue growth; • Rolling three-year Innovation rate.
#2
Sustain current, and drive further, ingredient market leadership positions in nutritional ingredients
2018 progress*• GN EBITA growth of 3.0%;• GN volume growth of 4.6%, Nutritional Solutions
volume growth of 8.5%;• Deepened our relationships with key customers
as a partner of choice for a comprehensive range of dairy, plant-based and premix solutions, across a broad range of categories;
• GN, informed by market, customer and consumer insight, continued to innovate across all product platforms; and
• Finalised agreement for new Dairy Joint Venture in Michigan, US and commenced construction of the new US$470m cheese and whey plant.
Looking forwardNutritional Solutions• Build on core strength in premix
and bioactives;• Innovate to leverage extensive protein
capability into healthy snacking segment;• Scale plant nutrition and flavours
capabilities.Cheese• Solidify our #1 position in the US cheese
market (including US Cheese JVs);• Deepen our strategic relationships with
customers and suppliers through innovative partnership models; and
• Continue market leading innovation.
Key risks• A failure to adapt to new market
challenges or innovate at a faster pace than our competitors;
• The loss or significant deterioration in commercial terms with one of our key customers; and
• Competitor activity.
Link to remuneration• Linked to short and long-term
incentive plans for GN CEO and his management team.
Key metrics:• EBITA growth;• Operating Cash Flow to EBITDA
conversion %;• Return on Capital Employed; and• Volume growth in Nutritional Solutions.
#3
Grow through organic investment programme and acquisition/partnership with complementary businesses
2018 progress• Acquired SlimFast brand to complement the
GPN performance and lifestyle portfolio;• Approved €130m investment in a mozzarella
cheese plant in Portlaoise, Ireland, through a new joint venture;
• Commenced construction of a US$470m large-scale cheese and whey plant in Michigan, US through a new Joint Venture with current Southwest Cheese partners; and
• Completed capital spend of €62.6 million.
Looking forward• Complete the acquisition of Watson,
a US-based non-dairy ingredient solutions business;
• Focus on M&A opportunities that enhance the portfolio or capabilities of GPN or GN Nutritional Solutions; and
• Working with our joint venture partners, continue to develop the new cheese and whey plant in Michigan, US, and the mozzarella cheese plant in Portlaoise, Ireland.
Key risks• The Group may fail to identify
suitable acquisition targets or conduct effective due diligence; and
• Management’s attention may be unduly diverted to acquisition integration efforts with a resulting impact on organic growth objectives.
Link to remuneration• Linked to short and long-term incentive
plans for all members of the Group Operating Executive.
Key metrics:• Group adjusted Earnings Per Share
growth;• Group Return on Capital Employed;• Group Operating Cash Flow to EBITDA
conversion %; and• Total Shareholder Return (TSR).
#4
Develop talent, culture and values in line with ourglobal growth ambition
2018 progress• Continued to embed our employee-focused purpose,
vision and values across all levels of the Group;• Commenced a HR transformation programme
focusing on talent acquisition;• Deepened linkages between career pathways, values
performance and reward across the Group; and• Focused on talent and leadership development
through our multi-level programmes – Leading the Glanbia Way and our Advanced Leadership Programme.
Looking forward• Accelerate focus on talent, succession
and leadership development across the organisation;
• Continue to invest in hiring new capabilities and skills to underpin growth ambitions; and
• Continue to focus on embedding our values across the Group.
Key risks• Competitive dynamics potentially
impacting ability to recruit key new talent;
• Any failure to invest in developing or retaining our people will impact the delivery of our strategic objectives; and
• Ability to recruit and integrate talent in new geographies.
Link to remuneration• Linked to short-term incentive plan for
all members of the Group Operating Executive.
Key objectives: • Leadership and talent development
plans;• Succession plans for key roles; and • Recruitment and retention plans.
In addition to the key metrics identified above, the Group has a range of Key Performance Indicators (KPIs) which are used to monitor Group performance against key strategic objectives. These KPIs are set out on pages 14 and 15. For more information on the key risks above see pages 50 to 53.

Glanbia plc | Annual Report and Financial Statements 2018
14
> Strategic Report
1 Performance condition of Glanbia’s Annual Incentive Scheme. 2 Performance condition of Glanbia’s Long-Term Incentive Plan.3 OCF as a % of EBITDA.4 Both EBITA and OCF are presented on a pre-exceptional basis.5 OCF as a % of EBITDA as presented on a pro forma basis (excluding Dairy Ireland).
REVENUE FROM CONTINUING OPERATIONS
€2.4bn (2017: €2.4bn)+4.1% cc
2.4bn
2.4bn
2018
2017
Strategic relevanceRevenue growth is a key indicator of how the Group is succeeding in developing through investment in organic growth and the ongoing acquisition programme.
In addition to overall revenue for the Group there are a number of key components (price, volume and acquisition) of Group revenue which are actively monitored to provide greater insight into markets, opportunities and performance of Business Units.
PerformanceIn 2018, revenue from continuing operations was €2.4 billion (2017: €2.4 billion), in line with the prior year on a reported basis and up 4.1% constant currency on 2017. Growth on prior year was driven by volume increases of 8.5% in NS within GN and like-for-like (LFL) branded volume growth of 9.2% within GPN. Price was negative 4.7% in 2018 primarily driven by lower dairy markets (impacting GN) and brand investment in GPN. Acquisitions accounted for 2.1% growth in the year.
SALES VOLUME1
+6.7%GPN +9.2% (LFL branded)
NS +8.5%
Strategic relevanceSales volume is an important metric for the Group as it represents the underlying growth in sales to customers excluding any impact of price. Volume is further broken down by the Business Units to understand the brand growth within GPN and the growth in US Cheese and Nutritional Solutions within GN.
PerformanceOverall volume growth was strong in the year with the Group reporting 6.7% volume growth. The key volume growth numbers guided to the market in the year were for LFL branded volume growth in GPN and volume growth within the NS division of the GN segment. Both recorded high single digit volume growth with GPN delivering 9.2% LFL branded volume growth and Nutritional Solutions delivering 8.5% volume growth.
EBITA4
€284.9m (2017: €283.2m)+5.2% cc
Margin 11.9%
Margin 11.9%
2018
2017
%12
Strategic relevanceEarnings Before Interest, Tax and Amortisation (EBITA) from continuing operations pre-exceptional items is the key performance measure of the wholly-owned segments within the Group. The exclusion of amortisation aids comparability between our segments. EBITA margin is a key metric to ensure that growth is being driven in a responsible manner by maintaining margins within an acceptable range. The strategy for the Group is to focus on higher growth, higher margin products within GPN and GN.
PerformanceEBITA was €284.9 million in 2018, up 0.6% reported and 5.2% on a constant currency basis. EBITA growth was good across both segments in the year with GPN up 6.7% and GN up 3.0% on a constant currency basis.
Overall Group EBITA margins were largely in line with prior year at 11.9% on a reported basis which was a 10bps improvement from prior year on a constant currency basis.
ADJUSTED EARNINGS PER SHARE 1,2
91.01c (2017: 87.11c)+9.0% cc
91.0c
87.1c
2018
2017
Strategic relevanceAdjusted Earnings Per Share (EPS) is an important measure of the profitability of the Group as it represents the underlying profit per equity share in issue. As a result of the disposal of 60% of Dairy Ireland and related assets in the prior year the Group adopted a pro-forma EPS calculation to ensure a like-for-like comparison of the continuing operations, accounting for Dairy Ireland as part of the Glanbia Ireland Joint Venture in the prior year comparatives for a full year.
PerformanceAdjusted EPS was 91.0 cent, up 4.5% on a reported basis, 9.0% constant currency basis, on a pro-forma basis.
OPERATING CASH FLOW 1,4,5
€301.7m (2017: €185.0M)5
92.0%3
56.4%5
2018
2017
%12
Strategic relevanceOperating Cash Flow (OCF) measures the cash generated from operations before interest and tax payments and before strategic capital expenditure. It is a measure of the ability of the Group to convert trading profits to cash, which is then available for strategic investments and dividend payments.
PerformanceOCF was €301.7 million in 2018 which represents an increase of €116.7 million on 2017 on a like-for-like basis (excluding Dairy Ireland which became part of the Glanbia Ireland Joint Venture in 2017). The increase in cash flow over last year is primarily driven by improved working capital movements of €113.6 million in the year.
Key Performance Indicators

Glanbia plc | Annual Report and Financial Statements 2018
15
2014
GlanbiaSTOXX Europe 600 Food and Beverage Index
€100
€150
2015 2016 2017 2018
€200
RETURN ON CAPITAL EMPLOYED 2
13.2% (2017: 13.4%)
13.2%
13.4%
2018
2017
Strategic relevanceReturn on Capital Employed (ROCE)measures the efficiency of the Group’sorganic and acquisition investmentprogrammes as well as the utilisation of its assets.
PerformanceROCE in 2018 decreased by 20 basispoints to 13.2% (2017: 13.4%). This was primarily due to the near-term dilutive effect of recent acquisitions more than offsetting growth in reported EBITA.
TOTAL SHAREHOLDER RETURN 2
+11.4%
Strategic relevanceTotal Shareholder Return (TSR) reflects thevalue delivered to shareholders arising fromthe ownership of Glanbia’s shares plusdividends reinvested. TSR compared to a specific peer group or market index, is an important measure of how successful the Group has been in terms of shareholder value creation, compared with its peers over the same time period.
PerformanceGlanbia delivered a strong TSR of 11.4% in 2018. The STOXX Europe 600 Food and Beverage Index, which is a key benchmark for remuneration purposes, decreased by 6.8% in 2018. TSR over the three-year period of 2016 to 2018 was a negative 0.6% and TSR over the five-year period of 2014 to 2018 was 54.9%. Glanbia’s share price at the end of the financial year was €16.35 (2017: €14.90).
DIVIDEND PAYOUT RATIO
26.6% (2017: 25.3%)+10% increase in total dividends
26.6%
25.3%
2018
2017
Strategic relevanceDividend payout ratio reflects shareholderreturn via dividends as a percentage ofadjusted EPS in the period. The Group’s dividend policy targets a dividend payout ratio of between 25% and 35% of adjusted EPS.
PerformanceBased on a final dividend of 14.49 cent per share, total dividends for the year amount to 24.2 cent per share which equates to a 26.6% dividend payout ratio of adjusted EPS. This represents a 10% increase in total dividend versus 2017 and a return of €71.6 million to shareholders from 2018 earnings.
ENVIRONMENTAL HEALTH AND SAFETY ObjectiveMaintain the highest possible global safety standards using sites with no Lost Time Case (LTC) as a key benchmark
See page 41 for more information on Environmental Health and Safety.
Strategic relevanceThe health and safety of our employees is inherent in our Glanbia values and is reflected in our organisational goal of ‘Zero Harm’. LTC frequency rate is an established global measure of safety performance and Glanbia aspires to zero LTC.
PerformanceIn 2018, nearly 50% of our reporting locations achieved zero LTC while 37% celebrated two or more continuous years without a LTC. An analysis of the specific drivers behind LTCs drives our improvement programmes and commitments.
GLANBIA RISK MANAGEMENT SYSTEM (GRMS)ObjectiveGenerate heightened operational risk awareness to help protect the safety of our people, the wider community and the environment.
See pages 46 to 53 for more information on Risk Management.
Strategic relevanceRisk management is a key focus area for the Group. GRMS is an auditable framework for the identification and management of operational risks across the Group. It covers a number of key risk areas with assessment and ranking levels based on international risk management standards. On-site assessments are conducted by an independent third party to help drive a culture of continuous improvement across our sites. Each site is awarded a Level 1 to 5 score.
PerformanceAll locations maintained or improved theirindividual site rating from the prior year. Management action plans to address the key improvement opportunities were developed by the independent assessor and agreed with local management. Progress against these recommendations are centrally monitored.

Glanbia plc | Annual Report and Financial Statements 2018
16
> Strategic Report
SlimFast
Joann’s storyJoann wanted to change her unhealthy habits and start living a healthy and active lifestyle. After discovering SlimFast and sticking to ‘The Plan’*, she lost 40 lbs in 26 weeks, and is now keeping it off!
* Based on the SlimFast Plan (a calorie-reduced diet, incorporating regular exercise and plenty of fluids). Individual results may vary. Average weight loss 1-2lbs per week.

Glanbia plc | Annual Report and Financial Statements 2018
17
Brand Awareness US
95%SlimFast brand awareness amongst US general population. Source: Source is C+R consumer research (n=754)
Market Share US
10%SlimFast market share of US weight management market. Source: Euromonitor (2017)
Market Position UK
#1 Market position in the UK and continues to experience strong growth.Source: SPINS MULO data for 52 weeks ending 12/30/2018
Achieving your personal best with a lifestyle that focuses on nutrition, health and weight management. Consumers globally are moving towards a more holistic and long-term weight management approach to improve their health and wellbeing. This growing trend is reshaping the nutrition and weight management categories pushing them towards innovations around healthy food and beverages.
The weight management category is worth an estimated US$8 billion* annually. In November 2018, Glanbia acquired SlimFast, a leading consumer brand in the weight management market. SlimFast complements our Glanbia Performance Nutrition (GPN) brand portfolio, targeting lifestyle consumers and playing to global consumer trends which are focused on convenient formats and snacking. In addition, it will provide GPN with scale in the growing FDMC channel, in particular via its Ready-to-Drink (RTD) products. GPN will use its existing capability to support SlimFast’s growth in other channels and geographies. Innovation will continue to be a core part of the SlimFast portfolio and the recent launch of the SlimFast Keto range in the US is performing well. SlimFast is the fastest-growing brand in the weight management category in the US** and the largest such brand in the UK.
* Nielsen/NBJ** Source: 2015-2017, Sales CAGR based on IRI data .
Strategy-in-actionFuelling ambition
Watch the video at https://www.slimfast.com/success-stories
Glanbia plc | Annual Report and Financial Statements 2018
18
> Strategic Report
Operations ReviewGlanbia Performance Nutrition
Growing and extending our brand portfolio
Who we are
We are a global performance nutrition brand family with an emerging presence in lifestyle nutrition.
Key stats
Hugh McGuireCEO Glanbia Performance Nutrition
Our mission
Inspiring people everywhere to achieve their performance and healthy lifestyle goals.
Our brands
Performance Lifestyle
Volume growth
9.2%Like-for-like branded growth
Revenue
€1.2bnBrands
9Ranked in the top 3 performance nutrition brands in more than 20 countries
EBITA Margin
14.7%
Glanbia Performance Nutrition has a portfolio of nine brands – Optimum Nutrition (ON), BSN, Isopure, Nutramino, ABB, thinkThin, Amazing Grass, Body & Fit and SlimFast. Our products are sold in over 100 countries and our brands are in the top three performance nutrition brands in more than 20 countries.
SlimFastGlanbia completed the acquisition of SlimFast on 19 November 2018 for US$350 million (exclusive of additional working capital and cash). The SlimFast brand provides GPN with an incremental growth opportunity within the US and UK markets where GPN has a strong existing presence.

Glanbia plc | Annual Report and Financial Statements 2018
19
PerformanceOverview
€’m FY 2018 FY 2017 Change
Constant Currency
Change
Revenue 1,179.6 1,121.1 +5.2% +9.5%EBITA 173.1 169.7 +2.0% +6.7%EBITA margin 14.7% 15.1% -40bps -40bps
All commentary is on a constant currency basis.
GPN delivered a good performance in 2018 with an overall increase in revenue of 9.5%. This was primarily driven by a strong volume performance which increased by 9.1% year-on-year as a result of demand growth in all regions. Acquisitions drove revenue growth of 4.5%. Price declined 4.1% due to brand investment, innovation support and pricing initiatives to negate the impact at consumer level of foreign exchange headwinds and tariffs in certain key markets with the rate of pricing decline moderating in the fourth quarter.
Like-for-like branded revenue growth versus prior year was up 5.3% with like-for-like branded volume growth up 9.2%. As in recent years, GPN had a significant seasonal uplift in the fourth quarter across all regions as retail partners prepared for specific consumer health and wellness initiatives ahead of the new year. North America delivered good growth in the second half of the year driven by the expansion of the online and FDMC channels, with the market remaining particularly competitive for Ready-to-Eat formats (RTE). In LAPAC strong momentum continued throughout the year and in EMEA, GPN’s dedicated direct-to-consumer platform, Body & Fit, was a key driver of growth.
GPN EBITA was €173.1 million which was a 6.7% increase on the prior year with EBITA margin of 14.7%, down 40 basis points somewhat impacted by tariff costs, foreign exchange headwinds and brand investment.
Innovation continued to be a key element of branded growth with new products in energy, isolates and plant-based formats performing strongly. GPN has a target of delivering at least 15% of revenue from products launched within the last three years and exceeded this metric in 2018. This enabled GPN to navigate the various consumer shifts in its markets, differentiate its brands as well as deliver on regional preferences in meeting the needs of its performance and lifestyle consumers.
The acquisition of SlimFast was completed in November 2018. The brand had a strong performance in 2018, and on a pro-forma basis the business grew its full year revenue by 17% year-on-year to US$247 million as a result of innovation and strong in-market execution.
GPN 2018 Revenue
Revenue Channel Mix
2015
2018
FDMC Online Distributor Specialty
10% 22% 32% 36%
21% 28% 25% 26%
Revenue Format Mix
2015
20184% 5% 5% 15% 71%
4% 5% 14%14% 63%C
AP
S/T
AB
SR
TD RTE ProteinEnergy
Revenue Region Mix
2015
2018
North America RoW
65% 35%
61% 39%
“ Our success in 2018 was achieved by the continual improvement of our core product ranges and introducing new innovations to excite and inspire our consumers.”
Engaging consumers through content innovation Vertical video; GPN continues to invest in its e-commerce and digital capabilities increasing omni-platform reach and engagement.––––––––
4.6m Facebook likes+48% ( 2017 v’s 2018 )––––––––
Channel mixGPN continues to invest in, and diversify its channel mix. Online, as the fastest growing channel, is a key driver of growth and represented 28% of GPN revenues in 2018. FDMC retailers are another important channel and represented 21% of 2018 revenues. This channel is predominantly oriented towards the lifestyle consumer, a category where we have experienced good success, having more than doubled our share of sales since 2015. In 2018 we acquired SlimFast, which will provide further scale and a platform for innovation in this channel. The Specialty channel accounted for 26% of GPN’s 2018 revenues. Specialty retail remains a key channel for performance oriented consumers. Finally 25% of GPN sales in 2018 came via distributors. This is mainly through regional markets where we rely on local partners to service certain route-to-market channels.
Regional distributionA core part of our strategy is to grow our business beyond North America. In 2018, 39% of total revenues were derived from outside North America. Key countries where we experienced strong growth included, Australia, India, Mexico, South-East Asia, Benelux and Germany.
Format mix As consumers demand convenient formats innovation is key to achieving success in this area. Our RTE products almost tripled in share of sales to 14% in 2018 versus 2015. With our global flagship brand – Optimum Nutrition, Ready-To-Mix (RTM) protein powder remains our largest product format representing 63% of 2018 sales. RTD share of sales remained relatively flat between 2015 and 2018, however with the acquisition of SlimFast we expect our share of sales from RTDs to grow materially in 2019. Energy powders remains an attractive format for GPN.

Glanbia plc | Annual Report and Financial Statements 2018
20
> Strategic Report
Global trendsAs interest in health and wellness around the world continues to grow, we see four major trends active across a range of countries and regions. The sports nutrition category continues to be “mainstream” moving beyond the traditional focus areas of strength, powders, whey and specialty stores to embrace broader fitness motivations, online purchasing and plant-based nutrition. Interest in active lifestyles in consumers aged 40 years or older, both male and female, has continued to accelerate, evidenced by the growing number of “Masters” events around the world. Consumers in this demographic have higher income and are more educated than ever before on the changing needs of their bodies in order to stay active. Healthy snacking, including Ready-to-Eat and Ready-to-Drink formats that cater to the “on-the-go” consumer lifestyle, continues to accelerate with consumers enjoying many more choices depending on their specific needs. The “clean and transparent” trend has moved far beyond labelling as consumers continue to look for products with reduced ingredient lists, less cluttered packaging design and a sustainable approach to the community and the environment.
Body & Fit: investing in our Direct-to-Consumer (D2C) channel to support future growth
In 2018 Body & Fit, our D2C brand, continued to show positive momentum. In line with our growth strategy we have increased the product range on offer.
Key to Body & Fit’s growth strategy is the evolution of our e-commerce platform. In 2018 we continued the development of our world-class e-commerce platform, Hybris, which is set to launch in 2019. This leading D2C platform is scalable and supports our strategic objective of international expansion. Coupled with further investment in data analytics tools, Hybris will provide a better understanding of our customers shopping habits and ultimately enable us to improve their shopping experience.
In tandem with the roll out of this new infrastructure, Body & Fit also continued to extend its international reach, with the launch in 2018, of a new UK website: https://www.bodyandfit.co.uk/
While we continue to focus on existing websites in France and Germany and in our core market in the Netherlands, the launch of the UK website offers the opportunity to target a growing health and fitness market.
In 2018 we also launched Body & Fit’s own clothing range, offering sportswear that motivates you to get moving.
The sportswear market benefits from consumers increasingly seeking to convey their healthy lifestyles while athleisure brands are in strong demand as consumers become more interested in their appearance while exercising.
Watch the video: https://www.bodyandfit.co.uk/about-body-and-fit/
Strategy-in-action
Website Visits––––––––
20mNo. of visits to Body & Fit websites annually.
Engagement––––––––
67 NPSBody & Fit Net Promoter Score (NPS) 2018. Source: Consumer research; n=10,200 across the Netherlands, Germany and France
Trusted Brands ––––––––
52%Percentage of consumers who only buy from brands they completely trust.Source: Euromonitor
Operations Review continuedGlanbia Performance Nutrition continued
Strategic priorityGPN: Digital The online channel percentage of GPN’s revenues in 2018. ––––––––
28 % Online revenue + 27% v’s 2015 ––––––––

Glanbia plc | Annual Report and Financial Statements 2018
21
Consumer trendsNew research recently carried out by GPN identified seven key motivations for pursuing an active lifestyle. These motivations range from the traditional sports nutrition industry goal of building muscle mass to weight management. Consumers are usually driven by more than one of these motivations throughout the year depending on their specific goals – either training for an event or simply being in “maintenance” mode. Motivations are generally consistent across geographies, although some markets show a higher motivation for general athletic performance than say building muscle mass. GPN are also seeing strong demand from both Millennials and Generation Z for brands that contribute to the wider environment and community.
Brand portfolioThe GPN brand portfolio satisfies the full range of motivations. The Sports Nutrition brands – Optimum Nutrition, ABB, BSN, Body & Fit and Isopure cater for more physically active consumers; thinkThin, Amazing Grass and Nutramino address active lifestyle and wellness motivations while SlimFast satisfies weight management.
Strategic pillarsOur strategy is formulated to deliver on our 2022 ambitions for the business. As part of Glanbia’s 2018 Capital Markets Day, we purposefully aligned our strategy around our core brands. Optimum Nutrition, as our global flagship brand, will pursue growth in all channels, in all markets. ABB, BSN and Isopure are established US brands with an international presence. Amazing Grass is predominately a US brand and will continue to build distribution and awareness in the US before expanding into other regions. thinkThin is a North American FDMC brand. Body & Fit is our dedicated D2C brand and will continue rolling out its repeatable growth model, launching in new attractive markets where we believe the D2C model will have greatest relevance. SlimFast will focus on expanding distribution and velocities in US and UK markets while adding to its portfolio with compelling innovation. Across the board, the desire to innovate and acquire across our core and adjacent categories remains unchanged.
Strategic prioritiesInnovationWe remain focused on further leveraging our custom-built innovation facility co-located with the commercial teams. Our goal is to meet or better our target of 15% of net revenue from products launched in the previous three years and in 2018 we exceeded this target achieving 19.8%.
Winning in Omni-channelAs our consumers shift purchasing behaviour we are broadening our channel reach across key markets. The depth of our brand portfolio enables us to appeal to consumers who purchase across multiple channels.
Digital Our focused investment in e-commerce and in-house digital capabilities, in particular our Body & Fit platform, will enable us to redefine consumer engagement by developing powerful digital capabilities.
International We will continue to grow internationally by selectively scaling in attractive, fast-growing geographies. Our aim is to further lean into the needs of regional consumers to scale our brands to full portfolio potential.
Selective M&ATo further enhance our portfolio value, we will continue to execute opportunities to acquire brands that are aligned with our core or are a strategic adjacency to our existing performance and lifestyle brands.
People Our people are our greatest asset and we will continue to hire, retain and develop the best people.
GPN growth ambitionsOur ambition is growth and as part of the Capital Markets Day 2018, we set our 2022 ambitions. We are targeting a 2018-2022 average EBITA margin of 13-15% and revenue of €1.8bn by 2022.
Hugh McGuire CEO Glanbia Performance Nutrition
Strategic priorityGPN: Innovation In 2018 we exceeded our innovation target of 15% achieving 19.8% of net revenue from products launched in the previous three years.––––––––
19.8% Innovation––––––––
Our 2022 Ambition
2022 Revenue
€1.8bn
2018-2022 average EBITA margin
13-15%
Annual sales from new products (launched
in the last 3 years)
15%
Growth drivers
Innovation Win in omni-channel
Invest in digital
Accelerateinternational
Selective M&A

Glanbia plc | Annual Report and Financial Statements 2018
22
> Strategic Report
Functional Snacks

Glanbia plc | Annual Report and Financial Statements 2018
23
Healthy snacking Innovative partnerships to serve a growing market.Consumers are seeking quick and convenient ways to achieve a healthier lifestyle. Functional snacks, fortified nutritionals, and naturally nutrient-dense food and drinks in convenient formats are enabling them to meet their lifestyle goals.
Annual sales of functional snacks are projected to reach US$8.5 billion* by 2020 but Ready-to-Eat (RTE) protein products continue to stand out from the rest of the snack pack. Health-conscious consumers demand protein because it provides energy, sates hunger and can support a weight management goal.
Glanbia Nutritionals continues to leverage its extensive dairy and non-dairy protein capability in the healthy snacking category. With production facilities in Europe, Asia and North America, we are a diverse business with state-of-the-art technologies servicing a wide-range of end markets and offering ingredient solutions with applications in a number of areas including extended shelf life, reduced sugar and enhanced texture and taste.
With our sophisticated and comprehensive bar and snack library that showcases capability and responds to current trends we enable our customers to deliver healthy snacks with the maximum nutritional value without compromising on taste, texture or format.
*(NBJ 2018)
Watch the video at https://www.glanbianutritionals.com/en/what-we-do/categories/bars-cereals-snacks
Bar category
US$6bnEstimated value of US bar category
Source: IRI Scan Data
Convenient foods
10% CAGRThe “on-the-go” snacking sub-category achieved a CAGR of 10% between 2012 and 2017
Source: Nielsen (2017)
Clean labelling
31%Products with clean labelling/transparency claims represent 31% of sales in the US consumer goods landscape.
Source: Nielsen (2017)
Strategy-in-actionFuelling ambition

Glanbia plc | Annual Report and Financial Statements 2018
24
> Strategic Report
Operations Review continuedGlanbia Nutritionals
Creating and sustaining market leading positions
Who we are
Glanbia Nutritionals (GN) comprises; Nutritional Solutions (NS) and US Cheese.
Brian PhelanCEO Glanbia Nutritionals
Market
#1Producer of American-style cheddar cheese.
Revenue
€680m
US Cheese
We are the number one producer of American-style cheddar cheese, supplying our natural cheese to brand owners and other leading food service organisations globally.
Key stats: US Cheese
Market
#1Producer of whey protein isolate.
Revenue
€527m
Nutritional Solutions (NS)
NS is a global provider of innovative nutritional and functional solutions. Through its extensive portfolio of dairy and non-dairy ingredients and capabilities, NS provides a wide range of science-led solutions to customers across the globe.
Key stats: NS
Nutritional Solutions (44%) US Cheese (56%) Dairy (39%)
Non-Dairy (61%)
Revenue by division Nutritional Solutions – Dairy and non-Dairy revenues
Glanbia Nutritionals Revenue 2018

Glanbia plc | Annual Report and Financial Statements 2018
25
PerformanceOverview
€’m FY 2018 FY 2017 Change
Constant Currency
Change
Revenue 1,206.7 1,266.0 (4.7%) (0.6%)EBITA 111.8 113.5 (1.5%) +3.0%EBITA margin 9.3% 9.0% +30bps +40bps
All commentary is on a constant currency basis
GN delivered a good profit performance in 2018. Total GN revenues were €1,206.7 million, a decrease on prior year of 0.6%, as volume growth of 4.6% was offset by price decline of 5.2%. Volume growth was largely driven by Nutritional Solutions (NS) and price decline related primarily to lower dairy markets. GN’s EBITA was €111.8 million, a 3.0% improvement versus prior year, with a 40 basis point improvement in EBITA margin to 9.3%.
Nutritional Solutions NS represents the majority of GN EBITA with a margin in the mid-teens range. NS delivered a good performance in 2018 with revenue of €526.7 million, an increase of 3.0% on the prior year. Volume growth of 8.5% was broadly based across major product groups with both global and regional customers. These customers operate in a variety of end market categories, with growth for NS driven by the ever-increasing trend of consumers seeking nutritional products with added protein, clean label, convenience and functionality. Pricing declined by 5.5% mainly reflecting relatively lower whey markets in 2018 versus the prior year.
US CheeseUS Cheese delivered an EBITA margin in the low-to-mid single digit range. US Cheese delivered a good operational performance in 2018 increasing volumes by 1.7%. Overall revenue was €680.0 million, a decrease of 3.1% with volume growth offset by a price decrease of 4.8%. Volume growth was achieved mainly through improved yields year-on-year. Pricing was lower as a result of reduced market prices but this did not impact earnings or margins due to the milk procurement model in place.
Global market trendsA new generation of functional foods and beverages, packaged in convenient formats, is emerging as consumers prioritise their health and fitness. Functional foods have added ingredients which have a potentially positive effect on consumer’s health, beyond basic nutrition. While protein remains the most desired functional food ingredient, and the cornerstone of GN, consumer appetite for novel functional foods and nutritional solutions is increasing with significant interest in both dairy and plant-based nutrition. This growing demand has led to functional and nutritional ingredients being incorporated into a variety of increasingly sophisticated and complex applications, from desserts to beverages and particularly bars and snacks. The rapid growth of the healthy snacking category is further supported by the rise in clean label and on-the-go convenience food and beverages with mindful consumers unwilling to sacrifice quality for convenience.
NS market categories NS is a leading leading provider of customised nutrient premixes, advanced-technology protein solutions, functional beverages and flavours. NS has a diverse product portfolio and supports a range of ingredients and solutions in Ready-to-Eat (RTE), value added beverages and powder based formats in a number of categories outlined below.
Sports & lifestyle nutritionWe collaborate with high performance sports nutrition brands to provide an unrivalled set of specialty solutions, creating products that build muscle, accelerate recovery and increase endurance.
Mainstream food & beverageWe enhance the nutrition, taste, texture and appearance of healthy, convenient, food & beverage solutions. We have pioneered functional bar solutions for protein fortification, specific textural benefits and extending shelf life.
SupplementsOur innovations span new formulations and formats, from capsules and gummies to tablets and targeting a broad spectrum of health benefits. NS has custom blended over 50 micronutrients with binders and flavours to create one easy, turnkey solution for successful multivitamin brands.
Clinical nutritionOur solutions are designed to meet the unique nutritional needs of aging populations and support healthy lifestyles. NS delivers a solution for the most nutritionally sensitive patients, bringing together precision, specialty nutrient blending, high hygiene manufacturing and sachet packaging to create medical nutrition used in the management of clinical dietary conditions.
Early life nutritionFrom infants, to toddlers, to pre-schoolers and beyond, we offer safe, quality-assured, science-based solutions you can trust. We manufacture and blend lactoferrin, lactose and key developmental micronutrients to create nutritionally rich infant formula.
“In 2018, we made significant progress on our strategic priorities and in that context are delighted to announce our exciting acquisition of Watson.”
Powerful Protein 40% of all millennials believe “high in protein” is a very important product attribute in their food and beverage. ––––––––
40% Source: Euromonitor 2018––––––––

Glanbia plc | Annual Report and Financial Statements 2018
26
> Strategic Report
Glanbia NutritionalsStrategyOur 2022 ambition is to achieve a €1 billion Nutritional Solutions (NS) business, while maintaining, with our joint venture partners, our leadership position in US Cheese.
Nutritional Solutions NS provides market-leading functional ingredient solutions to customers across many segments of the nutrition landscape. As part of Glanbia’s 2018 Capital Markets Day, we stated a number of priority development areas for the Nutritional Solutions business.
Strategic PrioritiesBuild premix and bioactivesThe micronutrient premix business continues to perform well and we remain ambitious for growth. As this business evolves, we continue to expand in our core markets while exploring new geographic opportunities, and growing globally with key strategic customers. Where relevant, we will consider suitable strategic acquisition opportunities to enhance our capabilities and geographic reach.
Leverage protein capability into healthy snackingAs consumer habits continue to evolve with a broadening of consumption occasions and preferred formats, we are leveraging our core expertise to innovate new solutions and applications to address this market need. For example, we are launching a new range of innovative crisps that are usable in an ingredient or snack format. We also have the ability to tailor these snacks for regional and ethnic palates using our innovative flavours and high protein seasonings. By leveraging our deep-seated technical knowledge across international geographies, we can develop appropriate solutions as these markets evolve.
Scale flavoursAs consumers expand their tastes, and brand owners seek to offer increasingly novel and tailored nutrition solutions, access to flavour capabilities is a key requirement. NS has developed flavour capability in our innovation and production centres. Specialising in flavours for powders, beverages and healthy snacks, this capability enables us to offer our customers holistic solutions.
Strategic priorityGN: Premix GN is the number two provider of global micronutrient premixes. ––––––––
#2 Market position––––––––
Operations Review continuedGlanbia Nutritionals continued
Watson: an exciting acquisition in the premix solutions category
Glanbia Nutritionals has strong ambitions and aims to achieve these via a combination of organic growth and complementary acquisitions.
As highlighted in our 2018 Capital Markets Day we have identified premix, within our NS business, as a high growth area. In line with this growth strategy in February 2019, we announced the agreement to acquire Watson for $89 million.
Watson is a third-generation US-based business which focuses on non-dairy ingredient solutions. It specialises in vitamin and mineral premix solutions, edible films and material conditioning for global and regional customers in the food, nutritional, supplement and personal care categories. The acquisition of Watson is a highly complementary addition to our NS business.
With an 80-year history of providing exceptional quality, capability and service to its customers, Watson will further strengthen NS’s capability set and enhance our ability to create superior premix solutions that address the complex formulation requirements of today’s increasingly sophisticated applications.
The knowledge and experience of the combined R&D teams will further cement our position as a leader in the micronutrient premix sector.
The acquisition will also broaden the NS customer base and category reach and provide additional US East Coast production capability. NS’s custom nutrient premix production footprint now extends coast to coast across the US with facilities in California, Missouri, Illinois and Connecticut. This US presence is supplemented by facilities in Germany and China to provide global scale and ingredients solutions to our customers.
Watson employs more than 300 employees across three production facilities in Connecticut and Illinois. We expect the transaction to be to complete in Q2 2019.
Strategy-in-action
Premix market
6.5% CAGRThe global food premix market is expected to grow at 6.5% CAGR from 2018-2023. Source: Premix global analysis forecast ( 2018-2023)
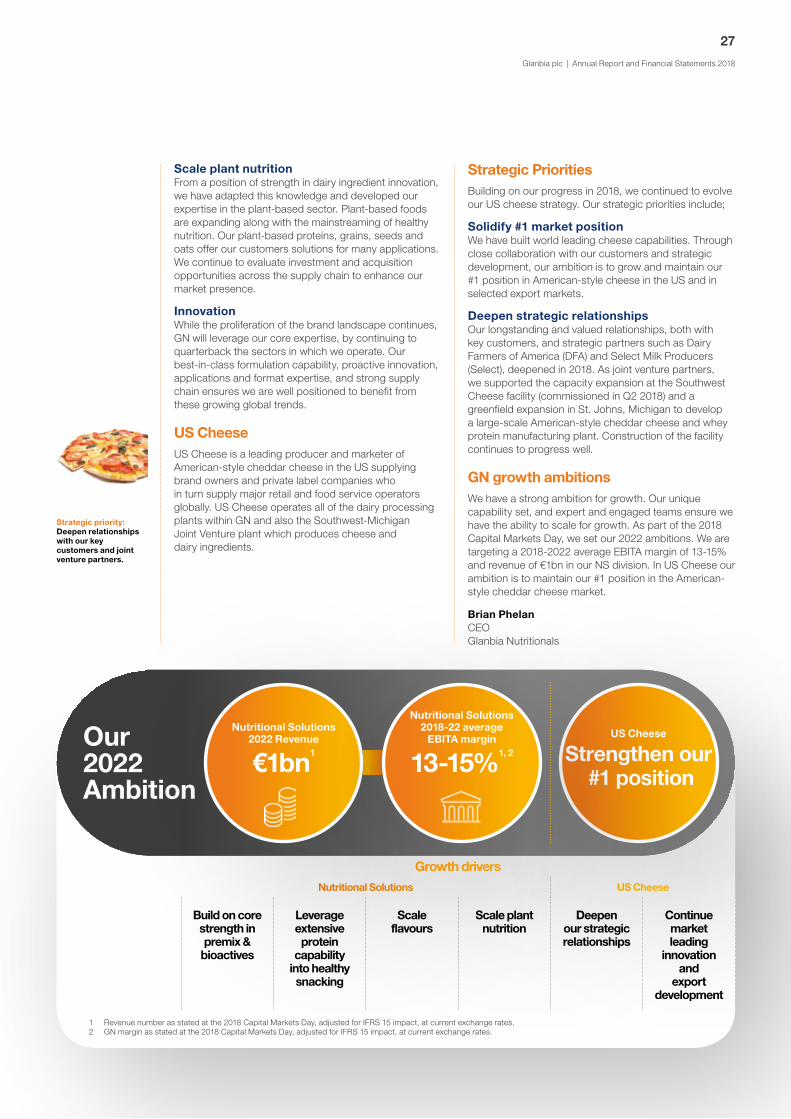
Glanbia plc | Annual Report and Financial Statements 2018
27
Our 2022 Ambition
Strategic PrioritiesBuilding on our progress in 2018, we continued to evolve our US cheese strategy. Our strategic priorities include;
Solidify #1 market positionWe have built world leading cheese capabilities. Through close collaboration with our customers and strategic development, our ambition is to grow and maintain our #1 position in American-style cheese in the US and in selected export markets.
Deepen strategic relationshipsOur longstanding and valued relationships, both with key customers, and strategic partners such as Dairy Farmers of America (DFA) and Select Milk Producers (Select), deepened in 2018. As joint venture partners, we supported the capacity expansion at the Southwest Cheese facility (commissioned in Q2 2018) and a greenfield expansion in St. Johns, Michigan to develop a large-scale American-style cheddar cheese and whey protein manufacturing plant. Construction of the facility continues to progress well.
GN growth ambitionsWe have a strong ambition for growth. Our unique capability set, and expert and engaged teams ensure we have the ability to scale for growth. As part of the 2018 Capital Markets Day, we set our 2022 ambitions. We are targeting a 2018-2022 average EBITA margin of 13-15% and revenue of €1bn in our NS division. In US Cheese our ambition is to maintain our #1 position in the American- style cheddar cheese market.
Brian PhelanCEO Glanbia Nutritionals
Scale plant nutritionFrom a position of strength in dairy ingredient innovation, we have adapted this knowledge and developed our expertise in the plant-based sector. Plant-based foods are expanding along with the mainstreaming of healthy nutrition. Our plant-based proteins, grains, seeds and oats offer our customers solutions for many applications. We continue to evaluate investment and acquisition opportunities across the supply chain to enhance our market presence.
Innovation While the proliferation of the brand landscape continues, GN will leverage our core expertise, by continuing to quarterback the sectors in which we operate. Our best-in-class formulation capability, proactive innovation, applications and format expertise, and strong supply chain ensures we are well positioned to benefit from these growing global trends.
US CheeseUS Cheese is a leading producer and marketer of American-style cheddar cheese in the US supplying brand owners and private label companies who in turn supply major retail and food service operators globally. US Cheese operates all of the dairy processing plants within GN and also the Southwest-Michigan Joint Venture plant which produces cheese and dairy ingredients.
Strategic priority: Deepen relationshipswith our keycustomers and joint venture partners.
Nutritional Solutions US Cheese
Build on core strength in premix & bioactives
Leverage extensive protein
capability into healthy snacking
Scale flavours
Scale plant nutrition
Deepen our strategic relationships
Continue market leading
innovation and
export development
US Cheese
Strengthen our #1 position
1 Revenue number as stated at the 2018 Capital Markets Day, adjusted for IFRS 15 impact, at current exchange rates.2 GN margin as stated at the 2018 Capital Markets Day, adjusted for IFRS 15 impact, at current exchange rates.
Nutritional Solutions 2022 Revenue
€1bn1
Nutritional Solutions 2018-22 average
EBITA margin
13-15%1, 2
Growth drivers

Glanbia plc | Annual Report and Financial Statements 2018
28
> Strategic Report
Operations Review continuedStrategic Joint Ventures
Driving growth through strong strategic partnerships
Joint Venture Business Performance
€’m FY 2018
FY 2017 Change
Constant Currency
Change
Revenue 1,283.8 1,093.4 +17.4% +19.3%EBITA 65.8 63.4 +3.8% +5.4%EBITA margin 5.1% 5.8% -70bps -70bps
Share of Profit after tax 45.3 42.8 +5.8% +7.1%
All commentary is on a constant currency basis.
Glanbia’s share of profit after tax (“PAT”) from Joint Ventures (JVs), pre-exceptional, increased by €2.5 million to €45.3 million in 2018 when compared to the prior year result driven by revenue growth. Glanbia’s share of JV’s revenues increased by 19.3% versus the prior year. This was driven by a volume increase of 9.4%, as a result of capacity expansion at Southwest Cheese and a good operating performance at Glanbia Ireland and Glanbia Cheese UK. This was offset by a price decline of 5.0%
as a result of lower year-on-year dairy markets. The Dairy Ireland acquisition made by Glanbia Ireland in 2017 contributed 14.9% of JV revenue growth. The Group accounts for all of its JVs using the equity method of accounting with only its share (based on percentage ownership) of the JV’s PAT contributing to the adjusted Earnings Per Share calculation. Any trade between Glanbia and JVs is done at arms-length. All JVs are independently financed with their own dedicated banking facilities, each of which are non-recourse to the plc.
Glanbia IrelandGlanbia Ireland (GI) Joint Venture is 60% owned by Glanbia Co-operative Society Limited and 40% by Glanbia plc. It is the largest milk processor in Ireland producing a range of value-added dairy ingredients and consumer products as well as selling farm inputs. 2018 was a challenging year for our Irish supply base due to a number of weather-related events. This resulted in milk volumes being 0.5% behind in the first half but over 10% ahead of 2017 in the second half of the year. Despite this volatility of supply, GI delivered a good performance in 2018 driven by volume growth which more than offset
Joint Venture
Glanbia Ireland Glanbia Cheese UK Glanbia Cheese EU (a) Southwest Cheese
(b) Michigan
Key activities
Largest Irish-based integrated agri-food and dairy nutrition business
Large-scale manufacturer and seller of
mozzarella cheese
JV established in 2018 to build a mozzarella
cheese plant
US producers of American-style cheddar
cheese and whey ingredients
Location Ireland United Kingdom Ireland(a) New Mexico, US (b) Michigan, US
2018Revenue
€724.0m* €158.6m*Commissioning
in 2020(a) €401.2m*
(b) Commissioning in 2021
* Share of Joint Venture Revenue is calculated as the share of Revenue attributed to Glanbia based on Glanbia’s percentage ownership in the JV. See glossary page 204 for further details.
Robust Joint Venture model

Glanbia plc | Annual Report and Financial Statements 2018
29
declines in price as a result of lower year-on-year dairy markets. Milk volumes processed increased by 5.1% to a total GI milk pool of 2.7 billion litres. GI will continue, over the next five years, to support the significant growth plans of the Irish dairy supply base and will continue to invest in additional processing capacity and capability to produce value-added ingredients. On 22 January 2019, Gl announced plans to enter into a strategic partnership with Royal A-ware, a leading global cheese and dairy producer in the Netherlands. This partnership plans to invest €140 million in building a new continental cheese manufacturing facility in Belview, Co. Kilkenny, Ireland with commissioning expected by 2022. This investment will be funded by a combination of equity from the partners (GI and Royal A-ware), non-recourse bank lending in the partnership as well as government grants. Glanbia plc will not be directly financing this investment.
Glanbia Cheese UKGlanbia Cheese UK joint venture is a large-scale manufacturer and seller of mozzarella cheese, 51% owned by Glanbia plc and 49% owned by a global specialist mozzarella producer, Leprino Foods Company. The business has two state-of-the-art mozzarella cheese manufacturing facilities: one in Llangefni, Wales and one in Magheralin, Northern Ireland. Glanbia Cheese UK delivered a reduced performance in 2018 versus prior year as a result of dairy market pricing.
Glanbia Cheese EUGlanbia Cheese EU was established in 2018 as a 50:50 joint venture between Glanbia plc and Leprino Foods Company. On 16 July 2018 Glanbia Cheese EU announced plans to build a new mozzarella cheese and whey facility in Portlaoise, Co Laois, Ireland. The project is expected to be commissioned in 2020. The total project cost is expected to be €130 million of which Glanbia will invest approximately €35 million into the joint venture. Glanbia Cheese EU will source a significant amount of its key raw materials from Glanbia Ireland and will be focused on sales to the European mozzarella market.
Southwest CheeseSouthwest Cheese (SWC) is a joint venture with Dairy Farmers of America (DFA) and Select Milk Producers (Select) and is a large-scale producer of American-style cheddar cheese and whey ingredients based in New Mexico, US. In 2018 SWC delivered a good performance. The US$140 million investment to expand production capacity at SWC by 25% was completed in Q2 of 2018. This expansion enabled strong volume growth during the year, which was somewhat offset by negative pricing as a result of lower year-on-year US Cheese pricing. SWC works closely with Glanbia Nutritionals as the operating partner of the plant and as a route-to-market for all of its cheese and dairy ingredients production. GN provides operational, technical and commercial expertise while its partners DFA and Select provide a long-term secure milk supply. This combined with its cheese and whey facilities in the wholly-owned operations in Idaho, US underpin GN’s position as the #1 American-style cheddar cheese manufacturer and marketer and the leader in advanced whey proteins.
In 2018, a new 50:50% joint venture was established between Glanbia plc and SWC’s existing joint venture partners, DFA and Select. This new joint venture will construct a US$470 million cheese and whey facility, based in St. John’s, Michigan. Construction is underway with commissioning expected to be completed by 2021. Glanbia’s total equity investment in this project is US$82.5 million with this investment being made over the construction phase of the project. The remaining financing will come from the joint venture partner and non-recourse bank lending within the Michigan JV.
Our 2022 Ambition
2022 Revenue1
€1.2bnEBITA Margin2
Low-to-mid single digits
Projected investment in dairy assets with our partners to 2022
€1bn
Growth driversInvestment programme to support Glanbia Ireland expansion is on track
New plant in Michigan, US is on track to be commissioned in 2021
Southwest Cheese 25% expansion commissioned in Q2 2018
Glanbia Cheese announced plans to build a new €130m facility in Ireland to be commissioned in 2020
1 JV revenue number as stated at the 2018 Capital Markets Day, adjusted for IFRS 15 impact, at current exchange rates.2 JV EBITA margin as stated at the 2018 Capital Markets Day, adjusted for IFRS 15 impact, at current exchange rates.
Glanbia Ireland total milk pool in 2018––––––––
2.7bnlitres––––––––
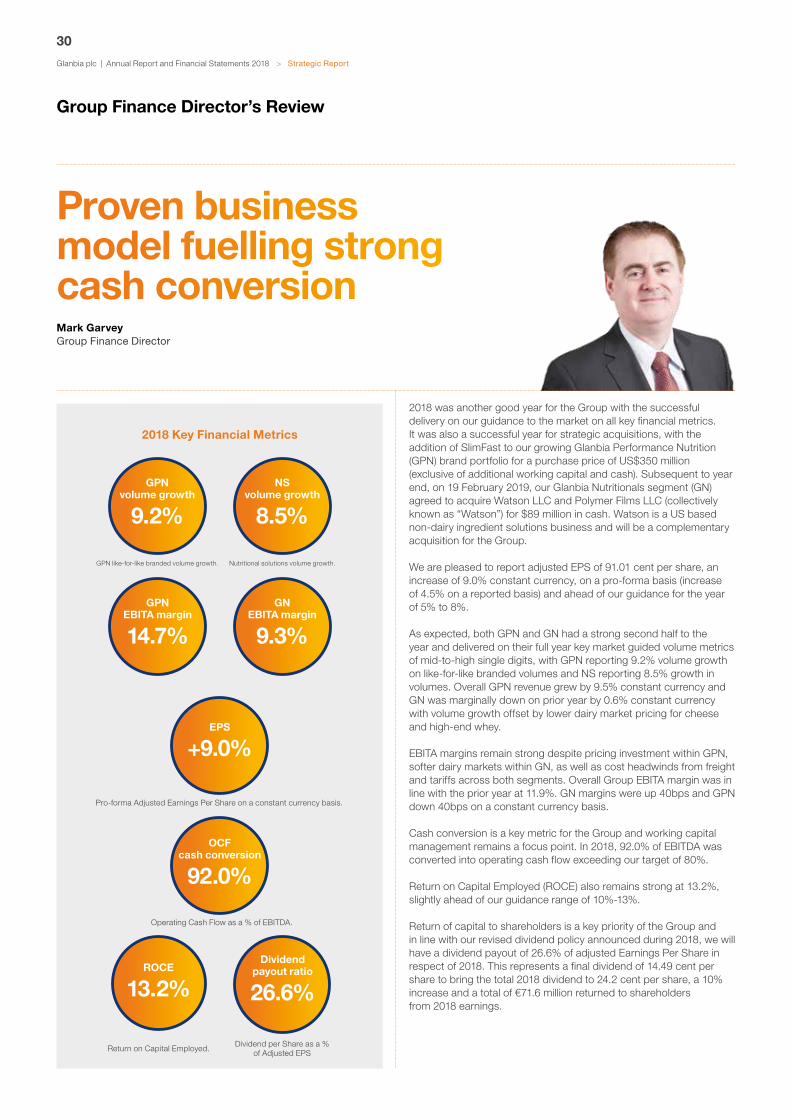
Glanbia plc | Annual Report and Financial Statements 2018
30
> Strategic Report
Group Finance Director’s Review
Proven business model fuelling strong cash conversionMark Garvey Group Finance Director
2018 was another good year for the Group with the successful delivery on our guidance to the market on all key financial metrics. It was also a successful year for strategic acquisitions, with the addition of SlimFast to our growing Glanbia Performance Nutrition (GPN) brand portfolio for a purchase price of US$350 million (exclusive of additional working capital and cash). Subsequent to year end, on 19 February 2019, our Glanbia Nutritionals segment (GN) agreed to acquire Watson LLC and Polymer Films LLC (collectively known as “Watson”) for $89 million in cash. Watson is a US based non-dairy ingredient solutions business and will be a complementary acquisition for the Group.
We are pleased to report adjusted EPS of 91.01 cent per share, an increase of 9.0% constant currency, on a pro-forma basis (increase of 4.5% on a reported basis) and ahead of our guidance for the year of 5% to 8%.
As expected, both GPN and GN had a strong second half to the year and delivered on their full year key market guided volume metrics of mid-to-high single digits, with GPN reporting 9.2% volume growth on like-for-like branded volumes and NS reporting 8.5% growth in volumes. Overall GPN revenue grew by 9.5% constant currency and GN was marginally down on prior year by 0.6% constant currency with volume growth offset by lower dairy market pricing for cheese and high-end whey.
EBITA margins remain strong despite pricing investment within GPN, softer dairy markets within GN, as well as cost headwinds from freight and tariffs across both segments. Overall Group EBITA margin was in line with the prior year at 11.9%. GN margins were up 40bps and GPN down 40bps on a constant currency basis.
Cash conversion is a key metric for the Group and working capital management remains a focus point. In 2018, 92.0% of EBITDA was converted into operating cash flow exceeding our target of 80%.
Return on Capital Employed (ROCE) also remains strong at 13.2%, slightly ahead of our guidance range of 10%-13%. Return of capital to shareholders is a key priority of the Group and in line with our revised dividend policy announced during 2018, we will have a dividend payout of 26.6% of adjusted Earnings Per Share in respect of 2018. This represents a final dividend of 14.49 cent per share to bring the total 2018 dividend to 24.2 cent per share, a 10% increase and a total of €71.6 million returned to shareholders from 2018 earnings.
EPS
+9.0%
Pro-forma Adjusted Earnings Per Share on a constant currency basis.
OCF
cash conversion
92.0%
Operating Cash Flow as a % of EBITDA.
GN
EBITA margin
9.3%
GPN
EBITA margin
14.7%
GPN
volume growth
9.2%
GPN like-for-like branded volume growth.
NS
volume growth
8.5%
Nutritional solutions volume growth.
2018 Key Financial Metrics
ROCE
13.2%
Return on Capital Employed.
Dividend payout ratio
26.6%
Dividend per Share as a % of Adjusted EPS

Glanbia plc | Annual Report and Financial Statements 2018
31
2018-2022 AmbitionIn May 2018 we held a Capital Markets Day (CMD) which gave us the opportunity to present our ambition for the Group over the next 5 years. I am pleased that in the first year of this plan we have delivered on the financial metrics set out at our CMD and look forward to future years of growth and strategy implementation.
2018-2022Ambition 2018 Result
Adjusted EPS 5%-10%1 9.0%Cash conversion 80%+ 92.0%ROCE 10%-13% 13.2%Dividend payout ratio 25%-35% 26.6%
Income Statement review:
Revenue and EBITARevenue and EBITA are key performance indicators (KPIs) for the Group. In particular the Group focuses on revenue volumes and EBITA margins to assess underlying performance. Details of these KPIs are set out below.
€’m 2018 2017 Change
Constant Currency
Change
RevenueGPN 1,179.6 1,121.1 5.2% 9.5%GN 1,206.7 1,266.0 (4.7%) (0.6%)
Total Revenue 2,386.3 2,387.1 0.0% 4.1%EBITAGPN 173.1 169.7 2.0% 6.7%GN 111.8 113.5 (1.5%) 3.0%
Total EBITA 284.9 283.2 0.6% 5.2%
EBITA Margin
GPN 14.7% 15.1% -40bps -40bps
GN 9.3% 9.0% +30bps +40bps
Total EBITA Margin 11.9% 11.9% 0bps +10bps
RevenueWholly-owned revenue from continuing operations increased by 4.1% on a constant currency basis in 2018 to €2.4 billion, which is largely in line with the prior year on a reported basis. Sales volumes accounted for 6.7% of the increase, primarily driven by branded revenue growth within GPN and volume growth in GN’s Nutritional Solutions. Pricing was adverse in the year impacting revenue by 4.7%, driven primarily by lower dairy market pricing within GN and brand investment, innovation support, foreign exchange headwinds and tariff costs in certain key markets within GPN. Acquisitions, which include the results of Body & Fit for quarter one and SlimFast for just over one month, accounted for 2.1% of the increase in revenue. Details of revenue by GPN and GN segments are set out below:
Glanbia Performance Nutrition: Overall GPN revenue increased by €58.5 million from €1,121.1 million to €1,179.6 million. The key components of the increase are set out in the chart below:
The increase in revenue from 2017 was primarily driven by sales volumes with branded like-for-like revenue volumes at 9.2% growth year on year. Pricing was negative 4.1% in the year driven by increased promotional spend and trade support to our international customers to offset the impact of tariffs and foreign exchange.
Glanbia Nutritionals:Overall GN revenue decreased by €59.3 million from €1,266.0 million to €1,206.7 million which was driven primarily by the impact of foreign exchange. On a constant currency basis GN revenue was marginally down on prior year (0.6%) with volume growth offset by the negative price impact of dairy markets. GN is comprised of Nutritional Solutions and US Cheese. Details on revenue movements within GN are set out below:
Nutritional Solutions:
€600m
€400m
€500m
€300mFY17 FY17 CCFX Volume Price FY18
€531.9m€511.6m
€526.7m
(€20.3m)(5.5%)
8.5%
US Cheese:
€800m
€700m
€600m
€500m
€400mFY17 FY17 CCFX Volume Price FY18
€734.1m€702.0m
€680.0m(€32.1m)
(4.8%)
1.7%
Excluding the impact of foreign exchange, Nutritional Solutions revenue grew by 3.0%, primarily driven by 8.5% volume growth. Negative pricing accounted for 5.5% of the movement driven by lower dairy market pricing, in particular high-end whey. US Cheese revenue fell 3.1% with negative pricing of 4.8% due to lower cheese market pricing offsetting volume growth of 1.7%.
EBITAWholly-owned EBITA from continuing activities before exceptional items grew 5.2% constant currency (up 0.6% reported) to €284.9 million (2017: €283.2 million). Increased EBITA was reported from both wholly-owned segments on a constant currency basis. Overall wholly-owned EBITA margins remained in line with the prior year at 11.9%.
GPN EBITA increased from €169.7 million to €173.1 million, an increase of 6.7% on a constant currency basis. This was primarily driven by increased branded revenue and reduced input costs in the year. EBITA margins at 14.7% decreased 40bps compared to 15.1% in 2017 with reduced input costs being offset by higher trade investment, investment in the D2C business and higher freight costs and one off transaction costs in respect of the SlimFast transaction.
GN EBITA decreased from €113.5 million to €111.8 million on a reported basis driven largely by the impact of foreign exchange. On a constant currency basis EBITA increased by 3.0%. EBITA margins improved by 40bps on a constant currency basis to 9.3%.FY17 FY17 CCFX Volume Price Acquisitions FY18
€1,200m
€1,000m
€1,100m
€900m
€800m
€700m
€600m
€1,121.1m€1,077.7m
€1,179.6m
(€43.4m)(4.1%)
9.1% 4.5%
1 On a constant currency basis

Glanbia plc | Annual Report and Financial Statements 2018
32
> Strategic Report
Group Finance Director’s Review continued
Net finance costs
€’m 2018 2017 Change
Finance income 3.9 3.0 0.9Finance costs (21.4) (26.0) 4.6
Net Finance Costs (17.5) (23.0) 5.5
Net finance costs pre-exceptional items decreased by €5.5 million to €17.5 million (2017: €23.0 million). The decrease is driven primarily by the lower average levels of debt throughout the year. New facilities were drawn down in Q4 to facilitate the acquisition of SlimFast however, as this was in November there was only a marginal impact to the 2018 interest charge. The Group’s average interest rate in 2018 was 4.3% (2017: 6.3%, 3.9% excluding the exceptional costs associated with the interest on settlement of part of the US private placement debt). Glanbia operates a policy of fixing a significant amount of its interest exposure, with 75% of projected 2019 debt currently contracted at fixed rates.
Share of results of Equity accounted investees (joint ventures)
€’m 2018 2017 Change
Share of profit of joint ventures 45.3 42.8 2.5
The Group’s share of profits (pre-exceptional) increased by €2.5 million to €45.3 million (2017: €42.8 million) in the year. The share of profits in the prior year includes 40% of Dairy Ireland from 2 July 2017 following the disposal of 60% of Dairy Ireland to Glanbia Co-operative Society Limited. The results of Dairy Ireland up to the date of disposal are reflected within prior year discontinued operations. The share of results of equity accounted investees is stated after tax.
Income Taxes
€’m 2018 2017 Change
Income Taxes 32.8 38.3 (5.5)Effective Tax Rate 14.8% 17.6% (280bps)
The 2018 pre-exceptional tax charge decreased by €5.5 million to €32.8 million (2017: €38.3 million). This represents an effective tax rate, excluding equity accounted investees, of 14.8% (2017: 17.6%). This reduction is driven primarily by the reduction in the US federal corporation tax rate from 35% to 21% under the Tax Cuts and Jobs Act which was signed into US law on 22 December 2017. The overall tax charge in the prior year includes an exceptional credit of €38.7 million relating to a deferred tax credit arising from the above mentioned change in the US tax rate.
The Group currently expects that its effective tax rate for 2019 will be in the range of 13.0% to 14.0%. However, there is some uncertainty as the US authorities have until 22 June 2019 to finalise the regulations in respect of the Tax Cuts and Jobs Act and due to the evolving international tax landscape.
Exceptional itemsThere were no material exceptional items to highlight in 2018. Prior year exceptional items amounted to a gain of €98.0 million. Prior year exceptional items included rationalisation costs (€5.5 million), debt restructuring costs (€14.0 million), intangible asset amortisation (€19.4 million), tax credits (€54.5 million) including a credit in deferred tax as a result of the change in the US corporate tax rate and the tax credits relating to the other exceptional costs noted above and the gain on the disposal of the Dairy Ireland segment (€82.4 million).
The total net cash outflow during the year in respect of exceptional items was €2.6 million relating to 2017 exceptional items (2017: inflow of €177.5 million).
Profit after tax
€’m 2018 2017 Change
Profit after tax 234.0 329.4 (95.4)
Profit for the year amounted to €234.0 million (2017: €329.4 million) which represents a decrease of €95.4 million on the prior year. This decrease is primarily due to the net exceptional gains in the prior year of €98.0 million primarily driven by a gain of €82.4 million arising on the disposal of 60% of Dairy Ireland and €38.7 million from deferred tax credits arising on the reduction in the US corporate tax rate. On a pre-exceptional basis overall profit for the year increased by €2.6 million from €231.4 million to €234.0 million. This increase is driven by profit growth in both wholly-owned segments, an increase in share of profit of joint ventures, and a reduction in finance costs and taxation as discussed above offset partially by higher amortisation costs and inclusion of profits from discontinued operations (Dairy Ireland) in the prior year.
Earnings Per Share
2018 2017 Change
Constant Currency
Change
Basic (continuing activities) 79.28c 80.40c (1.4%)
Adjusted pro-forma 91.01c 87.11c 4.5% 9.0%
Basic EPS from continuing activities decreased by 1.4% driven by exceptional gains in the prior year as noted above not repeated in 2018. Pro-forma adjusted EPS has been presented as it is more reflective of the revised structure of the Group following the disposal in the prior year of 60% of Dairy Ireland. Pro-forma adjusted EPS assumes the Dairy Ireland disposal was completed at the beginning of the 2016 financial year and consequently 2017 earnings is calculated based on the net profit attributable to equity holders of the parent from continuing activities plus 40% of the share of profits after tax for Dairy Ireland, before exceptional items and amortisation of intangible assets (excluding software amortisation), net of related tax. This ensures a like-for-like comparison with 2018.
Adjusted EPS is a KPI of the Group and a key metric guided to the market. Adjusted EPS grew 9.0% constant currency on a pro-forma basis (4.5% reported) in the year, driven by the strong results of the wholly-owned segments GPN and GN together with the positive impact of reduced net finance costs and tax.

Glanbia plc | Annual Report and Financial Statements 2018
33
Cash flowThe principal cash flow KPIs of the Group and Business Units are Operating Cash Flow (OCF) and Free Cash Flow (FCF). OCF represents EBITDA of the wholly-owned businesses net of business- sustaining capital expenditure and working capital movements, excluding exceptional cash flows. FCF is calculated as the cash flow in the year before the following items: strategic capital expenditure, acquisition spend, proceeds received on disposal, loans to joint ventures, equity dividends, exceptional costs paid and foreign exchange movements. These metrics are used to monitor cash conversion performance of the Group and Business Units and identify available cash for strategic investment. OCF is a key element of Executive Directors and senior management remuneration. OCF and FCF results for the Group are outlined below:
€’m 2018 2017
EBITDA pre-exceptional 327.8 328.2Movement in working capital (pre-
exceptional) (9.7) (123.3)Business-sustaining capital expenditure (16.4) (19.9)
Operating cash flow* 301.7 185.0Net interest and tax paid (42.2) (58.4)Dividends from Joint Ventures 31.6 15.8Other inflows/(outflows) 4.3 (5.5)
Free cash flow* 295.4 136.9Strategic capital expenditure (46.2) (46.9)Equity dividends (76.0) (41.0)Acquisitions (313.0) (168.2)Disposals 1.3 208.8Exceptional items paid (2.6) (29.3)Loans to / equity in Joint Ventures (58.9) –
Cash flow pre-foreign exchange translation/ other adjustments (200.0) 60.3
Exchange translation/other adjustments (9.0) 51.4Dairy Ireland Cash flows – (41.9)
Net debt movement (209.0) 69.8Net debt at beginning of the year (367.7) (437.5)
Closing net debt (576.7) (367.7)
* Pro-forma excludes Dairy Ireland cash flows.
2018 was a strong year for cash conversion driven by improvements in working capital management. We will continue to focus on further working capital improvements in 2019 to maintain our OCF cash conversion target of greater than 80%. OCF was €301.7 million in the year which represents an increase of €116.7 million compared to prior year (prior year was prepared on a pro-forma basis to exclude Dairy Ireland related cash flows). The improvement from last year is driven primarily by improvements in working capital. The OCF of €301.7 million represents a cash conversion on EBITDA of 92% (2017: 56.4%). The OCF conversion target for the year was 80% or greater and this remains the target for 2019.
FCF also remains strong driven by the OCF set out above and the increase in dividends from joint ventures. This increase in dividends received compared to prior year was as a result of higher Glanbia Cheese UK dividends but also the commencement of dividends from the newly formed Glanbia Ireland joint venture. FCF was deployed to increase the Group’s equity dividends by €35 million following the change in dividend policy in 2018 to move to a payout ratio of 25%-35% of adjusted EPS. Acquisition spend relates to SlimFast, which was acquired in November 2018. Loans to/equity in Joint Ventures includes the initial investment in Glanbia Cheese EU, the new mozzarella cheese plant Joint Venture in Portlaoise, Ireland, and the investment in the new Joint Venture cheese plant in Michigan, US.
Group net debt
Financing KPIs 2018 2017
Net debt (€’m) 576.7 367.7
Net debt: adjusted EBITDA 1.55 times 1.07 times Adjusted EBIT: net finance cost
(interest cover) 14.8 times 7.0 times
The Group’s financial position continues to be strong. Net debt at the end of 2018 was €576.7 million. This is an increase of €209.0 million from the prior year end net debt of €367.7 million and can be primarily attributed to the acquisition of SlimFast. A new two year facility of $351 million was drawn down to support the SlimFast acquisition. Additionally in December 2018 the Group completed a refinancing of all long-term debt (excluding the US private placement) to put in place new five year facilities. At year end 2018 Glanbia had available debt facilities of €358 million with an average maturity of 3.8 years. Glanbia’s ability to generate cash as outlined above and available debt facilities ensures we have considerable capacity to finance future investments.
Net debt to adjusted EBITDA was 1.55 times and interest cover was 14.8 times, with both metrics remaining well within financing covenants. Interest cover has significantly improved compared to the prior year as finance costs in 2017 included the once off interest cost associated with the early payment of part of the private placement debt. Excluding this once-off cost the cover would have been 11.2 times in 2017.
Use of capital Capital expenditureTotal cash outflow relating to capital expenditure for the year amounted to €62.6 million (2017: €66.8 million) which includes €16.4 million of business-sustaining capital expenditure and €46.2 million of strategic capital expenditure. Strategic capital expenditure was primarily focused on the wholly-owned segments GPN and GN with spend relating to investment in the D2C IT platforms within GPN, innovation expenditure across GPN and GN and improvements to our IT infrastructure to support reporting capabilities.
Strategic acquisitionsIn November 2018 the Group completed the acquisition of KSF Holdings LLP and HNS Intermediate Corporation (“SlimFast”) for a purchase price of US$350m (exclusive of additional working capital and cash). SlimFast is a leading weight management and health & wellness brand family distributed primarily in the food, drug, mass and club (FDMC) channel in the US and UK. It is a well-established and growing brand with high levels of brand awareness in the US, its largest market. As noted in the Glanbia Capital Markets Day in May 2018, acquisitions will continue to be an important part of the growth strategy of Glanbia. Subsequent to year end, on 19 February 2019, Glanbia agreed to acquire Watson LLC and Polymer Films LLC (collectively known as “Watson”) for $89 million in cash. Watson is a US based non-dairy ingredient solutions business and will be a complementary acquisition for the Group. The Group has capacity to make further acquisitions should an opportunity arise that is in line with the strategic and financial objectives of the Group.

Glanbia plc | Annual Report and Financial Statements 2018
34
> Strategic Report
Group Finance Director’s Review continued
Investments in Joint VenturesDuring 2018 the Group made two strategic investments in new and existing Joint Ventures. Glanbia Nutritionals finalised agreements with Dairy Farmers of America, Inc. and Select Milk Producers Inc., existing joint venture partners in the Southwest Cheese Joint Venture, to build, supply and operate the planned new large scale cheese and whey facility in Michigan, US at a total cost of $470 million. Construction commenced on the site in 2018 and commissioning is expected to be completed by 2021. Overall investment in the year in this Joint Venture amounted to $40.0 million. A further $42.5 million investment will be made in this project over the remaining construction phase of the project.
The Group also announced a new Joint Venture partnership (Glanbia Cheese EU) with Leprino Foods Company to build a mozzarella cheese plant in Portlaoise, Ireland at a total cost of €130 million. The total investment in this Joint Venture in the year amounted to €8 million. The Group expects to invest a further €27 million to Glanbia Cheese EU over the construction phase of the project. The remaining financing for these projects will come from the other joint venture partners, dedicated joint venture banking facilities, which are non-recourse to Glanbia, and government grants. Glanbia Ireland continues to invest to support the growth ambitions of its Irish supply base including the creation of a new partnership with Royal A-ware to build a cheese plant in Belview, Kilkenny, Ireland for €140 million. This investment will not be directly financed by Glanbia plc and will be funded largely by non-recourse financing within the new partnership.
Return on Capital Employed (ROCE)
2018 2017 Change
Return on Capital Employed 13.2% 13.4% -20bps
ROCE decreased in 2018 by 20 basis points to 13.2%. This was driven primarily by the near-term dilutive effect of recent acquisitions. As communicated at the Glanbia Capital Markets Day in May 2018, acquisitions are going to be a key part of the growth strategy and consequently maintaining a ROCE range of between 10% and 13% is the aim of the Group over the medium term.
The Group monitors the performance of acquisitions on an ongoing basis and completes annual impairment reviews in respect of goodwill and intangible assets. No impairments were identified from this 2018 review; however during 2018 the headroom on these investments, representing the difference between the carrying value of assets and their value in use, decreased primarily as a result of the increase in the associated discount rates. Full details on the annual impairment reviews are set out in note 17 of the financial statements.
DividendsDuring 2018 the Group adopted a revised dividend policy of an annual dividend payout ratio between 25% and 35% of adjusted EPS. In line with this policy the recommended final 2018 dividend will be 14.49 cent per share (2017: final dividend 16.09 cent per share) and brings the total dividend for the year to 24.2 cent per share (2017: 22.0 cent per share) and a payout ratio of 26.6%. This represents a 10% increase on prior year and a return of €71.6 million to shareholders from 2018 earnings.
Total Shareholder returnsTotal Shareholder Return (TSR) for the year was strong at 11.4%, particularly when compared to the STOXX Europe 600 Food & Beverage Index, a key benchmark for the Group, which decreased by 6.8% in 2018. The three-year period 2016 to 2018 was negative 0.6% and five-year TSR to 2018 was 54.9%. Glanbia’s share price at the end of the financial year was €16.35 compared to €14.90 at the 2017 year end, a 9.7% increase.
Impact of new accounting standardsWhile new accounting standards and improvements are issued annually there are three new accounting standards which have or are expected to have significant impacts on companies. We have set out the impact, where relevant, to Glanbia from these standards. Further detail on new accounting standards is set out in note 2 of the financial statements.
IFRS 15 ‘Revenue from Contracts with Customers’IFRS 15 ‘Revenue from Contracts with Customers’ is effective and will be adopted by the Group for the 2019 financial year. Following a detailed review by the Group there were no material changes to revenue recognition and profits across the Group with the exception of the matter outlined below.
As a result of the change in the principal/agent assessment criteria under IFRS 15, the Group concluded that the relationship between Glanbia Nutritionals and the Group Joint Venture partner Southwest Cheese (SWC), will transition from an agent relationship to that of a principal. The impact is as follows: • Revenue and cost of sales within GN will be grossed up for
all sales of SWC products on which previously only commission was recognised.
• There is no change to EBITA within GN or Glanbia Group.• Although there is no change to EBITA, as a result of the increase
in revenue, there will be a dilution to the EBITA margin percentage of GN and consequently of the wholly-owned Group.
• During the Glanbia capital markets day margin ambition for the Group’s segments to 2022 was outlined. As a result of the adoption of IFRS 15 the EBITA margin ambition for GN Nutritional Solutions has been reduced from 14%-16% to 13%-15% and in GN US Cheese from mid-single digits to low-to-mid single digits.
• Revised 2018 revenue numbers reflecting IFRS 15 are set out in the table below which will form the comparatives for 2019.
2018
Reported€’m
Restated under
IFRS 15€’m
Revenue
US Cheese 680.0 1,413.9
NS 526.7 577.0
Total GN revenue 1,206.7 1,990.9
EBITA Margin
Total GN Margin 9.3% 5.6%
Group Revenue 2,386.3 3,170.5
Group EBITA Margin 11.9% 9.0%
Glanbia plc | Annual Report and Financial Statements 2018
35
IFRS 9 ‘Financial Instruments’IFRS 9 is effective and will be adopted by the Group in the 2019 financial year. A full impact assessment has been completed and is disclosed in note 2 to the financial statements. There are no significant impacts from the adoption of this new standard.
IFRS 16 ‘Leases’IFRS 16 ‘Leases’ comes into effect for our financial year commencing on 5 January 2020. Under the new accounting standard the fair value of all qualifying operating leases, representing the present value of the lease payments over the life of the lease, will be recognised as a right of use asset with a corresponding liability. The new standard will result in the removal of an operating lease charge from the Income Statement for the impacted leases and will be replaced with a depreciation charge in respect of the right of use asset and an interest charge relating to the lease liability.
The estimated impact is currently being assessed including its impact on the Group’s financial KPIs such as EBITA, EPS and ROCE. An update will be provided in the 2019 interim financial statements. Information on the Group’s leases currently classified as operating leases is set out in note 33 of the financial statements.
PensionThe Group’s net pension liability under IAS 19 (revised) ‘Employee Benefits’, before deferred tax, decreased in 2018 by €3.4 million to €38.5 million (2017: €41.9 million).
On 26th October 2018, a high court in the UK made a judgement against the Lloyds banking Group regarding the rights of members to equality in defined benefit schemes. This judgement concluded that schemes have a duty to equalise benefits for all members, regardless of gender, in relation to minimum pension benefits. As a result of this ruling, the Group have recognised an additional past service cost in the year of €2.1 million in the Group Income statement.
Foreign exchangeGlanbia generates over 80% of its earnings in US Dollar currency and has significant assets and liabilities denominated in US Dollars. As a result, and as Glanbia’s reporting currency is Euro, there can be a significant impact to reported numbers arising from currency movements year-on-year and on translation of US Dollar non-monetary assets and liabilities in the preparation of the Consolidated Financial Statements. Commentary has been provided within the income statement on a constant currency basis to provide a better reflection of the underlying operating results in the year, as this removes the translational currency impact. To arrive at the constant currency change, the average foreign exchange rate for the current period is applied to the relevant reported result from the same period in the prior year.
At the balance sheet date, due to the strengthening of the US Dollar compared to prior year, there was a translation gain arising on the translation of US assets and liabilities into Euro. The gain on translation of non-monetary assets and liabilities, including US Dollar to Euro, is presented within other comprehensive income and amounted to €58.5 million in the year. The retranslation of non-Euro denominated debt resulted in a loss of €9.0 million within the cash flow statement. Average and year-end US$ to Euro rates were as follows:
Average Year end
2018 2017 2018 2017
1 Euro converted to US Dollar 1.1812 1.1295 1.1454 1.1993
Brexit and international trade challengesToday, the outcome of the UK departure from EU membership (“Brexit”) process remains unclear and its impact is difficult to quantify in this context. Whereas the wholly-owned businesses of the Group have a relatively limited risk in a no-deal scenario, the implications for two joint venture businesses, Glanbia Cheese UK and Glanbia Ireland, may be more significant depending on how the situation unfolds. The Group has been actively preparing, as far as possible, for a no-deal outcome and remains very alert to the risks that may crystallise in the coming months. Further detail on Brexit is set out on page 48.
International trading, and in particular trading with China, will continue to be monitored by the Group and the impact of tariffs on imports. All divisions trading with China, and other tariff impacted countries, have plans in place to mitigate as much as possible the exposure to these risks.
Financial strategyGlanbia’s financial strategy is very much aligned with its overall strategy of ensuring the Group delivers on our key financial goals. Details of our key financial metric targets over the strategy period are set out on page 31. Specific financial goals to enable this strategy include:
• Assessing both external and organic investment opportunities against a minimum benchmark of 12% return after tax by end of year three, with a goal of between 10% to 13% ROCE in any one year;
• Focusing the organisation on cash conversion through improved working capital management and disciplined business-sustaining capital expenditure, with a goal of greater than 80% cash conversion;
• Leveraging the Group’s activities to enable improved cost structures utilising shared services, procurement, IT, and a continuous improvement mind-set;
• Maintaining the capital structure of the Group within an implicit investment-grade credit profile; and
• Dividend policy with a payout ratio of 25%-35%.
Investor relationsGlanbia continued its active investor relations initiatives in 2018. During the year, representatives from Glanbia presented at 12 investor conferences globally and held over 300 meetings with institutional investors. Glanbia is focused on ensuring that a broad geographic base of institutional investors is reached via our investor relations programme. To do this Glanbia senior management increased the level of investor meetings in the US and Canada and internationally. In addition, in May 2018 the Group held a Capital Markets Day in Chicago with presentations from the Group Managing Director, the CEOs of GPN and GN and a financial presentation from myself. Details of the Glanbia Capital Markets Day 2018 are available on our website www.glanbia.com
Annual General Meeting (AGM)Glanbia plc’s AGM will be held on Wednesday, 24 April 2019, in the Lyrath Estate Hotel, Old Dublin Road, Kilkenny, Ireland.
Mark GarveyGroup Finance Director

Glanbia plc | Annual Report and Financial Statements 2018
36
> Strategic Report
Amazing Grass
Brandon Bert and Todd Habermehl, founders of Amazing Grass.

Glanbia plc | Annual Report and Financial Statements 2018
37
Plant-based shopping
23%The percentage of consumers who want more plant-based proteins on store shelves.
Source: Nielsen
Plant-based diet
39%The percentage of consumers who actively try to incorporate plant-based foods into their diets.
Source: Nielsen
Product launches
49% CAGRThe CAGR of product launches with a plant-based claim from 2012-2016.
Source: Innova Market Insights
Fuelling sustainable growth through plant-based nutrition Founded on a family farm in Kansas, US, Amazing Grass is predominately a US-brand that provides a powerful yet simple sustainability story. The business was established in 2002 by Brandon Bert and Todd Habermehl who shared a passion for connecting nutrition, health and the environment. Brandon’s grandfather had grown wheat grass on his family farm in Kansas since the 1940s. For over three generations, the Kansas-based farm perfected the growing, harvesting and dehydration of organic greens to ensure optimal nutrition. Today, Amazing Grass is a leading US provider of plant-based, non-GMO, whole-food powdered supplements and nutrition bars. Its core mission is to deliver plant-based, whole-food nutrition in flavours and forms that are simple and easy to enjoy. The brand’s cornerstone greens; wheat grass, barley grass, alfalfa and kale are still grown on the Kansas-based family farm. Amazing Grass thoughtfully combine these alkalizing greens with the highest quality plant-based ingredients and superfoods sustainably sourced from around the world.
Strategy-in-actionFuelling ambition
Watch the video case study at https://www.amazinggrass.com/our-story/

Glanbia plc | Annual Report and Financial Statements 2018
38
> Strategic Report
Our People and Our SustainabilityOur sustainable business strategy
Showing Respect
“ At Glanbia, we are conscious of our responsibilities in the workplace, in the global marketplace and in local communities. Financially, socially and environmentally we endeavour to act responsibly and sustainably in keeping with our ‘Showing Respect’ value.”
Our PeopleVision Programme 2020 Targets
Read more on page 40
Our WorldVision Programme 2020 Targets
Read more on page 44
Our SocietyVision Programme 2020 Targets
Read more on page 42
Our Supply ChainVision Programme 2020 Targets
Read more on page 43
Our Sustainability Vision
We are a responsible business generating economic, environmental and social value.
Our ambition is to embed sustainability in our strategy, creating shared value
for all stakeholders.
Our Sustainability Strategy
To advance our purpose and vision through an integrated and phased
sustainability programme, which will strengthen our business for the future.
Our Values
Customers’Champion
PerformanceMatters
Find ABetter Way
WinningTogether
ShowingRespect

Glanbia plc | Annual Report and Financial Statements 2018
39
We are deeply aware of our obligations to our stakeholders, our communities and the environment in which we operate. Our approach to sustainability reflects our purpose and values and focuses on four key pillars – Our People, Our Society, Our World and Our Supply Chain.
Our people2018 was a pivotal year in which we continued to invest in the development of our people, aiming to sustain a high-performing, values-driven culture where our employees are empowered to deliver to their full potential. Our areas of focus in 2018 were talent; leadership; organisational effectiveness and culture & engagement. During the year, we enhanced the Group’s resources in talent development and organisational effectiveness to help Glanbia grow the capability and impact of its leaders and employees. Our new Talent Acquisition platform went live, increasing the quality, speed and efficiency of recruitment. Our focus on building our culture and engagement also continued, with the rollout of our global Recognition Programme and embedding values into our performance management systems. We continue to optimise our operating model to meet current and future business needs and support wider services, digital delivery and internationalisation as efficiently as possible. For more detail on Our People, read page 40.
Our sustainabilityOur current programme is centred on the Group’s most material sustainability issues as determined in 2015. Our 2020 goals are pragmatic and are critical steps in our phased approach to sustainability. In this context we regularly engage with internal and external stakeholders to ensure we are focusing on what is important. We engage with our principal external stakeholders through a number of forums including customer and investor meetings, as well as through industry networks and formal reporting tools including the Carbon Disclosure Project (CDP).
Towards 2025Conscious that we operate in an ever-changing environment and to ensure our core business and sustainability focus remains relevant, in 2019 Glanbia will undertake a Group Materiality Assessment. The range of topics to be assessed will focus primarily on those with the potential to have a significant impact on society and the environment over the short, medium or long-term
while also potentially affecting the ability of the Group to fulfil its purpose, vision and strategy. The assessment process will update the sustainability priorities deemed as being important to both Glanbia and its stakeholders towards 2025 and beyond. We will continue to work with Carbon Trust on our 2025 strategy including supply chain mapping and target setting.
Reporting standards and guidance The Global Reporting Initiative G4 guidelines continue to guide our focus on key material aspects, boundaries and measures of our sustainability strategy. We have mapped our plans against the EU Non-Financial Reporting Directive (2014/95) and the United Nations Sustainable Development Goals (SDGs). We believe that business action is a key determinant of the success of the ambitious 2030 UN Sustainable Development Agenda, and the achievement of the SDGs. To this end we support multi-stakeholder industry forums, including the Dairy Sustainability Framework and the Global Dairy Platform’s programmes to advance the SDGs.
GovernanceThe delivery of our sustainability programme is overseen by the Group’s Corporate Responsibility Council (CRC), convened by the Group Director of HR & Corporate Affairs and the Group Secretary. The CRC oversees our Corporate Responsibility framework. This framework encompasses various policies including:• Group Code of Conduct• Environmental, Health & Safety Policy• Human Rights Policy • Diversity and Inclusion Policy• Anti-Bribery and Corruption Policy
The current focus of our CRC is to monitor progress against high priority actions on food safety and quality, health and safety and environment, taking corrective action as required. Further details on our policies can be found in the 2018 Glanbia Sustainability Report and at www.glanbia.com.
Caption: SDGs United Nations Sustainable Development Goals
Michael PattenGroup Human Resources and Corporate Affairs Director

Glanbia plc | Annual Report and Financial Statements 2018
40
> Strategic Report
Our People
Global employee baseIn 2018, total Group employees, including Joint Ventures & Associates, increased to 6,900 people based in 34 countries. Glanbia Performance Nutrition (GPN) had 2,118 employees, including the addition of 62 new employees from SlimFast, which was acquired by the Group in November 2018. Glanbia Nutritionals (GN) employed 2,039 people during the year. Our Joint Ventures and Associates had 2,743 employees in 2018.
Fostering purpose-led performance – our Global HR Agenda In continuing to embed our purpose, vision and values, we executed a complete restructuring of our Performance Development Programme (PDP) in 2018, introducing new ratings and a new methodology into how we calibrate performance management across our organisation. We also completed the rollout of our talent acquisition platform which will drive significant benefits to the organisation. These include building deeper pools of talent, as well as increased efficiencies and reduced costs in recruitment. Our objectives in 2019 will focus on talent attraction, retention and development as well as progressing our digital transformation.
Respecting Our People
Our VisionTo develop the talent, culture and values of Glanbia, within an inclusive framework that protects
and develops our people, respects the wider community and upholds international human rights.
Our programmes
Living our purpose, vision and values across all areas of the Group
Developing leadership talent
Driving organisational effectiveness
Fostering a strong culture and encouraging employee engagement
Enhancing the capabilities and systems underpinning HR to facilitate international expansion
Our 2018 progress
Embedded values into our performance management processes
Established new global talent centre of excellence
Launched an advanced leadership programme for senior leaders
Completed first full year of new Group-wide talent acquisition platform
Continued focus on employee engagement with a wide series of initiatives across all locations
2019 priorities
Prioritise talent management with a focus on succession planning
Focus on talent and leadership development through the introduction of new multi-level programmes
Continue to cultivate our performance management culture
Further engagement to embed our purpose and values
Renewed focus on diversity and inclusion
Evolution of people-centric digital HR support systems
Retaining and developing our peopleOur new Talent Centre of Excellence was launched in 2018 aiming to enhance our ability to analyse, anticipate and respond to the talent needs of the organisation, particularly leadership development and succession planning. The Group also completed a full talent and succession review, our Organisation and People Review (OPR), which assesses succession benchstrength and emerging issues in our talent planning.
In 2018 we also launched our Advanced Leadership Programme for senior leaders in conjunction with the Center for Creative Leadership and the Irish Management Institute. Senior executives from across the Group participated in the first module which took place in Silicon Valley and focused on themes around disruption, innovation and digitalisation. Future modules will address themes such as international scaling, leadership impact and business building.
We continued to rollout our ‘Leading the Glanbia Way’ programme which has seen more than 1,100 managers from all areas of the Group participate since inception.
United Nations Sustainable Development Goals Ensuring good health and wellbeing is at the core of our business and is aligned with our Purpose, Vision and Values.

Glanbia plc | Annual Report and Financial Statements 2018
41
In 2018, we also commenced a Reverse Mentoring programme to bring together our digital natives and experienced senior leaders to stimulate new ways of thinking about how Glanbia can further leverage digital capabilities.
Business Unit learning and development Initiatives In addition to the Group development programmes, there are significant learning and development initiatives undertaken within each of our Business Units.
Glanbia Nutritionals undertook several Talent Development initiatives including introducing a new First Line Supervisor Training Programme. Further initiatives included bringing in early talent through graduate and intern hiring and structured rotations, a comprehensive Organisation and People Review (OPR) process across operations, and continuing to offer leadership training (Leading the Glanbia Way) and reinforcement of its key concepts. In Glanbia Performance Nutrition, approximately 100 employees from various functions engaged in sessions centred on developing leadership and communication skills to create high performing teams. This has created a common language within the organisation to communicate leadership style.
Pure Ambition Graduate Programme Glanbia’s Pure Ambition Graduate Programme continues to play a key role in selecting and developing the next generation of leaders for Glanbia. It has been recognised for the last three years at the GradIreland Awards, winning the Gold Award for Best Training and Development Programme in the Business/Management Category. Learn more at www.glanbia.com/graduates.
Culture and engagementIn 2018 ‘Our Glanbia’ Roadshow extended its global reach and saw our Group Managing Director Siobhán Talbot and members of the Group Operating Executive visit 20 sites across the US, Europe and Asia Pacific, conducting 24 townhall meetings and interacting directly with more than 2,000 employees across the Group. Recognition was a key focus of the roadshow events, with more than 100 awards presented to employees and teams across the Group, recognising their commitment to our values in action.
To ensure that recognition of our people is an ongoing feature of our engagement, our global recognition programme was also rolled out during the year. Named ‘Living Our Values’, the programme encourages employees to #LetThemKnow and recognise colleagues both formally and informally for living Glanbia’s values every day. Building on our commitment to listen to our employees, a global employee engagement survey is planned for 2019, to measure progress against our people and engagement goals.
“ In continuing to embed our purpose, vision and values, we executed a complete restructuring of our Performance Development Programme (PDP).”
Diversity and inclusion In keeping with our values, Glanbia is committed to encouraging equality, fairness and diversity among our workforce. We aim to create an inclusive culture that gives every employee the freedom to succeed, regardless of age, status, ethnicity, gender or any other attribute. Our Group diversity and inclusion policy applies to all Glanbia employees and is core to our HR policies and practices. In 2018 we reviewed the evolving regulation and the potential Group impact. In 2019, we will develop and implement a diversity and inclusion strategy for delivery from 2019-2025. This will focus on key areas including talent acquisition, development and promotion; engaging with internal and external networks as well as building learning content around diversity and inclusion into our Leading the Glanbia Way and other leadership programmes. We will continue to develop our approach to increasing social diversity across the organisation as well as striving to ensure equal access to rewarding career and personal development experiences for our employees.
Health and SafetyShowing respect, by caring for our people and our world, is a value Glanbia lives by. In pursuit of our ‘Zero Harm’ ambition, the Health and Safety Leadership Team continues to establish group-wide standards and policies to safeguard health, safety, and wellness.
Our global Total Recordable Incident Rate (TRIR) remained consistent in 2018 at 2.15 / 200,000 hours, while increasing the scope of our Health and Safety programme. In 2018, 95% of our sites were trained in and are now using our Global Health and Safety Incident Management reporting platform. This approach has facilitated greater visibility on progress, risks and mitigation plans. To foster a culture of learning and prevention, we have implemented a policy to drive root cause analysis and promote management review for Lost Time Cases (LTC).The introduction of a new H&S Global Standard, Job Safety Analysis Risk Assessment, developed in 2018, will be rolled out across Glanbia in 2019 as a critical risk management tool.
Vision To safeguard the health, safety and wellness of
employees, customers and our community, in pursuing ‘Zero Harm’.
2018 Performance – Group H&S metrics and monthly reporting established
(2017 base year) – 95% of Group locations are now reporting on our
common H&S global reporting platform – Introduced global policies (Job Safety Analysis, a global
registry for H&S incidences and Root Cause Analyses (RCA )
2020 targets – To adopt a systems-based approach for H&S
programmes (e.g. OHSAS 18001/ISO45001 or equivalent).
– To identify, and develop plans to eliminate, the top drivers of LTC
– To achieve a 10% reduction in TRIRs at leading sites.

Glanbia plc | Annual Report and Financial Statements 2018
42
> Strategic Report
Our People and Our Sustainability continuedOur Society
Respecting Our Society
Our VisionTo have a positive social and economic impact on our communities through
the promotion of health and wellbeing at all stages of life’s journey.
Our programmes
Glanbia corporate responsibility programmes – partnering with community organisations.
Training and education for employees, customers and consumers through GPN’s Sports Nutrition School.
Engaging with government agencies such as the Fit India Campaign.
Our 2018 progress
Continued expansion of health and wellbeing programmes including a global Workplace Wellbeing Day.
Raised €1m for community partnerships focused on health and wellbeing.
15,780 consumers, customers and employees participated in GPN nutritional education programmes.
2020 targets
Provide targeted health and wellbeing programmes for all Glanbia employees.
Continue to promote our values through extensive support to community organisations.
Continue our leadership in education and advocacy initiatives.
Health and wellbeing Glanbia supports the physical, nutritional and mental health of our people through health and wellbeing programmes, including health checks, the provision of sports facilities at many sites and nutritional and healthy lifestyle education. In 2018, 40 sites across Glanbia’s global operations took part in a global Workplace Wellbeing day.
Education initiatives GPN’s Sports Nutrition School (SNS) is an industry leading educational programme designed to immerse participants in the science of sports nutrition. In 2018, SNS was redesigned, making it more interactive and of increased relevance for the modern learner. This year 108 global education sessions were experienced by over 15,780 consumers, customers and employees across EMEA, LAPAC and North America.
Community support Glanbia has a long tradition of supporting local communities through focused partnerships. In North America, GN continued to work with local communities. For example, in Idaho, the 25th Annual GN Charity Golf Tournament raised $200,000 for local charities, bringing to US$2.4 million the total amount raised since 2003.
In Ireland, we continued our relationship with the GAA through our sponsorship of the Kilkenny and Wexford inter-county teams. Our local community sponsorships included the Kilkenny Arts Festival and food festivals Savour Kilkenny and the Waterford Festival of Food.
Breast Cancer Ireland
Glanbia continued to sponsor Breast Cancer Ireland (BCI) in 2018. The Great Pink Run was once more held in Dublin and Kilkenny, with more than 8,000 people participating across both events which raised €500,000 for BCI. In Ireland, around 100 Glanbia employees took on the Two Peaks Challenge for BCI, climbing Croagh Patrick and Mweelree in a charity challenge. The Glanbia 300 Cycle and Pink Bales initiative returned once more, raising further funds for chosen charities including BCI. Together with other local events in Glanbia, employees directly raised a further €100,000 for BCI.
Case study

Glanbia plc | Annual Report and Financial Statements 2018
43
Respecting Our Supply Chain
Our VisionTo sustainably source all raw materials in line with the principles
of ethical business set out in the Glanbia Code of Conduct.
Our programmes
Sustaining globally recognised Food Safety Certifications across all our manufacturing sites.
Implementing the Glanbia Quality System (GQS).
Fostering a learning and prevention culture.
On-farm sustainability and animal welfare programmes.
Group procurement policies.
Our 2018 progress
100% sites are compliant with globally recognised Food Safety standards.
75% proficiency for all Glanbia sites across eight GQS standards with key gap areas and corrective actions identified.
80% compliance to Group standard for root cause analysis/post case review.
Progress on US farmer enrolment in the Farmers Assuring Responsible Management (FARM) Environmental Stewardship programme.
2020 targets
Fully embed global reporting tool and system of 3rd party audits/certifications.
Embed GQS core standards in global reporting system.
100% compliance on root cause analysis (RCA)/corrective action preventative action (CAPA).
100% supplier certification to Origin Green.
Drive continuous improvement through the US FARM programme.
Safe and secure production Glanbia continued its commitment to excellence in food safety and quality in 2018. The Group Quality Leadership team (QLT) continues to drive our food safety code of practice through the Glanbia Quality System (GQS). All sites are engaged to train, audit and verify core food safety topics, to deepen their capability and identify development needs. The GQS standards complement a Group requirement for sustaining a globally recognised Quality and Food Safety certification at all our manufacturing sites.
In 2018, new standards for sanitation and contract manufacturing qualification were launched. Developing new standards addresses risk management in our expanding supply chain. We continue to conduct an annual review of our Food Safety programme with an external, globally recognised leader. This year’s review focused on best practice for infant nutrition food safety, thus reinforcing our commitment to excellence in this category.
Responsible sourcingGlanbia’s supply chain spans procurement of materials, packaging, transportation and other services globally. Our procurement policy is to source responsibly and follows the principles of ethical business set out in the Glanbia Code of Conduct. Glanbia requires all our suppliers to be compliant with the laws, regulations and social customs of the countries in which they operate and with all human rights, labour and H&S regulations. In support of the on-going internationalisation of our business, in 2018 Glanbia Nutritionals launched the
Global Supplier Expectations Manual and provided formal quality training to suppliers to ensure greater alignment with our supply requirements.
On-farm sustainability The first phase of our sustainability strategy focuses on Scope 1 emissions (produced by fossil fuels) and Scope 2 emissions (produced through the consumption of purchased energy). Given that the dairy supply chain represents a significant element of our Group procurement, we continue to work with our suppliers to drive continuous improvement on farm. Our farm relations teams work closely with producers – assessing and advising on milk quality, environmental stewardship and economic sustainability under internationally recognised sustainability programmes.
Ireland: Origin GreenAs a founding member of Origin Green, Ireland’s national sustainability programme, we are pleased to report that 100% of Glanbia’s Irish dairy suppliers have achieved certification. Origin Green involves audits as part of the Sustainable Dairy Assurance Scheme, ensuring highly sustainable and responsible sourcing in our supply chain.
US: Farmers Assuring Responsible Management (FARM) Our US farmers are enrolled in FARM’s animal welfare programme, the first ISO-compliant livestock care programme in the world. Our farm relations teams are supporting the roll out of FARM’s Environmental Stewardship (ES) module with an ambition to achieve full coverage by 2020.
United Nations Sustainable Development Goals Through our on-farm programmes, we are working in partnership to promote sustainable communities and ensure responsible production.
Glanbia plc | Annual Report and Financial Statements 2018
44
> Strategic Report
Our People and Our Sustainability continuedOur World
Environmental reportingWe measure our performance by focusing on the aspects of environmental stewardship that are material to the development of a more sustainable world. Now in the third year of a coordinated Group wide-focus, we have built a solid foundation that supports our strategy to reduce energy, water use and waste. Through Group reporting and governance we continue to focus on high priority issues and make progress against KPIs.
Taking account of the Carbon Trust’s recommendations of 2017, we have implemented more efficient methods to utilise and report metrics. During 2018 Glanbia deployed Intelex, the EHSQ Management software to all Business Units bringing consistency to our monthly and quarterly reporting of facility-level environmental and safety metrics. This software solution allows for immediate evaluation of metrics by facility, Business Unit, and across our entire business footprint.
Respecting Our World
Our VisionTo protect the environment through strong, responsible stewardship.
Our programmes (base year 2015)
Improving energy efficiency
Improving water conservation
Waste reduction
Adoption of common environmental protection standards across the Group
Continued implementation of the Glanbia Performance System
Our 2018 progress
7% reduction in energy use intensity*
Completion of carbon foot printing of our operations certified by Carbon Trust
24% reduction in water use intensity*
Zero waste to landfill achieved for GPN manufacturing sites
Nine sites ISO accredited
Improved Carbon Disclosure Project (CDP) score
2020 targets
Achieve benchmarking of current operational performance vs. industry leading standards
Develop an action plan to lower carbon impact, in association with the Carbon Trust
Adopt ISO14001 as common standard
Water
24% (2015 base year)We have made considerable progress on water use reduction. In 2018, we reduced our water use intensity by 24% from the 2015 base year. Our progress is the result of focus applied at operational level through our Glanbia Performance System which drives excellence on sustainability metrics. In 2018, with the help of our environmental consultants Harbor, we mapped our manufacturing sites using the Aqueduct Water Risk Atlas (Water Resource Institute). While none of our sites are located in regions of Extremely High Overall Risk, this analysis provides us with a framework to assess our site specific water use and reuse ambitions.
United Nations Sustainable Development Goals In our production facilities, we are investing in technologies and adopting targeted programmes that will allow us to take action against climate change.
* By reference to 2015 base year.

Glanbia plc | Annual Report and Financial Statements 2018
45
DISCLOSURE INSIGHT ACTION
Energy
7% (2015 base year)We reduced energy consumption by 7% since 2015. This reduction in energy use intensity is due to the sourcing of power from renewable sources in our Irish operations and the offset of energy we return to the energy grid.
Greenhouse Gas emissionsReducing greenhouse gas (GHG) emissions is a central sustainability goal for Glanbia. In 2018 we engaged Carbon Trust to oversee our carbon footprint measurement. The project delivered our carbon footprint for Scope 1 and Scope 2 activities. This data will allow us to evaluate our emissions on the basis of product manufactured and compare plants with similar processes in pursuit of best practice. The data enables us to make informed decisions as we develop our 2025 targets and explore science based targets. 80% of Glanbia’s Scope 1 & 2 emissions are attributable to our dairy processing operations. The level of emissions is consistent with operations of our scale, with natural gas and electricity from the grid responsible for over 92% of emissions. In addition, we are leveraging our dairy suppliers’ commitment to Origin Green in Ireland and the FARM Environmental Stewardship module in the US to build a more complete picture of emissions in the supply chain. We are also collaborating with national and international organisations to drive industry-wide progress on targets and goal-setting including a leadership role in the Innovation Center for US Dairy Taskforce and Environmental Stewardship Committee.
Glanbia is committed to identifying further opportunities to reduce our carbon footprint and to contributing towards the Sustainable Development Goal 13 on Climate Action. Our GHG emissions are calculated according to global standards using methodology established by the International Panel on Climate Change (IPCC) as well as guidance from the World Resource Institute (WRI).
WasteGPN achieves zero landfill In 2016, Glanbia Performance Nutrition (GPN) set an ambitious three-year goal of reaching zero waste to landfill. The waste management programme focused on establishing baseline disposal data, centralising data tracking, identifying source reduction opportunities, and engaging employees through site “Green Teams”. As a result, GPN achieved its zero landfill goal in 2018 with sites reaching their target of eliminating circa 4,500t of landfill from 2016 to 2018. Our ambition is to further leverage this approach beyond the GPN business.
Our 2018 CDP scoreCarbon Disclosure Project (CDP) provides a globally recognised disclosure system that enables companies to measure and manage their environmental impacts. In 2018, Glanbia submitted a Group-wide response to CDP’s climate change questionnaire. Our score improved across supply chain and water and ranked ahead of the sector average in each category.
Supply chain Water
Supplier engagement
rating
Glanbia plc 2018 C B- B-Sector average D C C
Glanbia plc 2017 C- C B
Glanbia Ireland tackles food waste with FoodCloud
Tackling food waste is regarded as one of the most significant actions to reduce climate disruption. FoodCloud is a social enterprise that combats food waste by connecting retailers and food businesses which generate large volumes of surplus food to charities in need. In 2018 Glanbia Ireland piloted a new partnership with FoodCloud. More than 21,000kg of fresh, quality product from Glanbia Ireland which would
otherwise be destined for disposal as surplus, was redistributed to charities across Ireland by FoodCloud. This equated to almost 50,000 donated meals for 116 charity partners. FoodCloud creates a win-win situation by helping charities to save money and helping businesses reduce their carbon impact. Glanbia is now looking at extending the partnership with FoodCloud to other business units.
Case study
Scope 1 272,458 (63%)
Scope 2 160,644 (37%)
CO2 Emissions by SCOPE (tonnes)
CO2 Emissions by Business Unit
GPN 3% GN 33%
JV & Associates
GI 28% SWC 27% GC 9%
Alan J. Murphy, Site Manager at Glanbia Ireland’s Portlaoise depot, with the FoodCloud team.
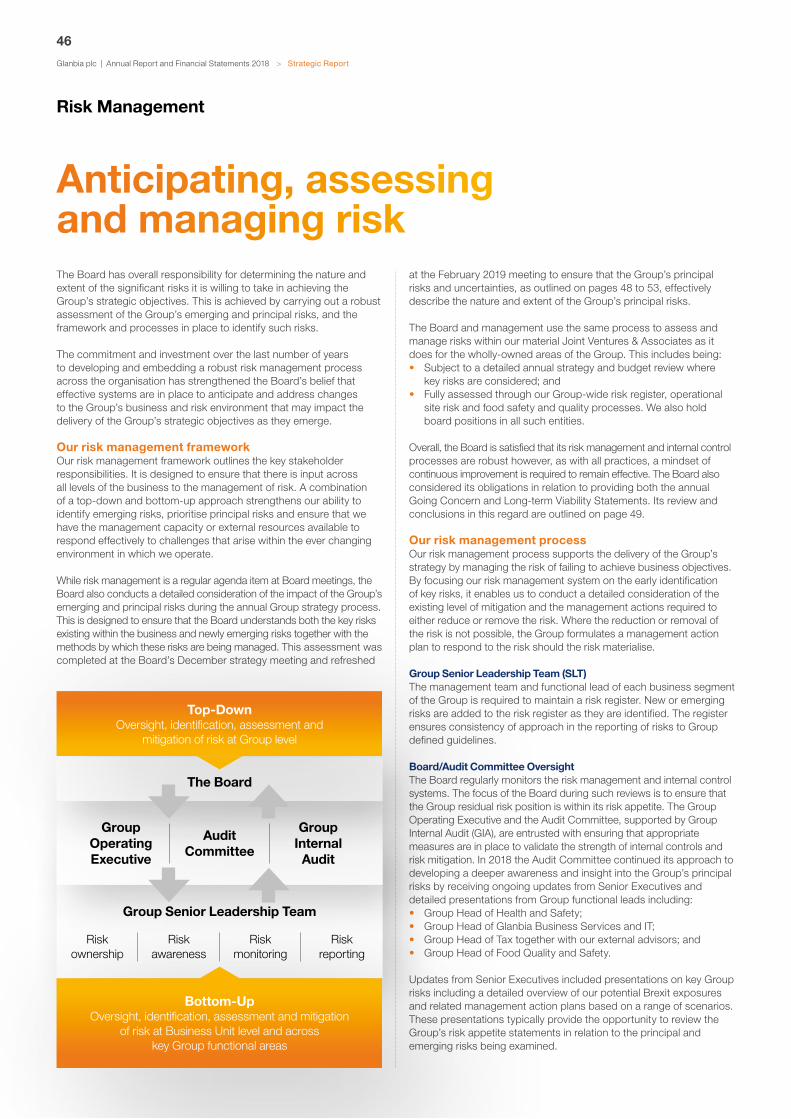
Glanbia plc | Annual Report and Financial Statements 2018
46
> Strategic Report
The Board has overall responsibility for determining the nature and extent of the significant risks it is willing to take in achieving the Group’s strategic objectives. This is achieved by carrying out a robust assessment of the Group’s emerging and principal risks, and the framework and processes in place to identify such risks.
The commitment and investment over the last number of years to developing and embedding a robust risk management process across the organisation has strengthened the Board’s belief that effective systems are in place to anticipate and address changes to the Group’s business and risk environment that may impact the delivery of the Group’s strategic objectives as they emerge.
Our risk management frameworkOur risk management framework outlines the key stakeholder responsibilities. It is designed to ensure that there is input across all levels of the business to the management of risk. A combination of a top-down and bottom-up approach strengthens our ability to identify emerging risks, prioritise principal risks and ensure that we have the management capacity or external resources available to respond effectively to challenges that arise within the ever changing environment in which we operate.
While risk management is a regular agenda item at Board meetings, the Board also conducts a detailed consideration of the impact of the Group’s emerging and principal risks during the annual Group strategy process. This is designed to ensure that the Board understands both the key risks existing within the business and newly emerging risks together with the methods by which these risks are being managed. This assessment was completed at the Board’s December strategy meeting and refreshed
at the February 2019 meeting to ensure that the Group’s principal risks and uncertainties, as outlined on pages 48 to 53, effectively describe the nature and extent of the Group’s principal risks.
The Board and management use the same process to assess and manage risks within our material Joint Ventures & Associates as it does for the wholly-owned areas of the Group. This includes being: • Subject to a detailed annual strategy and budget review where
key risks are considered; and • Fully assessed through our Group-wide risk register, operational
site risk and food safety and quality processes. We also hold board positions in all such entities.
Overall, the Board is satisfied that its risk management and internal control processes are robust however, as with all practices, a mindset of continuous improvement is required to remain effective. The Board also considered its obligations in relation to providing both the annual Going Concern and Long-term Viability Statements. Its review and conclusions in this regard are outlined on page 49.
Our risk management processOur risk management process supports the delivery of the Group’s strategy by managing the risk of failing to achieve business objectives. By focusing our risk management system on the early identification of key risks, it enables us to conduct a detailed consideration of the existing level of mitigation and the management actions required to either reduce or remove the risk. Where the reduction or removal of the risk is not possible, the Group formulates a management action plan to respond to the risk should the risk materialise.
Group Senior Leadership Team (SLT)The management team and functional lead of each business segment of the Group is required to maintain a risk register. New or emerging risks are added to the risk register as they are identified. The register ensures consistency of approach in the reporting of risks to Group defined guidelines.
Board/Audit Committee OversightThe Board regularly monitors the risk management and internal control systems. The focus of the Board during such reviews is to ensure that the Group residual risk position is within its risk appetite. The Group Operating Executive and the Audit Committee, supported by Group Internal Audit (GIA), are entrusted with ensuring that appropriate measures are in place to validate the strength of internal controls and risk mitigation. In 2018 the Audit Committee continued its approach to developing a deeper awareness and insight into the Group’s principal risks by receiving ongoing updates from Senior Executives and detailed presentations from Group functional leads including:• Group Head of Health and Safety;• Group Head of Glanbia Business Services and IT;• Group Head of Tax together with our external advisors; and• Group Head of Food Quality and Safety.
Updates from Senior Executives included presentations on key Group risks including a detailed overview of our potential Brexit exposures and related management action plans based on a range of scenarios. These presentations typically provide the opportunity to review the Group’s risk appetite statements in relation to the principal and emerging risks being examined.
Risk Management
Anticipating, assessing and managing risk
Group Operating Executive
Audit Committee
Group Internal
Audit
Group Senior Leadership Team
Risk ownership
Risk awareness
Risk monitoring
Risk reporting
The Board
Bottom-UpOversight, identification, assessment and mitigation
of risk at Business Unit level and across key Group functional areas
Top-DownOversight, identification, assessment and
mitigation of risk at Group level

Glanbia plc | Annual Report and Financial Statements 2018
47
Consolidation and review of the Group key risk summary Internal Audit prepares regular Group summary risk management reports based on information submitted by management throughout the year. These reports include:• An analysis of key Group risks in terms of impact (assessed over
the following 12 months within defined monetary terms), likelihood of occurrence (using defined probabilities of occurrence) and velocity (speed at which the impact of the risk could materialise);
• A summary of the key movements in the identified risks, with a particular focus on highlighting new or emerging risks;
• Management action plans (MAPs) to manage risk exposures; and • An overview of the broader organisational and business risks.
The Group Operating Executive reviews this report regularly during the year. The Audit Committee and the Board perform a bi-annual review, with interim updates from management on significant issues.
Ongoing monitoringThe quality and consistency of risk reporting is supported through a number of other monitoring and reporting processes including:• Annual Group strategy process and Board presentations;• Bi-annual control self-assessment and management
representation letter processes;• Business reviews of key financial and operational performance,
including detailed finance, capex planning and expenditure reviews;
• Post acquisition completion project reviews; • Risk focused Internal Audit plan; and • The externally assessed Glanbia Risk Management System
(GRMS) reviews which assess operational risks across the group and the internal Glanbia Quality System (GQS) reviews.
Senior management is also required, when presenting a business update to the Board or Audit Committee, to outline their key risks and planned management actions.
Regulatory ChangesThe revised 2018 UK Corporate Governance Code (‘the Code’) requires the Board to carry out a robust assessment of the Company’s emerging and principal risks. The Board is also required to formally confirm that it has completed its assessment, including a description of the principal risks, what procedures are in place to identify emerging risks, and an explanation of how these risks are being managed or mitigated. The Board believes it has fulfilled these obligations and this report provides a summary of the processes and outcomes of its various review activities.
Risk Management TimelineThe main elements of input for each of the key stakeholders is outlined in the 2019 risk management timetable below.
2019 Risk Management Timeline
Q1. 2019 Q3. 2019 Q4. 2019Q2. 2019
Group Senior Leadership Team (SLT)
• Preparation of risk registers including mitigation measures and MAPs.
• Focus on emerging risks.• Update risk review and
submission by SLT to GIA.
• Update risk review and submission by SLT to GIA.
• Update risk review and submission by SLT to GIA.
• Update risk review and submission by SLT as part of the strategic planning process.
• Risk register refresh for year end.
Audit Committee
• Review of the Group’s risk management processes.
• Review of the Annual Report principal risks and uncertainties, going concern and viability statements.
• Receive direct risk presentations from relevant Senior Executive and functional leads.
• Review of the Group’s half-year risk report and refreshed risk management policies.
• Receive direct risk presentations from relevant Senior Executive and functional leads.
• Review GIA risk management effectiveness report.
Board
• Review and approval of the Group’s principal risks and uncertainties, going concern and viability statements in the Annual Report.
• Monitors the evolving risk landscape during Board meetings.
• Review and approval of the Group’s half year risk reporting.
• Review key Group emerging and principal risks as part of the annual strategy process.
• Set risk appetite and tolerance levels.
Group Operating Executive
• Review of Group summary risk management report.
• ‘Top-Down’ input into emerging/principal risks.
• Review Q1 Group summary risk management report.
• Review the updated Group risk management policy.
• Review of the Group’s half-year risk report.
• ‘Top-Down’ input into emerging/principal risks.
• Approve Group strategy plan and associated risk management plan.
Group Internal Audit (GIA) Team
• Preparation of 2018 summary risk management reports.
• Refresh the Group’s risk management policies.
• Provide risk owner training and guidance.
• Prepare Q1 Group summary risk management report.
• Engage individually with each business segment CEO, other members of the Group Operating Executive and the Audit Committee to discuss risk agenda.
• Prepare half year summary risk management report.
• Prepare Group summary risk management report.
• Prepare risk management effectiveness report for Audit Committee review.

Glanbia plc | Annual Report and Financial Statements 2018
48
> Strategic Report
Economic, Industry and Political risk
Customer Concentration risk
Market risk
Acquisition risk
BrexitFollowing guidance issued by the Financial Reporting Council (FRC), the Board has considered the consequential risks and uncertainties in the political and economic environment arising from Brexit and the potential impact of those risks and uncertainties on the Glanbia Group.
More recently, the risk of a hard Brexit, where no deal is agreed with the EU, appears to be increasing and the Board believes that this will damage the UK and EU economies. Any outcome other than a full customs union will introduce additional costs and the food and drinks sector is likely to be initially hit with higher tariffs than any other sector. As a consequence of the increased downside risks, the Board has focused on ensuring that the short and medium-term impacts to the Group are clearly understood. This focus includes ensuring that appropriate action plans across a broad range of issues including operational risks, currency risks, regulatory, raw material inflation and tariff exposures are developed and implemented where possible. In its simplest terms the key short term impacts to Glanbia include effectively planning for and managing:• Raw material and finished goods into and out of the UK; and• Cross border product flows.
This includes measures such as:• Increasing stocks of raw materials in the UK beyond
what we would normally hold for supply chain safety purposes;
• Reviewing our EU storage and co-manufacture arrangements;
• Detailed discussions with our customers and suppliers on potential export certificate, customs inspection and logistic requirements and challenges;
• Review of potential alternative manufacturing and supply strategies; and
• Tax team monitoring of international tax legislation developments, particularly in the UK.
The Board and the Brexit cross-divisional and joint venture committee will continue to monitor closely the potential outcomes of the Brexit negotiations and will remain focused on ensuring that we are equipped as best as possible to address the short and medium term challenges that may arise.
Principal risks and uncertaintiesThe Directors have carried out a robust assessment of the Group’s emerging and principal risks, including those that may threaten our business model, future performance, solvency or liquidity. Key risks are identified based on the likelihood of occurrence and potential impact on the Group using the process outlined on pages 46 and 47. The Board fully recognises that many risks do not exist in isolation and that one or more risks may crystallise at the same time which could increase the impact to the Group. The interactions and relationship between such risks are discussed and considered by the Board. Risks are reported on a residual risk basis and represent a snapshot of the Group’s principal risk profile.
This is not an exhaustive list of all of the risks faced by the Group, there may be other risks and uncertainties that are not yet considered material or not yet known to us and this list will change if these risks assume greater importance in the future. Likewise some of the current risks will drop off the key risks schedule as management actions are implemented or changes in the operating environment occur. While no new principal risks were identified in 2018, the risk trend and associated volatility of a number of the Group’s principal risks did fluctuate as summarised in the risk profile diagram below.
In 2019 the principal risks and uncertainties affecting the Group’s performance include:• Economic, industry and political risk – Macroeconomic and global
trade uncertainty continues to increase, partly as a result of the geo-political climate where the potential introduction of further trade tariffs may have negative impacts to Glanbia’s strategic growth objectives. In addition, the nature of the United Kingdom’s future trading relationship with the European Union post Brexit is still to be determined. From a Group perspective this uncertainty has increased the potential risk of raw material pricing, cross border trade costs, volatility in currency, product pricing volatility and changing customer and competitor dynamics which together with other economic measures will require continued focus by both senior management across the Group and the internal teams established to assess and monitor any potential impacts to the Group’s performance; and
• Customer concentration risk – While from a strategic perspective the Group aims to build strong customer relationships with major customers, it can expose Glanbia to credit exposure and other balance sheet risks. The Board and management will be focused on utilising available mitigation to limit such exposures while recognising that they cannot be fully eliminated.
The Group’s approach to financial risks, including currency risk, interest rate risk, liquidity and cash flow risk, price risk, use of financial instruments and credit risk is to centrally manage these risks against comprehensive policy guidelines, details of which are outlined in note 31. The Board regularly reviews these policies.
Strategic and Commercial Operational and Regulatory
Talent Management risk
IT, Data Protection and Cyber Security risk
Product Safety and Compliance risk
Supplier risk
Site Compliance risk and Environmental, Health and Safety regulation risk
Financial
Tax risk
Risk Management continued

Glanbia plc | Annual Report and Financial Statements 2018
49
(c) Principal risks related to the Group’s business • Economic, industry and political risk – Deterioration in economic
growth or consumer confidence, particularly in our core markets.• Customer concentration risk – The loss or major disruption to one
of our core customers could materially impact Group profitability.• IT, data protection and cyber security risk – The risk of a significant
technology failure, data leak or key site disruption may negatively impact our reputation and business operations.
• Talent Management – The investment in building our Direct to Consumer capability may be negatively impacted by a failure to attract and retain key talent.
• Acquisition risk – Acquisitions or large-scale organic investments may fail to deliver in line with expectations or create significant integration difficulties.
See pages 50 to 53 for a detailed description of each of the Group’s principal risks, related mitigation measures and 2019 focus areas.
Assessment of ViabilityThe Directors’ assessment of the Group’s viability has been madewith reference to the principal risks and uncertainties facing theGroup and how these are managed within the Board’s risk appetite as detailed on pages 48 to 53. The Directors carried out a robust assessment of the consolidated financial forecast for the current year and financial projections for future years to 2022 during the recent two day strategy and budget review session in December 2018.
The Board reviewed the process and assessment of the Group’s prospects made by management, including: • The development of a rigorous planning process, the outputs
of which comprise of a strategic plan, a consolidated financial forecast for the current year and financial projections for future years covering the period of the plan;
• A comprehensive review of the strategic plan as part of their annual strategy review, with regular monitoring regarding the achievement of strategic objectives taking place at each Board meeting. Assumptions are built at both Group and Business Unit levels and are subject to detailed examination, challenge and sensitivity analysis by management and the Directors; and
• A consideration of how the occurrence of one or more of the principal risks and uncertainties, outlined on pages 50 to 53, could materially impact the Group’s future performance, solvency or liquidity.
These considerations include external factors such as the impacts of lower economic growth, particularly in our key areas of operation; unfavourable currency exchange rate movements, principally the USD/Euro rate; increased regulations; and internal factors such as the strategic plan under-delivering; the loss of a key production site; or a major food safety related event. These considerations also took into account additional mitigating measures available to the Group, including the ability to reduce capital expenditure and the potential availability of additional debt facilities. The Board is satisfied that sufficient financial headroom exists to address the potential negative impacts arising from the events considered.
Having considered these elements, the Board have a reasonable expectation that the Group will be able to continue in operation and meet its liabilities as they fall due over the period of the assessment. In reaching this assessment the Board has considered the impact of the on-going Brexit uncertainties and potential outcomes as outlined on page 48. The Board does not expect any reasonably anticipated Brexit-related outcomes to impact the Group’s long-term viability or the Company’s ability to continue as a going concern. The Board, in considering its dividend policy for the years to 2022, believes it will have sufficient distributable reserves to pay dividends. The Board assesses the Group’s key financial metrics, liquidity position and projected cash flows before declaring interim and proposing final dividends.
Going ConcernGlanbia’s business activities, together with the main factors likely to affect its future development and performance, are described in the Strategic Report on pages 1 to 53. After making enquiries the Directors have a reasonable expectation that the Group has adequate resources to continue in operational existence for a period of at least 12 months from the date of approval of the Financial Statements. The Group therefore continues to adopt the going concern basis in preparing its Financial Statements.
In reaching this conclusion the Directors have had due regard to:• Available cash resources, cash generation from operations,
committed bank facilities and their maturities which taken together provide confidence that Glanbia will be able to meet its obligations as they fall due. Further information on its bank facilities is provided in note 26 to the Financial Statements and outlined in the Group Finance Director’s review on pages 30 to 35; and
• Glanbia’s financial risk management policies which are described in note 31 to the Financial Statements, the nature of its business activities and the factors likely to impact our operating performance and future growth.
Long-term Viability StatementAssessment of ProspectsIn accordance with the Code and Listing Rule 6.8.3 (3) (b) of Euronext Dublin, the Directors have assessed the viability of the Group and its ability to meet its liabilities as they fall due over a period extending to 2022. This period was chosen as it is aligned to the Group’s growth strategy and ambitions as set out at the Group’s Capital Markets Day in Chicago in May 2018 and refreshed at the December 2018 Board Strategy review meeting. The Board considers this the most appropriate period to assess the prospects of the Group taking into account its current financial position, the Group’s strategy and business model and the potential impact arising from the principal risks and uncertainties. Factors considered in assessing long-term prospects include:
(a) The Group’s current position• Positive and growing global market trends in human nutrition
that underpin the execution of the Group’s strategic ambition.• Strong market positions in wholly-owned segments GPN and
GN and robust joint venture business models.• Leading performance nutrition and lifestyle branded portfolio
and key long-term customer relationships; both aspects supported by focused investment in science-led innovation.
• Strong Group financial position, with strong financial metrics.• A team of talented and committed people, focused on the delivery
of Group targets in line with our Group Values.
See the Finance Director’s review on pages 30 to 35 for more detail.
(b) The Group’s strategy and business model• Clearly articulated business model with well-defined and
communicated Group growth targets.• Focused on growing market share where we have market leading
capabilities while also building on these capabilities to capture opportunities in new channels and geographies.
• Ambition to grow through both organic investment and acquisition activity. This ambition is grounded in a framework of clear capital allocation priorities as demonstrated by the acquisition of SlimFast, in GPN and the scale investments in dairy processing which are conducted under robust joint venture models.
• Clear focus and prioritisation of the development of talent, culture and values in line with our growing global scale.
• Consistent delivery on margin, return on capital and other financial metrics within the guided targets.
See the Group’s business model and strategy on pages 8 to 13 for more detail.

Glanbia plc | Annual Report and Financial Statements 2018
50
> Strategic Report
Principal Risks and Uncertainties
Link to Strategic Priorities (see pages 12 and 13)
Risk Potential Impact Mitigation Developments in 2018 2019 Focus Areas
Strategic and Commercial risks
Economic, Industry and Political risk Our performance is influenced by global economic conditions, consumer confidence and the stability of the markets in which we operate. Failing to recognise or obtain accurate and relevant competitive and environmental intelligence may result in the adoption of incorrect business strategies.
Deterioration in economic growth or consumer confidence, significant currency movements, political instability or civil disturbances may impact performance and the achievement of growth targets.
Our strategy is aimed at the continued expansion of our geographic reach, focusing on key customer relationships and investment in new product development which will help to protect the Group from short-term economic fluctuations.
As an established international business, the Group already operates in many countries with differing, and in some cases fast-changing, competitive, economic, social and political conditions. Detailed market knowledge is assembled using a team of internal and external experts and potential risk exposures are assessed in advance of establishing operations.
The Board regularly assesses key market trends and the implications for Group performance and strategic objectives. Corrective actions are identified and implemented as required.
Macroeconomic and global trade uncertainty continued to increase in 2018, partly as a result of the geo-political climate where the potential introduction of further trade tariffs may have negative impacts to our strategic growth objectives.
Across the organisation we continue to expand our portfolio into new areas of operation and new geographies to balance macroeconomic risk but the potential for further trade and tariff disputes may create new operational and financial challenges.
The nature of the United Kingdom’s future trading relationship with the European Union post Brexit is still to be determined. Management continues to assess risks and develop action plans in this area with a detailed Board update in December 2018.
From a Group perspective the uncertainty surrounding the evolving economic landscape and Brexit has increased the potential risk of raw material pricing volatility, cross border trade costs, currency volatility and product pricing volatility. This will require continued focus by the internal teams established to assess and monitor any potential impacts to the Group’s performance.
We will continue to invest in developing in-house capabilities to assess trends in key market areas ensuring accurate and relevant data is available to the Board and management teams to support decision making.
Customer Concentration risk The Group benefits from close commercial relationships with a number of key customers.
The loss or material disruption with one or more of these customers, or a significant deterioration in commercial terms, could have a material impact on Group profitability.
The Group has developed strong relationships with major customers by focusing on superior customer service, quality assurance and cost competitiveness.
The Group has focused innovation pipelines in GPN and GN led by consumer insights and market research.
The Board regularly reviews its exposure to individual customers and considers the impact of acquisitions where relevant.
Credit exposure is actively reviewed and managed including the use of credit insurance where possible.
The Board has reviewed its exposures to individual customers and channels as part of the strategic review process and during its considerations of the impact of acquisitions where relevant.
We continually assess the potential impact of channel shifts by consumers and the financial strength of our customer base.
Building key customer partnerships through strategic capacity expansions and product supply opportunities, particularly with our core GN customers.
Monitor our customer credit exposures and balance sheet risks and utilise available mitigation to limit the risks where possible.
Market risk Increasing competition across certain channels through high promotional activity, competitor product innovation and channel shifts provides an ongoing challenge.
Potential adverse effect on the Group’s financial performance if we fail to adapt successfully where and when required to meet market challenges.
We actively monitor the major trends impacting our businesses and fully consider these as part of our strategic review processes.
We limit the impact of prolonged competitor challenges through continued channel and international expansion including a broadening of our portfolio through targeted acquisitions and strategic alliances.
We invest in research and development expenditure focused on value-added and customer-specific solutions and invest in promotional activities where required.
A focused approach to innovation and targeted acquisitions has enabled GPN to broaden its customer base into new channels, geographies and evolving, fast growing convenient formats such as Ready-to-Eat (RTE) and Ready-to-Drink (RTD).
The market remained particularly competitive in North America during 2018 for RTE formats.
GN has continued its focus on differentiating its capabilities from competitors through innovation to enable it to be the partner of choice for nutritional and functional solutions across both the dairy and non-dairy segments.
The Board believes that despite the dynamic nature of many of the markets in which it operates, the Group’s broadening product portfolio, channel mix and geographic reach offers it an enhanced opportunity to protect our market positions.
The Group will continue to pursue targeted acquisitions and strategic alliances to further expand our product, customer, channel and geographic reach.
We will continue to focus on developing key consumer insights and trends in all areas of the business and matching these to our innovation capabilities will be integral to our stated growth ambitions.
Acquisition risk The anticipated benefits of acquisitions may not be achieved if the Group fails to conduct full and proper due diligence, raise the required funds, complete the transaction or properly integrate the operations of the acquired businesses.
Below expected performance of the acquired business and the diversion of management attention to integration efforts could result in significant value destruction, impacting the Group’s profitability and growth objectives.
The Board approves business case and funding requirements for all significant investments.
The Group has acquisition integration processes in place to monitor the performance of acquired businesses and to implement corrective actions.
Acquired entity management teams are typically strengthened by the transfer of experienced Glanbia managers, which assists in increasing the efficiency of integration efforts.
Mandatory post-acquisition completion and significant capital expenditure project reviews are conducted, with regular Audit Committee updates.
The Board considered and approved the SlimFast brand acquisition to complement the GPN brand portfolio in 2018. In addition, the Group participated with its strategic joint venture partners in a number of dairy related investments including:• A €130 million investment in a mozzarella cheese plant in Ireland with our
JV partner Leprino Foods Company; • Commencing construction of a large scale cheese and whey plant in the
state of Michigan; a US$470 million investment in a joint venture, replicating the partnership in place at Southwest Cheese in New Mexico.
• Our JV Glanbia Ireland agreeing a plan with Royal A-ware to build a new €140 million continental cheese facility in Ireland.
The Group Finance Director presented to the Audit Committee on the output of post-acquisition completion reviews conducted in 2018.
The Audit Committee assessed the impairment review of goodwill and intangibles as outlined on page 74.
The Board will continue to review the Group’s overall portfolio as part of its strategic review processes.
In February 2019 the Group agreed to acquire Watson, a US based non-dairy ingredient solutions business which will be a complementary acquisition for the Group.
Acquisition integration and post-acquisition review processes will be monitored through regular Board meetings and Audit Committee reviews.
The Audit Committee will review the impairment testing methodology, inputs, assumptions, sensitivity analysis and results of any material business units performing below expectations.
The Board will continue to evaluate acquisition opportunities to broaden the portfolio.
Financial risk
Tax risk The Group’s tax strategy may be impacted by legislative changes to local or international tax rules.
The Group may be exposed to additional tax liabilities.
The Group employs a team of tax professionals to support the Group in ensuring compliance with legislative requirements globally.
We constructively engage with tax authorities where appropriate and we engage advisors to clarify tax legislation to ensure that we achieve compliance with relevant tax law across the jurisdictions in which we operate.
The Audit Committee received a number of presentations during the year from management and our external advisors on the status of current tax authority reviews, tax structures and controls and the ongoing management of our current operations.
The Committee was satisfied with the outcome of the various tax authority reviews which have concluded with no material issues arising.
Continuing to monitor potential further developments in international tax legislation.
Ensuring compliance with recent new legislative requirements.
Continued pro-active engagement with tax authorities in all material jurisdictions.
Grow performance nutrition Organic and acquisitional growth Sustain and drive nutritional solutions Develop talent, culture and values

Glanbia plc | Annual Report and Financial Statements 2018
51
Risk Trend
Risk Potential Impact Mitigation Developments in 2018 2019 Focus Areas
Strategic and Commercial risks
Economic, Industry and Political risk Our performance is influenced by global economic conditions, consumer confidence and the stability of the markets in which we operate. Failing to recognise or obtain accurate and relevant competitive and environmental intelligence may result in the adoption of incorrect business strategies.
Deterioration in economic growth or consumer confidence, significant currency movements, political instability or civil disturbances may impact performance and the achievement of growth targets.
Our strategy is aimed at the continued expansion of our geographic reach, focusing on key customer relationships and investment in new product development which will help to protect the Group from short-term economic fluctuations.
As an established international business, the Group already operates in many countries with differing, and in some cases fast-changing, competitive, economic, social and political conditions. Detailed market knowledge is assembled using a team of internal and external experts and potential risk exposures are assessed in advance of establishing operations.
The Board regularly assesses key market trends and the implications for Group performance and strategic objectives. Corrective actions are identified and implemented as required.
Macroeconomic and global trade uncertainty continued to increase in 2018, partly as a result of the geo-political climate where the potential introduction of further trade tariffs may have negative impacts to our strategic growth objectives.
Across the organisation we continue to expand our portfolio into new areas of operation and new geographies to balance macroeconomic risk but the potential for further trade and tariff disputes may create new operational and financial challenges.
The nature of the United Kingdom’s future trading relationship with the European Union post Brexit is still to be determined. Management continues to assess risks and develop action plans in this area with a detailed Board update in December 2018.
From a Group perspective the uncertainty surrounding the evolving economic landscape and Brexit has increased the potential risk of raw material pricing volatility, cross border trade costs, currency volatility and product pricing volatility. This will require continued focus by the internal teams established to assess and monitor any potential impacts to the Group’s performance.
We will continue to invest in developing in-house capabilities to assess trends in key market areas ensuring accurate and relevant data is available to the Board and management teams to support decision making.
Customer Concentration risk The Group benefits from close commercial relationships with a number of key customers.
The loss or material disruption with one or more of these customers, or a significant deterioration in commercial terms, could have a material impact on Group profitability.
The Group has developed strong relationships with major customers by focusing on superior customer service, quality assurance and cost competitiveness.
The Group has focused innovation pipelines in GPN and GN led by consumer insights and market research.
The Board regularly reviews its exposure to individual customers and considers the impact of acquisitions where relevant.
Credit exposure is actively reviewed and managed including the use of credit insurance where possible.
The Board has reviewed its exposures to individual customers and channels as part of the strategic review process and during its considerations of the impact of acquisitions where relevant.
We continually assess the potential impact of channel shifts by consumers and the financial strength of our customer base.
Building key customer partnerships through strategic capacity expansions and product supply opportunities, particularly with our core GN customers.
Monitor our customer credit exposures and balance sheet risks and utilise available mitigation to limit the risks where possible.
Market risk Increasing competition across certain channels through high promotional activity, competitor product innovation and channel shifts provides an ongoing challenge.
Potential adverse effect on the Group’s financial performance if we fail to adapt successfully where and when required to meet market challenges.
We actively monitor the major trends impacting our businesses and fully consider these as part of our strategic review processes.
We limit the impact of prolonged competitor challenges through continued channel and international expansion including a broadening of our portfolio through targeted acquisitions and strategic alliances.
We invest in research and development expenditure focused on value-added and customer-specific solutions and invest in promotional activities where required.
A focused approach to innovation and targeted acquisitions has enabled GPN to broaden its customer base into new channels, geographies and evolving, fast growing convenient formats such as Ready-to-Eat (RTE) and Ready-to-Drink (RTD).
The market remained particularly competitive in North America during 2018 for RTE formats.
GN has continued its focus on differentiating its capabilities from competitors through innovation to enable it to be the partner of choice for nutritional and functional solutions across both the dairy and non-dairy segments.
The Board believes that despite the dynamic nature of many of the markets in which it operates, the Group’s broadening product portfolio, channel mix and geographic reach offers it an enhanced opportunity to protect our market positions.
The Group will continue to pursue targeted acquisitions and strategic alliances to further expand our product, customer, channel and geographic reach.
We will continue to focus on developing key consumer insights and trends in all areas of the business and matching these to our innovation capabilities will be integral to our stated growth ambitions.
Acquisition risk The anticipated benefits of acquisitions may not be achieved if the Group fails to conduct full and proper due diligence, raise the required funds, complete the transaction or properly integrate the operations of the acquired businesses.
Below expected performance of the acquired business and the diversion of management attention to integration efforts could result in significant value destruction, impacting the Group’s profitability and growth objectives.
The Board approves business case and funding requirements for all significant investments.
The Group has acquisition integration processes in place to monitor the performance of acquired businesses and to implement corrective actions.
Acquired entity management teams are typically strengthened by the transfer of experienced Glanbia managers, which assists in increasing the efficiency of integration efforts.
Mandatory post-acquisition completion and significant capital expenditure project reviews are conducted, with regular Audit Committee updates.
The Board considered and approved the SlimFast brand acquisition to complement the GPN brand portfolio in 2018. In addition, the Group participated with its strategic joint venture partners in a number of dairy related investments including:• A €130 million investment in a mozzarella cheese plant in Ireland with our
JV partner Leprino Foods Company; • Commencing construction of a large scale cheese and whey plant in the
state of Michigan; a US$470 million investment in a joint venture, replicating the partnership in place at Southwest Cheese in New Mexico.
• Our JV Glanbia Ireland agreeing a plan with Royal A-ware to build a new €140 million continental cheese facility in Ireland.
The Group Finance Director presented to the Audit Committee on the output of post-acquisition completion reviews conducted in 2018.
The Audit Committee assessed the impairment review of goodwill and intangibles as outlined on page 74.
The Board will continue to review the Group’s overall portfolio as part of its strategic review processes.
In February 2019 the Group agreed to acquire Watson, a US based non-dairy ingredient solutions business which will be a complementary acquisition for the Group.
Acquisition integration and post-acquisition review processes will be monitored through regular Board meetings and Audit Committee reviews.
The Audit Committee will review the impairment testing methodology, inputs, assumptions, sensitivity analysis and results of any material business units performing below expectations.
The Board will continue to evaluate acquisition opportunities to broaden the portfolio.
Financial risk
Tax risk The Group’s tax strategy may be impacted by legislative changes to local or international tax rules.
The Group may be exposed to additional tax liabilities.
The Group employs a team of tax professionals to support the Group in ensuring compliance with legislative requirements globally.
We constructively engage with tax authorities where appropriate and we engage advisors to clarify tax legislation to ensure that we achieve compliance with relevant tax law across the jurisdictions in which we operate.
The Audit Committee received a number of presentations during the year from management and our external advisors on the status of current tax authority reviews, tax structures and controls and the ongoing management of our current operations.
The Committee was satisfied with the outcome of the various tax authority reviews which have concluded with no material issues arising.
Continuing to monitor potential further developments in international tax legislation.
Ensuring compliance with recent new legislative requirements.
Continued pro-active engagement with tax authorities in all material jurisdictions.
Increasing Stable Decreasing
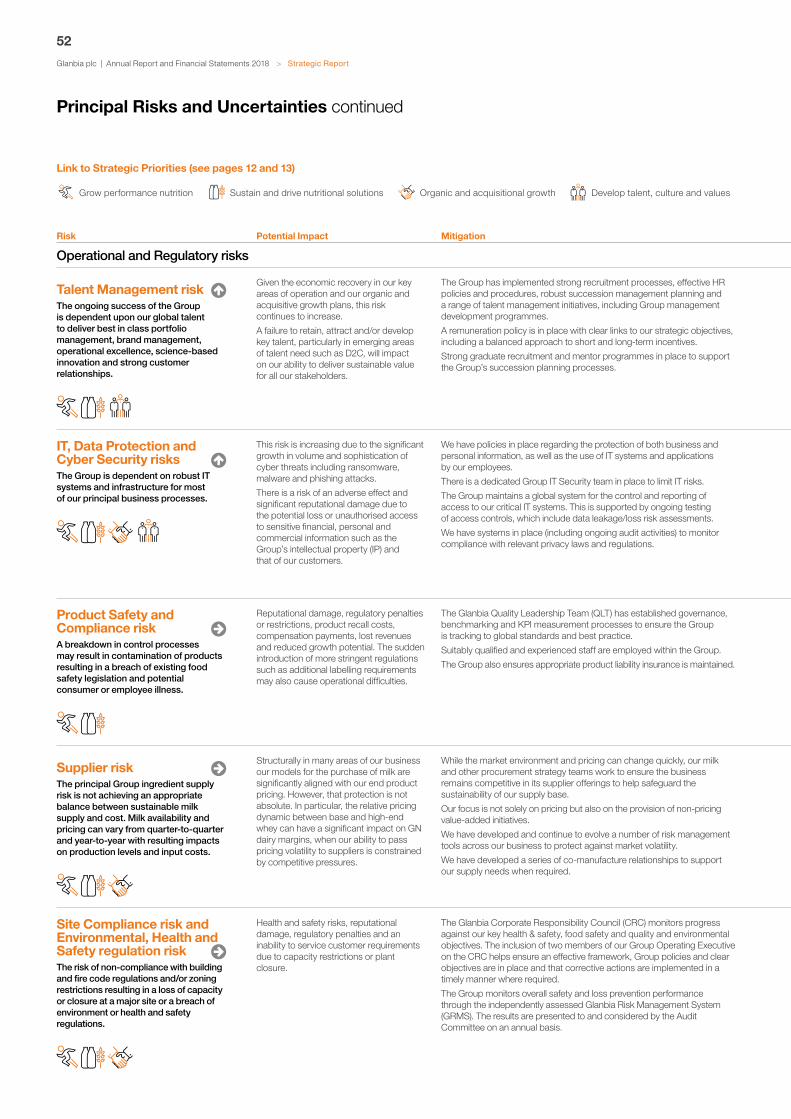
Glanbia plc | Annual Report and Financial Statements 2018
52
> Strategic Report
Principal Risks and Uncertainties continued
Risk Potential Impact Mitigation Developments in 2018 2019 Focus Areas
Operational and Regulatory risks
Talent Management risk The ongoing success of the Group is dependent upon our global talent to deliver best in class portfolio management, brand management, operational excellence, science-based innovation and strong customer relationships.
Given the economic recovery in our key areas of operation and our organic and acquisitive growth plans, this risk continues to increase.
A failure to retain, attract and/or develop key talent, particularly in emerging areas of talent need such as D2C, will impact on our ability to deliver sustainable value for all our stakeholders.
The Group has implemented strong recruitment processes, effective HR policies and procedures, robust succession management planning and a range of talent management initiatives, including Group management development programmes.
A remuneration policy is in place with clear links to our strategic objectives, including a balanced approach to short and long-term incentives.
Strong graduate recruitment and mentor programmes in place to support the Group’s succession planning processes.
Commenced a HR transformation programme with a core focus on talent acquisition, including a new global talent centre of excellence supported by a new IT platform.
Continued execution of our people strategy which aims to sustain a high-performing, values driven and respectful culture.
Implemented a restructure of our Performance Development Programme, integrating a values assessment into our performance requirement processes.
The programme of investment in hiring new talent, skills and capability to underpin our growth ambitions.
Continued focus on our employee engagement program including a Group wide employee pulse survey.
Continued development of our approach to increasing diversity across the organisation, including our talent pipeline, new acquisitions and new geographies.
Continue to embed our purpose, vision and values across all levels of the Group through defined training programmes.
IT, Data Protection and Cyber Security risks The Group is dependent on robust IT systems and infrastructure for most of our principal business processes.
This risk is increasing due to the significant growth in volume and sophistication of cyber threats including ransomware, malware and phishing attacks.
There is a risk of an adverse effect and significant reputational damage due to the potential loss or unauthorised access to sensitive financial, personal and commercial information such as the Group’s intellectual property (IP) and that of our customers.
We have policies in place regarding the protection of both business and personal information, as well as the use of IT systems and applications by our employees.
There is a dedicated Group IT Security team in place to limit IT risks.
The Group maintains a global system for the control and reporting of access to our critical IT systems. This is supported by ongoing testing of access controls, which include data leakage/loss risk assessments.
We have systems in place (including ongoing audit activities) to monitor compliance with relevant privacy laws and regulations.
Control processes further developed to limit the risk of system intrusion and/or data loss with a particular focus on the EU General Data Protection Regulation (GDPR) requirements.
Consolidation of our e-Commerce providers with detailed supplier risk assessments at vendor selection stage.
Vulnerability scans implemented across all e-Commerce sites.
Detailed IT Internal Audit work programme to identify operational IT weaknesses.
Continue to review our data protection regulatory obligations.
Focus on ensuring the effective integration of our IT systems and the related Group monitoring controls post-acquisition.
Completion of the phased migration to our preferred online platform.
Performance of end-to-end website security reviews across e-Commerce websites.
Continued focus on raising awareness of potential cyber attack threats such as phishing and social engineering.
Protection of IP is a key focus area for the cross functional teams involved including Group Legal, IT and the relevant commercial, operational and R&D teams. We will ensure our IP is protected through appropriate IT security measures, patent applications and related control procedures, and the inclusion of IP protection clauses as a standard element of employment contracts.
Product Safety and Compliance risk A breakdown in control processes may result in contamination of products resulting in a breach of existing food safety legislation and potential consumer or employee illness.
Reputational damage, regulatory penalties or restrictions, product recall costs, compensation payments, lost revenues and reduced growth potential. The sudden introduction of more stringent regulations such as additional labelling requirements may also cause operational difficulties.
The Glanbia Quality Leadership Team (QLT) has established governance, benchmarking and KPI measurement processes to ensure the Group is tracking to global standards and best practice.
Suitably qualified and experienced staff are employed within the Group.
The Group also ensures appropriate product liability insurance is maintained.
100% of sites are compliant with globally recognised food safety standards.
Conducted an independent review of our food safety programme based on industry best practice with lessons learned being incorporated into our global standards for priority topics.
Enhanced Group wide standards for sanitation and contract manufacturing qualification were launched.
Ensuring new regulatory requirements and emerging issues are captured with appropriate team training on the revised requirements.
Reviewing our crisis management protocols versus best practice.
Ensuring our global reporting tool, core Glanbia Quality Standards (GQS) and system of third party audits/certifications are fully embedded.
Supplier risk The principal Group ingredient supply risk is not achieving an appropriate balance between sustainable milk supply and cost. Milk availability and pricing can vary from quarter-to-quarter and year-to-year with resulting impacts on production levels and input costs.
Structurally in many areas of our business our models for the purchase of milk are significantly aligned with our end product pricing. However, that protection is not absolute. In particular, the relative pricing dynamic between base and high-end whey can have a significant impact on GN dairy margins, when our ability to pass pricing volatility to suppliers is constrained by competitive pressures.
While the market environment and pricing can change quickly, our milk and other procurement strategy teams work to ensure the business remains competitive in its supplier offerings to help safeguard the sustainability of our supply base.
Our focus is not solely on pricing but also on the provision of non-pricing value-added initiatives.
We have developed and continue to evolve a number of risk management tools across our business to protect against market volatility.
We have developed a series of co-manufacture relationships to support our supply needs when required.
The majority of our dairy activities are in joint venture partnerships with established, robust business models to manage this risk in our dairy operations.
GN continues to engage proactively with the US patron supplier base on milk procurement policy and milk price to underpin long-term sustainable supply and it specifically altered aspects of procurement in 2018 to address key risk areas.
On farm sustainability and animal-welfare programmes within Ireland.
Ongoing engagement with our supply base in Ireland and the US to ensure sustainability of supply at a level of pricing that is both commercial and competitive.
Targeting 100% supplier certification within Ireland to Origin Green.
Driving continuous improvement with our US farm suppliers through the US Farmers Assuring Responsible Management (FARM) environmental stewardship programme.
Site Compliance risk and Environmental, Health and Safety regulation risk The risk of non-compliance with building and fire code regulations and/or zoning restrictions resulting in a loss of capacity or closure at a major site or a breach of environment or health and safety regulations.
Health and safety risks, reputational damage, regulatory penalties and an inability to service customer requirements due to capacity restrictions or plant closure.
The Glanbia Corporate Responsibility Council (CRC) monitors progress against our key health & safety, food safety and quality and environmental objectives. The inclusion of two members of our Group Operating Executive on the CRC helps ensure an effective framework, Group policies and clear objectives are in place and that corrective actions are implemented in a timely manner where required.
The Group monitors overall safety and loss prevention performance through the independently assessed Glanbia Risk Management System (GRMS). The results are presented to and considered by the Audit Committee on an annual basis.
Continued development of our health & safety, food safety and quality and environmental programmes.
Global Health & Safety reporting platform introduced across 95% of Group locations to support our measurement processes against industry standards and our Lost Time cases accident reduction targets.
The Group continues to invest in energy efficiency advancements, carbon reduction and emission management programmes.
Continued Group commitment to pursuing a vision of zero harm.
Embed our Group policies and procedures through our improved performance dashboard reporting and CRC governance.
Focused approach to ensuring effective Root Cause Analysis.
Monitoring of evolving regulatory requirements.
Link to Strategic Priorities (see pages 12 and 13)
Grow performance nutrition Organic and acquisitional growth Sustain and drive nutritional solutions Develop talent, culture and values

Glanbia plc | Annual Report and Financial Statements 2018
53
Risk Potential Impact Mitigation Developments in 2018 2019 Focus Areas
Operational and Regulatory risks
Talent Management risk The ongoing success of the Group is dependent upon our global talent to deliver best in class portfolio management, brand management, operational excellence, science-based innovation and strong customer relationships.
Given the economic recovery in our key areas of operation and our organic and acquisitive growth plans, this risk continues to increase.
A failure to retain, attract and/or develop key talent, particularly in emerging areas of talent need such as D2C, will impact on our ability to deliver sustainable value for all our stakeholders.
The Group has implemented strong recruitment processes, effective HR policies and procedures, robust succession management planning and a range of talent management initiatives, including Group management development programmes.
A remuneration policy is in place with clear links to our strategic objectives, including a balanced approach to short and long-term incentives.
Strong graduate recruitment and mentor programmes in place to support the Group’s succession planning processes.
Commenced a HR transformation programme with a core focus on talent acquisition, including a new global talent centre of excellence supported by a new IT platform.
Continued execution of our people strategy which aims to sustain a high-performing, values driven and respectful culture.
Implemented a restructure of our Performance Development Programme, integrating a values assessment into our performance requirement processes.
The programme of investment in hiring new talent, skills and capability to underpin our growth ambitions.
Continued focus on our employee engagement program including a Group wide employee pulse survey.
Continued development of our approach to increasing diversity across the organisation, including our talent pipeline, new acquisitions and new geographies.
Continue to embed our purpose, vision and values across all levels of the Group through defined training programmes.
IT, Data Protection and Cyber Security risks The Group is dependent on robust IT systems and infrastructure for most of our principal business processes.
This risk is increasing due to the significant growth in volume and sophistication of cyber threats including ransomware, malware and phishing attacks.
There is a risk of an adverse effect and significant reputational damage due to the potential loss or unauthorised access to sensitive financial, personal and commercial information such as the Group’s intellectual property (IP) and that of our customers.
We have policies in place regarding the protection of both business and personal information, as well as the use of IT systems and applications by our employees.
There is a dedicated Group IT Security team in place to limit IT risks.
The Group maintains a global system for the control and reporting of access to our critical IT systems. This is supported by ongoing testing of access controls, which include data leakage/loss risk assessments.
We have systems in place (including ongoing audit activities) to monitor compliance with relevant privacy laws and regulations.
Control processes further developed to limit the risk of system intrusion and/or data loss with a particular focus on the EU General Data Protection Regulation (GDPR) requirements.
Consolidation of our e-Commerce providers with detailed supplier risk assessments at vendor selection stage.
Vulnerability scans implemented across all e-Commerce sites.
Detailed IT Internal Audit work programme to identify operational IT weaknesses.
Continue to review our data protection regulatory obligations.
Focus on ensuring the effective integration of our IT systems and the related Group monitoring controls post-acquisition.
Completion of the phased migration to our preferred online platform.
Performance of end-to-end website security reviews across e-Commerce websites.
Continued focus on raising awareness of potential cyber attack threats such as phishing and social engineering.
Protection of IP is a key focus area for the cross functional teams involved including Group Legal, IT and the relevant commercial, operational and R&D teams. We will ensure our IP is protected through appropriate IT security measures, patent applications and related control procedures, and the inclusion of IP protection clauses as a standard element of employment contracts.
Product Safety and Compliance risk A breakdown in control processes may result in contamination of products resulting in a breach of existing food safety legislation and potential consumer or employee illness.
Reputational damage, regulatory penalties or restrictions, product recall costs, compensation payments, lost revenues and reduced growth potential. The sudden introduction of more stringent regulations such as additional labelling requirements may also cause operational difficulties.
The Glanbia Quality Leadership Team (QLT) has established governance, benchmarking and KPI measurement processes to ensure the Group is tracking to global standards and best practice.
Suitably qualified and experienced staff are employed within the Group.
The Group also ensures appropriate product liability insurance is maintained.
100% of sites are compliant with globally recognised food safety standards.
Conducted an independent review of our food safety programme based on industry best practice with lessons learned being incorporated into our global standards for priority topics.
Enhanced Group wide standards for sanitation and contract manufacturing qualification were launched.
Ensuring new regulatory requirements and emerging issues are captured with appropriate team training on the revised requirements.
Reviewing our crisis management protocols versus best practice.
Ensuring our global reporting tool, core Glanbia Quality Standards (GQS) and system of third party audits/certifications are fully embedded.
Supplier risk The principal Group ingredient supply risk is not achieving an appropriate balance between sustainable milk supply and cost. Milk availability and pricing can vary from quarter-to-quarter and year-to-year with resulting impacts on production levels and input costs.
Structurally in many areas of our business our models for the purchase of milk are significantly aligned with our end product pricing. However, that protection is not absolute. In particular, the relative pricing dynamic between base and high-end whey can have a significant impact on GN dairy margins, when our ability to pass pricing volatility to suppliers is constrained by competitive pressures.
While the market environment and pricing can change quickly, our milk and other procurement strategy teams work to ensure the business remains competitive in its supplier offerings to help safeguard the sustainability of our supply base.
Our focus is not solely on pricing but also on the provision of non-pricing value-added initiatives.
We have developed and continue to evolve a number of risk management tools across our business to protect against market volatility.
We have developed a series of co-manufacture relationships to support our supply needs when required.
The majority of our dairy activities are in joint venture partnerships with established, robust business models to manage this risk in our dairy operations.
GN continues to engage proactively with the US patron supplier base on milk procurement policy and milk price to underpin long-term sustainable supply and it specifically altered aspects of procurement in 2018 to address key risk areas.
On farm sustainability and animal-welfare programmes within Ireland.
Ongoing engagement with our supply base in Ireland and the US to ensure sustainability of supply at a level of pricing that is both commercial and competitive.
Targeting 100% supplier certification within Ireland to Origin Green.
Driving continuous improvement with our US farm suppliers through the US Farmers Assuring Responsible Management (FARM) environmental stewardship programme.
Site Compliance risk and Environmental, Health and Safety regulation risk The risk of non-compliance with building and fire code regulations and/or zoning restrictions resulting in a loss of capacity or closure at a major site or a breach of environment or health and safety regulations.
Health and safety risks, reputational damage, regulatory penalties and an inability to service customer requirements due to capacity restrictions or plant closure.
The Glanbia Corporate Responsibility Council (CRC) monitors progress against our key health & safety, food safety and quality and environmental objectives. The inclusion of two members of our Group Operating Executive on the CRC helps ensure an effective framework, Group policies and clear objectives are in place and that corrective actions are implemented in a timely manner where required.
The Group monitors overall safety and loss prevention performance through the independently assessed Glanbia Risk Management System (GRMS). The results are presented to and considered by the Audit Committee on an annual basis.
Continued development of our health & safety, food safety and quality and environmental programmes.
Global Health & Safety reporting platform introduced across 95% of Group locations to support our measurement processes against industry standards and our Lost Time cases accident reduction targets.
The Group continues to invest in energy efficiency advancements, carbon reduction and emission management programmes.
Continued Group commitment to pursuing a vision of zero harm.
Embed our Group policies and procedures through our improved performance dashboard reporting and CRC governance.
Focused approach to ensuring effective Root Cause Analysis.
Monitoring of evolving regulatory requirements.
Risk Trend
Increasing Stable Decreasing

Glanbia plc | Annual Report and Financial Statements 2018
54
> Director’s Report
In this section
Corporate Governance Report 55-69
Introduction from the Chairman 55
Board of Directors and Senior Management 57
Board Leadership and Company Purpose 62
Division of Responsibilities 64
Composition, Succession and Evaluation 66
Audit, Risk, Internal Control and Remuneration 68
Compliance Statements 69
Audit Committee Report 70
Nomination and Governance Committee Report 76
Remuneration Committee Report 80
Other Statutory Information 102
Directors’ Responsibility Statement 107
Directors’ Report

Glanbia plc | Annual Report and Financial Statements 2018
55
Corporate Governance ReportIntroduction from the Chairman
Dear shareholder,I am delighted to present my first Corporate Governance Report as Group Chairman which reinforces the Board’s continued commitment to strong corporate governance and the highest ethical standards.
StrategyI am committed to fostering a well governed and effective Board to support the delivery of the Group’s strategic priorities. The Board is very clear on our responsibility to ensure the Group is capable of delivering on its strategic objectives. We operate with due regard to the interests of all our stakeholders and are aware of the potential impact of our decisions upon them. Having a clearly defined strategy, a robust governance structure and a culture to guide our values and behaviours remains a priority for the Board and in the following pages we explain our approach to governance and how we fulfil our responsibility to ensure that robust governance practices are embedded across the Group.
Board and Committee compositionThere were a number of changes to the composition of the Board during the year which are discussed in detail in the Nomination and Governance Report on pages 77 and 78. From a governance perspective the most significant changes were (i) the reduction in June 2018 of the number of Non-Executive Directors nominated by the Glanbia Co-operative Society Ltd (‘Society Nominees Directors’) from ten to eight in accordance with the amended and restated relationship agreement dated 2 July 2017 (the ‘Relationship Agreement’) between the Company and the Society and (ii) the reorganisation of the composition of the Board, where it is proposed that from 1 May 2019 it will be comprised as follows:• Two Executive Directors; Group Managing Director and Group
Finance Director;• Six Independent Non-Executive Directors; and• Eight Society Nominee Directors.
To facilitate this reorganisation and the broadening of the external perspective of the Board, Hugh McGuire and Brian Phelan will not be putting themselves forward for re-election at the 2019 Annual General Meeting (AGM). Their key executive roles are unaltered and they will continue in their executive leadership positions as CEOs of the Group’s two global growth platforms, Glanbia Performance Nutrition and Glanbia Nutritionals respectively.
I am delighted to welcome Mary Minnick and Richard Laube to the Board effective 1 May 2019. Mary and Richard bring a wealth of experience from prior executive and non-executive leadership roles within various multinational consumer health, food and beverage businesses.
Mary Minnick (59) was previously a partner of Lion Capital LLP, a consumer-focused private equity firm, from 2007 to 2018. In that role, Mary was involved in a number of successful investments in well-known retail and consumer branded companies, several of which she chaired. Prior to that, Mary had a 23-year career with The Coca-Cola Company, where she held a variety of senior management positions, including Chief Operating Officer of the Asian region, Division President roles in the Japan, South Pacific and Asian regions, and ultimately as the company’s Chief Marketing Officer and Global President of Strategy and Innovation. She is an experienced Board Director and is currently a member of the Boards of Target Corporation and Leo Holdings Corp, both of which are publicly-traded in the US. Previously she was a member of the Boards of Heineken NV and Whitewave Foods, also US publicly traded. Mary holds an MBA from Duke University in the US and a BS in Business Administration from Bowling Green State University in the US.
Richard Laube (62) was CEO of Nobel Biocare, a Swiss listed medical device business, from April 2011 to April 2016. Prior to that Richard served as Executive Board Member of Nestlé SA, from April 2005 to September 2010, and served operationally as CEO of Nestlé Nutrition. Before Nestlé, Richard served as Executive Committee member of Roche Holding AG and was operationally responsible for Roche Consumer Health. Earlier in his career he held positions of increasing responsibility in brand and general management at Procter & Gamble, including international assignments in Switzerland, the USA, Japan, Germany and Brazil. Richard is an experienced company director, having served as Chairman of Atkins Nutritionals Inc. from January 2011 to July 2017 and remained as independent director of the Simply Good Foods Company upon the company’s successful initial public offering on NASDAQ in July 2017. He currently serves as a Director of Gnubiotics Sciences and Piqur Therapeutics SA. He has previously served as independent board member of Logitech SA. Richard holds an MA and BA in Psychology from Boston University in the US.
Committed to robust corporate governance supported by our strong culture and values

Glanbia plc | Annual Report and Financial Statements 2018
56
> Director’s Report
Directors’ tenure on the Board Retirements since 20 February 2018
Between 3 and 6 years Between 6 and 9 years Over 9 years
Name Michael KeaneRetired: 25 April 2018
Name Tom GrantRetired: 1 June 2018
Name Henry CorballyRetired: 21 June 2018 All three retirees were nominees of the Society.
Paul Haran, Senior Independent Director, will retire immediately upon completion of the appointment of a third new Independent Non-Executive Director which is expected to be completed during 2019. Following Mr. Haran’s retirement, Dan O’Connor will take up the position of Senior Independent Director. We have expanded the role of Donard Gaynor, an Independent Non-Executive Director, to include oversight of workforce engagement to further improve our Board involvement in this area. The Company will announce the appointment of the new Independent Non-Executive Director to replace Mr. Haran and changes to the composition of the Committees (which will continue to comprise all independent Non-Executive Directors) in due course.
In accordance with the Relationship Agreement between the Company and the Society, in 2020 the number of Society Nominee Directors will reduce from eight to seven and in 2022 the number of Society Nominee Directors will reduce to six. It is the intention that the Society will continue to nominate a Society nominee as Chairman of the Board until no later than 30 June 2020.
Further details of these changes and the selection process undertaken by the Company in respect of the appointment of the new Independent Non-Executive Directors can be found on page 78.
Board evaluation and Board effectivenessThe Board undertook an internal evaluation in 2018; an external evaluation is scheduled for 2019. The internal evaluation process incorporated elements of the Institute of Chartered Secretaries and Administrators (ICSA) guidance on Board effectiveness and the revised UK Corporate Governance Code and focused on the overall effectiveness of the Board and its Committees; the process and results of which are discussed on pages 66 and 67.
Remuneration and reportingThe Remuneration Committee agenda continued to concentrate on key matters of Company and individual Executive Director performance and the consideration of appropriate short term and long term targets across key financial and non-financial metrics. Discussions covered a wide range of topics including the executive pay landscape and increased engagement with the wider workforce.
UK Corporate Governance Code (2018)The Board is cognisant of the Financial Reporting Council’s (FRC) revised UK Corporate Governance Code (2018) (the “Code”) which is applicable from 1 January 2019. The Board is supportive of the revisions of the Code given the wide societal impact and greater expectation of large organisations today. The revisions to the Code in relation to corporate culture, strengthening the stakeholder voice and adopting appropriate remuneration structures are areas in which the Board is already committed to providing focus and upholding high standards of corporate governance. In the following report, we have reflected how the Group has already applied many of the updated principles of the Code that emphasise the value of good corporate governance to long-term sustainable success. We are determined to continue our policy of deep engagement with all stakeholders to ensure we understand and respect the needs of our shareholders, our suppliers, our colleagues and our customers. In recent years we have also recognised that workforce engagement is extremely important for the future health and prosperity of Glanbia, a process to date led by the Executive team through town hall meetings, management conferences, site visits, the establishment of a whistleblowing policy and a speak up line.
Looking aheadThe Board welcomes open, meaningful discussion with all of our shareholders and I look forward to meeting shareholders at our 2019 AGM, which will be held on 24 April 2019 at 11.00 am in the Lyrath Estate Hotel, Old Dublin Road, Kilkenny. I also welcome questions from shareholders either via our website www.glanbia.com, e-mail or in person at the AGM.
Finally, I would like to thank my colleagues on the Board and all our employees for their continued support, commitment, challenge and passion for our business.
Martin KeaneGroup Chairman
Corporate Governance Report continuedIntroduction from the Chairman continued

Glanbia plc | Annual Report and Financial Statements 2018
57
Board of Directors and Senior ManagementGroup Chairman, Vice-Chairmen, Non-Executive Directors nominated by Glanbia Co-operative Society Limited (the ‘Society’)
Martin Keane Group Chairman and Non-Executive Director nominated by the SocietyAge: 63
John Murphy Vice-Chairman and Non-Executive Director nominated by the SocietyAge: 56
Patrick Murphy Vice-Chairman and Non-Executive Director nominated by the SocietyAge: 60
Term of officeDate of Appointment: 24 May 2006Tenure: 12 full years
Term of officeDate of Appointment: 29 June 2010Tenure: Eight full years
Term of OfficeDate of Appointment: 26 May 2011Tenure: Seven full years
Skills, competence and experienceMartin Keane was appointed Group Chairman on 1 June 2018 having previously served eight years as Vice-Chairman. Martin farms at Errill, Portlaoise, Co. Laois and has completed the ICOS Co-operative Leadership Programme. Martin is Director of Ornua Co-operative Limited and a former President of the Irish Co-operative Organisation Society Limited.
Skills, competence and experienceJohn Murphy was appointed as a Vice-Chairman on 2 June 2017. John farms at Ballinacoola, Craanford, Gorey, Co. Wexford. John is Vice-Chairman of the National Dairy Council and has completed the University College Cork Diploma in Corporate Direction.
Skills, competence and experiencePatrick Murphy was re-appointed as a Vice-Chairman on 1 June 2018 having previously served two years as Vice-Chairman from 2015 to 2017. Patrick farms at Smithstown, Maddoxtown, Co. Kilkenny and is a Director of Farmer Business Developments plc.
UK Corporate Governance CodeThe Group has adopted the Irish Corporate Governance Annex (2010) and the UK Corporate Governance Code collectively known as (the ‘Codes’). A fundamental part of the way the Board conducts its business is embedding the main principles of the Codes and embracing best practice across all parts of our organisation. Details of where the Codes can be accessed are included on page 69. Each year, through the Directors’ Report, we describe how we have complied with the Codes and in line with its “comply or explain” model we detail any departures from its specific provisions. For 2018 we are reporting against the 2016 version of the code and confirm full compliance with its provisions with the exception of A.3.1 (Independence of the Chairman on appointment) and B.1 (Composition of the Board of Directors) of the UK Corporate Governance Code (2016). The appointment of a Director nominated by the Society (‘Society Nominee Director’) as Group Chairman and the current composition of the Board reflect the historical shareholding and relationship of the Company with the Society which is documented in the amended and restated relationship agreement dated 2 July 2017 (the “Relationship Agreement”) the provisions of
which were approved by shareholders at the Extraordinary General Meeting held on 22 May 2017. Between 2012 and 2017, the Society and the Board agreed on a number of changes impacting the composition and size of the Board over the period 2016 to 2022 which will reduce the number of Society Nominee Directors on the Board from the current level of eight (previously 14) to six (details of which are set out in the Nomination and Governance Committee Report on page 77). As documented in the Relationship Agreement, the Society and the Board also agreed that the Society would continue to nominate a Society Nominee Director as Chairman of the Board until 30 June 2020. The Board will continue to work closely with the representatives of the Society to further the interests of the Group. The Board is satisfied that the appointment of a Society Nominee Director as Chairman and the current composition and size of the Board (which has received shareholder approval) is justified in our particular circumstances. A detailed description of how we have applied the principles of the Irish Corporate Governance Annex (2010) and the UK Corporate Governance Code (2016) is set out in the following pages including the Audit, Nomination and Governance and Remuneration Committee Reports.

Glanbia plc | Annual Report and Financial Statements 2018
58
> Director’s Report
Corporate Governance Report continued Board of Directors and Senior ManagementSenior Independent Director, Non-Executive Directors
Paul Haran Senior Independent Director and Non-Executive DirectorAge: 61
Patrick Coveney Non-Executive DirectorAge: 48
Donard Gaynor Non-Executive DirectorAge: 62
Dan O’Connor Non-Executive DirectorAge: 59
Term of officeDate of Appointment: 9 June 2005Tenure: 13 full years
Term of officeDate of Appointment: 30 May 2014Tenure: Four full years
Term of officeDate of Appointment: 12 March 2013Tenure: Five full years
Term of officeDate of Appointment: 1 December 2014Tenure: Four full years
Skills, competence and experiencePaul Haran is a Director of Insurance Ireland and the Mater Private Hospital. He also chairs Edward Dillon & Co. Previously he was Secretary General of the Department of Enterprise and Employment, Principal of the University College Dublin College of Business and Law and a Director of Bank of Ireland, the Road Safety Authority, the Institute of Public Administration and chaired the Qualifications Authority of Ireland. He graduated from Trinity College Dublin with a B.Sc. in Computer Science and an M.Sc. in Public Sector Analysis. He was awarded Honorary Doctorates from both Trinity College Dublin and University College Dublin.
Committee MembershipNomination and Governance Committee (Chair) Audit Committee/Remuneration Committee (Member)
Skills, competence and experiencePatrick Coveney is Chief Executive Officer (CEO) of Greencore Group plc, the leading convenience foods manufacturer. Prior to becoming CEO of Greencore, Patrick served as the Chief Financial Officer for Greencore for over two years. Before he joined Greencore, Patrick was Managing Partner of McKinsey & Company in Ireland. Patrick is also Non-Executive Chairman of Core Media Group. He holds an M.Phil and D.Phil from New College Oxford University, where he was a Rhodes Scholar. He also holds a Bachelor of Commerce degree (First Class) from University College Cork. Patrick served as President of the Dublin Chamber of Commerce in 2012, having been a Council member since 2003.
Committee MembershipAudit Committee/Nomination and Governance Committee (Member)
Skills, competence and experienceDonard Gaynor retired in December 2012 as Senior Vice President of Strategy and Corporate Development of Beam, Inc., the premium spirits company previously listed on the New York Stock Exchange, based in Chicago, Illinois. A Fellow of Chartered Accountants Ireland and the American Institute of Certified Public Accountants, he joined Beam Inc. in 2003 as Senior Vice President and Managing Director – International. Prior to this, he served in a variety of senior executive leadership roles with The Seagram Spirits & Wine Group in New York and was also Audit Client Services Partner with the New York office of PricewaterhouseCoopers. In November 2016, Donard was appointed Chairman of Hazelwood Demesne Limited ‘The Lough Gill Distillery’ Company.
Committee MembershipRemuneration Committee (Chair)Audit Committee/Nomination and Governance Committee (Member)
Skills, competence and experienceDan O’Connor is currently Chairman of Activate Capital Limited and International Personal Finance plc. He is a former Non-Executive Director of CRH plc. Dan is a former President and CEO of GE Consumer Finance Europe and a former Senior Vice-President of GE. He was Executive Chairman of Allied Irish Banks plc from November 2009 until October 2010. A fellow of Chartered Accountants Ireland, Dan graduated from University College Dublin with a Bachelor of Commerce and Diploma in Professional Accounting.
Committee MembershipAudit Committee (Chair)Nomination and Governance Committee/Remuneration Committee (Member)

Glanbia plc | Annual Report and Financial Statements 2018
59
Patsy Ahern Non-Executive Director nominated by the SocietyAge: 61
Jer Doheny Non-Executive Director nominated by the SocietyAge: 63
Vincent GormanNon-Executive Director nominated by the SocietyAge: 62
Brendan HayesNon-Executive Director nominated by the SocietyAge: 58
Eamon PowerNon-Executive Director nominated by the SocietyAge: 64
Term of officeDate of Appointment: 21 June 2018Tenure: Three full years (over each of his terms)
Term of officeDate of Appointment: 1 June 2018Tenure: Five full years (over each of his terms)
Term of officeDate of Appointment: 27 June 2013Tenure: Five full years
Term of officeDate of Appointment: 2 June 2017Tenure: Six full years (over each of his terms)
Term of officeDate of Appointment: 2 June 2017Tenure: 15 full years (over each of his terms)
Skills, competence and experiencePatsy Ahern farms at Sheanmore, Ballyduff Upper, Co. Waterford and previously served two full years on the Board. Patsy has completed the University College Cork Diploma in Corporate Direction.
Skills, competence and experienceJer Doheny farms at Upper Tullaroan, Co. Kilkenny and previously served five full years on the Board. Jer has completed the University College Cork Diploma in Corporate Direction.
Skills, competence and experienceVincent Gorman farms at Ballindrum, Athy, Co. Kildare. Vincent is also a Director of Progressive Genetics Co-operative Society Limited.
Skills, competence and experienceBrendan Hayes farms at Ballyquinn, Carrick on Suir, Co. Waterford and previously served four full years on the Board. Brendan has completed the University College Cork Diploma in Corporate Direction.
Skills, competence and experienceEamon Power farms at Fethard on Sea, New Ross, Co. Wexford and previously served 13 full years on the Board. Eamon has completed the University College Cork Diploma in Corporate Direction.
Board of Directors and Senior ManagementNon-Executive Directors nominated by Glanbia Co-operative Society Limited (the ‘Society’)
All of the Directors nominated by the Society are full time farmers who have significant experience of the dairy and agricultural industry.

Glanbia plc | Annual Report and Financial Statements 2018
60
> Director’s Report
Corporate Governance Report continued Board of Directors and Senior ManagementGroup Operating Executive, Executive Directors
Siobhán TalbotGroup Managing Director and Executive DirectorAge: 55
Mark Garvey Group Finance Director and Executive DirectorAge: 54
Hugh McGuire CEO Glanbia Performance Nutrition and Executive DirectorAge: 48
Brian Phelan CEO Glanbia Nutritionals and Executive DirectorAge: 52
Term of officeDate of Appointment: 1 July 2009Tenure: Nine full years
Term of officeDate of Appointment: 12 November 2013Tenure: Five full years
Term of officeDate of Appointment: 1 June 2013Tenure: Five full years
Term of officeDate of Appointment: 1 January 2013Tenure: Six full years
Skills, competence and experienceSiobhán Talbot was appointed as Group Managing Director on 12 November 2013, having been appointed Group Managing Director Designate on 1 June 2013. She was previously Group Finance Director and her role encompassed responsibility for Group strategic planning. She has been a member of the Group Operating Executive since 2000 and the Board since 2009 and has held a number of senior positions since she joined the Group in 1992. She is also a Director of the Irish Business Employers’ Confederation (IBEC) and was appointed as a Non-Executive Director of CRH plc effective 1 December 2018. Prior to joining Glanbia, she worked with PricewaterhouseCoopers in Dublin and Sydney. A fellow of Chartered Accountants Ireland, Siobhán graduated from University College Dublin with a Bachelor of Commerce and Diploma in Professional Accounting.
Skills, competence and experienceMark Garvey was appointed as Group Finance Director on 12 November 2013. Prior to joining Glanbia he held the position of Executive Vice President and Chief Financial Officer until 2012 with Sara Lee Corporation, a leading global food and beverage company. Mark also held a number of senior finance roles in the Sara Lee Corporation in the US and Europe and prior to that he worked with Arthur Andersen in Ireland and the US. A fellow of Chartered Accountants Ireland and the American Institute of Certified Public Accountants, Mark graduated from University College Dublin with a Bachelor of Commerce and Diploma in Professional Accounting and has an Executive MBA from Northwestern University, Illinois.
Skills, competence and experienceHugh McGuire was appointed to the Board on 1 June 2013 as an Executive Director with responsibility for Glanbia Performance Nutrition. Hugh joined the Group in 2003 and has been CEO of Glanbia Performance Nutrition since 2008. Prior to that he held a number of senior management roles in the Group. He previously worked for McKinsey & Company as a consultant across a range of industry sectors. Prior to this he worked in the consumer products industry with Nestlé and Leaf. Hugh graduated from University College Dublin with an M.Sc. in Food Science. He has a Diploma in Finance from the Association of Chartered Certified Accountants Ireland.
Skills, competence and experienceBrian Phelan was appointed as CEO of Glanbia Nutritionals on 1 June 2013. He was appointed to the Board on 1 January 2013 as Group Development and Global Cheese Director. Brian was previously Group Human Resources & Operations Development Director. He is the Chairman of Glanbia Cheese Limited. Since joining the Group in 1993, he has held a number of senior management positions. Prior to this he worked with KPMG. He graduated from University College Cork with a Bachelor of Commerce and is a fellow of Chartered Accountants Ireland.

Glanbia plc | Annual Report and Financial Statements 2018
61
Senior ManagementGroup Operating Executive
Jim BerginCEO Glanbia Ireland Age: 56
Michael HoranGroup SecretaryAge: 54
Michael Patten Group Human Resources & Corporate Affairs DirectorAge: 56
Tom Tench Group Corporate Development DirectorAge: 48
Term of officeDate of Appointment: 2 July 2017Tenure: One full year
Term of officeDate of Appointment: 9 June 2005Tenure: 13 full years
Term of officeDate of Appointment: 11 December 2014Tenure: Four full years
Term of officeDate of Appointment: 1 March 2015Tenure: Three full years
Skills, competence and experienceJim Bergin was appointed as Director and CEO of Glanbia Ireland, a Joint Venture of the Group in 2017 having previously been Director and CEO of Glanbia Ingredients Ireland since 2012. He worked for the Group between 1984 and 2012 and held a number of senior positions during that time. Jim is also a Director of Ornua Co-operative Limited. Jim graduated from University College Cork with a Bachelor of Commerce and has a M.Sc. in Management Practice from Smurfit Business School.
Skills, competence and experienceMichael Horan was appointed as Group Secretary on 9 June 2005, having previously held the position of Group Financial Controller since June 2002. He joined the Group in 1998 as Financial Controller of the Fresh Pork business in Ireland. Michael previously worked with Almarai Company Limited in Saudi Arabia and BDO Simpson Xavier. A fellow of Chartered Accountants Ireland, Michael graduated from the National University of Ireland, Galway with a Bachelor of Commerce.
Skills, competence and experienceMichael Patten is Group Human Resources & Corporate Affairs Director and has responsibility for Group Human Resources, strategic leadership of the Group’s global reputation, public affairs and sustainability agenda. Prior to joining the Group, Michael was Global Public Affairs Director with Diageo plc. He previously served with the Group as Director of Communications. Michael holds a BA in Communication Studies from Dublin City University and is an Honorary Life Fellow of the Public Relations Institute of Ireland.
Skills, competence and experienceTom Tench is the Group Corporate Development Director. Tom joined the Group in 2004 with responsibility for strategy and development for Glanbia’s US Cheese and Global Nutritionals businesses. Prior to joining the Group, Tom worked in the investment banking and investment management industry. Tom also served for 10 years as an officer in the US military.

Glanbia plc | Annual Report and Financial Statements 2018
62
> Director’s Report
Corporate Governance Report continuedBoard Leadership and Company Purpose
Board activities and stakeholder engagement during 2018
Below: Board Directors visiting US operations.
The Board is responsible for the stewardship of the Group, risk management and overseeing its strategy to create sustainable value growth.
With almost 50,000 registered shareholders, 6,900 employees, and thousands of customers, suppliers and consumers engaging with these individuals, businesses and communities requires detailed consideration in Board discussions and decision making.
We believe that trust in our business and our reputation is driven by how we engage with these stakeholders. A strong relationship with all of our stakeholders ensures the sustainable success of our business.
The following pages provide a flavour of some of the boardroom discussions and debates around our activities and stakeholder engagement over the course of 2018.
Strategy and corporate development
Operational and financial performance
Governance
• Received regular reports from the Group Managing Director on all aspects of performance;
• Received regular updates from the Group Finance Director and other Executive Directors on business performance, business priorities, and operations of the Group;
• Approved the Group’s Annual Report, half-yearly report and interim management statements;
• Recommended the 2017 final dividend and approved the 2018 interim dividend; and
• Approved the Group budget for the 2019 financial year.
• Appointment of Martin Keane as Group Chairman;
• Approved the reorganisation of the Board and appointment of two new Independent Non-Executive Directors;
• Reduced the Society representation on the Board to eight in accordance with the Relationship Agreement;
• Designation of Donard Gaynor to oversee workforce engagement;
• Undertook an internal Board evaluation;• Reviewed updates on corporate
regulatory matters;• Considered the revisions to the UK
Corporate Governance Code (2018);• Confirmed Directors’ independence;• Received reports from the Committee
Chairmen;• Enhanced Group Risk Reporting;• Considered and approved the
appointment of Siobhán Talbot as Non-Executive Director of CRH plc; and
• Approved the amended statement of policy for appointment of Independent Non-Executive Directors.
Risk
• Conducted an annual review of the material financial and non-financial risks facing the Group;
• Considered the Group’s emerging and principal risks and uncertainties and how they are managed within our risk appetite when assessing the Group’s longer term viability;
• Received reports from the Group Audit Committee Chairman on the Committees engagement with core Risk Functional Owners; and
• Conducted a review of the Group’s material compliance arrangements and structures for the purpose of the Compliance Statement.
• Received regular updates on Group corporate development opportunities from the Group Corporate Development Director. This included regular reviews of the merger and acquisition strategy/pipeline;
• Received updates on IT strategy and infrastructure, data protection and information security;
• Received regular updates from the Group Managing Director and Executive Directors on the implementation status of strategic priorities;
• Finalised a Joint Venture agreement with Dairy Farmers of America and Select Milk Producers in the US to invest US$470m to build, supply and operate a cheese and whey production facility in Michigan;
• Approved the €130 million investment in a new mozzarella cheese plant in Portlaoise by the Glanbia Cheese EU Joint Venture, a partnership with Leprino Foods Company;
• Approved the US$350 million (exclusive of additional working capital and cash) acquisition of SlimFast;
• Conducted a detailed strategic review of the market trends and organisational capabilities and ambitions across all aspects of the Group’s portfolio. This review included on-site visits at key business locations;
• Approved the strategic growth ambitions outlined at the Group’s Capital Markets Day in May 2018 for the five years to 2022; and
• Approved the three-year strategic plan for 2019 to 2021.
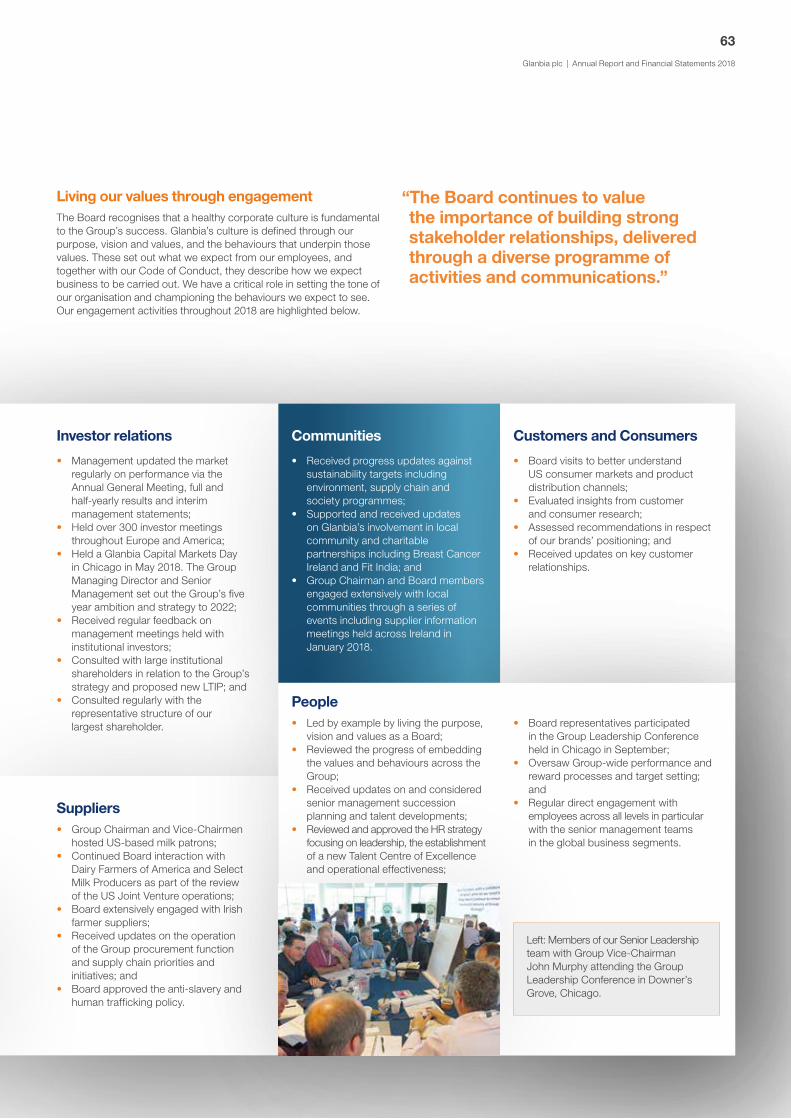
Glanbia plc | Annual Report and Financial Statements 2018
63
Investor relations Customers and Consumers
• Management updated the market regularly on performance via the Annual General Meeting, full and half-yearly results and interim management statements;
• Held over 300 investor meetings throughout Europe and America;
• Held a Glanbia Capital Markets Day in Chicago in May 2018. The Group Managing Director and Senior Management set out the Group’s five year ambition and strategy to 2022;
• Received regular feedback on management meetings held with institutional investors;
• Consulted with large institutional shareholders in relation to the Group’s strategy and proposed new LTIP; and
• Consulted regularly with the representative structure of our largest shareholder.
Suppliers• Group Chairman and Vice-Chairmen
hosted US-based milk patrons; • Continued Board interaction with
Dairy Farmers of America and Select Milk Producers as part of the review of the US Joint Venture operations;
• Board extensively engaged with Irish farmer suppliers;
• Received updates on the operation of the Group procurement function and supply chain priorities and initiatives; and
• Board approved the anti-slavery and human trafficking policy.
Communities
• Received progress updates against sustainability targets including environment, supply chain and society programmes;
• Supported and received updates on Glanbia’s involvement in local community and charitable partnerships including Breast Cancer Ireland and Fit India; and
• Group Chairman and Board members engaged extensively with local communities through a series of events including supplier information meetings held across Ireland in January 2018.
People• Led by example by living the purpose,
vision and values as a Board;• Reviewed the progress of embedding
the values and behaviours across the Group;
• Received updates on and considered senior management succession planning and talent developments;
• Reviewed and approved the HR strategy focusing on leadership, the establishment of a new Talent Centre of Excellence and operational effectiveness;
• Board representatives participated in the Group Leadership Conference held in Chicago in September;
• Oversaw Group-wide performance and reward processes and target setting; and
• Regular direct engagement with employees across all levels in particular with the senior management teams in the global business segments.
Left: Members of our Senior Leadership team with Group Vice-Chairman John Murphy attending the Group Leadership Conference in Downer’s Grove, Chicago.
Living our values through engagement The Board recognises that a healthy corporate culture is fundamental to the Group’s success. Glanbia’s culture is defined through our purpose, vision and values, and the behaviours that underpin those values. These set out what we expect from our employees, and together with our Code of Conduct, they describe how we expect business to be carried out. We have a critical role in setting the tone of our organisation and championing the behaviours we expect to see. Our engagement activities throughout 2018 are highlighted below.
“The Board continues to value the importance of building strong stakeholder relationships, delivered through a diverse programme of activities and communications.”
• Board visits to better understand US consumer markets and product distribution channels;
• Evaluated insights from customer and consumer research;
• Assessed recommendations in respect of our brands’ positioning; and
• Received updates on key customer relationships.

Glanbia plc | Annual Report and Financial Statements 2018
64
> Director’s Report
Audit CommitteeKey activities: Review of Annual Report and Financial Statements and statutory
Auditor’s independence and fees, internal controls, risk management systems,
post-acquisition reviews and the effectiveness of the Group Internal Audit
and Group Finance functions.
Nomination and Governance CommitteeKey activities: Making recommendations on appointments to the Board (including
the Group Chairman and Vice-Chairmen), Senior Management succession planning,
review of the independence and time commitment of Non-Executive Directors
and keeping under review corporate governance developments to ensure
Group governance practices are in line with best practice.
Remuneration CommitteeKey activities: Review of Executive
Directors’ salaries and benefits, approval of Annual Incentive targets, Long-Term
Incentive share awards, review of Non-Executive Directors’ fees and
compliance with the relevant codes.
Board Committees
Board
Group Management
Group Operating ExecutiveThis group is comprised of the four Executive Directors, the Group
Secretary, the Group Human Resources & Corporate Affairs Director, the Group Corporate Development Director and the CEO of Glanbia Ireland. Key activities: Monitoring performance and making
strategic recommendations to the Board. This forum is also the Group Risk Committee and the Group Investment Committee.
Group Senior Leadership TeamThis team includes the Group Operating Executive and the Group’s
senior business and functional leaders. Key activities: To create alignment and drive delivery of the Group’s business plans.
The Strategy Review Committee formed in 2017 continues to harness the experience of individual Directors to facilitate deeper dives and focus on selected items of a strategic nature where appropriate.
The Disclosure Committee remains in place to oversee the timely and accurate disclosure of all information required to be so disclosed by the Group to meet the legal and regulatory obligations
required by its Stock Exchange listings. It also continues to assist in the design, implementation and periodic evaluation of disclosure controls and procedures.
Corporate Governance ReportDivision of ResponsibilitiesCorporate Governance Report continued
The following are the key matters reserved for the Board:
• Approval of the Group’s strategic plan, oversight of the Group’s operations and review of performance in light of the Group’s strategy, objectives, business plans and budgets, ensuring that any necessary corrective action is taken;
• Ultimate oversight of risk, including determining the Group’s risk profile and risk appetite;
• Approval of acquisitions, disposals and other transactions outside delegated limits;
• Financial reporting and controls, including approval of the half-year results, interim management statements and full-year results, approval of the Annual Report and Financial Statements, approval of any significant changes in accounting policies or practices, and ensuring maintenance of appropriate internal control and risk management systems;
• Ensuring the Annual Report and Financial Statements present a fair, balanced and understandable assessment of the Group’s position and prospects;
• Assessment of the Group’s viability and ability to continue as a going concern;
• Capital expenditure, including the annual approval of the capital expenditure budgets and any material changes to them in line with the Group-wide policy on capital expenditure;
• Dividend policy, including the annual review of the dividend policy and declaration of the interim dividend and recommendation of the final dividend;
• Shareholder documentation, including approval of resolutions and corresponding documentation to be put to the shareholders and approval of all press releases concerning matters decided by the Board; and
• Key business policies.
Managing Director

Glanbia plc | Annual Report and Financial Statements 2018
65
The Board has a clear governance framework with defined responsibilities and accountabilities which ensures that policies and procedures set at Board level are effectively communicated across the whole Group. The Board has established certain principal Committees to assist it in fulfilling its oversight responsibilities, providing detailed focus on particular areas as set out in the respective Committee reports that follow.
Information for the BoardThe Group Chairman, with the assistance of the Group Managing Director and the Group Secretary, is responsible for ensuring that Directors are supplied with information in a timely manner and of an appropriate quality that enables them to discharge their duties. In the normal course of business, such information is provided by the Group Managing Director in a regular report to the Board that includes information on operational matters, strategic developments, financial performance relative to the business plan, business development, corporate responsibility and investor relations.
At each scheduled Board meeting, the Executive Directors provide operational and financial updates. Depending on the nature of the proposal to be considered, other Senior Executives are invited to make presentations or participate in Board discussions to ensure that Board decisions are supported by a full analysis of each proposal.
All Directors have access to the advice and services of the Group Secretary, who is responsible for advising the Board on all governance matters. The Directors also have access to independent professional advice, if required, at the expense of the Group. This is coordinated through the Group Secretary.
Board responsibilitiesTo ensure that the Board operates efficiently and effectively, the Directors and Group Secretary have certain responsibilities in line with their roles which are set out in more detail in the table below.
Board attendanceThe Board had 11 meetings in 2018 with Board member meeting attendance as follows:
2018 Board meeting attendance
Director Appointed
Number of full years on
the Board2018 Meeting
attendance
Mn Keane 24 May 2006 12 11/11H Corbally (Note 1) 9 June 1999 19 4/4J Murphy 29 June 2010 8 11/11P Murphy 26 May 2011 7 11/11S Talbot 1 July 2009 9 11/11P Ahern (Note 2) 21 June 2018 3 9/9P Coveney 30 May 2014 4 10/11J Doheny (Note 3) 1 June 2018 5 9/9M Garvey 12 November 2013 5 11/11D Gaynor 12 March 2013 5 11/11V Gorman 27 June 2013 5 9/11T Grant (Note 4) 2 June 2017 1 2/2P Haran 9 June 2005 13 11/11B Hayes (Note 5) 2 June 2017 6 11/11Ml Keane (Note 6) 29 June 2010 9 1/2H McGuire 1 June 2013 5 10/11D O’Connor 1 December 2014 4 11/11B Phelan 1 January 2013 6 11/11E Power (Note 7) 2 June 2017 15 11/11
1. H Corbally retired from the Board on 21 June 2018.2. P Ahern retired from the Board on 1 June 2018 and was re-appointed to the Board on
21 June 2018 having previously served two full years on the Board.3. J Doheny was re-appointed to the Board on 1 June 2018 having previously served five
full years on the Board.4. T Grant retired from the Board on 1 June 2018.5. B Hayes was re-appointed to the Board on 2 June 2017 having previously served four
full years on the Board.6. Ml Keane retired from the Board on 25 April 2018 having served a total of nine full years
on the Board over each of his terms.7. E Power was re-appointed to the Board on 2 June 2017 having previously served 13 full
years on the Board.
All changes during 2018 relate to nominees of the Society.
Read more on pages 57 to 61
We have a clear division of responsibilities between our Chairman and Group Managing Director, each role is clearly defined and is distinct from one another.
Martin Keane, Group Chairman• Leads the Board, sets the agenda and promotes a culture of
open debate between Executive and Non-Executive Directors and sets the highest standards of corporate governance;
• Regularly meets with the Group Managing Director and other senior management to stay informed; and
• Ensures effective communication with our stakeholders.
Siobhán Talbot, Group Managing Director• Develops and implements strategy and chairs the Group
Operating Executive;• Leads the Group through the Executive Directors and senior
management team; and• Promotes the purpose, vision and values of the organisation
internally and externally.
Paul Haran, Senior Independent Director• Provides a sounding board to the Group Chairman and
appraises his performance;• Acts as intermediary for other Directors, if needed; and• Is available to respond to shareholder concerns when contact
through the normal channels is inappropriate.
Executive Directors• With the Group Managing Director develop and execute the Group’s
strategy in line with the policies and objectives agreed by the Board;• Monitor compliance by the Group with legal, regulatory, corporate
governance, social, ethical and environmental principles; and• Manage operational effectiveness and profitability of the Group.
Non-Executive Directors• Provide independent insight based on relevant experience;• Contribute to developing strategy; and• Scrutinise and constructively challenge business performance
and strategic execution.
Michael Horan, Group Secretary• Supports the Group Chairman by organising induction and
training programmes for Directors;• Ensures that the correct Board procedures are followed. In
conjunction with the Group Chairman ensures that the Directors receive timely and clear information so that the Directors are equipped for robust debate and informed decision making;
• Advises the Board on policy, procedure, governance and ethics; and• Coordinates where necessary access to independent
professional advice for Directors.

Glanbia plc | Annual Report and Financial Statements 2018
66
> Director’s Report
Corporate Governance Report continuedComposition, Succession and Evaluation
Board structureThe Board currently comprises 16 Directors: Four Executive Directors and 12 Non-Executive Directors of whom eight are nominated by Glanbia Co-operative Society Limited (the ‘Society’). This will be reorganised during 2019 as set out on page 55.
Avonmore Foods plc and Waterford Foods plc merged in 1997 to form Glanbia plc. At the same time, their respective major shareholders also merged to form the Society. The Society retains a major shareholding in the Company and nominates from its board of directors up to eight (previously 14) Non-Executive Directors for appointment to the Board of the Company. This will reduce to seven Non-Executive Directors in 2020 and six Non-Executive Directors in 2022, more details of which are set out on page 77 of the Nomination and Governance Committee Report. Our Directors come from a diversity of backgrounds, ranging from public service, accountancy and banking to industry (dairy, fast moving consumer goods and production).
Appointments to the Board, policy, diversity and succession planningDuring 2018, the Board approved a Board Diversity Policy which recognised the benefits of diversity. Having regard to the right of the Society to nominate eight of the 16 Directors, the Nomination and Governance Committee keeps the Board’s balance of skills, knowledge, experience and the tenure of Directors under constant review. In this regard, the Company has not set any specific quota. In respect of succession planning and maintaining the skill set of the Board, there is an established procedure for the appointment of new Directors and Senior Executives. The Nomination and Governance Committee identifies the set of skills and experience required. Individuals are then selected on the basis of required competencies, irrespective of gender, age, nationality or other personal characteristics. External search agencies are engaged to assist where appropriate. The Company also has a formal policy with respect to the appointment of new Independent Non-Executive Directors (other than those nominated by the Society). The policy provides that any new Independent Non-Executive Directors will be appointed for an initial three-year term, subject to re-appointment by shareholders at each AGM and should expect to serve no more than three successive three-year terms i.e. a maximum of nine years. All new Independent Non-Executive Directors, and any re-appointments, will be subject to a rigorous review by the Committee after each three-year term and annually after six years.
Induction and Board developmentThe Company puts full, formal and tailored induction programmes in place for all its new Directors. While Directors’ backgrounds and experience are taken into account, the induction programme is aimed to be a broad introduction to the Group’s businesses and its areas of significant risk. Key elements include meeting the Executive Directors and Senior Management as well as visiting the Group’s major sites in order to be briefed on Group strategy and on individual businesses.
The Group Chairman regularly encourages the Non-Executive Directors to update their skills, expertise and knowledge of the Group in order to carry out their responsibilities competently. This is achieved by regular presentations at Board meetings from Senior Management on matters of significance. Examples during the year included regular presentations from Senior Management of our two wholly-owned business segments: Glanbia Performance Nutrition, Glanbia Nutritionals and from our strategic Joint Ventures. The Board also received presentations from the Group Corporate Development Director and the Group Human Resources & Corporate Affairs Director.
In addition to the induction programme that all Directors undertake on joining the Board, an ongoing programme of Director development has been established. For example, as part of the annual programme of Board meetings, Directors will visit some of the Group’s principal operations to meet employees and gain an understanding of the business operations and strategy. These visits provide Directors with an opportunity to interact with employees to develop deeper insights into the quality of our current Senior Management and the potential for succession in the next generation. It also helps the Directors to actively embed the values of Glanbia across key locations. During 2018, the October Board meeting was held in Glanbia Performance Nutrition, Downers Grove, Illinois. This was a two day event during which the Senior Management of both GPN and GN made presentations to the Board. Some Board members also took the opportunity to visit various US stores, which stock and sell our products through various channels.
The Directors are also regularly provided with updates on corporate governance, legislative and regulatory issues. During 2018 updates included a presentation from the Group Secretary on the revised provisions of the UK Corporate Governance Code (2018) and an investor relations update presentation from the Group Finance Director.
As part of their annual performance evaluation, Directors are given the opportunity to discuss their own training and development needs.
Board evaluation The annual Board evaluation process is an important element in ensuring the effective and efficient operation of the Board. The Group has established a formal process for the annual evaluation of the performance of the Board and its principal Committees. This includes a triennial external evaluation. In accordance with our triennial cycle of Board performance evaluations an external consultant will be engaged to facilitate the external evaluation of the effectiveness of the Board during the course of 2019. The external evaluation supplements our existing internal Board performance evaluation processes.
In 2018 the Board undertook an internal evaluation. The 2018 internal evaluation process focused on the overall effectiveness of the Board and its Committees. New evaluation questionnaires were developed for the 2018 internal evaluation and incorporated elements of the Institute of Chartered Secretaries and Administrators guidance on Board Effectiveness and the revised UK Corporate Governance Code published during 2018.
The new questionnaire followed the structure of the revised code. The questions were designed to evaluate the Board’s effectiveness against each of the revised code’s principles, based on rankings of excellent, good, adequate and poor. The questionnaire encouraged Directors to support their rankings with comments or suggestions. The questionnaire also included an overall performance and priorities for change section to allow Directors raise any issues not addressed in the questionnaire.
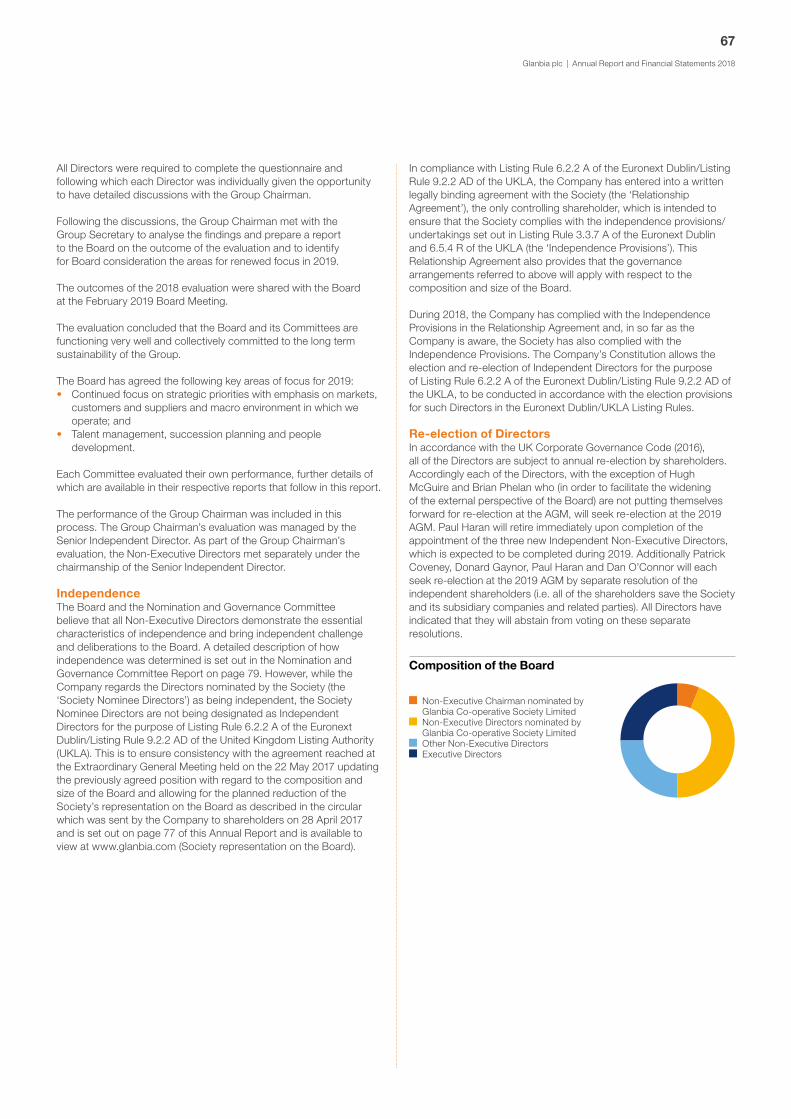
Glanbia plc | Annual Report and Financial Statements 2018
67
All Directors were required to complete the questionnaire and following which each Director was individually given the opportunity to have detailed discussions with the Group Chairman.
Following the discussions, the Group Chairman met with the Group Secretary to analyse the findings and prepare a report to the Board on the outcome of the evaluation and to identify for Board consideration the areas for renewed focus in 2019.
The outcomes of the 2018 evaluation were shared with the Board at the February 2019 Board Meeting.
The evaluation concluded that the Board and its Committees are functioning very well and collectively committed to the long term sustainability of the Group. The Board has agreed the following key areas of focus for 2019:• Continued focus on strategic priorities with emphasis on markets,
customers and suppliers and macro environment in which we operate; and
• Talent management, succession planning and people development.
Each Committee evaluated their own performance, further details of which are available in their respective reports that follow in this report.
The performance of the Group Chairman was included in this process. The Group Chairman’s evaluation was managed by the Senior Independent Director. As part of the Group Chairman’s evaluation, the Non-Executive Directors met separately under the chairmanship of the Senior Independent Director.
IndependenceThe Board and the Nomination and Governance Committee believe that all Non-Executive Directors demonstrate the essential characteristics of independence and bring independent challenge and deliberations to the Board. A detailed description of how independence was determined is set out in the Nomination and Governance Committee Report on page 79. However, while the Company regards the Directors nominated by the Society (the ‘Society Nominee Directors’) as being independent, the Society Nominee Directors are not being designated as Independent Directors for the purpose of Listing Rule 6.2.2 A of the Euronext Dublin/Listing Rule 9.2.2 AD of the United Kingdom Listing Authority (UKLA). This is to ensure consistency with the agreement reached at the Extraordinary General Meeting held on the 22 May 2017 updating the previously agreed position with regard to the composition and size of the Board and allowing for the planned reduction of the Society’s representation on the Board as described in the circular which was sent by the Company to shareholders on 28 April 2017 and is set out on page 77 of this Annual Report and is available to view at www.glanbia.com (Society representation on the Board).
In compliance with Listing Rule 6.2.2 A of the Euronext Dublin/Listing Rule 9.2.2 AD of the UKLA, the Company has entered into a written legally binding agreement with the Society (the ‘Relationship Agreement’), the only controlling shareholder, which is intended to ensure that the Society complies with the independence provisions/undertakings set out in Listing Rule 3.3.7 A of the Euronext Dublin and 6.5.4 R of the UKLA (the ‘Independence Provisions’). This Relationship Agreement also provides that the governance arrangements referred to above will apply with respect to the composition and size of the Board.
During 2018, the Company has complied with the Independence Provisions in the Relationship Agreement and, in so far as the Company is aware, the Society has also complied with the Independence Provisions. The Company’s Constitution allows the election and re-election of Independent Directors for the purpose of Listing Rule 6.2.2 A of the Euronext Dublin/Listing Rule 9.2.2 AD of the UKLA, to be conducted in accordance with the election provisions for such Directors in the Euronext Dublin/UKLA Listing Rules.
Re-election of Directors In accordance with the UK Corporate Governance Code (2016), all of the Directors are subject to annual re-election by shareholders. Accordingly each of the Directors, with the exception of Hugh McGuire and Brian Phelan who (in order to facilitate the widening of the external perspective of the Board) are not putting themselves forward for re-election at the AGM, will seek re-election at the 2019 AGM. Paul Haran will retire immediately upon completion of the appointment of the three new Independent Non-Executive Directors, which is expected to be completed during 2019. Additionally Patrick Coveney, Donard Gaynor, Paul Haran and Dan O’Connor will each seek re-election at the 2019 AGM by separate resolution of the independent shareholders (i.e. all of the shareholders save the Society and its subsidiary companies and related parties). All Directors have indicated that they will abstain from voting on these separate resolutions.
Composition of the Board
Non-Executive Chairman nominated by Glanbia Co-operative Society Limited
Non-Executive Directors nominated by Glanbia Co-operative Society Limited
Other Non-Executive Directors Executive Directors

Glanbia plc | Annual Report and Financial Statements 2018
68
> Director’s Report
Corporate Governance Report continuedAudit, Risk, Internal Control and Remuneration
Audit, Risk and Internal Control
Risk management and internal controlEffective risk management underpins our operating, financial and governance activities. The Board continues to place particular emphasis on monitoring both principal and emerging risks and regularly monitors the risk management framework to ensure risks are being appropriately mitigated and new risks identified.
While the Board has ultimate responsibility for determining the Group’s risk profile and risk appetite, the Board has delegated responsibility for reviewing the design and implementation of the Group’s management and internal control systems to the Audit Committee. These systems are designed to manage, rather than eliminate, the risk of failure to achieve business objectives and provide reasonable, but not absolute, assurance against material misstatement or loss. During the year, the Board considered the Group key risk reports and received updates from the Audit Committee Chairman on the programme of risk presentations from key risk managers across the Group. This work provided a comprehensive insight into how key risk exposures are managed and better informs the Board in its evaluation of progress against strategic objectives of the business.
The Board and management are satisfied that appropriate risk management and internal control systems are in place throughout the Group. The Risk Management section is contained on pages 46 to 53.
Going concernGlanbia’s business activities, together with the main factors likely to affect its future development and performance, are described in the Strategic Report on pages 1 to 53.
After making enquiries, the Directors have a reasonable expectation that the Group has adequate resources to continue in operational existence for a period of at least 12 months from the date of approval of the Annual Report and Financial Statements. The Group therefore continues to adopt the going concern basis in preparing its Annual Report and Financial Statements. The full Going Concern Statement is contained on page 49.
Long-term viability statementIn accordance with the UK Corporate Governance Code (2016), the Directors have assessed the viability of the Group and its ability to meet its liabilities as they fall due over a period extending to 2022, taking into account the Group’s current financial position, the Group’s strategy and business model and the potential impact arising from the principal risks and uncertainties detailed on pages 46 to 53.
Having considered these elements, the Directors have a reasonable expectation that the Group will be able to continue in operation and meet its liabilities as they fall due over the three-year period of the assessment. The full viability statement is contained on page 49.
Fair, balanced and understandableThe Directors have concluded that the Annual Report and Financial Statements present a fair, balanced and understandable assessment of the Group’s position and prospects. This assessment was completed by the Audit Committee as outlined in its report on page 72.
Adequate accounting recordsThe Directors are responsible for keeping adequate accounting records that are sufficient to correctly record and explain the transactions of the Company or enable, at any time, the assets, liabilities, financial position and profit or loss of the Company to be determined with reasonable accuracy, enable the Directors to ensure that the Financial Statements comply with the Companies Act 2014, and, as regards the Group Financial Statements, Article 4 of the IAS Regulation, and enable those Financial Statements to be audited.The Directors, through the use of appropriate procedures and systems, have also ensured that measures are in place to secure compliance with the Company’s and the Group’s obligation to keep adequate accounting records. These accounting records are kept at the registered office of the Company.
Accountability and auditDirectors’ responsibilities for preparing the Financial Statements for the Company and the Group are detailed on page 107.
The Independent Auditor’s report details the respective responsibilities of Directors and statutory Auditor.
Statutory AuditorThe statutory Auditor, Deloitte Ireland LLP, have expressed their willingness to continue in office in accordance with section 383(2) of the Companies Act 2014. Deloitte (who were succeeded by Deloitte Ireland LLP) were originally appointed on 27 April 2016.
Disclosure of information to statutory AuditorIn accordance with the provisions of section 330 of the Companies Act 2014, each of the persons who are Directors of the Company at the date of approval of this report confirms that: • So far as the Director is aware, there is not any relevant audit
information (as defined in the Companies Act 2014) of which the statutory Auditor is unaware; and
• The Director has taken all the steps that he/she ought to have taken as a Director to make himself/herself aware of any relevant audit information (as defined) and to ensure that the statutory Auditor is aware of such information.
RemunerationThe Remuneration Committee agenda continued to apply focus to the key matters of Company and individual Executive Director performance and the consideration of appropriate targets for 2018 and beyond. Our aim is to ensure that our remuneration policies and practices remain competitive within our industry to attract, retain and motivate high quality and committed people who are critical to the future development and growth of the Group. Further details can be obtained on pages 80 to 101.

Glanbia plc | Annual Report and Financial Statements 2018
69
Compliance StatementsDirectors’ Compliance Statement It is the policy of the Company to comply with its relevant obligations (as defined in the Companies Act 2014). The Directors have drawn up a compliance policy statement as defined in section 225(3)(a) of the Companies Act 2014. Arrangements and structures have been put in place that are, in the Directors’ opinion, designed to secure a material compliance with the Company’s relevant obligations. These arrangements and structures were reviewed by the Company during the financial year. As required by section 225(2) of the Companies Act 2014, the Directors acknowledge that they are responsible for the Company’s compliance with the relevant obligations. In discharging their responsibilities under section 225, the Directors relied on the advice of third parties whom the Directors believe have the requisite knowledge and experience to advise the Company on compliance with its relevant obligations.
Corporate Governance StatementDuring 2018 the Group was subject to the Irish Corporate Governance Annex (2010) and the UK Corporate Governance Code (2016) (the ‘Codes’). The Group has complied with the detailed provisions of the Codes throughout 2018 with the exception of A.3.1 (Independence of the Chairman on appointment) and B.1 (Composition of the Board) of the UK Corporate Governance Code (2016). The rationale for this departure is explained on pages 57 and 77. The Codes are not a rigid set of rules and they recognise that an alternative to following a provision may be justified in particular circumstances where good governance is still achieved.
The Irish Corporate Governance Annex published in December 2010 by the Irish Stock Exchange is publicly available on the Euronext Dublin website: www.ise.ie/Products-Services/Sponsors-and-Advisors/Irish-Corporate-Governance-Annex.pdf. The UK Corporate Governance Code is publicly available on www.frc.org.uk/getattachment/88bd8c45-50ea-4841-95b0-d2f4f48069a2/2018-UK-Corporate-Governance-Code-FINAL.PDF.
Our approach to corporate governance and how we apply the principles of the Codes is set out in this Corporate Governance Report, the Board of Directors and Senior Management section and the Risk Management section (all of which are deemed to be incorporated in this Corporate Governance Report). The Reports from the Chairmen of the Audit, Nomination and Governance and Remuneration Committees highlight the key areas of focus for, and the background to, the principal decisions taken by, those Committees, which form an integral part of our governance structure. A fair, balanced and understandable assessment of the Group’s position and prospects is set out in the Strategic Report on pages 1 to 53. Other Statutory Information contains certain other information required to be incorporated into this Corporate Governance Statement. All of these statements are deemed to be incorporated in this Corporate Governance Statement.
Section 1373 Companies Act 2014 Applicable codes Pages 57 and 69
Departures from the codes Pages 57 and 69
Risk management and Internal control Pages 46 to 53 and 68
Takeover regulations Pages 102 to 106
Shareholder information Pages 102 to 106
Board and Committees Pages 55 to 101
Non-Financial Reporting Statement Page 102
Irish Corporate Governance Annex Board Composition Pages 57 to 67
Board Appointments Pages 55,56 and 66
Board Evaluation Pages 56 and 66
Board Re-election Page 79
Audit Committee Pages 70 to 75
Remuneration Pages 80 to 101
UK Corporate Governance Code
Board Leadership and Company Purpose: Leadership Pages 62 to 63
Division of Responsibilities: Leadership Pages 64 to 65
Composition Succession and Evaluation: Effectiveness Pages 66 to 69 and 76 to 79
Audit Risk and Internal Controls: Accountability Pages 68 and 70 to 75
Remuneration Pages 80 to 101
Board Leadership and Company Purpose: Relations with shareholders Pages 62 to 63

Glanbia plc | Annual Report and Financial Statements 2018
70
> Director’s Report
Audit Committee Report
Sustaining shareholder value through effective governanceDan O’ConnorAudit Committee Chairman
Key responsibilities
Monitor the integrity of the Group’s Financial Statements.
Review the appropriateness of accounting policies and significant financial reporting issues or judgements.
Advise the Board in relation to its responsibilities in regard to monitoring the Group’s systems of risk management and internal controls.
Assist the Board in its responsibilities with regard to the assessment of the Going Concern and Viability Statements.
Provide input on whether the Annual Report and Financial Statements, taken as a whole, is fair, balanced and understandable.
Oversee the relationship with the statutory Auditor, including approving the terms of engagement and assessing the effectiveness of the process.
Ensure that the Group’s Auditor’s Relationship and Independence Policy is enforced including conducting an audit tender at least every 10 years.
Review the operation and effectiveness of the Internal Audit function.
Assess the Group’s procedures for fraud prevention and detection.
Review the Group’s arrangements for its employees to raise concerns, in confidence, about possible wrongdoing in financial reporting and other matters.
Terms of reference
The full terms of reference of the Audit Committee can be found on the Group’s website: www.glanbia.com or can be obtained from the Group Secretary.
Non-Executive Chairman Non-Executive Directors
Composition of the Committee
Financial and corporate governance updates
Statutory Auditor Risk management and internal
control systems Internal Audit Other
Allocation of time
“The Board and the Audit Committee are focused on embedding a culture that ensures we all work to a consistently high standard and conduct our business activities in line with the Glanbia values and evolving governance requirements.”
2018 Committee members and meeting attendance
Member AppointedNumber of full years
on the Committee2018 meeting
attendance
D O’Connor 1-Dec-14 4 6/6
P Haran 9-Jun-05 13 6/6
P Coveney 30-Sep-14 4 6/6
D Gaynor 24-Feb-15 3 6/6
See page 58 for more information on current Audit Committee members.

Glanbia plc | Annual Report and Financial Statements 2018
71
Dear shareholder,
As Chairman of Glanbia’s Audit Committee, I am pleased to present the report of the Committee for the year ended 29 December 2018.
This report sets out the Audit Committee’s principal activities during the year, as well as the Committee’s priorities for the year ahead.
The Committee is responsible for assisting the Board in reviewing the effectiveness of the Group’s risk management and internal control systems and for ensuring a robust assessment of the emerging and principal risks facing the company. During 2018 the Committee evaluated key areas of risk such as IT security, financial reporting and tax, food safety and quality and health and safety by receiving direct presentations from management, Group functional heads and external advisors. The work performed in this regard including ongoing monitoring and the review of effectiveness is detailed on page 73.
The Committee is also responsible for monitoring the integrity of the Group’s Financial Statements and for assisting the Board in determining that the Annual Report and Accounts, taken as a whole, is fair, balanced and understandable and provides the information necessary for shareholders to assess the Company’s position and performance, business model and strategy. This review included conducting a detailed review of both the financial and non-financial information contained in the Group’s Annual Report. The work performed in this regard is detailed on page 72. A summary of the 2018 significant financial judgements and disclosures and the steps taken by the Committee to address these matters is included on page 74.
In fulfilling its key oversight responsibilities the Committee engaged regularly with management, Group Internal Audit and the statutory Auditor to ensure the provision of timely and accurate information. Our engagement with the Group Internal Audit function and the external Auditor is detailed on pages 73 and 75.
The Audit Committee considered the requirements of the Irish Companies Act 2014 in relation to the Directors’ Compliance Statement and is satisfied that appropriate steps have been undertaken to ensure that Glanbia is fully compliant with these requirements.
Priorities for 2019
The Committee’s key priorities for 2019 include ensuring effective management of cyber-security risks, the development of the Group’s direct-to-consumer strategy, compliance with the EU General Data Protection Regulation (GDPR) and progress in addressing improvement opportunities identified during the External and Internal Audit reviews. The Committee will continue its programme of direct presentations from management to ensure that risk management processes are implemented to address these key risk areas in a manner consistent with the Group’s risk appetite statements and to enable the continuous improvement of the Group’s risk and financial management.
Given the increasing global economic uncertainties and market challenges, the effective oversight of our acquisition integration plans and post-acquisition review processes will be a core focus of the Committee and the Board in 2019. The impairment testing methodology, inputs, assumptions, sensitivity analysis and results outlined in note 17 will also be maintained under review in 2019.
On behalf of the Audit Committee
Dan O’ConnorAudit Committee Chairman

Glanbia plc | Annual Report and Financial Statements 2018
72
> Director’s Report
GovernanceThe Audit Committee was in place throughout 2018. The Committee comprises four Independent Non-Executive Directors, Dan O’Connor (Chairman), Paul Haran (Senior Independent Director), Patrick Coveney and Donard Gaynor, of whom three members constitute a quorum. The Group Secretary acts as secretary to the Committee. Membership is reviewed annually by the Chairman of the Committee and the Group Chairman who recommend new appointments to the Nomination and Governance Committee for consideration and onward recommendation to the Board.
The Board is satisfied that Dan O’Connor, Patrick Coveney and Donard Gaynor have recent and relevant financial experience, as set out in the UK Corporate Governance Code (2016). The Board is also satisfied that the Audit Committee, as a whole, has competence relevant to the sector in which the Group operates including a wide range of skills, expertise and experience arising from the senior positions they hold or held in other organisations. The Chairman of the Audit Committee reports to the Board as necessary on the activities of the Committee and attends the AGM to answer questions on the Audit Committee’s report and matters within the scope of the Committee’s responsibilities.
Meetings The Audit Committee met six times during the year ended 29 December 2018 and there was full attendance by all members of the Committee. The Group Managing Director, Group Finance Director, Group Secretary, Group Head of Internal Audit, Group Financial Controller and representatives of the statutory Auditor are typically invited to attend all meetings of the Committee, with additional members of the Group Senior Leadership Team invited to attend as deemed necessary, typically to present on Group key risk areas.
Audit Committee key activitiesFinancial reporting and significant financial judgementsAt our meetings during 2018 and to date in 2019, the Committee reviewed both the Group’s half-year results, Interim Management Statement (IMS) updates and the 2018 full-year Annual Report and Financial Statements by considering and challenging, where appropriate, the Group’s accounting policies and key judgement areas. The Committee paid particular attention to matters it deemed to be important by virtue of their impact on the Group’s results and particularly those items which involved a higher level of estimation or judgement. The table on page 74 sets out the 2018 significant financial statement reporting judgements and disclosures and how the Audit Committee addressed these matters. The Committee reviewed reports from the Group Finance team on accounting, financial reporting, treasury, and taxation issues in making these assessments which were discussed with the statutory Auditor, Deloitte Ireland LLP.
While a number of significant items within the Group’s results were highlighted as exceptional items in 2017, no such items were noted in 2018 and the Committee was satisfied that this was appropriate and consistent with the Group’s policy in this area. The Committee also reviewed the status of the various legal claims, disputes the Group is party to and risk exposures including management’s calculations and assumptions, and concluded that the provisions held are adequate and appropriate.
The Committee considered the Directors’ Responsibility Statement and the principal risks and uncertainties of the Group within the 2018 Annual Report and Financial Statements and the half-year results and were satisfied with the adequacy of the disclosures in the Financial Statements.
Regulators and our financial reportingDuring the year the Group received correspondence from The Irish Auditing and Accounting Supervisory Authority (IAASA) in respect of the Group’s Annual Report and Financial Statements for the year ended 30 December 2017 outlining a number of areas on which they required further information and clarity. The Company subsequently provided the necessary information and clarifications requested and IAASA acknowledged the co-operation received from the Directors and management in responding to the queries raised. The Committee was satisfied that no material findings arose from the review. We remain focused on enhancing the effectiveness of the Group’s financial reporting and support such external review processes and the guidance issued by regulatory bodies such as IAASA and the Financial Reporting Council (FRC) as key enablers in ensuring the consistent application of financial reporting standards and the transparency of Financial Statement disclosures.
Fair, balanced and understandableThe Code requires that the Board present a fair, balanced and understandable assessment of the Company’s position and prospects and specifically that it considers the Annual Report and Accounts taken as a whole, is fair, balanced and understandable and provides the information necessary for shareholders to assess the Company’s position and performance, business model and strategy. The Committee is responsible for assisting the Board in considering whether the 2018 Annual Report and Financial Statements met these requirements.
The Committee reviewed a report from the Group Head of Internal Audit on the key considerations supporting our fair, balanced and understandable statement including a detailed overview of the established and documented process for the planning, preparation and review of the 2018 Annual Report and Financial Statements. This document outlines the effectiveness of the key features of internal control in preparing the Financial Statements including the reporting timetable for the development of the Annual Report and Financial Statements, and the coordination and review activities involved. The Committee is satisfied that a dedicated project manager is in place to drive adherence to deadlines, reporting standards and consistency and that this is aligned with the formal external audit process undertaken by Deloitte Ireland LLP. This process, together with the regular updates the Committee receives from management and Deloitte Ireland LLP, has enabled the Committee and then the Board, to conclude that the Annual Report and Accounts, taken as a whole, is fair, balanced and understandable and that it provides the information necessary for shareholders to assess the Company’s position and performance, business model and strategy.
Going Concern and Viability Statements The Audit Committee reviewed the draft Going Concern and Viability Statements prior to recommending them for approval by the Board. These statements are included in the Risk Management Report on page 49. This review included assessing the effectiveness of the process undertaken by the Directors to evaluate going concern, including the analysis supporting the going concern statement and disclosures in the Financial Statements. The Committee and the Board consider it appropriate to adopt the going concern basis of accounting with no material uncertainties as to the Group’s ability to continue to do so.
The Committee also reviewed the Directors’ Viability Statement which is supported by the work conducted in the two day strategy and budget review session in December 2018, the May 2018 Glanbia Capital Markets day preparatory work and the Board’s ongoing review of monthly and year-to-date business performance versus budget and forecast. Further detail is provided within the Viability Statement on page 49.
Audit Committee Report continued
Glanbia plc | Annual Report and Financial Statements 2018
73
Internal AuditThe Committee approves the annual work programme of the Group Internal Audit function and ensures that it is adequately resourced with a strong mix of skills and expertise capable of conducting effective internal audits, IT audits and special investigations. The Committee receives regular reports from the Group Head of Internal Audit covering team development, progress against the audit plan, the status of management action plans to address control weaknesses identified, best practice risk management and whistleblowing procedures. The Committee encourages effective coordination between the external and internal audit teams and ensures that this is in place through the regular Committee meetings.
The Group Internal Audit team utilises a market leading audit management system and appropriate data analytics tools to improve the effectiveness of the Internal Audit processes across the organisation. The audit management system is used to record and monitor the corrective actions arising from all Internal Audit reviews and the Committee regularly reviews progress on these corrective actions at its meetings. In order to ensure compliance with best practice the Internal Audit function is preparing for an External Quality Assessment (EQA) review with a designated member of the team being appointed to oversee the process.
The Group Head of Internal Audit has direct access to the Chairman of the Audit Committee and the Committee holds private review meetings with the Group Head of Internal Audit as required.
Risk management and internal control systemsThe Audit Committee is responsible for assisting the Board by taking delegated responsibility for the ongoing monitoring of the effectiveness of the Group’s systems of risk management and internal control. The Risk Management Report on pages 46 to 53 sets out the detailed steps in this regard.
The Group maintains a risk register, which contains the key risks faced by the Group, including their likelihood, impact and velocity as well as the controls and procedures implemented to mitigate these risks. The Committee receive regular Group key risk summary reports, prepared by the Internal Audit team, tracking residual risk exposures which allows the Committee to assess the appropriateness of management’s action plans to ensure the Board’s risk appetite is not exceeded and to remain alert to emerging risk areas as they are identified through the review process.
The Committee’s risk management focus during 2018 centred on ensuring it evaluated key areas of risk such as IT security, financial reporting, tax, food safety and quality and health and safety by receiving direct presentations from management, Group functional heads and external advisors. By targeting such areas the Committee has built up a detailed understanding of the risks within each of these core functions, our improvement opportunities, team strengths and weaknesses and emerging risk areas, all of which has helped the Committee to enforce the Board’s risk appetite and ensure effective risk management.
The Committee’s efforts to improve risk management oversight in recent years has resulted in a formalised approach to developing risk appetite statements which has helped make the direct management presentations to the Committee more effective and strengthened the opportunity for the Committee to provide a robust challenge to management on their activities and the effectiveness of the risk mitigation measures. The Committee considered the current risk management process during the year and deemed it effective in relation to identifying, assessing and monitoring Group risks including emerging risk areas. The Board has also reviewed the effectiveness of the current systems of risk management and internal control and is satisfied that these systems have been operating throughout 2018 and to the date of this report.
Whistleblowing and fraudThe Audit Committee is responsible for ensuring that the Group maintains suitable whistleblowing arrangements for employees. These arrangements are outlined in our Code of Conduct which is available on the Company’s website www.glanbia.com and on our Group intranet. Following a presentation from the Group Secretary the Committee considered the Group’s arrangements for its employees to raise concerns, in confidence, about possible wrong doings in financial reporting and other matters, which included a review of the Group’s Code of Conduct, Anti-bribery and Corruption policy and Safecall Speak-up service. The Committee also considered the Group’s procedures for fraud prevention and detection to ensure that these arrangements allow for the proportionate and independent investigation of such matters and appropriate follow up action. The Committee concluded that the Group’s whistleblowing and fraud prevention procedures are adequate.
Review of Audit Committee performanceThe Committee’s performance and its members independence, recent and relevant financial experience were assessed and deemed appropriate at the Committee’s February 2019 meeting.

Glanbia plc | Annual Report and Financial Statements 2018
74
> Director’s Report
2018 significant financial reporting judgements and disclosuresThe Audit Committee assessed whether suitable accounting policies have been adopted and whether management has made appropriate estimates and judgements in the preparation of the 2018 Financial Statements. As part of this exercise the Committee reviewed accounting papers prepared by management which provide the supporting detail for the key areas of financial judgement.
The primary areas of financial reporting judgement and disclosure which were considered by the Committee in relation to the 2018 Financial Statements and how these were addressed are outlined in the following table.
Key financial judgement and disclosures How the Audit Committee addressed these matters
Impairment review of goodwill and intangibles
• Goodwill and intangible asset impairment reviews involve a range of judgemental decisions largely related to the assumptions used to assess the value-in-use of the assets being tested. These assumptions typically include long-term business and macroeconomic projections, cash flow forecasts and associated discount rates;
• Management provided the Committee with detailed reports to support the recoverable value of the balances included in Note 17 to the Financial Statements. The Committee examined the methodology applied including ensuring that the discount rates used were appropriate;
• The Committee constructively challenged assumptions used to support short and long-term projections, with consideration of different scenarios and key assumptions used within the respective reviews; and
• While no impairments were identified from this review process the Committee noted the impact of the increase in discount rates in reducing the headroom, the difference between the carrying value of assets and their value in use, on a number of investments.
Following these discussions, the Committee is satisfied that the impairment review approach, disclosed in Note 17, key assumptions made and conclusions reached are appropriate.
Acquisition accounting and valuation of intangible assets on acquisition
• On 19 November 2018 the Group acquired SlimFast for a consideration of €335 million (US$350 million) exclusive of additional working capital and cash. This acquisition included intangible assets and goodwill. Intangible assets included customer relationships and brands;
• The Committee recognises that valuing these intangible assets is a subjective process requiring a level of estimation and judgement around areas such as cash flow projections and discounts rates; and
• The Group Finance Director outlined the advice received from the Group’s external valuation experts to the Committee, with regard to the purchase price allocations and key assumptions utilised in the acquisition model.
Following this review the Committee is satisfied that the accounting treatment applied for the acquisition under IFRS 3, the purchase price allocations performed by management and the assumptions utilised as disclosed in Note 36 and conclusions reached are reasonable.
Revenue recognition • As part of the Group’s preparations to address IFRS 15 ‘Revenue from Contracts with Customers’, which will be effective for and will be adopted by the Group for the 2019 financial year beginning 30 December 2018, revenue recognition criteria was reviewed across all business units with a detailed focus on material sales and customers in the year. With the exception of the presentation of the sale of cheese and whey on behalf of Southwest Cheese within Glanbia Nutritionals as disclosed in Note 2, no material changes were identified to be implemented under the new accounting standard. The revised criteria have been communicated within an updated Group accounting manual to the Business Unit finance teams.
• The Committee considered the extent of rebate, discount, deduction and allowance claims across the Group where the amounts payable can vary depending on the arrangements made with individual customers and the volume of trade; and
• This review included understanding the basis of any significant year-end provisions to ensure they were adequate and appropriate.
Following these discussions and a review of a number of Internal Audit reports focused on our controls over the Group’s rebate, discount, deduction and allowance claim processes across the Group, the Committee is satisfied that the basis of the year-end rebate provisions within the Financial Statements are appropriate.
Uncertain tax provisions • The Committee received a number of presentations from the Group Finance Director, Group Head of Tax and our external advisors on various tax matters including legislative changes, tax structures and controls;
• The Committee considered in detail the impact of the changes on the Group, particularly the US tax reform legislation enacted on 22 December 2017, the potential for further legislative changes and the Group’s compliance with the associated increasing requirements;
• The Committee received an analysis of movements in the year-end uncertain tax provisions, reviewed the key judgements in relation to the calculation of the uncertain tax provisions, the external professional advice obtained to support the provisions and the Financial Statement disclosure requirement; and
• The Committee obtained an update from management on the status or outcome of any tax authority reviews conducted during the financial period.
Following these enquiries, the Committee is satisfied that the key assumptions governing the calculation of uncertain tax provisions and their disclosure within the Financial Statements are appropriate.
Audit Committee Report continued
Glanbia plc | Annual Report and Financial Statements 2018
75
Review of statutory AuditorThe Committee oversees the relationship with the statutory Auditor, including approving the external Auditor’s fee proposals and ensuring that the statutory audit contract is put out to tender at least every 10 years. Deloitte (who were succeeded by Deloitte Ireland LLP) were appointed as the Group’s statutory Auditor on 27 April 2016 following a formal tender process.
At the Committee’s October 2018 meeting it reviewed the approach and scope of the annual audit work to be undertaken by the statutory Auditor, which included planned levels of materiality, key risks to the accounts, the audit of the Group’s core financial IT systems, the proposed audit fee, fraud responsibilities and representations, the Group’s processes for disclosing information to the Auditor and the approval of the terms of engagement for the audit. The Committee also discussed recent corporate governance updates, such as the revised 2018 UK Corporate Governance Code which applies for accounting periods commencing on or after 1 January 2019, regulator commentary and correspondence and the potential impacts and preparation requirements for the implementation of IFRS 9, IFRS 15 and IFRS 16 together with other planned IFRS reporting developments. The Committee also received updates from the Auditor at its meetings in December 2018 and February 2019.
The Committee ensured that the statutory Auditor had direct access to the Chairman of the Committee and the Group Chairman. It is standard practice for the statutory Auditor to meet privately with the Audit Committee on at least an annual basis without any members of management or the Executive Directors being present. This meeting was held in February 2019 following the completion of the 2018 audit to review the findings from the audit of the Group Financial Statements. Management’s progress on control improvement opportunities identified by Deloitte Ireland LLP will be maintained under review by the Committee during 2019.
Independence of the statutory AuditorIn order to ensure the independence and objectivity of the statutory Auditor, the Committee maintains and regularly reviews the Group’s Auditor’s Relationship and Independence Policy. The policy provides clear definitions of services that the statutory Auditor cannot provide, such as financial information systems design and implementation, Internal Audit services or legal services. For services that may be undertaken by the statutory Auditor, appropriate approval thresholds are in place to ensure the provision of these services do not impair the Auditor’s independence.
The Committee also considers the performance of the statutory Auditor each year, including Audit Partner rotation requirements, and assesses their independence on an on-going basis. In line with regulatory requirements for listed companies, the statutory Auditor is required to rotate the Audit Partner responsible for the Group audit every five years. The Committee is very supportive of such rotation requirements as it helps ensure a fresh review without sacrificing industry knowledge. The current audit engagement partner, Kevin Sheehan, was appointed as lead engagement partner for the Group in 2016.
As part of the independence review process, the statutory Auditor is requested to formally confirm its independence in writing to the Committee. This confirmation process also provides examples of safeguards that may, either individually or in combination, reduce any independence threat to an acceptable level. While their appropriateness depends on the specific circumstances involved in the provision of the service they will always include ensuring:• that the statutory Auditor does not play any part in the
management or decision-making of Glanbia; and• the individuals involved in providing any non-audit services are
not members of the audit engagement team.
Non-audit servicesOur Auditor Relationship and Independence Policy includes a clearly defined pre-approval process for audit and other services, including a requirement for the business to submit a formal template setting out the details of the services requested, the likely fee level, the rationale for requiring the work to be carried out by Deloitte Ireland LLP rather than another service provider and confirmation that the service requested is not a prohibited service. The policy requires each request to be reviewed and where appropriate challenged by the Group Financial Controller, Group Finance Director, Group Secretary and Audit Committee Chairman (subject to a defined monetary threshold). The provision of all non-audit services which are not prohibited and approved in line with our policy must be ratified by the Audit Committee at the following meeting of the Committee, who also ensures that the total fees for non-audit services will not exceed the defined thresholds. Fees paid to Deloitte Ireland LLP for audit related and non-audit related services are analysed in Note 5 to the Financial Statements. The Committee is very pleased with the effective implementation of this policy since the appointment of Deloitte Ireland LLP as statutory Auditor following the 2016 audit tender. This focus has significantly reduced the type and level of services provided to prevent any perceived or actual impact on the Auditor’s independence.
EffectivenessThe Audit Committee reviews the effectiveness of the external audit process. As part of the 2018 audit review process, audit effectiveness questionnaires will be completed by the relevant finance executives at Group and Business Unit level, the responses will be summarised by management and reported to the Audit Committee at its June 2019 meeting. While the Committee is very satisfied with its own interactions with Deloitte Ireland LLP, both in terms of reports received and direct interactions during Audit Committee meetings, it believes that a more widespread view on the effectiveness of the audit process needs to be gathered to ensure:• that any audit learnings are captured and acted upon; • the audit process is fully respected; and• the overall efficiency and effectiveness of the statutory audit
process is progressed in future years.
The observations from this survey and subsequent follow-up discussions will be shared with the statutory Auditor to ensure learnings are openly discussed and the audit process is further enhanced in 2019. The Committee remains satisfied with the effectiveness of the statutory Auditor based on the improvements implemented following past audit process reviews, the quality of the presentations received, management commentary on the robustness of the challenge provided, their technical insight and their demonstration of a clear understanding of the Group’s business and its key risks.

Glanbia plc | Annual Report and Financial Statements 2018
76
> Director’s Report
Nomination and Governance Committee Report
“The Committee ensures the Board comprises individuals with the necessary skills, knowledge and experience to ensure the effective management of the Group’s expanding business and delivery of its strategic objectives.”
2018 Committee Members and attendance
Member Appointed
Number of full years on the Committee
2018 meeting attendance
P Haran 9-Jun-05 13 8/8
P Coveney 23-Feb-16 2 8/8
D Gaynor 12-Dec-14 4 8/8
D O’Connor 12-Dec-14 4 8/8
See page 58 for more information on current Nomination and Governance Committee members.
Terms of referenceThe full terms of reference of the Nomination and Governance Committee can be found on the Group’s website: www.glanbia.com or can be obtained from the Group Secretary.
Key responsibilities
Making recommendations to the Board on the appointment and re-appointment of Directors;
Planning for the orderly succession of new Directors to the Board and of Senior Management;
Keeping under review the leadership needs of the Group, both executive and non-executive, with a view to ensuring the continued ability of the Group to compete effectively in the market place;
Recommending to the Board the membership and chairmanship of the Audit and Remuneration Committees respectively;
Keeping the extent of Directors’ other interests under review to ensure that the effectiveness of the Board is not compromised;
Keeping under review corporate governance developments with the aim of ensuring that the Group’s governance policies and practices continue to be in line with best practice;
Ensuring that the principles and provisions set out in the Irish Corporate Governance Annex and the UK Corporate Governance Code (and any other governance code that applies to the Company) are observed where appropriate; and
Reviewing the disclosures and statements made in the Directors’ Report to the shareholders.
GovernanceThe Committee was in place throughout 2018 and Paul Haran, Senior Independent Director is Chairman of the Committee. The Committee comprises four Independent Non-Executive Directors, of whom two members constitute a quorum. The Group Secretary acts as secretary to the Committee. The Group Chairman and Group Managing Director attend by invitation only.
Focused on effective Board composition and governance
Non-Executive Chairman Non-Executive Directors
Composition of the Committee
Governance Board and Committee composition Succession planning Board effectiveness
Allocation of time
Paul HaranNomination and Governance Committee Chairman
Glanbia plc | Annual Report and Financial Statements 2018
77
Our 2018 highlights
Considered the composition and balance of the Board and oversaw the selection process for the appointment of Mary Minnick and Richard Laube as the new Independent Non-Executive Directors;
Recommended the designation of Dan O’ Connor as the new Senior Independent Director and Donard Gaynor as the Independent Non-Executive Workforce Director with responsibility for oversight of workforce engagement;
Considered the revisions to the UK Corporate Governance Code (2018) and oversaw the Board and Committees’ governance;
Progressed Senior Management succession planning; and
Considered the outcome of the Board and Committee evaluations.
Dear shareholder, I am pleased to present our Nomination and Governance Committee Report for the year ended 29 December 2018, which was another year of significant change for the Board. The size of the Board reduced from 18 to 16 members in accordance with the amended and restated relationship agreement dated 2 July 2017 (the ‘Relationship Agreement’) between the Company and Glanbia Co-operative Society Limited (the ‘Society’) relating to the Society’s agreed Board representation, its composition and size over the period 2018 to 2022, full details of these changes are set below. Additionally, in accordance with the Relationship Agreement, the Company proposes to reorganise the composition of its Board of Directors effective 1 May 2019. The reorganised Board will be comprised of 16 members, as follows:• Two Executive Directors; Group Managing Director and Group
Finance Director;• Six Independent Non-Executive Directors; and• Eight Non-Executive Directors nominated by the Society.
We are pleased to welcome two new Independent Non-Executive Directors, Mary Minnick and Richard Laube, who will add valuable experience and fresh perspective to the Glanbia Board, full details of whom are contained on page 55. Mary and Richard will join the Board effective 1 May 2019.
To facilitate the reorganisation and the broadening of the external perspective of the Board, Hugh McGuire and Brian Phelan will not be putting themselves forward for re-election at the 2019 Annual General Meeting (AGM). Their key executive roles are unaltered and they will continue in their executive leadership positions as CEOs of the Group’s two global growth platforms, Glanbia Performance Nutrition and Glanbia Nutritionals respectively.
I will retire immediately upon completion of the appointment of a third new Independent Non-Executive Director which is expected to be completed during 2019. Following my retirement, Dan O’Connor will take up the position of Senior Independent Director. The role of Donard Gaynor, an Independent Non-Executive Director, has been expanded to include oversight of workforce engagement to further improve our Board involvement in this area. The Company will announce the appointment of the Independent Board Director to replace me and changes to the composition of the Committees (which will continue to comprise only of Independent Non-Executive Directors) in due course.
I would like to thank Glanbia for the support and opportunities it has afforded to me throughout my tenure. I am available at any time (up to my retirement) to discuss any matters that any shareholder may wish to raise and Dan O’Connor will be available thereafter to discuss future shareholder matters.
Yours sincerely,
Paul HaranNomination and Governance Committee Chairman
Glanbia Co-operative Society Limited – right to nominate eight of the Company’s Non-Executive Directors The current composition and size of the Board reflects the historical shareholding and relationship of the Company with the Society and is documented in the amended and restated Relationship Agreement dated 2 July 2017.
The Society currently owns 31.5% of the issued share capital of the Company. Between 2012 and 2017, the Society and the Board agreed the following changes, which will impact the composition and size of the Board in the coming years:
• In 2018 the number of Society Nominee Directors reduced from 10 to eight, which number of Society Nominee Directors will also apply in 2019;
• In 2020 the number of Society Nominee Directors will reduce from eight to seven, which number of Society Nominee Directors will also apply in 2021; and
• In 2022 the number of Society Nominee Directors will reduce from seven to six, which number of Society Nominee Directors will also apply each subsequent year thereafter.
It is the intention that the Society would continue to nominate a Society Nominee Director as Chairman of the Board until no later than 30 June 2020.
Up to eight of the Directors on the Board will be made up of Executives and Independent (of the Society) Non-Executive Directors. The parties will co-operate to ensure (as far as practicable) that the Independent Non-Executive Directors will be appointed on the recommendation of the Nomination and Governance Committee. If the number of non-Society Nominee Directors on the Board changes, the number of Society Nominee Directors set out above will change pro rata.
Where a reduction is required to take effect in the number of Society Nominee Directors in respect of a particular year it shall take effect on the earlier of the conclusion of the first board meeting of the Society immediately following the AGM of the Society which takes place in that year or 30 June (or such earlier date as the Society shall agree with Glanbia plc) in that year. Further, if the Society’s shareholding in the Company falls below 28% of the issued share capital, discussions will take place regarding a further reduction in the size of the Society’s representation on the Board.
Glanbia plc | Annual Report and Financial Statements 2018
78
> Director’s Report
Nomination and Governance Committee key activitiesThe principal activities undertaken by the Committee in 2018 were as follows:
Board changes and proposed Board and Committee Changes There were a number changes to the composition of the Board. These changes were driven by the reduction in the size of the Board from 18 to 16 during 2018 and the proposed reorganisation in 2019 of the composition of the Board, each in accordance with the Relationship Agreement.
Changes arising from the re-organisation of the composition of the BoardMary Minnick and Richard Laube will join the Board effective 1 May 2019.
Paul Haran will retire immediately upon completion of the appointment of a third new Independent Non-Executive Director which is expected to be completed during 2019.
To facilitate the broadening of the experience set of the Board, Hugh McGuire and Brian Phelan will not be putting themselves forward for re-election at the 2019 AGM.
Society ChangesAt the conclusion of the 2018 AGM on 25 April 2018, Michael Keane retired as Non-Executive Director (having served nine years on the Board). On 1 June 2018 Henry Corbally retired as Group Chairman and was succeeded by Martin Keane (Vice-Chairman). On the same day Patrick Murphy was appointed as one of the two Vice-Chairmen in place of Martin Keane. Also on the same day, in accordance with the terms of the Relationship Agreement, the Society reduced its representation on the Board of the Company to eight Directors. Patsy Ahern and Tom Grant, Society Nominee Directors, retired from the Board of the Company and Jer Doheny was nominated by the Society to join the Board of the Company. Subsequently, on 21 June 2018 Henry Corbally retired as a Non-Executive Director from the Board and was replaced on that date by Patsy Ahern. These changes resulted in the reduction in the number of Society Nominee Directors on the Board from ten to eight.
The Nomination and Governance Committee did not use either an external search consultancy or open advertising for the appointments of the Society Nominee Directors. The Independent Non-Executive Director recruitment and selection process is described below.
DiversityA description of our Diversity Policy is contained on page 66.
Committee changes during 2018There were no changes to Committee membership during 2018. In compliance with the UK Corporate Governance code (2016) the membership of the Audit, Nomination and Governance andRemuneration Committees continues to comprise only Independent (of the Society) Non-Executive Directors.
Independent Non-Executive Director recruitment and selection processDuring 2018, the Nomination and Governance Committee commenced a process to recruit and appoint new Independent Non-Executive Directors. The Committee had a number of discussions to scope out the current and likely key skills, experience, characteristics and requirements for the role having regard to the challenges and demands of the future operating environment, growth opportunities for Glanbia and Board diversity. An Independent Non-Executive Director specification was drawn up and approved by the Committee.
Key criteria included international experience, management of cultural diversity, strategic commercial business acumen and knowledge of global capital markets and major transactions.
The Committee retained Leaders Mores (Ireland) and Russell Reynolds Associates (International) to lead the search. Both are leading executive search practices and have no other connection with the Group.
A structured timetable was adopted for the process and regular Committee discussions and updates held throughout. Both Leaders Mores and Russell Reynolds Associates put together an extensive range of potential candidates for consideration which were narrowed down to a strong short list for interview. Shortlisted candidates went through a three-stage interview process meeting with both the current and proposed new Senior Independent Director and the Group Secretary, the Group Managing Director and Group Chairman and finally the Committee. The Group Managing Director and the Committee were unanimous in their final selection of Mary Minnick and Richard Laube as Independent Non-Executive Directors. The Committee believes that Mary and Richard will bring invaluable objective and independent insight to the Board’s deliberations and are well placed to support the Board as they deliver on the strategic priorities already underway. A third Independent Non-Executive Director appointment will be announced during 2019.
Senior Independent Non-Executive DirectorThe Board on the recommendation of the Nomination and Governance Committee has approved the appointment of Dan O’ Connor to succeed Paul Haran as Senior Independent Non-Executive Director effective from Paul’s retirement. Dan joined the Board in December 2014; his knowledge and understanding of Glanbia and other listed companies means that he is well experienced for the role.
Workforce DirectorWe have expanded the role of Donard Gaynor, a Non-Executive Director, to include oversight of workforce engagement to further improve our Board involvement in this area.
Succession PlanningThe Committee is responsible for ensuring that the Board, its Committees and senior management have the correct balance of skills, knowledge and experience, to effectively lead the Group both now and in the longer term. This is achieved through effective succession planning. During 2018 the Committee continued to focus on the succession pipeline with consideration of both Board-level plans to ensure orderly refreshment of membership, and longer term talent strategy to understand the changing competencies required to ensure the development of a skilled workforce which will support the Group’s strategy, purpose, culture and values.
Through on-going review of Non-Executive tenure the Committee can identify any likely short to medium term changes in the skill set, diversity and independence of the Board and ensure that Board refreshment is progressive and planned.
Internal talent development and the attraction and retention of skilled individuals is facilitated through engagement with HR to ensure that the broader people strategy supports the development of the internal talent pipeline and ensures access to a diverse and inclusive external talent pool. We have looked to identify, harness and accelerate the development of talent at all levels, based on an assessment of successor readiness in respect of senior positions. Annually one Board meeting is held at one of the wholly owned business sites which provides an opportunity for interaction with employees and a chance for Non-Executive Directors to develop deeper insights into the quality of our current senior management in both these businesses and the potential for succession in the next generation.
Nomination and Governance Committee Report continued

Glanbia plc | Annual Report and Financial Statements 2018
79
Our culture is a major contributing factor to the delivery of long term success for our stakeholders. The Committee plays a key role in embedding a positive culture by ensuring that our succession planning and appointment process identifies candidates who are exemplars of our purpose, vision, values and culture. Our induction and training programmes, and the annual performance evaluation process promotes these values in all our Directors and employees.
External Board AppointmentSiobhán Talbot was appointed as Non-Executive Director to the Board of CRH plc, effective 1 December 2018. The Board on the recommendation of the Nomination and Governance Committee unanimously agreed to the appointment of Siobhán Talbot as a Non-Executive Director to CRH plc. The Committee is satisfied that this will not interfere with the discharge of her duties and recognise the benefits to the Group of this appointment.
UK Corporate Governance Code (2018)The Board is aware of the changes to the UK Corporate Governance Code which will apply to companies with financial year ends beginning on or after 1 January 2019. During 2018, the Committee reviewed the detailed provisions of the new code and the Board has taken into consideration these changes and work has already commenced to reflect the revised principles; examples include the designation of Donard Gaynor as Independent Non-Executive Director with oversight for workforce engagement, the incorporation of the provisions of the new code into the Board evaluation process, the restructuring of this Corporate Governance Report in line with the five new principles including enhanced disclosures where appropriate (although we reported against the 2016 code for this Report). We have also enhanced our remuneration reporting which is further detailed in the Remuneration Committee report on page 80.
Regular mattersA number of regular matters were considered by the Committee in accordance with its terms of reference, details of which are set out below:
Review of Non-Executive Directors’ independence in accordance with the guidance in the Irish Corporate Governance Annex and the UK Corporate Governance Code (2016) (the ‘Codes’)The Board evaluation and review process considered the independence of each of the Non-Executive Directors, taking into account their integrity, their objectivity and their contribution to the Board and its Committees.
The Board is of the view that the following behaviours are essential for a Non-Executive Director to be considered independent:• Provides an objective, robust and consistent challenge to the
assumptions, beliefs and views of senior management and the other Directors;
• Questions intelligently, debates constructively and challenges rigorously and dispassionately;
• Acts at all times in the best interests of the Company and its shareholders; and
• Has a detailed and extensive knowledge of the Company and the Group’s business and of the market as a whole which provides a solid background with which they can consider the strategy of the Company and the Group objectively and help the Executive Directors develop proposals on strategy.
The Board and Committee believe that all Non-Executive Directors demonstrated the essential characteristics of independence and brought independent challenge and deliberations to the Board.
The reviews took into consideration the fact that Paul Haran, Martin Keane and Eamon Power have served on the Board for more than nine years, (Paul and Martin serving nine and a half years coterminously with the Group Managing Director, the longest coterminous period with a current Executive Director) and that eight of the Non-Executive Directors are Society Nominee Directors, both of which the Codes state could be relevant to the determination of a Non-Executive Director’s independence. However, the Codes also make it clear that a director may be considered independent notwithstanding the presence of one or more of these factors. This reflects the Board’s view that independence is determined by the Director’s character as set out above. The Committee concluded that Paul Haran and the Society Nominee Directors including the Group Chairman continue to demonstrate the essential characteristics of independence and brought independent challenge and deliberations to the Board through their character and objectivity; however notwithstanding this, the Society Nominee Directors are not being designated as Independent Directors for the purpose of Listing Rule 6.2.2 A of the Euronext Dublin /Listing Rule 9.2.2 AD of the UKLA. This conclusion was presented to and agreed by the Board.
Re-election of Directors The Committee continues to be of the view that all Directors should be re-elected to the Board at the Company’s AGM. All Directors who sought re-election at the 2018 AGM were re-elected.
All Directors, with the exception of Hugh McGuire and Brian Phelan who (in order to facilitate the broadening of the perspective of the Board) are not putting themselves forward for re-election at the AGM, are seeking re-election at the 2019 AGM. Paul Haran will retire immediately upon completion of the appointment of the third new Independent Non-Executive Director, which is expected to be completed during 2019.
The Committee is satisfied that the backgrounds, skills, experience and knowledge of the Group of the continuing Directors collectively enables the Board and its Committees to discharge their respective duties and responsibilities effectively. This was supported by the formal external performance evaluation of the Board conducted in 2016 and the internal evaluations conducted in 2017 and 2018.
Additionally in 2019 (as in 2018), Patrick Coveney, Donard Gaynor, Paul Haran and Dan O’Connor will each seek re-election at the 2019 AGM by separate resolution of the independent shareholders (i.e. all of the shareholders save the Society and its subsidiary companies). We believe that sufficient biographical and other information on those Directors seeking re-election is provided in this Annual Report and the circular accompanying the Notice of the 2019 AGM to be published to enable shareholders to make an informed decision.
Review of the time required from a Non-Executive DirectorThe Committee assessed the time dedicated to the Company and the Group by each Non-Executive Director. This review also considered the extent of the Non-Executive Directors’ other interests to ensure that the effectiveness of the Board is not compromised by such interests. The Board and Committee are satisfied that the Group Chairman and each of the Non-Executive Directors commit sufficient time to the fulfilment of their duties. The Group Chairman farms in Co. Laois and is a Director of Ornua Co-operative Society Limited, but the Committee and the Board consider that this does not interfere with the discharge of his duties to the Group.
Review of Nomination and Governance Committee performanceThe Committee assessed its performance covering its terms of reference, composition, procedures, contribution and effectiveness. As a result of that assessment, the Board and Committee are satisfied that the Committee is functioning effectively and continues to meet its terms of reference.

Glanbia plc | Annual Report and Financial Statements 2018
80
> Director’s Report
Reinforcing the link between performance and reward
Remuneration Committee Report
Donard Gaynor Remuneration Committee Chairman
Dear shareholder, On behalf of the Board and Remuneration Committee, I am pleased to present the Directors’ Remuneration Committee Report for the year ended 29 December 2018. The Directors’ Remuneration Committee report covers the remuneration governance, Directors’ Remuneration Policy 2018-2020 and its implementation in 2018 reflecting regulatory requirements and balancing commercial sensitivities. The Remuneration Committee is currently operating within the Directors’ Remuneration Policy 2018-2020 which received 99.83% approval of shareholders at the Annual General Meeting on 25 April 2018.
The Remuneration Committee reviews the remuneration framework of the Executive Directors and Senior Leadership annually, with external input from Willis Towers Watson, to ensure existing remuneration arrangements continue to be appropriate relative to delivering business strategy in the changing external context. The Remuneration Committee seeks to align remuneration policies and practices to incentivise delivery of the strategic business priorities both in the short and long-term, and also to recognise and reward business performance and that of individuals. There is also an increasing focus on executive retention and post termination non-compete restrictions. The Committee has reviewed the new UK Corporate Governance Code and in particular the provisions for remuneration and oversight of all employees. The Committee supports the narrative of the Code and already reviews the employee culture, remuneration and risk as part of its activities and will continue to consider its Group remuneration policy and the impact on the Executive Director pay policy at the next review in 2020, for approval by shareholders at the 2021 AGM. In addition the Committee continues to monitor the adoption of the amended European Shareholder Rights Directive in Ireland and any potential impact.
Business performance 2018The Group had another strong year of growth with adjusted Earnings Per Share (EPS) from continuing operations up 9.0% constant currency on a Pro-forma basis for the year. On a reported basis adjusted EPS was up 4.5%, reflecting a weakening of the US Dollar versus the Euro during the year. Return on Capital Employed (ROCE) was 13.2% for 2018. The Balance Sheet continues to be in a strong position. Net debt has increased by €209 million driven by the drawdown of a new loan facility to finance the acquisition of SlimFast in November 2018. The Group also refinanced all long term loans, excluding the US private placement, into new five year facilities. All financial metrics are well within bank covenant levels at year end with capacity for further investment available. The Group had a good year on cash flow with Operating Cash Flow of €301.7 million for the year which equates to an EBITDA cash conversion of 92.0%.
Directors’ Remuneration Policy 2018-2020During 2017 the Remuneration Committee completed a review of the Directors’ Remuneration Policy to ensure that delivery of an ambitious Group strategy is appropriately incentivised while maintaining focus on strong financial discipline. The Directors’ Remuneration Policy for 2018-2020 received 99.83% approval of shareholders at the AGM.
Non-Executive Chairman Non-Executive Directors
Framework and Policy Annual Incentive Plan Long-Term Incentive Plan Total Compensation Package
Allocation of time
Composition of the Committee
Key responsibilities of the Committee Determine and agree with the Board the framework and broad policy for remuneration of the Executive Directors, Non-Executive Directors and other Senior Executives as required.
Oversee remuneration design and target setting to ensure comprehensive linkages between performance and reward and incentivise delivery of Group strategy.
Determine, within the agreed policy, individual total compensation packages for the Executive Directors, Non-Executive Directors and other Senior Executives as required.
Determine any employee share-based incentive awards and any performance conditions to be used for such awards.
Consider and approve Executive Directors’ and other Senior Executives’ total compensation arrangements annually.
Determine the achievement of performance conditions for vesting of Annual and Long-Term Incentive Plans.
Terms of referenceThe full terms of reference of the Remuneration Committee can be found on the Group’s website www.glanbia.com or can be obtained from the Group Secretary.

Glanbia plc | Annual Report and Financial Statements 2018
81
The principles which underpin the current Directors’ Remuneration Policy are as follows:
Global context Strong emphasis on the global nature of the Group and therefore global market references for remuneration.
Strong alignment with business performance
Clear linkage of Executive Director remuneration to Group performance and Business Segment metrics, where relevant.
Rewarding sustained performance
Greater emphasis on long-term incentives, with market benchmarking reflecting trends in Europe, UK and US markets.
Greater alignment with shareholders/share value growth
Delivery of remuneration through shares, increased shareholding requirements, extended LTIP holding period, malus and clawback provisions together with increased LTIP participation below Executive Director level (both in terms of number of participants and quantum).
Full details of the Directors’ Remuneration Policy 2018-2020 are on pages 83 to 87.
Remuneration in respect of 2018Executive Director base salary and benefits Arising from the remuneration review in 2017, the Remuneration Committee increased the base salaries of the Group Managing Director, Group Finance Director and CEO Glanbia Nutritionals in 2018 by 6%, effective 1 January 2018 as detailed in the Remuneration Report 2017.
There was no change to the benefits of the Executive Directors in 2018.
2018 Annual Incentive The Remuneration Committee considers that the 2018 Annual Incentive awards of between 84.9% and 92.8% of maximum payment fairly recognises the combined business and personal performance of the Executive Directors during the year. The 2018 Annual Incentive is based on a combination of business (80% weighting) and personal (20% weighting) objectives.
2016 Share Awards granted under the 2008 Long-Term Incentive Plan (LTIP 2008)Under the 2008 LTIP the 2016 share award is the second share award which incorporates business segment as well as Group performance conditions for relevant Executive Directors. Against very stretching objectives for the three year performance period 2016 to 2018, the vesting for Executive Directors was in the range of 43.0% and 58.1% for the 2016 share awards. Under the 2008 LTIP, the 2016 share award granted to Executive Directors vests no earlier than 26 February 2019, the third anniversary of their grant.
Full details on the remuneration of Executive Directors can be found in the Directors’ Remuneration Implementation Report on pages 88 to 94.
Non-Executive Director remuneration An increase in the fees paid to Non-Executive Directors was part of the Remuneration Policy review approved at the AGM in April 2018. The Non-Executive Directors fees for 2018 are outlined on page 87.
Executive Director Remuneration for 2019Executive Director Service AgreementsIn May 2018, we set out our 5 year strategic ambition and roadmap 2018 to 2022 building on the strong performance by the Executive team in recent years. Recognising governance changes announced and those planned over the next three years, the need to successfully integrate current and likely future acquisitions across both our major business units and the responsibility placed on the Group Managing
Director to be the key link between management and the Board, the Board welcomes the agreement by the Group Managing Director and the Group Finance Director to sign three year renewable service agreements, effective 1st January 2019. The Board believes the signing of these agreements will sustain organisational stability over the next three years.
These service agreements include new 12 month notice obligation on both parties and the signing of new separate 12 month non-compete agreements post departure by both executives. Salary adjustments for both are set out below. The Board is strongly supportive of these salary adjustments which are consistent with our remuneration policy as overwhelmingly approved by shareholders at the 2018 AGM.
Additionally, the Remuneration Committee is satisfied that these adjustments are reasonable relative to the Total Direct Compensation benchmark comparators as set out in our policy. Finally, consistent with our practice of stakeholder engagement, the Board agreed that I discuss these changes with shareholders to facilitate their full understanding and confirm their support. To date the response has been supportive.
Executive Director base salary and benefitsThe base salary of the CEO Glanbia Nutritionals and CEO Glanbia Performance Nutrition will increase by 2.5%, effective 1 January 2019, in line with the standard increase for other employees in the Irish market where they are employed. The base salary for the Group Managing Director and the Group Finance Director will increase to €1,050,000 and €581,000 respectively, effective 1 January 2019, as set out on page 89. The salary adjustment of the Group Finance Director also reflects the fact that he has taken on additional responsibility for the Group Corporate Development function.
2019 Annual Incentive The Executive Directors will continue to participate in the Annual Incentive plan based on a combination of business (80% weighting) and personal (20% weighting) objectives. The target and maximum payments will remain at 75% and 150% of base salary respectively.
2019 Share Awards granted under the 2018 Long-Term Incentive Plan (LTIP 2018)The Executive Directors will continue to participate in the Long Term Incentive plan at levels consistent with prior years. Objectives will continue to measure key Group performance metrics and additional business segment performance metrics where relevant.
VotingAt the AGM on 25 April 2018 shareholders voted on three resolutions relating to remuneration which were approved:• Remuneration Committee Report 2017 – 99.14% approval• Directors’ Remuneration Policy 2018-2020 – 99.83% affirmative vote• 2018 Long-Term Incentive Plan rules – 99.79% approval
An advisory non-binding resolution to approve the 2018 Remuneration Committee Implementation Report will be put to the AGM on 24 April 2019.
During 2018 the Group continued to execute its strategic ambitions, delivering growth across all key aspects of the portfolio. The Committee is confident that this sustained performance is reflected in the 2018 implementation of the Remuneration Policy 2018-2020.
Donard Gaynor Remuneration Committee Chairman

Glanbia plc | Annual Report and Financial Statements 2018
82
> Director’s Report
Remuneration Committee Governance 2018Remuneration Committee GovernanceThe Remuneration Committee is currently comprised of three Independent (in all respects, including of the Society) Non-Executive Directors, of whom two members constitute a quorum. Where relevant the Group Chairman may also attend the Remuneration Committee meetings.
The Group Managing Director and the Group Human Resources & Corporate Affairs Director attend Committee meetings by invitation only. They absent themselves when their remuneration is discussed and no Director is involved in considering his/her own remuneration. The Group Secretary acts as secretary to the Remuneration Committee.
Remuneration Best PracticesThe Remuneration Committee complies with all relevant reporting and legislative requirements applicable to an Irish incorporated company with a primary listing on the Euronext Dublin. With a secondary listing on the London Stock Exchange, the Remuneration Committee has also resolved on a voluntary basis to align, to the extent possible under Irish law, the Directors’ Remuneration Policy with UK remuneration best practices. Additionally, the Remuneration Committee is giving increasing regard to remuneration practices in the major overseas countries in which the Group operates which are relevant in attracting, retaining and motivating senior talent in relevant markets. The Committee also continues to monitor the adoption of the amended European Shareholder Rights Directive in Ireland and any potential impact.
The Remuneration Committee receives independent external advice on executive remuneration from Willis Towers Watson who were first appointed as Remuneration Advisers in 2011 and were re-appointed following a competitive selection process in 2016. Willis Towers Watson provide advice to the Remuneration Committee which enables robust and sound decision making. Willis Towers Watson fees for advising the Remuneration Committee during 2018 were €155,000.
The Remuneration Committee continues to actively listen and incorporate, as far as possible, the views of the shareholders when determining the Directors’ Remuneration Policy and making remuneration decisions. The Directors’ Remuneration Committee is currently operating within the Directors’ Remuneration Policy 2018-2020 which received 99.83% approval of shareholders at the AGM on 25 April 2018. The Remuneration Committee, through the advice of the independent Remuneration Advisers, monitors and incorporates, as appropriate, best practice developments for remuneration policies. The 2018 UK Governance Code has been reviewed by the Remuneration Committee who have voluntarily adopted guidance in 2018 including taking steps to more deeply understand how the Directors’ Remuneration Policy cascades below the Executive Directors and consideration for the pay arrangements of the wider employee population when making Executive Director decisions. In 2019 the Remuneration Committee intend to adopt further aspects of the 2018 UK Governance Code.
Results at 2018 AGMResolution to receive and consider the Remuneration Committee report for the year ended 30 December 2017
For % Against %Total excluding
withheld % Withheld %Total including
withheld %
184,212,654 99.14% 1,604,526 0.86% 185,817,180 100.00% 3,439 0.00% 185,820,619 100.00%
Committee Members and Meeting Attendance
Member AppointedNumber of full years on the Committee
2018 meeting attendance
D Gaynor 13-May-14 4 6/6
P Haran 9-Jun-05 13 6/6
D O’Connor 1-Dec-14 4 6/6
See page 58 for more information on current Remuneration Committee members.
What we did in 2018
Secured approval for the Directors’ Remuneration Policy 2018-2020 by the Board and at the AGM (99.83% approval);
Measured and approved performance against the 2017 annual incentive plan and the 2015 LTIP awards which vested during the period. Approved associated payments and awards;
Agreed the 2018 annual incentive plan targets and the 2018 LTIP quantum and performance conditions for the 2018 share awards;
Reviewed achievements of the Glanbia Executive Team against pre-agreed objectives;
Reviewed the reward framework beyond the Glanbia Executive Team to enable market competitiveness and internal equity;
Reviewed achievements of the Glanbia Executive Team against pre-agreed objectives;
Reviewed the reward framework beyond the Glanbia Executive Team to enable market competitiveness and internal equity; and
Reviewed the service agreements of the Group Managing Director and the Group Finance Director.
What we plan to do in 2019
Measure and approve performance against the 2018 annual incentive plan and the 2008 LTIP awards granted in 2016;
Agree the targets for the 2019 annual incentive plan and the 2019 share award quantum and performance conditions under the LTIP 2018;
Continuously review achievements of the Glanbia Executive Team against objectives;
Address executive retention and post termination non-compete restrictions;
Deepen understanding of reward policies and practices beyond the Glanbia Executive Team; and
Continue to assess all relevant regulations and market practice, in the context of our policy and implementation of that policy.
Remuneration Committee Report continued
Results at 2018 AGMResolution to receive and consider the Directors’ Remuneration Policy 2018 – 2020
For % Against %Total excluding
withheld % Withheld %Total including
withheld %
185,508,946 99.83% 309,270 0.17% 185,818,216 100.00% 2,403 0.00% 185,820,619 100.00%
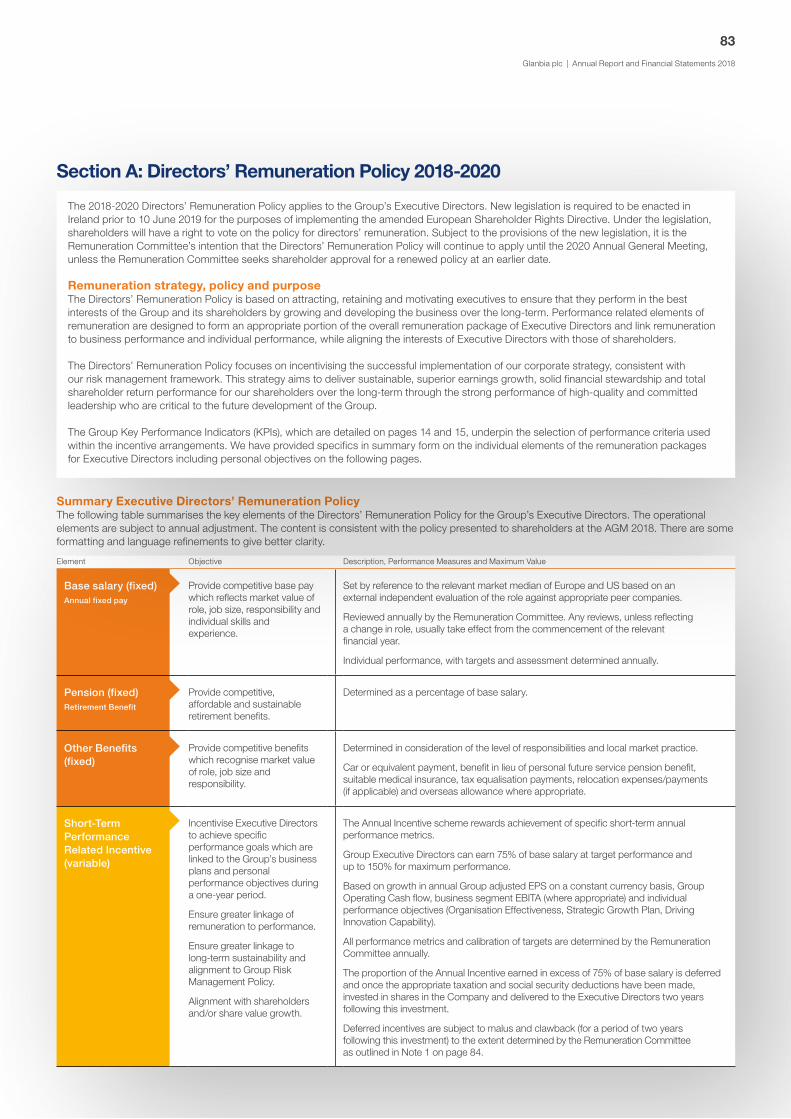
Glanbia plc | Annual Report and Financial Statements 2018
83
Summary Executive Directors’ Remuneration PolicyThe following table summarises the key elements of the Directors’ Remuneration Policy for the Group’s Executive Directors. The operational elements are subject to annual adjustment. The content is consistent with the policy presented to shareholders at the AGM 2018. There are some formatting and language refinements to give better clarity.
Element Objective Description, Performance Measures and Maximum Value
Base salary (fixed)Annual fixed pay
Provide competitive base pay which reflects market value of role, job size, responsibility and individual skills and experience.
Set by reference to the relevant market median of Europe and US based on an external independent evaluation of the role against appropriate peer companies.
Reviewed annually by the Remuneration Committee. Any reviews, unless reflecting a change in role, usually take effect from the commencement of the relevant financial year.
Individual performance, with targets and assessment determined annually.
Pension (fixed) Retirement Benefit
Provide competitive, affordable and sustainable retirement benefits.
Determined as a percentage of base salary.
Other Benefits (fixed)
Provide competitive benefits which recognise market value of role, job size and responsibility.
Determined in consideration of the level of responsibilities and local market practice.
Car or equivalent payment, benefit in lieu of personal future service pension benefit, suitable medical insurance, tax equalisation payments, relocation expenses/payments (if applicable) and overseas allowance where appropriate.
Short-Term Performance Related Incentive (variable)
Incentivise Executive Directors to achieve specific performance goals which are linked to the Group’s business plans and personal performance objectives during a one-year period.
Ensure greater linkage of remuneration to performance.
Ensure greater linkage to long-term sustainability and alignment to Group Risk Management Policy.
Alignment with shareholders and/or share value growth.
The Annual Incentive scheme rewards achievement of specific short-term annual performance metrics.
Group Executive Directors can earn 75% of base salary at target performance and up to 150% for maximum performance.
Based on growth in annual Group adjusted EPS on a constant currency basis, Group Operating Cash flow, business segment EBITA (where appropriate) and individual performance objectives (Organisation Effectiveness, Strategic Growth Plan, Driving Innovation Capability).
All performance metrics and calibration of targets are determined by the Remuneration Committee annually.
The proportion of the Annual Incentive earned in excess of 75% of base salary is deferred and once the appropriate taxation and social security deductions have been made, invested in shares in the Company and delivered to the Executive Directors two years following this investment.
Deferred incentives are subject to malus and clawback (for a period of two years following this investment) to the extent determined by the Remuneration Committee as outlined in Note 1 on page 84.
The 2018-2020 Directors’ Remuneration Policy applies to the Group’s Executive Directors. New legislation is required to be enacted in Ireland prior to 10 June 2019 for the purposes of implementing the amended European Shareholder Rights Directive. Under the legislation, shareholders will have a right to vote on the policy for directors’ remuneration. Subject to the provisions of the new legislation, it is the Remuneration Committee’s intention that the Directors’ Remuneration Policy will continue to apply until the 2020 Annual General Meeting, unless the Remuneration Committee seeks shareholder approval for a renewed policy at an earlier date.
Remuneration strategy, policy and purposeThe Directors’ Remuneration Policy is based on attracting, retaining and motivating executives to ensure that they perform in the best interests of the Group and its shareholders by growing and developing the business over the long-term. Performance related elements of remuneration are designed to form an appropriate portion of the overall remuneration package of Executive Directors and link remuneration to business performance and individual performance, while aligning the interests of Executive Directors with those of shareholders.
The Directors’ Remuneration Policy focuses on incentivising the successful implementation of our corporate strategy, consistent with our risk management framework. This strategy aims to deliver sustainable, superior earnings growth, solid financial stewardship and total shareholder return performance for our shareholders over the long-term through the strong performance of high-quality and committed leadership who are critical to the future development of the Group.
The Group Key Performance Indicators (KPIs), which are detailed on pages 14 and 15, underpin the selection of performance criteria used within the incentive arrangements. We have provided specifics in summary form on the individual elements of the remuneration packages for Executive Directors including personal objectives on the following pages.
Section A: Directors’ Remuneration Policy 2018-2020

Glanbia plc | Annual Report and Financial Statements 2018
84
> Director’s Report
Element Objective Description, Performance Measures and Maximum Value
Shareholding Requirement Minimum share ownership requirements to be built up over a five-year period.
Ensure a greater alignment with shareholders’ interests.
Executive Directors are expected to build a shareholding through the vesting of shares under the Group’s schemes.
The Group Managing Director is required to build and maintain a shareholding of 250% of base salary over a maximum of five years. Other Executive Directors are required to build up and maintain a shareholding of 150% of base salary over a maximum of five years.
Existing shareholdings and shares acquired in the market are also taken into account, and although share ownership guidelines are not contractually binding, the Remuneration Committee retains the discretion to withhold future grants under the 2018 LTIP if Executive Directors do not comply with the guidelines.
Long-Term Performance Related Incentive (variable) Long Term Incentive Plan under which shares are granted in the form of a provisional allocation of shares for which no exercise price is payable
To align the interests of Executive Directors and shareholders through a long-term share-based incentive linked to share ownership and holding requirements.
To focus on greater alignment with shareholders, long-term retention and reward for sustainable performance.
Long-Term Incentive individual annual share award level ordinarily cannot exceed 250% of base salary, dependent on the level of job responsibilities and with reference to companies of similar size and complexity in Europe and US. This may vary where necessitated by the recruitment or retention of key Executives as determined by the Remuneration Committee.
• Group Managing Director, maximum award level of 250%. • For all other Executive Directors, maximum award level of 200%.
The Remuneration Committee annually reviews and determines the financial metrics. The 2019 share award is to be determined by reference to the following performance metrics with weightings varying dependent on the job responsibilities as set out below:
• Group adjusted EPS;• Group ROCE;• relative TSR against the STOXX Europe 600 Food and Beverage Index;• business segment EBITA; and• business segment ROCE.
For all performance metrics, 25% vests at threshold performance and 100% vests at maximum with straight line vesting in between these levels.
The 2019 share award is to be determined by reference to three performance metrics for the Group Managing Director and Group Finance Director:
• 40% based on Group adjusted EPS;• 40% based on Group ROCE; and• 20% based on relative TSR against the STOXX Europe 600 Food and Beverage Index. For business segment Executive Directors the weighting of the 2019 share award is to be:
• 30% based on Group adjusted EPS;• 25% based on Group ROCE;• 15% based on relative TSR against the STOXX Europe 600 Food and Beverage Index;• 20% based on business segment EBITA and;• 10% based on business segment ROCE.
The extent of vesting shall be dependent on the level of achievement, measured over a three-year period, of the relevant performance conditions. The Remuneration Committee has the discretion to change the performance criteria (including the measures, their weighting and calibration) where deemed appropriate. Any changes to these performance conditions will be disclosed in the Remuneration Committee Report which will be subject to a general shareholder non-binding advisory vote. Quality of earnings review/underpin will continue to be exercised at the discretion of the Remuneration Committee. Calibration details for business segment EBITA and business segment ROCE are considered to be commercially sensitive, but will include significant stretch and targets will be based on a mix of market and budget expectations.
A share award shall not vest unless the Remuneration Committee is satisfied that the Group’s underlying financial performance has shown a sustained improvement in the period since the date of grant.
Executive Directors will be required to hold shares received pursuant to the vesting of LTIP share awards for a minimum period of two years post vesting. LTIP share awards are subject to malus and clawback (during the two-year holding period following vesting), to the extent determined by the Remuneration Committee as outlined in Note 1 below.
Note 1: Malus and clawback – The Committee may, at any time within two years of an LTIP share award or Annual Deferred Incentive vesting, determine that malus and clawback shall apply if the Committee determines that there was a material misstatement of the financial statements of the Company upon which the performance targets were assessed or an erroneous calculation was made in assessing the extent to which performance targets were met. Additionally, the Committee can determine at any time within two years of an LTIP share award or Annual Deferred Incentive vesting that malus and clawback will apply if an award holder is found guilty, or pleads guilty, to a crime which causes reputational damage; or an award holder is guilty of serious misconduct or gross negligence which causes loss or reputational damage.
Remuneration Committee Report continued

Glanbia plc | Annual Report and Financial Statements 2018
85
Executive Director employment conditionsThe Remuneration Committee adopts a transparent framework when making Board appointments of either external or internal candidates.
Recruitment policy When recruiting new Executive Directors, the Group’s policy is to pay what is necessary to attract individuals with the skills and experience appropriate to the role to be filled, taking into account remuneration across the Group, including other senior executives, and that offered by other international food and nutritional companies and other companies of similar size and complexity. New Executive Directors will generally be appointed on remuneration packages with the same structure and pay elements as described in the table below. Each element of remuneration to be included in the package offered to a new Executive Director would be considered.
Element Description
Base salary (fixed) Base salary levels will be set in consideration of the skills, experience and expected contribution to the new role, the current salaries of other Executive Directors in the Group and current market levels for the role.
Pension (fixed) Will be considered in light of relevant market practice for the role, the retirement arrangements which are in place for the other Executive Directors and consideration by the Remuneration Committee of the new recruit’s package as a whole.
Other Benefits (fixed)
Will be considered in light of relevant market practice for the role and the provisions in place for other Executive Directors.
Short-Term Performance Related Incentive (variable)
The maximum level of short-term variable remuneration which may be granted to a new recruit is 150% (total maximum variable remuneration is 400%, annual and long term variable). This excludes any buyout share awards that might arise.
The Remuneration Committee will consider whether it is appropriate for the new recruit to participate in the same Annual Incentive plan applicable to the current Executive Directors. If this is considered appropriate, the same financial measures, weighting, payout scale and target and maximum incentive opportunity (as a percentage of base salary) which apply to the existing Executive Directors will generally apply to the new recruit.
Long-Term Performance Related Incentive (variable)
The maximum level of long-term variable remuneration which may be granted to a new recruit is 250% (total maximum variable remuneration is 400%, annual and long-term variable). This excludes any buyout share awards that might arise.
The award of long-term incentives will depend on the timing of the appointment and where this fits into the typical annual grant cycles.
In exceptional circumstances or where the Remuneration Committee determines that it is necessary for the recruitment or retention of key executives, the Remuneration Committee reserves the right to offer additional cash and/or share-based payments. Such payments may take into account remuneration relinquished when leaving the former employer and would reflect the nature, time horizons and performance requirements attached to that remuneration. The Remuneration Committee may also grant share awards on hiring an external candidate to buy out awards which will be forfeited on leaving the previous employer.
The Remuneration Committee’s approach to this matter is to carry out a detailed review of the awards which the individual will lose and calculate the estimated value of them. In doing so, the Remuneration Committee will consider the vesting period; the award exercise period if applicable; whether the awards are cash or share-based; performance related or not; the former employer’s recent performance and pay out levels and any other factors the Remuneration Committee considers appropriate. If a buyout share award is to be made, the structure and level will be carefully designed and will generally reflect and replicate the previous awards as accurately as possible. The award will be made subject to appropriate clawback provisions in the event that the individual resigns or is terminated within a certain time frame.
For an internal appointment, any variable pay element awarded in respect of the prior role may be allowed to pay out according to its terms, adjusted as relevant to take into account the appointment. In addition, any on-going remuneration obligations existing prior to appointment (which are inconsistent with the policy as disclosed herein) may continue, provided they are disclosed to the Remuneration Committee. The Remuneration Committee reserves the right to offer additional cash and/or share-based payments on an internal promotion when it considers this to be in the best interests of the Group and its shareholders.

Glanbia plc | Annual Report and Financial Statements 2018
86
> Director’s Report
Executive Director Service AgreementsThe Group has agreed a new three year, renewable, service agreement with the Group Managing Director, Siobhan Talbot, and the Group Finance Director, Mark Garvey, effective from January 1 2019. The service agreements are capable of being terminated by either party on not more than 12 months’ notice, provided however that no notice obligation for the executives shall be for a period longer than 6 months after the end of the initial three year contract period, if not renewed. The Group retains the sole right to terminate with pay in lieu of 12 months’ notice, or part thereof, at any time.
Furthermore the two Executive Directors have each agreed to enter into a separate, comprehensive, binding, post-termination non-solicit and non-compete agreement for a period of 12 months after ceasing employment with the Group, for which an amount equivalent to 12 months base salary is payable in monthly instalments in arrears.
Employment contracts for Executive Directors do not provide for any compensation for loss of office beyond payments in lieu of notice and therefore, except as may otherwise be required by Irish law, the amount payable upon termination is limited to a maximum of 12 months remuneration. If so required the Group reserves the right to make necessary payments in settlement of a Director’s statutory employment rights.
Exit pay policyThe Group’s exit pay policy for the variable pay of Executive Directors is as follows;• STIP awards will be paid out in accordance with plan rules with the
Remuneration Committee applying it’s discretion to allow all or part of STIP award to vest.
• LTIP awards In the event an Executive Director leaves for reasons of injury,
disability, redundancy or retirement by agreement with the Group, which the Remuneration Committee in its absolute discretion permits, any outstanding share awards issued under the 2018 LTIP will be pro-rated for time and performance and will vest at the end of the period subject to compliance with any separation agreement or protective covenants in force at that time and pro-rating of the share awards to reflect the reduced period of time between the commencement of the performance period and the early vesting. The Remuneration Committee can decide not to apply restrictions on sale or pro-rate a share award if it regards it as inappropriate to do so in particular circumstances.
In the event of a takeover, merger, scheme of arrangement or other similar event involving a change of control of the Company or a demerger of a substantial part of the Group, or a special dividend, or which has the effect of materially changing the Group’s business, or an Executive Director’s employment with the Group terminates by reason of a transfer of his/her employment to an entity outside the Group or other similar event that affects the Group’s shares to a material extent, share awards under the 2018 LTIP will vest early, subject to normal restrictions on sale and the pro-rating of the share awards to reflect the reduced period of time between the commencement of the performance period and the early vesting.
The Remuneration Committee can decide not to apply restrictions on sale or pro-rate a share award if it regards it as inappropriate to do so in the particular circumstances.
In all other circumstances, outstanding share awards under the 2018 LTIP will lapse. Any outstanding share awards under the 2008 LTIP will vest in accordance with the 2015-2017 Remuneration Policy.
• Other payments, such as legal or other professional fees, relocation or outplacement costs, may be paid if it is considered appropriate and is at the absolute discretion of the Remuneration Committee.
Policy on external Board appointments The long-standing policy of allowing Executive Directors to hold external Non-Executive Directorships with the prior approval of the Remuneration Committee will continue. The Remuneration Committee considers that external directorships provide the Group’s Executive Directors with valuable experience that is of benefit to Glanbia. The Remuneration Committee believes that it is reasonable for the individual Executive Director to retain any fees received from such appointments given the additional personal responsibility that this entails. During the year ended 29 December 2018, Siobhán Talbot was appointed as a Non-Executive Director to the board of CRH plc effective from 1 December 2018, for which Siobhán receives an annual fee of €93,000. Siobhán Talbot also holds a position on the IBEC board, for which she does not receive any fee. The other Executive Directors have no external directorships and no other fees earned.
Consideration of employment conditions elsewhere in the Group The Remuneration Committee considers all employees across the Group when establishing and implementing policy for Executive Directors. Senior and high-performing individuals within the organisation are invited to participate in both annual and long-term incentive arrangements. Similar to the Executive Directors, incentives are calibrated to provide appropriate rewards only on the achievement of superior performance. In addition, senior executives below Board level may be eligible to participate in restricted stock awards as part of the annual LTIP grant, as a retention measure.
The Remuneration Committee does not consult directly with employees when formulating Executive Director pay policy. However, it does solicit and take into account information provided by the Group Human Resources function and the independent external advice from Willis Towers Watson, Remuneration Advisers.
Remuneration Committee Report continued

Glanbia plc | Annual Report and Financial Statements 2018
87
Remuneration Below Executive DirectorsThe Group’s remuneration principles and policy underpin remuneration practice across the Group. Below the level of the Executive Directors, similar principles and policy framework, as outlined in the preceding pages, cascade as far as possible, taking account of seniority and relevant local market practice.
The table below outlines the reward elements which apply to employees across the Group depending on their level of seniority and market location.
Element Description
Base salary (fixed) Set by reference to role responsibilities relative to the relevant local market based on external independent market data against appropriate peer companies. Reviewed annually in consideration of personal performance with any change of pay approved by a member of the Group Operating Executive.
Pension (fixed) Employees participate in retirement benefits applicable to their local market and in line with relevant scheme rules and Company practice.
Other Benefits (fixed)
Employees participate in other benefits applicable to their local market and in line with relevant rules and Company practice. Examples may include car benefit, illness benefit, medical insurance, relocation expenses/payments.
Short-Term Performance Related Incentive (variable)
The Annual Incentive potential is based on appropriate and specific Business Unit measures, as determined by the Remuneration Committee. For designated senior executives, deferral of the proportion of the Annual Incentive earned in excess of 75% of base salary which, once the appropriate taxation and social security deductions have been made, will be invested in shares in the Company and delivered two years following this investment.
Long-Term Performance Related Incentive (variable)
The Long-Term Incentive plan is focused on key Group financial metrics and TSR. Additionally, where relevant, appropriate specific Business Unit measures, as determined by the Remuneration Committee, emphasise long-term Business Unit achievement. The Remuneration Committee may also award a portion of the LTIP award as restricted stock, focusing on individual performance over the performance period. A one year holding period applies below Executive Directors.
Non-Executive Directors RemunerationThe Directors’ Remuneration Policy for the Group Chairman and Non-Executive Directors is summarised below:
Element Objective Description
Annual Fees Recognise market value of role, job size, responsibility and reflects individual skills and experience.
Set by reference to the relevant market median based on an external independent evaluation of comparator companies of a similar scale and complexity. Reflects a fee for the role of Non-Executive Director and additional fees reflecting responsibilities for chairmanship of a committee of the Board. Reviewed from time to time by the Remuneration Committee and the Board. Any reviews usually take effect from 1 January in the relevant year.
Benefits and Expenses
Reimburse role based expenses incurred during performance of the duties of the role.
No additional benefits are provided other than direct expenses relating to the role. Such expenses may include travel in the course of the role for the Group.
Non-Executive Director feesThe remuneration for each of the four Independent (of the Society) Non-Executive Directors was increased by €15,000 effective from 1 January 2018. The fee for the Society Nominated Non-Executive Directors was increased by €7,500 effective from 1 January 2018.
Role2019
€2018
€
Group Chairman 112,500 112,500Vice-Chairmen 60,000 60,000Senior Independent Director 95,000 95,000Audit Committee Chairman/Remuneration Committee Chairman 95,000 95,000Non-Executive Director 85,000 85,000Society-nominated Non-Executive Director 42,500 42,500
The Non-Executive Directors do not have service contracts, but have letters of appointment detailing the basis of their appointment. The terms and conditions of appointment of Non-Executive Directors are available for inspection at the Company’s registered office during normal business hours and at the AGM of the Company.
The Non-Executive Directors do not have periods of notice and the Group has no obligation to pay compensation when their appointment terminates in accordance with their letters of appointment. They are subject to annual re-election at the AGM of the Company.

Glanbia plc | Annual Report and Financial Statements 2018
88
> Director’s Report
Section B: Directors’ Remuneration Implementation ReportExecutive Directors’ Remuneration Elements 2018The Remuneration elements and 2018 delivery for the four Executive Directors is summarised in the table below.
Fixed pay Annual incentive Long-term incentive
Base salaryUp to 150% of base salary for maximum performance
Group CEO, 250% Other Executive Directors, 200%
(% of base salary)Pension
Other benefits
Measured by Adjusted EPS, Group OCF, Personal Objectives and
where relevant Business Segment EBITA
Measured by Adjusted EPS, Group ROCE, TSR and where relevant
Business Segment EBITA & Business Segment ROCE
Base salary increase effective 1 January 2019
Annual Incentive payments for FY 2018
Long-term Incentive 2016 vesting
Fixed pay Annual incentive
Executive Directors Full YearBase salary
€’000
Pension Contribution1
€’000Other Benefits2
€’000
Annual Incentive (paid in cash)3
€’000
Annual Incentive(paid in Shares)4
€’000
S Talbot 2018 860 – 283 645 5532017 811 – 267 608 263
M Garvey 2018 506 126 33 379 3252017 477 119 29 358 154
H McGuire 2018 513 – 212 384 2692017 500 – 626 375 119
B Phelan 2018 447 – 156 335 2552017 422 – 141 316 92
Details of Directors’ 2008 LTIP share awards granted in 2016 expected to vest in respect of performance to 29 December 2018 are set out on pages 92 to 94.
Further explanatory notes relating to each remuneration element follow.
1. Mark Garvey participates in the Glanbia defined contribution plan with a contribution in 2018 of €126,405.2. Other benefits also include car, healthcare, permanent health insurance and life assurance benefits. Pension – Other benefits for 2018 includes taxable payments in lieu of personal future service pension benefit, representing 26.5% of base salary, made to Siobhán Talbot and Brian Phelan
of €227,810 and €118,456 respectively, both of whom are deferred members of the Glanbia defined benefit scheme. Hugh McGuire received a taxable non-pensionable allowance of 25% of base salary in lieu of a pension contribution of €128,125.
LTIP Tax – during the vest period, 2015 to 2018 inclusive, Hugh McGuire worked in the US as well as in Ireland resulting in a double tax for Hugh McGuire in respect of certain taxes on his LTIP 2015 vested award. Accordingly, per his LTIP 2014 award, the Remuneration Committee agreed to make an equalisation payment to him of gross €29,462. This reimbursement did not result in any increase in Hugh McGuire’s post-tax income. A further gross amount of €7,773 was paid to Hugh McGuire in respect of double tax on his LTIP 2014 award to reflect a blended tax rate for 2017 of 4.35% resulting from a change in Illinois state tax from 3.75% to 4.95% at the time of the 2014 award vest, July 2017.
3. This reflects the proportion of the Annual Incentive payable in cash to Executive Directors in respect of performance for full year 2018 performance (which amount to maximum 75% of base salary). 2018 annual incentive payments will be paid through salary in 2019.
4. This reflects the proportion of the gross Annual Incentive (over 75% of base salary) which will be invested in shares in the Company, following appropriate taxation and social security deductions. Those made in 2019 will be delivered to Executive Directors two years following this investment (2021).
Executive Director Remuneration Payments 2018Further details of actual 2018 payments are set out in the subsequent table and later in this report.
Remuneration Committee Report continued

Glanbia plc | Annual Report and Financial Statements 2018
89
Base salary 2018The Remuneration Committee resolved to increase the base salaries of the Group Managing Director, Group Finance Director and CEO Glanbia Nutritionals over 2017 and 2018 as outlined in the Remuneration Report 2017.
The Group Managing Director, Group Finance Director and CEO Glanbia Nutritionals increased on a phased basis by 6% effective 1 January 2017 and a further 6% effective 1 January 2018 bringing base salaries to €859,660, €505,620 and €447,002 respectively. The base salary of CEO Glanbia Performance Nutrition was increased by 2.5% annually over the same period, resulting in a base salary of €512,500 effective 1 January 2018.
The base salary increase for the broader employee population for 2018 was in a range of 2.5% to 7%.
The following table sets out the closing 2018 base salary for each of the Executive Directors.
Executive DirectorsClosing 2018 Base salary
Change in salary % increase from
2017
S Talbot €859,660 6.00%M Garvey €505,620 6.00%H McGuire €512,500 2.50%B Phelan €447,002 6.00%
Base salary 2019The base salaries of the CEO Glanbia Performance Nutrition and CEO Glanbia Nutritionals will increase in line with the standard 2.5% increase in Ireland, where they are all based, to €525,313 and €458,177 respectively effective 1 January 2019.
Further to the new three year, renewable, service agreement with the Group Managing Director as well as the additional responsibilities of the Group Finance Director, the Remuneration Committee, through its advisors, undertook market benchmarking of remuneration for these roles, taking into account Irish, UK and USA equivalents. Their respective base salaries will increase to €1,050,000 and €581,000 effective from 1 January 2019. This adjustment brings their total remuneration more in line with the estimated median of total remuneration for equivalent size roles and responsibilities across our target geographies of USA, UK and Ireland.
Pension 2018Mark Garvey participates in a defined contribution retirement plan, to which contributions are made at an agreed rate of 25%.
Other benefits 2018This includes employment related benefits such as the use of a company car or equivalent, payment in lieu of personal future service pension benefit, medical/life assurance, tax equalisation payments and relocation or other business related allowances where appropriate. All benefits are subject to normal deductions per the relevant regulations.
Siobhán Talbot and Brian Phelan are no longer accruing personal pension benefits from the Glanbia defined benefit pension schemes, effective 1 January 2012 and 4 January 2015 respectively. As a result of the cap on pension benefits introduced in the Irish Finance Act 2006, and subsequently amended in December 2010 and in December 2013, the Remuneration Committee reviewed the pension arrangements for Executive Directors and agreed to offer the option to receive a taxable payment (26.5% of base salary) in lieu of the personal future service pension benefit. As agreed by the Remuneration Committee, Hugh McGuire received a taxable non-pensionable allowance of 25% of base salary in lieu of a pension contribution to the Glanbia defined contribution retirement plan.

Glanbia plc | Annual Report and Financial Statements 2018
90
> Director’s Report
Annual incentive 2018The Group’s Executive Directors participate in a performance related Annual Incentive scheme, which aims to reward achievement of specific short-term performance metrics determined by the Remuneration Committee annually and reviewed periodically during the year. Other senior executives below the Group’s Executive Directors also participate in this scheme, albeit at different participation levels. The performance metrics consider collective business performance and individual performance. The Committee believes that this method of performance measurement and assessment is objective, transparent, rigorous and balanced, and provides an appropriate means to evaluate annual performance.
It also ensures that all senior management in the Group are aligned to the same annual goals in the best interest of the Group and the shareholders.
The table outlines the 2018 Annual Incentive design for each Executive Director and respective weightings. It also details the full year 2018 actual incentive outcome as a percentage of salary.
Annual Incentive Weighting
Executive Directors Adjusted EPS Group OCFPersonal
ObjectivesBusiness
segment EBITA TotalAnnual Incentive
Opportunity
2018 Actual Incentive
Outcome as a % of Maximum Opportunity
S Talbot 56% 24% 20% – 100% 0%-150% 92.8%M Garvey 56% 24% 20% – 100% 0%-150% 92.8%H McGuire 40% 20% 20% 20% 100% 0%-150% 84.9%B Phelan 40% 20% 20% 20% 100% 0%-150% 88.0%
For the financial year to 29 December 2018, each Executive Director could earn up to 150% of base salary for maximum performance measured against growth in adjusted EPS on a constant currency basis, Operating Cash Flow (OCF) on a constant currency basis, individual performance objectives and where relevant business segment EBITA for Executive Directors with Business Unit responsibility. The mix of weightings for all objectives at target reflected 15% of base salary for personal objectives and 60% of base salary for business objectives (EPS, OCF and business segment EBITA where relevant), doubling at maximum performance to 30% of base salary for personal objectives and 120% of base salary for business objectives. Both personal and business objectives are specific and measurable, determined and communicated at the start of the financial year. The mix and weighting of objectives recognises each Executive Director’s contribution to the Group.
Personal objectives are aligned with the Group strategy reflecting personal contribution to the achievement of both medium and long-term strategic objectives all relating to: organisational effectiveness, the execution of the strategic growth plan and driving innovation capability. Progress was made on all fronts and this is reflected in the personal objectives achievement included in the 2018 Annual Incentive outcomes.
Key Business Objectives 2018The table below summarises the achieved performance in 2018 in respect of the primary measures used in the determination of Annual Incentive, together with an indication of actual performance relative to target.
Performance Assessment in 2018
Below Threshold
(zero vesting)
Threshold to Target
(pro-rata vesting)
Target
(100% vesting)
Target to Maximum
(pro-rata vesting)Maximum
(200% vesting)
Adjusted EPS Growth1
Group OCF (€’m)2
GN EBITA (and relevant Joint Ventures)GPN EBITA
1. Adjusted EPS growth is measured on a constant currency basis to reflect the underlying performance of the Group. For 2018 the Executive Directors’ targeted constant currency adjusted EPS growth of 5% with a maximum incentive achieved at 9%. The 2018 outcome was 9% adjusted to 8.3% when the impact of acquisitions during the year is excluded.
2. OCF is defined as EBITDA plus or minus the movement in working capital less business-sustaining capital expenditure. Similar to Adjusted EPS, OCF is measured on a constant currency basis. For 2018 the Executive Directors targeted constant currency OCF of €265.5 million with a maximum incentive achieved at €306.4 million. The 2018 outcome was €301.7 million adjusted to €304.9 million when the impact of acquisitions during the year is excluded.
Remuneration Committee Report continued

Glanbia plc | Annual Report and Financial Statements 2018
91
Key Personal Objectives 2018Personal objectives are aligned with the Group strategy reflecting the Executive Director’s personal contribution to organisational effectiveness, the execution of the strategic growth plan and driving innovation capability. The Group Managing Director set the personal performance objectives for each of the other Executive Directors, with the Group Managing Director’s personal objectives set by the Chairman in conjunction with the Remuneration Committee. All personal objectives were then agreed with the Remuneration Committee who monitored their progress throughout the year.
Name and position Objective Achievement
Siobhán Talbot Group Managing Director
Organisation Effectiveness
• Embed, with the Group Operating Executive, the purpose, vision and values system across the organisation
• Deliver, with the Group Operating Executive, a high performing team ensuring capability development and succession plans are in place for key roles across the Group
• Deliver market guidance volume growth of mid-to-high single digit in GN Nutritional Solutions and GPN like-for-like branded volumes
Strategic Growth Plans
• Deliver a successful Capital Markets event outlining the longer term ambition for the Group
• Drive with the business unit segment CEOs the organic growth agenda of the businesses extending global footprint, commercial channel and product portfolios
• Execute accretive M&A opportunities in both GPN and GN
• Evolve with the GN CEO the strategy for US Cheese encompassing the US Cheese joint ventures
Driving Innovation Capability
• Evolve the innovation strategy across the Group aligning this strategy to the overall Group ambition
Mark Garvey Group Finance Director
Organisation Effectiveness
• Sustain focus on operating cash flow conversion and working capital management
• Focus on cost optimisation across the Group
• Report to the Audit Committee ensuring compliance and risk mitigation in key financial areas
Strategic Growth Plans
• Support the Group Operating Executive in exploring and executing acquisition and development opportunities within GPN, GN and the joint ventures
• Deliver a successful Capital Markets event outlining the longer term Group ambition across key financial metrics
Hugh McGuireCEO Glanbia Performance Nutrition
Organisation Effectiveness
• Deliver like-for-like branded revenue growth
• Refine the operating model for growth in markets outside the US
• Development of a high performing team, skills and capabilities
Strategic Growth Plans
• Evolve the strategy for Body & Fit acquisition and the overall GPN direct-to-consumer strategy
• Develop the omni-channel strategy for GPN in the US and other markets
• Execute M&A strategy
Driving Innovation Capability
• Deliver innovation as % of 3 year rolling revenue
Brian PhelanCEO Glanbia Nutritionals
Organisation Effectiveness
• Development of a high performing team, skills and capabilities
• Deliver mid to-high-single digit volume growth in GN Nutritional Solutions
• Deliver growth in the non-dairy component of GN Nutritional Solutions
Strategic Growth Plans
• Evolve the strategy for US Cheese
• Deliver strategic projects in US Cheese joint ventures
• Execute M&A strategy in GN Nutritional Solutions
Driving Innovation Capability
• Develop the strategic positioning of GN Nutritional Solutions protein business in the healthy snacking arena
Bonus impact
2018 personal objectives at maximum: 30% 2018 actual outcome: 27%
Bonus impact
2018 personal objectives at maximum: 30% 2018 actual outcome: 27%
Bonus impact
2018 personal objectives at maximum: 30% 2018 actual outcome: 27%
Bonus impact
2018 personal objectives at maximum: 30% 2018 actual outcome: 28%
On Track Partial Achievement Off Track

Glanbia plc | Annual Report and Financial Statements 2018
92
> Director’s Report
Long-Term Incentive Awards 2016The 2008 LTIP share awards granted on 25 February 2016 had a three-year performance period (2016 to 2018) which ended on 29 December 2018. Under the 2008 LTIP, the 2016 share award incorporated business segment performance conditions as well as Group performance conditions, with the mix and weighting of performance conditions depending on the Executive Director’s responsibilities in the Group. Both the Group and business segment performance conditions for the 2016 share awards are measured in respect of performance in the three-year period and independently verified by external advisers on behalf of the Remuneration Committee.
The Remuneration Committee has agreed that, in implementing the policy for 2015-2017, in the event of a material acquisition or disposal which was unforeseen at the time of setting LTIP metrics, the calibration of the performance conditions for the Group and Business Unit may be adjusted by the Committee for the impact of the acquisition or disposal during the performance period. The principle for such review is that the impact of any transaction on the LTIP should not influence decision making to the detriment of the long-term strategy of the business; that the true underlying performance of the business is factored into any LTIP performance achievement; and that there is a balanced perception of appropriate reward levels and value creation by LTIP participants and shareholders over the long-term.
Acquisitions which were not foreseen at the time of setting LTIP 2016 targets and therefore require adjustment on determining vesting include Body & Fit and Amazing Grass in 2017 and SlimFast in 2018.
Following the Dairy Ireland transaction, completed on 2 July 2017, Group performance for 2016 was restated to exclude the Dairy Ireland businesses and allow like for like comparison for continuing operations. The 2016 LTIP was also amended by the Remuneration Committee to reflect the disposal of Dairy Ireland in accordance with the principles applying to acquisitions and disposals in the 2015-2017 LTIP plan. Consequently through the Directors’ Remuneration Policy 2018-2020 the Remuneration Committee consulted with shareholders and subsequently secured shareholder approval for the LTIP 2018 EPS performance condition to be measured using constant currency to more accurately reflect underlying earnings performance and remove any distortionary effect of currency volatility.
As the same circumstances arose in respect of the 2016 and 2017 inflight LTIP awards, arising from adjusting for disposals, the Remuneration Committee under LTIP Rule 5.2 has agreed to apply constant currency for the EPS condition of inflight LTIP awards, namely LTIP awards made in 2016 and 2017. This reinforces the emphasis on achievements through actual underlying performance.
For the Group Managing Director and Group Finance Director the 2016 LTIP performance conditions were: growth in annual adjusted EPS, Group ROCE and the Group’s relative TSR measured against a peer group of the STOXX Europe 600 Food & Beverage Index. The CEO Glanbia Nutritionals and CEO Glanbia Performance Nutrition are also incentivised through these Group performance conditions as well as business segment ROCE and business segment EBITA. The table below outlines the relative weighting of the 2016 share award performance conditions for each of the Executive Directors.
2008 Long-Term Incentive Plan 2016 share award
Executive Directors
Adjusted EPS growth
(constant currency) Group ROCETSR ranking In the comparator group
Business segment EBITA
Business segment ROCE
S Talbot 50% 30% 20% n/a n/aM Garvey 50% 30% 20% n/a n/aH McGuire 40% 15% 15% 20% 10%B Phelan 40% 15% 15% 20% 10%
Comparison of overall performance and payThe graph below illustrates the value over the last five years of €100 invested in Glanbia plc compared with that of €100 invested in the STOXX Europe 600 Food and Beverage Index. The return from the hypothetical €100 invested in Glanbia plc shares over the five years is €154.85 (inclusive of the original investment) versus the Index of €141.42.
2014
GlanbiaSTOXX Europe 600 Food and Beverage Index
€100
€150
2015 2016 2017 2018
€200
Glanbia plc STOXX Europe 600 Food and Beverage Index
Remuneration Committee Report continued

Glanbia plc | Annual Report and Financial Statements 2018
93
2008 LTIP – 2016 share award vestingThe following table outlines the relevant threshold, maximum and actual vesting outcome for the 2008 LTIP scheme, for the 3-year performance period 2016-2018.
Performance Condition Threshold (25% vesting) Maximum (100% vesting) Actual
Group EPS Three-year adjusted EPS growth equal to 6% CAGR
Three-year adjusted EPS growth equal to or greater than 12% CAGR
Three-year adjusted EPS growth equal to 9.96% CAGR Vesting 74.5%
Group ROCE Three-year simple ROCE average equal to 11.43%^
Three-year simple ROCE average equal to 13.43%^
Three-year simple ROCE average 12.61% Vesting 69.6%
Group TSR Ranked at the median of the STOXX Europe 600 Food & Beverage Index
Ranked in the top quartile of the STOXX Europe 600 Food & Beverage Index
Ranked below median Vesting 0%
Glanbia Performance Nutrition ROCE
Three-year simple ROCE average equal to the defined target %*
Three-year simple ROCE average equal to the defined maximum %*
Vesting 33.7%
Glanbia Nutritionals ROCE
Three-year simple ROCE average equal to the defined target %*
Three-year simple ROCE average equal to the defined target %*
Vesting 27.2%
Glanbia Performance Nutrition EBITA
Growth over Base EBITA average equal to the defined target %*
Growth over Base EBITA average equal to the defined maximum %*
Vesting 25.9%
Glanbia Nutritionals EBITA
Growth over Base EBITA equal to the defined target %*
Growth over Base EBITA average equal to the defined maximum %*
Vesting 0%
^ Group ROCE adjustment from 12% to 14% to account for acquisitions unforeseen at the time of target setting. * Commercially sensitive information.
2008 LTIP – 2016 share award vestingIt is expected that share awards granted to Executive Directors in 2016, under the 2008 LTIP scheme, for the three-year performance period 2016-2018, will vest in March 2019 as follows:
Executive Directors Full share awardPercentage outcome %
Number of shares awarded expected
to vest in 2019 Estimated
market value1
S Talbot 103,790 58.1% 60,334 €986,461M Garvey 44,280 58.1% 25,741 €420,865H McGuire 54,040 48.8% 26,368 €431,117B Phelan 43,180 43.0% 18,551 €303,309
1. This reflects the value of 2008 LTIP share awards expected to vest in 2019 with a three-year performance period ended in 2018. The market values have been estimated using the official closing price of a Glanbia plc share on 28 December 2018 (being the last day of trading of the Euronext Dublin in 2018) of €16.35.

Glanbia plc | Annual Report and Financial Statements 2018
94
> Director’s Report
MethodologyThe Remuneration Committee has agreed to the following adjustments for the purposes of determining the vesting of LTIP 2016:• Acquisitions which were not foreseen at the time of setting LTIP
2016 targets are adjusted for on determining vesting. Relevant acquisitions include Body & Fit and Amazing Grass in 2017 and SlimFast in 2018. This adjustment impacts Group EPS, Group ROCE and relevant business segment EBITA and ROCE, by restating the threshold and maximum to maintain the performance metric range during the 3 year performance period.
• the EPS and business segment EBITA performance condition to be measured using constant currency to more accurately reflect underlying earnings performance and remove any distortionary effect of currency volatility.
Group EPS
The Group’s Compound Annual Growth Rate (CAGR) of adjusted EPS over the three-year performance period was a key LTIP metric for each Executive Director’s 2016 share award, representing 50% weighting for the Group Managing Director and Group Finance Director and a 40% weighting for business segment Directors. Adjusted EPS is calculated as the profit attributable to the equity holders of the Group before exceptional items and intangible asset amortisation (net of related tax), divided by the weighted average number of ordinary shares in issue during the year.
Investors consider adjusted EPS to be a key indicator of long-term financial performance and value creation of a public limited company. Therefore adjusted EPS is a key metric to incentivise long-term sustainable business performance.
The table below shows the Group’s reported adjusted EPS over the performance period from continuing operations. For the purpose of LTIP 2016 these reported adjusted EPS numbers are adjusted for acquisitions and constant currency in line with the methodology set out above.
2015 79.14c2018 91.01c
Group ROCE
Group ROCE over the three-year performance period represented a 30% weighting for the Group Managing Director and Group Finance Director and a 15% weighting for business segment Directors for the 2016 share award. ROCE is calculated as defined in 2016, as Group earnings before interest and amortisation (net of related tax) plus Glanbia’s share of results of Joint Ventures & Associates after interest and tax divided by Capital Employed. Capital Employed is calculated as the sum of the Group’s total assets plus cumulative intangible asset amortisation less current liabilities but excluding all financial liabilities, retirement benefit assets, cash and deferred tax balances. The impact of acquisitions on the 2016 Group ROCE performance condition adjusts the threshold and maximum by -0.57%.
Group TSR
The Group’s TSR ranking relative to an agreed peer group of STOXX Europe 600 Food & Beverage Index represents the change in the capital value of a listed/quoted company over a period, plus dividends reinvested, expressed as a plus or minus percentage of the opening value. Investors regard TSR as an important indication of both earnings and capital growth relative to other major companies in the same sector as well as ensuring that share awards only vest if there has been a clear improvement in the Group’s relative performance over the relevant period. Therefore TSR is a key metric to incentivise long-term sustainable business performance.
This metric attracts a 20% weighting for the Group Managing Director and Group Finance Director and a 15% weighting for business segment Executive Directors.
Business segment ROCE
Business segment Executive Directors have a 10% weighting associated with business segment ROCE over the three-year performance period for the 2016 share award. ROCE is calculated as business segment earnings before interest, tax and amortisation divided by Capital Employed. Capital employed is calculated as the sum of the business segment’s total assets less current liabilities, excluding all borrowings, cash and tax balances plus cumulative intangible asset amortisation.
The impact of acquisitions on the 2016 Glanbia Performance Nutrition ROCE performance condition adjusts the threshold and maximum.
Business segment EBITA
Business segment EBITA is calculated as business segment compounded growth over Base EBITA for the three-year performance period. This metric attracts a 20% weighting for business segment Executive Directors.
The EBITA outturn is adjusted for the impact of acquisitions on the 2016 Glanbia Performance Nutrition EBITA performance condition.
Remuneration Committee Report continued

Glanbia plc | Annual Report and Financial Statements 2018
95
Long-Term Incentive Awards 2017, 2018 and 2019The performance conditions and weightings for all outstanding share awards, 2017 awards under LTIP 2008 and 2018 and 2019 awards under LTIP 2018, are set out in the following tables.
Long-Term Incentive Awards 2017, 2018 and 2019 – performance conditionsThe performance conditions for all outstanding share awards (2017, 2018 and 2019) are set out in the table below.
Achievement against performance conditions is determined on a constant currency basis to more accurately reflect underlying earnings performance and remove any distortionary effect of currency volatility. Acquisitions which were not foreseen at the time of setting LTIP 2017 targets will be adjusted on determining vesting.
For 2018 LTIP awards onwards, performance targets are set with future acquisitions in–mind and are therefore reflective of the expected impact acquisitions may have on key performance conditions. This approach acknowledges the strategic importance of acquisitions to the Company’s long-term performance and strategy.
2017 Performance Metrics 2018 Performance Metrics 2019 Performance Metrics
Performance Condition Vesting 0%Vesting 25% (Threshold)*
Vesting 100% (Maximum)* Vesting 0%
Vesting 25% (Threshold)*
Vesting 100% (Maximum)* Vesting 0%
Vesting 25% (Threshold)*
Vesting 100% (Maximum)*
Group EPSThree-year adjusted EPS
< 5% CAGR
= 5% CAGR
≥ 12% CAGR
< 4% CAGR
= 4% CAGR
≥ 9% CAGR
< 4% CAGR
= 4% CAGR
≥ 9% CAGR
Group ROCE < 12% = 12% ≥ 14% < 10% = 10% ≥ 13% < 9% = 9% ≥ 12%
Group TSR Ranking in STOXX Europe 600 Food and Beverage Index
Below the median
At median
In the top quartile
Below the median
At median
In the top quartile
Below the median
At median
In the top quartile
GPN & GN ROCE** Below target
At target
At Maximum
Below target
At target
At Maximum
Below target
At target
At Maximum
GPN & GN EBITA** Growth over Base EBITA relative to the defined % per annum compounded
< defined %
= defined %
≥ defined %
< defined %
= defined %
≥ defined %
< defined %
= defined %
≥ defined %
* Straight line vesting between threshold performance and maximum performance.** Commercially sensitive information.
Long-Term Incentive Awards 2017, 2018 and 2019 – weightingsThe weightings for all outstanding share awards (2017, 2018 and 2019) are set out in the table below.
2017 Weightings 2018 Weightings 2019 Weightings
Performance Condition
Group Managing Director and Group Finance Director
Business segment Executive Directors
Group Managing Director and Group Finance Director
Business segment Executive Directors
Group Managing Director and Group Finance Director
Business segment Executive Directors
Group EPS 40% 30% 40% 30% 40% 30%
Group ROCE 40% 25% 40% 25% 40% 25%
Group TSR 20% 15% 20% 15% 20% 15%
GPN & GN ROCE n/a 10% n/a 10% n/a 10%
GPN & GN EBITA n/a 20% n/a 20% n/a 20%

Glanbia plc | Annual Report and Financial Statements 2018
96
> Director’s Report
2018 Share Awards granted under the LTIP 20182018 LTIP share awards were made to the Executive Directors on 26 April 2018 and will vest no earlier than 26 April 2021, subject to the achievement of TSR, EPS and ROCE performance conditions. For business segment Executive Directors, their long-term incentive weightings also include business segment EBITA and business segment ROCE as outlined in the table ‘Summary Executive Directors’ Remuneration Policy’ on page 83.
These share awards were made in line with the Directors’ Remuneration Policy presented to the AGM in April 2018. Performance is measured over a three-year period. The performance period will end on 2 January 2021. The shares are subject to a two-year holding period from date of vesting.
Executive DirectorsShare awards
granted April 2018
Market value
€1
Share award as a % of base salary at
29/12/2018
S Talbot 155,005 2,149,144 250%M Garvey 72,935 1,011,244 200%H McGuire 73,927 1,024,998 200%B Phelan 64,479 894,001 200%
1. These have been valued at the mean between the highest and lowest sale prices of a Glanbia plc share on 25 April 2018 (€13.865) the dealing day immediately preceding the date of grant.
Directors’ shareholdingsAs at 29 December 2018 the Executive Directors’ share ownership against the guidelines was as follows:
Executive Directors
Shares held as at 29 December
2018
% of base salary based on market
value as at 29 December
2018Shareholding
guidance
S Talbot 275,068 523% 250%M Garvey 63,421 205% 150%H McGuire 106,830 341% 150%B Phelan 163,495 598% 150%
DilutionShare awards granted under the 2008 LTIP, 2018 LTIP and the Annual Deferred Incentive are satisfied through the funding of employee benefit trusts which acquire shares in the market. The Company’s employee benefit trusts held 871,335 shares at 29 December 2018.
The exercise of share options under the 2002 LTIP (which expired in 2012) is satisfied by the allotment of newly issued shares. At 29 December 2018 the total number of shares which could be allotted under this scheme was 40,000 shares which represent significantly less than one percent of the issued share capital of the Company.
Implementation of policy in 2019The base salaries of Executive Directors as of the date of this report are set out on page 89.
Annual Incentive opportunity for Executive Directors and Senior Executives in 2019 will remain unchanged. Annual Incentive will continue to be contingent on meeting targets relating to EPS, Group Operating Cash flow, individual performance objectives and financial performance metrics tailored to business segment where relevant. The Remuneration Committee intends that the financial targets will include significant stretch and will be based on a mix of market expectations and budget expectations.
Vesting criteria for 2019 LTIP share awards will include proportional weighting for Group adjusted EPS, Group ROCE and relative TSR. Business segment EBITA and business segment ROCE is also included for business segment Executive Directors. The TSR performance metric will be reviewed in 2019 to determine if the index and methodology continues to be relevant to incentive performance.
The Remuneration Committee intends that the performance measures and targets will continue to include significant stretch to reflect the Group’s and external expectations of performance. There will also be an increased focus on executive retention and post termination non-compete restrictions.
All pension and other benefits will remain unchanged.
Review of Committee performanceThe Committee reviewed its performance covering its terms of reference, composition, procedures, contribution and effectiveness. As a result of that assessment, the Board and Committee is satisfied that it is functioning effectively and it has met its terms of reference.
Directors’ remuneration and interests in shares in Glanbia plcTables A to G give details of the Directors’ remuneration and interests in shares, etc. The tables give details of the Directors’ remuneration and interests in shares in Glanbia plc held by Directors and the Group Secretary and their connected persons as at 29 December 2018. There have been no changes in the interests listed in Tables B to G between 29 December 2018 and 20 February 2019.
The market price of the ordinary shares as at 29 December 2018 was €16.35 and the range during the year was €13.39 to €17.19. The average price for the year was €14.82.
Remuneration Committee Report continued

Glanbia plc | Annual Report and Financial Statements 2018
97
Table A: 2018 Directors RemunerationThe salary, fees and other benefits pursuant to the remuneration package of each Director during the year were:
Date of appointment/resignation, if applicableSalary €’000
Fees €’000
Pension contribution1
€’000
Other benefits2
€’000
Annual Incentive
paid in cash3 €’000
Annual Incentive deferred
into shares4 €’000
2018 Total
€’000
2017 Total
€’000
Executive DirectorsS Talbot 860 – – 283 645 553 2,341 1,949M Garvey 506 – 126 33 379 325 1,369 1,137
H McGuire 513 – – 212 384 269 1,378 1,620B Phelan 447 – – 156 335 255 1,193 971
2018 2,326 – 126 684 1,743 1,402 6,281
2017 2,210 – 119 1,063 1,657 628 5,677
Non-Executive DirectorsMn Keane – 90 – – – – 90 53J Murphy – 60 – – – – 60 45P Murphy – 53 – – – – 53 42P Ahern Ret. 1 June 2018 and Reapp 21 June 2018 – 40 – – – – 40 35
H Corbally Ret. 21 June 2018 – 49 – – – – 49 105P Coveney – 85 – – – – 85 70J Doheny Ret. 2 June 2017 and Reapp 1 June 2018 – 25 – – – – 25 15D Gaynor – 95 – – – – 95 80J Gilsenan Ret. 26 April 2017 – – – – – – – 11V Gorman – 43 – – – – 43 35T Grant Ret. 9 May 2016, Reapp 2 June 2017
and Ret. 1 June 2018 – 18 – – – – 18 20P Haran – 95 – – – – 95 80B Hayes Ret. 9 May 2016 and Reapp 2 June 2017 – 43 – – – – 43 20MI Keane Ret. 25 April 2018 – 13 – – – – 13 35M Merrick Ret. 26 April 2017 – – – – – – – 11D O’Connor – 95 – – – – 95 80E Power Ret. 9 May 2016 and Reapp 2 June 2017 – 43 – – – – 43 20
2018 – 847 – – – – 847
2017 – 757 – – – – 757
Total 2018 2,326 847 126 684 1,743 1,402 7,128
Total 2017 2,210 757 119 1,063 1,657 628 6,434
1. Mark Garvey participates in the Glanbia defined contribution plan with a contribution in 2018 of €126,405.2. Other benefits also include car, healthcare, permanent health insurance and life assurance benefits. Pension – Other benefits for 2018 includes taxable payments in lieu of personal future service pension benefit, representing 26.5% of base salary, made to Siobhán Talbot and Brian Phelan
of €227,810 and €118,456 respectively, both of whom are deferred members of the Glanbia defined benefit scheme. Hugh McGuire received a taxable non-pensionable allowance of 25% of base salary in lieu of a pension contribution of €128,125.
LTIP Tax – during the vest period, 2015 to 2018 inclusive, Hugh McGuire worked in the US as well as in Ireland resulting in a double tax for Hugh McGuire in respect of certain taxes on his LTIP 2015 vested award. Accordingly, per his LTIP 2014 award, the Remuneration Committee agreed to make an equalisation payment to him of gross €29,462. This reimbursement did not result in any increase in Hugh McGuire’s post-tax income. A further gross amount of €7,773 was paid to Hugh McGuire in respect of double tax on his LTIP 2014 award to reflect a blended tax rate for 2017 of 4.35% resulting from a change in Illinois state tax from 3.75% to 4.95% at the time of the 2014 award vest, July 2017.
3. This reflects the proportion of the Annual Incentive payable in cash to Executive Directors in respect of performance for full year 2018 performance (which amount to maximum 75% of base salary). 2018 annual incentive payments will be paid through salary in 2019.
4. This reflects the proportion of the gross Annual Incentive (over 75% of base salary) which will be invested in shares in the Company, following appropriate taxation and social security deductions. Those made in 2019 will be delivered to Executive Directors two years following this investment (2021).
Details of Directors’ long-term awards expected to vest in respect of performance to 29 December 2018 are set out on pages 92 to 94.

Glanbia plc | Annual Report and Financial Statements 2018
98
> Director’s Report
The pension benefits of each of the Executive Directors during the year were as follows:
Transfer value of increase in
accrued pension €’000
Annual pension accrued in 2018 in excess of inflation
€’000
Total annual accrued pension at 29 December
2018 €’000
S Talbot – – 159B Phelan – – 103
2018 – – 262
2017 – – 262
Table B: Directors’ and Secretary’s interests in ordinary shares in Glanbia plc
As at 29 December 2018
Ordinary Shares
As at 31 December 2017
Ordinary Shares*
DirectorsMn Keane 25,742 25,742J Murphy 7,283 7,283P Murphy 11,506 33,198S Talbot1 275,068 255,175P Ahern2 10,091 10,091P Coveney 3,900 3,900J Doheny3 16,159 11,596M Garvey1 63,421 38,429D Gaynor 10,000 10,000V Gorman 5,033 5,033P Haran 7,462 7,462B Hayes 32,346 32,346H McGuire1 106,830 100,606D O’Connor 7,680 7,680B Phelan1 163,495 153,059E Power 58,693 58,693
SecretaryM Horan 39,313 27,162
* or at date of original appointment to the Board.
1. Executive Director.2. Retired 1 June 2018 and re-appointed 21 June 2018.3. Re-appointed 1 June 2018.
Note: The ordinary shares held in trust for the Directors and Secretary disclosed in Table C on page 99 are included in the total number of ordinary shares held by the Directors and Secretary above.
Remuneration Committee Report continued

Glanbia plc | Annual Report and Financial Statements 2018
99
Table C: Directors’ and Secretary’s interests in ordinary shares in Glanbia plc subject to restriction
2008 LTIP2
2016 Annual Deferred Incentive3
2017 Annual Deferred Incentive4 Total1
Executive DirectorsS Talbot 44,937 13,839 9,893 68,669M Garvey 19,174 8,261 5,818 33,253H McGuire 17,792 10,928 4,493 33,213B Phelan 12,989 4,914 3,447 21,350
SecretaryM Horan 8,876 4,284 3,275 16,435
1. The above ordinary shares are held on trust for the Directors and Secretary by the Glanbia plc Section 128D Employee Benefit Trust and are included in the total number of ordinary shares held by the Directors and Secretary disclosed in Table B on page 98.
2. Subject to restriction on sale until 25 May 2020.3. Subject to restriction on sale until 28 March 2019.4. Subject to restriction on sale until 29 March 2020.
Table D: Summary of Directors’ and Secretary’s interests in Glanbia plc 2018 and 2008 LTIP
As at29 December 2018
2018 LTIPshare awards1
As at29 December 2018
2008 LTIPshare awards
As at31 December 2017
2008 LTIPshare awards
DirectorsS Talbot 155,005 216,241 325,691M Garvey 72,935 97,191 143,891H McGuire 73,927 109,503 156,203B Phelan 64,479 89,957 135,457
SecretaryM Horan 35,341 44,062 65,512
1. 2018 LTIP was adopted on 25 April 2018.
Table E: Directors’ and Secretary’s interests in 2018 LTIP
Date of Grant
As at31 December
2017
Granted during
the year
Vested during
the year
Lapsed during
the year
As at29 December
2018
Market price at date
of award €
Earliest date for vesting
Expiry date Notes
DirectorsS Talbot
26-Apr-18 – 155,005 – – 155,005 13.86 26-Apr-21 26-Apr-23 1Total: – 155,005 – – 155,005
M Garvey26-Apr-18 – 72,935 – – 72,935 13.86 26-Apr-21 26-Apr-23 1
Total: – 72,935 – – 72,935
H McGuire26-Apr-18 – 73,927 – – 73,927 13.86 26-Apr-21 26-Apr-23 1
Total: – 73,927 – – 73,927
B Phelan26-Apr-18 – 64,479 – – 64,479 13.86 26-Apr-21 26-Apr-23 1
Total: – 64,479 – – 64,479
SecretaryM Horan
26-Apr-18 – 35,341 – – 35,341 13.86 26-Apr-21 26-Apr-23 1Total: – 35,341 – – 35,341
1. The performance period in respect of the 2018 LTIP awards made in 2018 is the three financial years ending 2020. The performance conditions attached to the awards are detailed in the section entitled ‘Long-Term Incentive Awards 2017,2018 and 2019 – performance conditions’ on page 95.

Glanbia plc | Annual Report and Financial Statements 2018
100
> Director’s Report
Table F: Directors’ and Secretary’s interests in 2008 LTIP
Date of Grant
As at31 December
2017
Granted during
the year
Vested during
the year
Lapsed during
the year
As at29 December
2018
Market price at date
of award €
Earliest date for vesting
Expiry date Notes
DirectorsS Talbot
18-May-15 109,450 – 84,047 25,403 – 17.53 18-May-18 18-May-19 1,2,325-Feb-16 103,790 – – – 103,790 18.47 25-Feb-19 25-Feb-20 423-Feb-17 112,451 – – – 112,451 18.05 23-Feb-20 23-Feb-21 5
Total: 325,691 – 84,047 25,403 216,241
M Garvey18-May-15 46,700 – 35,861 10,839 – 17.53 18-May-18 18-May-19 1,2,325-Feb-16 44,280 – – – 44,280 18.47 25-Feb-19 25-Feb-20 423-Feb-17 52,911 – – – 52,911 18.05 23-Feb-20 23-Feb-21 5
Total: 143,891 – 35,861 10,839 97,191
H McGuire18-May-15 46,700 – 35,239 11,461 – 17.53 18-May-18 18-May-19 1,2,325-Feb-16 54,040 – – – 54,040 18.47 25-Feb-19 25-Feb-20 423-Feb-17 55,463 – – – 55,463 18.05 23-Feb-20 23-Feb-21 5
Total: 156,203 – 35,239 11,461 109,503
B Phelan18-May-15 45,500 – 24,295 21,205 – 17.53 18-May-18 18-May-19 1,2,325-Feb-16 43,180 – – – 43,180 18.47 25-Feb-19 25-Feb-20 423-Feb-17 46,777 – – – 46,777 18.05 23-Feb-20 23-Feb-21 5
Total: 135,457 – 24,295 21,205 89,957
SecretaryM Horan
18-May-15 21,450 – 16,601 4,849 – 17.53 18-May-18 18-May-19 1,2,325-Feb-16 20,360 – – – 20,360 18.47 25-Feb-19 25-Feb-20 423-Feb-17 23,702 – – – 23,702 18.05 23-Feb-20 23-Feb-21 5
Total: 65,512 – 16,601 4,849 44,062
1. Share awards granted on 18 May 2015 were subject to performance conditions measured over the three financial years ended 30 December 2017. The awards vested on 25 May 2018 and the percentage of the awards vested for Executive Directors are shown on page 101.
2. Directors were permitted to sell sufficient shares to satisfy any tax and/or social security deductions arising on the vesting of the shares. The balance of the shares is restricted from sale for two years and are held on trust for them by the trustee of the Glanbia plc Section 128D Employee Benefit Trust.
3. The total number of shares subject to restriction are included in the total number of ordinary shares disclosed in Table B on Page 98.4. Share awards granted on 25 February 2016 were subject to performance conditions measured over the three financial years ended 29 December 2018. The outcome of these
performance conditions and the number of share awards expected to vest to Executive Directors during 2019 are set out on page 93. The vested share award, net of relevant tax, will be restricted from sale for two years and be held on trust for them by the trustee of the Glanbia plc section 128D Employee Benefit Trust.
5. The performance period in respect of the 2008 LTIP awards made in 2017 is the three financial years ending 2019. The performance conditions attached to the awards are detailed in the section entitled ‘Long Term Incentive Awards 2017,2018 and 2019 – performance conditions’ on page 95.
Remuneration Committee Report continued

Glanbia plc | Annual Report and Financial Statements 2018
101
Table G: Directors’ and Secretary’s Annual Deferred Incentive
Value of Annual Incentive
converted into shares
€1
Date of conversion/acquisition
of shares
Acquisition price per share at date
of conversion
Number of shares acquired
DirectorsS Talbot2016 Annual Deferred Incentive €465,000 28-Mar-17 €18.00 25,8342017 Annual Deferred Incentive €263,000 29-Mar-18 €14.22 18,468
M Garvey2016 Annual Deferred Incentive €278,000 28-Mar-17 €18.00 15,4222017 Annual Deferred Incentive €154,000 29-Mar-18 €14.22 10,862
H McGuire2016 Annual Deferred Incentive €290,000 28-Mar-17 €18.00 16,1202017 Annual Deferred Incentive €119,000 29-Mar-18 €14.22 8,387
B Phelan2016 Annual Deferred Incentive €165,000 28-Mar-17 €18.00 9,1732017 Annual Deferred Incentive €92,000 29-Mar-18 €14.22 6,436
SecretaryM Horan2016 Annual Deferred Incentive €144,000 28-Mar-17 €18.00 7,9982017 Annual Deferred Incentive €87,000 29-Mar-18 €14.22 6,114
1. Numbers are rounded to the nearest thousand.2. Directors were permitted to sell sufficient shares to satisfy any tax or social security deductions arising on the acquisition of the shares. The balance of the shares are restricted from sale
for two years and are held on trust for them by the trustee of the Glanbia plc Section 128D Employee Benefit Trust.3. The total number of shares subject to restriction are included in the total number of ordinary shares disclosed in Table B on Page 98.
Table H: Value of awards expected to vest in 2019 and awards vested in 2018
Number of shares awarded expected
to vest in 2019
Percentage outcome
%
Estimated market value
€1
Number of shares awarded vested
in 2018
Percentage outcome
%
Estimatedmarket value
€2
Executive DirectorsS Talbot 60,334 58.1% 986,461 84,047 76.8 1,267,429 M Garvey 25,741 58.1% 420,865 35,861 76.8 540,784 H McGuire 26,368 48.8% 431,117 35,239 75.5 531,404 B Phelan 18,551 43.0% 303,309 24,295 53.4 366,369
1. This reflects the value of long term incentive share awards expected to vest in 2019 with a three year performance period ended in 2018. The market values have been estimated using the official closing price of a Glanbia plc share on 28 December 2018 (being the last day of trading on the Euronext Dublin in 2018) of €16.35.
2. This reflects the value of long-term incentive share awards vested in 2018 with a three year performance period ended in 2017. These have been valued at the market value of the shares on the date of vesting €15.08 per share (official opening price).
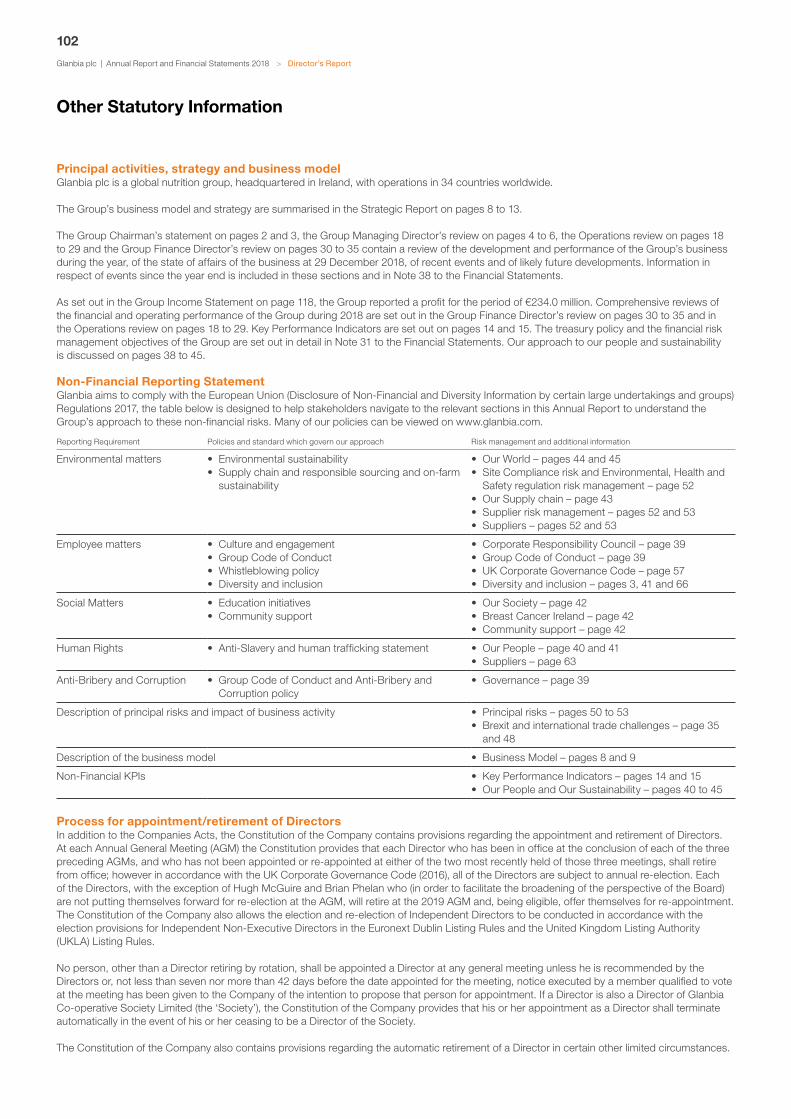
Glanbia plc | Annual Report and Financial Statements 2018
102
> Director’s Report
Principal activities, strategy and business model Glanbia plc is a global nutrition group, headquartered in Ireland, with operations in 34 countries worldwide.
The Group’s business model and strategy are summarised in the Strategic Report on pages 8 to 13.
The Group Chairman’s statement on pages 2 and 3, the Group Managing Director’s review on pages 4 to 6, the Operations review on pages 18 to 29 and the Group Finance Director’s review on pages 30 to 35 contain a review of the development and performance of the Group’s business during the year, of the state of affairs of the business at 29 December 2018, of recent events and of likely future developments. Information in respect of events since the year end is included in these sections and in Note 38 to the Financial Statements.
As set out in the Group Income Statement on page 118, the Group reported a profit for the period of €234.0 million. Comprehensive reviews of the financial and operating performance of the Group during 2018 are set out in the Group Finance Director’s review on pages 30 to 35 and in the Operations review on pages 18 to 29. Key Performance Indicators are set out on pages 14 and 15. The treasury policy and the financial risk management objectives of the Group are set out in detail in Note 31 to the Financial Statements. Our approach to our people and sustainability is discussed on pages 38 to 45.
Non-Financial Reporting StatementGlanbia aims to comply with the European Union (Disclosure of Non-Financial and Diversity Information by certain large undertakings and groups) Regulations 2017, the table below is designed to help stakeholders navigate to the relevant sections in this Annual Report to understand the Group’s approach to these non-financial risks. Many of our policies can be viewed on www.glanbia.com.
Reporting Requirement Policies and standard which govern our approach Risk management and additional information
Environmental matters • Environmental sustainability • Supply chain and responsible sourcing and on-farm
sustainability
• Our World – pages 44 and 45• Site Compliance risk and Environmental, Health and
Safety regulation risk management – page 52• Our Supply chain – page 43• Supplier risk management – pages 52 and 53• Suppliers – pages 52 and 53
Employee matters • Culture and engagement • Group Code of Conduct• Whistleblowing policy• Diversity and inclusion
• Corporate Responsibility Council – page 39• Group Code of Conduct – page 39• UK Corporate Governance Code – page 57• Diversity and inclusion – pages 3, 41 and 66
Social Matters • Education initiatives• Community support
• Our Society – page 42• Breast Cancer Ireland – page 42• Community support – page 42
Human Rights • Anti-Slavery and human trafficking statement • Our People – page 40 and 41• Suppliers – page 63
Anti-Bribery and Corruption • Group Code of Conduct and Anti-Bribery and Corruption policy
• Governance – page 39
Description of principal risks and impact of business activity • Principal risks – pages 50 to 53• Brexit and international trade challenges – page 35
and 48
Description of the business model • Business Model – pages 8 and 9
Non-Financial KPIs • Key Performance Indicators – pages 14 and 15• Our People and Our Sustainability – pages 40 to 45
Process for appointment/retirement of DirectorsIn addition to the Companies Acts, the Constitution of the Company contains provisions regarding the appointment and retirement of Directors. At each Annual General Meeting (AGM) the Constitution provides that each Director who has been in office at the conclusion of each of the three preceding AGMs, and who has not been appointed or re-appointed at either of the two most recently held of those three meetings, shall retire from office; however in accordance with the UK Corporate Governance Code (2016), all of the Directors are subject to annual re-election. Each of the Directors, with the exception of Hugh McGuire and Brian Phelan who (in order to facilitate the broadening of the perspective of the Board) are not putting themselves forward for re-election at the AGM, will retire at the 2019 AGM and, being eligible, offer themselves for re-appointment. The Constitution of the Company also allows the election and re-election of Independent Directors to be conducted in accordance with the election provisions for Independent Non-Executive Directors in the Euronext Dublin Listing Rules and the United Kingdom Listing Authority (UKLA) Listing Rules.
No person, other than a Director retiring by rotation, shall be appointed a Director at any general meeting unless he is recommended by the Directors or, not less than seven nor more than 42 days before the date appointed for the meeting, notice executed by a member qualified to vote at the meeting has been given to the Company of the intention to propose that person for appointment. If a Director is also a Director of Glanbia Co-operative Society Limited (the ‘Society’), the Constitution of the Company provides that his or her appointment as a Director shall terminate automatically in the event of his or her ceasing to be a Director of the Society.
The Constitution of the Company also contains provisions regarding the automatic retirement of a Director in certain other limited circumstances.
Other Statutory Information

Glanbia plc | Annual Report and Financial Statements 2018
103
Annual General MeetingThe Company’s 2019 AGM will be held on 24 April 2019. Full details of the 2019 AGM, together with explanations of the resolutions to be proposed, will be contained in the Notice of the 2019 AGM. The record date for the 2019 AGM is 5pm on 22 April 2019.
Powers of the DirectorsThe Directors are responsible for the management of the business of the Company and the Group and may exercise all powers of the Company subject to applicable legislation and regulation and the Constitution of the Company. At the 2018 AGM, the Directors were given the power to issue new shares up to a nominal amount of €3,237,258.96. This power will expire on the earlier of the close of business on the date of the 2019 AGM or 24 July 2019. Accordingly, a resolution will be proposed at the 2019 AGM to renew the Company’s authority to issue new shares.
At the 2018 AGM, the Directors were also given the power to: (i) dis-apply the strict statutory pre-emption provisions in the event of a rights issue or other pre-emptive issue or in any other issue up to an
aggregate amount equal to 5% of the nominal value of the Company’s issued share capital. This 5% limit includes any treasury shares re-issued by the Company while this authority remains operable; and
(ii) dis-apply the strict statutory pre-emption provisions for an additional 5% for specific transactions. The resolution gave the Directors an additional power to allot shares on a non-pre-emptive basis and for cash up to a further 5% of the issued share capital in connection with an acquisition or a specified capital investment which is announced contemporaneously with the issue, or which has taken place in the preceding six month period and is disclosed in the announcement of the issue. The 5% limit includes any treasury shares reissued by the Company while this authority remains operable.
These powers will expire on the date of the 2019 AGM or 24 July 2019, whichever is earlier. Accordingly, resolutions will be proposed at the 2019 AGM to renew these authorities.
It is the Directors’ intention to follow the provisions of the Pre-emption Group Statement of Principles regarding cumulative usage of authorities within a rolling three-year period. These principles provide that companies should consult shareholders prior to issuing, other than to existing shareholders, shares for cash representing in excess of 7.5% of a company’s issued share capital in any rolling three-year period.
Research and developmentThe Group is fully committed to ongoing technological innovation in all sectors of its business, providing integrated customer-focused product development by leveraging our global technology capabilities and expertise. Expenditure on research and development amounted to €11.2 million in 2018 (2017: €9.0 million) as disclosed in Note 5 to the Financial Statements.
DividendsAn interim dividend of 9.71 cent per share was paid on 5 October 2018 (an aggregate of €28.7 million) to shareholders on the share register at the close of business on 24 August 2018. The Directors propose a final dividend of 14.49 cent per share (an aggregate of €42.9 million). Subject to shareholder approval, the final dividend will be paid on 26 April 2019 to shareholders on the share register on 15 March 2019.
Total dividends paid during 2018 amounted to an aggregate of €76 million.
Following approval by shareholders at the AGM in 2010, all dividend payments will be made by direct credit transfer into a nominated bank or financial institution. If a shareholder has not provided his/her account details prior to the payment of the dividend, a shareholder will be sent the normal tax voucher advising a shareholder of the amount of his/her dividend and that the amount is being held because his/her direct credit transfer instructions had not been received in time.
A shareholder’s dividends will not accrue interest while they are held. Payment will be transferred to a shareholder’s account as soon as possible on receipt of his/her direct credit transfer instructions. Additionally, if a shareholder’s registered address is in the UK and a shareholder has not previously provided the Company with a mandate form for a Euro account, a shareholder’s dividend will default to a Sterling payment. All other shareholder’s dividends will default to a Euro payment.
Political donationsThe Electoral Act, 1997 as amended requires companies to disclose all political donations over €200 in aggregate made during the financial year. The Directors, on enquiry, have satisfied themselves that no payment or other donations in excess of this amount have been made by the Group.
Issued share capitalAt 29 December 2018 the authorised share capital of the Company was 350,000,000 ordinary shares of €0.06 each and the issued share capital was 296,045,684 (2017: 296,045,684) ordinary shares of €0.06 each, of which 31.5% was held by the Society. All the Company’s shares are fully paid up and quoted on Euronext Dublin and the London Stock Exchange. The Company did not allot any shares during the year.
Details of the Company’s share capital and shares under option or share award at 29 December 2018 are given in Notes 23 and 24, respectively, to the Financial Statements.
Rights and obligations of ordinary sharesOn a show of hands at a general meeting, every holder of ordinary shares present in person or by proxy and entitled to vote shall have one vote. On a poll, every shareholder present in person or by proxy, shall have one vote for every ordinary share held. In accordance with the provisions of the Constitution of the Company, holders of ordinary shares are entitled to a dividend where declared or paid out of profits available for such purposes. On a return of capital on a winding up, holders of ordinary shares are entitled to participate.

Glanbia plc | Annual Report and Financial Statements 2018
104
> Director’s Report
Restrictions on transfer of shares/votesWith the exception of restrictions on transfer of shares under the Group’s share schemes, while the shares are subject to the schemes, there are no restrictions on the voting rights attaching to the Company’s ordinary shares (except as outlined below) or the transfer of securities in the Company.
Article 2 of the Constitution of the Company provides that any ordinary shares acquired by any person who is/was an employee of the Group or any associate or joint venture (provided he is neither a Director of the Company nor a Director of the Society) shall be non-voting shares if such acquisition would, if not for this restriction on voting rights, cause such person to be deemed to have acquired indirect control of the Company or to have to make an offer under Rule 9 of the Irish Takeover Panel Act 1997, Takeover Rules 2013.
Under the Constitution of the Company, the Directors have the power to impose restrictions on the exercise of rights attaching to share(s) where the holder of the share(s) fails to disclose the identity of any person who may have an interest in those shares. No person holds securities in the Company carrying special rights with regard to control of the Company. The Company is not aware of any agreements between holders of securities that may result in restrictions in the transfer of securities or voting rights.
Exercise of rights of shares in employee share schemesAs detailed in Note 24 to the Financial Statements at 29 December 2018, 871,335 ordinary shares were held in employee benefit trusts for the purpose of the Company’s employee share schemes.
The Group’s employee benefit trusts have waived dividends due to them in respect of unallocated shares save a nominal amount.
The Trustees of the Group’s employee trusts do not seek to exercise voting rights on shares held in the employee trusts other than on the direction of the underlying beneficiaries. No voting rights are exercised in relation to shares unallocated to individual beneficiaries.
Rights under the Shareholders’ Rights (Directive 2007/36/EC) Regulations 2009Shareholder(s) have the right to ask questions related to items on the agenda of a general meeting and to receive answers, subject to certain qualifications. Shareholder(s) holding 3% of the issued share capital of the Company, representing at least 3% of its total voting rights, have the right to put items on the agenda and to table draft resolutions at AGMs. The request must be received by the Company at least 42 days before the relevant meeting. Further details of shareholders’ rights under the Shareholders’ Rights (Directive 2007/36/EC) Regulations 2009 will be contained in the Notice of the 2019 AGM.
Restrictions on voting deadlinesThe notice of any general meeting shall specify the deadline for exercising voting rights and appointing a proxy or proxies to vote in relation to resolutions to be proposed at the general meeting. The number of proxy votes for, against or withheld in respect of each resolution is published on the Group’s website after the meeting.
Constitution of the CompanyThe Company’s Constitution details the rights attaching to the shares; the method by which the Company may purchase or reissue its shares, the provisions which apply to the holding of shares and voting at general meetings and the rules relating to the Directors, including their appointment, retirement, re-election, duties and powers. A copy of the Company’s Constitution can be obtained from the Group’s website: www.glanbia.com.
Unless expressly specified to the contrary in the Constitution of the Company, the Company’s Constitution may be amended by special resolution of the Company’s shareholders.
Change of control provisionsThe Group has certain debt facilities which may require repayment in the event that a change in control occurs with respect to the Group.
There are also a number of agreements that take effect, alter or terminate upon a change of control of the Group, which include the Group’s Glanbia Cheese Joint Venture with Leprino Foods Company. If a third party were to acquire control of the Group, Leprino Foods Company could elect to terminate its Joint Venture with the Group and, if this were to occur, the Group could then be required to sell its shareholding in the Joint Venture to Leprino Foods Company at a price equal to its fair value.
The Board is satisfied that no change of control has occurred in respect of these agreements.
In addition, the Company’s employee share plans contain change of control provisions which can allow for the acceleration of the exercisability of share options and the vesting of share awards in the event of a change of control.
Substantial interestsThe Company has been advised of the following notifiable interests in its ordinary share capital:
Shareholder
No of ordinary shares as at 29/12/2018
% of issued share capital as at 29/12/2018
No of ordinary shares as at 19/02/2019
% of issued share capital as at 19/02/2019
Glanbia Co-operative Society Limited 93,276,241 31.5% 93,276,241 31.5%The Capital Group Companies, Inc./Capital Research and Mgt. Company* 23,699,232 8.0% 23,699,232 8.0%Mawer Investment Management Limited 14,852,659 5.0% 14,852,659 5.0%Black Creek Investment Management Inc** 11,888,469 4.0% 11,888,469 4.0%
Other Statutory Information continued
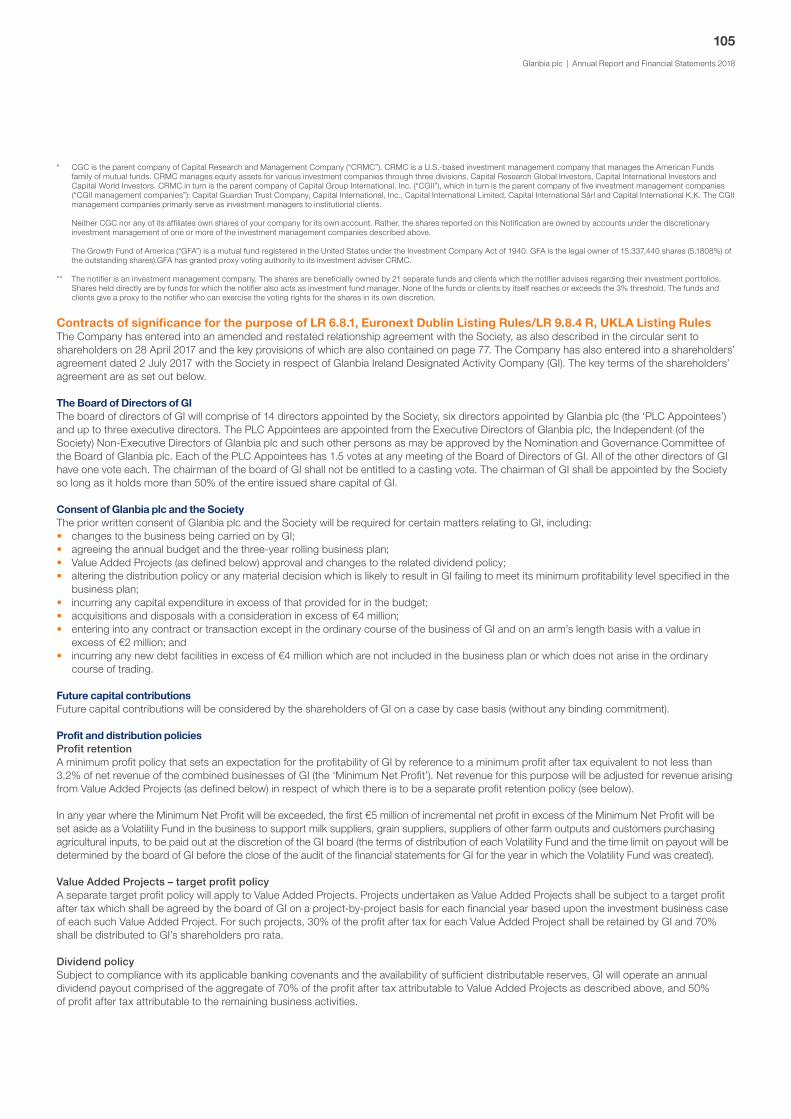
Glanbia plc | Annual Report and Financial Statements 2018
105
* CGC is the parent company of Capital Research and Management Company (“CRMC”). CRMC is a U.S.-based investment management company that manages the American Funds family of mutual funds. CRMC manages equity assets for various investment companies through three divisions, Capital Research Global Investors, Capital International Investors and Capital World Investors. CRMC in turn is the parent company of Capital Group International, Inc. (“CGII”), which in turn is the parent company of five investment management companies (“CGII management companies”): Capital Guardian Trust Company, Capital International, Inc., Capital International Limited, Capital International Sàrl and Capital International K.K. The CGII management companies primarily serve as investment managers to institutional clients.
Neither CGC nor any of its affiliates own shares of your company for its own account. Rather, the shares reported on this Notification are owned by accounts under the discretionary investment management of one or more of the investment management companies described above.
The Growth Fund of America (“GFA”) is a mutual fund registered in the United States under the Investment Company Act of 1940. GFA is the legal owner of 15,337,440 shares (5.1808%) of the outstanding shares).GFA has granted proxy voting authority to its investment adviser CRMC.
** The notifier is an investment management company. The shares are beneficially owned by 21 separate funds and clients which the notifier advises regarding their investment portfolios. Shares held directly are by funds for which the notifier also acts as investment fund manager. None of the funds or clients by itself reaches or exceeds the 3% threshold. The funds and clients give a proxy to the notifier who can exercise the voting rights for the shares in its own discretion.
Contracts of significance for the purpose of LR 6.8.1, Euronext Dublin Listing Rules/LR 9.8.4 R, UKLA Listing RulesThe Company has entered into an amended and restated relationship agreement with the Society, as also described in the circular sent to shareholders on 28 April 2017 and the key provisions of which are also contained on page 77. The Company has also entered into a shareholders’ agreement dated 2 July 2017 with the Society in respect of Glanbia Ireland Designated Activity Company (GI). The key terms of the shareholders’ agreement are as set out below.
The Board of Directors of GIThe board of directors of GI will comprise of 14 directors appointed by the Society, six directors appointed by Glanbia plc (the ‘PLC Appointees’) and up to three executive directors. The PLC Appointees are appointed from the Executive Directors of Glanbia plc, the Independent (of the Society) Non-Executive Directors of Glanbia plc and such other persons as may be approved by the Nomination and Governance Committee of the Board of Glanbia plc. Each of the PLC Appointees has 1.5 votes at any meeting of the Board of Directors of GI. All of the other directors of GI have one vote each. The chairman of the board of GI shall not be entitled to a casting vote. The chairman of GI shall be appointed by the Society so long as it holds more than 50% of the entire issued share capital of GI.
Consent of Glanbia plc and the SocietyThe prior written consent of Glanbia plc and the Society will be required for certain matters relating to GI, including:• changes to the business being carried on by GI;• agreeing the annual budget and the three-year rolling business plan;• Value Added Projects (as defined below) approval and changes to the related dividend policy;• altering the distribution policy or any material decision which is likely to result in GI failing to meet its minimum profitability level specified in the
business plan;• incurring any capital expenditure in excess of that provided for in the budget;• acquisitions and disposals with a consideration in excess of €4 million;• entering into any contract or transaction except in the ordinary course of the business of GI and on an arm’s length basis with a value in
excess of €2 million; and• incurring any new debt facilities in excess of €4 million which are not included in the business plan or which does not arise in the ordinary
course of trading.
Future capital contributionsFuture capital contributions will be considered by the shareholders of GI on a case by case basis (without any binding commitment).
Profit and distribution policiesProfit retentionA minimum profit policy that sets an expectation for the profitability of GI by reference to a minimum profit after tax equivalent to not less than 3.2% of net revenue of the combined businesses of GI (the ‘Minimum Net Profit’). Net revenue for this purpose will be adjusted for revenue arising from Value Added Projects (as defined below) in respect of which there is to be a separate profit retention policy (see below).
In any year where the Minimum Net Profit will be exceeded, the first €5 million of incremental net profit in excess of the Minimum Net Profit will be set aside as a Volatility Fund in the business to support milk suppliers, grain suppliers, suppliers of other farm outputs and customers purchasing agricultural inputs, to be paid out at the discretion of the GI board (the terms of distribution of each Volatility Fund and the time limit on payout will be determined by the board of GI before the close of the audit of the financial statements for GI for the year in which the Volatility Fund was created).
Value Added Projects – target profit policyA separate target profit policy will apply to Value Added Projects. Projects undertaken as Value Added Projects shall be subject to a target profit after tax which shall be agreed by the board of GI on a project-by-project basis for each financial year based upon the investment business case of each such Value Added Project. For such projects, 30% of the profit after tax for each Value Added Project shall be retained by GI and 70% shall be distributed to GI’s shareholders pro rata.
Dividend policySubject to compliance with its applicable banking covenants and the availability of sufficient distributable reserves, GI will operate an annual dividend payout comprised of the aggregate of 70% of the profit after tax attributable to Value Added Projects as described above, and 50% of profit after tax attributable to the remaining business activities.

Glanbia plc | Annual Report and Financial Statements 2018
106
> Director’s Report
Call optionUnder the shareholders’ agreement dated 2 July 2017, the Society will continue to have a call option (the ‘Call Option’) to acquire Glanbia plc’s 40% interest in GI. The Call Option will be exercisable for a one year period commencing on completion of a change of control event in relation to Glanbia plc. A reduction of the Society’s representation on the Glanbia plc Board or its shareholding in Glanbia plc below 30% shall not constitute a change of control for the purposes of the Call Option (unless there is an associated acquisition by an unaffiliated third party of a controlling interest in Glanbia plc). The price payable by the Society on completion of the Call Option shall be an amount equal to 40% of the fair value of GI as between a willing buyer and willing seller (and no discount in respect of Glanbia plc being a minority shareholder in GI will apply). The fair value of GI shall be agreed by Glanbia plc and the Society or, in the absence of agreement, the fair value shall be the midpoint between the valuations as determined for the fair value by two suitably qualified independent valuers.
If following the exercise of the Call Option by the Society, GI and/or Glanbia Foods Ireland Limited continues to be a participating employer in the Glanbia defined benefit pension schemes and Glanbia plc continues to be the principal employer, the Society will guarantee to Glanbia plc the due performance of the obligations of these companies under the schemes for so long as each individual company remains as a participating employer.
For a period of three years from completion, Glanbia plc shall not, directly or indirectly, without the Society’s prior written consent, transfer or dispose of any interest in GI, or enter into any agreement, arrangement or understanding (whether legally binding or not) or do or omit to do any act as a result of which any third party may acquire such interest. This restriction shall not apply to transfers by Glanbia plc to subsidiaries of Glanbia plc provided that the transferee does not cease to be a subsidiary of Glanbia plc.
Effect of termination of the Glanbia Ireland Joint VentureIf Glanbia plc ceases to have any shareholding in GI:• GI and, if applicable, each of its subsidiaries will change its name to a new name which does not include the name ‘Glanbia’ and Glanbia
will pay to GI 50% of the vouched reasonable costs of such rebranding up to a maximum liability for Glanbia plc of €1,500,000 (i.e. 50% of €3 million); and
• the Society will propose (and recommend to its members for approval) a resolution at the next annual general meeting of the Society following the date on which Glanbia plc ceases to have any shareholding in GI to change its corporate name to a name which does not include the name ‘Glanbia’. The Society will not be required to convene a general meeting of members solely to consider a proposed change of name. The Society will not use the ‘Glanbia’ name for any trading or business purpose.
Information required to be disclosed by LR 6.8.1, Euronext Dublin Listing Rules/LR 9.8.4 R, UKLA Listing Rules For the purposes of LR 6.8.1/LR 9.8.4 R, the information required to be disclosed by LR 6.8.1/LR 9.8.4 R can be found in the following locations:
Section Topic Location
(1) Interest capitalised and related tax relief Financial Statements, Note 12
(2) Publication of unaudited financial information Not applicable
(3) Small related party transactions Not applicable
(4) Details of long-term incentive schemes Remuneration Committee report
(5) Waiver of emoluments by a director Not applicable
(6) Waiver of future emoluments by a director Not applicable
(7) Non-pre-emptive issues of equity for cash Not applicable
(8) Item (7) in relation to major subsidiary undertakings Not applicable
(9) Parent participation in a placing by a listed subsidiary Not applicable
(10) Contracts of significance Other Statutory Information
(11) Provision of services by a controlling shareholder Not applicable
(12) Shareholder waivers of dividends Other Statutory Information
(13) Shareholder waivers of future dividends Other Statutory Information
(14) Agreement with controlling shareholders and independence provisions/undertakings
Page 67
All the information cross-referenced above is hereby incorporated by reference into this Directors’ Report.
Subsidiary and associated undertakingsA list of the principal subsidiary and associated undertakings and their activities is included in Note 39 to the Financial Statements.
Other Statutory Information continued

Glanbia plc | Annual Report and Financial Statements 2018
107
Directors’ Responsibility Statement
The Directors are responsible for preparing the Annual Report and the Group and Company Financial Statements in accordance with applicable law and regulations. Irish company law requires the Directors to prepare Financial Statements for each financial year. Under that law the Directors are required to prepare the Group Financial Statements in accordance with International Financial Reporting Standards (IFRS) as adopted by the European Union and Article 4 of the IAS Regulation and elected to prepare the Company Financial Statements in accordance with IFRS as adopted by the European Union, as applied in accordance with the provisions of the Companies Act 2014. Under Irish law the Directors shall not approve the Group and Company Financial Statements unless they are satisfied that they give a true and fair view of the assets, liabilities and financial position, of the Group and Company respectively, as at the end of the financial year and of the profit or loss of the Group for the financial year and otherwise comply with the Companies Act 2014.
In preparing these Group and Company Financial Statements the Directors are required to:• select suitable accounting policies and then apply them consistently;• make judgements and estimates that are reasonable and prudent; • state that the Financial Statements comply with IFRS as adopted by the European Union and ensure the Financial Statements contain the
information required by the Companies Act 2014 and as regards the Company Financial Statements as applied in accordance with the provision of the Companies Act 2014; and
• prepare the Financial Statements on a going concern basis, unless it is inappropriate to presume that the Group and the Company will continue in business.
The Directors are also required by the Transparency Directive (Directive 2004/109/EC) Regulations 2007, the Transparency Rules of the Central Bank of Ireland, the Companies Act 2014 and the Listing Rules issued by Euronext Dublin to prepare a Directors’ Report and reports relating to Directors’ remuneration and corporate governance and the Directors are required to include a management report containing, amongst other things, a fair review of the development and performance of the Group’s business and of its position and a description of the principal risks and uncertainties facing the Group.
The Directors are responsible for keeping adequate accounting records that are sufficient to:• correctly record and explain the transactions of the Company;• enable, at any time, the assets, liabilities, financial position and profit or loss of the Company to be determined with reasonable accuracy;• enable the Directors to ensure that the Group and Company Financial Statements and the Directors Report comply with the Companies Act
2014, and as regards the Group Financial Statements Article 4 of the IAS Regulation; and • enable the Group and Company Financial Statements to be audited.
The Directors are also responsible for safeguarding the assets of the Company and the Group and hence for taking reasonable steps for the prevention and detection of fraud and other irregularities. The Directors are responsible for the maintenance and integrity of certain corporate and financial information included on the Group’s website (www.glanbia.com). Legislation in Ireland concerning the preparation and dissemination of Financial Statements may differ from legislation in other jurisdictions.
Each of the Directors, whose names and functions are listed on pages 57 to 60 (‘Current Directors’) confirms that he/she considers that the Annual Report and Financial Statements, taken as a whole, is fair, balanced and understandable and provides the information necessary for shareholders to assess the position, performance, business model and strategy of the Company and the undertakings included in the consolidation taken as whole. Each of the Current Directors also confirms that to the best of each person’s knowledge and belief:• the Group Financial Statements prepared in accordance with IFRS as adopted by the European Union and the Company Financial Statements
prepared in accordance with IFRS as adopted by the European Union and as applied in accordance with the provision of the Companies Act 2014 give a true and fair view of the assets, liabilities and financial position and profit or loss of the Company and the undertakings included in the consolidation taken as a whole; and
• the Directors’ Report contained in the Annual Report includes a fair review of the development and performance of the business and the position of the Company and the undertakings included in the consolidation taken as whole, together with a description of the principal risks and uncertainties that they face.
The Directors’ Report for the purpose of the Transparency Directive (Directive 2004/109/EC) Regulations 2007, the Transparency Rules of the Central Bank of Ireland, the Companies Act 2014 and the Listing Rules issued by Euronext Dublin consists of pages 1 to 107.
Directors’ ReportOn behalf of the Board
Martin KeaneDirectors
Siobhán Talbot Mark Garvey
19 February 2019

Glanbia plc | Annual Report and Financial Statements 2018
108
> Financial Statements
Financial Statements

Glanbia plc | Annual Report and Financial Statements 2018
109
Financial StatementsIn this section
Independent Auditor’s Report 110
Group Financial Statements 118
Company Financial Statements 124
Notes to the Financial Statements 127
Glossary of KPIs and Non-IFRS Performance Measures 203
Shareholder Information 213
Contacts 217
Glanbia plc | Annual Report and Financial Statements 2018
110
> Financial Statements
Independent Auditor’s Report to the Members of Glanbia plc
Opinion on the financial statements of Glanbia plc (the ‘Company’)In our opinion the Group and Company financial statements:• give a true and fair view of the assets, liabilities and financial position of the Group and Company as at 29 December 2018 and of the profit
of the Group for the financial year then ended; and• have been properly prepared in accordance with the relevant financial reporting framework and, in particular, with the requirements of the
Companies Act 2014, and as regards the Group financial statements, Article 4 of the IAS Regulation.
The financial statements we have audited comprise:
The Group financial statements:• the Group income statement;• the Group statement of comprehensive income;• the Group balance sheet;• the Group statement of changes in equity;• the Group statement of cash flows;• and the related notes 1 to 39, including a summary of significant accounting policies as set out in Note 2.
The Company financial statements:• the Company balance sheet;• the Company statement of changes in equity;• the Company statement of comprehensive income and statement of cash flows;• and the related notes 1 to 39, including a summary of significant accounting policies as set out in Note 2.
The relevant financial reporting framework that has been applied in the preparation of the Company and Group financial statements is the Companies Act 2014, International Financial Reporting Standards (IFRS) as adopted by the European Union and interpretations as approved by the International Accounting Standards Board (IASB) (“the relevant financial reporting framework”).
Basis for opinionWe conducted our audit in accordance with International Standards on Auditing (Ireland) (ISAs (Ireland)) and applicable law. Our responsibilities under those standards are described below in the “Auditor’s responsibilities for the audit of the financial statements” section of our report.
We are independent of the Group and the Company in accordance with the ethical requirements that are relevant to our audit of the financial statements in Ireland, including the Ethical Standard issued by the Irish Auditing and Accounting Supervisory Authority (IAASA), as applied to public interest entities, and we have fulfilled our other ethical responsibilities in accordance with these requirements.
We believe that the audit evidence we have obtained is sufficient and appropriate to provide a basis for our opinion.

Glanbia plc | Annual Report and Financial Statements 2018
111
Summary of our audit approach
Key audit matters The key audit matters that we identified in the current year were:
Event Driven:• Acquisition accounting & the valuation of intangible assets on acquisition.
Recurring:• Provisions for uncertain tax positions; • Impairment of goodwill and other intangible assets; and • Revenue recognition.
Materiality The materiality for the Group that we used in the current year was €13.1m which was determined on the basis of adjusted profit before tax.
The materiality for the Company that we used in the current year was €5.2m which was determined on the basis of net assets.
Scoping We determined the scope of our Group audit by obtaining an understanding of the Group and its environment, including Group-wide internal financial controls, and assessing the risks of material misstatement at the Group level.
Based on that assessment, we focused our Group audit scope primarily on the audit work in 42 components. 13 of these were subject to a full audit, whilst the remaining 29 were subject to specified audit procedures where the extent of our testing was based on our assessment of the associated risks of material misstatement and of the materiality of the components operations to the Group.
Significant changes in our approach
Key audit matters:We have included a new key audit matter in the current year arising from changes in the Group’s business relating to the acquisition of Slimfast by the Glanbia Performance Nutrition segment.
We have removed Disposal Accounting as a key audit matter. This was included in the prior year due to the disposal of the controlling interest in Dairy Ireland to a related party & subsequent reorganisation of investment in Glanbia Ireland DAC in that year.
Materiality & Audit Scope:Our materiality and audit scope were further affected in the current year due to the disposal of the Dairy Ireland segment as 2017 results held 6 months trading activity for Dairy Ireland. Group materiality has reduced due to the changes in the Group’s business resulting in a number of additional international components being included in our audit scope.
Conclusions relating to going concernWe have nothing to report in respect of the following information in the annual report, in relation to which ISAs (Ireland) require us to report to you whether we have anything material to report, add or draw attention to:• the Directors’ confirmation in the annual report on page 48 that they have carried out a robust assessment of the principal risks facing the
Group, including those that would threaten its business model, future performance, solvency or liquidity;• the disclosures on pages 46 to 53 to the annual report that describe those principal risks and explain how they are being managed or mitigated;• the Directors’ statement on page 49 to the annual report and on page 127 in the financial statements about whether the Directors consider
it appropriate to adopt the going concern basis of accounting in preparing the financial statements and the Directors’ identification of any material uncertainties to the Group’s and the Company’s ability to continue to do so over a period of at least twelve months from the date of approval of the financial statements;
• whether the Directors’ statement relating to going concern required under the Listing Rules in accordance with Listing Rule 6.8.3(3) is materially inconsistent with our knowledge obtained in the audit; or
• the Directors’ explanation on page 68 in the annual report as to how they have assessed the prospects of the Group and Company, over what period they have done so and why they consider that period to be appropriate, and their statement as to whether they have a reasonable expectation that the Group and Company will be able to continue in operation and meet its liabilities as they fall due over the period of their assessment, including any related disclosures drawing attention to any necessary qualifications or assumptions.
Key Audit MattersKey audit matters are those matters that, in our professional judgment, were of most significance in our audit of the financial statements of the current financial year and include the most significant assessed risks of material misstatement (whether or not due to fraud) we identified, including those which had the greatest effect on: the overall audit strategy, the allocation of resources in the audit; and directing the efforts of the engagement team. These matters were addressed in the context of our audit of the financial statements as a whole, and in forming our opinion thereon, and we do not provide a separate opinion on these matters.

Glanbia plc | Annual Report and Financial Statements 2018
112
> Financial Statements
Independent Auditor’s Report to the Members of Glanbia plc continued
Acquisition accounting and the valuation of intangible assets on acquisition
Key audit matter description
The Group acquired 100% of the equity of KSF Holdings LLP and HNS Intermediate Corporation (‘SlimFast’) on 19 November 2018 for consideration of €335m.
This acquisition included intangible assets and goodwill. Intangible assets recognised by the Group include customer relationships or lists and brands. Valuing these intangible assets is a subjective process requiring a high level of estimation and judgement by the Directors. This acquisition required the Group to allocate the excess of purchase price over the fair value of the net assets acquired, firstly to intangible assets and the residual to goodwill, which is not amortised. The treatment of goodwill and intangible assets has a significant impact on the amount of subsequent amortisation. Therefore, there is a risk that the allocation between intangible assets and goodwill is incorrect.
Refer also to page 74 (Audit Committee Report), page 128 (business combinations accounting policy), note 3 (Critical accounting estimates and judgements) and notes 17 and 36 to the financial statements.
How the scope of our audit responded to the key audit matter
We evaluated the design and determined the implementation of key controls in place in relation to the valuation process. We, in conjunction with our valuation specialists as part of our audit team, reviewed the purchase price allocation and challenged the key assumptions utilised in the acquisition model to value the split between goodwill and other intangible assets. We, using valuation specialists, assessed whether all assets have been appropriately identified and evaluated and if appropriate methodologies were used in the valuation of the assets. We also tested the accounting treatment of acquisitions for compliance with IFRS 3.
Based on our procedures completed we assessed if the purchase price allocations performed by the Directors are reasonable.
We evaluated the completeness and accuracy of the disclosures in relation to acquisitions for compliance with the relevant accounting standards.
Key observations We have no observations that impact on our audit in respect of the amounts and disclosures related to acquisition accounting and valuation of intangible assets on acquisitions.
Provisions for uncertain tax positions
Key audit matter description
The Group operates across numerous multinational jurisdictions, the most significant of which are Ireland and the USA, and are subject to periodic challenge by local tax authorities on a range of tax matters during the normal course of business including transfer pricing, indirect taxes and transaction related tax matters.
The Directors apply significant judgement in assessing current and deferred tax risks and exposures in relation to the interpretation of local and international tax laws, rates and treaties relating to worldwide provisions for uncertain tax positions.
There is a risk that tax authorities could have different interpretations to those of the Directors resulting in potential misstatement of tax provisions.
Refer also to page 74 (Audit Committee Report), page 136 (Income taxes accounting policy), note 3 (Critical accounting estimates and judgements) and notes 13 and 27 to the financial statements.
How the scope of our audit responded to the key audit matter
To obtain evidence over the appropriateness of the Directors’ assumptions in determining provisions for uncertain tax positions, we obtained an understanding of the Group’s tax strategy, tax operating models and the Directors’ assessment of related tax risks and exposures across the Group.
We engaged our Irish and Deloitte International tax specialists as part of our audit team, including US tax specialists to analyse and challenge the appropriateness of the assumptions made by the Directors in determining adjustments to current and deferred tax provisions.
We challenged and evaluated Directors’ assumptions and estimates, including external advice obtained, in respect of tax risks and related provisions.
We focused particularly on the Directors’ judgements made in relation to transfer pricing risks and interpretations of relevant tax laws, and the Directors’ assessment of likely outcomes for uncertain tax positions in key jurisdictions where the Group has significant trading operations.
We inspected relevant correspondence between the Group and relevant tax authorities.
We evaluated the completeness and accuracy of current and deferred tax disclosures for compliance with the relevant accounting standards.
Key observations We have no observations that impact on our audit in respect of the amounts and disclosures related to the taxation provisions.

Glanbia plc | Annual Report and Financial Statements 2018
113
Impairment of goodwill and other intangibles assets
Key audit matter description
The Group’s goodwill and intangible assets of €1,230m, which is held across thirteen individual Cash Generating Units (CGUs), represents approximately 40% of the Group’s total assets at year end. The Performance Nutrition business accounts for 88% of total goodwill and intangible assets as it has been the fastest growing and most acquisitive segment of the Group over recent years.
Judgement is required in identifying indicators of impairment and estimation is required in determining the recoverable amount of the Group’s CGUs. There is a risk that incorrect inputs or inappropriate assumptions could be included in the Group’s impairment assessment model leading to an impairment charge that has not been included in the Group’s financial statements. This risk was pinpointed to nine CGUs in the current year with particular focus on the three CGUs outlined in note 17 where reduced headroom was noted in the current year.
When a review for impairment is carried out, the recoverable amount of each CGU is compared to its carrying value. The recoverable amount is determined based on value in use calculations which rely on Director’s assumptions and estimates of future trading performance.
The key assumptions utilised by the Directors in the impairment reviews are discount rates and growth rates.
Refer also to page 74 (Audit Committee Report), page 131 (Intangible assets accounting policy), note 3 (Critical accounting estimates and judgements) and note 17 to the financial statements.
How the scope of our audit responded to the key audit matter
We, in conjunction with our valuation specialists, evaluated the methodology applied by the Directors in preparing the value in use calculations and the judgements applied in determining the CGUs. In addition, we evaluated the design and determined the implementation of relevant controls in respect of the impairment review process and the budgeting process upon which the Group’s discounted cash flow model is based.
We performed a retrospective review of assumptions used in prior year value in use calculations and compared these to actual outturn.
We challenged the underlying key assumptions within the Group’s impairment model by developing an independent view of the Group discount rate where we benchmarked the rates used by the Directors against market data and comparable organisations.
We challenged cash flow projections by comparing them to historic growth rates and Group strategic plans. We challenged the Group’s forecasts with reference to recent performance and trend analysis including comparing recent historic performance to budgets for CGUs where revenue growth has significantly fallen behind plans or where sensitivity analysis in respect of key assumptions in the Groups impairment model indicates a potential impairment. We held discussions with the business unit controllers to understand the changes being implemented at the site level to ensure the targets set in the strategic plans are met.
We assessed the reasonableness of related assumptions used in determining terminal values.
We evaluated the completeness and accuracy of the disclosures in relation to goodwill and intangible assets for compliance with the relevant accounting standards.
Key observations While we note that actions are required by the Group to achieve the forecasts outlined in the Group’s strategic plans over the medium term, we concluded that the assumptions in the impairment models, specifically in the value in use calculations, are within an acceptable range.
Glanbia plc | Annual Report and Financial Statements 2018
114
> Financial Statements
Independent Auditor’s Report to the Members of Glanbia plc continued
Revenue Recognition
Key audit matter description
The Group sells products to customers under a variety of contractual terms.
When assessing the potential risk of fraud in relation to revenue recognition, we considered the nature of the automated and manual transactions recorded across the Group. All revenue across the Group is recorded automatically at point of dispatch. Management record manual adjustments to revenue to ensure revenue is accounted for in line with the underlying contractual terms with customers. We have therefore pinpointed the significant risk across the Group to manual adjustments to revenue.
Furthermore, revenue is recognised net of discounts, rebates and other promotional arrangements where they apply to sales contracts. Significant judgement is required to determine the level of accruals required to settle these arrangements with customers post year end, which impacts the amount of revenue recognised in the period. Within the Glanbia Performance Nutrition segment there are significant discounts, rebates and other promotional arrangements, hence there is a risk that year end accruals relating to selling arrangements, and therefore revenue could be misstated either intentionally to achieve performance targets, or as a result of error.
Refer also to page 74 (Audit Committee Report), and page 137 (Revenue recognition accounting policy).
How the scope of our audit responded to the key audit matter
We obtained an understanding of the various selling contracts and arrangements in place with customers across all divisions of the Group, and of the internal controls and IT systems in place over the revenue processes to determine if revenue was appropriately recognised to reflect the terms of contracts with customers and to ensure that the appropriate cut-off procedures are applied and revenue at year end is not misstated.
We evaluated the design and determined the implementation of relevant controls in respect of revenue recognition.
We tested year end accruals for settlement of rebates and other selling arrangements and assessed whether there was any evidence of management bias in key judgements made by management. We also tested year end cut-off procedures and reviewed goods in transit at the year end date to ensure transactions were recorded in the correct period.
As revenue is recognised automatically on despatch within the Group’s IT system, we tested manual journal entries posted to revenue to ensure amounts were recorded in line with underlying contracts for a selection of invoices and customers. We also tested higher risk transactions including consignment sales and agency arrangements and assessed if these transactions were appropriately accounted for in accordance with the relevant accounting standards.
In addition, we tested post year end credit notes and rebate payments to identify any invalid sales transactions recorded in the period.
Key observations We have no observations that impact on our audit in respect of the amounts and disclosures related to revenue recognised.
Our audit procedures relating to these matters were designed in the context of our audit of the financial statements as a whole, and not to express an opinion on individual accounts or disclosures. Our opinion on the financial statements is not modified with respect to any of the risks described above, and we do not express an opinion on these individual matters.

Glanbia plc | Annual Report and Financial Statements 2018
115
Our application of materialityWe define materiality as the magnitude of misstatement that makes it probable that the economic decisions of a reasonably knowledgeable person, relying on the financial statements, would be changed or influenced. We use materiality both in planning the scope of our audit work and in evaluating the results of our work.
We determined materiality for the Group to be €13.1m, which is approximately 5% of adjusted profit before tax and 1% of consolidated shareholders’ equity. We have considered the adjusted profit before tax and exceptionals to be the appropriate benchmark for determining materiality because it is the most important measure for users of the Group’s financial statements. We determined materiality for the Company to be €5.2m on the basis of net assets. We have considered quantitative and qualitative factors such as understanding the entity and its environment, history of misstatements, complexity of the Group and reliability of the control environment.
PBT Materiality
Materiality €13.1m
Audit Committee reporting threshold €0.66m
PBT €266.8m
We agreed with the Audit Committee that we would report to them all audit differences in excess of €0.66m as well as differences below this threshold that, in our view, warranted reporting on qualitative grounds. We also report to the Audit Committee on disclosure matters that we identified when assessing the overall presentation of the financial statements.
An overview of the scope of our auditWe determined the scope of our Group audit by obtaining an understanding of the Group and its environment, including Group-wide controls, and assessing the risks of material misstatement at the Group level. Based on that assessment, we focused our Group audit scope primarily on the audit work in 42 components. 13 of these were subject to a full audit, whilst the remaining 29 were subject to specified audit procedures where the extent of our testing was based on our assessment of the associated risks of material misstatement and of the materiality of the components operations to the Group.
These components were selected based on the level of coverage achieved and to provide an appropriate basis for undertaking audit work to address the risks of material misstatement identified above. Our audit work for all components was executed at levels of materiality applicable to each individual unit which were lower than Group materiality and ranged from €2.6m to €9.1m.
At the Group level, we also tested the consolidation process and carried out analytical procedures to confirm our conclusion that there were no significant risks of material misstatement of the aggregated financial information of the remaining components not subject to a full audit.
Full audit Specified Audit Balances Analytical Procedures
External Revenue % Tested Net Assets % Tested
Revenue Net Assets
Full audit 61% 46%Specified Audit Balances 30% 45%Analytical Procedures 9% 11%
The Group audit team attended planning meetings at a number of significant component locations, including Ireland and the US, during the year and participated in audit meetings with other significant components and a number of non significant components.
In addition to our planning meetings, we sent detailed instructions to our component audit teams, included them in our team briefings, discussed their risk assessment, attended client planning and closing meetings, and reviewed their audit working papers.

Glanbia plc | Annual Report and Financial Statements 2018
116
> Financial Statements
Independent Auditor’s Report to the Members of Glanbia plc continued
Other informationThe directors are responsible for the other information. The other information comprises the information included in the the annual report, other than the financial statements and our auditor’s report thereon. Our opinion on the financial statements does not cover the other information and, except to the extent otherwise explicitly stated in our report, we do not express any form of assurance conclusion thereon.
In connection with our audit of the financial statements, our responsibility is to read the other information and, in doing so, consider whether the other information is materially inconsistent with the financial statements or our knowledge obtained in the audit or otherwise appears to be materially misstated. If we identify such material inconsistencies or apparent material misstatements, we are required to determine whether there is a material misstatement in the financial statements or a material misstatement of the other information. If, based on the work we have performed, we conclude that there is a material misstatement of this other information, we are required to report that fact. We have nothing to report in this regard.
In this context, we also have nothing to report with regard to our responsibility to specifically address the following items in the other information and to report as uncorrected material misstatements of the other information where we conclude that those items meet the following conditions:• Fair, balanced and understandable – the statement given by the Directors that they consider the annual report and financial statements
taken as a whole is fair, balanced and understandable and provides the information necessary for shareholders to assess the Group’s and the Company’s performance, business model and strategy, is materially inconsistent with our knowledge obtained in the audit; or
• Audit committee reporting – the section describing the work of the audit committee does not appropriately address matters communicated by us to the audit committee; or
• Directors’ statement of compliance with the UK Corporate Governance Code and the Irish Corporate Governance Annex – the parts of the Directors’ statement required under the Listing Rules relating to the Company’s compliance with the UK Corporate Governance Code and the Irish Corporate Governance Annex containing provisions specified for review by the auditor in accordance with Listing Rule 6.8.3(7) and Listing Rule 6.8.3(9) do not properly disclose a departure from a relevant provision of the UK Corporate Governance Code or the Irish Corporate Governance Annex.
Responsibilities of directorsAs explained more fully in the Directors’ Responsibilities Statement, the directors are responsible for the preparation of the financial statements and for being satisfied that they give a true and fair view and otherwise comply with the Companies Act 2014, and for such internal control as the directors determine is necessary to enable the preparation of financial statements that are free from material misstatement, whether due to fraud or error.
In preparing the financial statements, the directors are responsible for assessing the Group and Company’s ability to continue as a going concern, disclosing, as applicable, matters related to going concern and using the going concern basis of accounting unless the directors either intend to liquidate the Company or to cease operations, or have no realistic alternative but to do so.
Auditor’s responsibilities for the audit of the financial statementsOur objectives are to obtain reasonable assurance about whether the financial statements as a whole are free from material misstatement, whether due to fraud or error, and to issue an auditor’s report that includes our opinion. Reasonable assurance is a high level of assurance, but is not a guarantee that an audit conducted in accordance with ISAs (Ireland) will always detect a material misstatement when it exists. Misstatements can arise from fraud or error and are considered material if, individually or in the aggregate, they could reasonably be expected to influence the economic decisions of users taken on the basis of these financial statements.
As part of an audit in accordance with ISAs (Ireland), we exercise professional judgment and maintain professional scepticism throughout the audit. We also:• Identify and assess the risks of material misstatement of the financial statements, whether due to fraud or error, design and perform audit
procedures responsive to those risks, and obtain audit evidence that is sufficient and appropriate to provide a basis for our opinion. The risk of not detecting a material misstatement resulting from fraud is higher than for one resulting from error, as fraud may involve collusion, forgery, intentional omissions, misrepresentations, or the override of internal control.
• Obtain an understanding of internal control relevant to the audit in order to design audit procedures that are appropriate in the circumstances, but not for the purpose of expressing an opinion on the effectiveness of the Group’s and Company’s internal control.
• Evaluate the appropriateness of accounting policies used and the reasonableness of accounting estimates and related disclosures made by the directors.
• Conclude on the appropriateness of the directors’ use of the going concern basis of accounting and, based on the audit evidence obtained, whether a material uncertainty exists related to events or conditions that may cast significant doubt on the Group and Company’s ability to continue as a going concern. If we conclude that a material uncertainty exists, we are required to draw attention in our auditor’s report to the related disclosures in the financial statements or, if such disclosures are inadequate, to modify our opinion. Our conclusions are based on the audit evidence obtained up to the date of the auditor’s report. However, future events or conditions may cause the entity (or where relevant, the Group) to cease to continue as a going concern.
• Evaluate the overall presentation, structure and content of the financial statements, including the disclosures, and whether the financial statements represent the underlying transactions and events in a manner that achieves fair presentation.
• Obtain sufficient appropriate audit evidence regarding the financial information of the business activities within the Group to express an opinion on the consolidated financial statements. The Group auditor is responsible for the direction, supervision and performance of the Group audit. The Group auditor remains solely responsible for the audit opinion.
We communicate with those charged with governance regarding, among other matters, the planned scope and timing of the audit and significant audit findings, including any significant deficiencies in internal control that the auditor identifies during the audit.

Glanbia plc | Annual Report and Financial Statements 2018
117
For listed entities and public interest entities, the auditor also provides those charged with governance with a statement that the auditor has complied with relevant ethical requirements regarding independence, including the Ethical Standard for Auditors (Ireland) 2016, and communicates with them all relationships and other matters that may be reasonably be thought to bear on the auditor’s independence, and where applicable, related safeguards.
Where the auditor is required to report on key audit matters, from the matters communicated with those charged with governance, the auditor determines those matters that were of most significance in the audit of the financial statements of the current period and are therefore the key audit matters. The auditor describes these matters in the auditor’s report unless law or regulation precludes public disclosure about the matter or when, in extremely rare circumstances, the auditor determines that a matter should not be communicated in the auditor’s report because the adverse consequences of doing so would reasonably be expected to outweigh the public interest benefits of such communication.
This report is made solely to the Company’s members, as a body, in accordance with Section 391 of the Companies Act 2014. Our audit work has been undertaken so that we might state to the Company’s members those matters we are required to state to them in an auditor’s report and for no other purpose. To the fullest extent permitted by law, we do not accept or assume responsibility to anyone other than the Company and the Company’s members as a body, for our audit work, for this report, or for the opinions, we have formed.
Report on other legal and regulatory requirementsOpinion on other matters prescribed by the Companies Act 2014Based solely on the work undertaken in the course of the audit, we report that:• We have obtained all the information and explanations which we consider necessary for the purposes of our audit.• In our opinion the accounting records of the Company were sufficient to permit the financial statements to be readily and properly audited.• The Company balance sheet is in agreement with the accounting records.• In our opinion the information given in those parts of the Directors’ report as specified for our review is consistent with the financial statements
and has been prepared in accordance with the Companies Act 2014.
Corporate Governance StatementWe report, in relation to information given in the Corporate Governance Statement on pages 56 to 69 that:• In our opinion, based on the work undertaken during the course of the audit, the information given in the Corporate Governance Statement
pursuant to subsections 2(c) and (d) of section 1373 of the Companies Act 2014 is consistent with the Company’s statutory financial statements in respect of the financial year concerned and such information has been prepared in accordance with the Companies Act 2014. Based on our knowledge and understanding of the Company and its environment obtained in the course of the audit, we have not identified any material misstatements in this information;
• In our opinion, based on the work undertaken during the course of the audit, the Corporate Governance Statement contains the information required by Regulation 6(2) of the European Union (Disclosure of Non-Financial and Diversity Information by certain large undertakings and groups) Regulations 2017 (as amended); and
• In our opinion, based on the work undertaken during the course of the audit, the information required pursuant to section 1373(2)(a),(b),(e) and (f) of the Companies Act 2014 is contained in the Corporate Governance Statement.
Matters on which we are required to report by exceptionBased on the knowledge and understanding of the Group and the Company and its environment obtained in the course of the audit, we have not identified material misstatements in those parts of the Directors’ report that have been specified for our review.
The Companies Act 2014 also requires us to report to you if, in our opinion, the Company has not provided the information required by Regulation 5(2) to 5(7) of the European Union (Disclosure of Non-Financial and Diversity Information by certain large undertakings and Groups) Regulations 2017 (as amended) for the financial year ended 29 December 2018. We have nothing to report in this regard.
We have nothing to report in respect of the provisions in the Companies Act 2014 which require us to report to you if, in our opinion, the disclosures of directors’ remuneration and transactions specified by law are not made.
The Listing Rules of the Euronext Dublin require us to review six specified elements of disclosures in the report to shareholders by the Board of Directors’ remuneration committee. We have nothing to report in this regard.
Other matters, which we are required to addressGlanbia plc appointed us on 27 April 2016 to audit the financial statements for the financial year ended 31 December 2016 and subsequent financial periods. The period of total uninterrupted engagement including previous renewals and reappointments of the firm is three years, covering the years ending 31 December 2016, 30 December 2017 and 29 December 2018.
The non-audit services prohibited by IAASA’s Ethical Standard were not provided and we remained independent of the Company in conducting the audit.
Our audit opinion is consistent with the additional report to the audit committee we are required to provide in accordance with ISA (Ireland) 260.
Kevin SheehanFor and on behalf of Deloitte Ireland LLPChartered Accountants and Statutory Audit FirmDublin
19 February 2019

Glanbia plc | Annual Report and Financial Statements 2018
118
> Financial Statements
Group Income Statementfor the financial year ended 29 December 2018
2018 2017
Notes
Pre-exceptional
€’mExceptional
€’m(note 6)
Total€’m
Pre-exceptional
€’mExceptional
€’m(note 6)
Total€’m
Continuing operationsRevenue 5 2,386.3 – 2,386.3 2,387.1 – 2,387.1
Earnings before interest, tax and amortisation (EBITA) 5 284.9 – 284.9 283.2 (5.5) 277.7Intangible asset amortisation 17 (45.9) – (45.9) (43.1) (19.4) (62.5)
Operating profit 5 239.0 – 239.0 240.1 (24.9) 215.2
Finance income 12 3.9 – 3.9 3.0 – 3.0Finance costs 12 (21.4) – (21.4) (26.0) (14.0) (40.0)Share of results of Equity accounted investees 18 45.3 – 45.3 42.8 8.7 51.5
Profit before taxation 266.8 – 266.8 259.9 (30.2) 229.7Income taxes 13 (32.8) – (32.8) (38.3) 45.8 7.5
Profit from continuing operations 234.0 – 234.0 221.6 15.6 237.2
Discontinued operationsProfit from discontinued operations 10 – – – 9.8 82.4 92.2
Profit for the year 234.0 – 234.0 231.4 98.0 329.4
Attributable to:Equity holders of the Company – Continuing operations 234.0 237.2Equity holders of the Company – Discontinued operations – 92.2
234.0 329.4
Earnings Per Share from continuing and discontinued operations attributable to the equity holders of the CompanyBasic Earnings Per Share (cent)Continuing operations 14 79.28 80.40Discontinued operations 14 – 31.25
79.28 111.65
Diluted Earnings Per Share (cent)Continuing operations 14 79.04 80.19Discontinued operations 14 – 31.17
79.04 111.36

Glanbia plc | Annual Report and Financial Statements 2018
119
Notes2018€’m
2017€’m
Profit for the year 234.0 329.4
Other comprehensive income/(expense)Items that will not be reclassified subsequently to the Group income statement:Remeasurements – defined benefit plans– Continuing operations 9 (0.5) 7.1– Discontinued operations 9 – 12.0Deferred tax on remeasurements – defined benefit plans– Continuing operations 27 0.2 (0.3)– Discontinued operations 27 – (1.5)Share of remeasurements – defined benefit plans – Equity accounted investees –
net of deferred tax– Continuing operations 18 (2.0) (0.6)– Discontinued operations 18 – 1.9
Items that may be reclassified subsequently to the Group income statement:Currency translation differences – Continuing operations 24 58.6 (149.8)Reclassification of foreign currency differences on disposal of Dairy Ireland 10/24 – (0.2)Currency translation difference arising on net investment hedge 24 (3.9) 11.3Revaluation of available for sale financial assets 24 – 1.6Deferred tax on revaluation of available for sale financial assets 24 – (0.7)Disposal of available for sale financial assets 24 (5.3) –Deferred tax on disposal of available for sale financial assets 24 1.8 –Net fair value movements on cash flow hedges (0.2) (0.6)Deferred tax on cash flow hedges 0.1 –Net fair value movements on cash flow hedges – Equity accounted investees, net of deferred tax 18 (4.2) 2.8
Other comprehensive income/(expense) for the year, net of tax 44.6 (117.0)
Total comprehensive income for the year 278.6 212.4
Total comprehensive income attributable to:Equity holders of the Company – Continuing operations 278.6 108.0Equity holders of the Company – Discontinued operations – 104.5Non-controlling interests – Discontinued operations 25 – (0.1)
Total comprehensive income for the year 278.6 212.4
Group Statement of Comprehensive Income for the financial year ended 29 December 2018

Glanbia plc | Annual Report and Financial Statements 2018
120
> Financial Statements
Group Balance Sheetas at 29 December 2018
Notes
29 December2018€’m
30 December 2017€’m
ASSETSNon-current assetsProperty, plant and equipment 16 453.0 442.2Intangible assets 17 1,304.0 959.8Equity accounted investees 18 334.5 266.9Available for sale financial assets 19(a) 3.7 11.1Trade and other receivables 20 29.8 –Deferred tax assets 27 2.1 1.6Retirement benefit assets 9 1.1 1.7
2,128.2 1,683.3
Current assetsCurrent tax assets 9.6 11.3Inventories 21 384.6 321.6Trade and other receivables 20 350.2 302.4Derivative financial instruments 31 1.5 2.2Cash and cash equivalents 22 224.6 162.2
970.5 799.7
Total assets 3,098.7 2,483.0
EQUITYIssued capital and reserves attributable to equity holders of the CompanyShare capital and share premium 23 105.4 105.4Other reserves 24 240.9 190.0Retained earnings 1,242.8 1,086.3
Total equity 1,589.1 1,381.7
LIABILITIESNon-current liabilitiesFinancial liabilities 26 752.4 499.6Deferred tax liabilities 27 160.3 125.6Retirement benefit obligations 9 39.6 43.6Provisions 28 24.9 24.0Capital grants 29 – 0.1Other payables 30 13.0 10.1
990.2 703.0
Current liabilitiesTrade and other payables 30 407.0 307.9Current tax liabilities 59.7 52.0Financial liabilities 26 48.9 30.3Derivative financial instruments 31 0.5 0.3Provisions 28 3.3 7.8
519.4 398.3
Total liabilities 1,509.6 1,101.3
Total equity and liabilities 3,098.7 2,483.0
On behalf of the Board
Martin KeaneDirectors
Siobhán Talbot Mark Garvey

Glanbia plc | Annual Report and Financial Statements 2018
121
Attributable to equity holders of the Company
Sharecapital and
sharepremium
€’m(note 23)
Otherreserves
€’m(note 24)
Retainedearnings
€’mTotal
€’m
Balance at 30 December 2017 105.4 190.0 1,086.3 1,381.7
Profit for the year – – 234.0 234.0
Other comprehensive income/(expense)Remeasurements – defined benefit plans – – (0.5) (0.5)Deferred tax on remeasurements – defined benefit plans – – 0.2 0.2Share of remeasurements – defined benefit plans – Equity accounted investees –
net of deferred tax – – (2.0) (2.0)Currency translation differences – 58.6 – 58.6Net investment hedge – (3.9) – (3.9)Fair value movements – (10.5) – (10.5)Deferred tax on fair value movements – 2.8 – 2.8
Total comprehensive income for the year – 47.0 231.7 278.7
Transactions with equity holders of the CompanyContributions and distributionsDividends – – (76.0) (76.0)Cost of share-based payments – 8.8 – 8.8Transfer on exercise, vesting or expiry of share-based payments – (0.6) 0.6 –Deferred tax on share-based payments – – 0.2 0.2Purchase of own shares – (4.3) – (4.3)
Total contributions and distributions – 3.9 (75.2) (71.3)
Balance at 29 December 2018 105.4 240.9 1,242.8 1,589.1
Group Statement of Changes in Equity for the financial year ended 29 December 2018

Glanbia plc | Annual Report and Financial Statements 2018
122
> Financial Statements
Attributable to equity holders of the Company
Sharecapital and
sharepremium
€’m(note 23)
Otherreserves
€’m(note 24)
Retainedearnings
€’mTotal€’m
Non-controlling
interests€’m
(note 25)
Total€’m
Balance at 31 December 2016 105.4 331.6 779.0 1,216.0 11.1 1,227.1
Profit for the year – – 329.4 329.4 – 329.4
Other comprehensive income/(expense)Remeasurements – defined benefit plans – – 19.2 19.2 (0.1) 19.1Deferred tax on remeasurements – defined benefit plans – – (1.8) (1.8) – (1.8)Share of remeasurements – defined benefit plans –
Equity accounted investees – net of deferred tax – – 1.3 1.3 – 1.3Currency translation differences – (149.8) – (149.8) – (149.8)Reclassification of foreign currency differences
on disposal of Dairy Ireland (0.2) – (0.2) – (0.2)Net investment hedge – 11.3 – 11.3 – 11.3Fair value movements – 3.9 – 3.9 – 3.9Deferred tax on fair value movements – (0.8) – (0.8) – (0.8)
Total comprehensive (expense)/income for the year – (135.6) 348.1 212.5 (0.1) 212.4
Transactions with equity holders of the CompanyContributions and distributionsDividends – – (40.9) (40.9) – (40.9)Sale of shares held by a subsidiary – – 2.4 2.4 – 2.4Cost of share-based payments – 7.8 – 7.8 – 7.8Transfer on exercise, vesting or expiry of share-based
payments – 2.4 (2.4) – – –Deferred tax on share-based payments – – 0.1 0.1 – 0.1Purchase of own shares – (16.2) – (16.2) – (16.2)
Total contributions and distributions – (6.0) (40.8) (46.8) – (46.8)
Changes in ownership interestsDisposal of non-controlling interests – – – – (11.0) (11.0)
Balance at 30 December 2017 105.4 190.0 1,086.3 1,381.7 – 1,381.7
Group Statement of Changes in Equity continuedfor the financial year ended 29 December 2018

Glanbia plc | Annual Report and Financial Statements 2018
123
Notes2018€’m
2017€’m
Cash flows from operating activitiesCash generated from operating activities 34 316.5 162.2Interest received 4.8 3.1Interest paid (21.0) (39.5)Tax paid (25.2) (34.7)
Net cash inflow from operating activities 275.1 91.1
Cash flows from investing activitiesAcquisition of subsidiaries – purchase consideration 36 (337.8) (162.2)Acquisition of subsidiaries – liabilities settled at completion – (7.6)Acquisition of subsidiaries – net cash and cash equivalents acquired 24.8 1.6Purchase of property, plant and equipment (32.0) (38.0)Purchase of intangible assets 17 (30.6) (34.5)Interest paid in relation to property, plant and equipment 12 (0.8) (0.8)Dividends received from Equity accounted investees 18/37 31.6 15.8Loans advanced to Equity accounted investees 37 (17.0) –Investment in Joint Ventures (41.9) –Disposals/redemption of available for sale financial assets 19(a) 7.9 2.4Additions to available for sale financial assets 19(a) (0.3) (2.0)Disposal of undertaking and investment in Equity accounted investee (net of cash disposed) 10 – 208.8Proceeds from property, plant and equipment 1.3 0.1Sale of shares held by a subsidiary – 2.4
Net cash outflow from investing activities (394.8) (14.0)
Cash flows from financing activitiesPurchase of own shares 24 (4.3) (16.2)Drawdown of borrowings 370.7 182.0Repayment of borrowings (130.5) (242.7)Finance lease payments 26 (0.3) (2.2)Dividends paid to Company shareholders 15 (76.0) (41.0)
Net cash inflow/(outflow) from financing activities 159.6 (120.1)
Net increase/(decrease) in cash and cash equivalents 39.9 (43.0)Cash and cash equivalents at the beginning of the year 22 132.1 187.3Effects of exchange rate changes on cash and cash equivalents 3.7 (12.2)
Cash and cash equivalents at the end of the year 22 175.7 132.1
Reconciliation of net cash flow to movement in net debt2018€’m
2017€’m
Net increase/(decrease) in cash and cash equivalents 39.9 (43.0)Cash movements from debt financing (239.9) 62.9
26 (200.0) 19.9Exchange translation adjustment on net debt 26 (9.0) 49.9
Movement in net debt in the year (209.0) 69.8Net debt at the beginning of the year 26 (367.7) (437.5)
Net debt at the end of the year 26 (576.7) (367.7)
Group Statement of Cash Flows for the financial year ended 29 December 2018

Glanbia plc | Annual Report and Financial Statements 2018
124
> Financial Statements
Company Balance Sheetas at 29 December 2018
Notes
29 December2018€’m
30 December 2017€’m
ASSETSNon-current assetsEquity accounted investees 18 95.4 95.4Investment in subsidiaries 19(b) 489.4 467.4Available for sale financial assets 19(a) 3.1 10.8Deferred tax assets 27 0.4 0.3
588.3 573.9
Current assetsTrade and other receivables 20 347.2 318.2Cash and cash equivalents 22 7.9 6.0
355.1 324.2
Total assets 943.4 898.1
EQUITYIssued capital and reserves attributable to equity holders of the CompanyShare capital and share premium 23 460.7 460.7Other reserves 3.8 3.4Retained earnings 170.8 212.1
Total equity 635.3 676.2
LIABILITIESNon-current liabilities
Financial liabilities 26 41.0 –Deferred tax liabilities 27 – 1.7
41.0 1.7
Current liabilitiesProvisions 28 0.6 0.6Trade and other payables 30 266.5 219.6
267.1 220.2
Total liabilities 308.1 221.9
Total equity and liabilities 943.4 898.1
As permitted by section 304 of the Companies Act 2014, the Company is availing of the exemption from presenting its separate income statement in these financial statements and from filing it with the Registrar of Companies. The profit for the year dealt with in the financial statements of the Company amounts to €34.1 million (2017: €107.2 million).
On behalf of the Board
Martin KeaneDirectors
Siobhán Talbot Mark Garvey

Glanbia plc | Annual Report and Financial Statements 2018
125
Other reserves
Sharecapital
and sharepremium
€’m(note 23)
Capitalreserve
€’m(note 24 (a))
Ownshares
€’m(note 24 (f))
Share-based
paymentreserve
€’m(note 11)
Availablefor sale
financialasset
reserve€’m
(note 24 (e))
RetainedEarnings
€’mTotal €’m
Balance at 30 December 2017 460.7 4.2 (19.1) 14.9 3.4 212.1 676.2
Profit for the year – – – – – 34.1 34.1Other comprehensive income – – – – – – –
Total comprehensive income for the year – – – – – 34.1 34.1
Transactions with equity holders of the CompanyContributions and distributionsTransfer to income statement:– Available for sale disposals – – – – (5.3) – (5.3)– Deferred tax on disposals of available for sale – – – – 1.8 – 1.8Dividends – – – – – (76.0) (76.0)Cost of share-based payments – – – 8.8 – – 8.8Transfer on exercise, vesting or expiry of
share-based payments – – 9.0 (9.6) – 0.6 –Purchase of own shares – – (4.3) – – – (4.3)
Total contributions and distributions – – 4.7 (0.8) (3.5) (75.4) (75.0)
Balance at 29 December 2018 460.7 4.2 (14.4) 14.1 (0.1) 170.8 635.3
Balance at 31 December 2016 460.7 4.2 (15.2) 17.0 2.0 148.2 616.9
Profit for the year – – – – – 107.2 107.2
Other comprehensive income/(expense)Fair value movements – – – – 2.1 – 2.1Deferred tax on fair value movements – – – – (0.7) – (0.7)
Total comprehensive income for the year – – – – 1.4 107.2 108.6
Transactions with equity holders of the CompanyContributions and distributionsDividends – – – – – (40.9) (40.9)Cost of share-based payments – – – 7.8 – – 7.8Transfer on exercise, vesting or expiry of
share-based payments – – 12.3 (9.9) – (2.4) –Purchase of own shares – – (16.2) – – – (16.2)
Total contributions and distributions – – (3.9) (2.1) – (43.3) (49.3)
Balance at 30 December 2017 460.7 4.2 (19.1) 14.9 3.4 212.1 676.2
Company Statement of Changes in Equity for the financial year ended 29 December 2018
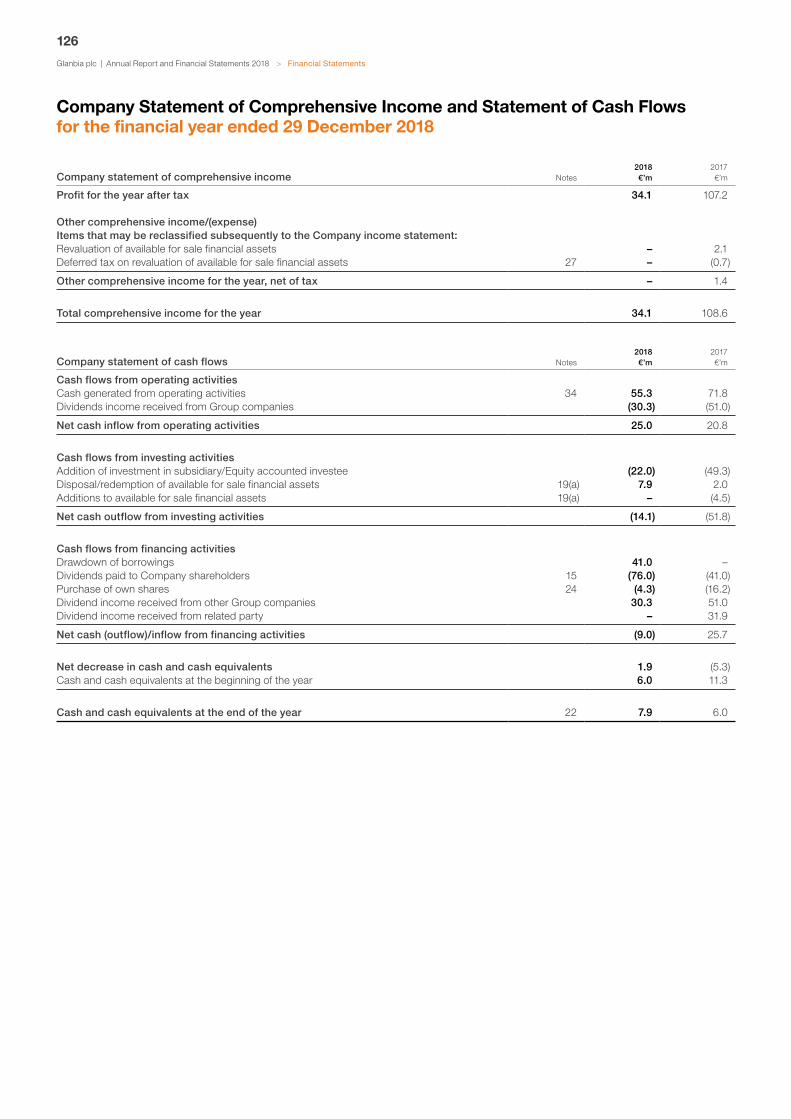
Glanbia plc | Annual Report and Financial Statements 2018
126
> Financial Statements
Company statement of comprehensive income Notes2018€’m
2017€’m
Profit for the year after tax 34.1 107.2
Other comprehensive income/(expense)Items that may be reclassified subsequently to the Company income statement:Revaluation of available for sale financial assets – 2.1Deferred tax on revaluation of available for sale financial assets 27 – (0.7)
Other comprehensive income for the year, net of tax – 1.4
Total comprehensive income for the year 34.1 108.6
Company statement of cash flows Notes2018€’m
2017€’m
Cash flows from operating activitiesCash generated from operating activities 34 55.3 71.8Dividends income received from Group companies (30.3) (51.0)
Net cash inflow from operating activities 25.0 20.8
Cash flows from investing activitiesAddition of investment in subsidiary/Equity accounted investee (22.0) (49.3)Disposal/redemption of available for sale financial assets 19(a) 7.9 2.0Additions to available for sale financial assets 19(a) – (4.5)
Net cash outflow from investing activities (14.1) (51.8)
Cash flows from financing activitiesDrawdown of borrowings 41.0 –Dividends paid to Company shareholders 15 (76.0) (41.0)Purchase of own shares 24 (4.3) (16.2)Dividend income received from other Group companies 30.3 51.0Dividend income received from related party – 31.9
Net cash (outflow)/inflow from financing activities (9.0) 25.7
Net decrease in cash and cash equivalents 1.9 (5.3)Cash and cash equivalents at the beginning of the year 6.0 11.3
Cash and cash equivalents at the end of the year 22 7.9 6.0
Company Statement of Comprehensive Income and Statement of Cash Flowsfor the financial year ended 29 December 2018

Glanbia plc | Annual Report and Financial Statements 2018
127
1. General informationGlanbia plc (the ‘Company’) and its subsidiaries (together the ‘Group’) is a leading global nutrition group with its main operations in Europe, US and Asia Pacific. See note 4.
The Company is a public limited company incorporated and domiciled in Ireland, the number under which it is registered is 129933. The address of its registered office is Glanbia House, Kilkenny, Ireland. Glanbia Co-operative Society Limited, (the ‘Society’), together with its subsidiaries, holds 31.5% of the issued share capital of the Company. The Board of Directors for the year ended 29 December 2018 is comprised of 16 members, of which up to 8, including the Chairman who has the casting vote, are nominated by the Society. In accordance with IFRS 10 ‘Consolidated Financial Statements’, the Society controls the Group and is the ultimate parent of the Group.
The Company’s shares are quoted on the Euronext Dublin and London Stock Exchange.
The Company and consolidated financial statements were approved and authorised for issue by the Board of Directors on 19 February 2019.
2. Summary of significant accounting policiesNew accounting standards and International Financial Reporting Interpretations Committee (IFRIC) interpretations adopted by the Group and Company during the year ended 29 December 2018 are dealt with in section (ab) below. The adoption of these standards and interpretations had no significant impact on the results or financial position of the Group and Company during the year.
The principal accounting policies adopted in the preparation of the financial statements are set out below.
These policies have been consistently applied to all years presented by the Company, its subsidiaries and Equity accounted investees unless otherwise stated.
(a) Basis of preparationThe consolidated financial statements have been prepared in accordance with EU adopted International Financial Reporting Standards (IFRS), IFRIC interpretations and those parts of the Companies Act 2014, applicable to companies reporting under IFRS.
IFRS as adopted by the European Union (EU) comprise standards and interpretations approved by the International Accounting Standards Board (IASB). The consolidated financial statements comply with Article 4 of the EU IAS Regulation. IFRS adopted by the EU differs in certain respects from IFRS issued by the IASB. References to IFRS hereafter refer to IFRS adopted by the EU.
The Company financial statements are prepared using accounting policies consistent with the accounting policies applied by the Group to the consolidated financial statements, as applied in accordance with the Companies Act 2014.
The consolidated financial statements have been prepared under the historical cost convention as modified by use of fair values for available for sale financial assets, derivative financial instruments, share-based payments and retirement benefit obligations. The carrying values of recognised assets and liabilities that are hedged are adjusted to record changes in the fair values attributable to the risks that are being hedged.
The preparation of the consolidated financial statements in conformity with IFRS requires the use of estimates, judgements and assumptions that affect the reported amounts of assets and liabilities at the date of the consolidated financial statements and the reported amounts of revenues and expenses during the reporting period. Although these estimates are based on management’s best knowledge of the amount, event or actions, actual results ultimately may differ from these estimates. See note 3.
Amounts are stated in euro millions (€’m) unless otherwise stated. These financial statements are prepared for the 52-week period ended 29 December 2018. Comparatives are for the 52-week period ended 30 December 2017. The balance sheets for 2018 and 2017 have been drawn up as at 29 December 2018 and 30 December 2017 respectively.
In the prior year following the disposal of 60% of Dairy Ireland and related assets, and in accordance with the requirements of IFRS 5 ‘Non-current assets held for sale and discontinued operations’ and note (b) (iv) below, the results of Dairy Ireland to the date of disposal have been presented within profit from discontinued operations in the prior year Group income statement. See note 10.
Going concernAfter making enquiries the Directors consider it appropriate to adopt the going concern basis of accounting in preparing the consolidated financial statements.
(b) Basis of consolidationi) Subsidiaries
The consolidated financial statements incorporate the financial statements of the Company and entities controlled by it (its subsidiaries). Subsidiaries are entities over which the Group has control. The Group controls an entity when the Group is exposed to, or has rights to, variable returns from its involvement with the entity and has the ability to affect those returns through its power over the entity.
Subsidiaries are consolidated from the date on which control is transferred to the Group and are no longer consolidated from the date that control ceases.
Inter-company assets and liabilities, equity, income, expenses and cash flows relating to transactions between members of the Group are eliminated on consolidation.
Notes to the Financial Statements for the financial year ended 29 December 2018

Glanbia plc | Annual Report and Financial Statements 2018
128
> Financial Statements
2. Summary of significant accounting policies continuedii) Equity accounted investees
Joint VenturesThe Group applies IFRS 11 ‘Joint Arrangements’ to all joint arrangements. Under IFRS 11 investments in joint arrangements are classified as either joint operations or joint ventures depending on the contractual rights and obligations of each investor. The Group has assessed the nature of its joint arrangements and determined them to be Joint Ventures. Investments in Joint Ventures are accounted for using the equity method of accounting.
AssociatesAssociates are entities over which the Group has significant influence but not control, generally accompanying a shareholding of between 20% and 50% of the voting rights. Significant influence is the power to participate in the financial and operating policy decisions of the investee but not the ability to control or jointly control those policies. Investments in Associates are accounted for using the equity method of accounting. The Group disposed of its Associates during 2017.
Equity method of accounting – Joint Ventures & AssociatesUnder the equity method of accounting, interests in Joint Ventures & Associates are initially recognised at cost.
The Group’s share of Joint Ventures & Associates post acquisition profits or losses after tax are recognised in the ‘Share of results of Equity accounted investees’ in the Group income statement.
The Group’s share of Joint Ventures & Associates post acquisition movement in reserves is recognised in other comprehensive income.
The cumulative post-acquisition movements are adjusted against the carrying amount of the investment less any impairment in value. Where indicators of impairment arise, the carrying amount of the Joint Venture or Associate is tested for impairment by comparing its recoverable amount against its carrying value.
Unrealised gains arising from transactions with Joint Ventures & Associates are eliminated to the extent of the Group’s interest in the entity. Unrealised losses are similarly eliminated to the extent that they do not provide evidence of impairment of a transferred asset.
When the Group’s share of losses in a Joint Venture or Associate equals or exceeds its interest in the Joint Venture or Associate, the Group does not recognise further losses unless the Group has incurred obligations or made payments on behalf of the Joint Venture or Associate.
When the Group ceases to have joint control or significant influence, any retained interest in the entity is re-measured to its fair value at the date when joint control or significant influence is lost with the change in carrying amount recognised in the income statement. The Group also reclassifies any movements previously recognised in other comprehensive income to the income statement.
iii) Business combinationsThe Group uses the acquisition method of accounting to account for business combinations.
The acquisition date is defined as the date the Group gained control of the entity.
The cost of the acquisition is measured at the aggregate of the fair value of the consideration given.
Any contingent consideration to be transferred by the acquirer will be recognised at fair value at the acquisition date. Subsequent changes to the fair value of the contingent consideration will be recognised in accordance with IAS 39 ‘Financial Instruments: Recognition and Measurement’ in the income statement.
Identifiable assets acquired and liabilities and contingent liabilities assumed in a business combination are measured initially at their fair values at the acquisition date except for deferred tax assets or liabilities and assets or liabilities related to employee benefit arrangements which are recognised and measured in accordance with IAS 12 ‘Income Taxes’ and IAS 19 ‘Employee Benefits’ respectively.
The fair value of the assets and liabilities are based on valuations using assumptions deemed by management to be appropriate. Professional valuers are engaged when it is deemed appropriate to do so.
Upon acquisition, the Group assesses the assets acquired and liabilities assumed for appropriate classification and designation in accordance with the contractual terms, economic circumstances and pertinent conditions as at the acquisition date.
Acquisition-related costs are expensed as incurred in the income statement.
On an acquisition-by-acquisition basis, the Group recognises any non-controlling interest in the acquiree either at fair value or at the non-controlling interest’s proportionate share of the acquiree’s net assets.
Goodwill represents the excess of the aggregate of the consideration transferred and the amount of any non-controlling interest in the acquired entity over the net identifiable assets acquired. If this is less than the fair value of the net assets of the subsidiary acquired, in the case of a bargain purchase, the difference is recognised directly in the income statement.
Notes to the Financial Statements continued

Glanbia plc | Annual Report and Financial Statements 2018
129
If the initial accounting for a business combination is incomplete by the end of the reporting period in which the combination occurs, the Group reports provisional amounts for the items for which the valuation of the fair value of assets acquired and liabilities assumed is still in progress. Those provisional amounts are adjusted during the measurement period of one year from the date control is achieved when additional information is obtained about facts and circumstances which would have affected the amounts recognised as of that date.
iv) Discontinued operations and non-current assets held for saleDiscontinued operations and non-current assets held for sale are defined as follows: a component of an entity that either has been disposed of, abandoned or is classified as held for sale; and • represents a separate major line of business or geographical area of operation; or• is part of a single coordinated plan to dispose of a separate major line of business or geographical area of operation; or• is a subsidiary acquired exclusively with a view to resale.
Classification as a discontinued operation occurs upon disposal, abandonment or when the operations meet the criteria to be classified as held for sale.
Non-current assets and disposal groups classified as held for sale are measured at the lower of the carrying value and the fair value less costs to sell.
Non-current assets and disposal groups are classified as held for sale if their carrying amounts will be recovered through a sale transaction rather than continued use. This condition is regarded as satisfied only when the sale is highly probable and the asset or disposal group is available for immediate sale in its present condition.
Management must be committed to the sale, which should be expected to qualify for recognition as a completed sale within one year of the date of classification. Property, plant and equipment and intangible assets, once classified as held for sale, are not depreciated or amortised.
When an operation is classified as a discontinued operation, the comparative statement of profit or loss and other comprehensive income is re-presented as if the operation had been discontinued from the start of the comparative year.
When the Group ceases to have control, any retained interest in the entity is re-measured to its fair value at the date when control is lost with the change in carrying amount recognised in profit or loss. The fair value is the initial carrying amount for the purposes of subsequently accounting for the retained interest as an Equity accounted investee or financial asset.
In addition, any movements previously recognised in other comprehensive income in respect of that entity are accounted for as if the Group had directly disposed of the related assets or liabilities. This may mean that amounts previously recognised in other comprehensive income are reclassified to profit or loss.
In determining the amount to be presented as discontinued operations, all intercompany items are eliminated on consolidation. These items are eliminated against continuing operations when an arrangement will not continue and are eliminated against discontinued operations where an arrangement will continue.
v) Non-controlling interestsNon-controlling interests represent the portion of the equity of a subsidiary not attributable either directly or indirectly to the Company and are presented separately in the income statement and within equity in the balance sheet, distinguished from shareholders’ equity attributable to owners of the Company.
(c) Foreign currency translationi) Functional and presentation currency
Items included in the financial statements of each of the Group’s subsidiaries, Joint Ventures & Associates are measured using the currency of the primary economic environment in which the entity operates (the functional currency).
The consolidated financial statements are presented in euro, which is the Company’s functional currency and the Group’s presentation currency.
ii) Transactions and balancesForeign currency transactions are translated into the functional currency using the exchange rates prevailing at the date of the transactions.
Foreign exchange gains and losses resulting from the settlement of such transactions are recognised in the income statement, except when deferred in equity as qualifying cash flow hedges or net investment hedges.
Monetary assets and liabilities denominated in foreign currencies are retranslated at the rate of exchange ruling at the reporting date.
Currency translation differences on monetary assets and liabilities are taken to the income statement, except when deferred in equity in the currency translation reserve as (i) qualifying cash flow hedges or (ii) exchange gains or losses on long-term intra-group loans and on net investment hedges.
Net investment hedges are foreign currency borrowings used to finance or provide a hedge against Group equity investments in non-euro denominated operations to the extent that they are neither planned nor expected to be repaid in the foreseeable future or are expected to provide an effective hedge of the net investment. When long-term intra-group loans are repaid the related cumulative currency translation recognised in the currency reserve is not reclassified to the income statement unless the entity is disposed of.

Glanbia plc | Annual Report and Financial Statements 2018
130
> Financial Statements
2. Summary of significant accounting policies continuediii) Subsidiaries, Joint Ventures & Associates
The income statement and balance sheet of subsidiaries, Joint Ventures & Associates that have a functional currency different from the presentation currency are translated into the presentation currency as follows: • assets and liabilities at each reporting date are translated at the closing rate at the reporting date of the balance sheet; • income and expenses in the income statement and statement of comprehensive income are translated at average exchange rates for the
year when they are a reasonable approximation of the cumulative effect of the rates on transaction dates; and• all resulting exchange differences are recognised in other comprehensive income.
Resulting exchange differences are taken to a separate currency reserve within equity. When a foreign entity is disposed of outside the Group, such exchange differences are recognised in the income statement as part of the gain or loss on disposal.
The principal exchange rates used for the translation of results and balance sheets into euro are as follows:
Average Year-end
Euro 1= 2018 2017 2018 2017
US dollar 1.1812 1.1295 1.1454 1.1993Pound sterling 0.8847 0.8764 0.9027 0.8872
iv) Business combinationsGoodwill and fair value adjustments arising on the acquisition of a foreign entity are denominated in the functional currency of the foreign entity, recorded at the exchange rate at the date of the transaction and subsequently retranslated at the applicable closing rates.
(d) Property, plant and equipmenti) Cost
Property, plant and equipment is stated at cost less accumulated depreciation and impairment losses.
Cost includes expenditure that is directly attributable to the acquisition of the assets.
Subsequent costs, for example the costs of major renovation, are included in the asset’s carrying amount or recognised as a separate asset, as appropriate, only when it is probable that future economic benefits associated with the item will flow to the Group and the cost of the item can be measured reliably.
The carrying amount of any component accounted for as a separate asset is de-recognised when replaced.
All other repairs and maintenance are charged to the income statement during the reporting period in which they are incurred.
Gains and losses on disposals are determined by comparing proceeds with the carrying amount and are included in the income statement.
Borrowing costs directly attributable to the construction of property, plant and equipment which take a substantial period of time to get ready for its intended use are capitalised as part of the cost of the assets.
ii) DepreciationDepreciation is calculated on the straight-line method to write off the cost (less residual value) of each asset over its estimated useful life at the following rates:
%
Land NilBuildings 2.5 – 5Plant and equipment 4 – 33Motor vehicles 20 – 25
Land is not depreciated.
Residual values and useful lives are reviewed and adjusted if appropriate at each reporting date.
Assets held under finance leases are depreciated over their expected useful lives on the same basis as owned assets or, where shorter, the term of the relevant lease.
iii) ImpairmentIn accordance with IAS 36 ‘Impairment of Assets’, the carrying amounts of items of property, plant and equipment are reviewed at each balance sheet date to determine whether there is any indication of impairment. An impairment loss is recognised whenever the carrying amount of an asset exceeds its recoverable amount.
Impairment losses are recognised in the income statement. Following the recognition of an impairment loss, the depreciation charge applicable to the asset is adjusted prospectively in order to systematically allocate the revised carrying amount, net of any residual value over the remaining useful life.
Notes to the Financial Statements continued

Glanbia plc | Annual Report and Financial Statements 2018
131
(e) Intangible assetsi) Goodwill
Goodwill is initially recognised at cost being the excess of the cost of an acquisition over the fair value of the Group’s share of the net identifiable assets, liabilities and contingent liabilities of the acquired subsidiary, Joint Venture or Associate at the date of acquisition.
Goodwill on acquisition of subsidiaries is included within intangible assets.
Goodwill associated with the acquisition of Joint Ventures & Associates is included within the interest in Joint Ventures & Associates under the equity method of accounting.
Following initial recognition goodwill is carried at cost less accumulated impairment losses, if applicable. Goodwill impairments are not reversed.
Goodwill is not amortised but is subject to impairment testing on an annual basis and at any time during the year if an indicator of impairment is considered to exist; the annual goodwill impairment tests are undertaken at a consistent time in each annual period. See section (v).
Gains and losses on the disposal of an entity include the carrying amount of goodwill relating to the entity sold.
In accordance with IFRS 1 ‘First time Adoption of International Financial Reporting Standards’, goodwill written off to reserves prior to date of transition to IFRS remains written off. In respect of goodwill capitalised and amortised at transition date, its carrying value at date of transition to IFRS remains unchanged.
ii) Research and development costsResearch expenditure is recognised as an expense in the income statement as incurred.
Costs incurred on development projects (relating to the design and testing of new or improved products) are recognised as intangible assets when it is probable that the project will be a success, considering, its commercial and technological feasibility and costs can be measured reliably.
Development costs are amortised using the straight line method over their estimated useful lives. The useful life is typically 3 years.
iii) Brands, customer relationships and other intangiblesBrands, customer relationships and other intangibles acquired as part of a business combination are stated at their fair value at the date control is achieved.
Indefinite life brands are carried at cost less accumulated impairment losses, if applicable. Indefinite life brands are not amortised on an annual basis but are tested annually for impairment. Indefinite life intangible assets are those for which there is no foreseeable limit to their expected useful life. The classification of the brands as indefinite is assessed annually.
Definite life brands, customer relationships and other intangibles are amortised using the straight-line method over their useful life as follows:
Years
Brands 10 – 40Customer relationships 5 – 15Other intangibles 2 – 15
The useful life used to amortise definite life brands, customer relationships and other intangibles relates to the future performance of the assets acquired and management’s judgement of the period over which the economic benefit will be derived from the assets.
The carrying values of definite life brands, customer relationships and other intangibles are reviewed for indicators of impairment at each reporting date and are subject to impairment testing when events or circumstances indicate that the carrying values may not be recoverable.
iv) Computer softwareComputer software is stated at cost less accumulated amortisation and impairment losses.
Costs incurred on the acquisition of computer software are capitalised, as are costs directly associated with developing computer software programmes for internal use, if they meet the recognition criteria of IAS 38 ‘Intangible Assets’.
Computer software costs recognised as assets are amortised using the straight-line method over their estimated useful lives, which is normally between five and 10 years.

Glanbia plc | Annual Report and Financial Statements 2018
132
> Financial Statements
2. Summary of significant accounting policies continuedv) Impairment of intangible assets
Goodwill and intangible assets that have an indefinite useful life are not subject to amortisation and are tested annually for impairment, or more frequently if events or changes in circumstances indicate that they might be impaired. Other assets are tested for impairment whenever events or changes in circumstances indicate that the carrying amount may not be recoverable.
For the purposes of impairment testing, assets are grouped at the lowest level for which there are separately identifiable cash flows (cash-generating units (CGUs)). An impairment is recognised in the income statement for the amount by which the carrying value of the CGU exceeds its recoverable amount. The recoverable amount is the higher of an asset’s fair value less costs to sell and its value in use. Value in use is determined as the discounted future cash flows of the CGU.
(f) Available for sale financial assetsAvailable for sale financial assets are non-derivatives that are either designated in this category or not classified in any of the other categories.
They are classified as non-current assets unless management intends to dispose of the available for sale financial asset within 12 months of the reporting date.
They are initially recognised at fair value plus transaction costs and are subsequently adjusted to fair value at each reporting date.
Unrealised gains and losses arising from changes in the fair value of the available for sale financial assets are recognised in other comprehensive income.
When such available for sale assets are disposed or impaired, the accumulated fair value adjustments are included in the income statement as gains or losses from available for sale financial assets.
The fair values of quoted financial assets are based on current bid prices (Level 1 within the fair value hierarchy).
If the market for a financial asset is not active or unquoted, the Group establishes fair value using valuation techniques.
Where the range of reasonable fair values is significant and the probability of various estimates cannot be reasonably assessed, the Group measures the investment at cost.
Dividends on available for sale financial assets are recognised in the income statement.
ImpairmentA significant or prolonged decline in the fair value of the security below its cost is considered an indicator that the securities are impaired. If any such evidence exists, the cumulative loss is measured as the difference between the acquisition cost and the current fair value. Impairment losses recognised in the income statement on equity instruments are not reversed through the income statement.
(g) InventoriesInventories are stated at the lower of cost or net realisable value.
Cost includes all expenditure incurred in the normal course of business in bringing the products to their present location and condition.
Cost is determined by the first-in, first-out (FIFO) method or by weighted average cost. The cost of finished goods and work in progress comprises raw materials, direct labour, other direct costs and related production overheads (based on normal capacity).
Costs of inventories include the transfer from equity of any gains/losses on qualifying cash flow hedges which relate to purchases of raw materials.
Net realisable value is the estimated selling price in the ordinary course of business, less the estimated costs of completion and selling expenses.
Allowance is made, where necessary, for aged, slow moving, obsolete and defective inventories.
(h) Trade and loan receivablesTrade and loan receivables are recognised initially at fair value and subsequently measured at amortised cost using the effective interest method less allowance for impairment.
These are classified as non-current assets except for those maturing within 12 months of the reporting date.
ImpairmentAn allowance for impairment of receivables is established when there is objective evidence that the Group will not be able to collect all amounts due according to the original terms of the receivables.
Objective evidence includes significant financial difficulties of the trade/loan receivable, probability that the trade/loan receivable will enter bankruptcy or financial reorganisation and default or delinquency in payments.
If collectability appears unlikely compared with the original terms of the receivable, the Group will determine the appropriate allowance based on the available evidence at that time.
Notes to the Financial Statements continued

Glanbia plc | Annual Report and Financial Statements 2018
133
The amount of the allowance is the difference between the asset’s carrying value and the estimated future cash flows. The carrying amount of the asset is reduced through the use of an allowance account and the amount of the loss is recognised in the income statement. When a receivable is uncollectable it is written off against an allowance account for receivables.
Subsequent recoveries of amounts previously written off are credited to the income statement. Where risks associated with receivables are transferred out of the Group under debt purchase agreements such receivables are recognised in the balance sheet to the extent of the Group’s continued involvement and retained risk. The Group has not entered into any debt purchase arrangement.
(i) Trade and other payablesTrade and other payables are recognised initially at their fair value and subsequently measured at amortised cost which approximates to fair value given the short-term nature of these liabilities.
These amounts represent liabilities for goods and services provided to the Group prior to, or at the end of the financial year which are unpaid.
The amounts are unsecured and are usually paid within 30–60 days of recognition depending on the terms negotiated with suppliers. Trade and other payables are presented as current liabilities unless payment is not due within 12 months after the reporting period.
(j) Provisions, contingent liabilities and contingent assetsProvisions are recognised on the balance sheet when the Group has a constructive or legal obligation as a result of past events, it is probable that an outflow of resources will be required to settle the obligation and the amount can be reliably estimated. Provisions are not recognised for future operating losses. Provisions are measured using management’s best estimate of the present value of the expenditure required to settle the present obligation at the end of the reporting period. The discount rate used to determine the present value is a pre-tax rate that reflects current market assessments of the time value of money and the risks specific to the liability. The increase in provision due to passage of time is recognised as an interest expense.
Provisions arising on business combinations are only recognised to the extent that they have qualified for recognition in the financial statements of the acquiree prior to acquisition.
A contingent liability is not recognised but is disclosed where the existence of the obligation will only be confirmed by future events or where it is not probable that an outflow of resources will be required to settle the obligation or where the amount of the obligation cannot be measured with reasonable reliability.
Contingent assets are not recognised but are disclosed where an inflow of economic benefits is probable.
(k) Cash and cash equivalentsCash and cash equivalents comprise cash on hand and deposits held on call with banks.
For the purposes of the Group statement of cash flows, cash and cash equivalents consists of cash and cash equivalents as defined above net of bank overdrafts.
(l) Financial liabilitiesFinancial liabilities are recognised initially at fair value and are subsequently stated at amortised cost.
Financial liabilities are classified as current liabilities unless the Group has an unconditional right to defer settlement of the liability for at least 12 months after the reporting date.
Financial assets and liabilities are offset and the net amount reported in the balance sheet when there is a legally enforceable right to offset the recognised amounts and there is an intention to settle on a net basis or realise the asset and settle the liability simultaneously. The legally enforceable right must not be contingent on future events and must be enforceable in the normal course of business and in the event of default, insolvency or bankruptcy of the Company or the counterpart.
(m) Employee benefitsi) Pension obligations
The Group operates various pension plans. The plans are funded through payments to trustee-administered funds. The Group has both defined contribution and defined benefit plans.
Defined contribution pensionA defined contribution plan is a pension plan under which the Group pays fixed contributions into a separate entity. The Group has no legal or constructive obligation to pay further contributions if the fund does not hold sufficient assets to pay all employees the benefits relating to employee service in the current and prior periods.
The contributions are recognised as an employee benefit expense in the income statement when they are due.
Defined benefit pension obligationDefined benefit plans define an amount of pension benefit that an employee will receive on retirement, usually dependent on one or more factors such as age, years of service and compensation.
The liability recognised in the balance sheet in respect of defined benefit pension plans is the present value of the defined benefit obligation at the reporting date less the fair value of the plan assets.

Glanbia plc | Annual Report and Financial Statements 2018
134
> Financial Statements
2. Summary of significant accounting policies continuedThe defined benefit obligation is calculated annually by independent actuaries using the projected unit credit method. The present value of the defined benefit obligation is determined by discounting the estimated future cash outflows using interest rates of high-quality corporate bonds that are denominated in the currency in which the benefits will be paid, and that have terms to maturity approximating to the terms of the related pension obligation.
The fair value of plan assets is based on market price information and in the case of quoted securities in active markets it is the published bid price.
Remeasurement gains and losses arising from experience adjustments and changes in actuarial assumptions are recognised in the period in which they occur, directly in other comprehensive income. They are included in retained earnings in the statement of changes in equity and in the balance sheet. Remeasurements are not reclassified to the income statement in subsequent periods.
A curtailment arises when the Group significantly reduces the number of employees or employee entitlements covered by a plan. A past service cost may be either positive (when benefits are introduced or changed so that the present value of the defined benefit obligation increases) or negative (when benefits are withdrawn or changed so that the present value of the defined benefit obligation decreases).
A settlement occurs when an entity enters into a transaction that eliminates all further legal or constructive obligation for part or all of the benefits provided under a defined benefit plan (other than a payment of benefits to, or on behalf of, employees in accordance with the terms of the plan and included in the actuarial assumptions).
The gain or loss on a settlement is the difference between: (a) the present value of the defined benefit obligation being settled, as determined on the date of settlement; and (b) the settlement price, including any plan assets transferred and any payments made directly by the entity in connection with the settlement.
The deferred tax impact of pension plan obligations is disclosed separately within deferred tax assets.
ii) Share-based paymentsThe Group operates a number of equity settled share-based compensation plans which include share option and share award schemes which are open to Executive Directors and certain senior managers.
The charge to the income statement in respect of share-based payments is based on the fair value of the equity instruments granted and is spread over the performance period.
Options under the 2002 Long-term incentive planThe fair value of the instruments awarded were calculated using the binomial model.
The proceeds received are credited to share capital (nominal value) and share premium when the options are exercised.
The market vesting condition is Total Shareholder Return (TSR) and the awards contain both market and non-market vesting conditions.
Awards under the 2008 and 2018 Long-term incentive planThe 2018 Long-term incentive plan replaces the 2008 Long-term incentive plan which expired on 4 March 2018. No further awards will be made under the 2008 Long-term incentive plan.
The fair value of the awards is calculated using a Monte Carlo simulation technique. The awards contain both market and non-market vesting conditions. The market vesting condition is TSR and, accordingly, the fair value assigned to the related equity instruments is adjusted so as to reflect the anticipated likelihood at the grant date of achieving the market-based vesting condition. There are no revisions to the fair value at subsequent reporting dates for changes in TSR estimates.
Non-market vesting conditions are included in assumptions about the number of awards that are expected to vest. At each reporting date, the Group revises its estimates of the number of awards that are expected to vest based on the non-market vesting conditions. It recognises the impact of the revision to original estimates, if any, in the income statement with a corresponding adjustment to equity.
The non-market based charge to the income statement is reversed where awards do not vest because non-market performance conditions have not been met or where, subject to the rules of the scheme, an employee in receipt of share awards leaves service before the end of the vesting period.
Awards under the Annual incentive deferred into shares scheme (AIDIS)The fair value of shares awarded is determined in line with the Group’s Annual Incentive Scheme rules and equates with the cash value of the portion of the annual incentive that will be settled by way of shares. The expense is recognised immediately in the income statement with a corresponding entry to equity.
Notes to the Financial Statements continued

Glanbia plc | Annual Report and Financial Statements 2018
135
(n) Derivative financial instruments The activities of the Group expose it primarily to the financial risks of changes in foreign currency exchange rates, interest rates and commodity prices. The Group uses foreign currency, interest rate and commodity derivative financial instruments to hedge these exposures.
Derivatives are initially recorded at fair value and subsequently remeasured at their fair value at the reporting date. Other than for ‘regular way’ contracts for which settlement date accounting is applied, derivative contracts are recognised on the date the contract is entered into.
The fair value of any foreign currency contracts or any commodities contract is estimated by discounting the difference between the contractual forward price and the current forward price, using the market interest rate at the measurement date, for a time period equal to the residual maturity of the contract.
The fair value of any interest rate swap is estimated by discounting future cash flows under the swap, using the market interest rates, at the measurement date, for time periods equal to the residual maturity of the contracted cash flows.
The method of recognising the resulting gain or loss depends on whether the derivative is designated as a hedging instrument and, if so, the nature of the item being hedged.
The Group designates certain derivatives as either: (1) hedges of the fair value of recognised assets or liabilities or a firm commitment (fair value hedge); or (2) hedges of a particular risk associated with a recognised asset or liability or a highly probable forecast transaction (cash flow hedge).
The Group documents at the inception of the transaction, the relationship between hedging instruments and hedged items, as well as its risk management objective and strategy for undertaking various hedging transactions. The Group also documents its assessment, both at hedge inception and half yearly, of whether the derivatives that are used in hedging transactions are effective in offsetting changes in fair values or cash flows of hedged items.
The fair values of various derivative instruments used for hedging purposes are disclosed in note 31. Movements on the cash flow hedging reserve in equity are shown in note 24. The full fair value of a hedging derivative is classified as a non-current asset or liability if the remaining maturity of the hedged item is more than 12 months, and as a current asset or liability if the remaining maturity of the hedged item is less than 12 months.
i) Fair value hedgeChanges in the fair value of derivatives that are designated and qualify as fair value hedges are recorded in the income statement, together with any changes in the fair value of the hedged asset or liability that are attributable to the hedged risk.
ii) Cash flow hedgeThe effective portion of changes in the fair value of derivatives that are designated and qualify as cash flow hedges is recognised in other comprehensive income. The gain or loss relating to the ineffective portion is recognised immediately in the income statement.
Amounts accumulated in equity are recycled in the income statement in the periods when the hedged item affects profit or loss (for instance when the forecast sale that is hedged takes place). The recycled gain or loss relating to the effective portion of interest rate swaps hedging variable interest rates on borrowings is recognised in the income statement within ‘finance costs’. The recycled gain or loss relating to the effective portion of foreign exchange contracts is recognised in the income statement.
When a hedging instrument expires or is sold or when a hedge no longer meets the criteria for hedge accounting, any cumulative gain or loss existing in equity at that time remains in equity until the forecast transaction occurs. When a forecast transaction is no longer expected to occur, the cumulative gain or loss that was reported in equity is immediately transferred to the income statement.
iii) Derivatives that do not qualify for hedge accountingChanges in the fair value of any derivative instruments that do not qualify for hedge accounting are recognised in the income statement.
iv) Financial guarantee contractsFinancial guarantee contracts are issued to banking institutions by the Group and Company on behalf of certain of its subsidiaries. These subsidiaries engage in ongoing financing arrangements with these banking institutions. Under the terms of IAS 39 ‘Financial Instruments: Recognition and Measurement’, financial guarantee contracts are required to be recognised at fair value at inception and subsequently measured as a provision under IAS 37 ‘Provisions, Contingent Liabilities and Contingent Assets’, on the Company balance sheet. Guarantees provided by the Company over the payment of employer contributions in respect of the UK defined benefit pension plans are treated as insurance contracts (note 32).

Glanbia plc | Annual Report and Financial Statements 2018
136
> Financial Statements
2. Summary of significant accounting policies continued(o) Income taxesThe tax expense for the period comprises current and deferred tax. Tax is recognised in the income statement except to the extent that it relates to items recognised in other comprehensive income or directly in equity, in which case the tax is also recognised in other comprehensive income or directly in equity, respectively.
i) Current taxCurrent tax is calculated on the basis of tax laws enacted or substantively enacted at the Group balance sheet date in countries where the Group operates and generates taxable income, taking into account adjustments relating to prior years.
Management periodically evaluates positions taken in tax returns with respect to situations in which applicable tax legislation is subject to interpretation and establishes provisions, where appropriate, on the basis of amounts expected to be paid to the tax authorities. Management uses in-house tax experts, professional firms and previous experience when assessing tax risks and the tax uncertainties have been measured using a probability weighted expected value approach. We recognise interest and penalties related to tax uncertainties within income taxes in the income statement and within provisions on the balance sheet. Further detail on estimates and judgements are set out in note 3.
Current tax assets and liabilities are offset only if certain criteria are met.
ii) Deferred tax Deferred tax is determined using tax rates and laws enacted or substantively enacted by the reporting date. Deferred tax is provided on a non-discounted basis, using the balance sheet liability method, providing for temporary differences on the reporting date between the tax bases of assets and liabilities and their carrying amounts in the financial statements. However, deferred tax is not accounted for if it arises from initial recognition of an asset or liability in a transaction, other than a business combination, that at the time of the transaction affects neither accounting nor taxable profit or loss. Deferred tax liabilities are not recognised to the extent they arise from the initial recognition of goodwill not having full tax basis.
The carrying amount of a deferred tax asset or liability may change for reasons other than a change in the temporary difference itself. Such changes might arise as a result of a change in tax rates or laws, a reassessment of the recoverability of a deferred tax asset or a change in the expected manner of recovery of an asset or the expected manner of a settlement of a liability. The impact of these changes is recognised in the income statement or in other comprehensive income depending on where the original deferred tax balance was recognised.
Deferred tax is provided on temporary differences arising on investments in subsidiaries, Joint Ventures & Associates except where the timing of the reversal of the temporary difference can be controlled by the Group and it is probable that the temporary difference will not reverse in the foreseeable future.
Deferred tax assets are recognised to the extent that it is probable that future taxable profit will be available against which the temporary differences can be utilised.
Deferred tax assets and liabilities are offset when there is a legally enforceable right to set off current tax assets against current tax liabilities and when they relate to income taxes levied by the same tax authority and the Group intends to settle its current tax assets and liabilities on a net basis.
(p) Government grantsGrants from government authorities are recognised at their fair value where there is a reasonable assurance that the grant will be received and the Group will comply with all attached conditions.
Revenue grants are deferred and recognised in the income statement over the period necessary to match them with the costs they are intended to compensate.
Government grants relating to the purchase of property, plant and equipment are included in current and non-current liabilities and are credited to the income statement on a straight-line basis over the expected lives of the related assets.
Research and development taxation credits are recognised at their fair value in the income statement where there is reasonable assurance that the credit will be received.
(q) Share capitali) Equity
Ordinary shares are classified as equity. Incremental costs directly attributable to the issue of new shares or options are shown in equity as a deduction from the proceeds.
ii) Own sharesWhere the Employee Share Trust and/or the Employee Share Scheme Trust (on behalf of the Company) purchases the Company’s equity share capital, under the 2008 and 2018 Long-term incentive plan and the Annual Incentive Deferred into Shares Scheme, the consideration paid is deducted from total equity and classified as own shares until they are re-issued. Where such shares are re-issued, they are re-issued on a first-in, first-out basis and the amount re-issued is transferred from own shares to retained earnings.
Notes to the Financial Statements continued

Glanbia plc | Annual Report and Financial Statements 2018
137
(r) Revenue recognitionRevenue is measured at the fair value of the consideration received/receivable for the sale of goods to external customers net of value added tax, rebates and discounts.
The Group recognises revenue when the amount of revenue can be reliably measured, when it is probable that future economic benefit will flow to the entity and when specific criteria have been met for each of the Group’s activities.
Revenue from the sale of goods is recognised when significant risks and rewards of ownership of the goods are transferred to the buyer. Revenue is typically recognised on dispatch or on delivery depending on the specific terms agreed with the customer.
Rebates and discounts are provided for based on agreements or contracts with customers, agreed promotional arrangements and accumulated experience. Rebates and discounts are recorded in the same period as the original revenue.
Interest income is recognised using the effective interest rate method.
Dividends are recognised when the right to receive payment is established.
Revenue from the sale of property is recognised when there is an unconditional and irrevocable contract for sale.
If the Group acts in the capacity of an agent rather than as the principal in a transaction, then the revenue recognised is the net amount of commission made by the Group. Management considers the following factors to determine whether the Group acts as an agent or principal: (a) whether the Group takes title to or is exposed to inventory risk related to the goods, or has no significant responsibility in respect of the goods sold; (b) although the Group collects the revenue from the final customer, all credit risk is borne by the supplier of the goods; and (c) the ability of the Group to vary the selling prices set by the supplier by more than a small percentage.
The timing of recognition of service revenue equals the timing of when the services were rendered.
(s) Segment reportingIn identifying the Group’s operating segments, management considered the following factors:• how financial information is reported to the Chief Operating Decision Maker (CODM)• existence of managers responsible for the components• the nature of the component business activities• the nature of products and services • the nature of the production processes• the type or class of customer• the methods used to distribute the products.
The Group has identified three reportable segments and these are as follows:
Glanbia Performance NutritionGlanbia Performance Nutrition manufactures and sells sports nutrition and lifestyle nutrition through a variety of channels including specialty retail, the internet, FDMC (food, drug, mass and club), and gyms in a variety of formats, including powders, Ready-to-Eat (bars and snacking foods) and Ready-to-Drink beverages.
Glanbia NutritionalsGlanbia Nutritionals manufactures and sells cheese, dairy and non-dairy nutritional ingredients and vitamin and mineral premixes targeting the increased market focus on health and nutrition.
Glanbia IrelandThe Glanbia Ireland Joint Venture was created on 2 July 2017 following the disposal of 60% of Dairy Ireland and related assets to Glanbia Co-operative Society Limited. Glanbia Ireland is the largest milk processor in Ireland producing a range of value added dairy ingredients and consumer products. Glanbia Ireland is also a large scale seller of animal nutrition and fertilizer as well as having a chain of agricultural retail outlets in Ireland.
Other segmentsOther non-reportable segments include Equity accounted investees which do not meet the segment criteria, individually or on an aggregate basis, as outlined in IFRS 8 ‘Operating segments’.
These segments align with the Group’s internal reporting system and the way in which the CODM (Glanbia Operating Executive) assesses performance and allocates the Group’s resources.
Finance income, finance costs and income taxes are not allocated to segments, as this type of activity is driven by central treasury and taxation functions which manage the cash and tax position of the Group. Unallocated assets and liabilities primarily include tax, cash and cash equivalents, available for sale financial assets, financial liabilities and derivatives. Inter-segment revenue is determined on an arm’s-length basis. Where a material dependency or concentration on an individual customer would warrant disclosure, this is disclosed in the operating segments note under IFRS 8 ‘Operating Segments’.

Glanbia plc | Annual Report and Financial Statements 2018
138
> Financial Statements
2. Summary of significant accounting policies continued(t) DividendsDividends on ordinary shares to the Company’s shareholders are recognised as a liability of the Company when approved by the Company’s shareholders. Interim dividends are recognised when paid.
Proposed dividends that are approved after the balance sheet date are not recognised as a liability but are disclosed in the dividends note.
(u) Finance costsFinance costs comprise interest payable on borrowings calculated using the effective interest rate method, net losses on hedging instruments that are recognised in the income statement, facility fees and the unwinding of discounts on provisions. The interest expense component of finance lease payments is recognised in the income statement using the effective interest rate method.
General and specific finance costs that are directly attributable to the acquisition, construction or production of a qualifying asset are capitalised during the period of time that is required to complete and prepare the asset for its intended use or sale. Qualifying assets are assets that necessarily take a substantial period of time to get ready for their intended use or sale.
Other finance costs are expensed in the income statement in the period in which they are incurred.
(v) Finance incomeFinance income is recognised in the income statement as it accrues using the effective interest rate method and includes net gains on hedging instruments that are recognised in the income statement.
(w) Earnings Per ShareEarnings Per Share (EPS) represents the profit attributable to owners of the Company divided by the weighted average number of ordinary shares in issue during the period excluding own shares.
Adjusted EPS is calculated on the net profit attributable to the owners of the Company before exceptional items and intangible asset amortisation (excluding software amortisation), net of related tax, divided by the weighted average number of ordinary shares in issue during the period excluding own shares.
This has been provided on a pro-forma basis in the current and prior year as it represents the revised and on-going structure of the Group following the disposal of 60% of the Dairy Ireland segment and related assets. Pro-forma Adjusted EPS is calculated based on the net profit attributable to equity holders of the parent from continuing activities plus 40% of the share of profits of Dairy Ireland and related assets, before exceptional items and amortisation of intangible assets (excluding software amortisation), net of related tax.
Pro-forma adjusted EPS is a non-IFRS metrics. Full details on the calculation and reconciliation to IFRS reported numbers are included in the Glossary on pages 203 to 212.
Diluted EPS is calculated by adjusting the weighted average number of ordinary shares outstanding to assume conversion of all dilutive potential ordinary shares.
(x) Leasesi) Finance leases
Leases of assets where the Group has substantially all the risks and rewards of ownership are classified as finance leases. All other leases are operating leases.
A determination is also made as to whether the substance of an arrangement could equate to a finance lease.
Finance leases are capitalised at the inception of the lease at the lower of the fair value of the leased asset or the present value of the minimum lease payments.
Each lease payment is allocated between the liability and finance cost. The property, plant and equipment acquired under finance leases is depreciated over the shorter of the useful life of the asset or the lease term.
The corresponding rental obligation, net of finance charges is included in financial liabilities and split between current and non-current, as appropriate.
ii) Operating leasesLeases where a significant portion of the risks and rewards of ownership are retained by the lessor are classified as operating leases.
Payments made under operating leases (net of any incentives received from the lessor) are charged to the income statement on a straight-line basis over the period of the lease.
(y) Termination benefitsTermination benefits are payable when employment is terminated by the Group before the normal retirement date or whenever an employee accepts voluntary redundancy in exchange for these benefits. The Group recognises termination benefits at the earlier of the following dates: (a) when the Group can no longer withdraw the offer of those benefits; and (b) when the entity recognises costs for a restructuring that is within the scope of IAS 37 ‘Provisions, Contingent Liabilities and Contingent Assets’ and involves the payment of termination benefits.
Notes to the Financial Statements continued
Glanbia plc | Annual Report and Financial Statements 2018
139
(z) Income statement formati) Exceptional items
The Group has adopted an income statement format that seeks to highlight significant items within the Group results for the year. Such items may include restructuring, impairment of assets, including material adjustments arising from the re-assessment of asset lives, adjustments to contingent consideration, material acquisition integration costs, restructuring costs, profit or loss on disposal or termination of operations, material acquisition costs, litigation settlements, legislative changes, gains or losses on defined benefit pension plan restructuring and profit or loss on disposal of investments. Judgement is used by the Group in assessing the particular items which by virtue of their scale and nature should be disclosed in the income statement and notes as exceptional items.
ii) Earnings before interest, tax and amortisationThe Group believes that Earnings before interest, tax and amortisation (EBITA) is a relevant performance measure and has therefore disclosed this amount in the Group income statement. EBITA is stated before considering the share of results of Equity accounted investees.
(aa) Financial assets – CompanyInvestments in subsidiaries and associates held by the Company are carried at cost.
(ab) New accounting standards and IFRIC interpretationsThe following standards, amendments and interpretations have been published. The Group will apply the relevant standards from their effective dates. The standards are mandatory for future accounting periods but are not yet effective for the Group and have not been early adopted by the Group.
IFRS 9 ‘Financial Instruments’ (EU effective date: on or after 1 January 2018)This standard will be effective for and will be adopted by the Group for the 2019 financial year beginning 30 December 2018. Comparative information will not be restated in accordance with transitional provisions.
The impact of IFRS 9 on the Group has been assessed and the findings are as follows:
Classification and measurementFor an equity instrument currently classified as available for sale (AFS), there is an option to present its fair value changes in other comprehensive income and not recycle any gains or losses arising on its de-recognition to the income statement (“OCI option”). The AFS reserve related to equity investments currently held as AFS is not significant. Notwithstanding the application of the OCI option to a security, the application of IFRS 9 will not have a significant impact.
Trade receivables meet the ‘solely payments of principal and interest’ definition and are held to collect and therefore will continue to be carried at amortised cost on transition to IFRS 9.
There will be no impact on the Group’s accounting for financial liabilities, as the new requirements only affect the accounting for financial liabilities that are designated at fair value through profit or loss and the Group does not have any such liabilities.
ImpairmentIFRS 9 introduces a forward-looking expected credit losses model (ECL), rather than the current incurred loss model, which is applied to financial assets within the scope of IFRS 9, contract assets under IFRS 15, lease receivables and certain financial guarantees held for its subsidiaries. The standard allows the use of practical expedients to measure expected credit losses which will be adopted by the Group in determining those for trade receivables. On transition to IFRS 9, the impact of utilising the expected credit losses model is not significant to the Group.
Hedge accountingThe Group will adopt the hedge accounting section of IFRS 9 on transition to the new standard. The Group determined that all existing hedge relationships that are currently designated in effective hedging relationships will continue to qualify for hedge accounting under IFRS 9. As IFRS 9 does not change the general principles of how an entity accounts for effective hedges, no impact to the Group’s results has been identified from the Group’s assessment of the hedge accounting requirements.
IFRS 15 ‘Revenue from Contracts with Customers’ (EU effective date: on or after 1 January 2018)This standard will be effective for and will be adopted by the Group for the 2019 financial year beginning 30 December 2018.
The Group will adopt the full retrospective approach to transition at the date of initial application. The Group has assessed the impact of implementing IFRS 15 and, with the exception of the matter set out below, has not identified any material impacts resulting from transition to the new standard.
Following a review of all material contracts with customers, the Group has concluded that the revised principal versus agent considerations will lead to the Group’s relationship with its Joint Venture, Southwest Cheese Company, LLC (Southwest Cheese) to transition from an agent relationship to that of a principal. Based on sales by Southwest Cheese, the transition to the new standard would result in a gross up of revenue and costs of sales of €784.2 million for 2018. Although there is no change to EBITA, as a result of the increase in revenue, there would be a dilution to the EBITA margin of the Glanbia Nutritionals segment and the Glanbia Group. Full impact of this change is set out in the Group Finance Director’s review on pages 30 to 35. For the 2019 financial year, revenue and costs relating to this arrangement will be shown gross in the Group income statement.

Glanbia plc | Annual Report and Financial Statements 2018
140
> Financial Statements
2. Summary of significant accounting policies continuedIFRS 15 ‘Revenue from Contracts with Customers’ (EU effective date: on or after 1 January 2018) continuedOther findings resulting from the IFRS 15 assessment include:
The Group manufactures and sells performance nutrition products, cheese, dairy and non-dairy nutritional ingredients. Sales are recognised at a point in time when control of the products has transferred to the customer, which is dependent on the contractual terms with each customer. In most cases, control transfers to the customer when the products are dispatched or delivered to the customer.
The Group does not expect to have any contracts where the period between the transfer of the promised products to the customer and payment by the customer exceeds one year. Thus, the Group does not adjust any of the transaction prices for the time value of money as a practical expedient.
IFRS 15 increases the disclosure requirements for revenue. Revenue is required to be disaggregated into categories that depict how the nature, amount, timing and uncertainty of revenue and cash flows are affected by economic factors. The Group is evaluating the category (or categories) to disaggregate revenue from contracts with customers for disclosure purposes. It is considering segments and geographical regions as categories as the Group is managed based on segments and have operations in a variety of countries.
IFRS 16 ‘Leases’ (EU effective date: on or after 1 January 2019) This standard will be effective for and will be adopted by the Group for the 2020 financial year beginning 5 January 2020.
The Group’s evaluation of the effect of adoption of IFRS 16 is ongoing and the initial findings are detailed as follows.
The Group expects to adopt the modified retrospective approach to transition permitted by the standard in which the cumulative effect of initially applying the standard is recognised in opening retained earnings at the date of initial application.
The Group expects that the adoption of IFRS 16 will have a material impact on the financial statements, significantly increasing the Group’s recognised assets and liabilities. The Group has approximately 600 operating leases for a range of assets principally relating to property, equipment and vehicles. On transition to the new standard, the fair value of these leases representing the present value of the lease payments over the expected lease contract period will be recognised as a Right of Use Asset with a corresponding value recognised as a lease liability. The Group commenced a comprehensive project to assess the impact of IFRS 16 during 2018 which is still ongoing. This project includes an accounting assessment of the impact and implementing new processes and procedures, including a new software implementation, to ensure leases are accounted for in line with the new standard from the commencement of our 2020 financial year. As the Group’s evaluation of the effect of adoption of IFRS 16 is still ongoing, the fair values of the leases are being determined. The Group intends to avail of the election to exclude short-term leases and leases for which the underlying asset is of low value from being recognised as leased assets and liabilities.
Information on the Group’s leases currently classified as operating leases is provided in note 33.
IFRIC 23 ‘Uncertainty over Income Tax treatments’ (EU effective date: 1 January 2019)The interpretation sets out how to determine taxable profit (tax loss), tax bases, unused tax losses, unused tax credits and tax rates when there is uncertainty over income tax treatments under IAS 12 ‘Income taxes’. The Group is currently evaluating the impact of this interpretation on future periods.
The following new accounting standards and IFRIC interpretations, issued but not yet effective, are not expected to have a material impact on the Group:
Amendments to IFRS 2 ‘Classification and Measurement of Share-based payment Transactions’ (EU effective date: on or after 1 January 2018)These amendments clarify that only market and non-vesting conditions are taken into account in the measurement of the fair value of the liability in a cash-settled share-based payment transaction. Vesting conditions (other than market conditions) are considered when estimating the number of awards expected to vest.
Annual Improvements to IFRSs 2014–2016 Cycle (EU effective date: on or after 1 January 2018)A number of small amendments to IAS 28 ‘Investments in Associates and Joint Ventures’.
Amendments to IAS 40 ‘Transfers of Investment Property’ (EU effective date: on or after 1 January 2018)This amendment provides guidance on transfers to, or from, investment properties.
IFRIC Interpretation 22 ‘Foreign Currency Translation and Advance Consideration’ (EU effective date: on or after 1 January 2018)IFRIC 22 clarifies the accounting for transactions that include the receipt or payment of advance consideration in a foreign currency.
Amendments to IFRS 4 ‘Insurance Contracts’ (EU effective date: on or after 1 January 2018)The amendments address concerns arising from implementing the new financial instruments standard, IFRS 9, before implementing IFRS 17, which replaces IFRS 4. The amendments introduce two options for entities issuing insurance contracts: a temporary exemption from applying IFRS 9 and an overlay approach.
Amendments to IAS 28 ‘Long-term Interests in Associates and Joint Ventures’ (EU effective date: on or after 1 January 2019)The amendments clarify that an entity applies IFRS 9 ‘Financial Instruments’ to long-term interests in an Associate or Joint Venture that form part of the net investment in the Associate or Joint Venture but to which the equity method is not applied.
Notes to the Financial Statements continued

Glanbia plc | Annual Report and Financial Statements 2018
141
Amendments to IAS 19 ‘Employee Benefits’ (IASB effective date: on or after 1 January 2019 – not yet endorsed)The amendments clarify the effect of a plan amendment, curtailment or settlement on the requirements regarding the asset ceiling. It also clarifies that if a plan amendment, curtailment or settlement occur, that it is mandatory that the current service cost and the net investment for the period after the re-measurement are determined using the assumptions used for the re-measurement.
Amendments to IFRS 9 ‘Financial Instruments’ (EU effective date: on or after 1 January 2019)The amendments address concerns about how IFRS 9 ‘Financial Instruments’ classifies particular pre-payable financial assets. In addition, the IASB has clarified an aspect of the accounting for financial liabilities following a modification.
Annual Improvements to IFRSs 2015–2017 Cycle (IASB effective date: on or after 1 January 2019 – not yet endorsed)A number of small amendments to IFRS 3 ‘Business combinations’, IFRS 11 ‘Joint arrangements’, IAS12 ‘Income taxes’ and IAS 23 ‘Borrowing Costs’.
IFRS 17 ‘Insurance Contracts’ (IASB effective date: on or after 1 January 2022 – not yet endorsed)This standard replaces the guidance in IFRS 4 ‘Insurance Contracts’. It requires insurance liabilities to be measured at a current fulfilment value and provides a more uniform measurement and presentation approach for all insurance contracts. These requirements are designed to achieve the goal of a consistent, principle based accounting for insurance contracts.
Amendments to IFRS 3 ‘Business Combinations’ (IASB effective date: on or after 1 January 2020 – not yet endorsed)The amendments clarify the definition of a business to help entities determine whether an acquired set of activities and assets is a business or not.
Amendments to IAS 1 ‘Presentations of Financial Statements’ and IAS 8 ‘Accounting Policies, Changes in Accounting Estimates and Errors’ (IASB effective date: on or after 1 January 2020 – not yet endorsed)The amendments align the definition of ‘material’ across the standards and clarify aspects of the definition. They clarify that materiality will depend on the nature or magnitude of information, or both.
Amendments to References to the Conceptual Framework for Financial Reporting (IASB effective date: on or after 1 January 2020 – not yet endorsed)The purpose of the Conceptual Framework is to assist the Board in developing standards, to help preparers develop consistent accounting policies if there is no applicable standard in place and to assist all parties to understand and interpret the standards.
3. Critical accounting estimates and judgementsEstimates and judgements are continually evaluated and are based on historical experience and other factors, including expectations of future events that are believed to be reasonable under the circumstances.
The Group makes estimates and assumptions concerning the future. The resulting accounting estimates will, by definition, seldom equal the related actual results. Revisions to estimates are recognised prospectively. Significant judgements and estimates made in the preparation of these financial statements are set out below. With the exception of retirement benefit obligations, which are subject to market conditions, it is not expected that there will be a material adjustment to the carrying value of the assets and liabilities of the other areas outlined below.
Judgements Information about judgements made in applying accounting policies that have the most significant effects on the amounts recognised in the consolidated financial statements is included in the following notes: • Note 2(r) – commission revenue: whether the Group acts as an agent in the transaction rather than as a principal; • Note 17 – amortisation of intangible assets: estimation of useful life of development assets;• Note 6 – exceptional items: assessing particular items which by virtue of their scale and nature should be disclosed in the income statement
and noted as exceptional items; • Note 18 – interests in Joint Ventures: whether the Group has joint control over an investee; and• Note 2(x) – lease classification.
EstimatesImpairment reviews of goodwill and indefinite life intangiblesThe Group tests annually whether goodwill and indefinite life intangibles have suffered any impairment, in accordance with the accounting policy stated in note 2(e). The recoverable amounts of cash-generating units (CGUs) have been determined based on value in use calculations. These calculations require the use of estimates.
Goodwill and intangible assets in respect of Glanbia Performance Nutrition and Glanbia Nutritionals are tested for impairment using projected cash flows over a three year period. In cases where management have strategic plans beyond three years these numbers are also used in the projections. Discount rates are based on the Group weighted average cost of capital adjusted for company risk factors and specific country risk. A terminal value assuming 2% growth into perpetuity is also applied. Sensitivity on the cashflows is also prepared based on a reduction in projected EBITDA of 10%, a terminal value assuming zero growth or an increase in the discount factor used by 1%. Indefinite life intangible assets are those for which there is no foreseeable limit to their expected useful life. The classification of intangible assets as indefinite is reviewed annually.
Additional information in relation to impairment reviews is disclosed in note 17.

Glanbia plc | Annual Report and Financial Statements 2018
142
> Financial Statements
3. Critical accounting estimates and judgements continuedIncome taxes The Group is subject to income tax in numerous jurisdictions. Significant estimation is required in determining the worldwide provision for income taxes. There are many transactions during the ordinary course of business for which the ultimate tax determination is uncertain and the applicable tax legislation is open to differing interpretations. The Group takes external professional advice to help minimise this risk. It recognises liabilities for anticipated tax authority reviews based on estimates of whether additional taxes will be due, having regard to all information available on the tax matter. The Group engages with local tax experts to support the judgements made where there is significant uncertainty about the position taken. In determining any liability for amounts expected to be paid to tax authorities, the Group has regard to the tax status of the entities involved, the external professional advice received, the status of negotiations and correspondence with the relevant tax authorities, assessments of a probability weighted expected value, past practices of the tax authorities and any precedents in the relevant jurisdiction. Where the final outcome of these tax matters is different from the amounts that were initially recorded, such differences will impact the income tax and deferred tax provisions in the period in which such determination is made.
Deferred tax assets are recognised to the extent that it is probable that future taxable profit will be available against which the unused tax losses and unused tax credits may be utilised. The Group estimates the most probable amount of future taxable profits using assumptions consistent with those employed in impairment calculations and taking into consideration applicable tax legislation in the relevant jurisdiction.
On 22 December 2017, the Tax Cuts and Jobs Act was signed into law in the United States which reduced the federal corporation tax rate from 35% to 21%. The impact of the reduction in the US tax rate has been factored into the calculation of the 2017 and 2018 US tax liabilities. Certain assumptions have been made in the calculation of income taxes where the application of the new legislation has not been confirmed. It is not expected that there will be a material adjustment, within the next financial year, to the carrying amounts of tax assets and liabilities as at 29 December 2018 as a result of the assumptions made.
Retirement benefit obligationsThe Group operates a number of defined benefit pension plans both in Ireland and the UK. The rates of contributions payable, the pension cost and the Group’s total obligation in respect of defined benefit plans is calculated and determined by independent qualified actuaries and updated at least annually. The Irish plans have plan assets totalling €105.9 million (2017: €103.3 million) and plan liabilities of €127.3 million (2017: €122.7 million) giving a net pension deficit of €21.4 million (2017: €19.4 million). The UK plans have plan assets totalling €80.4 million (2017: €82.4 million) and plan liabilities of €97.5 million (2017: €104.9 million) giving a net pension deficit of €17.1 million (2017: €22.5 million).
The size of the obligation and cost of the benefits are sensitive to actuarial assumptions. These include demographic assumptions covering mortality and longevity, and economic assumptions including price inflation, benefit and salary increases together with the discount rate used. As a result of the UK referendum on EU membership, and the ongoing Brexit negotiations, the Group’s UK defined benefit pension plan assumptions are subject to increased volatility and risk. The Group disclose the UK defined benefit pension plan details separate from the Irish plans to identify the impact of a change in UK assumptions on the Group’s defined benefit pension plans.
On 26 October 2018, the High Court of Justice of England and Wales issued a judgement in the case of Lloyds Banking Group Pension Trustees Limited v Lloyds Bank plc (and others) regarding the rights of members to equality in defined benefit pension schemes. The judgement concluded that schemes are under a duty to equalise benefits for all members, regardless of gender, in relation to guaranteed minimum pension benefits. The Group has engaged its actuaries to determine an appropriate estimate for the reporting period. The computations are complex and it is expected it will take a number of years to finalise the full impact. The directors do not believe the result will be materially different to the current estimate. Any subsequent changes will result in an increase or decrease to the obligation and recorded through Other Comprehensive Income. The ruling has resulted in an increase to the defined benefit obligations on the balance sheet and a past service cost has been recognised amounting to €2.1 million in the Group income statement.
The discount rate is a highly sensitive input to the calculation of scheme liabilities. Sensitivity analysis has been completed to assess the impact of a change in the discount rate used and concluded that based on the pension deficit at 29 December 2018, an increase/decrease in the discount rate applied of 0.25% would have the impact of decreasing/increasing the Irish pension plan deficit by approximately €5.2 million to €5.5 million (2017: €5.3 million to €5.6 million) and the UK pension plan deficit by approximately €3.6 million to €3.8 million (2017: €4.2 million to €4.5 million). Additional information in relation to retirement benefit obligations is disclosed in note 9.
Business combinationsBusiness combinations are accounted for using the acquisition method which requires that the assets and liabilities assumed are recorded at their respective fair values at the date of acquisition. The application of this method requires certain estimates and assumptions particularly concerning the determination of the fair values of the acquired assets and liabilities assumed at the date of acquisition. For intangible assets acquired the Group bases valuations on expected future cash flows. This method employs a discounted cash flow analysis using the present value of the estimated after-tax cash flows expected to be generated from the purchased intangible asset using risk adjusted discount rates, revenue forecasts, estimated customer attrition and royalty savings as appropriate. The Group engages with external experts to support identification and valuation of identifiable intangible assets. The period of expected cash flows is based on the expected useful life of the intangible asset acquired.
ProvisionsThe amounts recognised as a provision are management’s best estimate of the expenditure required to settle present obligations at the balance sheet date. The outcome depends on future events which are by their nature uncertain. In assessing the likely outcome, management bases its assessment on historical experience and other factors that are believed to be reasonable in the circumstances. Provisions are disclosed in note 28.
Notes to the Financial Statements continued
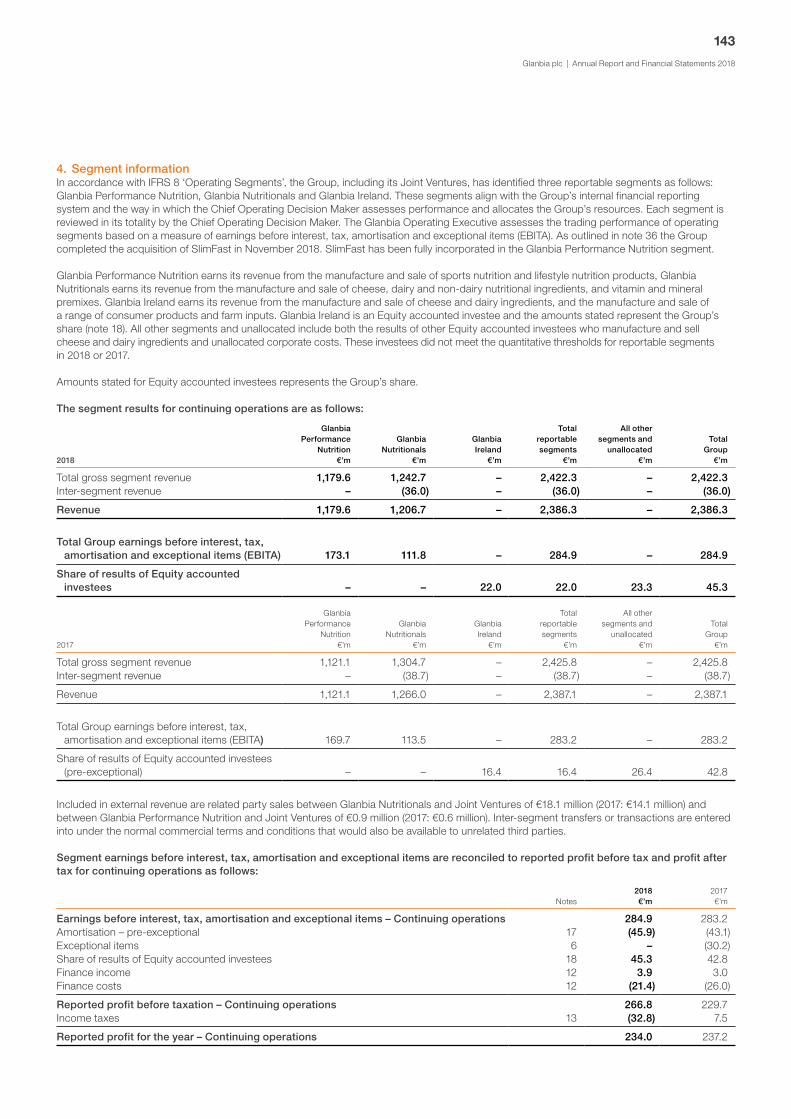
Glanbia plc | Annual Report and Financial Statements 2018
143
4. Segment informationIn accordance with IFRS 8 ‘Operating Segments’, the Group, including its Joint Ventures, has identified three reportable segments as follows: Glanbia Performance Nutrition, Glanbia Nutritionals and Glanbia Ireland. These segments align with the Group’s internal financial reporting system and the way in which the Chief Operating Decision Maker assesses performance and allocates the Group’s resources. Each segment is reviewed in its totality by the Chief Operating Decision Maker. The Glanbia Operating Executive assesses the trading performance of operating segments based on a measure of earnings before interest, tax, amortisation and exceptional items (EBITA). As outlined in note 36 the Group completed the acquisition of SlimFast in November 2018. SlimFast has been fully incorporated in the Glanbia Performance Nutrition segment.
Glanbia Performance Nutrition earns its revenue from the manufacture and sale of sports nutrition and lifestyle nutrition products, Glanbia Nutritionals earns its revenue from the manufacture and sale of cheese, dairy and non-dairy nutritional ingredients, and vitamin and mineral premixes. Glanbia Ireland earns its revenue from the manufacture and sale of cheese and dairy ingredients, and the manufacture and sale of a range of consumer products and farm inputs. Glanbia Ireland is an Equity accounted investee and the amounts stated represent the Group’s share (note 18). All other segments and unallocated include both the results of other Equity accounted investees who manufacture and sell cheese and dairy ingredients and unallocated corporate costs. These investees did not meet the quantitative thresholds for reportable segments in 2018 or 2017.
Amounts stated for Equity accounted investees represents the Group’s share.
The segment results for continuing operations are as follows:
2018
Glanbia Performance
Nutrition€’m
GlanbiaNutritionals
€’m
Glanbia Ireland
€’m
Total reportable segments
€’m
All othersegments and
unallocated€’m
TotalGroup
€’m
Total gross segment revenue 1,179.6 1,242.7 – 2,422.3 – 2,422.3Inter-segment revenue – (36.0) – (36.0) – (36.0)
Revenue 1,179.6 1,206.7 – 2,386.3 – 2,386.3
Total Group earnings before interest, tax, amortisation and exceptional items (EBITA) 173.1 111.8 – 284.9 – 284.9
Share of results of Equity accounted investees – – 22.0 22.0 23.3 45.3
2017
Glanbia Performance
Nutrition€’m
GlanbiaNutritionals
€’m
Glanbia Ireland
€’m
Total reportable segments
€’m
All othersegments and
unallocated€’m
TotalGroup
€’m
Total gross segment revenue 1,121.1 1,304.7 – 2,425.8 – 2,425.8Inter-segment revenue – (38.7) – (38.7) – (38.7)
Revenue 1,121.1 1,266.0 – 2,387.1 – 2,387.1
Total Group earnings before interest, tax, amortisation and exceptional items (EBITA) 169.7 113.5 – 283.2 – 283.2
Share of results of Equity accounted investees (pre-exceptional) – – 16.4 16.4 26.4 42.8
Included in external revenue are related party sales between Glanbia Nutritionals and Joint Ventures of €18.1 million (2017: €14.1 million) and between Glanbia Performance Nutrition and Joint Ventures of €0.9 million (2017: €0.6 million). Inter-segment transfers or transactions are entered into under the normal commercial terms and conditions that would also be available to unrelated third parties.
Segment earnings before interest, tax, amortisation and exceptional items are reconciled to reported profit before tax and profit after tax for continuing operations as follows:
Notes2018 €’m
2017 €’m
Earnings before interest, tax, amortisation and exceptional items – Continuing operations 284.9 283.2Amortisation – pre-exceptional 17 (45.9) (43.1)Exceptional items 6 – (30.2)Share of results of Equity accounted investees 18 45.3 42.8Finance income 12 3.9 3.0Finance costs 12 (21.4) (26.0)
Reported profit before taxation – Continuing operations 266.8 229.7Income taxes 13 (32.8) 7.5
Reported profit for the year – Continuing operations 234.0 237.2

Glanbia plc | Annual Report and Financial Statements 2018
144
> Financial Statements
4. Segment information continuedOther segment information pre-exceptional for continuing operations are as follows:
2018 Notes
Glanbia Performance
Nutrition€’m
Glanbia Nutritionals
€’m
Glanbia Ireland
€’m
Total reportable segments
€’m
All othersegments and
unallocated€’m
TotalGroup
€’m
Depreciation and impairment of PPE 16 16.1 26.9 – 43.0 – 43.0Amortisation and impairment of intangibles 17 34.9 11.0 – 45.9 – 45.9Capital expenditure – additions 16/17 28.2 34.3 – 62.5 5.3 67.8Capital expenditure – business combinations 36 321.0 – – 321.0 – 321.0
2017 Notes
Glanbia Performance
Nutrition€’m
Glanbia Nutritionals
€’m
Glanbia Ireland
€’m
Total reportable segments
€’m
All othersegments and
unallocated€’m
TotalGroup
€’m
Depreciation and impairment of PPE 16 14.8 30.3 – 45.1 2.7 47.8Amortisation and impairment of intangibles 17 33.2 9.9 – 43.1 – 43.1Capital expenditure – additions 16/17 32.8 29.4 – 62.2 10.5 72.7Capital expenditure – business combinations 166.9 – – 166.9 – 166.9
The segment assets and liabilities are as follows:
2018
Glanbia Performance
Nutrition €’m
Glanbia Nutritionals
€’m
Glanbia Ireland
€’m
Total reportable segments
€’m
All othersegments and
unallocated €’m
TotalGroup
€’m
Segment assets 1,728.6 737.5 225.4 2,691.5 407.2 3,098.7Segment liabilities 367.8 193.9 – 561.7 947.9 1,509.6
2017
Glanbia Performance
Nutrition
€’m
Glanbia Nutritionals
€’m
Glanbia Ireland
(note 18)€’m
Total reportable segments
€’m
All othersegments and
unallocated
€’m
TotalGroup
€’m
Segment assets 1,331.5 759.7 187.1 2,278.3 204.7 2,483.0Segment liabilities 232.2 181.0 – 413.2 688.1 1,101.3
Geographical informationThe following represents a geographical analysis of the segment information in accordance with IFRS 8, which requires disclosure of information about the country of domicile (Ireland) and countries with material revenue and non-current assets. The analysis of revenue represents revenue from continuing operations.
2018 €’m
2017 €’m
US 1,588.5 1,723.8Ireland 4.0 23.4UK 82.3 72.1Australia 34.5 53.2Rest of Europe 270.5 217.1Other 406.5 297.5
Total 2,386.3 2,387.1
Revenue of approximately €302.3 million (2017: €312.5 million) is derived from a single external customer within the Glanbia Nutritionals segment.
The total of non-current assets, other than financial instruments and deferred tax assets, located in Ireland is €816.0 million (2017: €821.3 million) and located in other countries, mainly the US, is €1,305.2 million (2017: €849.3 million).
Notes to the Financial Statements continued

Glanbia plc | Annual Report and Financial Statements 2018
145
5. Operating Profit – Continuing operations
2018 2017
Notes
Pre- exceptional
€’m
Exceptional (note 6)
€’m
Total
€’m
Pre- exceptional
€’m
Exceptional (note 6)
€’mTotal €’m
Revenue 2,386.3 – 2,386.3 2,387.1 – 2,387.1Cost of goods sold (1,706.2) – (1,706.2) (1,742.4) – (1,742.4)
Gross profit 680.1 – 680.1 644.7 – 644.7Selling and distribution expenses (234.9) – (234.9) (212.3) – (212.3)Administration expenses (160.3) – (160.3) (149.2) (5.5) (154.7)
Earnings before interest tax and amortisation (EBITA) 284.9 – 284.9 283.2 (5.5) 277.7
Intangible asset amortisation 17 (45.9) – (45.9) (43.1) (19.4) (62.5)
Operating profit 239.0 – 239.0 240.1 (24.9) 215.2
Operating profit – Continuing operations is stated after (charging)/crediting:
2018 2017
Notes
Pre-exceptional
€’m
Exceptional(note 6)
€’mTotal
€’m
Pre-exceptional
€’m
Exceptional(note 6)
€’mTotal€’m
Cost of inventories recognised as an expense in Cost of Goods Sold 21 (1,417.5) – (1,417.5) (1,468.2) – (1,468.2)
Depreciation of property, plant and equipment 16 (43.0) – (43.0) (45.1) – (45.1)Impairment of property, plant and equipment 16 – – – (2.7) – (2.7)Amortisation of intangible assets 17 (45.9) – (45.9) (43.1) (19.4) (62.5)Amortisation of capital grants received 29 0.1 – 0.1 0.1 – 0.1Employee benefit expense* (320.6) – (320.6) (309.8) (3.9) (313.7)Auditor’s remuneration (1.3) – (1.3) (1.2) – (1.2)Research and development costs (11.2) – (11.2) (9.0) – (9.0)Net foreign exchange (loss)/gain (2.5) – (2.5) 0.4 – 0.4Profit/(loss) on disposal of property, plant
and equipment 34 0.3 – 0.3 (0.9) – (0.9)Operating lease rentals 16 (21.0) – (21.0) (20.1) – (20.1)
* Included in employee benefit expense is capitalised labour costs of €20.2 million (2017: €21.2 million).
The following tables disclose the fees paid or payable to Deloitte Ireland LLP, the Group and Company auditor, and to other statutory audit firms in the Deloitte network:
Current auditor2018 €’m
2017 €’m
Statutory auditor– Statutory audit of Group companies* 0.6 0.5– Other assurance services – –– Tax advisory services – –– Other non-audit services – –
0.6 0.5
Current auditor2018 €’m
2017 €’m
Other statutory auditor network firms– Statutory audit of Group companies 0.7 0.7– Other assurance services – –– Tax advisory services – –– Other non-audit services – –
0.7 0.7
* The audit fee for the Company is €35,700 (2017: €35,700) and is payable to Deloitte Ireland LLP, the statutory auditor.
In addition to the above, Deloitte Ireland LLP and Deloitte network member firms received fees of €0.2 million (2017: €0.2 million) in respect of the audit of the Group’s Equity accounted investees.

Glanbia plc | Annual Report and Financial Statements 2018
146
> Financial Statements
6. Exceptional itemsThere were no exceptional items in the current year. Prior year exceptional items amounted to €98.0 million and included rationalisation costs, debt restructuring costs, intangible asset amortisation, reduction in deferred tax on change in US corporate tax rate and tax impact of other exceptional items, and the gain on disposal of the Dairy Ireland segment. Details of the prior year exceptional items are set out below. The net cash outflow during 2018 in respect of 2017 exceptional charges was €2.6 million.
• Rationalisation costs of €5.5 million – they relate mainly to redundancies arising from the elimination of certain positions following a Group-wide organisational review. It included employee benefit expense of €3.9 million (note 7), professional fees of €1.2 million and other costs of €0.4 million.
• Intangible asset amortisation of €19.4 million – based on the speed at which new trends and formats emerge within the Glanbia Performance Nutrition and Glanbia Nutritionals segments, a review was undertaken in the prior year of the useful asset life of development assets. The estimated useful life was reduced from 6 years to 3 years. The once-off additional amortisation from this change in estimate amounted to €19.4 million in 2017 (note 17).
• Debt restructuring costs of €14.0 million – following the sale of 60% of Dairy Ireland and related assets in the prior year a review of existing debt facilities was undertaken to ensure they were appropriate for the revised Group structure. As a result the Group repaid US$169.0 million of the US$325.0 million private placement debt resulting in €13.9 million of a once-off interest costs reflecting make-whole interest due to note holders arising on early settlement and €0.1 million of professional fees (note 12).
• Deferred tax credit of €8.7 million – on 22 December 2017 the Tax Cuts and Jobs Act was signed into law in the United States which reduced the federal corporate tax rate from 35% to 21%. As a result of the reduced federal corporate tax rate the Group recognised in the prior year a deferred tax credit of €8.7 million within Equity accounted investees.
• Income taxes of €45.8 million – this comprised a deferred tax credit of €38.7 million recognised within wholly owned subsidiaries (note 27) as a result of the reduced federal corporate tax rate as described in the preceding item and a tax credit of €7.1 million on exceptional items.
• Net profit on disposal of 60% of Dairy Ireland and related assets of €82.4 million – on 2 July 2017 the Group completed the sale of 60% of Dairy Ireland and related assets to Glanbia Co-operative Society Limited. The gross profit arising on disposal was €96.3 million and net of related costs of €13.0 million and tax charge of €0.9 million. These costs include impairment of tangible fixed assets of €8.1 million (note 16), professional fees of €3.6 million, Extraordinary General Meeting costs of €0.6 million, employee benefit expense of €0.5 million and other related costs of €0.2 million.
Please refer to the Glossary on page 208 for further information on exceptional items (non-IFRS information).
7. Employee benefit expense – Continuing operationsThe aggregate payroll costs of employees (including Executive Directors) in the Group were:
Notes2018 €’m
2017 €’m
Wages and salaries 256.5 250.3Social security costs 23.5 22.0Pension costs – defined contribution plans 9 9.4 9.7Pension costs – defined benefit plans 9 4.7 2.8
Other compensation costs:Cost of share-based payments 11 8.8 7.5Company car allowance 1.3 1.4Private health insurance 16.4 16.1
5 320.6 309.8Exceptional items 5/6 – 3.9
5 320.6 313.7
Exceptional items include redundancy costs of nil (2017: €3.9 million). Capitalised labour costs of €20.2 million (2017: €21.2 million) are included within the aggregate payroll costs above. See note 16 and note 17.
The average number of employees in continuing operations, excluding the Group’s Equity accounted investees, is analysed into the following reportable segments:
2018 2017
Glanbia Performance Nutrition 2,118 2,027Glanbia Nutritionals 2,039 1,948
4,157 3,975
The aggregate payroll cost of employees in the Company is nil (2017: nil).
Notes to the Financial Statements continued

Glanbia plc | Annual Report and Financial Statements 2018
147
8. Directors’ remuneration The Directors’ remuneration information is shown on tables A to H on pages 97 to 101 in the Remuneration Committee report.
9. Retirement benefit obligationsThe Group operates defined benefit and defined contribution pension plans.
Defined contribution plans The Group has a number of defined contribution pension plans in operation.
The following amounts have been recognised in the Group income statement in relation to the defined contribution pension plan expense:
2018 2017
Continuing operations
(note 7) €’m
Discontinued operations
(note 10) €’m
Total €’m
Continuing operations
(note 7) €’m
Discontinued operations
(note 10) €’m
Total €’m
Defined contribution pension plan expense 9.4 – 9.4 9.7 0.4 10.1
Defined benefit pension plans The Group operates two defined benefit pension plans in the Republic of Ireland and two defined benefit pension plans in the United Kingdom (UK).
The defined benefit pension plans in Ireland and the UK are administered by Boards of Trustees through separate trustee controlled funds. These Boards are responsible for the management and governance of the plans including compliance with all relevant laws and regulations. Each of the Group’s plans operates under their respective regulatory frameworks and minimum funding requirements. All of the plans are closed to new entrants and the UK plans comprise solely of pensioners and deferred pensioners.
The defined benefit pension plans provide retirement and death benefits for the Group’s employees. The majority of the defined benefit pension plans are career average pension plans, which provide benefits to members in the form of a guaranteed level of pension payable for life. The level of benefits provided depends on members’ length of service and their average salary over their period of employment.
The contributions paid to the defined benefit pension plans are in accordance with the schedule of contributions agreed between the Group and the Trustees of the relevant plans as recommended in the actuarial valuation reports or in subsequent actuarial advice. The contributions are partly funded by the employees, where they are required to contribute a fixed percentage of pensionable salary, and partly by the Group. The latest actuarial valuation reports for these plans, which are not available for public inspection, are dated between 30 June 2015 and 1 January 2018.
On 26 October 2018, the High Court of Justice of England and Wales issued a judgement in the case of Lloyds Banking Group Pension Group Pension Trustees Limited v Lloyds Bank plc (and others) regarding the rights of members to equality in defined benefit pension schemes. The judgement concluded that schemes are under a duty to equalise benefits for all members, regardless of gender, in relation to guaranteed minimum pension benefits. The ruling has resulted in an increase to the defined benefit obligations on the balance sheet. A past service cost has been recognised amounting to €2.1 million in the Group income statement, relating to the impact of this change in benefits.
Principal risks in the defined benefit pension plansThrough its defined benefit pension plans the Group is exposed to a number of risks, the most significant of which are detailed below:
(a) Investment risk The pension plans hold investments in asset classes such as equities, which have volatile market values. While these assets are expected to provide higher returns than other asset classes over the long-term, the short-term volatility could cause an increase in the deficit at any particular point in time. When assets return less than the discount rate, this will lead to an increase in the net defined benefit obligation. The Trustees conduct investment reviews to take advice on asset allocation, taking into account asset valuations, liability durations, funding measurements and an achievement of an appropriate return on assets.
(b) Interest rate riskThe pension liabilities are assessed using market yields on high-quality corporate bonds to discount the liabilities. As the pension plans hold other assets such as equities, the value of the assets and liabilities may not move in the same way. A change in the defined benefit obligation as a result of changes in the discount rate leads to volatility in the Group balance sheet, Group income statement and Group statement of comprehensive income. It also impacts the funding requirements for the plans.
(c) Inflation riskA significant proportion of the benefits under the plans are linked to inflation, be it consumer price inflation or retail price inflation, which in most cases are subject to a cap on annual increases. Although there are caps in force on inflation increases and the plans’ assets are expected to provide a good hedge against inflation over the long-term, higher inflation will lead to higher liabilities.
(d) Longevity riskThe present value of the defined benefit obligation is calculated by reference to the best estimate of the life expectancy of plan participants both during and after their employment. An increase in the life expectancy of the plan participants will increase the defined benefit obligation.

Glanbia plc | Annual Report and Financial Statements 2018
148
> Financial Statements
9. Retirement benefit obligations continuedRecognition in the Group income statement and Group statement of comprehensive incomeThe following amounts have been recognised in the Group income statement and Group statement of comprehensive income in relation to defined benefit pension plans:
Recognition in the Group income statement:
2018 2017
ContinuingOperations
€’m
Discontinued operations
(note 10)€’m
Total €’m
Continuing Operations
€’m
Discontinuedoperations
(note 10)€’m
Total €’m
Current service cost (1.8) – (1.8) (1.7) (2.0) (3.7)Past service cost (2.1) – (2.1) – – –Net interest cost (0.8) – (0.8) (1.1) (0.5) (1.6)
Total expense recognised in the Group income statement in employee benefit expense (4.7) – (4.7) (2.8) (2.5) (5.3)
Recognition in the Group statement of comprehensive income:
2018 2017
Continuingoperations
€’m
Discontinued operations
€’mTotal
€’m
Continuing operations
€’m
Discontinuedoperations
€’mTotal €’m
Return of plan assets in excess of interest income (2.5) – (2.5) (2.3) (0.9) (3.2)
Actuarial gain arising from experience adjustments 1.0 – 1.0 2.9 – 2.9
Actuarial gain arising from changes in demographic assumptions 1.9 – 1.9 1.3 – 1.3
Actuarial (loss)/gain arising from changes in financial assumptions (0.9) – (0.9) 5.2 12.9 18.1
Total (expense)/income recognised in the Group statement of comprehensive income (0.5) – (0.5) 7.1 12.0 19.1
Notes to the Financial Statements continued

Glanbia plc | Annual Report and Financial Statements 2018
149
Recognition in the Group balance sheet:
2018 €’m
2017 €’m
Non-current assetsSurplus on defined benefit pension plan 1.1 1.7Non-current liabilitiesDeficit on defined benefit pension plan (39.6) (43.6)
Net defined benefit pension plan liability (38.5) (41.9)
Reconciliation of net defined benefit pension plan liability to the amounts recognised in the Group balance sheet:
2018 €’m
2017 €’m
Present value of funded obligations (224.8) (227.6)Fair value of plan assets 186.3 185.7
Net defined benefit pension plan liability (38.5) (41.9)
The net liability disclosed above relates to funded plans.
The movement in the net retirement benefit liability recognised in the Group balance sheet is as follows:
2018 €’m
2017 €’m
At the beginning of the year (41.9) (110.4)Exchange differences 0.3 1.0Service cost and net interest cost (4.7) (5.3)Remeasurements – defined benefit plans (0.5) 19.1Contributions paid/payable by employer 8.3 9.5Disposal of discontinued operations – 44.2
At the end of the year (38.5) (41.9)
The movement in obligations during the year is as follows:
2018 2017
ROI €’m
UK €’m
Total €’m
ROI €’m
UK €’m
Total €’m
At the beginning of the year (122.7) (104.9) (227.6) (364.5) (112.7) (477.2)Exchange differences – 1.8 1.8 – 3.8 3.8Current service costs (1.8) – (1.8) (3.7) – (3.7)Interest costs (2.3) (2.4) (4.7) (4.2) (2.8) (7.0)Remeasurements:– Experience (loss)/gain (1.0) 2.0 1.0 0.1 2.8 2.9– Gain from changes in
demographic assumptions – 1.9 1.9 – 1.3 1.3– (Loss)/gain from changes in
financial assumptions (3.1) 2.2 (0.9) 20.3 (2.2) 18.1Contributions by plan participants (0.4) – (0.4) (0.9) – (0.9)Past service cost – (2.1) (2.1) – – –Payments from plans: – Benefit payments 4.0 4.0 8.0 6.8 4.9 11.7Disposal of discontinued operations – – – 223.4 – 223.4
At the end of the year (127.3) (97.5) (224.8) (122.7) (104.9) (227.6)
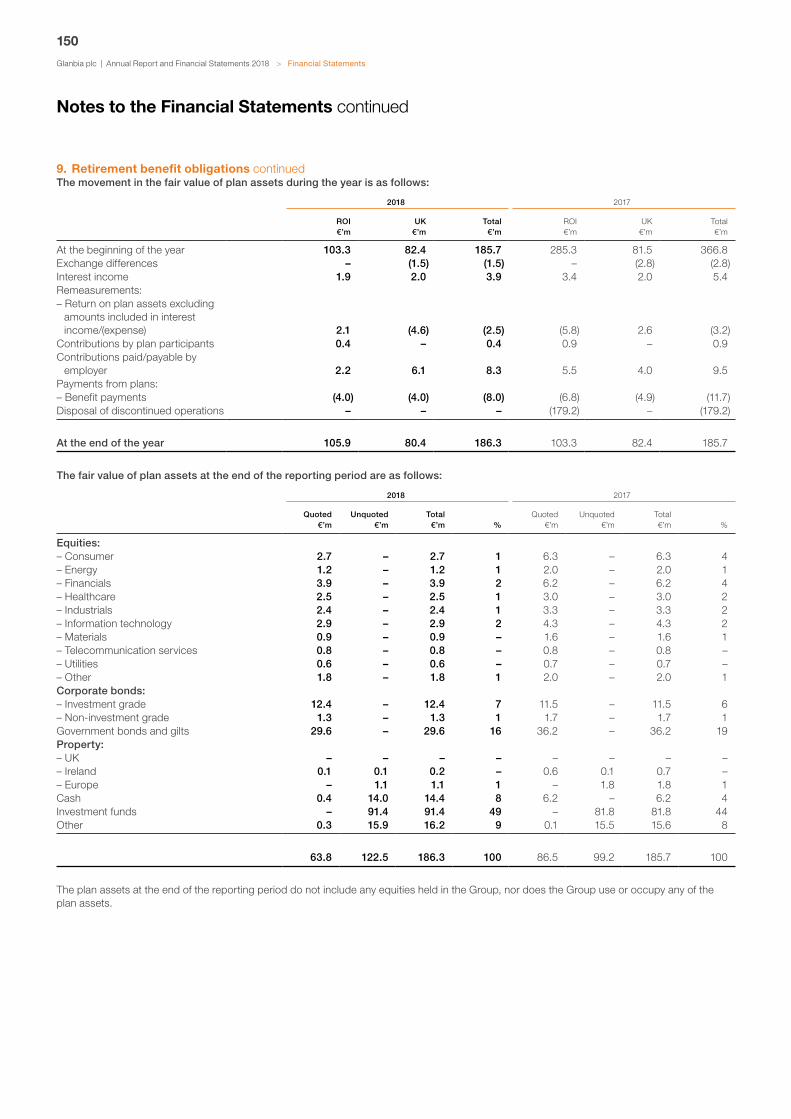
Glanbia plc | Annual Report and Financial Statements 2018
150
> Financial Statements
9. Retirement benefit obligations continuedThe movement in the fair value of plan assets during the year is as follows:
2018 2017
ROI €’m
UK €’m
Total €’m
ROI €’m
UK €’m
Total €’m
At the beginning of the year 103.3 82.4 185.7 285.3 81.5 366.8Exchange differences – (1.5) (1.5) – (2.8) (2.8)Interest income 1.9 2.0 3.9 3.4 2.0 5.4Remeasurements:– Return on plan assets excluding
amounts included in interest income/(expense) 2.1 (4.6) (2.5) (5.8) 2.6 (3.2)
Contributions by plan participants 0.4 – 0.4 0.9 – 0.9Contributions paid/payable by
employer 2.2 6.1 8.3 5.5 4.0 9.5Payments from plans: – Benefit payments (4.0) (4.0) (8.0) (6.8) (4.9) (11.7)Disposal of discontinued operations – – – (179.2) – (179.2)
At the end of the year 105.9 80.4 186.3 103.3 82.4 185.7
The fair value of plan assets at the end of the reporting period are as follows:
2018 2017
Quoted €’m
Unquoted €’m
Total €’m %
Quoted €’m
Unquoted €’m
Total €’m %
Equities:– Consumer 2.7 – 2.7 1 6.3 – 6.3 4– Energy 1.2 – 1.2 1 2.0 – 2.0 1– Financials 3.9 – 3.9 2 6.2 – 6.2 4– Healthcare 2.5 – 2.5 1 3.0 – 3.0 2– Industrials 2.4 – 2.4 1 3.3 – 3.3 2– Information technology 2.9 – 2.9 2 4.3 – 4.3 2– Materials 0.9 – 0.9 – 1.6 – 1.6 1– Telecommunication services 0.8 – 0.8 – 0.8 – 0.8 –– Utilities 0.6 – 0.6 – 0.7 – 0.7 –– Other 1.8 – 1.8 1 2.0 – 2.0 1Corporate bonds:– Investment grade 12.4 – 12.4 7 11.5 – 11.5 6– Non-investment grade 1.3 – 1.3 1 1.7 – 1.7 1Government bonds and gilts 29.6 – 29.6 16 36.2 – 36.2 19Property:– UK – – – – – – – –– Ireland 0.1 0.1 0.2 – 0.6 0.1 0.7 –– Europe – 1.1 1.1 1 – 1.8 1.8 1Cash 0.4 14.0 14.4 8 6.2 – 6.2 4Investment funds – 91.4 91.4 49 – 81.8 81.8 44Other 0.3 15.9 16.2 9 0.1 15.5 15.6 8
63.8 122.5 186.3 100 86.5 99.2 185.7 100
The plan assets at the end of the reporting period do not include any equities held in the Group, nor does the Group use or occupy any of the plan assets.
Notes to the Financial Statements continued
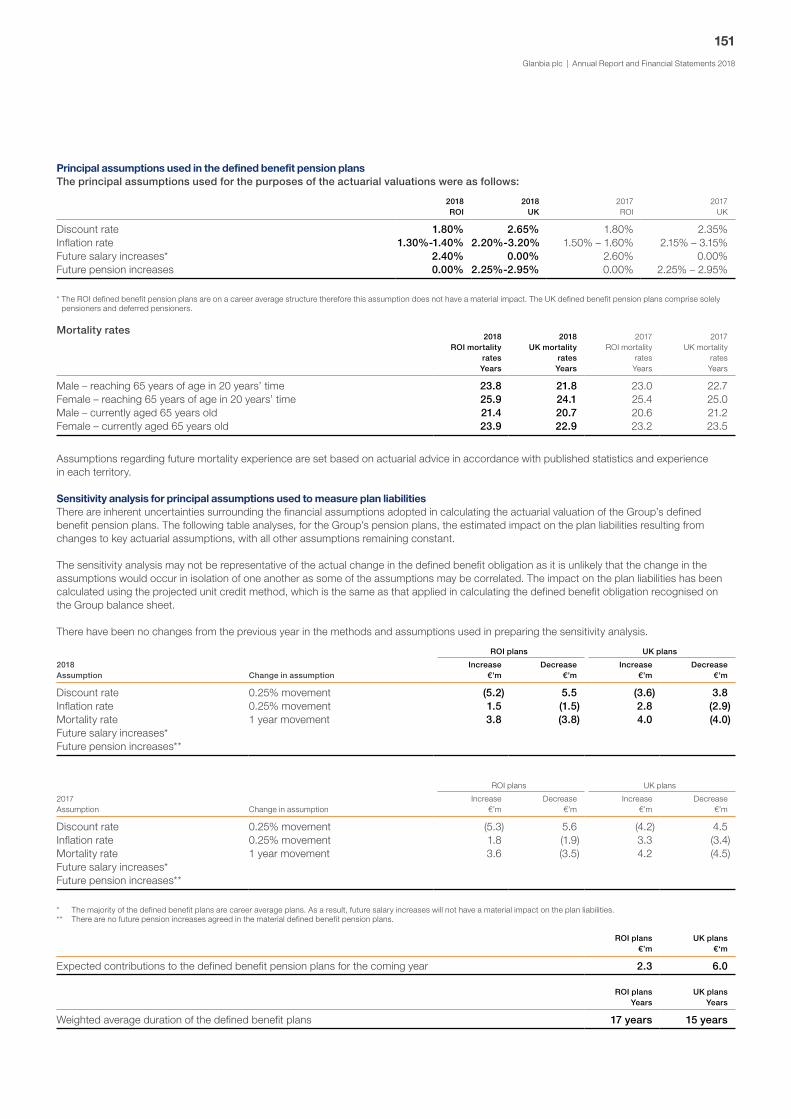
Glanbia plc | Annual Report and Financial Statements 2018
151
Principal assumptions used in the defined benefit pension plansThe principal assumptions used for the purposes of the actuarial valuations were as follows:
2018 ROI
2018 UK
2017 ROI
2017 UK
Discount rate 1.80% 2.65% 1.80% 2.35%Inflation rate 1.30%-1.40% 2.20%-3.20% 1.50% – 1.60% 2.15% – 3.15%Future salary increases* 2.40% 0.00% 2.60% 0.00%Future pension increases 0.00% 2.25%-2.95% 0.00% 2.25% – 2.95%
* The ROI defined benefit pension plans are on a career average structure therefore this assumption does not have a material impact. The UK defined benefit pension plans comprise solely pensioners and deferred pensioners.
Mortality rates2018
ROI mortality rates Years
2018 UK mortality
rates Years
2017 ROI mortality
rates Years
2017 UK mortality
rates Years
Male – reaching 65 years of age in 20 years’ time 23.8 21.8 23.0 22.7Female – reaching 65 years of age in 20 years’ time 25.9 24.1 25.4 25.0Male – currently aged 65 years old 21.4 20.7 20.6 21.2Female – currently aged 65 years old 23.9 22.9 23.2 23.5
Assumptions regarding future mortality experience are set based on actuarial advice in accordance with published statistics and experience in each territory.
Sensitivity analysis for principal assumptions used to measure plan liabilities There are inherent uncertainties surrounding the financial assumptions adopted in calculating the actuarial valuation of the Group’s defined benefit pension plans. The following table analyses, for the Group’s pension plans, the estimated impact on the plan liabilities resulting from changes to key actuarial assumptions, with all other assumptions remaining constant.
The sensitivity analysis may not be representative of the actual change in the defined benefit obligation as it is unlikely that the change in the assumptions would occur in isolation of one another as some of the assumptions may be correlated. The impact on the plan liabilities has been calculated using the projected unit credit method, which is the same as that applied in calculating the defined benefit obligation recognised on the Group balance sheet.
There have been no changes from the previous year in the methods and assumptions used in preparing the sensitivity analysis.
ROI plans UK plans
2018 Assumption Change in assumption
Increase €’m
Decrease €’m
Increase €’m
Decrease €’m
Discount rate 0.25% movement (5.2) 5.5 (3.6) 3.8Inflation rate 0.25% movement 1.5 (1.5) 2.8 (2.9)Mortality rate 1 year movement 3.8 (3.8) 4.0 (4.0)Future salary increases*Future pension increases**
ROI plans UK plans
2017 Assumption Change in assumption
Increase €’m
Decrease €’m
Increase €’m
Decrease €’m
Discount rate 0.25% movement (5.3) 5.6 (4.2) 4.5Inflation rate 0.25% movement 1.8 (1.9) 3.3 (3.4)Mortality rate 1 year movement 3.6 (3.5) 4.2 (4.5)Future salary increases*Future pension increases**
* The majority of the defined benefit plans are career average plans. As a result, future salary increases will not have a material impact on the plan liabilities.** There are no future pension increases agreed in the material defined benefit pension plans.
ROI plans €’m
UK plans €‘m
Expected contributions to the defined benefit pension plans for the coming year 2.3 6.0
ROI plans Years
UK plans Years
Weighted average duration of the defined benefit plans 17 years 15 years

Glanbia plc | Annual Report and Financial Statements 2018
152
> Financial Statements
10. Discontinued operations There were no discontinued operations in the current year. All discontinued operations referred to below relate to the prior year.
In the prior year on 2 July 2017, the Group disposed of 60% of its shareholding in Dairy Ireland and related assets (Dairy Ireland) to Glanbia Co-operative Society Limited (the Society), its ultimate parent, creating a joint venture, together with Glanbia Ingredients Ireland DAC, called Glanbia Ireland. Dairy Ireland is comprised of two business units, Glanbia Consumer Foods Ireland and Glanbia Agribusiness.
The disposal was approved by Society members at a Special General Meeting (SGM) on 18 May 2017 and by Group shareholders at an Extraordinary General Meeting (EGM) on 22 May 2017.
In consideration for the Society acquiring the 60% interest, Glanbia plc received a total of €208.8 million consisting of €112.0 million and an amount of €96.8 million which equalled 100% of the working capital in Dairy Ireland at completion.
The transaction was accounted for as a 100% disposal of Dairy Ireland in consideration for the cash payments outlined above and a 40% investment in Glanbia Ireland. Since 2 July 2017 the 40% investment in Glanbia Ireland is treated as a Joint Venture of the Group (note 18).
Results of discontinued operationsThe following table details the results of discontinued operations included within the Group income statement:
Notes2017 €’m
Revenue 358.4Cost of goods sold (284.9)
Gross profit 73.5Selling and distribution expenses (42.3)Administration expenses (20.6)
Earnings before interest tax and amortisation (EBITA) 10.6Intangible asset amortisation 17 (0.7)
Operating profit 9.9Finance costs (0.1)Share of results of Equity accounted investees 18 0.3Exceptional items (13.0)
Loss from operating activities before tax (2.9)Income tax credit/(charge) on discontinued operations 2.2
Loss from operating activities for the year, net of tax (0.7)
Profit on disposal of discontinued operations 96.3Income tax on profit on disposal of discontinued operations (3.4)
Profit from discontinued operations for the year, net of tax 92.2
Exceptional items from discontinued operations for the year, net of tax 82.4
The net cash flows of the Group’s discontinued operations are as follows:
2017 €’m
Operating net cash outflow (32.1)Investing net cash inflow 149.4Financing cash outflow (1.4)
Cash generated during the year 115.9
The following table details the profit on disposal of discontinued operations before tax:
Notes2017 €’m
Consideration received, satisfied in cash 112.0Fair value of investment in Glanbia Ireland 18 74.7
186.7Reclassification of foreign currency differences on disposal of Dairy Ireland 24 0.2Net assets and liabilities attributable to owners of the Company (90.6)
Profit on disposal of discontinued operations before tax 96.3
Notes to the Financial Statements continued
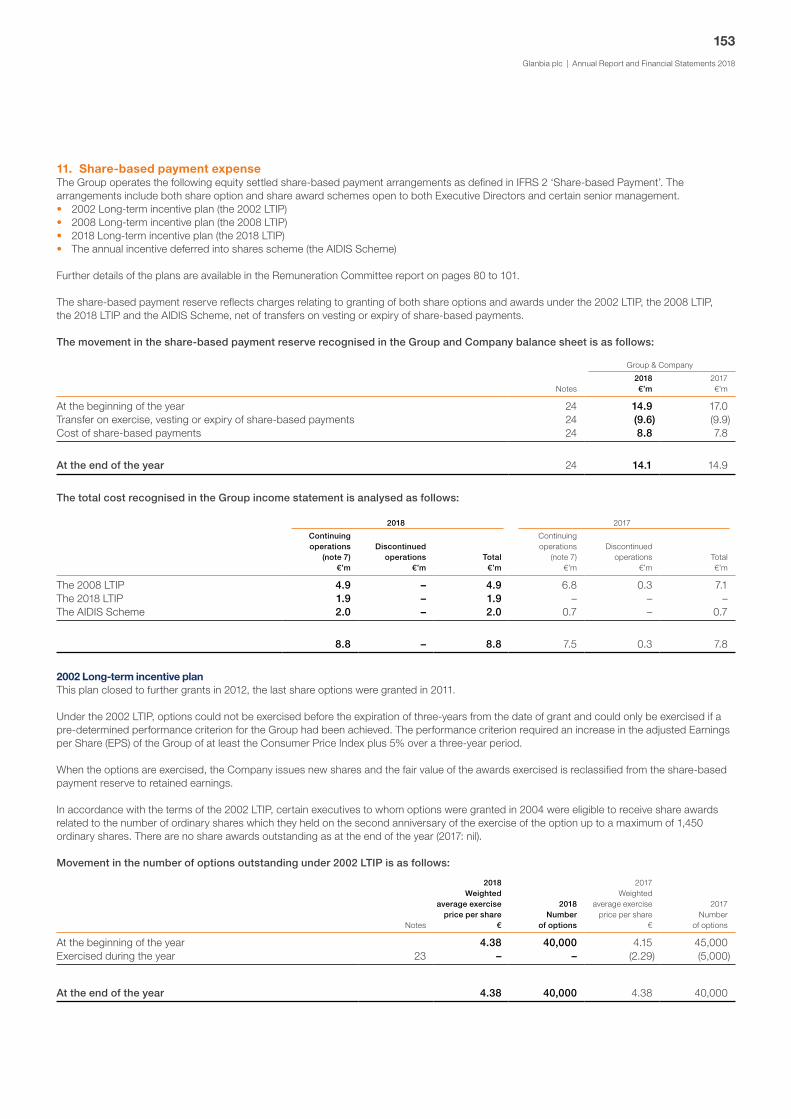
Glanbia plc | Annual Report and Financial Statements 2018
153
11. Share-based payment expenseThe Group operates the following equity settled share-based payment arrangements as defined in IFRS 2 ‘Share-based Payment’. The arrangements include both share option and share award schemes open to both Executive Directors and certain senior management.• 2002 Long-term incentive plan (the 2002 LTIP)• 2008 Long-term incentive plan (the 2008 LTIP)• 2018 Long-term incentive plan (the 2018 LTIP)• The annual incentive deferred into shares scheme (the AIDIS Scheme)
Further details of the plans are available in the Remuneration Committee report on pages 80 to 101.
The share-based payment reserve reflects charges relating to granting of both share options and awards under the 2002 LTIP, the 2008 LTIP, the 2018 LTIP and the AIDIS Scheme, net of transfers on vesting or expiry of share-based payments.
The movement in the share-based payment reserve recognised in the Group and Company balance sheet is as follows:
Group & Company
Notes2018 €’m
2017 €’m
At the beginning of the year 24 14.9 17.0Transfer on exercise, vesting or expiry of share-based payments 24 (9.6) (9.9)Cost of share-based payments 24 8.8 7.8
At the end of the year 24 14.1 14.9
The total cost recognised in the Group income statement is analysed as follows:
2018 2017
Continuingoperations
(note 7)€’m
Discontinuedoperations
€’mTotal
€’m
Continuing operations
(note 7)€’m
Discontinuedoperations
€’mTotal€’m
The 2008 LTIP 4.9 – 4.9 6.8 0.3 7.1The 2018 LTIP 1.9 – 1.9 – – –The AIDIS Scheme 2.0 – 2.0 0.7 – 0.7
8.8 – 8.8 7.5 0.3 7.8
2002 Long-term incentive planThis plan closed to further grants in 2012, the last share options were granted in 2011.
Under the 2002 LTIP, options could not be exercised before the expiration of three-years from the date of grant and could only be exercised if a pre-determined performance criterion for the Group had been achieved. The performance criterion required an increase in the adjusted Earnings per Share (EPS) of the Group of at least the Consumer Price Index plus 5% over a three-year period.
When the options are exercised, the Company issues new shares and the fair value of the awards exercised is reclassified from the share-based payment reserve to retained earnings.
In accordance with the terms of the 2002 LTIP, certain executives to whom options were granted in 2004 were eligible to receive share awards related to the number of ordinary shares which they held on the second anniversary of the exercise of the option up to a maximum of 1,450 ordinary shares. There are no share awards outstanding as at the end of the year (2017: nil).
Movement in the number of options outstanding under 2002 LTIP is as follows:
Notes
2018 Weighted
average exercise price per share
€
2018 Number
of options
2017 Weighted
average exercise price per share
€
2017 Number
of options
At the beginning of the year 4.38 40,000 4.15 45,000Exercised during the year 23 – – (2.29) (5,000)
At the end of the year 4.38 40,000 4.38 40,000
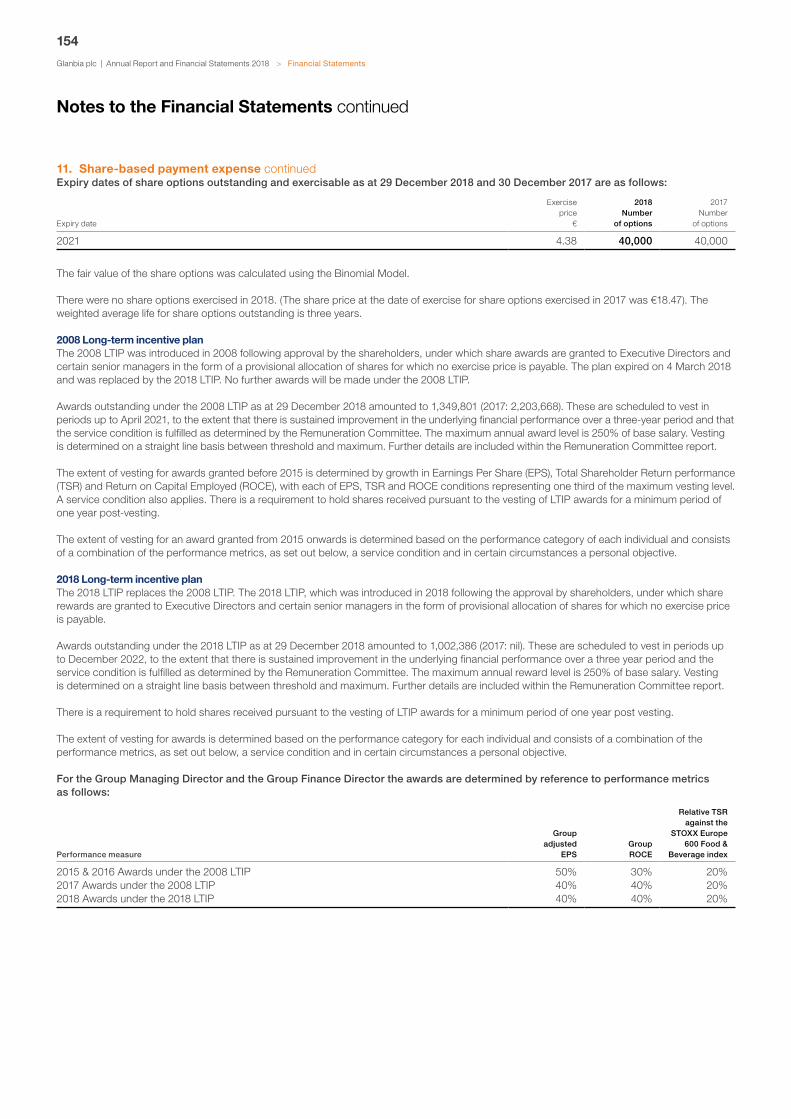
Glanbia plc | Annual Report and Financial Statements 2018
154
> Financial Statements
11. Share-based payment expense continuedExpiry dates of share options outstanding and exercisable as at 29 December 2018 and 30 December 2017 are as follows:
Expiry date
Exercise price
€
2018 Number
of options
2017 Number
of options
2021 4.38 40,000 40,000
The fair value of the share options was calculated using the Binomial Model.
There were no share options exercised in 2018. (The share price at the date of exercise for share options exercised in 2017 was €18.47). The weighted average life for share options outstanding is three years.
2008 Long-term incentive planThe 2008 LTIP was introduced in 2008 following approval by the shareholders, under which share awards are granted to Executive Directors and certain senior managers in the form of a provisional allocation of shares for which no exercise price is payable. The plan expired on 4 March 2018 and was replaced by the 2018 LTIP. No further awards will be made under the 2008 LTIP.
Awards outstanding under the 2008 LTIP as at 29 December 2018 amounted to 1,349,801 (2017: 2,203,668). These are scheduled to vest in periods up to April 2021, to the extent that there is sustained improvement in the underlying financial performance over a three-year period and that the service condition is fulfilled as determined by the Remuneration Committee. The maximum annual award level is 250% of base salary. Vesting is determined on a straight line basis between threshold and maximum. Further details are included within the Remuneration Committee report.
The extent of vesting for awards granted before 2015 is determined by growth in Earnings Per Share (EPS), Total Shareholder Return performance (TSR) and Return on Capital Employed (ROCE), with each of EPS, TSR and ROCE conditions representing one third of the maximum vesting level. A service condition also applies. There is a requirement to hold shares received pursuant to the vesting of LTIP awards for a minimum period of one year post-vesting.
The extent of vesting for an award granted from 2015 onwards is determined based on the performance category of each individual and consists of a combination of the performance metrics, as set out below, a service condition and in certain circumstances a personal objective.
2018 Long-term incentive planThe 2018 LTIP replaces the 2008 LTIP. The 2018 LTIP, which was introduced in 2018 following the approval by shareholders, under which share rewards are granted to Executive Directors and certain senior managers in the form of provisional allocation of shares for which no exercise price is payable.
Awards outstanding under the 2018 LTIP as at 29 December 2018 amounted to 1,002,386 (2017: nil). These are scheduled to vest in periods up to December 2022, to the extent that there is sustained improvement in the underlying financial performance over a three year period and the service condition is fulfilled as determined by the Remuneration Committee. The maximum annual reward level is 250% of base salary. Vesting is determined on a straight line basis between threshold and maximum. Further details are included within the Remuneration Committee report.
There is a requirement to hold shares received pursuant to the vesting of LTIP awards for a minimum period of one year post vesting.
The extent of vesting for awards is determined based on the performance category for each individual and consists of a combination of the performance metrics, as set out below, a service condition and in certain circumstances a personal objective.
For the Group Managing Director and the Group Finance Director the awards are determined by reference to performance metrics as follows:
Performance measure
Group adjusted
EPS Group ROCE
Relative TSR against the
STOXX Europe 600 Food &
Beverage index
2015 & 2016 Awards under the 2008 LTIP 50% 30% 20%2017 Awards under the 2008 LTIP 40% 40% 20%2018 Awards under the 2018 LTIP 40% 40% 20%
Notes to the Financial Statements continued

Glanbia plc | Annual Report and Financial Statements 2018
155
For business segment Executive Directors, the awards are determined by reference to the following performance metrics:
Performance measure
Business Segment
EBITA
Business Segment
ROCE
Group adjusted
EPSGroup ROCE
Relative TSR against the
STOXX Europe 600 Food &
Beverage index
2015 & 2016 Awards under the 2008 LTIP 20% 10% 40% 15% 15%2017 Awards under the 2008 LTIP 20% 10% 30% 25% 15%2018 Awards under the 2018 LTIP 20% 10% 30% 25% 15%
From 2015 onwards the required period to hold shares received post vesting of LTIP award has increased to two years for members of the Group Operating Executive.
IFRS 2 requires that a recognised valuation methodology be employed to determine the fair value of shares awarded and stipulates that this methodology should be consistent with methodologies used for pricing of financial instruments. The 2008 LTIP expense of €4.9 million (2017: €7.1 million) and the 2018 LTIP expense of €1.9 million (2017: nil) charged in the Group income statement has been arrived at through applying a Monte Carlo simulation technique to model the combination of market and non-market based performance conditions of the plan.
The assumptions used in the valuation of the 2008 LTIP and 2018 LTIP were as follows:
2018 LTIP 2008 LTIP
Granted in 2018
Granted in 2017
Granted in 2016
Granted in 2015
Risk-free interest rate (0.35%) (0.63%) (0.50%) 0.04%Expected volatility 24.40% 25.00% 22.30% 22.00%Dividend yield 1.38% 0.79% 0.66% 0.81%
Expected volatility was determined by calculating the historical volatility of the Company’s share price over a period equivalent to the expected life of the award.
At each reporting date the Group revises its estimates of the number of awards that are expected to vest based on the non-market vesting conditions and the service condition. A share award may lapse if a participant ceases to be employed within the Group before the date of vest.
When the awards are exercised, the Company re-issues shares from own shares and the fair value of the awards exercised is reclassified from the share-based payment reserve to retained earnings.
Movement in the number of awards in the 2008 LTIP and 2018 LTIP for the year ended 29 December 2018 and 30 December 2017 is as follows:
2018 LTIP 2008 LTIP
2018 Number of
awards
2017 Number of
awards
2018 Number
of awards
2017 Number
of awards
At the beginning of the year – – 2,203,668 2,294,783Granted 1,063,248 – – 874,641Vested – – (480,995) (644,620)Lapsed (60,862) – (372,872) (321,136)
At the end of the year 1,002,386 – 1,349,801 2,203,668
Expiry dates of share awards outstanding at 29 December 2018 and 30 December 2017:
2018 LTIP 2008 LTIP
2018 Number of
awards
2017 Number of
awards
2018 Number of
awards
2017 Number of
awards
Expiry date in2019 – – 2,047 673,3372020 – – 634,402 706,9902021 – – 713,352 823,3412022 1,002,386 – – –
At the end of the year 1,002,386 – 1,349,801 2,203,668

Glanbia plc | Annual Report and Financial Statements 2018
156
> Financial Statements
11. Share-based payment expense continuedThe total LTIP expense recognised in the Group income statement is analysed as follows:
Share price at date of
award €
Year of earliest vesting
dateNumber
of shares
Fair value – TSR
component €
Fair value – non-market
performance components
€
Total weighted
average fair value
€
Expense in Group
income statement
2018 €’m
Expense in Group
income statement
2017 €’m
Granted in 20152008 Long-term Incentive Plan 17.53 2018 844,490 13.16 17.10 16.55 – 1.9Granted in 20162008 Long-term Incentive Plan 18.47 2019 851,305 11.19 18.11 17.15 2.9 2.2Granted in 20172008 Long-term Incentive Plan 18.05 2020 874,641 9.00 17.62 16.57 2.0 3.0Granted in 20182018 Long-term Incentive Plan 13.86 2021 1,063,248 6.49 13.29 12.45 1.9 –
Total LTIP expense recognised in Group income statement 6.8 7.1
Annual incentive deferred into shares scheme (AIDIS)This scheme is an annual performance related incentive scheme for Executive Directors and other senior management. The fair value of the annual incentive deferred into shares scheme was calculated as €2.0 million in 2018 (2017: €0.7 million) and equates to the cash value of the portion of the annual incentive that will be settled by way of shares. The number of shares received is determined by the share price on the date of allocation. The incentive will be invested in shares in the Company and delivered to the Executive Directors and senior management two years following this investment. Please refer to the Remuneration Committee report on pages 80 to 101 for further information.
12. Finance income and costs – Continuing operations
2018 2017
Notes
Pre- exceptional
€’m
Exceptional (note 6)
€’mTotal
€’m
Pre- exceptional
€’m
Exceptional (note 6)
€’mTotal €’m
Finance incomeInterest income on loans to related parties 37 0.4 – 0.4 0.7 – 0.7Interest income on deposits and others 3.1 – 3.1 2.3 – 2.3Net interest income on currency swaps 0.4 – 0.4 – – –
Total finance income 3.9 – 3.9 3.0 – 3.0
Finance costsBank borrowing costs (12.2) – (12.2) (7.3) – (7.3)Facility fees including cost amortisation (2.0) – (2.0) (2.6) (0.1) (2.7)Unwinding of discounts – – – (0.1) – (0.1)Finance lease costs – – – (0.1) – (0.1)Net interest expense on currency swaps – – – (1.2) – (1.2)Finance cost of private placement debt (7.2) – (7.2) (14.7) (13.9) (28.6)
Total finance costs (21.4) – (21.4) (26.0) (14.0) (40.0)
Net finance costs (17.5) – (17.5) (23.0) (14.0) (37.0)
Net finance costs do not include bank borrowing costs of €0.8 million (2017: €0.8 million) attributable to the acquisition, construction or production of a qualifying asset, which have been capitalised, as disclosed in note 16. Interest is capitalised at the Group’s average interest rate (excluding exceptional items) for the period of 4.3% (2017: 3.9%). Where relevant, tax deduction for capitalised interest was taken in accordance with Sec 81(3), TCA 1997.
Notes to the Financial Statements continued

Glanbia plc | Annual Report and Financial Statements 2018
157
13. Income taxes
2018 2017
Notes
Continuing operations
€’m
Discontinued operations
€’mTotal
€’m
Continuing operations
€’m
Discontinued operations
€’mTotal €’m
Current taxIrish current tax charge (15.7) – (15.7) (12.3) (0.9) (13.2)Adjustments in respect of prior years 0.9 – 0.9 0.5 0.1 0.6
Irish current tax for the year (14.8) – (14.8) (11.8) (0.8) (12.6)
Foreign current tax (17.9) – (17.9) (12.4) – (12.4)Adjustments in respect of prior years (1.0) – (1.0) 3.2 – 3.2
Foreign current tax for the year (18.9) – (18.9) (9.2) – (9.2)
Total current tax (33.7) – (33.7) (21.0) (0.8) (21.8)
Deferred taxDeferred tax – current year 0.7 – 0.7 28.2 (0.6) 27.6Adjustments in respect of prior years 0.2 – 0.2 0.3 0.2 0.5
Total deferred tax 27 0.9 – 0.9 28.5 (0.4) 28.1
Tax (charge)/credit 34 (32.8) – (32.8) 7.5 (1.2) 6.3
The tax credit on exceptional items and the exceptional deferred tax credit included in the above amounts is as follows:
2018 2017
Notes
Continuing operations
€’m
Discontinued operations
€’mTotal
€’m
Continuing operations
€’m
Discontinued operations
€’mTotal €’m
Current tax credit/(charge) on exceptional items – – – 4.8 (0.7) 4.1
Deferred tax credit/(charge) on exceptional items – – – 2.3 (0.2) 2.1
Deferred tax credit due to US tax reform 27 – – – 38.7 – 38.7
Total tax credit/(charge) on exceptional items and exceptional deferred tax credit for the year 6 – – – 45.8 (0.9) 44.9
The net tax credit on exceptional items in 2017 has been disclosed separately above as it relates to costs and income which have been presented as exceptional.
The tax on the Group’s profit before tax for continuing operations differs from the theoretical amount that would arise applying the corporation tax rate in Ireland, as follows:
2018 €’m
2017 €’m
Profit before tax – Continuing operations 266.8 229.7
Income tax calculated at Irish rate of 12.5% (2017: 12.5%) (33.3) (28.7)Earnings at higher Irish rates (0.4) (2.5)Difference due to overseas tax rates (capital and trading) (3.3) (6.7)Reduction in US tax rate – 38.7Adjustment to tax charge in respect of previous periods 0.1 4.0Tax on share of results of Equity accounted investees included in profit before tax 5.7 5.4Other reconciling differences (1.6) (2.7)
Total tax (charge)/credit – Continuing operations (32.8) 7.5
Details of deferred tax charged or credited directly to other comprehensive income during the year are outlined in note 27.

Glanbia plc | Annual Report and Financial Statements 2018
158
> Financial Statements
13. Income taxes continuedFactors that may affect future tax charges and other disclosure requirementsThe total tax charge in future periods will be affected by any changes to the applicable tax rates in force in jurisdictions in which the Group operates and other relevant changes in tax legislation, including amendments impacting on the excess of tax depreciation over accounting depreciation and clarification on certain application matters in relation to the Tax Cuts and Jobs Act enacted in December 2017 in the US (due by 22 June 2019). The total tax charge of the Group may also be influenced by the effects of corporate development activity and the resolution of uncertain tax positions where the final outcome of those matters is different than the amounts recorded using the probability weighted expected value approach.
14. Earnings Per Share BasicBasic Earnings Per Share is calculated by dividing the net profit attributable to the equity holders of the Company by the weighted average number of ordinary shares in issue during the year, excluding ordinary shares purchased by the Group and held as own shares (note 24). The weighted average number of ordinary shares in issue used in the calculation of basic Earnings Per Share is 295,159,530 (2017: 295,010,462).
2018 2017
Continuing operations
Discontinued operations Total
Continuing operations
Discontinued operations Total
Profit after tax attributable to equity holders of the Company (€’m) 234.0 – 234.0 237.2 92.2 329.4
Basic Earnings Per Share (cent) 79.28 – 79.28 80.40 31.25 111.65
DilutedDiluted Earnings Per Share is calculated by adjusting the weighted average number of ordinary shares in issue to assume conversion of all potential dilutive ordinary shares. Share options and share awards are the Company’s only potential dilutive ordinary shares.
The share awards, which are performance based, are treated as contingently issuable shares, because their issue is contingent upon satisfaction of specified performance conditions, as well as the passage of time. Contingently issuable shares are included in the calculation of Diluted Earnings Per Share to the extent that conditions governing exercisability have been satisfied, as if the end of the reporting period were the end of the vesting period. The number of share options represents the number expected to be exercised.
2018 2017
Weighted average number of ordinary shares in issue 295,159,530 295,010,462Shares deemed to be issued for no consideration in respect of:Share awards 858,826 759,074Share options 28,182 29,639
Weighted average number of shares used in the calculation of Diluted Earnings Per Share 296,046,538 295,799,175
2018 2017
Continuing operations
Discontinued operations Total
Continuing operations
Discontinued operations Total
Diluted Earnings Per Share (cent) 79.04 – 79.04 80.19 31.17 111.36
Pro-forma Adjusted Earnings Per Share (Non-IFRS information)Pro-forma Adjusted Earnings Per Share is a non-IFRS performance measure. Pro-forma calculation of Adjusted Earnings Per Share from continuing operations has been provided as it reflects the metrics used by the Group to measure profitability and financial performance and represents the revised and ongoing structure of the Group following the disposal of 60% of Dairy Ireland and related assets in 2017. Refer to Glossary of KPIs and non-IFRS performance measures for details on calculation.
Notes to the Financial Statements continued
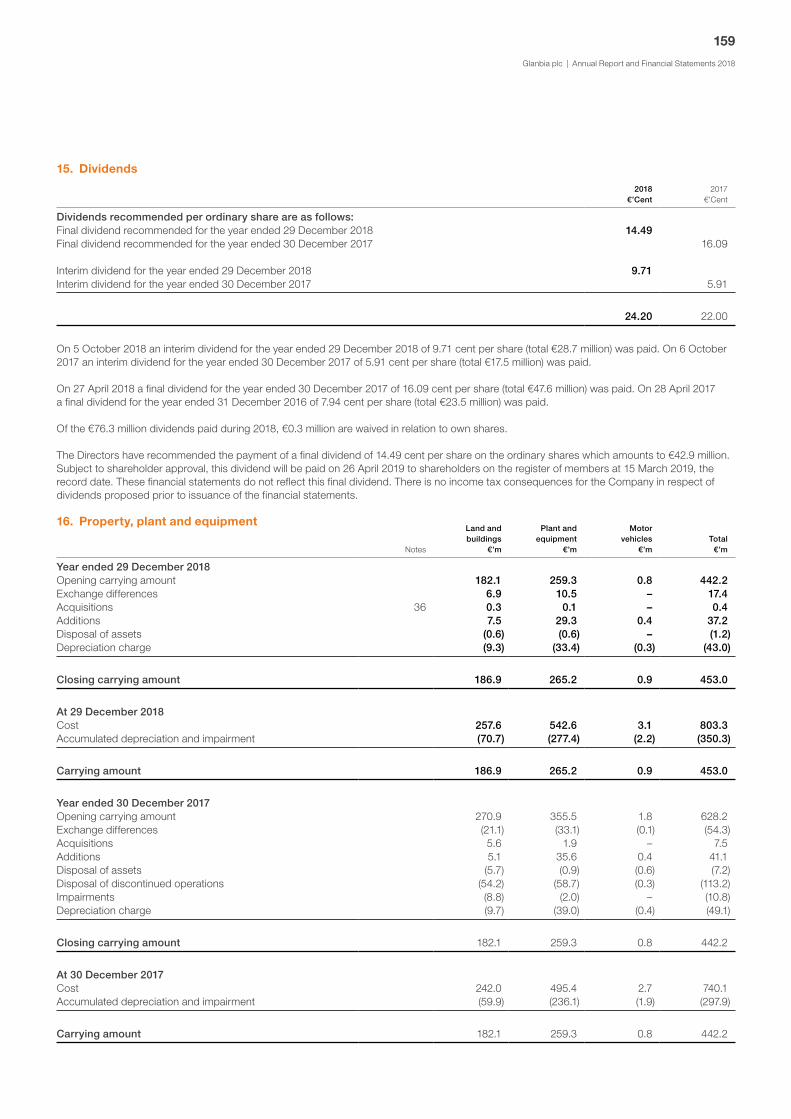
Glanbia plc | Annual Report and Financial Statements 2018
159
15. Dividends
2018 €’Cent
2017 €’Cent
Dividends recommended per ordinary share are as follows:Final dividend recommended for the year ended 29 December 2018 14.49Final dividend recommended for the year ended 30 December 2017 16.09
Interim dividend for the year ended 29 December 2018 9.71Interim dividend for the year ended 30 December 2017 5.91
24.20 22.00
On 5 October 2018 an interim dividend for the year ended 29 December 2018 of 9.71 cent per share (total €28.7 million) was paid. On 6 October 2017 an interim dividend for the year ended 30 December 2017 of 5.91 cent per share (total €17.5 million) was paid.
On 27 April 2018 a final dividend for the year ended 30 December 2017 of 16.09 cent per share (total €47.6 million) was paid. On 28 April 2017 a final dividend for the year ended 31 December 2016 of 7.94 cent per share (total €23.5 million) was paid.
Of the €76.3 million dividends paid during 2018, €0.3 million are waived in relation to own shares.
The Directors have recommended the payment of a final dividend of 14.49 cent per share on the ordinary shares which amounts to €42.9 million. Subject to shareholder approval, this dividend will be paid on 26 April 2019 to shareholders on the register of members at 15 March 2019, the record date. These financial statements do not reflect this final dividend. There is no income tax consequences for the Company in respect of dividends proposed prior to issuance of the financial statements.
16. Property, plant and equipment
Notes
Land and buildings
€’m
Plant and equipment
€’m
Motor vehicles
€’mTotal
€’m
Year ended 29 December 2018Opening carrying amount 182.1 259.3 0.8 442.2Exchange differences 6.9 10.5 – 17.4Acquisitions 36 0.3 0.1 – 0.4Additions 7.5 29.3 0.4 37.2Disposal of assets (0.6) (0.6) – (1.2)Depreciation charge (9.3) (33.4) (0.3) (43.0)
Closing carrying amount 186.9 265.2 0.9 453.0
At 29 December 2018Cost 257.6 542.6 3.1 803.3Accumulated depreciation and impairment (70.7) (277.4) (2.2) (350.3)
Carrying amount 186.9 265.2 0.9 453.0
Year ended 30 December 2017Opening carrying amount 270.9 355.5 1.8 628.2Exchange differences (21.1) (33.1) (0.1) (54.3)Acquisitions 5.6 1.9 – 7.5Additions 5.1 35.6 0.4 41.1Disposal of assets (5.7) (0.9) (0.6) (7.2)Disposal of discontinued operations (54.2) (58.7) (0.3) (113.2)Impairments (8.8) (2.0) – (10.8)Depreciation charge (9.7) (39.0) (0.4) (49.1)
Closing carrying amount 182.1 259.3 0.8 442.2
At 30 December 2017Cost 242.0 495.4 2.7 740.1Accumulated depreciation and impairment (59.9) (236.1) (1.9) (297.9)
Carrying amount 182.1 259.3 0.8 442.2

Glanbia plc | Annual Report and Financial Statements 2018
160
> Financial Statements
16. Property, plant and equipment continuedThe amounts charged to the Group income statement during the year are as follows:
2018 2017
Continuing operations (note 5/12)
€’m
Discontinued operations
€’mTotal
€’m
Continuing operations (note 5/12)
€’m
Discontinued operations
€’mTotal €’m
Depreciation 43.0 – 43.0 45.1 4.0 49.1Impairment – – – 2.7 8.1 10.8Operating lease rentals 21.0 – 21.0 20.1 3.1 23.2
Included in the closing cost at 29 December 2018 is an amount of €15.5 million (2017: €11.9 million) incurred in respect of assets under construction. Included in the cost of additions for 2018 is €1.2 million (2017: €0.6 million) incurred in respect of staff costs capitalised into assets. Included in the cost of additions for 2018 is €0.8 million (2017: €0.8 million) incurred in respect of borrowing cost capitalised into assets.
Assets held under finance leasesAt 29 December 2018, tangible fixed assets held under finance leases amounted to €0.1 million (2017: €0.1 million). Depreciation on assets held under finance leases was €0.3 million (2017: €0.4 million).
17. Intangible assets
NotesGoodwill
€’m
Brands and other
intangibles €’m
Software costs
€’m
Development costs
€’mTotal
€’m
Year ended 29 December 2018Opening carrying amount 396.2 503.9 43.4 16.3 959.8Exchange differences 16.1 21.2 0.9 0.7 38.9Acquisitions 36 137.5* 183.0 0.1 – 320.6Additions – 1.0 16.3 13.3 30.6Amortisation 5 – (29.0) (6.8) (10.1) (45.9)
Closing carrying amount 549.8 680.1 53.9 20.2 1,304.0
At 29 December 2018Cost 549.8 871.6 96.1 87.8 1,605.3Accumulated amortisation and impairment – (191.5) (42.2) (67.6) (301.3)
Carrying amount 549.8 680.1 53.9 20.2 1,304.0
Year ended 30 December 2017Opening carrying amount 386.9 513.2 32.6 33.5 966.2Exchange differences (48.0) (67.1) (2.3) (3.2) (120.6)Acquisitions 68.1 91.3 – – 159.4Additions – 0.8 20.2 13.5 34.5Disposals of discontinued operations (10.8) (4.1) (1.6) – (16.5)Amortisation – (30.2) (5.5) (27.5) (63.2)
Closing carrying amount 396.2 503.9 43.4 16.3 959.8
At 30 December 2017Cost 396.2 659.4 76.4 70.9 1,202.9Accumulated amortisation and impairment – (155.5) (33.0) (54.6) (243.1)
Carrying amount 396.2 503.9 43.4 16.3 959.8
* Goodwill acquisitions comprised €137.0 million of goodwill arising on the SlimFast acquisition, and €0.5 million of a revision to goodwill on the acquisition of Body & Fit.
Notes to the Financial Statements continued

Glanbia plc | Annual Report and Financial Statements 2018
161
The amounts charged to the Group income statement during the year are as follows:
2018 2017
Continuing operations
(note 5) €’m
Discontinued operations
€’mTotal
€’m
Continuing operations
(note 5) €’m
Discontinued operations
(note 10) €’m
Total €’m
Amortisation – pre-exceptional 45.9 – 45.9 43.1 0.7 43.8Amortisation – exceptional – – – 19.4 – 19.4
The average remaining amortisation period for software costs is 5.8 years (2017: 4.6 years) and development costs is 2.2 years (2017: 3 years).
Approximately €12.6 million (2017: €13.6 million) of software additions during the year were internally generated which included €12.1 million (2017: €12.3 million) of staff costs capitalised. Approximately €12.6 million of development cost additions during the year (2017: €13.2 million) were internally generated which included €6.9 million (2017: €8.3 million) of staff costs capitalised.
In the prior year the estimated useful life of development assets was reduced from six years to three years. The change in useful life reflects the speed at which new trends and formats are emerging in the Glanbia Performance Nutrition and Glanbia Nutritionals segments. The additional amortisation in the prior year due to the change in estimated useful life amounted to €19.4 million and is included in exceptional items (note 6).
Brands and other intangibles
NotesBrands
€’m
Customer relationships
€’mOther
€’mTotal €’m
Year ended 29 December 2018Opening carrying amount 335.2 166.4 2.3 503.9Exchange differences 14.3 6.8 0.1 21.2Acquisitions 36 120.7 62.3 – 183.0Additions 1.0 – – 1.0Amortisation (7.8) (20.8) (0.4) (29.0)
Closing carrying amount 463.4 214.7 2.0 680.1
At 29 December 2018Cost 507.8 360.3 3.5 871.6Accumulated amortisation and impairment (44.4) (145.6) (1.5) (191.5)
Carrying amount 463.4 214.7 2.0 680.1
Year ended 30 December 2017Opening carrying amount 339.7 172.1 1.4 513.2Exchange differences (43.5) (23.6) – (67.1)Acquisitions 50.8 39.9 0.6 91.3Additions – – 0.8 0.8Disposal of discontinued operations (3.8) (0.3) – (4.1)Amortisation (8.0) (21.7) (0.5) (30.2)
Closing carrying amount 335.2 166.4 2.3 503.9
At 30 December 2017Cost 370.1 285.0 4.3 659.4Accumulated amortisation and impairment (34.9) (118.6) (2.0) (155.5)
Carrying amount 335.2 166.4 2.3 503.9
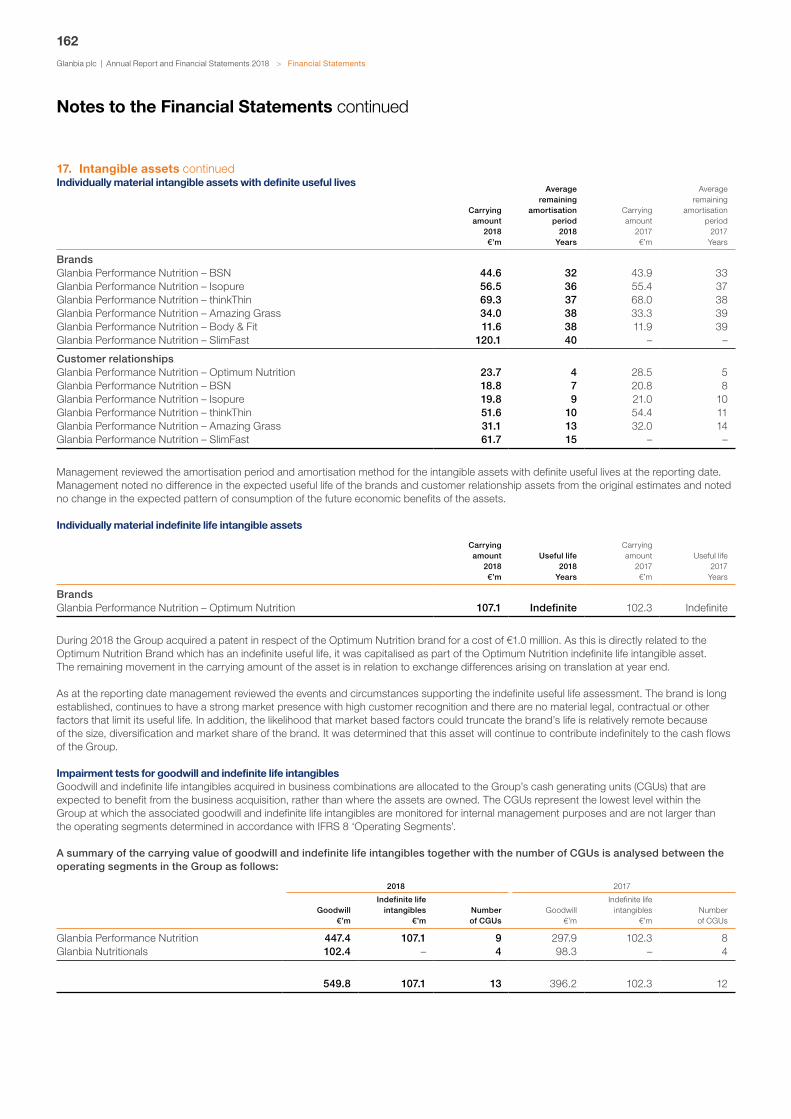
Glanbia plc | Annual Report and Financial Statements 2018
162
> Financial Statements
17. Intangible assets continuedIndividually material intangible assets with definite useful lives
Carrying amount
2018 €’m
Average remaining
amortisation period
2018 Years
Carrying amount
2017 €’m
Average remaining
amortisation period 2017 Years
Brands Glanbia Performance Nutrition – BSN 44.6 32 43.9 33Glanbia Performance Nutrition – Isopure 56.5 36 55.4 37Glanbia Performance Nutrition – thinkThin 69.3 37 68.0 38Glanbia Performance Nutrition – Amazing Grass 34.0 38 33.3 39Glanbia Performance Nutrition – Body & Fit 11.6 38 11.9 39Glanbia Performance Nutrition – SlimFast 120.1 40 – –
Customer relationshipsGlanbia Performance Nutrition – Optimum Nutrition 23.7 4 28.5 5Glanbia Performance Nutrition – BSN 18.8 7 20.8 8Glanbia Performance Nutrition – Isopure 19.8 9 21.0 10Glanbia Performance Nutrition – thinkThin 51.6 10 54.4 11Glanbia Performance Nutrition – Amazing Grass 31.1 13 32.0 14Glanbia Performance Nutrition – SlimFast 61.7 15 – –
Management reviewed the amortisation period and amortisation method for the intangible assets with definite useful lives at the reporting date. Management noted no difference in the expected useful life of the brands and customer relationship assets from the original estimates and noted no change in the expected pattern of consumption of the future economic benefits of the assets.
Individually material indefinite life intangible assets
Carrying amount
2018 €’m
Useful life 2018
Years
Carrying amount
2017 €’m
Useful life 2017
Years
BrandsGlanbia Performance Nutrition – Optimum Nutrition 107.1 Indefinite 102.3 Indefinite
During 2018 the Group acquired a patent in respect of the Optimum Nutrition brand for a cost of €1.0 million. As this is directly related to the Optimum Nutrition Brand which has an indefinite useful life, it was capitalised as part of the Optimum Nutrition indefinite life intangible asset. The remaining movement in the carrying amount of the asset is in relation to exchange differences arising on translation at year end.
As at the reporting date management reviewed the events and circumstances supporting the indefinite useful life assessment. The brand is long established, continues to have a strong market presence with high customer recognition and there are no material legal, contractual or other factors that limit its useful life. In addition, the likelihood that market based factors could truncate the brand’s life is relatively remote because of the size, diversification and market share of the brand. It was determined that this asset will continue to contribute indefinitely to the cash flows of the Group.
Impairment tests for goodwill and indefinite life intangiblesGoodwill and indefinite life intangibles acquired in business combinations are allocated to the Group’s cash generating units (CGUs) that are expected to benefit from the business acquisition, rather than where the assets are owned. The CGUs represent the lowest level within the Group at which the associated goodwill and indefinite life intangibles are monitored for internal management purposes and are not larger than the operating segments determined in accordance with IFRS 8 ‘Operating Segments’.
A summary of the carrying value of goodwill and indefinite life intangibles together with the number of CGUs is analysed between the operating segments in the Group as follows:
2018 2017
Goodwill €’m
Indefinite life intangibles
€’mNumber of CGUs
Goodwill €’m
Indefinite life intangibles
€’mNumber of CGUs
Glanbia Performance Nutrition 447.4 107.1 9 297.9 102.3 8Glanbia Nutritionals 102.4 – 4 98.3 – 4
549.8 107.1 13 396.2 102.3 12
Notes to the Financial Statements continued

Glanbia plc | Annual Report and Financial Statements 2018
163
In accordance with IAS 36 ‘Impairment of Assets’, the CGUs to which significant amounts of goodwill and indefinite life intangibles have been allocated and the associated discount rates used for impairment testing are set out below:
2018 2017
Goodwill €’m
Indefinite life intangibles
€’m
Discount rate Goodwill
€’m
Indefinite life intangibles
€’m
Discount rate
Glanbia Performance Nutrition – thinkThin 81.3 – 8.22% 77.6 – 7.08%Glanbia Performance Nutrition –
Optimum Nutrition 76.3 107.1 8.80% 72.9 102.3 7.76%Glanbia Performance Nutrition – Isopure 55.4 – 9.35% 52.9 – 7.08%Glanbia Performance Nutrition – Amazing Grass 37.1 – 8.22% 35.4 – 7.08%Glanbia Performance Nutrition – Body & Fit 28.5 – 8.63% 28.0 – 7.47%Glanbia Performance Nutrition – SlimFast 136.6 – 8.43% – – –Glanbia Nutritionals – Premix and non-dairy
bioactives – Americas 70.2 – 8.22% 67.1 – 7.08%Other CGUs without individually significant
goodwill 64.4 – 6.17%-9.50% 62.3 – 6.18%-8.65%
549.8 107.1 396.2 102.3
Key assumptionsThe recoverable amount of goodwill and indefinite life intangibles allocated to a CGU is determined based on a value in use computation. The key assumptions for calculating value in use of the CGUs are discount rates, growth rates and cash flows. They are described as follows:
Discount ratesRefer to the preceding table for the pre-tax discount rates that are applied to the cash flow projections in the value in use computations. The pre-tax discount rates are based on the Group’s weighted average cost of capital, calculated using the Capital Asset Pricing Model adjusted for the Group’s specific beta coefficient together with a country risk premium to take account of the countries from where the CGU derives its cash flows from, and adjusted to reflect risks associated with the CGU.
Growth ratesA terminal value of 2% growth into perpetuity was used to extrapolate cash flows beyond the budget and strategic plan period. This growth rate does not exceed the long-term average growth rate for the industries in which each CGU operates. The application of the terminal value has taken account of the Group’s strong financial position, its established history of earnings growth and cash flow generation, and its proven ability to integrate value enhancing acquisitions.
Cash flowsThe cash flow projections are based on three years of cash flows being, the 2019 budget formally approved by, and the strategic plan for 2020 and 2021 as presented to, the Board of Directors. In cases where management have strategic plans beyond 2021 these numbers are also used in the projections. Due to management’s plan as part of the direct-to-consumer business model to reinvest the profits of the business for a number of years to drive revenue growth and build the brand for potential expansion into other markets, the cash flows of the CGU relating to Body & Fit are forecast over a period of eight years. In respect of thinkThin the strategy presented to the Board covered a five year period from 2019 to 2023 and these cash flows have been used in the impairment calculations. In preparing the 2019 budget and strategic plan, management considered the Group’s history of earnings, past experience and cash flow generation. Management also considered external sources of information pertaining to estimated growth of the relevant market, customer and consumer behaviours, competitor activity and developing trends in the industry in which the CGU operates in. Business sustaining capital expenditure and working capital requirements are estimated by assigning values to the investment required to support the estimated future profitability taking into account historic investment patterns and past experience. The cash flow projections exclude the impact of future development and acquisition activity.
No impairments arose in either 2018 or 2017.
Sensitivity analysisThe key assumptions underlying the impairment reviews are set out above. Sensitivity analysis has been conducted in respect of each of the CGUs using the following sensitivity assumptions: 1% increase in the discount rate; 10% decrease in EBITDA growth; and nil terminal value growth.
During the year, there was a material increase in the discount rate on a number of the CGUs which significantly reduced the headroom thereon. From our sensitivity analysis, we have identified three CGUs where a reasonably possible change in one of the sensitivity assumptions could result in an impairment charge. The table below identifies the amount by which each CGU’s recoverable amount exceeds its carrying amount and the amounts by which each of the assumptions would have to either decline or increase to arrive at a zero excess of the recoverable amount over its carrying amount in the CGU:
CGU 1 CGU 2 CGU 3
Amount by which recoverable amount exceeds carrying amount €13.0m €5.4m €11.4mIncrease in 2018 pre-tax discount rate 63bps 14bps 84bpsDecrease in terminal value growth from 2% 81bps 19bps 160bpsDecrease in EBITDA growth from plan 6.85% 2.30% –*
* Sensitivity analysis in relation to this item will not result in the carrying amount exceeding the recoverable amount of the CGU.

Glanbia plc | Annual Report and Financial Statements 2018
164
> Financial Statements
18. Equity accounted investeesThe Group’s nature of interests in Equity accounted investees at the end of the reporting period is as follows:
Group Company
2018 €’m
2017 €’m
2018 €’m
2017 €’m
Spartan-Southwest Holdings, LLC 83.4 – – –Southwest Cheese Company, LLC – 45.0 – –Glanbia Cheese Limited 34.8 34.8 – –Glanbia Cheese EU Limited 19.7 – – –Glanbia Ireland DAC 196.6 187.1 95.4 95.4
Interest in Joint Ventures 334.5 266.9 95.4 95.4
Name of entity
Place of business/ country of incorporation Notes
2018 % of
ownership interest
2017 % of
ownership interest Primary activity
Spartan-Southwest Holdings, LLC Delaware, US (a) 50% – Holding companySouthwest Cheese Company, LLC Clovis, New Mexico, US (a) – 50% Cheese and nutritional ingredientsGlanbia Cheese Limited Magheralin and Llangefni, UK (b) 51% 51% Cheese productsGlanbia Cheese EU Limited Portlaoise, Ireland (c) 50% – Cheese productsGlanbia Ireland DAC Kilkenny, Ireland (d) 40% 40% Milk products, consumer goods and
agri trading
The entities listed above have share capital, consisting solely of ordinary shares, membership interests or membership units and preference shares.
(a) In 2018, Spartan-Southwest Holdings, LLC, was established to hold 100% of the ownership interest in Southwest Cheese Company, LLC (Southwest Cheese) and Spartan-Michigan, LLC (Michigan Cheese). Consequently, the Group now owns 50% of Spartan-Southwest Holdings, LLC, and its two subsidiaries (Southwest/Michigan Group). Southwest Cheese is a large scale manufacturer of premium quality block cheese and whey protein ingredients for consumer foods and beverage markets internationally. The Group acts as an agent on behalf of Southwest Cheese and earns commission on the sale of whey protein products and cheese. On transition to IFRS 15 on 30 December 2018, the Group will transition from an agent to a principal relationships, see note 2(ab). Michigan Cheese will also be a large scale manufacturer of premium quality block cheese and whey protein ingredients for consumer foods and beverage markets internationally. The plant is currently under construction in Michigan, US and is expected to be commissioned in 2021.
(b) Glanbia Cheese Limited is a leading European mozzarella producer. Its customers include most of the leading pizza and pasta chains, food service operators, industrial food manufacturers, wholesalers and retailers across Europe and internationally. The two plants (Magheralin and Llangefni) are strategically located in productive agricultural heartland which helps to ensure a secure and consistent supply of high-quality milk. The Group holds 51% of the share capital of Glanbia Cheese Limited but this entity is considered to be a Joint Venture as the Group does not have control of the company as it has equal representation on the Board of Directors, along with its Joint Venture partner Leprino Foods Company who directs the relevant activities of the business. The Group controls 50% of the voting rights and is entitled to appoint 50% of the total number of Directors to the Board.
(c) Glanbia Cheese EU Limited was established in 2018 and is a Joint Venture with Leprino Foods Company with each party owning 50% of the share capital of the company. The Group controls 50% of the voting rights and is entitled to appoint 50% of the total number of Directors to the Board. When operating, the company will be a producer of mozzarella cheese with a plant situated in Portlaoise, Ireland. It is expected to be commissioned in 2020.
(d) Glanbia Ireland DAC is the largest dairy and Agribusiness in Ireland. It owns leading consumer and Agri brands such as Avonmore, GAIN Animal Nutrition, Kilmeaden Cheese, Premier Milk, mymilkman.ie and Wexford. The Group holds 40% of the ordinary share capital of Glanbia Ireland DAC. However this entity is considered to be a Joint Venture of the Group as the business plan, which directs the relevant activities of the business, requires the unanimous approval of both the Group and Glanbia Co-operative Society Limited (the Society) (60% shareholding). Both parties also have rights to a share of the net assets of the arrangement.
In the prior year, on 2 July 2017, the Group disposed of 60% of its shareholding in Dairy Ireland and related assets to the Society, its ultimate parent (note 10). The related assets included the Groups shareholding in certain Joint Ventures and Associates. The nature of the transaction resulted in Glanbia Ireland DAC (formerly known as Glanbia Ingredients Ireland DAC) being recognised as an Associate up to 2 July 2017 and as a Joint Venture from 3 July 2017. The Group has no interests in Associates as at 30 December 2017 and as at 29 December 2018.
Notes to the Financial Statements continued

Glanbia plc | Annual Report and Financial Statements 2018
165
The movement in the Equity accounted investees recognised in the Group balance sheet is as follows:
Group Company
Notes2018 €’m
2017 €’m
2018 €’m
2017 €’m
At the beginning of the year 266.9 166.3 95.4 22.1Investment in Joint Ventures 53.9 – –Share of profit after tax (post exceptional) 34 45.3 51.8 – –Remeasurements – defined benefit plan – net of deferred tax (2.0) 1.3 – –Fair value movement on cash flow hedges – net of deferred tax (4.2) 2.8 – –Dividend received 37 (31.6) (15.8) – –Income tax movement 3.6 4.3 – –Exchange differences 2.6 (6.2) – –Fair value of investment in Glanbia Ireland DAC* 10 – 74.7 – 74.7Disposal of discontinued operations – (12.3) – (1.4)
At the end of the year 334.5 266.9 95.4 95.4
* The fair value of the investment in Glanbia Ireland DAC at 30 December 2017 includes net assets of €35.1 million, intangible assets of €27.7 million and goodwill of €11.9 million.
The above movements are further analysed on pages 166 and 167.
Recognition in the Group income statement and Group statement of comprehensive incomeThe following amounts have been recognised in the Group income statement and in the Group statement of comprehensive income in relation to results from Equity accounted investees:
Recognition in the Group income statement:
2018 2017
Continuing operations
€’m
Discontinued operations
(note 10) €’m
Total €’m
Continuing operations
€’m
Discontinued operations
(note 10) €’m
Total €’m
Share of profit after tax (post exceptional) 45.3 – 45.3 51.5 0.3 51.8
Recognition in the Group statement of comprehensive income:
2018 2017
Continuing operations
€’m
Discontinued operations
€’mTotal
€’m
Continuing operations
€’m
Discontinued operations
€’mTotal €’m
Remeasurements – defined benefit plans – net of deferred tax (2.0) – (2.0) (0.6) 1.9 1.3
Fair value movement on cash flow hedges – net of deferred tax (4.2) – (4.2) 2.8 – 2.8
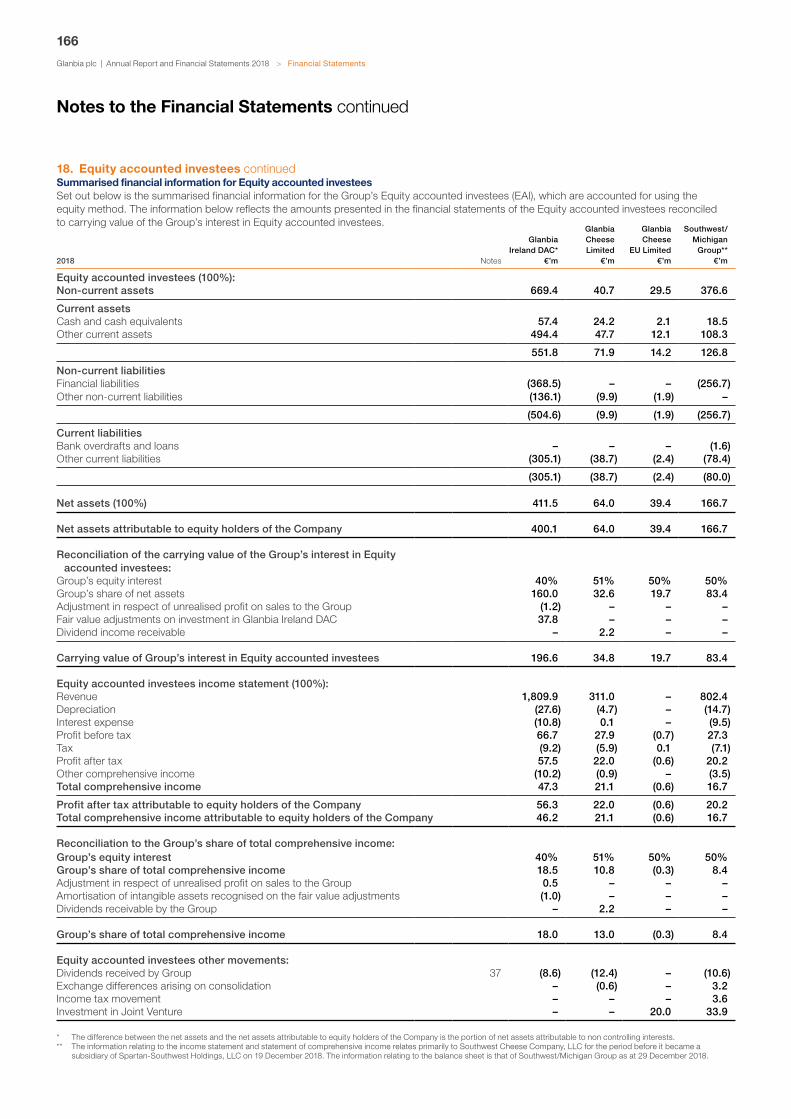
Glanbia plc | Annual Report and Financial Statements 2018
166
> Financial Statements
18. Equity accounted investees continuedSummarised financial information for Equity accounted investeesSet out below is the summarised financial information for the Group’s Equity accounted investees (EAI), which are accounted for using the equity method. The information below reflects the amounts presented in the financial statements of the Equity accounted investees reconciled to carrying value of the Group’s interest in Equity accounted investees.
2018 Notes
Glanbia Ireland DAC*
€’m
Glanbia Cheese Limited
€’m
Glanbia Cheese
EU Limited €’m
Southwest/Michigan
Group** €’m
Equity accounted investees (100%):Non-current assets 669.4 40.7 29.5 376.6
Current assetsCash and cash equivalents 57.4 24.2 2.1 18.5Other current assets 494.4 47.7 12.1 108.3
551.8 71.9 14.2 126.8
Non-current liabilitiesFinancial liabilities (368.5) – – (256.7)Other non-current liabilities (136.1) (9.9) (1.9) –
(504.6) (9.9) (1.9) (256.7)
Current liabilitiesBank overdrafts and loans – – – (1.6)Other current liabilities (305.1) (38.7) (2.4) (78.4)
(305.1) (38.7) (2.4) (80.0)
Net assets (100%) 411.5 64.0 39.4 166.7
Net assets attributable to equity holders of the Company 400.1 64.0 39.4 166.7
Reconciliation of the carrying value of the Group’s interest in Equity accounted investees:
Group’s equity interest 40% 51% 50% 50%Group’s share of net assets 160.0 32.6 19.7 83.4Adjustment in respect of unrealised profit on sales to the Group (1.2) – – –Fair value adjustments on investment in Glanbia Ireland DAC 37.8 – – –Dividend income receivable – 2.2 – –
Carrying value of Group’s interest in Equity accounted investees 196.6 34.8 19.7 83.4
Equity accounted investees income statement (100%):Revenue 1,809.9 311.0 – 802.4Depreciation (27.6) (4.7) – (14.7)Interest expense (10.8) 0.1 – (9.5)Profit before tax 66.7 27.9 (0.7) 27.3Tax (9.2) (5.9) 0.1 (7.1)Profit after tax 57.5 22.0 (0.6) 20.2Other comprehensive income (10.2) (0.9) – (3.5)Total comprehensive income 47.3 21.1 (0.6) 16.7
Profit after tax attributable to equity holders of the Company 56.3 22.0 (0.6) 20.2Total comprehensive income attributable to equity holders of the Company 46.2 21.1 (0.6) 16.7
Reconciliation to the Group’s share of total comprehensive income:Group’s equity interest 40% 51% 50% 50%Group’s share of total comprehensive income 18.5 10.8 (0.3) 8.4Adjustment in respect of unrealised profit on sales to the Group 0.5 – – –Amortisation of intangible assets recognised on the fair value adjustments (1.0) – – –Dividends receivable by the Group – 2.2 – –
Group’s share of total comprehensive income 18.0 13.0 (0.3) 8.4
Equity accounted investees other movements:Dividends received by Group 37 (8.6) (12.4) – (10.6)Exchange differences arising on consolidation – (0.6) – 3.2Income tax movement – – – 3.6Investment in Joint Venture – – 20.0 33.9
* The difference between the net assets and the net assets attributable to equity holders of the Company is the portion of net assets attributable to non controlling interests.** The information relating to the income statement and statement of comprehensive income relates primarily to Southwest Cheese Company, LLC for the period before it became a
subsidiary of Spartan-Southwest Holdings, LLC on 19 December 2018. The information relating to the balance sheet is that of Southwest/Michigan Group as at 29 December 2018.
Notes to the Financial Statements continued

Glanbia plc | Annual Report and Financial Statements 2018
167
2017
Glanbia Ingredients
Ireland DAC (note d)
€’m
Glanbia Cheese Limited
€’m
Southwest Cheese
Company, LLC €’m
Dairy Ireland EAI
(note d) €’m
Equity accounted investees (100%):Non-current assets 591.1 41.8 308.6 –
Current assetsCash and cash equivalents 46.5 27.2 – –Other current assets 487.8 47.7 91.6 –
534.3 74.9 91.6 –
Non-current liabilitiesFinancial liabilities (220.5) – (215.6) –Other non-current liabilities (128.7) (12.3) – –
(349.2) (12.3) (215.6) –
Current liabilitiesBank overdrafts and loans – – (9.9) –Other current liabilities (390.1) (40.4) (84.8) –
(390.1) (40.4) (94.7) –
Net assets (100%) 386.1 64.0 89.9 –
Net assets attributable to equity holders of the Company 375.1 64.0 89.9 –
Reconciliation of the carrying value of the Group’s interest in Equity accounted investees:
Group’s equity interest 40% 51% 50% –Group’s share of net assets 150.0 32.6 45.0 –Adjustment in respect of unrealised profit on sales to the Group (1.7) – – –Fair value adjustments on investments in Glanbia Ireland DAC 38.8 – – –Dividend income receivable – 2.2 – –
Carrying value of Group’s interest in Equity accounted investees 187.1 34.8 45.0 –
Equity accounted investees income statement (100%):Revenue 1,407.1 316.7 738.0 59.8Depreciation (22.8) (5.0) (12.0) 0.5Interest expense (11.1) – (5.3) (0.2)Profit before tax 50.3 40.2 25.8 0.9Tax (6.6) (8.0) (10.3) (0.1)Exceptional tax credit – – 17.4 –Profit after tax 43.7 32.2 32.9 0.8Other comprehensive income 1.5 2.1 1.5 3.7Total comprehensive income 45.2 34.3 34.4 4.5
Profit after tax attributable to equity holders of the Company 43.2 32.2 32.9 0.8Total comprehensive income attributable to equity holders of the Company 44.7 34.3 34.4 4.5
Reconciliation to the Group’s share of total comprehensive income:Group’s equity interest 40% 51% 50% –Group’s share of total comprehensive income 17.7 17.5 17.2 2.2Adjustment in respect of unrealised profit on sales to the Group (0.1) – – –Amortisation of intangible assets recognised as fair value adjustments (0.8) – – –Dividends receivable by the Group – 2.2 – –
Group’s share of total comprehensive income 16.8 19.7 17.2 2.2
Equity accounted investees other movements:Dividends received by Group – (4.7) (11.1) –Exchange differences arising on consolidation – (0.8) (5.4) –Income tax movement – – 4.3 –Investment in Joint Venture 74.7 – – –
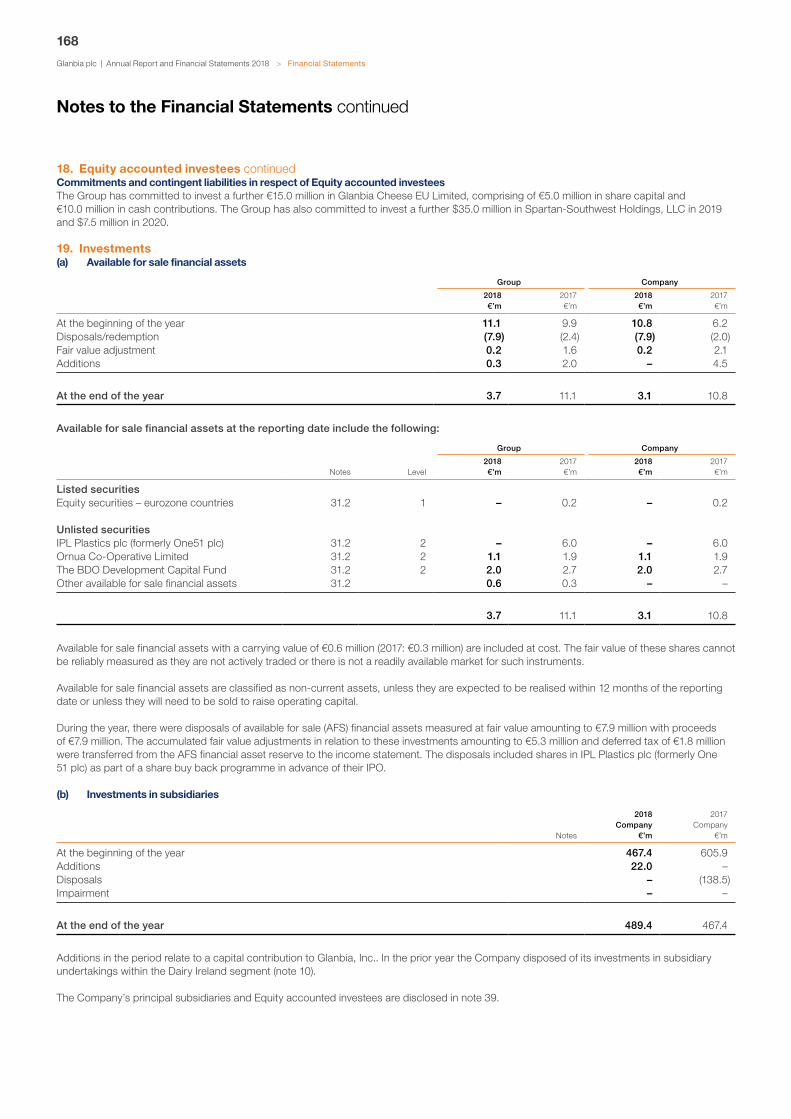
Glanbia plc | Annual Report and Financial Statements 2018
168
> Financial Statements
18. Equity accounted investees continuedCommitments and contingent liabilities in respect of Equity accounted investeesThe Group has committed to invest a further €15.0 million in Glanbia Cheese EU Limited, comprising of €5.0 million in share capital and €10.0 million in cash contributions. The Group has also committed to invest a further $35.0 million in Spartan-Southwest Holdings, LLC in 2019 and $7.5 million in 2020.
19. Investments(a) Available for sale financial assets
Group Company
2018 €’m
2017 €’m
2018 €’m
2017 €’m
At the beginning of the year 11.1 9.9 10.8 6.2Disposals/redemption (7.9) (2.4) (7.9) (2.0)Fair value adjustment 0.2 1.6 0.2 2.1Additions 0.3 2.0 – 4.5
At the end of the year 3.7 11.1 3.1 10.8
Available for sale financial assets at the reporting date include the following:
Group Company
Notes Level2018 €’m
2017 €’m
2018 €’m
2017 €’m
Listed securitiesEquity securities – eurozone countries 31.2 1 – 0.2 – 0.2
Unlisted securitiesIPL Plastics plc (formerly One51 plc) 31.2 2 – 6.0 – 6.0Ornua Co-Operative Limited 31.2 2 1.1 1.9 1.1 1.9The BDO Development Capital Fund 31.2 2 2.0 2.7 2.0 2.7Other available for sale financial assets 31.2 0.6 0.3 – –
3.7 11.1 3.1 10.8
Available for sale financial assets with a carrying value of €0.6 million (2017: €0.3 million) are included at cost. The fair value of these shares cannot be reliably measured as they are not actively traded or there is not a readily available market for such instruments.
Available for sale financial assets are classified as non-current assets, unless they are expected to be realised within 12 months of the reporting date or unless they will need to be sold to raise operating capital.
During the year, there were disposals of available for sale (AFS) financial assets measured at fair value amounting to €7.9 million with proceeds of €7.9 million. The accumulated fair value adjustments in relation to these investments amounting to €5.3 million and deferred tax of €1.8 million were transferred from the AFS financial asset reserve to the income statement. The disposals included shares in IPL Plastics plc (formerly One 51 plc) as part of a share buy back programme in advance of their IPO.
(b) Investments in subsidiaries
Notes
2018 Company
€’m
2017 Company
€’m
At the beginning of the year 467.4 605.9Additions 22.0 –Disposals – (138.5)Impairment – –
At the end of the year 489.4 467.4
Additions in the period relate to a capital contribution to Glanbia, Inc.. In the prior year the Company disposed of its investments in subsidiary undertakings within the Dairy Ireland segment (note 10).
The Company’s principal subsidiaries and Equity accounted investees are disclosed in note 39.
Notes to the Financial Statements continued

Glanbia plc | Annual Report and Financial Statements 2018
169
20. Trade and other receivables
Group Company
Current assets Notes2018 €’m
2017 €’m
2018 €’m
2017 €’m
Trade receivables 310.9 256.5 – –Less allowance for impairment of receivables (4.7) (4.0) – –
Trade receivables – net 31.2 306.2 252.5 – –Prepayments 18.4 15.3 0.4 –Receivables from Equity accounted investees 31.2/37(c) 13.2 14.4 – 0.1Receivables from other related parties 31.2/37(c) 0.2 1.1 – 0.7Loans to Equity accounted investees 37 0.1 13.1 – –Value added tax 2.2 0.5 – –Other receivables 9.9 5.5 – –Amounts due from other Group companies – – 346.8 317.4
350.2 302.4 347.2 318.2
Non-currentLoans to Equity accounted investees 37 29.8 – – –
Total 380.0 302.4 347.2 318.2
See note 35 for analysis of the movement in trade and other receivables. Information in relation to the Group’s credit risk and fair value estimation process is included in note 31.
The carrying amounts of the Group’s trade and other receivables at the reporting date by currency are as follows:
Group Company
2018 €’m
2017 €’m
2018 €’m
2017 €’m
Euro 73.5 48.9 347.2 318.2US dollar 259.0 221.3 – –Pound sterling 29.6 19.9 – –Australian dollar 4.2 3.3 – –Other 13.7 9.0 – –
Total 380.0 302.4 347.2 318.2
At 29 December 2018, Group trade receivables of €34.5 million (2017: €27.0 million) were past due:
2018 €’m
2017 €’m
Past due:Less than 30 days 21.9 16.71 to 3 months 8.9 4.84 to 6 months 0.4 1.2Over 6 months 3.3 4.3
34.5 27.0Less allowance for impairment of receivables (4.7) (4.0)
Total 29.8 23.0
Where the Group expects that those balances that are past due are not collectible in full the Group establishes an allowance for impairment that represents the difference between the carrying value of the trade and other receivable and the estimated future cash flows, see note 2(h).

Glanbia plc | Annual Report and Financial Statements 2018
170
> Financial Statements
20. Trade and other receivables continuedThe movement in the allowance for impairment of Group trade receivables is as follows:
2018 €’m
2017 €’m
At the beginning of the year 4.0 9.1Exchange differences 0.1 (0.2)Allowance for impairment recognised in the year 3.6 2.3Receivables written off during the year as uncollectible (0.9) (0.2)Unused amounts reversed (2.1) (1.9)Disposal of discontinued operations – (5.1)
At the end of the year 4.7 4.0
The net movement in the allowance for impairment of receivables has been included within the Group income statement.
21. Inventories
2018 €’m
2017 €’m
Raw materials 127.5 99.2Work in progress 6.8 8.4Finished goods 212.3 182.0Consumables 38.0 32.0
384.6 321.6
Included above are inventories carried at net realisable value amounting to €21.2 million (2017: €18.6 million).
Recognition in the Group income statement:
2018 2017
Continuing operations
(note 5) €’m
Discontinued operations
€’m
Total
€’m
Continuing operations
(note 5) €’m
Discontinued operations
€’m
Total
€’m
Cost of inventories recognised as an expense in Cost of Goods Sold 1,417.5 – 1,417.5 1,468.2 252.1 1,720.3
Write down of inventory to net realisable value during the year 4.7 – 4.7 7.7 0.2 7.9
Previous write downs of inventories reversed during the year* (5.0) – (5.0) (7.2) – (7.2)
(0.3) – (0.3) 0.5 0.2 0.7
* Previous write downs have been reversed as a result of increased sales prices in certain markets.
22. Cash and cash equivalents
Group Company
Notes2018 €’m
2017 €’m
2018 €’m
2017 €’m
Cash at bank and in hand 216.4 153.6 7.9 6.0Short term bank deposits 8.2 8.6 – –
Cash and cash equivalents in the Group and Company balance sheet 31.3 224.6 162.2 7.9 6.0
Bank overdrafts used for cash management purposes 26 (48.9) (30.1) – –
Cash and cash equivalents in the Group and Company statement of cash flows 175.7 132.1 7.9 6.0
Notes to the Financial Statements continued
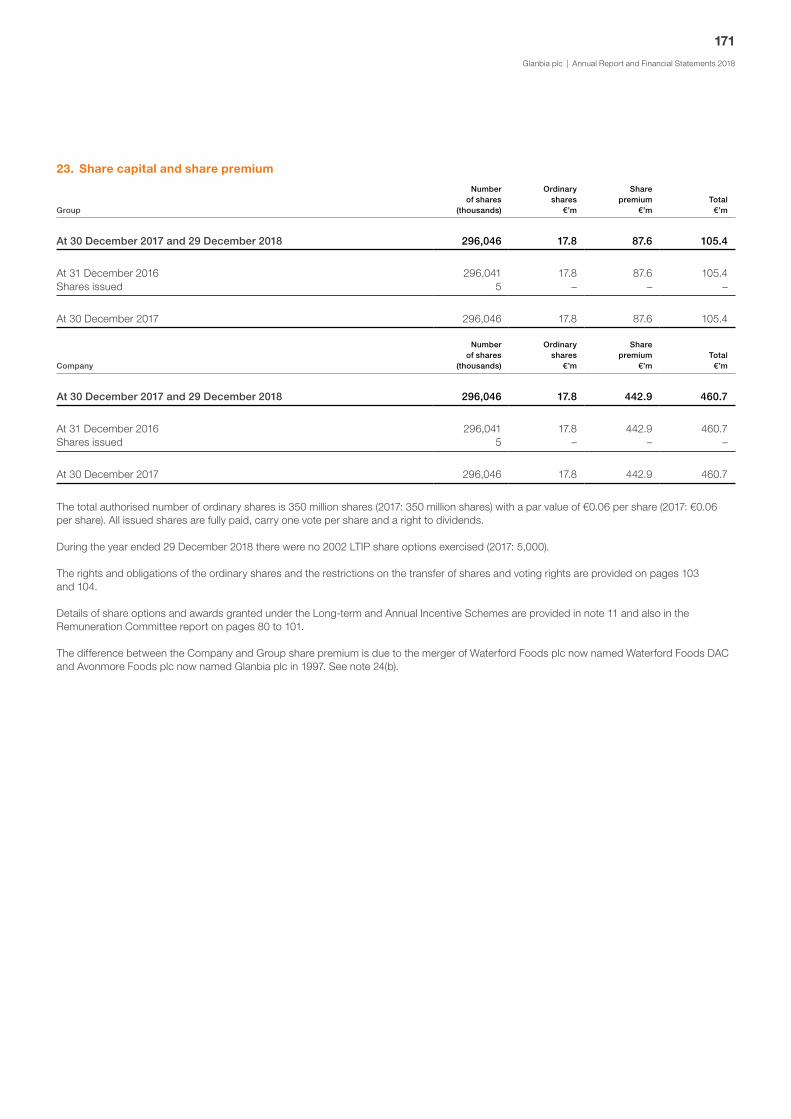
Glanbia plc | Annual Report and Financial Statements 2018
171
23. Share capital and share premium
Group
Number of shares
(thousands)
Ordinary shares
€’m
Share premium
€’mTotal
€’m
At 30 December 2017 and 29 December 2018 296,046 17.8 87.6 105.4
At 31 December 2016 296,041 17.8 87.6 105.4Shares issued 5 – – –
At 30 December 2017 296,046 17.8 87.6 105.4
Company
Number of shares
(thousands)
Ordinary shares
€’m
Share premium
€’mTotal
€’m
At 30 December 2017 and 29 December 2018 296,046 17.8 442.9 460.7
At 31 December 2016 296,041 17.8 442.9 460.7Shares issued 5 – – –
At 30 December 2017 296,046 17.8 442.9 460.7
The total authorised number of ordinary shares is 350 million shares (2017: 350 million shares) with a par value of €0.06 per share (2017: €0.06 per share). All issued shares are fully paid, carry one vote per share and a right to dividends.
During the year ended 29 December 2018 there were no 2002 LTIP share options exercised (2017: 5,000).
The rights and obligations of the ordinary shares and the restrictions on the transfer of shares and voting rights are provided on pages 103 and 104.
Details of share options and awards granted under the Long-term and Annual Incentive Schemes are provided in note 11 and also in the Remuneration Committee report on pages 80 to 101.
The difference between the Company and Group share premium is due to the merger of Waterford Foods plc now named Waterford Foods DAC and Avonmore Foods plc now named Glanbia plc in 1997. See note 24(b).
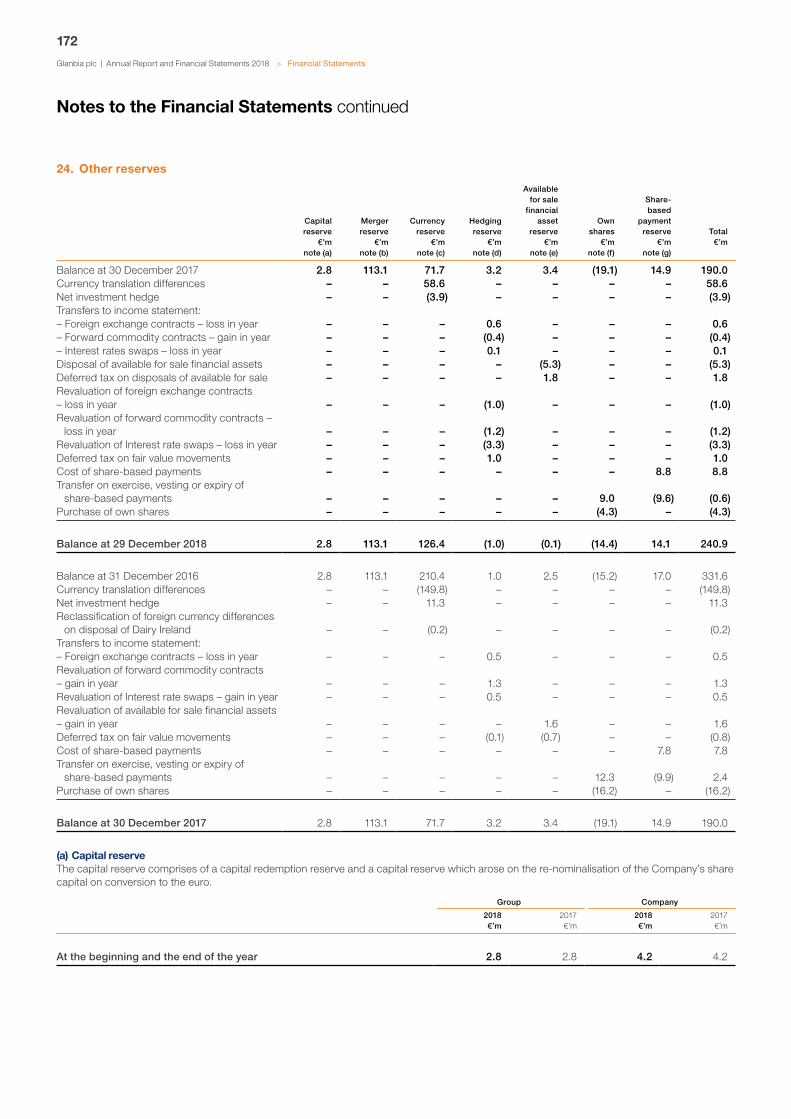
Glanbia plc | Annual Report and Financial Statements 2018
172
> Financial Statements
24. Other reserves
Capital reserve
€’m note (a)
Merger reserve
€’m note (b)
Currency reserve
€’m note (c)
Hedging reserve
€’m note (d)
Available for sale
financial asset
reserve €’m
note (e)
Own shares
€’m note (f)
Share-based
payment reserve
€’m note (g)
Total €’m
Balance at 30 December 2017 2.8 113.1 71.7 3.2 3.4 (19.1) 14.9 190.0Currency translation differences – – 58.6 – – – – 58.6Net investment hedge – – (3.9) – – – – (3.9)Transfers to income statement:– Foreign exchange contracts – loss in year – – – 0.6 – – – 0.6– Forward commodity contracts – gain in year – – – (0.4) – – – (0.4)– Interest rates swaps – loss in year – – – 0.1 – – – 0.1Disposal of available for sale financial assets – – – – (5.3) – – (5.3)Deferred tax on disposals of available for sale – – – – 1.8 – – 1.8Revaluation of foreign exchange contracts – loss in year – – – (1.0) – – – (1.0)Revaluation of forward commodity contracts –
loss in year – – – (1.2) – – – (1.2)Revaluation of Interest rate swaps – loss in year – – – (3.3) – – – (3.3)Deferred tax on fair value movements – – – 1.0 – – – 1.0Cost of share-based payments – – – – – – 8.8 8.8Transfer on exercise, vesting or expiry of
share-based payments – – – – – 9.0 (9.6) (0.6)Purchase of own shares – – – – – (4.3) – (4.3)
Balance at 29 December 2018 2.8 113.1 126.4 (1.0) (0.1) (14.4) 14.1 240.9
Balance at 31 December 2016 2.8 113.1 210.4 1.0 2.5 (15.2) 17.0 331.6Currency translation differences – – (149.8) – – – – (149.8)Net investment hedge – – 11.3 – – – – 11.3Reclassification of foreign currency differences
on disposal of Dairy Ireland – – (0.2) – – – – (0.2)Transfers to income statement:– Foreign exchange contracts – loss in year – – – 0.5 – – – 0.5Revaluation of forward commodity contracts – gain in year – – – 1.3 – – – 1.3Revaluation of Interest rate swaps – gain in year – – – 0.5 – – – 0.5Revaluation of available for sale financial assets – gain in year – – – – 1.6 – – 1.6Deferred tax on fair value movements – – – (0.1) (0.7) – – (0.8)Cost of share-based payments – – – – – – 7.8 7.8Transfer on exercise, vesting or expiry of
share-based payments – – – – – 12.3 (9.9) 2.4Purchase of own shares – – – – – (16.2) – (16.2)
Balance at 30 December 2017 2.8 113.1 71.7 3.2 3.4 (19.1) 14.9 190.0
(a) Capital reserveThe capital reserve comprises of a capital redemption reserve and a capital reserve which arose on the re-nominalisation of the Company’s share capital on conversion to the euro.
Group Company
2018 €’m
2017 €’m
2018 €’m
2017 €’m
At the beginning and the end of the year 2.8 2.8 4.2 4.2
Notes to the Financial Statements continued

Glanbia plc | Annual Report and Financial Statements 2018
173
(b) Merger reserveThe merger reserve arose on the merger of Waterford Foods plc now named Waterford Foods DAC and Avonmore Foods plc now named Glanbia plc in 1997. The merger reserve adjustment represents the difference between the nominal value of the issued share capital of Waterford Foods DAC and the fair value of the shares issued by Glanbia plc.
2018 €’m
2017 €’m
Share premium representing excess of fair value over nominal value of ordinary shares issued in connection with the merger of Avonmore Foods plc and Waterford Foods plc 355.3 355.3
Merger reserve adjustment (327.2) (327.2)Share premium and other reserves relating to nominal value of shares in Waterford Foods plc 85.0 85.0
At the beginning and end of the year 113.1 113.1
(c) Currency reserveThe currency reserve reflects the foreign exchange gains and losses arising from the translation of the net investment in foreign operations and on borrowings designated as hedges of the net investment which are taken to equity. The movement in US dollar foreign exchange rates from 1.1993 as at 30 December 2017 to 1.1454 as at 29 December 2018 is the primary driver of the movement in the currency reserve in the year. When an entity is sold the accumulated foreign currency gains and losses are recycled to the income statement.
(d) Hedging reserveThe hedging reserve reflects the effective portion of changes in the fair value of derivatives that are designated and qualify as cash flow hedges. Amounts accumulated in the hedging reserve are recycled to the income statement in the periods when the hedged item affects income or expense. The hedging reserve also reflects the Group’s share of the effective portion of changes in the fair value of derivatives that are entered into by the Group’s Equity accounted investees (note 31.1).
The movements on the hedging reserve for the years ended 29 December 2018 and 30 December 2017 are as follows:
Equity accounted
investees €’m
Group €’m
Total hedging reserve
€’m
Balance at 30 December 2017 3.3 (0.1) 3.2Transfer to income statement– Foreign exchange contracts – loss in year 0.2 0.4 0.6– Interest rate swaps – loss in year 0.1 – 0.1– Forward commodity contracts – gain in year (0.4) – (0.4)Revaluation of foreign exchange contracts – loss in year (0.6) (0.4) (1.0)Revaluation of forward commodity contracts – loss in year (1.1) (0.1) (1.2)Revaluation of interest rate swaps – loss in year (3.3) – (3.3)Deferred tax on fair value movements 0.9 0.1 1.0
Balance at 29 December 2018 (0.9) (0.1) (1.0)
Balance at 31 December 2016 0.5 0.5 1.0Foreign exchange contracts gain/(loss) in year 0.1 (0.1) –Transfer to income statement– Foreign exchange contracts – loss/(gain) in year 0.9 (0.4) 0.5– Revaluation of interest rate swaps – gain in year 0.5 – 0.5– Forward commodity contracts – loss/(gain) in year 0.1 (0.1) –Revaluation of forward commodity contracts – gain in year 1.3 – 1.3Deferred tax on fair value movements (0.1) – (0.1)
Balance at 30 December 2017 3.3 (0.1) 3.2
(e) Available for sale financial asset reserveUnrealised gains and losses arising from changes in the fair value of available for sale financial assets are recognised in the available for sale financial asset reserve. When such available for sale financial assets are sold or impaired, the accumulated fair value adjustments are recycled to the income statement.

Glanbia plc | Annual Report and Financial Statements 2018
174
> Financial Statements
24. Other reserves continued(f) Own sharesThe own shares reserve reflects the ordinary shares of Glanbia plc which are held in trust.
The movement in own shares for the year ended 29 December 2018 and 30 December 2017 are as follows:
2018 2017
Value €’m
Nominal value
€’mNumber
of SharesValue
€’m
Nominal value
€’mNumber
of Shares
At the beginning of the year 19.1 0.2 1,127,066 15.2 0.1 934,860Purchased 4.3 – 291,362 16.2 0.1 938,590Allocated (9.0) (0.1) (547,093) (12.3) – (746,384)
At the end of the year 14.4 0.1 871,335 19.1 0.2 1,127,066
The shares acquired during the year and those held in trust are allocated to employees under the 2008 and 2018 LTIP plan, and the AIDIS scheme. This represented an insignificant amount of the total share capital at the beginning and end of the year.
An Employee Share Trust was established in May 2002 to operate initially in connection with the Company’s Saving Related Share Option Scheme (Sharesave Scheme) and subsequently for the vesting of shares under the 2008 and 2018 LTIP. The Trustee of the Employee Share Trust is Computershare Trustees (Jersey) Limited, a Jersey based trustee services company. The dividend rights in respect of these shares have been waived, save 0.001 cent per share. An Employee Share Scheme Trust was established in April 2013 to operate in connection with the Company’s AIDIS scheme. The Trustee of the Employee Share Scheme Trust is Glanbia Management Services Limited. The dividend rights in respect of shares which have not vested have been waived.
Shares purchased for the 2008 and 2018 LTIP schemes and the Company’s AIDIS scheme are deemed to be own shares in accordance with IAS 32 ‘Financial Instruments’. The shares included in the Employee Share Trust and the Employee Share Scheme Trust at 29 December 2018 cost €14.4 million (2017: €19.1 million). These restrict distributable profits by €14.4 million (2017: €19.1 million) and had a market value of €14.3 million (2017: €16.8 million). During the year ended 29 December 2018 547,093 (2017: 746,384) shares were allocated of which 480,995 (2017: 644,620) were allocated under the 2008 LTIP and 66,098 (2017: 101,764) were allocated under the AIDIS scheme.
(g) Share-based payment reserveThe share-based payment reserve reflects the equity settled share-based payment plans in operation by the Group (note 11). Other reserves in the Company are detailed in the Company statement of changes in equity on page 125.
25. Non-controlling interests
2018 €’m
2017 €’m
At the beginning of the year – 11.1Remeasurement – defined benefit plan – (0.1)Disposal of non-controlling interest – (11.0)
At the end of the year – –
In the prior year on 2 July 2017, the Group disposed of 60% of its shareholding in Dairy Ireland and related assets to Glanbia Co-operative Society Limited (the Society), its ultimate parent. As a result of the transaction the Group disposed of the entities in which there was a non-controlling interest.
26. Financial liabilities
Group Company
Notes2018 €’m
2017 €’m
2018 €’m
2017 €’m
Non-currentBank borrowings 616.2 369.4 41.0 –Private placement debt 136.2 130.1 – –Finance lease liabilities* – 0.1 – –
31.2/31.3 752.4 499.6 41.0 –
CurrentBank overdrafts 22 48.9 30.1 –Finance lease liabilities* – 0.2 – –
31.2/31.3 48.9 30.3 – –
Total financial liabilities 801.3 529.9 41.0 –
* Secured on specific plant and equipment.
Notes to the Financial Statements continued

Glanbia plc | Annual Report and Financial Statements 2018
175
Bank borrowings and overdraftsThe Group’s bank borrowings are primarily denominated in euro, US dollar, pound sterling and Australian dollar and are borrowed at fixed and floating interest rates. Loans borrowed at floating interest rates are set at commercial rates based on a margin over EURIBOR, US dollar LIBOR and Australian dollar interest rates for periods of up to six months. At 29 December 2018, the Group had undrawn uncommitted bank overdraft facilities of €10.5 million (2017: €10.6 million).
Private placement debtAt 29 December 2018, the Group had undrawn uncommitted private placement facilities of €87.3 million (2017: €83.4 million).
Debt issue costsIncluded within the carrying value of borrowings are deferred debt issue costs of €0.4 million (2017: €0.4 million), all of which will be recognised in finance costs in the Group income statement using the effective interest rate method over the remaining life of the borrowings.
GuaranteesFinancial liabilities are secured by cross-guarantees from Glanbia plc and certain principal subsidiaries. The Group has complied with the financial covenants of its borrowing facilities during 2018 and 2017 (note 31.3).
Financial liabilities include the following for the purposes of the Group statement of cash flows at the reporting date:
Notes2018 €’m
2017 €’m
Total financial liabilities 801.3 529.9Bank overdraft included as part of cash and cash equivalents 22 (48.9) (30.1)
752.4 499.8
The maturity profile of financial liabilities and undrawn committed facilities is as follows:
2018 2017
Loans and borrowings
€’m
Undrawn committed
facilities €’m
Loans and borrowings
€’m
Undrawn committed
facilities €’m
12 months or less 48.9 – 30.2 –Between 1 and 2 years 306.4 – 0.2 –Between 2 and 5 years 136.2 – 499.5 344.1More than 5 years 309.8 358.0 – –
801.3 358.0 529.9 344.1
Undrawn uncommitted facilities expiring within one year are €97.8 million (2017: €94.0 million).
The exposure of the Group’s total financial liabilities to interest rate changes, taking account of contractual repricing dates, at the reporting date is as follows:
2018 €’m
2017 €’m
12 months or less 517.6 399.6Between 1 and 2 years – 0.2
Financial liabilities subject to interest rate changes 517.6 399.8
Financial liabilities not subject to interest rate changes 283.7 130.1
801.3 529.9
Details of the Group’s exposure to risks arising from current and non-current financial liabilities are set out in note 31.
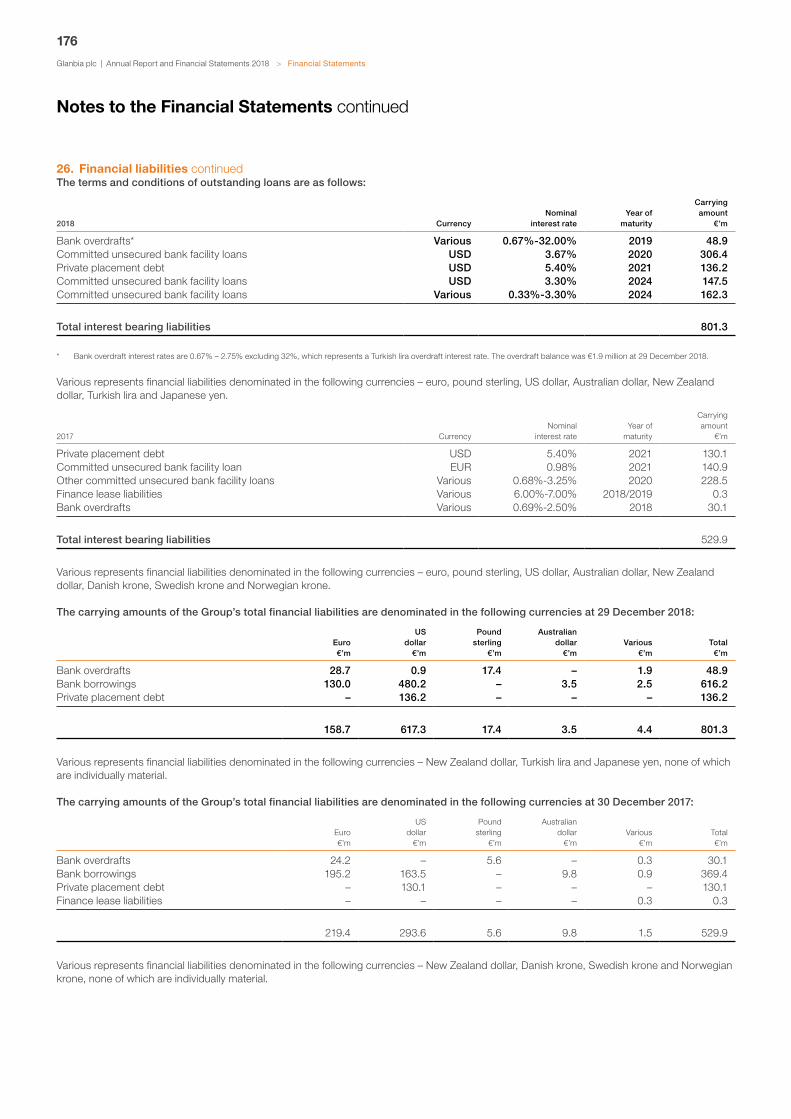
Glanbia plc | Annual Report and Financial Statements 2018
176
> Financial Statements
26. Financial liabilities continuedThe terms and conditions of outstanding loans are as follows:
2018 CurrencyNominal
interest rateYear of
maturity
Carrying amount
€’m
Bank overdrafts* Various 0.67%-32.00% 2019 48.9Committed unsecured bank facility loans USD 3.67% 2020 306.4Private placement debt USD 5.40% 2021 136.2Committed unsecured bank facility loans USD 3.30% 2024 147.5Committed unsecured bank facility loans Various 0.33%-3.30% 2024 162.3
Total interest bearing liabilities 801.3
* Bank overdraft interest rates are 0.67% – 2.75% excluding 32%, which represents a Turkish lira overdraft interest rate. The overdraft balance was €1.9 million at 29 December 2018.
Various represents financial liabilities denominated in the following currencies – euro, pound sterling, US dollar, Australian dollar, New Zealand dollar, Turkish lira and Japanese yen.
2017 CurrencyNominal
interest rateYear of
maturity
Carrying amount
€’m
Private placement debt USD 5.40% 2021 130.1Committed unsecured bank facility loan EUR 0.98% 2021 140.9Other committed unsecured bank facility loans Various 0.68%-3.25% 2020 228.5Finance lease liabilities Various 6.00%-7.00% 2018/2019 0.3Bank overdrafts Various 0.69%-2.50% 2018 30.1
Total interest bearing liabilities 529.9
Various represents financial liabilities denominated in the following currencies – euro, pound sterling, US dollar, Australian dollar, New Zealand dollar, Danish krone, Swedish krone and Norwegian krone.
The carrying amounts of the Group’s total financial liabilities are denominated in the following currencies at 29 December 2018:
Euro €’m
US dollar
€’m
Pound sterling
€’m
Australian dollar
€’mVarious
€’mTotal
€’m
Bank overdrafts 28.7 0.9 17.4 – 1.9 48.9Bank borrowings 130.0 480.2 – 3.5 2.5 616.2Private placement debt – 136.2 – – – 136.2
158.7 617.3 17.4 3.5 4.4 801.3
Various represents financial liabilities denominated in the following currencies – New Zealand dollar, Turkish lira and Japanese yen, none of which are individually material.
The carrying amounts of the Group’s total financial liabilities are denominated in the following currencies at 30 December 2017:
Euro €’m
US dollar
€’m
Pound sterling
€’m
Australian dollar
€’mVarious
€’mTotal €’m
Bank overdrafts 24.2 – 5.6 – 0.3 30.1Bank borrowings 195.2 163.5 – 9.8 0.9 369.4Private placement debt – 130.1 – – – 130.1Finance lease liabilities – – – – 0.3 0.3
219.4 293.6 5.6 9.8 1.5 529.9
Various represents financial liabilities denominated in the following currencies – New Zealand dollar, Danish krone, Swedish krone and Norwegian krone, none of which are individually material.
Notes to the Financial Statements continued

Glanbia plc | Annual Report and Financial Statements 2018
177
Finance lease liabilities – minimum lease payments at the reporting date:
Future minimum lease payments Interest
Present value of minimum lease payment
2018 €’m
2017 €’m
2018 €’m
2017 €’m
2018 €’m
2017 €’m
12 months or less – 0.3 – (0.1) – 0.2Between 1 and 2 years – 0.1 – – – 0.1Between 2 and 5 years – – – – – –Greater than 5 years – – – – – –
– 0.4 – (0.1) – 0.3
For the purposes of the Group statement of cash flows net debt is comprised of the following:
Net debt at the end of the year comprises: Notes2018 €’m
2017 €’m
Borrowings 752.4 499.8Cash and cash equivalents net of bank overdrafts 22 (175.7) (132.1)
576.7 367.7
The movement in net debt is as follows:
2018
Cash and short-term
bank deposits (note 22)
€’m
Overdrafts (note 22)
€’m
Finance leases
€’m
Bank borrowings
€’m
Private placement debt
€’m
Total
€’m
At 30 December 2017 (162.2) 30.1 0.3 369.4 130.1 367.7Cash flows (59.1) 19.2 (0.3) 240.2 – 200.0Exchange differences (3.3) (0.4) – 6.6 6.1 9.0
At 29 December 2018 (224.6) 48.9 – 616.2 136.2 576.7
2017
Cash and short-term
bank deposits (note 22)
€’m
Overdrafts (note 22)
€’m
Finance leases
€’m
Bank borrowings
€’m
Privateplacement debt
€’m
Total
€’m
At 31 December 2016 (218.9) 31.6 2.5 314.0 308.3 437.5Cash flows 44.1 (1.1) (2.2) 101.3 (162.0) (19.9)Exchange differences 12.6 (0.4) – (45.9) (16.2) (49.9)
At 30 December 2017 (162.2) 30.1 0.3 369.4 130.1 367.7
CompanyThe change in liabilities of the Company of €41.0 million during the period represents a loan drawdown of €41.0 million.

Glanbia plc | Annual Report and Financial Statements 2018
178
> Financial Statements
27. Deferred taxesRecognition in the Group balance sheet:
2018 2017
Deferred tax assets
€’m
Deferred tax liabilities
€’mNet €’m
Deferred tax assets
€’m
Deferred tax liabilities
€’mNet €’m
Deferred tax assets/(liabilities) before set off 29.3 (187.5) (158.2) 24.6 (148.6) (124.0)Set off of deferred tax (27.2) 27.2 – (23.0) 23.0 –
Deferred tax assets/(liabilities) after set off 2.1 (160.3) (158.2) 1.6 (125.6) (124.0)
The movement in the net deferred tax liability recognised in the Group balance sheet is as follows:
Group Company
Notes2018 €’m
2017 €’m
2018 €’m
2017 €’m
At the beginning of the year (124.0) (156.4) (1.4) (0.4)Income statement credit/(charge) 13 0.9 (10.6) 0.1 (0.3)Reduction in US tax rate credited to the income statement 6/13 – 38.7 – –Deferred tax credit/(charge) on fair value movements 1.9 (0.7) 1.7 (0.7)Deferred tax credit/(charge) relating to defined benefit
remeasurement 0.2 (1.8) – –Deferred tax charge on acquisition of subsidiaries 36 (32.4) (8.0) – –Deferred tax charge on disposal of subsidiaries – (2.4) – –Deferred tax credited on share-based payments 0.2 0.1 – –Exchange differences (5.0) 17.1 – –
At the end of the year (158.2) (124.0) 0.4 (1.4)
The movement in deferred tax assets during the year is as follows:
Retirement benefit
obligations €’m
Other employee
obligations €’m
Tax losses
€’mOther
€’mTotal
€’m
At 30 December 2017 4.9 8.0 1.0 10.7 24.6(Charge)/credit to income statement (0.2) 0.5 (1.2) (0.3) (1.2)Credited to other comprehensive income 0.2 – – – 0.2Credited to equity – 0.2 – – 0.2Acquisition of subsidiaries and intellectual properties – 0.4 3.0 1.1 4.5Exchange differences 0.1 0.2 – 0.7 1.0
At 29 December 2018 5.0 9.3 2.8 12.2 29.3
At 31 December 2016 13.3 15.9 1.6 14.9 45.7Credit/(charge) to income statement 0.7 (3.6) (0.5) 2.7 (0.7)Charged to other comprehensive income (1.8) – – – (1.8)Credited to equity – 0.1 – – 0.1Disposal of discontinued operations (5.5) (0.2) – (0.5) (6.2)Reduction in US tax rate charged to the income statement (1.3) (3.1) – (5.1) (9.5)Exchange differences (0.5) (1.1) (0.1) (1.3) (3.0)
At 30 December 2017 4.9 8.0 1.0 10.7 24.6
Notes to the Financial Statements continued

Glanbia plc | Annual Report and Financial Statements 2018
179
The movement in deferred tax liabilities during the year is as follows:
Accelerated tax depreciation
€’m
Fair value gain €’m
Development costs and other
intangibles €’m
Other €’m
Total €’m
At 30 December 2017 (57.9) (1.8) (69.1) (19.8) (148.6)(Charge)/credit to income statement (2.0) – 9.6 (5.5) 2.1Credit to other comprehensive income – 1.9 – – 1.9Acquisition of subsidiaries and intellectual
properties (0.1) – (36.5) (0.3) (36.9)Exchange differences (2.6) (0.1) (3.2) (0.1) (6.0)
At 29 December 2018 (62.6) – (99.2) (25.7) (187.5)
At 31 December 2016 (92.7) (1.1) (101.0) (7.3) (202.1)(Charge)/credit to income statement (5.7) – 8.8 (13.0) (9.9)Charged to other comprehensive income – (0.7) – – (0.7)Acquisition of subsidiaries and intellectual
properties (0.1) – (7.9) – (8.0)Disposal of discontinued operations 3.6 – 0.2 – 3.8Reduction in US Corporate tax rate credited
to the income statement 28.0 – 19.7 0.5 48.2Exchange differences 9.0 – 11.1 – 20.1
At 30 December 2017 (57.9) (1.8) (69.1) (19.8) (148.6)
A deferred tax asset has been recognised on the basis that the realisation of the related tax benefit through future taxable profits is probable. This includes deferred tax assets which are recognised for tax losses carried forward to the extent that realisation of the related tax benefit through future taxable profits are probable.
At the balance sheet date, the Group has unused tax losses of €83.0 million (2017: €95.0 million) available for offset against future profits. A deferred tax asset has been recognised in respect of €3.8 million (2017: €2.0 million) of such losses. No deferred tax asset has been recognised in respect of the remaining €79.2 million (2017: €93.0 million) as it is not considered probable that there will be future taxable profits available. Included in unrecognised tax losses are losses of €0.3 million (2017: €6.2 million) which will expire within the next 3 years. Other tax losses may be carried forward indefinitely. Also included in unrecognised tax losses are €45.9 million (2017: €46.4 million) of capital losses.
No deferred tax liability has been recognised on temporary differences of €34.4 million (2017: €25.9 million) relating to the unremitted earnings of overseas subsidiaries as the Group is able to control the timing of the reversal of these temporary differences and it is probable that they will not reverse in the foreseeable future. Temporary differences arising in connection with interests in Equity accounted investees are insignificant.
The deferred income tax credited/(charged) to other comprehensive income during the year is as follows:
Notes2018 €’m
2017 €’m
Available for sale financial asset reserve 24 1.8 (0.7)Hedging reserve 24(d) 0.1 –Defined benefit remeasurements 0.2 (1.8)
2.1 (2.5)
Deferred income tax credited to equity: The deferred income tax credited to equity during the year was €0.2 million (2017: €0.1 million) and relates to tax benefits arising on share-based payments.

Glanbia plc | Annual Report and Financial Statements 2018
180
> Financial Statements
27. Deferred taxes continuedThe deferred tax assets and liabilities recognised in the Company balance sheet are as follows:
Company
2018 €’m
2017 €’m
Deferred tax assets – other 0.4 0.3Deferred tax liabilities – available for sale financial assets – (1.7)
0.4 (1.4)
28. Provisions
Group
Restructuring €’m
note (a)
Legal claims
€’m note (b)
Property and lease
commitments €’m
note (c)
Operational €’m
note (d)
Regulatory and related provisions
€’m note (e)
Total €’m
At 30 December 2017 3.2 2.5 4.2 1.4 20.5 31.8Amount provided for in the year 0.1 0.2 – – 2.3 2.6Utilised in the year (2.8) (0.3) (1.4) (0.5) – (5.0)Unused amounts reversed in the year (0.5) (0.8) – (0.1) – (1.4)Exchange differences 0.1 0.1 – – – 0.2
At 29 December 2018 0.1 1.7 2.8 0.8 22.8 28.2
Non-current – – 2.8 – 22.1 24.9Current 0.1 1.7 – 0.8 0.7 3.3
0.1 1.7 2.8 0.8 22.8 28.2
(a) The restructuring provision related mainly to the Group wide review of the operating model that was undertaken during the prior year to ensure that the structure and resources of the Group were appropriate. The provision was substantially utilised in 2018. The amount provided for was recognised as an exceptional item in the Group income statement in the prior year.
(b) The legal claims provision represents legal claims brought against the Group. The balance at 29 December 2018 is expected to be utilised in 2019. In the opinion of the Directors, after taking appropriate legal advice, the outcome of these legal claims is not expected to give rise to any significant loss beyond the amounts provided for at 29 December 2018.
(c) The property and lease commitments provision relates to property remediation works and is based on the estimated cost of re-instating a property to its original condition. Due to the nature of the remediation works there is some uncertainty around the amount and timing of payments.
(d) The operational provision represents provisions relating to certain insurance claims, product returns, and other items. Due to the nature of these items, there is some uncertainty around the amount and timing of payments.
(e) The regulatory and related provision represents provisions relating to the interest and penalties element of uncertain tax positions and the UK pension provision. Due to the nature of these items, there is some uncertainty around the amount and timing of payments, however there is not expected to be a material change within the next 12 months.
CompanyRecognised on the Company balance sheet is a current operational provision of €0.6 million as at 29 December 2018 (2017: €0.6 million).
Notes to the Financial Statements continued

Glanbia plc | Annual Report and Financial Statements 2018
181
29. Capital grants
2018 €’m
2017 €’m
At the beginning of the year 0.1 3.3Credited to the Group income statement (0.1) (0.3)Disposals – (2.9)
At the end of the year – 0.1
Non-current – 0.1Current – –
– 0.1
The entities receiving the grants are principal subsidiaries (note 39) and have no going concern issues, therefore, there are no material unfulfilled conditions or other contingencies attaching to any grants received.
Recognition in the Group income statement:
2018 2017
Continuing operations
(note 5) €’m
Discontinued operations
€’m
Total €’m
Continuing operations
(note 5) €’m
Discontinued operations
€’m
Total €’m
Capital grants credited to the Group income statement (0.1) – (0.1) (0.1) (0.2) (0.3)
30. Trade and other payables
Group Company
Notes2018 €’m
2017 €’m
2018 €’m
2017 €’m
CurrentTrade payables 31.2 223.5 173.8 – –Amounts due to Equity accounted investees 31.2/37(c) 22.6 13.3 – –Amounts due to other related parties 31.2/37(c) 0.1 – 0.1 –Amounts due to other Group companies 37(c) – – 253.7 208.8Social security costs 4.3 2.8 – –Accrued expenses 156.5 118.0 12.7 10.8
407.0 307.9 266.5 219.6
Non-current Other payables 13.0 10.1 – –
Total 420.0 318.0 266.5 219.6
See note 35 for analysis of the movement in trade and other payables. See note 31 for information on the Group’s fair value estimation process.

Glanbia plc | Annual Report and Financial Statements 2018
182
> Financial Statements
31. Derivative financial instruments and financial risk management31.1 Derivative financial instruments
Notes
2018 Assets
€’m
2018 Liabilities
€’m
2017 Assets
€’m
2017 Liabilities
€’m
Cross currency swaps – fair value through income statement 31.2 – (0.2) 1.7 –Foreign exchange contracts – cash flow hedges 31.2 0.1 – – (0.1)Commodity futures – cash flow hedges 31.2 0.2 (0.3) 0.1 (0.2)Commodity futures – fair value hedges 31.2 1.2 – 0.4 –
Total 1.5 (0.5) 2.2 (0.3)
Non-current – – – –Current 1.5 (0.5) 2.2 (0.3)
31.5 1.5 (0.5) 2.2 (0.3)
Derivatives recognised at fair value through income statementIncluded in cross currency swaps is a pound sterling euro cross currency swap with a notional amount of £36.0 million and €40.1 million. The translation loss included in the Group income statement in respect of this swap is €0.2 million.
The instruments in the prior year refer to a pound sterling US dollar cross currency swap with a notional amount of £31.0 million and US$41.5 million and euro US dollar cross currency swaps with notional amounts of €101.7 million and US$120.3 million which were settled during 2018. The translation gains included in the Group income statement in respect of these swaps is €1.7 million.
Derivative assets and liabilities designated as cash flow hedgesForeign exchange contractsThe Group uses foreign exchange contracts to hedge its future cash flow risk from movements in foreign exchange rates, such contracts are generally designated as cash flow hedges.
The notional principal amounts of the outstanding foreign exchange contracts as at 29 December 2018 were €5.3 million (2017: €9.3 million). All outstanding foreign exchange contracts will mature and be released to the Group income statement within 12 months of the reporting date (2017: within 12 months of the reporting date).
Commodity futuresThe Group uses commodity futures to hedge its future cash flow risk from movement in gas prices. The notional principal amount of the outstanding futures designated as cash flow hedges is €1.5 million (2017: €2.1 million). All outstanding commodity futures mature and will be released to the Group income statement within 12 months of the reporting date (2017: within 12 months of the reporting date).
Amounts recognised in the Group income statement and the Group statement of comprehensive income:
Losses recognised in other comprehensive income Notes2018 €’m
2017 €’m
Foreign exchange contracts 24(d) (0.4) (0.1)Commodity futures 24(d) (0.1) –
(0.5) (0.1)
Loss/(gain) transferred from equity to the Group income statement Notes2018 €’m
2017 €’m
Foreign exchange contracts 24(d) 0.4 (0.4)Commodity futures 24(d) – (0.1)
0.4 (0.5)
No material ineffectiveness has been recognised in respect of the cash flow hedges in 2018 (2017: nil).
The maturity profile of the cash flows of the derivative financial instruments is included in note 31.4(d).
Notes to the Financial Statements continued

Glanbia plc | Annual Report and Financial Statements 2018
183
Derivative assets and liabilities designated as fair value hedgesCommodity futuresThe Group enters into fixed price purchase and sale contracts for milk and cheese respectively and uses commodity futures to hedge this exposure.
The notional principal amounts of the outstanding commodity (milk and cheese) futures, designated as fair value hedges as at 29 December 2018 was €42.2 million (2017: €89.1 million). All outstanding commodity contracts are short positions as at 29 December 2018.
Net investment hedgeA portion of the Group’s US dollar denominated borrowings amounting to US$98.5 million (2017: US$98.5 million) is designated as a hedge of the net investment in the Group’s US dollar net assets.
Notes2018 €’m
2017 €’m
Carrying value of net investment hedge 86.0 82.1(Loss)/gain recognised in other comprehensive income 24 (3.9) 11.3
There was no ineffectiveness recognised in the Group income statement during the year (2017: nil).
Derivative financial instruments entered into by Equity accounted investeesThe Group’s Equity accounted investees enter into interest rate swaps, commodity futures (gas, oil, butter, whey and skim milk powder) and foreign exchange contracts. The Group’s share of the movement in the derivative financial instruments designated as cash flow hedges is recognised in other comprehensive income and against the carrying value of the interest in Equity accounted investees.
The Group has not entered into any interest rate swaps. The movement recognised in other comprehensive income on interest rate swaps (note 24) represents the Group’s share of the movement in the interest rate swaps entered into by Equity accounted investees. All movements are recognised against the carrying value of the interest in Equity accounted investees until repayment of the related bank borrowings.
Financial guarantee contractsIn accordance with Group accounting policy, management has reviewed the fair values associated with financial guarantee contracts, as defined within IAS 39 ‘Financial Instruments: Recognition and Measurement’, issued in the name of Glanbia plc and has determined that their value is not significant. No adjustment has been made to the Glanbia plc Company balance sheet to reflect fair value of the financial guarantee contracts issued in its name.
31.2 Fair value and fair value estimationThe fair value of financial assets and liabilities together with their carrying amounts are as follows:
Notes
Cash flow hedges
€’m
Fair value through income
statement €’m
Financial assets/
(liabilities) held at
amortised cost €’m
Financial assets/
(liabilities) held at fair
value €’m
Total carrying
value €’m
1,2 Fair value
€’m
At 29 December 2018Trade receivables – net 20 – – 306.2 – 306.2 306.2Receivables from Equity accounted investees 20 – – 13.2 – 13.2 13.2Receivables from other related parties 20 – – 0.2 – 0.2 0.2Loans to Equity accounted investees 20 – – 29.9 – 29.9 29.9Available for sale financial assets at amortised cost 19 – – 0.6 – 0.6 0.6Available for sale financial assets at fair value 19 – – – 3.1 3.1 3.1Derivative financial instruments 31.1 0.3 1.2 – – 1.5 1.5Cash and cash equivalents 22 – – 224.6 – 224.6 224.6
Total financial assets 0.3 1.2 574.7 3.1 579.3 579.3
Trade payables 30 – – (223.5) – (223.5) (223.5)Amounts due to Equity accounted investees 30 – – (22.6) – (22.6) (22.6)Amounts due to other related parties 30 – – (0.1) – (0.1) (0.1)Financial liabilities – non-current 26 – – (752.4) – (752.4) (751.1)Financial liabilities – current 26 – – (48.9) – (48.9) (48.9)Derivative financial instruments 31.1 (0.3) (0.2) – – (0.5) (0.5)
Total financial liabilities (0.3) (0.2) (1,047.5) – (1,048.0) (1,046.7)

Glanbia plc | Annual Report and Financial Statements 2018
184
> Financial Statements
31. Derivative financial instruments and financial risk management continued
Notes
Cash flow hedges
€’m
Fair value through income
statement €’m
Financial assets/
(liabilities) held at
amortised cost €’m
Financial assets/
(liabilities) held at fair
value €’m
Total carrying
value €’m
1,2 Fair value
€’m
At 30 December 2017Trade receivables – net 20 – – 252.5 – 252.5 252.5Receivables from Equity accounted investees 20 – – 14.4 – 14.4 14.4Receivables from other related parties 20 – – 1.1 – 1.1 1.1Loans to Equity accounted investees 20 – – 13.1 – 13.1 13.1Available for sale financial assets at amortised cost 19 – – 0.3 – 0.3 0.3Available for sale financial assets at fair value 19 – – – 10.8 10.8 10.8Derivative financial instruments 31.1 0.1 2.1 – – 2.2 2.2Cash and cash equivalents 22 – – 162.2 – 162.2 162.2
Total financial assets 0.1 2.1 443.6 10.8 456.6 456.6
Trade payables 30 – – (173.8) – (173.8) (173.8)Amounts due to Equity accounted investees 30 – – (13.3) – (13.3) (13.3)Financial liabilities – non-current 26 – – (499.6) – (499.6) (503.6)Financial liabilities – current 26 – – (30.3) – (30.3) (30.3)Derivative financial instruments 31.1 (0.3) – – – (0.3) (0.3)
Total financial liabilities (0.3) – (717.0) – (717.3) (721.3)
1. The Group deemed that the carrying amounts of financial assets and financial liabilities recognised at amortised cost in the Group financial statements approximate their fair value other than non-current financial liabilities.
2. During 2018 the Group advanced a loan of €16.0 million at arm’s length to Glanbia Ireland DAC, a Joint Venture of the Group, which is repayable on 5 August 2020 and a loan of €1.0 million at arm’s length to Glanbia Cheese EU Limited, a Joint Venture of the Group, which is repayable on 15 June 2023. The carrying amount of the loans is deemed to approximate to fair value. The Group expects Glanbia Ireland DAC and Glanbia Cheese EU Limited to meet their contractual obligations.
Group’s fair valuation processThe Group’s finance department includes a team that performs the valuations of financial assets and liabilities required for financial reporting purposes, including Level 3 fair values.
The valuation team reports directly to the Group Finance Director who in turn reports to the Audit Committee. Discussions of valuation processes and results are held between the Group Finance Director and the Audit Committee.
Changes in Level 2 and Level 3 fair values are analysed at each reporting date. As part of this discussion, the valuation team presents a report that explains the reasons for fair value movements.
Fair value of financial assets and liabilities carried at fair valueIn accordance with IFRS 13 ‘Fair Value Measurements’, the Group has disclosed the fair value of instruments by the following fair value measurement hierarchy: • quoted prices (unadjusted) in active markets for identical assets or liabilities (Level 1);• inputs, other than quoted prices included in Level 1, that are observable for the asset or liability, either directly (that is, as prices) or indirectly
(that is, derived from prices) (Level 2); and• inputs for the asset or liability that are not based on observable market data (that is, unobservable inputs) (Level 3).
CompanyThe carrying amount of available for sale financial assets equals their fair value as they are measured at fair value. The Company deemed that the remaining financial assets and financial liabilities, which are recognised at amortised cost, approximate their fair value.
Notes to the Financial Statements continued

Glanbia plc | Annual Report and Financial Statements 2018
185
The following table presents the Group’s assets and liabilities, which are measured at fair value at 29 December 2018 and 30 December 2017:
NotesFair value hierarchy
2018 €’m
2017 €’m
AssetsCross currency swaps – fair value through income statement (a) Level 2 – 1.7Foreign exchange contracts – cash flow hedges (b) Level 2 0.1 –Commodity futures – cash flow hedges (c) Level 2 0.2 0.1Commodity futures – fair value hedges (c) Level 2 1.2 0.4Available for sale financial assets – equity securities – listed (d) Level 1 – 0.2Available for sale financial assets – equity securities – IPL Plastics plc (formerly
known as One51 plc) (e) Level 2 – 6.0Available for sale financial assets – equity securities – The BDO Development
Capital Fund (f) Level 2 2.0 2.7Available for sale financial assets – Ornua Co-Operative Ltd (g) Level 2 1.1 1.9
Total assets 4.6 13.0
NotesFair value hierarchy
2018 €m
2017 €’m
LiabilitiesCross currency swaps – fair value through income statement (a) Level 2 (0.2) –Foreign exchange contracts – cash flow hedges (b) Level 2 – (0.1)Commodity futures – cash flow hedges (c) Level 2 (0.3) (0.2)
Total liabilities (0.5) (0.3)
(a) Fair value is determined by reference to the current foreign exchange rates at the end of the reporting period. (b) The fair value is estimated by discounting the difference between the contractual forward exchange rate and the current forward exchange
rate (from observable forward exchange rates at the end of the reporting period). The effect of discounting was insignificant in 2018 and 2017. (c) The fair value is estimated by discounting the difference between the contractual forward commodity price and the current forward commodity
price (from observable commodity forward prices at the end of the reporting period). The effect of discounting was insignificant in 2018 and 2017. (d) Fair value is determined by reference to the stock exchange quoted bid prices at the end of the reporting period. (e) The unlisted equity shares in IPL Plastics plc are traded on an informal ‘grey’ market. Fair value was determined by reference to these
published prices. These shares were disposed of during 2018. (f) The unlisted investment in the BDO Development Capital Fund is fair valued by reference to the latest quarterly report available to the limited
partners.(g) The fair value is estimated by discounting the expected future cash flows using current interest rates.
There were no transfers in either direction between Level 1 and Level 2 in 2018 and 2017. The Group did not hold any Level 3 financial assets or liabilities at 29 December 2018 or 30 December 2017.
Fair value of financial assets and liabilities carried at amortised costWith the exception of those financial liabilities outlined below, it is considered that the carrying amounts of financial assets and financial liabilities recognised at amortised cost in the Group financial statements approximate their fair value.
The following table shows the fair value hierarchy of the financial liabilities not measured at fair value in the Group balance sheet but for which fair value disclosures are required:
NotesFair value hierarchy
Carrying amount
2018 €’m
Fair value 2018 €’m
Carrying amount
2017 €’m
Fair value 2017 €’m
Non-current financial liabilities (a) Level 2 752.4 751.1 499.6 503.6
(a) Fair value is estimated by discounting future contractual cash flows using current market interest rates from observable interest rates at the end of the reporting period that are available to the Group for similar financial instruments.
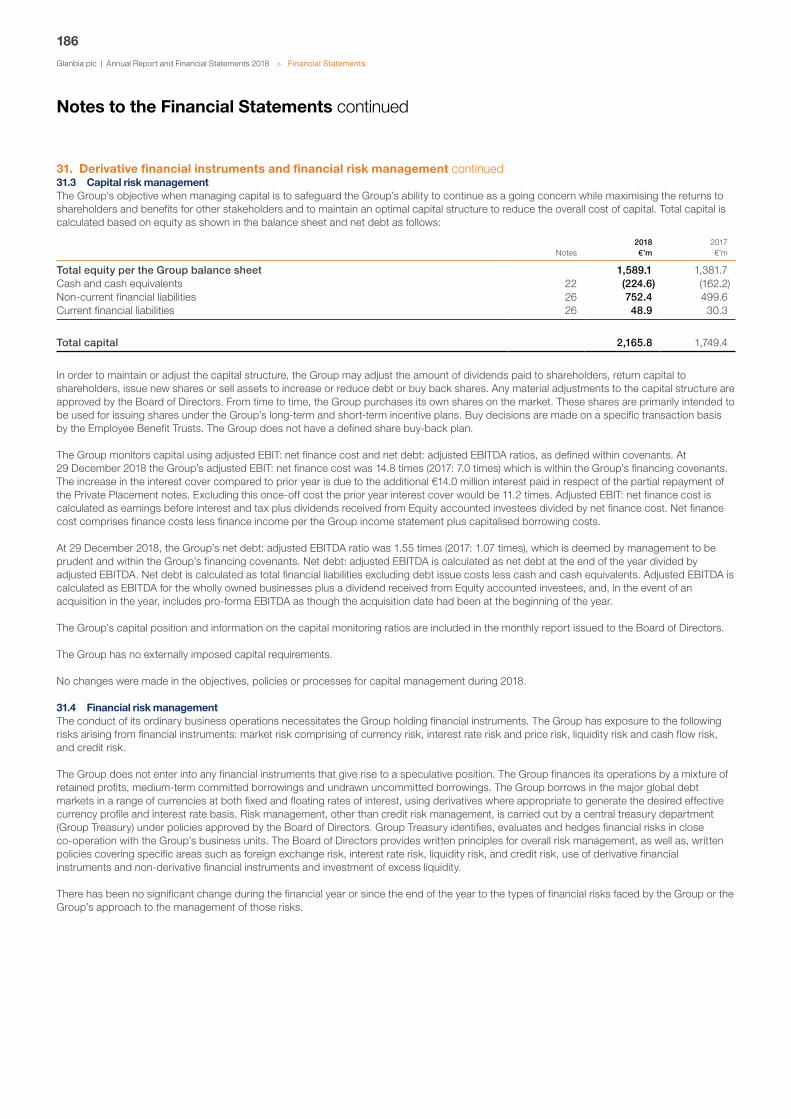
Glanbia plc | Annual Report and Financial Statements 2018
186
> Financial Statements
31. Derivative financial instruments and financial risk management continued31.3 Capital risk managementThe Group’s objective when managing capital is to safeguard the Group’s ability to continue as a going concern while maximising the returns to shareholders and benefits for other stakeholders and to maintain an optimal capital structure to reduce the overall cost of capital. Total capital is calculated based on equity as shown in the balance sheet and net debt as follows:
Notes2018 €’m
2017 €’m
Total equity per the Group balance sheet 1,589.1 1,381.7Cash and cash equivalents 22 (224.6) (162.2)Non-current financial liabilities 26 752.4 499.6Current financial liabilities 26 48.9 30.3
Total capital 2,165.8 1,749.4
In order to maintain or adjust the capital structure, the Group may adjust the amount of dividends paid to shareholders, return capital to shareholders, issue new shares or sell assets to increase or reduce debt or buy back shares. Any material adjustments to the capital structure are approved by the Board of Directors. From time to time, the Group purchases its own shares on the market. These shares are primarily intended to be used for issuing shares under the Group’s long-term and short-term incentive plans. Buy decisions are made on a specific transaction basis by the Employee Benefit Trusts. The Group does not have a defined share buy-back plan.
The Group monitors capital using adjusted EBIT: net finance cost and net debt: adjusted EBITDA ratios, as defined within covenants. At 29 December 2018 the Group’s adjusted EBIT: net finance cost was 14.8 times (2017: 7.0 times) which is within the Group’s financing covenants. The increase in the interest cover compared to prior year is due to the additional €14.0 million interest paid in respect of the partial repayment of the Private Placement notes. Excluding this once-off cost the prior year interest cover would be 11.2 times. Adjusted EBIT: net finance cost is calculated as earnings before interest and tax plus dividends received from Equity accounted investees divided by net finance cost. Net finance cost comprises finance costs less finance income per the Group income statement plus capitalised borrowing costs.
At 29 December 2018, the Group’s net debt: adjusted EBITDA ratio was 1.55 times (2017: 1.07 times), which is deemed by management to be prudent and within the Group’s financing covenants. Net debt: adjusted EBITDA is calculated as net debt at the end of the year divided by adjusted EBITDA. Net debt is calculated as total financial liabilities excluding debt issue costs less cash and cash equivalents. Adjusted EBITDA is calculated as EBITDA for the wholly owned businesses plus a dividend received from Equity accounted investees, and, in the event of an acquisition in the year, includes pro-forma EBITDA as though the acquisition date had been at the beginning of the year.
The Group’s capital position and information on the capital monitoring ratios are included in the monthly report issued to the Board of Directors.
The Group has no externally imposed capital requirements.
No changes were made in the objectives, policies or processes for capital management during 2018.
31.4 Financial risk management The conduct of its ordinary business operations necessitates the Group holding financial instruments. The Group has exposure to the following risks arising from financial instruments: market risk comprising of currency risk, interest rate risk and price risk, liquidity risk and cash flow risk, and credit risk.
The Group does not enter into any financial instruments that give rise to a speculative position. The Group finances its operations by a mixture of retained profits, medium-term committed borrowings and undrawn uncommitted borrowings. The Group borrows in the major global debt markets in a range of currencies at both fixed and floating rates of interest, using derivatives where appropriate to generate the desired effective currency profile and interest rate basis. Risk management, other than credit risk management, is carried out by a central treasury department (Group Treasury) under policies approved by the Board of Directors. Group Treasury identifies, evaluates and hedges financial risks in close co-operation with the Group’s business units. The Board of Directors provides written principles for overall risk management, as well as, written policies covering specific areas such as foreign exchange risk, interest rate risk, liquidity risk, and credit risk, use of derivative financial instruments and non-derivative financial instruments and investment of excess liquidity.
There has been no significant change during the financial year or since the end of the year to the types of financial risks faced by the Group or the Group’s approach to the management of those risks.
Notes to the Financial Statements continued
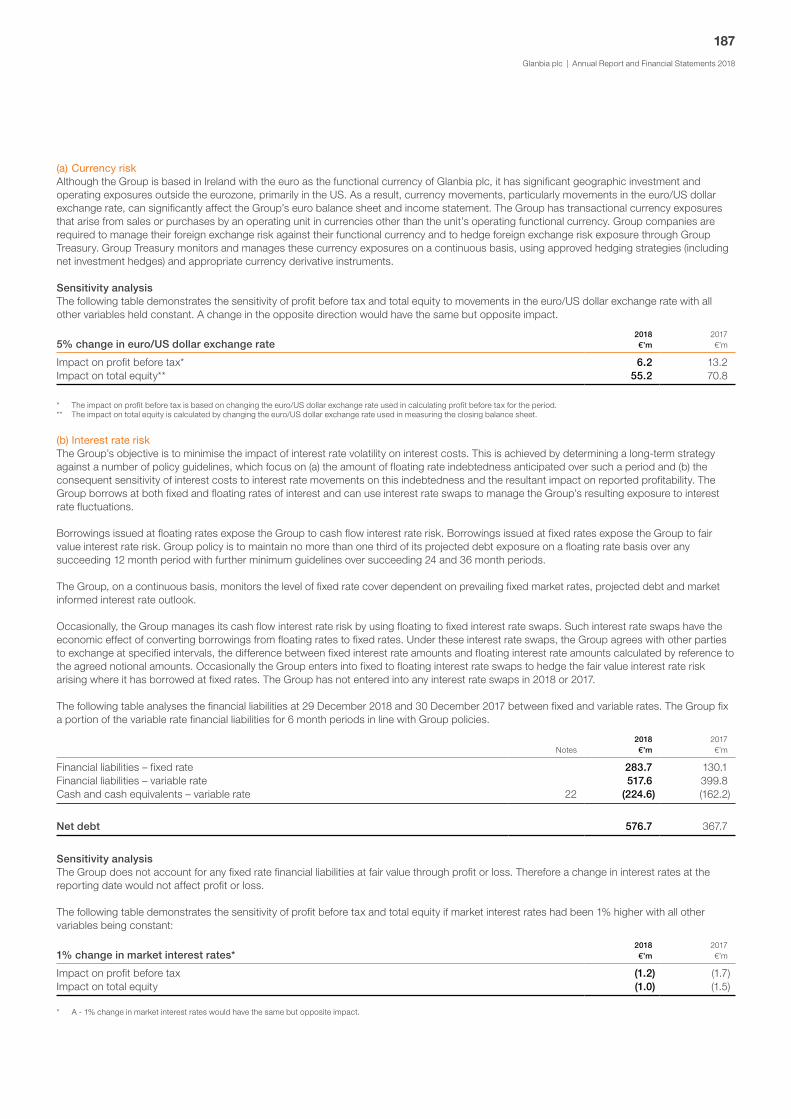
Glanbia plc | Annual Report and Financial Statements 2018
187
(a) Currency riskAlthough the Group is based in Ireland with the euro as the functional currency of Glanbia plc, it has significant geographic investment and operating exposures outside the eurozone, primarily in the US. As a result, currency movements, particularly movements in the euro/US dollar exchange rate, can significantly affect the Group’s euro balance sheet and income statement. The Group has transactional currency exposures that arise from sales or purchases by an operating unit in currencies other than the unit’s operating functional currency. Group companies are required to manage their foreign exchange risk against their functional currency and to hedge foreign exchange risk exposure through Group Treasury. Group Treasury monitors and manages these currency exposures on a continuous basis, using approved hedging strategies (including net investment hedges) and appropriate currency derivative instruments.
Sensitivity analysisThe following table demonstrates the sensitivity of profit before tax and total equity to movements in the euro/US dollar exchange rate with all other variables held constant. A change in the opposite direction would have the same but opposite impact.
5% change in euro/US dollar exchange rate2018 €’m
2017 €’m
Impact on profit before tax* 6.2 13.2Impact on total equity** 55.2 70.8
* The impact on profit before tax is based on changing the euro/US dollar exchange rate used in calculating profit before tax for the period.** The impact on total equity is calculated by changing the euro/US dollar exchange rate used in measuring the closing balance sheet.
(b) Interest rate riskThe Group’s objective is to minimise the impact of interest rate volatility on interest costs. This is achieved by determining a long-term strategy against a number of policy guidelines, which focus on (a) the amount of floating rate indebtedness anticipated over such a period and (b) the consequent sensitivity of interest costs to interest rate movements on this indebtedness and the resultant impact on reported profitability. The Group borrows at both fixed and floating rates of interest and can use interest rate swaps to manage the Group’s resulting exposure to interest rate fluctuations.
Borrowings issued at floating rates expose the Group to cash flow interest rate risk. Borrowings issued at fixed rates expose the Group to fair value interest rate risk. Group policy is to maintain no more than one third of its projected debt exposure on a floating rate basis over any succeeding 12 month period with further minimum guidelines over succeeding 24 and 36 month periods.
The Group, on a continuous basis, monitors the level of fixed rate cover dependent on prevailing fixed market rates, projected debt and market informed interest rate outlook.
Occasionally, the Group manages its cash flow interest rate risk by using floating to fixed interest rate swaps. Such interest rate swaps have the economic effect of converting borrowings from floating rates to fixed rates. Under these interest rate swaps, the Group agrees with other parties to exchange at specified intervals, the difference between fixed interest rate amounts and floating interest rate amounts calculated by reference to the agreed notional amounts. Occasionally the Group enters into fixed to floating interest rate swaps to hedge the fair value interest rate risk arising where it has borrowed at fixed rates. The Group has not entered into any interest rate swaps in 2018 or 2017.
The following table analyses the financial liabilities at 29 December 2018 and 30 December 2017 between fixed and variable rates. The Group fix a portion of the variable rate financial liabilities for 6 month periods in line with Group policies.
Notes2018 €’m
2017 €’m
Financial liabilities – fixed rate 283.7 130.1Financial liabilities – variable rate 517.6 399.8Cash and cash equivalents – variable rate 22 (224.6) (162.2)
Net debt 576.7 367.7
Sensitivity analysisThe Group does not account for any fixed rate financial liabilities at fair value through profit or loss. Therefore a change in interest rates at the reporting date would not affect profit or loss.
The following table demonstrates the sensitivity of profit before tax and total equity if market interest rates had been 1% higher with all other variables being constant:
1% change in market interest rates*2018 €’m
2017 €’m
Impact on profit before tax (1.2) (1.7)Impact on total equity (1.0) (1.5)
* A - 1% change in market interest rates would have the same but opposite impact.
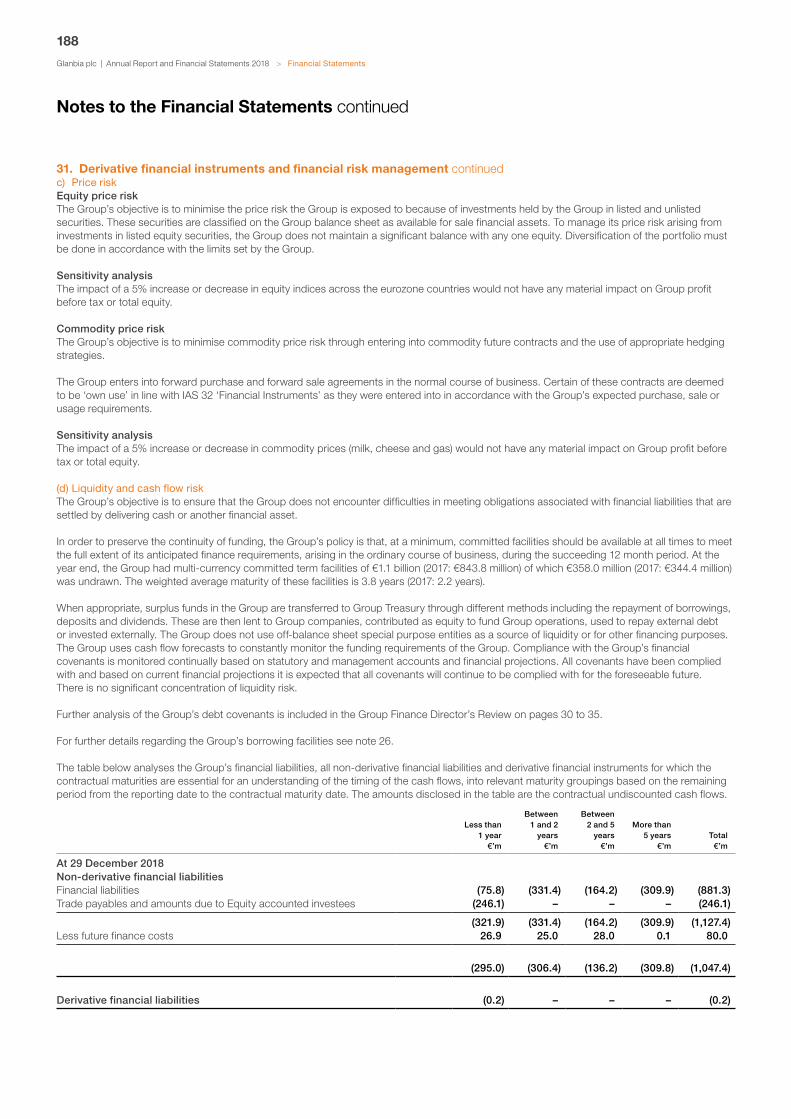
Glanbia plc | Annual Report and Financial Statements 2018
188
> Financial Statements
31. Derivative financial instruments and financial risk management continuedc) Price riskEquity price riskThe Group’s objective is to minimise the price risk the Group is exposed to because of investments held by the Group in listed and unlisted securities. These securities are classified on the Group balance sheet as available for sale financial assets. To manage its price risk arising from investments in listed equity securities, the Group does not maintain a significant balance with any one equity. Diversification of the portfolio must be done in accordance with the limits set by the Group.
Sensitivity analysisThe impact of a 5% increase or decrease in equity indices across the eurozone countries would not have any material impact on Group profit before tax or total equity.
Commodity price riskThe Group’s objective is to minimise commodity price risk through entering into commodity future contracts and the use of appropriate hedging strategies.
The Group enters into forward purchase and forward sale agreements in the normal course of business. Certain of these contracts are deemed to be ‘own use’ in line with IAS 32 ‘Financial Instruments’ as they were entered into in accordance with the Group’s expected purchase, sale or usage requirements.
Sensitivity analysisThe impact of a 5% increase or decrease in commodity prices (milk, cheese and gas) would not have any material impact on Group profit before tax or total equity.
(d) Liquidity and cash flow riskThe Group’s objective is to ensure that the Group does not encounter difficulties in meeting obligations associated with financial liabilities that are settled by delivering cash or another financial asset.
In order to preserve the continuity of funding, the Group’s policy is that, at a minimum, committed facilities should be available at all times to meet the full extent of its anticipated finance requirements, arising in the ordinary course of business, during the succeeding 12 month period. At the year end, the Group had multi-currency committed term facilities of €1.1 billion (2017: €843.8 million) of which €358.0 million (2017: €344.4 million) was undrawn. The weighted average maturity of these facilities is 3.8 years (2017: 2.2 years).
When appropriate, surplus funds in the Group are transferred to Group Treasury through different methods including the repayment of borrowings, deposits and dividends. These are then lent to Group companies, contributed as equity to fund Group operations, used to repay external debt or invested externally. The Group does not use off-balance sheet special purpose entities as a source of liquidity or for other financing purposes. The Group uses cash flow forecasts to constantly monitor the funding requirements of the Group. Compliance with the Group’s financial covenants is monitored continually based on statutory and management accounts and financial projections. All covenants have been complied with and based on current financial projections it is expected that all covenants will continue to be complied with for the foreseeable future. There is no significant concentration of liquidity risk.
Further analysis of the Group’s debt covenants is included in the Group Finance Director’s Review on pages 30 to 35.
For further details regarding the Group’s borrowing facilities see note 26.
The table below analyses the Group’s financial liabilities, all non-derivative financial liabilities and derivative financial instruments for which the contractual maturities are essential for an understanding of the timing of the cash flows, into relevant maturity groupings based on the remaining period from the reporting date to the contractual maturity date. The amounts disclosed in the table are the contractual undiscounted cash flows.
Less than 1 year
€’m
Between 1 and 2
years €’m
Between 2 and 5
years €’m
More than 5 years
€’mTotal
€’m
At 29 December 2018Non-derivative financial liabilitiesFinancial liabilities (75.8) (331.4) (164.2) (309.9) (881.3)Trade payables and amounts due to Equity accounted investees (246.1) – – – (246.1)
(321.9) (331.4) (164.2) (309.9) (1,127.4)Less future finance costs 26.9 25.0 28.0 0.1 80.0
(295.0) (306.4) (136.2) (309.8) (1,047.4)
Derivative financial liabilities (0.2) – – – (0.2)
Notes to the Financial Statements continued

Glanbia plc | Annual Report and Financial Statements 2018
189
Less than 1 year
€’m
Between 1 and 2
years €’m
Between 2 and 5
years €’m
More than 5 years
€’mTotal €’m
At 30 December 2017Non-derivative financial liabilitiesFinancial liabilities (excluding finance lease liabilities) (48.5) (18.5) (510.1) – (577.1)Finance lease liabilities (0.3) (0.1) – – (0.4)Trade payables and amounts due to Equity accounted investees (187.1) – – – (187.1)
(235.9) (18.6) (510.1) – (764.6)Less future finance costs 18.6 18.4 10.6 – 47.6
(217.3) (0.2) (499.5) – (717.0)
Derivative financial liabilities 1.5 – – – 1.5
The Company had cash at bank of €7.9 million at 29 December 2018 (2017: €6.0 million). The contractual undiscounted cash flows for cash and cash equivalents equal the carrying value at 29 December 2018 and 30 December 2017.
(e) Credit riskThe Group’s objective is to minimise credit risk which is managed on a Group basis. Credit risk is the risk of financial loss to the Group if a customer or counterparty to a financial transaction fails to meet its contractual obligations. Credit risk arises from cash and cash equivalents, deposits with banks and financial institutions, derivative financial instruments as well as credit exposures to customers, including outstanding receivables and committed transactions.
In the international movement and placement of funds and execution of financial transactions, the risk of counterparty default is managed by the Group’s policies requiring exposure to independently rated parties with long-term credit ratings of at least A3 (Moody’s) or A– (Standard & Poor’s). In the movement and placement of funds and execution of financial transactions in Ireland, the Group’s policies accept exposure to independently rated parties with long-term credit ratings of at least Baa3 (Moody’s) or BBB– (Standard & Poor’s). The Group held cash and cash equivalents of €224.6 million (2017: €162.2 million) and derivative financial assets of €1.5 million (2017: €2.2 million) at 29 December 2018, all balances were held within financial institutions which complied with Group policy.
The Group advanced an additional interest bearing loan of €16.0 million (2017: €12.8 million) to Glanbia Ireland DAC (an Equity accounted investee of the Group) and an interest bearing loan of €1.0 million to Glanbia Cheese EU Limited (an Equity accounted investee of the Group) during the year ended 29 December 2018 for the purposes of funding capital expenditure. The Group expects Glanbia Ireland DAC and Glanbia Cheese EU Limited to meet its obligations.
The Group’s credit risk management policy requires that, where possible, all debt is insured with an external credit insurance underwriter. No goods may be dispatched to a customer on credit until the application for credit has been authorised. The Group’s authorisation review includes external credit agency reports, the trading and financial history and position of the customer, the business case, the country in which the customer operates and any other available information. The utilisation of credit limits is actively managed and reviewed formally on an annual basis. Where the extension of credit is not appropriate, payment in advance is required. No goods are dispatched on credit until the credit controller has authorised the application confirming all necessary procedures have been complied with.
Goods are sold primarily subject to retention of title clauses, so that in the event of non-payment the Group may have a secured claim. Where required, the Group holds appropriate security or liens in respect of trade and other receivables. The Group does not hold any significant security or liens at the end of the year.
As disclosed in note 4 the Group has one significant external customer within the Glanbia Nutritionals segment. This customer accounted for €43.3 million of the trade and other receivables carrying amount (2017: €44.4 million). The Group is satisfied that it has satisfactory credit control procedures in place in respect of this customer.
The Group does not expect any significant counterparty to fail to meet its obligations. The maximum exposure to credit risk is represented by the carrying amount of each asset.
For further details regarding the Group’s trade and other receivables see note 20.
CompanyThe Company’s exposure to interest rate risk arises from its euro denominated floating rate loans of €41.0 million that mature after more than 5 years. A 1% change in market interest rates would have a €0.2 million impact on the Company’s profit before tax and total equity respectively. The maximum exposure to credit risk is represented by the carrying amount of financial assets on the balance sheet. Other than the foregoing, the Company has no significant exposure to other financial risks. The Company policy relating to financial risk management is consistent with the Group policy.

Glanbia plc | Annual Report and Financial Statements 2018
190
> Financial Statements
31. Derivative financial instruments and financial risk management continued31.5 Offsetting financial assets and financial liabilities The Group enters into derivative transactions under International Swaps and Derivatives Association (ISDA) master netting arrangements. The Group is required to maintain cash on deposit in respect of certain borrowings. The Group and the lender intend to net settle or realise the asset and settle the liability simultaneously. As a result, the Group’s borrowings have been presented net of the cash on deposit as the requirements for offsetting have been met.
The following tables set out the carrying amounts of recognised financial instruments that are subject to the above agreements:
31.5 (a) Financial assets
At 29 December 2018 Notes
Gross amounts of recognised
financial assets €’m
Gross amounts of recognised
financial liabilities set off
in the balance sheet
€’m
Net amounts of financial assets
presented in the balance sheet
€’m
Derivative financial assets 31.1 1.5 – 1.5Cash and cash equivalents 22 333.7 (109.1) 224.6
335.2 (109.1) 226.1
At 30 December 2017 Notes
Gross amounts of recognised
financial assets €’m
Gross amounts of recognised
financial liabilities set off in the balance
sheet €’m
Net amounts of financial assets
presented in the balance sheet
€’m
Derivative financial assets 31.1 2.2 – 2.2Cash and cash equivalents 22 266.4 (104.2) 162.2
268.6 (104.2) 164.4
31.5 (b) Financial liabilities
At 29 December 2018 Notes
Gross amounts of recognised
financial liabilities
€’m
Gross amounts of recognised
financial assets set off in the
balance sheet €’m
Net amounts of financial
liabilities presented in the
balance sheet €’m
Derivative financial liabilities 31.1 (0.5) – (0.5)Bank overdrafts and borrowings 26 (910.4) 109.1 (801.3)
(910.9) 109.1 (801.8)
At 30 December 2017 Notes
Gross amounts of recognised
financial liabilities €’m
Gross amounts of recognised
financial assets set off in the balance
sheet €’m
Net amounts of financial
liabilities presented in the
balance sheet €’m
Derivative financial liabilities 31.1 (0.3) – (0.3)Bank overdrafts and borrowings 26 (633.8) 104.2 (529.6)
(634.1) 104.2 (529.9)
Notes to the Financial Statements continued

Glanbia plc | Annual Report and Financial Statements 2018
191
32. Contingent liabilitiesGroupBank guarantees amounting to €3.5 million (2017: €6.7 million) are outstanding at 29 December 2018. The Group does not expect any material loss to arise from these guarantees.
The Group has contingent liabilities in respect of legal claims arising in the ordinary course of business. It is not anticipated that any material liability will arise from these contingent liabilities other than those provided for.
CompanyAny Irish registered wholly-owned subsidiary of the Company may avail of the exemption from filing its statutory financial statements for the year ended 29 December 2018 as permitted by section 357 of the Companies Act 2014. If an Irish registered wholly-owned subsidiary of the Company elects to avail of this exemption, there will be in force an irrevocable guarantee from the Company in respect of all commitments entered into by such wholly-owned subsidiary, including amounts shown as liabilities (within the meaning of section 357 (1) (b) of the Companies Act 2014) in such wholly-owned subsidiary’s statutory financial statements for the year ended 29 December 2018.
Within the scope of benefitting from the exemption related to the filing of the annual accounts for the financial year ended 31 December 2018 of Glanbia Foods B.V. (note 39), the Company has guaranteed the liabilities ensuing from legal acts performed by this subsidiary from 1 January 2018 in accordance with and to the extent as set out in section 2:403.1(f) of the Dutch Civil Code. Therefore Glanbia Foods B.V. is exempt from the obligation to publish its financial statements and its obligations to file financial statements has been fulfilled by means of the publication of the declaration of consent and the declaration of liability.
Within the scope of benefitting from the exemption related to the filing of the annual accounts for the financial year ended 31 December 2018 of the three Luxembourg subsidiaries (note 39), the Company has guaranteed the liabilities of these subsidiaries in respect of any losses or liabilities (as provided by Article 70 (c) of the Luxembourg Law of 19 December 2002 on the register of commerce and companies and the accounting and annual accounts of undertakings) for the financial year ended on 31 December 2018. These subsidiaries avail of the exemption from filing of their financial statements, as permitted by Article 70 of the Luxembourg Law of 19 December 2002 on the register of commerce and companies and the accounting and annual accounts of undertakings.
The Group recognises a defined benefit liability and incurs administration and certain other costs in relation to its UK pension schemes for businesses disposed of in prior years, as outlined in note 9. In addition, the Company has guaranteed the payment of a proportion of employer contributions in respect of these UK pension plans. The Company considers these guarantees to be insurance contracts and accounts for them as such. The amount of the potential liability under the UK pension guarantee is reducing annually by the contributions paid into these plans. The Company treats the guarantee contracts as a contingent liability until such time as it becomes probable that the Company will be required to make a payment under the guarantee.
33. CommitmentsCapital commitmentsCapital expenditure contracted for at the reporting date but not recognised in the Group financial statements is as follows:
2018 €’m
2017 €’m
Property, plant and equipment 4.8 3.2
Operating lease commitments – where the Group is the lesseeThe Group leases various assets. Generally, operating leases are short-term with no purchase option.
The future aggregate minimum lease payments under non-cancellable operating leases are as follows at the reporting date:
2018 €’m
2017 €’m
Not later than 1 year 19.5 16.9Later than 1 year and not later than 5 years 50.4 49.8Later than 5 years 41.8 43.3
111.7 110.0
Commitments in relation to Joint Ventures are disclosed in note 18.

Glanbia plc | Annual Report and Financial Statements 2018
192
> Financial Statements
34. Cash generated from operating activities
Group Company
Notes2018 €’m
2017 €’m
2018 €’m
2017 €’m
Profit after taxation 234.0 329.4 34.1 107.2Income taxes 13 32.8 (6.3) (0.1) 0.3Net (write back)/write down of inventories 21 (0.3) 0.5 – –Impairment of tangible assets 16 – 10.8 – –Non-cash movement in allowance for impairment of receivables 1.5 – – –Non-cash element of exceptional charge – 3.0 – –Non-cash movement in provisions (1.1) – – –Non-cash movement on cross currency swaps and
fair value hedges 1.0 – – –Share of results of Equity accounted investees 18 (45.3) (51.8) – –Depreciation of tangible assets 16 43.0 49.1 – –Amortisation of intangible assets 17 45.9 63.2 – –Cost of share-based payments 11/24 8.8 7.8 8.8 7.8Difference between pension charge and cash contributions (3.7) (4.2) – –(Profit)/loss on disposal of property, plant and equipment 5 (0.3) 0.9 – –Finance income 12 (3.9) (3.0) – –Finance expense 12 21.4 40.1 – –Amortisation of government grants received 29 (0.1) (0.3) – –Net loss on disposal of investments 0.2 – – –Recycle of available for sale reserve to the Group income
statement on disposal of investment 24 (5.3) – (5.3) –Profit on disposal of discontinued operations 10 – (96.3) – –Profit on sale of investments to Joint Ventures – – – (71.6)
Operating cash flows before movement in working capital 328.6 342.9 37.5 43.7Increase in inventories 35 (18.4) (14.6) – –(Increase)/decrease in short-term receivables 35 (27.7) (149.9) (29.0) 37.2Increase/(decrease) in short-term liabilities 35 39.0 (13.9) 46.8 (9.7)(Decrease)/increase in provisions 35 (5.0) (2.3) – 0.6
Cash generated from operating activities 316.5 162.2 55.3 71.8
35. Movement in working capital
2018 Notes
Inventories(note 21)
€’m
Trade and other receivables
(note 20) €’m
Trade and other payables(note 30)
€’m
Provisions(note 28)
€’mTotal
€’m
At 30 December 2017 321.6 302.4 (318.0) (31.8) 274.2Exchange differences 12.3 10.6 (14.5) (0.1) 8.3Arising on acquisition 36 32.0 24.8 (31.9) – 24.9Loans/amounts payable to Equity accounted
investees, interest accruals, capital creditors and other non-operating items 0.3 (15.3) (16.6) (1.3) (32.9)
Increase/(decrease) in working capital 34 18.4 27.7 (39.0) 5.0 12.1
At 29 December 2018 384.6 350.2 (420.0) (28.2) 286.6
Notes to the Financial Statements continued

Glanbia plc | Annual Report and Financial Statements 2018
193
36. Business CombinationsAcquisitions in 2018 On 19 November 2018, the Group acquired 100% of the equity of KSF Holdings LLP and HNS Intermediate Corporation who collectively own SlimFast and other brands (“SlimFast”). SlimFast is a leading weight management and health & wellness brand family distributed primarily in the food, drug, mass and club (FDMC) channel in the United States of America and the United Kingdom. The SlimFast brand is an adjacency to the Glanbia Performance Nutrition brand portfolio and has been included in the Glanbia Performance Nutrition segment. The Goodwill relates to the acquired workforce, the expectation that the business is self-sustaining and will generate future sales beyond the existing customer base, as well as the opportunity to expand the business into new markets, where there are no existing customers and the brands are not known. Goodwill of €131.6 million is not deductible for tax purposes.
Details of the net assets acquired and Goodwill arising from the acquisition are as follows:
Total €’m
Purchase consideration 335.2Less: Fair value of assets acquired (198.2)
Goodwill 137.0
Total €’m
Purchase consideration – cash paid 337.8Refund due from vendor (2.6)
Purchase consideration 335.2
The fair value of assets and liabilities arising from the acquisition are as follows:
NotesTotal
€’m
Property, plant and equipment 16 0.4Intangible assets – software 17 0.1Intangible assets – customer relationships 17 62.3Intangible assets – brands 17 120.7Inventories 35 32.0Trade and other receivables 35 22.2Trade and other payables 35 (31.9)Cash and cash equivalents 28.7Bank overdraft (3.9)Deferred tax liability 27 (32.4)
Fair value of net assets acquired 198.2
The fair value of SlimFast trade and other receivables at the acquisition date amounted to €22.2 million. The gross contractual amount for trade receivables due is €22.2 million.
The initial assignment of fair values to identifiable net assets acquired has been performed on a provisional basis. Any amendments to these fair values within the 12 month timeframe from the date of acquisition will be disclosed in the 2019 Annual Report as stipulated by IFRS 3 ‘Business Combinations’.
The fair value assignment is provisional as the acquisition was completed within six weeks before the balance sheet date. Completion accounts have not been formally agreed between the purchaser and seller at the date of signing the financial statements. It is therefore possible the provisional amounts for inventories, trade and other receivables, trade and other payables, cash and cash equivalents, bank overdraft or deferred tax liability may differ from the provisional values presented. Any change to these balances will result in a consequent change to Goodwill.
Combined impact of acquisitionsThe revenue and profit before taxation of the Group (including transaction costs), including the impact of acquisitions completed during the financial year ended 29 December 2018, were as follows:
2018 Acquisitions
€’m
Group excluding acquisitions
€’m
Consolidated group including
acquisitions €’m
Revenue 30.0 2,356.3 2,386.3Profit before taxation 2.5 264.3 266.8

Glanbia plc | Annual Report and Financial Statements 2018
194
> Financial Statements
36. Business Combinations continuedThe revenue and profit before taxation (including transaction costs) of the Group for the financial year ended 29 December 2018 determined in accordance with IFRS 3 as though the acquisition date for all business combinations effected during the year had been at the beginning of the year would be as follows:
2018 Acquisitions
€’m
Group excluding acquisitions
€’m
Pro-forma consolidated
group €’m
Revenue 209.4 2,356.3 2,565.7(Loss)/profit before taxation (1.8) 264.3 262.5
Profit before taxation in respect of the acquisitions includes one-off transaction costs during the post-acquisition period of €1.3 million and €3.1 million for the full year.
Acquisitions in 2017The Group acquired Grass Advantage LLC (Amazing Grass) and B&F Vastgoed B.V. (Body & Fit) in 2017 for which the fair value of assets and liabilities were determined provisionally. There have been no revisions to the provisional values other than an increase of €0.5 million in Goodwill in relation to the acquisition of Body & Fit.
37. Related party transactionsRelated parties of the Group and Company include Glanbia Co-operative Society Limited (the Group’s ultimate parent), subsidiary undertakings, Equity accounted investees, post-employment benefits, key management personnel and connected parties. A listing of the principal subsidiaries and Equity accounted investees is provided in note 39.
Transactions with Glanbia Co-operative Society LimitedGlanbia Co-operative Society Limited (the Society), together with its subsidiaries, holds 31.5% of the issued share capital of the Company. The Board of Directors for the year ended 29 December 2018 is comprised of 16 members, of which up to 8, including the Chairman who has the casting vote, are nominated by the Society. In accordance with IFRS 10 ‘Consolidated Financial Statements’, the Society controls the Group and is the ultimate parent of the Group. During 2018, dividends of €24.1 million (2017: €14.4 million) were paid to the Society and its wholly owned subsidiaries based on their shareholding in Glanbia plc. Dividends of €0.1 million (2017: €0.3 million) were received during the period from the Society by a subsidiary society of the Group. The Group provides a range of management and administrative services to the Society and is headquartered in a premises owned by the Society.
Transactions with subsidiariesGlanbia plc is the parent company of the Group. Transactions in the financial year between the Company and its subsidiaries include dividends received of €30.3 million (2017: €51.0 million), payment of management services of €6.3 million (2017: €4.0 million) and other transactions entered into in the normal course of business. The Group operates an annual incentive scheme whereby a portion of the annual incentive will be settled by way of shares and a long-term incentive plan whereby share awards in the Company are granted to Executive Directors and senior management. The Company recharges the costs of these plans of €8.8 million (2017: €7.8 million) to its subsidiaries and the balances are settled in cash (note 11). Details of balances to/from subsidiaries are provided in the Company balance sheet on page 124, note 20 and note 30.
In the prior year the Group through Employee Benefit Trusts reacquired Company shares from related parties, the total number of shares acquired was 146,179 ordinary shares at an average price of €16.90 per share.
Sales to and purchases from, together with outstanding payables and receivables to and from subsidiaries, are eliminated in the preparation of the Group financial statements in accordance with IFRS 10 ‘Consolidated Financial Statements’. Financial liabilities are secured by cross-guarantees from Glanbia plc and certain principal subsidiaries.
Transactions with Equity accounted investeesThe Group trades in the normal course of business with its Equity accounted investees. The Group has certain agency agreements in place with its Equity accounted investees. The commission income receivable is included in sales of services; (note 37(a)) and the year-end balance receivable is included in note 37(c). The Group provides management and administrative services to its Equity accounted investees, which are settled in cash. Dividends received by the Group from its Equity accounted investees are as follows:
Entity Nature of investment Notes2018 €’m
2017 €’m
Southwest Cheese Company, LLC Joint Venture 18 10.6 11.1Glanbia Cheese Limited Joint Venture 18 12.4 4.7Glanbia Ireland DAC Joint Venture 18 8.6 –
31.6 15.8
Dividends receivable from Glanbia Cheese Limited (Joint Venture) of €2.2 million (2017: €2.2 million) were recognised by the Group.
Notes to the Financial Statements continued

Glanbia plc | Annual Report and Financial Statements 2018
195
Loans to Equity accounted investees are as follows:
Group
2018 €’m
2017 €’m
Loans receivable At the beginning of the year 12.8 14.7Disposal – (1.9)Loans advanced during the year 17.0 –
At the end of the year 29.8 12.8
Interest on loans receivable At the beginning of the year 0.3 –Interest charged 0.4 0.7Interest received (0.6) (0.4)
At the end of the year 0.1 0.3
Total loan and interest receivable at the end of the year 29.9 13.1
During 2018 the Group advanced a loan of €16.0 million at arm’s length to Glanbia Ireland DAC, a Joint Venture of the Group, which is repayable on 5 August 2020 and a loan of €1.0 million at arm’s length to Glanbia Cheese EU Limited, a Joint Venture of the Group, which is repayable on 15 June 2023. On 21 January 2016 a subordinated loan of €12.8 million was advanced to Glanbia Ireland DAC, a Joint Venture of the Group, which is repayable on 5 August 2020. During 2017 an interest bearing unsecured loan of €1.5 million to South East Port Services Limited, and an interest free unsecured loan of €0.35 million to Malting Company of Ireland Limited were disposed of as part of the Dairy Ireland transaction.
Key management personnel and connected partiesThe Board of Directors and Glanbia Operating Executive are deemed to be key management personnel as they are responsible for planning, directing and controlling the activities of the Group. In the period to 2 July 2017 the Group traded in the normal course of business, within the Dairy Ireland segment, with key management personnel and connected parties who are involved in farming activities.
The following transactions were carried out with related parties:
37 (a) Sales of goods and services
Group Company
2018 €’m
2017 €’m
2018 €’m
2017 €’m
Sales of goods:– Associates – 4.1 – –– Joint Ventures 1.2 3.7 – –– Key management – 0.5 – –
1.2 8.3 – –
Sales of services:– Glanbia Co-operative Society Limited 2.5 2.9 – –– Associates – 4.9 – –– Joint Ventures 45.6 28.6 – –
48.1 36.4 – –
Sale of property and other assets:– Glanbia Co-operative Society Limited – 208.8 – –– Joint Ventures 0.3 – 0.3 –
0.3 208.8 0.3 –
Sales to related parties were carried out under normal commercial terms and conditions.

Glanbia plc | Annual Report and Financial Statements 2018
196
> Financial Statements
37. Related party transactions continued37 (b) Purchases of goods and services
Group Company
2018 €’m
2017 €’m
2018 €’m
2017 €’m
Purchases of goods:– Associates – 40.8 – –– Joint Ventures 41.9 27.9 – –– Key management – 0.2 – –
41.9 68.9 – –
Purchases of services:– Glanbia Co-operative Society Limited 0.3 0.2 – –– Associates – 2.1 – –– Joint Ventures 0.3 1.6 – –– Subsidiaries – – 6.3 4.0
0.6 3.9 6.3 4.0
Purchases of property and other assets:– Subsidiaries – – – 2.6
– – – 2.6
Purchases from related parties were carried out under normal commercial terms and conditions.
37 (c) Year end balances (excluding loans)
Group Company
2018 €’m
2017 €’m
2018 €’m
2017 €’m
Receivables from related parties:– Glanbia Co-operative Society Limited 0.2 1.1 – 0.7– Joint Ventures 13.2 14.4 – 0.1– Subsidiaries – – 346.8 317.4
13.4 15.5 346.8 318.2
Payables to related parties:– Glanbia Co-operative Society Limited 0.1 – 0.1 –– Joint Ventures 22.6 13.3 – –– Subsidiaries – – 253.7 208.8
22.7 13.3 253.8 208.8
The outstanding balances included in receivables and payables at the balance sheet date in respect of transactions with related parties are unsecured, interest free and settlement arises in cash. No guarantees have been given or received. All outstanding balances are deemed to be fully recoverable by the Group.
37 (d) Contributions to retirement benefit plansInformation in relation to the Group’s contributions to retirement benefit plans is disclosed in note 9.
37 (e) Key management compensationIAS 24 ‘Related Party Disclosures’ requires the disclosure of compensation paid to the Group’s key management.
Key management compensation includes the compensation of the Board of Directors (Executive and Non-Executive) and members of the Glanbia Operating Executive, including the Group Secretary. Dividends totalling €0.3 million (2017: €0.1 million) were received by key management personnel during the year, based on their personal shareholdings in Glanbia plc.
Notes to the Financial Statements continued

Glanbia plc | Annual Report and Financial Statements 2018
197
In addition to their salaries and short term benefits, the Group contributes to post retirement benefit plans on behalf of key management personnel and these personnel also participate in the Group’s annual incentive scheme and Long-term incentive plan, (notes 9 and 11). No loans were made to key management during the year (2017: nil).
Group Company
2018 €’m
2017 €’m
2018 €’m
2017 €’m
Salaries and other short-term employee benefits 6.5 6.4 – –Post-employment benefits 0.9 0.9 – –Share-based payments 6.2 4.6 – –Non-Executive Directors fees 0.8 0.8 0.8 0.8
14.4 12.7 0.8 0.8
Retirement benefits of €0.4 million (2017: €0.4 million) were accrued in the year to four members of key management (2017: four) under a post retirement defined benefit plan. Total retirement benefits accrued to directors under the post retirement defined benefit plan are €6.5 million (2017: €5.8 million).
The Group through Employee Benefit Trusts reacquired Company shares from key management personnel; the total number reacquired was 111,989 ordinary shares at an average price of €15.08 per share.
Details of the Directors compensation including salary, fees and other benefits, together with their interest in Glanbia plc, the Long-term incentive plan and the Annual incentive scheme is disclosed in the Remuneration Committee report on pages 80 to 101.
Prior to the disposal of Dairy Ireland the Group traded in the normal course of business, within the Dairy Ireland segment with key management personnel and connected parties who are involved in farming activities. The following table sets out details of the transactions and amounts outstanding on trading accounts by Directors during 2017.
Directors in office during 2017
Balance at 31 December 2016/date of appointment
€’000
Sales/ (purchases)
with Director during 2017
€’000
(Receipts from)/payments
to Director during 2017
€’000
Interest charged
during 2017 €’000
Balance transferred to
Glanbia Ireland DAC
€’000
Balance at 30 December
2017 €’000
Maximum balance
during 2017 €’000
H CorballySales to Director 3 31 (27) – (7) – 12Purchases from Director (7) (36) 36 – 7 – (7)Mn KeaneSales to Director 5 51 (40) 1 (17) – 19Purchases from Director – – – – – – –P MurphySales to Director 7 23 (31) 1 – – 14Purchases from Director – – – – – – –P AhernSales to Director 3 86 (75) – (14) – (21)Purchases from Director – – – – – – –V GormanSales to Director – 43 (43) – – – –Purchases from Director (9) (44) 45 – 8 – (9)MI KeaneSales to Director 5 15 (17) – (3) – 6Purchases from Director – – – – – – –J MurphySales to Director 107 72 (113) 2 (68) – 121Purchases from Director (8) (39) 40 – 7 – (8)D O’ConnorSales to Director – 1 (1) – – – 1Purchases from Director – – – – – – –T GrantSales to Director 9 1 (5) – (5) – 6Purchases from Director – – – – – – –E PowerSales to Director 6 – – – (6) – 6Purchases from Director – – – – – – –B HayesSales to Director 7 3 – – (10) – 10Purchases from Director – – – – – – –

Glanbia plc | Annual Report and Financial Statements 2018
198
> Financial Statements
37. Related party transactions continuedFormer Directors who were in office during 2017
Balance at 31 December 2016/date of appointment
€’000
Sales/ (purchases)
with Director during 2017
€’000
(Receipts from)/payments
to Director during 2017
€’000
Interest charged
during 2017 €’000
Balance at date of
retirement €’000
Maximum balance
during period €’000
J DohenySales to Director – 8 – – 8 8Purchases from Director – – – – – –J GilsenanSales to Director 5 12 (8) – 9 9Purchases from Director (10) (30) 35 – (5) (9)M MerrickSales to Director 17 45 (35) – 27 27Purchases from Director (13) (26) 34 – (5) (8)
Connected personsThe aggregate of credit sales/purchases, transactions to/with connected persons of Directors in office at 30 December 2017, as defined in section 220 of the Companies Act 2014, are as follows (aggregate of 8 persons):
Balance at 01 January
2017/date of appointment
€’000
Sales/ (purchases)
with connected persons during
2017 €’000
(Receipts from)/payments to
connected persons during
2017 €’000
Interest charged
during 2017 €’000
Balance transferred to
Glanbia Ireland DAC
€’000
Balance at 30 December
2017 €’000
Maximum balance
during 2017 €’000
Sales to connected persons (33) 154 (102) 1 (20) – 52Purchases from connected
persons – – – – – – –
38. Events after the reporting periodSee note 15 for the final dividend, recommended by the Directors, to be paid on 26 April 2019.
Subsequent to year end, on 19 February 2019, Glanbia agreed to acquire Watson LLC and Polymer Films LLC (collectively known as ‘Watson’) for $89 million in cash (the ‘Transaction’). Watson is a US based non-dairy ingredient solutions business and will be a complementary acquisition for the Group. In 2018 Watson delivered $101 million in revenue. On completion, Watson will be part of GN Nutritional Solutions. It is anticipated that the Transaction will close by Q2 2019 subject to customary completion conditions. There is no deferred component to the purchase price. The Transaction will be fully financed by the Group’s existing banking facilities and based on the anticipated close date it is expected to be marginally accretive to earnings per share in 2019. Due to the proximity of the acquisition to the date of signature of the financial statements, it is not possible to provide the fair values of the net assets acquired.
39. Principal subsidiaries and Equity accounted investeesThe information outlined below relates only to the principal undertakings in the Group as at 29 December 2018 and as at 30 December 2017. The Group has availed of the exemption under section 316 of the Companies Act 2014. The information required under section 314 of the Companies Act 2014 including a full listing of subsidiaries and Joint Venture undertakings will be annexed to the Company’s Annual Return to be filed in the Companies Registration Office in Ireland.
All beneficial interests are in ordinary shares, membership interests or membership units.
(a) Subsidiaries
Incorporated and operating in Registered office Principal activity
Beneficial % interest
2018
Beneficial % interest
2017
Ireland
Alanfield Society Limited Glanbia House, Kilkenny, Co Kilkenny Holding society 100 100
Avonmore Proteins Designated Activity Company Glanbia House, Kilkenny, Co Kilkenny Financing 100 100
Avonmore Skim Milk Products Limited Glanbia House, Kilkenny, Co Kilkenny Financing 100 100
Glanbia Cheesip Limited 1 Glanbia House, Kilkenny, Co Kilkenny Research and development 100 100
Glanbia Estates Limited Glanbia House, Kilkenny, Co Kilkenny Property and land dealing 100 100
Glanbia Finance Designated Activity Company Glanbia House, Kilkenny, Co Kilkenny Financing 100 100
Glanbia Financial Services Unlimited Company Glanbia House, Kilkenny, Co Kilkenny Financing 100 100
Notes to the Financial Statements continued
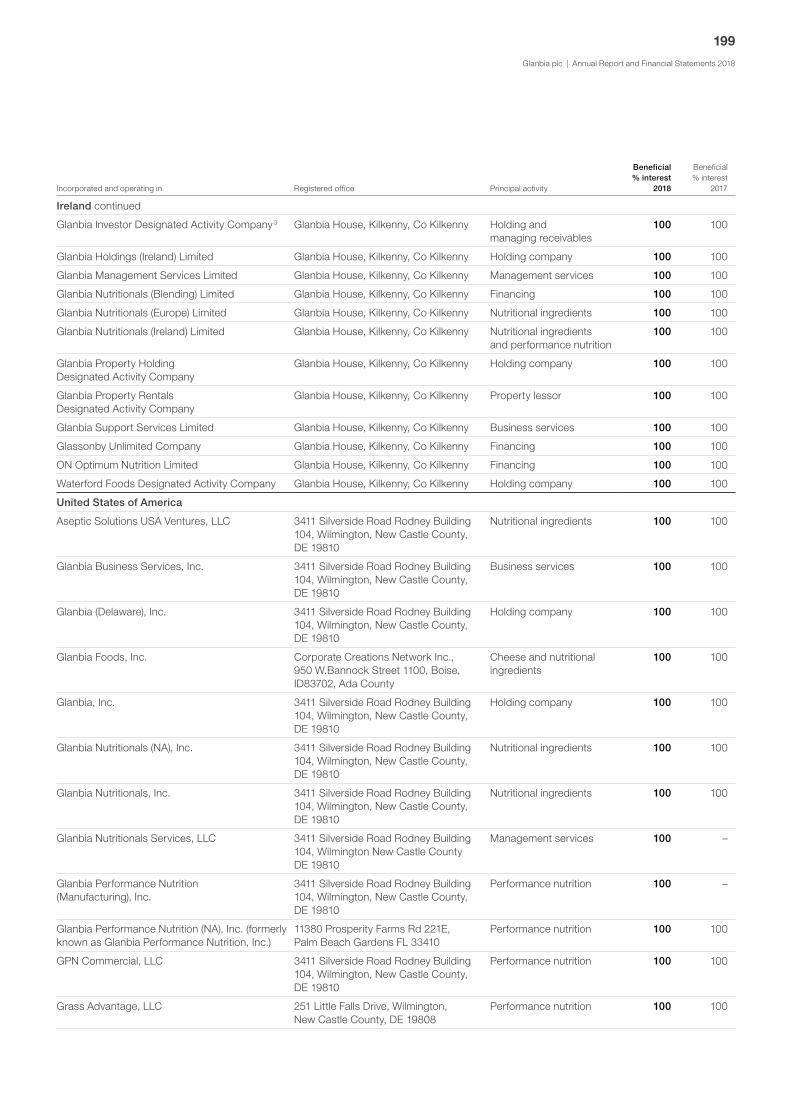
Glanbia plc | Annual Report and Financial Statements 2018
199
Incorporated and operating in Registered office Principal activity
Beneficial % interest
2018
Beneficial % interest
2017
Ireland continued
Glanbia Investor Designated Activity Company 3 Glanbia House, Kilkenny, Co Kilkenny Holding and managing receivables
100 100
Glanbia Holdings (Ireland) Limited Glanbia House, Kilkenny, Co Kilkenny Holding company 100 100
Glanbia Management Services Limited Glanbia House, Kilkenny, Co Kilkenny Management services 100 100
Glanbia Nutritionals (Blending) Limited Glanbia House, Kilkenny, Co Kilkenny Financing 100 100
Glanbia Nutritionals (Europe) Limited Glanbia House, Kilkenny, Co Kilkenny Nutritional ingredients 100 100
Glanbia Nutritionals (Ireland) Limited Glanbia House, Kilkenny, Co Kilkenny Nutritional ingredients and performance nutrition
100 100
Glanbia Property Holding Designated Activity Company
Glanbia House, Kilkenny, Co Kilkenny Holding company 100 100
Glanbia Property Rentals Designated Activity Company
Glanbia House, Kilkenny, Co Kilkenny Property lessor 100 100
Glanbia Support Services Limited Glanbia House, Kilkenny, Co Kilkenny Business services 100 100
Glassonby Unlimited Company Glanbia House, Kilkenny, Co Kilkenny Financing 100 100
ON Optimum Nutrition Limited Glanbia House, Kilkenny, Co Kilkenny Financing 100 100
Waterford Foods Designated Activity Company Glanbia House, Kilkenny, Co Kilkenny Holding company 100 100
United States of America
Aseptic Solutions USA Ventures, LLC 3411 Silverside Road Rodney Building 104, Wilmington, New Castle County, DE 19810
Nutritional ingredients 100 100
Glanbia Business Services, Inc. 3411 Silverside Road Rodney Building 104, Wilmington, New Castle County, DE 19810
Business services 100 100
Glanbia (Delaware), Inc. 3411 Silverside Road Rodney Building 104, Wilmington, New Castle County, DE 19810
Holding company 100 100
Glanbia Foods, Inc. Corporate Creations Network Inc., 950 W.Bannock Street 1100, Boise, ID83702, Ada County
Cheese and nutritional ingredients
100 100
Glanbia, Inc. 3411 Silverside Road Rodney Building 104, Wilmington, New Castle County, DE 19810
Holding company 100 100
Glanbia Nutritionals (NA), Inc. 3411 Silverside Road Rodney Building 104, Wilmington, New Castle County, DE 19810
Nutritional ingredients 100 100
Glanbia Nutritionals, Inc. 3411 Silverside Road Rodney Building 104, Wilmington, New Castle County, DE 19810
Nutritional ingredients 100 100
Glanbia Nutritionals Services, LLC 3411 Silverside Road Rodney Building 104, Wilmington New Castle County DE 19810
Management services 100 –
Glanbia Performance Nutrition (Manufacturing), Inc.
3411 Silverside Road Rodney Building 104, Wilmington, New Castle County, DE 19810
Performance nutrition 100 –
Glanbia Performance Nutrition (NA), Inc. (formerly known as Glanbia Performance Nutrition, Inc.)
11380 Prosperity Farms Rd 221E, Palm Beach Gardens FL 33410
Performance nutrition 100 100
GPN Commercial, LLC 3411 Silverside Road Rodney Building 104, Wilmington, New Castle County, DE 19810
Performance nutrition 100 100
Grass Advantage, LLC 251 Little Falls Drive, Wilmington, New Castle County, DE 19808
Performance nutrition 100 100

Glanbia plc | Annual Report and Financial Statements 2018
200
> Financial Statements
39. Principal subsidiaries and Equity accounted investees continued
Incorporated and operating in Registered office Principal activity
Beneficial % interest
2018
Beneficial % interest
2017
United States of America continued
HNS Intermediate Corporation 3411 Silverside Road Rodney Building 104, Wilmington, New Castle County, DE 19810
Weight management solutions
100 –
Hyper Network Solutions of Florida, LLC 11380 Prosperity Farms Rd 221E, Palm Beach Gardens FL 33410
Mineral and vitamin supplements
100 –
KSF Acquisition Corporation 3411 Silverside Road Rodney Building 104, Wilmington, New Castle County, DE 19810
Weight management solutions
100 –
Lifeagen Biosciences of Florida, Inc. 11380 Prosperity Farms Rd 221E, Palm Beach Gardens FL 33410
Mineral and vitamin supplements
100 –
Britain and Northern Ireland
Glanbia Holdings Limited One Victoria Square, Birmingham, B1 1BD
Financing 100 100
Glanbia Investments (UK) Limited One Victoria Square, Birmingham, B1 1BD
Holding company 100 100
Glanbia Milk Limited One Victoria Square, Birmingham, B1 1BD
Management services 100 100
Glanbia Performance Nutrition (UK) Limited One Victoria Square, Birmingham, B1 1BD
Performance nutrition 100 100
Glanbia Performance Nutrition (UK Sales Division) Limited
One Victoria Square, Birmingham, B1 1BD
Performance nutrition 100 100
Glanbia (UK) Limited One Victoria Square, Birmingham, B1 1BD
Holding company 100 100
KSF Acquisition UK Limited One Victoria Square, Birmingham, B1 1BD
Weight management solutions
100 –
Waterford Foods International Limited One Victoria Square, Birmingham, B1 1BD
Holding company 100 100
Australia
Glanbia Performance Nutrition Pty Limited Level 10, 68 Pitt Street, Sydney NSW 2000
Performance nutrition 100 100
Brazil
Glanbia Marketing de Produtos de Nutriçâo e Performance do Brasil Ltda 3
Alameda Gabriel Monteiro da Silva, No. 2892, Jardim America, na Cidade de Sao Paulo, São Paulo
Performance nutrition 100 100
Canada
Glanbia Nutritionals (Canada) Inc. 3 1700-242 Hargrave Street, Winnipeg MB, R3C 0V1
Nutritional ingredients 100 100
Glanbia Performance Nutrition Canada Inc. 3 1700-242 Hargrave Street, Winnipeg MB, R3C 0V1
Performance nutrition 100 100
China
Glanbia Nutritionals (Suzhou) Co. Limited 3 No. 128 Fangzong Street SIP, Suzhou, Jiangsu Province, PRC 215025, China
Nutritional ingredients 100 100
Glanbia Performance Nutrition Trading (Shanghai) Co., Ltd. 3
Room 101, Building D, the Bund SOHO, Zhongshan East 2nd Road 88, Shanghai, 200001
Performance nutrition 100 100
Glanbia (Shanghai) International Trading Co. Limited 3
Room 432, No. 473 Fute Xiyi Road, Waigaoqiao Free Trade Zone, Shanghai, China
Nutritional ingredients 100 100
Denmark
Nutramino Holding ApS 3 Landgreven 3, 1. tv., 1301, København K
Holding company 100 100
Nutramino Int. ApS 3 Landgreven 3, 1. tv., 1301, København K
Performance nutrition 100 100
Notes to the Financial Statements continued

Glanbia plc | Annual Report and Financial Statements 2018
201
Incorporated and operating in Registered office Principal activity
Beneficial % interest
2018
Beneficial % interest
2017
France
Glanbia Performance Nutrition France SAS 3 8, Avenue Hoche, 75008, Paris Performance nutrition 100 100
Germany
Body & Fit Nutrition GmbH 3 Hohenstaufenring 62, 50674, Köln Performance nutrition 100 100
Glanbia Nutritionals Deutschland GmbH 3 Gewerbestrasse 3, 78359 Orsingen – Nenzingen
Nutritional ingredients 100 100
Glanbia Performance Nutrition GmbH 3 Anwesen Freudenbergerweg 11, 81669, Munich
Performance nutrition 100 100
India
Glanbia India Private Limited 2 Ground Floor, No. 12/47, 7th Cross, Swimming Pool Extension, Malleshwaram, Bangalore KA, 560003
Nutritional ingredients 100 100
Glanbia Performance Nutrition (India) Private Limited 2
S9, 2nd Floor, Manish Megha Plaza, Plot No 13, Sector 5, Dwarka, New Delhi, 110075
Performance nutrition 100 100
Japan
Glanbia Japan K.K. 3 Level 18 Yebisu Garden Place, Tower 4–20–3, Ebisu Shibuya-ku, Tokyo
Nutritional ingredients 100 100
Korea (Republic of)
Glanbia Performance Nutrition Korea LLC 3 1319, 13th floor, 311 Gangnam-daero, Seocho-gu, Seoul
Performance nutrition 100 –
Luxembourg
Glanbia Luxembourg SA 3 15, Boulevard Friedrich Wilhelm Raiffeisen, L-2411, Luxembourg
Financing 100 100
Glanbia Luxfin SA 3 15, Boulevard Friedrich Wilhelm Raiffeisen, L-2411, Luxembourg
Financing 100 100
Glanbia Luxinvest SA 3 15, Boulevard Friedrich Wilhelm Raiffeisen, L-2411, Luxembourg
Financing 100 100
Mexico
Glanbia, S.A. de CV 3 Av. Prolongación Paseo de la Reforma No. 115–1006, Col. Paseo de las Lomas, C.P. 01330
Nutritional ingredients 100 100
Netherlands
B&F Vastgoed B.V. 3 Mars 10, 8448CP, Heerenveen Holding company 100 100
Body & Fit Sportsnutrition B.V. 3 Mars 10, 8448CP, Heerenveen Performance nutrition 100 100
Glanbia Foods B.V. 3 Atrium Building 8th Floor, Strawinskylaan 3127, 1077 ZX, Amsterdam
Holding company 100 100
New Zealand
Glanbia Performance Nutrition (New Zealand) Limited 3
C/–Martelli Mckegg, Level 20, PwC Tower, 188 Quay Street, Auckland, 1010
Performance nutrition 100 100
Norway
Nutramino NO AS 3 Fillpstad brygge 1, 0252, Oslo Performance nutrition 100 100
Philippines
Glanbia Performance Nutrition Philippines, Inc. 3 146 Yakal Street, San Antonio Village, Makati City 1203
Performance nutrition 100 –
Portugal
Glanbia Nutritionals (Portugal) – Sociedade Unipessoal, Lda. 3
Miraflores, Torre de Mansanto, Rua Afonso Praça, 30–7o e 8o piso, 1495–061 Miraflores
Performance nutrition 100 100
Russian Federation
LLC Glanbia 3 6 Vernadskogo prospect, Office 614, 119311, Moscow
Nutritional ingredients 100 100

Glanbia plc | Annual Report and Financial Statements 2018
202
> Financial Statements
Incorporated and operating in Registered office Principal activity
Beneficial % interest
2018
Beneficial % interest
2017
Singapore
Glanbia Nutritionals Singapore Pte Limited 3 70 Bendemeer Road, 06–01, 339940 Nutritional ingredients 100 100
Glanbia Performance Nutrition Singapore Pte. Ltd
300 Beach Road, 35-06/07, The Concourse, 199555
Performance nutrition 100 100
South Africa
Glanbia (Pty) Limited 3 Stand 893, 7 Forbes Street, Midstream Estate – Windsor Gate, Brakfontein Road, Guateng, South Africa, 2192
Nutritional ingredients 100 100
Sweden
Nutramino AB 3 Ostermalinstorg.1, 4 tr, 114 42, Stockholm
Performance nutrition 100 100
Turkey
Glanbia Besin Ürünleri Pazarlama ve Ticaret Limited Sirketi 3
Kocatepe Mah., Lamartin Cad. No:5, Ofis Lamartine Kat:6, Taksim, Beyoglu, Istanbul, 34437
Performance nutrition 100 100
United Arab Emirates (UAE)
Glanbia Performance Nutrition DMCC (UAE)3 Unit No. 3406, Liwa Heights 1, Plot No: JLT – PH2-W3A, Jumeirah Lake Towers, Dubai
Performance nutrition 100 –
Uruguay
Glanbia (Uruguay Exports) SA 3 Copacabana Street, Block 26 – S 12, Médanos de Solymar City, Canelones
Nutritional ingredients 100 100
1. Glanbia Cheesip Limited has a branch at 1 rue Hildegard von Bingen L–1282 Luxembourg. The company and its branch have a statutory year fixed at 31 December each year to comply with statutory requirements.
2. The statutory year end of this subsidiary is 31 March, which coincides with the tax year in India.3. The statutory year end of these subsidiaries is fixed at 31 December each year to comply with statutory requirements.
The Group has no significant restrictions in relation to its ability to access or use the assets and settle the liabilities of its subsidiaries.
(b) Joint Ventures
Incorporated and operating inJoint Venture/ Associate
Date to which results are included Registered office Principal activity
Beneficial % interest
2018
Beneficial % interest
2017
Ireland
Glanbia Cheese EU Limited Joint Venture 29/12/2018 Glanbia House, Kilkenny, Co Kilkenny
Cheese products 50 –
Glanbia Ireland Designated Activity Company
Joint Venture 29/12/2018 Glanbia House, Kilkenny, Co Kilkenny
Milk products, consumer goods and agri trading
40 40
United States of America
Southwest Cheese Company, LLC Joint Venture 29/12/2018 1209 Orange Street, Wilmington New Castle County, DE 19801
Cheese and nutritional ingredients
– 50
Spartan-Southwest Holdings, LLC Joint Venture 29/12/2018 3411 Silverside Road, Rodney Building, Wilmington, New Castle County, DE 19801
Holding company 50 –
Britain and Northern Ireland
Glanbia Cheese Limited Joint Venture 29/12/2018 4 Royal Mews, Gadbrook Park, Rudheath, Northwich, Cheshire, CW9 7VD
Cheese products 51 51
The Group’s interests in Joint Ventures are subject to certain restrictions, however these are not material.
39. Principal subsidiaries and Equity accounted investees continued
Notes to the Financial Statements continued

Glanbia plc | Annual Report and Financial Statements 2018
203
NOT COVERED BY INDEPENDENT AUDITOR’S REPORT
Non–IFRS performance measuresThe Group reports certain performance measures that are not defined under IFRS but which represent additional measures used by the Board of Directors and the Glanbia Operating Executive in assessing performance and for reporting both internally and to shareholders and other external users. The Group believes that the presentation of these non–IFRS performance measures provides useful supplemental information which, when viewed in conjunction with our IFRS financial information, provides readers with a more meaningful understanding of the underlying financial and operating performance of the Group.
None of these non–IFRS performance measures should be considered as an alternative to financial measures drawn up in accordance with IFRS.
The principal non–IFRS performance measures used by the Group are:
G 1. Constant currencyG 2. Total GroupG 3. RevenueG 4. EBITAG 5. EBITA margin %G 6. IFRS 15G 7. EBITDA G 8. Pro–forma Adjusted Earnings Per ShareG 9. Financing Key Performance IndicatorsG 10. Exceptional itemsG 11. Volume and pricing increase/(decrease)G 12. Like-for-like branded revenue increase/(decrease)G 13. Innovation rateG 14. Effective tax rateG 15. Average interest rateG 16. Operating cash flow and free cash flowG 17. Operating cash conversionG 18. Return on capital employed (ROCE)G 19. Total shareholder return (TSR)G 20. Dividend payout ratioG 21. Compound annual growth rate (CAGR)
These principal non-IFRS performance measures are defined below with a reconciliation of these measures to IFRS measures where applicable.
G 1. Constant currencyWhile the Group reports its results in euro, it generates a significant proportion of its earnings in currencies other than euro, in particular US dollar. Constant currency reporting is used by the Group to eliminate the translational effect of foreign exchange on the Group’s results. To arrive at the constant currency year–on–year change, the results for the prior year are retranslated using the average exchange rates for the current year and compared to the current year reported numbers.
The principal average exchange rates used to translate results for 2018 and 2017 are set out below:
Euro 1 = 2018 2017
US dollar 1.1812 1.1295Pound sterling 0.8847 0.8764
All non–IFRS performance measures have been presented on a constant currency basis, where relevant, within this glossary.
G 2. Total GroupThe Group has a number of strategically important Equity accounted investees (Joint Ventures) which when combined with the Group’s wholly-owned businesses give an important indication of the scale and reach of the Group’s operations. Total Group is used to describe certain financial metrics such as Revenue and EBITA when they include both the wholly-owned businesses and the Group’s share of Equity accounted investees.
Total Group pro-forma Revenue and EBITA have been provided for 2017 as the Group believes it is more reflective of the revised and on-going structure of the Group following the disposal of 60% of Dairy Ireland and related assets in 2017. Total Group pro-forma Revenue and EBITA are defined as Total Group Revenue/EBITA plus the Group’s share (40%) of the Revenue/EBITA of Dairy Ireland in 2017. See G3.1.
G 3. Revenue Revenue comprises sales of goods and services of the wholly-owned businesses to external customers net of value added tax, rebates and discounts. Revenue is one of the Group’s Key Performance Indicators and is an IFRS performance measure.
GlossaryKey Performance Indicators and non-IFRS performance measures

Glanbia plc | Annual Report and Financial Statements 2018
204
> Other Information
Glossary continuedKey Performance Indicators and non-IFRS performance measures continued
G 3. Revenue continuedG 3.1 Total Group pro-forma revenue:
Reference to the Financial Statements/Glossary
2018€’m
2017Reported
€’m
2017Retranslated
€’m
Constant currency
growth%
US Cheese 680.0 734.1 702.0 (3.1%)Nutritional Solutions 526.7 531.9 511.6 3.0%
Glanbia Nutritionals Note 4 1,206.7 1,266.0 1,213.6 (0.6%)Glanbia Performance Nutrition Note 4 1,179.6 1,121.1 1,077.7 9.5%
Wholly-owned (continuing operations) 2,386.3 2,387.1 2,291.3 4.1%
Equity accounted investees G 3.2 1,283.8 1,093.4 1,075.7 19.3%40% share of discontinued operations* – 143.2 143.2
Pro-forma Equity accounted investees 1,283.8 1,236.6 1,218.9 5.3%
Total Group pro-forma revenue 3,670.1 3,623.7 3,510.2 4.6%
* Excludes inter segment revenue in 2017 of €0.5 million. Gross segment revenue for discontinued operations is presented in note 10.
G 3.2 Group’s share of revenue of Equity accounted investees:
2018Reference to the Financial Statements/Glossary
Glanbia Ireland DAC
€’m
Southwest/Michigan
Cheese Group€’m
GlanbiaCheeseLimited
€’mTotal
€’m
Equity accounted investees revenue (100%) Note 18 1,809.9 802.4 311.0 2,923.3% of ownership interest 40% 50% 51%
Group’s share of revenue of Equity accounted investees 724.0 401.2 158.6 1,283.8
2017
Equity accounted investees revenue (100%) Note 18 1,407.1 738.0 316.7 2,461.8% of ownership interest 40% 50% 51%
Group’s share of revenue of Equity accounted investees 562.9 369.0 161.5 1,093.4
G 4. EBITA EBITA is defined as earnings before interest, tax and amortisation. EBITA references throughout the annual report are on a pre-exceptional basis unless otherwise indicated. EBITA is one of the Group’s Key Performance Indicators. Business Segment EBITA growth on a constant currency basis is one of the performance conditions in Glanbia’s Annual Incentive Plan for Executive Directors with Business Unit responsibility. Refer to note 5 to the financial statements for the reconciliation of continuing operations EBITA.

Glanbia plc | Annual Report and Financial Statements 2018
205
G 4.1 Total Group pro-forma EBITA:
Reference to the Financial Statements/Glossary
2018€’m
2017Reported
€’m
2017Retranslated
€’m
Constant currency
growth%
Glanbia Nutritionals Note 4 111.8 113.5 108.5 3.0%Glanbia Performance Nutrition Note 4 173.1 169.7 162.3 6.7%
Wholly-owned (continuing operations) 284.9 283.2 270.8 5.2%
Equity accounted investees G 4.2 65.8 63.4 62.4 5.4%40% share of discontinued operations Note 10 – 4.2 4.2
Pro-forma Equity accounted investees 65.8 67.6 66.6 (1.2%)
Total Group pro-forma EBITA 350.7 350.8 337.4 3.9%
G 4.2 Reconciliation of the Group’s share of Equity accounted investees EBITA to the pro-forma share of results of Equity accounted investees on a constant currency basis is as follows:
2018€’m
2017€’m
EBITA of Equity accounted investees 65.8 63.4Adjustment in respect of unrealised profit on sales to the Group 0.6 (0.2)Amortisation (2.5) (1.7)Finance costs (9.0) (7.1)Income tax (10.1) (11.8)Share of results of Equity accounted investees 1.0 0.4Non-controlling interest (0.5) (0.2)
Share of results of Equity accounted investees per the Group income statement – pre-exceptional 45.3 42.8Impact of retranslating 2017 – (0.5)
Share of results of Equity accounted investees on a constant currency basis – pre-exceptional 45.3 42.3Constant currency change 7.1%
G 5. EBITA margin %EBITA margin % is defined as EBITA as a percentage of revenue. Total Group EBITA margin % is defined as Total Group EBITA as a percentage of Total Group revenue. Refer to G3.1 and G4.1 for reconciliations of Total Group pro-forma revenue and Total Group pro-forma EBITA respectively. EBITA references throughout the annual report are on a pre-exceptional basis unless otherwise indicated.
G 6. IFRS 15 IFRS 15 ‘Revenue from Contracts with Customers’ is effective and will be adopted by the Group for the 2019 financial year. Following a detailed review by the Group there were no material changes to revenue recognition and profits across the Group with the exception of the matter outlined below.
The Group concluded that the relationship between Glanbia Nutritionals and the Group Joint Venture partner Southwest Cheese (SWC), will transition from an agent relationship to that of a principal.

Glanbia plc | Annual Report and Financial Statements 2018
206
> Other Information
Glossary continuedKey Performance Indicators and non-IFRS performance measures continued
G 6. IFRS 15 continuedThe impact is as follows:
G 6.1 Wholly-owned pro-forma revenue – IFRS 15 restatement:
Reference to the Financial Statements/Glossary
2018Reported
€’m
2018IFRS 15 Impact
€’m
2018IFRS 15
Restated€’m
US Cheese 680.0 733.9 1,413.9Nutritional Solutions 526.7 50.3 577.0
Glanbia Nutritionals Note 4 1,206.7 784.2 1,990.9Glanbia Performance Nutrition Note 4 1,179.6 – 1,179.6
Wholly-owned (continuing operations) Note 4 2,386.3 784.2 3,170.5
G 7. EBITDAEBITDA is defined as earnings before interest, tax, depreciation (net of grant amortisation) and amortisation. EBITDA references throughout the annual report are on a pre-exceptional basis unless otherwise indicated.
Reference to the Financial Statements/Glossary
2018€’m
Continuing operations
2017€’m
Discontinued operations
2017€’m
Total2017€’m
Earnings before interest, tax and amortisation (pre-exceptional EBITA) G 4.1/Note 10 284.9 283.2 10.6 293.8
Depreciation Note 5/Note 34 43.0 45.1 4.0 49.1Grant amortisation Note 34 (0.1) (0.1) (0.2) (0.3)
Earnings before interest, tax, depreciation and amortisation (pre-exceptional EBITDA) 327.8 328.2 14.4 342.6
G 8. Pro-forma Adjusted Earnings Per Share (EPS)Pro-forma Adjusted EPS has been provided as the Group believes it is more reflective of the revised and on-going structure of the Group following the disposal of 60% of Dairy Ireland and related assets in 2017. It is defined as the net profit from continuing operations attributable to the equity holders of Glanbia plc, before exceptional items and intangible asset amortisation (excluding software amortisation), net of related tax, plus the Group’s share (40%) of the profits after tax for Dairy Ireland and related assets, before exceptional items and amortisation of intangible assets (excluding software amortisation), net of related tax, divided by the weighted average number of ordinary shares in issue during the year.
Pro-forma Adjusted EPS has been calculated to set out the Adjusted EPS on the basis that the Dairy Ireland transaction had taken place on 1 January 2017.
Adjusted EPS is defined as the net profit attributable to the equity holders of Glanbia plc, before exceptional items and intangible asset amortisation (excluding software amortisation), net of related tax, divided by the weighted average number of ordinary shares in issue during the year. The Group believes that adjusted EPS is a better measure of underlying performance than Basic EPS as it excludes exceptional items (net of related tax) that are not related to on–going operational performance and intangible asset amortisation, which allows better comparability of companies that grow by acquisition to those that grow organically.
Adjusted EPS is one of the Group’s Key Performance Indicators. Adjusted EPS growth on a constant currency basis is one of the performance conditions in Glanbia’s Annual Incentive Plan and in Glanbia’s Long–term Incentive Plan.

Glanbia plc | Annual Report and Financial Statements 2018
207
NotesReference to the Financial Statements/Glossary
2018€’m
2017Reported
€’m
2017Retranslated
€’m
Profit attributable to equity holders of the Company – pre-exceptional
Group income statement 234.0 231.4 221.8
Amortisation and impairment of intangible assets (excluding software amortisation) net of related tax of €6.1 million (2017: €7.5 million) 34.6 31.7 30.4Discontinued operations adjusted net income (100%) (a) – (10.1) (10.1)40% share of discontinued operations adjusted net income (b) – 4.0 4.0
Pro-forma Adjusted net income 268.6 257.0 246.1
Weighted average number of ordinary shares in issue (thousands) Note 14 295,159 295,010 295,010
Pro-forma Adjusted Earnings Per Share (cent) 91.01 87.11 83.46
Pro-forma constant currency change 9.0%
(a) Discontinued activities – removal of 100% of the profit after tax before exceptional items and intangible asset amortisation (excluding software amortisation costs), net of related tax, from discontinued activities. The on-going retained element of Dairy Ireland (40%) is added back as part of adjustment (b) below.
(b) Add back of 40% of the Dairy Ireland profit after tax before exceptional items and intangible asset amortisation (excluding software amortisation), net of related tax, (reflecting Dairy Ireland as an Equity accounted investee from 1 January 2017).
G 9. Financing Key Performance Indicators The following are the financing key performance indicators defined as per the Group’s financing agreements. G 9.1 Net debt: adjusted EBITDANet debt: adjusted EBITDA is calculated as net debt at the end of the period divided by adjusted EBITDA. Net debt is calculated as total financial liabilities less cash and cash equivalents. Adjusted EBITDA is calculated in accordance with lenders’ facility agreements definition which adjust pre-exceptional EBITDA for items such as dividends received from Equity accounted investees and acquisitions or disposals. Adjusted EBITDA is a rolling 12 month measure.
Reference to the Financial Statements/Glossary
2018€’m
2017€’m
Net debt Note 26 576.7 367.7
EBITDA G 7 327.8 328.2Adjustments in line with lenders’ facility agreements 45.2 15.8
Adjusted EBITDA 373.0 344.0
Net debt: adjusted EBITDA 1.55 1.07
G 9.2 Adjusted EBIT: Net finance costAdjusted EBIT: net finance cost is calculated as pre-exceptional earnings before interest and tax plus dividends received from Equity accounted investees divided by net finance cost. Net finance cost comprises finance costs less finance income per the Group income statement plus capitalised borrowing costs. Adjusted EBIT and net finance cost are rolling 12 month measures.
Reference to the Financial Statements/Glossary
2018€’m
2017€’m
Operating profit – continuing operations (pre-exceptional) Group income statement 239.0 240.1Operating profit – discontinued operations (pre-exceptional) Note 10 – 9.9
Operating profit – continuing and discontinued operations (pre-exceptional) 239.0 250.0Dividends received from Equity accounted investees Group statement of cash flows 31.6 15.8
Adjusted EBIT 270.6 265.8Net finance costs Note 12/Note 10 18.3 37.9
Adjusted EBIT: net finance cost 14.8 7.0
The 2017 Adjusted EBIT: net finance cost calculation include a once-off finance cost of €14.0 million recognised as an exceptional item in 2017 (see note 6). Excluding this once-off cost, Adjusted EBIT: net finance cost would be 11.2 times.

Glanbia plc | Annual Report and Financial Statements 2018
208
> Other Information
Glossary continuedKey Performance Indicators and non-IFRS performance measures continued
G 10. Exceptional ItemsThe Group has adopted an income statement format that seeks to highlight significant items within the Group results for the year. Such items may include restructuring, impairment of assets including material adjustments arising from the re-assessment of asset lives, adjustments to contingent consideration, material acquisition integration costs, restructuring costs, profit or loss on disposal or termination of operations, material acquisition costs, litigation settlements, legislative changes, gains or losses on defined benefit pension plan restructuring and profit or loss on disposal of investments. Judgement is used by the Group in assessing the particular items which by virtue of their scale and nature should be disclosed in the income statement and notes as exceptional items. Refer to note 6 for an analysis of exceptional items recognised in 2017.
G 11. Volume and pricing increase/(decrease)Volume increase/(decrease) represents the impact of sales volumes within the revenue movement year on year, excluding volume from acquisitions, on a constant currency basis.
Pricing increase/(decrease) represents the impact of sales pricing (including trade spend) within revenue movement year-on-year, excluding acquisitions, on a constant currency basis.
G 11.1 Reconciliation of volume and pricing increase/(decrease) to pro-forma constant currency revenue growth
Reference to the Financial Statements/Glossary
Volume increase/
(decrease)
Priceincrease/
(decrease)Acquisitions/
disposals
Revenue increase/
(decrease)
US Cheese G 3.1 1.7% (4.8%) – (3.1%)Nutritional Solutions G 3.1 8.5% (5.5%) – 3.0%
Glanbia Nutritionals G 3.1 4.6% (5.2%) – (0.6%)Glanbia Performance Nutrition G 3.1 9.1% (4.1%) 4.5% 9.5%
2018 increase/(decrease) % – wholly-owned (continuing operations) revenue G 3.1 6.7% (4.7%) 2.1% 4.1%
2018 increase/(decrease) % – Equity accounted investees revenue G 3.1 9.4% (5.0%) 14.9% 19.3%
G 12. Like-for-like branded revenue increase/(decrease)This represents the sales increase/(decrease) year-on-year on branded sales, excluding acquisitions, on a constant currency basis. Like-for-like branded revenue increase/(decrease) is one of the Glanbia Performance Nutrition segment’s Key Performance Indicators. Like-for-like branded revenue increase/(decrease) is one of the performance conditions in Glanbia’s Annual Incentive Plan for Glanbia Performance Nutrition Senior Management.
G 13. Innovation rateThis represents net revenue from products launched in the previous three years. Innovation rate is one of the Glanbia Performance Nutrition segment’s Key Performance Indicators. Innovation rate is one of the performance conditions in Glanbia’s Annual Incentive Plan for Glanbia Performance Nutrition Senior Management.
G 14. Effective tax rateThe effective tax rate is defined as the pre-exceptional income tax charge divided by the profit before tax less share of results of Equity accounted investees.
Reference to the Financial Statements/Glossary
2018€’m
2017€’m
Profit before tax Group income statement 266.8 259.9Less share of results of Equity accounted investees Group income statement (45.3) (42.8)
221.5 217.1Income tax (pre-exceptional) Group income statement 32.8 38.3
Effective tax rate 14.8% 17.6%
G 15. Average interest rateThe average interest rate is defined as the annualised net finance costs (pre-capitalised borrowing costs) divided by the average net debt during the reporting period.

Glanbia plc | Annual Report and Financial Statements 2018
209
G 16. Operating cash flow and free cash flow Operating cash flow is defined as pre-exceptional EBITDA of the wholly-owned businesses net of business sustaining capital expenditure and working capital movements, excluding exceptional cash flows.
Operating cash flow is one of the Group’s Key Performance Indicators. Operating cash flow is one of the performance conditions in Glanbia’s Annual Incentive Plan.
Free cash flow is calculated as the net cash flow in the year before the following items: strategic capital expenditure, acquisition spend, proceeds received on disposals, loans to Equity accounted investees, equity dividends paid, exceptional costs paid and currency translation movements.
Reference to the Financial Statements/Glossary
2018Reported
€’m
2017Reported
€’m
2017Discontinued
Operations€’m
2017Pro-forma
€’m
Earnings before interest, tax, depreciation and amortisation (pre-exceptional EBITDA) G 7 327.8 342.6 (14.4) 328.2
Movement in working capital (pre-exceptional) G 16.3 (9.7) (170.8) 47.5 (123.3)Business sustaining capital expenditure G 16.5 (16.4) (23.8) 3.9 (19.9)
Operating cash flow G 16.1 301.7 148.0 37.0 185.0Net interest and tax paid G 16.4 (42.2) (57.9) (0.5) (58.4)Dividends from Equity accounted investees Group statement of cash flows 31.6 15.8 – 15.8Other inflows/(outflows) G 16.6 4.3 (5.5) – (5.5)
Free cash flow 295.4 100.4 36.5 136.9Strategic capital expenditure G 16.5 (46.2) (48.7) 1.8 (46.9)Dividends paid Group statement of cash flows (76.0) (41.0) – (41.0)Loans/Investment in Equity accounted investees Group statement of cash flows (58.9) – – –Exceptional costs paid G 16.2 (2.6) (31.4) 2.1 (29.3)Acquisitions Group statement of cash flows (313.0) (168.2) – (168.2)Disposals Group statement of cash flows 1.3 208.8 – 208.8
Net cash flow (200.0) 19.9 40.4 60.3Exchange translation/other adjustments Group statement of cash flows (9.0) 49.9 1.5 51.4Dairy Ireland cash flows G 16.7 – – (41.9) (41.9)
Net debt movement Group statement of cash flows (209.0) 69.8 – 69.8Opening net debt Group statement of cash flows (367.7) (437.5) – (437.5)
Closing net debt Group statement of cash flows (576.7) (367.7) – (367.7)
G 16.1 Reconciliation of operating cash flow to the Group statement of cash flows in the Financial Statements:
Reference to the Financial Statements/Glossary
2018Reported
€’m
2017Reported
€’m
Cash generated from operating activities Note 34 316.5 162.2Add back exceptional cash flow in the year G 16.2 2.6 17.3Less business sustaining capital expenditure G 16.5 (16.4) (23.8)Non-cash items not adjusted in computing operating cash flow:Impairment of tangible assets (excluding exceptional items 2017: €8.1m) Note 34 – (2.7)Net write down of inventories Note 34 – (0.5)Cost of share based payments Note 34 (8.8) (7.8)Difference between pension charge and cash contributions Note 34 3.7 4.2Profit/(loss) on disposal of property, plant and equipment Note 34 0.3 (0.9)Recycle of available for sale reserve to the Group income statement on disposal of
investment Note 34 5.3 –Net loss on disposal of investments Note 34 (0.2) –Amounts payable to Spartan-Southwest Holdings joint venture partners (1.3) –
Operating cash flow G 16 301.7 148.0

Glanbia plc | Annual Report and Financial Statements 2018
210
> Other Information
Glossary continuedKey Performance Indicators and non-IFRS performance measures continued
G 16. Operating cash flow and free cash flow continuedG 16.2 Exceptional cash flow in the year:
Reference to the Financial Statements/Glossary
2018Reported
€’m
2017Reported
€’m
Pre–tax exceptional profit for year Note 6 – 53.1Intangible asset amortisation Note 6 – 19.4Finance costs Note 6 – 14.0Deferred tax Note 6 – (8.7)Profit on disposal of Dairy Ireland Note 6 – (96.3)Impairment of tangible assets Note 6 – 8.1Non–cash element of exceptional charge Note 34 – 3.0
Current year exceptional items paid in the year – (7.4)Prior year exceptional items paid in the year Note 6 (2.6) (9.9)
Exceptional cash outflow in the year – included in operating cash flow (2.6) (17.3)Interest paid Note 6 – (14.0)Disposal of undertaking in Investment in Equity accounted investees Group statement of cash flows – 208.8
Total exceptional cash (outflow)/inflow paid in the year Note 6 (2.6) 177.5
G 16.3 Movement in working capital:
Reference to the Financial Statements/Glossary
2018Reported
€’m
2017Reported
€’m
Movement in working capital (pre-exceptional) G 16 (9.7) (170.8)Net write back of inventories Note 34 0.3 –Non cash movement in allowance for impairment of receivables Note 34 (1.5) –Prior year exceptional items paid in the year G 16.2 (2.6) (9.9)Non cash movement in provisions Note 34 1.1 –Non cash movement on cross currency swaps and fair value hedges Note 34 (1.0) –Amounts payable to Spartan-Southwest Holdings joint venture partners 1.3 –
Change in net working capital Note 34 (12.1) (180.7)
G 16.4 Net interest and tax paid:
Reference to the Financial Statements/Glossary
2018Reported
€’m
2017Reported
€’m
Interest received Group statement of cash flows 4.8 3.1Interest paid Group statement of cash flows (21.0) (39.5)Tax paid Group statement of cash flows (25.2) (34.7)Interest paid in relation to property, plant and equipment Group statement of cash flows (0.8) (0.8)Interest paid – exceptional item G 16.2 – 14.0
Net interest and tax paid (42.2) (57.9)
G 16.5 Capital expenditure
Reference to the Financial Statements/Glossary
2018Reported
€’m
2017Reported
€’m
Business sustaining capital expenditure G 16 16.4 23.8Strategic capital expenditure G 16 46.2 48.7
Total capital expenditure 62.6 72.5
Purchase of property, plant and equipment Group statement of cash flows 32.0 38.0Purchase of intangible assets Group statement of cash flows 30.6 34.5
Total capital expenditure per the Group statement of cash flows 62.6 72.5
Business sustaining capital expenditureThe Group defines business sustaining capital expenditure as the expenditure required to maintain/replace existing assets with a high proportion of expired useful life. This expenditure does not attract new customers or create the capacity for a bigger business. It enables the Group to keep running at current throughput rates but also keep pace with regulatory and environmental changes as well as complying with new requirements from existing customers.

Glanbia plc | Annual Report and Financial Statements 2018
211
Strategic capital expenditureThe Group defines strategic capital expenditure as the expenditure required to facilitate growth and generate additional returns for the Group. This is generally expansionary expenditure beyond what is necessary to maintain the Group’s current competitive position.
G 16.6 Other inflows/(outflows)
Reference to the Financial Statements/Glossary
2018Reported
€’m
2017Reported
€’m
Cost of share based payments Note 34 8.8 7.8Difference between pension charge and cash contributions Note 34 (3.7) (4.2)(Profit)/loss on disposal of property, plant and equipment Note 34 (0.3) 0.9Disposals/redemption of available for sale financial assets Group statement of cash flows 7.9 2.5Additions to available for sale financial assets Group statement of cash flows (0.3) (2.0)Purchase of own shares Group statement of cash flows (4.3) (16.2)Sale of shares held by subsidiary Group statement of cash flows – 2.4Impairment of tangible assets (excluding exceptional items 2017: €8.1m) Note 34 – 2.7Net write down of inventories Note 34 – 0.5Proceeds from property, plant and equipment Group statement of cash flows – 0.1Recycle of available for sale reserve to the Group income statement on
disposal of investment Note 34 (5.3) –Amounts payable to joint venture partners 1.3 –Net loss on disposal of investments Note 34 0.2 –
Total other inflows/(outflows) 4.3 (5.5)
G 16.7 Reconciliation of discontinued operations net cash flow:Reference to the Financial Statements/Glossary
2017€’m
Dairy Ireland cash flows G 16 (41.9)Share redemption (a) 154.2Other reconciling items 3.6
Discontinued operations cash generated Note 10 115.9
(a) Included in discontinued operations cash generated is an amount of €154.2 million. This amount related to the redemption of ordinary shares in Glanbia Foods Ireland Limited by Glanbia plc which occurred on the date of the transaction, 2 July 2017.
G 17. Operating cash conversion Operating cash conversion is defined as Operating Cash Flow (OCF) divided by pre-exceptional EBITDA. Cash conversion is a measure of the Group’s ability to convert trading profits into cash and is an important metric in the Group’s working capital management programme.
G 18. Return on capital employed (ROCE) ROCE is defined as the Group’s earnings before interest, and amortisation (net of related tax) plus the Group’s share of the results of Equity accounted investees after interest and tax divided by capital employed. Capital employed comprises the sum of the Group’s total assets plus cumulative intangible asset amortisation less current liabilities less deferred tax liabilities excluding all financial liabilities, retirement benefit assets and cash. It is calculated by taking the average of the relevant opening and closing balance sheet amounts.
In years where the Group makes significant acquisitions or disposals, the ROCE calculation is adjusted appropriately, to ensure the acquisition or disposal are equally time apportioned in the numerator and the denominator.
ROCE is one of the Group’s Key Performance Indicators (see pages 14 to 15). ROCE is one of the performance conditions in Glanbia’s Long Term Incentive Plan. See Remuneration Committee report on pages 80 to 101 for more information.

Glanbia plc | Annual Report and Financial Statements 2018
212
> Other Information
G 18. Return on capital employed (ROCE) continued
Reference to the Financial Statements/Glossary
2018€’m
2017€’m
Operating profit – pre-exceptional Group income statement 239.0 240.1Tax on operating profit (35.4) (42.3)Amortisation and impairment of intangible assets (net of related tax) 38.7 33.7Share of results of Equity accounted investees Group income statement 45.3 42.8Adjustment for discontinued operations G 18.1 – 9.6
Return 287.6 283.9
Total assets Group balance sheet 3,098.7 2,483.0Current liabilities Group balance sheet (519.4) (398.3)Deferred tax liabilities Group balance sheet (160.3) (125.6)Less cash and cash equivalents Group balance sheet (224.6) (162.2)Less current financial liabilities Group balance sheet 48.9 30.3Less retirement benefit assets Group balance sheet (1.1) (1.7)Plus accumulated amortisation Note 17 301.3 243.1
Capital employed before acquisition adjustment 2,543.5 2,068.6Adjustment for acquisitions G 18.2 (242.8) 147.2
Capital employed 2,300.7 2,215.8Average capital employed 2,184.6 2,125.6
Return on capital employed 13.2% 13.4%
G 18.1 Adjustment for discontinued operations (Dairy Ireland):
Reference to the Financial Statements/Glossary
2017€’m
Operating profit – discontinued operations Note 10 9.9Amortisation net of tax 0.6Tax on EBIT (1.2)Share of results of Equity accounted for investees 0.3
Total adjustment for discontinued operations 9.6
G 18.2. Adjustment for acquisitionsThis adjustment is required to ensure the capital employed of the acquisitions (SlimFast (2018), Amazing Grass (2017) and Body & Fit (2017)) are appropriately time apportioned in the denominator.
G 19. Total Shareholder Return (TSR)TSR represents the change in the capital value of a listed quoted company over a period, plus dividends reinvested, expressed as a plus or minus percentage of the opening value.
TSR is one of the Group’s Key Performance Indicators (see pages 14 to 15). TSR is one of the performance conditions in Glanbia’s Long Term Incentive Plan. See Remuneration Committee report on pages 80 to 101 for more information.
G 20. Dividend Payout RatioDividend payout ratio is defined as the annual dividend per ordinary share divided by the Adjusted Earnings Per Share. The dividend payout ratio for 2017 is defined as the annual dividend per ordinary share divided by the pro-forma Adjusted Earnings Per Share as the Group believes it is more reflective of the revised and ongoing structure of the Group following the disposal of 60% of Dairy Ireland and related assets in 2017. The dividend payout ratio provides an indication of the value returned to shareholders relative to the Group’s total earnings.
Reference to the Financial Statements/Glossary
2018€ cent
2017€ cent
Pro–forma adjusted Earnings Per Share G. 8 91.01 87.11Dividend recommended/paid per ordinary share Note 15 24.20 22.00
Dividend payout % 26.6% 25.3%
G 21. Compound Annual Growth Rate (CAGR)The compound annual growth rate is the annual growth rate over a period of years. It is calculated on the basis that each year’s growth is compounded.
Glossary continuedKey Performance Indicators and non-IFRS performance measures continued

Glanbia plc | Annual Report and Financial Statements 2018
213
Shareholder Information
Stock exchange listingsThe Company’s shares are listed on the main market of the Euronext Dublin Stock Exchange as well as having a premium listing on the main market of the London Stock Exchange.
Managing your shareholding Computershare Investor Services (Ireland) Limited (“Computershare”) maintains the Company’s register of members. Should a shareholder have any queries in respect of their shareholding, they should contact Computershare directly using the contact details provided below:
Computershare Investor Services (Ireland) Limited, 3100 Lake Drive, Citywest Business Campus, Dublin 24, Ireland.
Contact details: Telephone number 01 247 5349 (within Ireland), +353 1 247 5349 (outside Ireland), or by logging on to: www.investorcentre.com/ie/contactus.
2018 2017
Share price data € €Share price as at financial year end 16.35 14.90Market capitalisation 4,840m 4,411mShare price movements during the year:– high 17.19 19.21– low 13.39 14.46
The current share price of Glanbia plc ordinary shares can be accessed at: http://www.glanbia.com/prices-delayed
Shareholder analysis
Geographic Location*Number of
shares held% of total
InstitutionalNorth America 69,506,742 23.5UK 32,772,308 11.1Rest of world 26,631,242 9.0Retail 73,859,151 24.9Glanbia Co-op Society Ltd 93,276,241 31.5
*This represents a best estimate of the number of shares held by geographic locations at 29 December 2018.
North America – 23.5% UK – 11.1% Rest of the World – 9.0% Retail – 24.9% Glanbia Co-op Society Ltd – 31.5%
Share capital The authorised share capital of the Company at 29 December 2018 was 350,000,000 ordinary shares at €0.06 each. The issued share capital at 29 December 2018 was 296,045,684 ordinary shares of €0.06 each.
Substantial shareholdingsThe table below details the significant holding (3% or more) in the Company’s ordinary share capital that has been disclosed to the Company at 29 December 2018 and 19 February 2019 in accordance with the requirements of Rule 7 of the Transparency Rules issued by the Central Bank under section 22 of the Investment Funds, Companies and Miscellaneous Provisions Act, 2006.
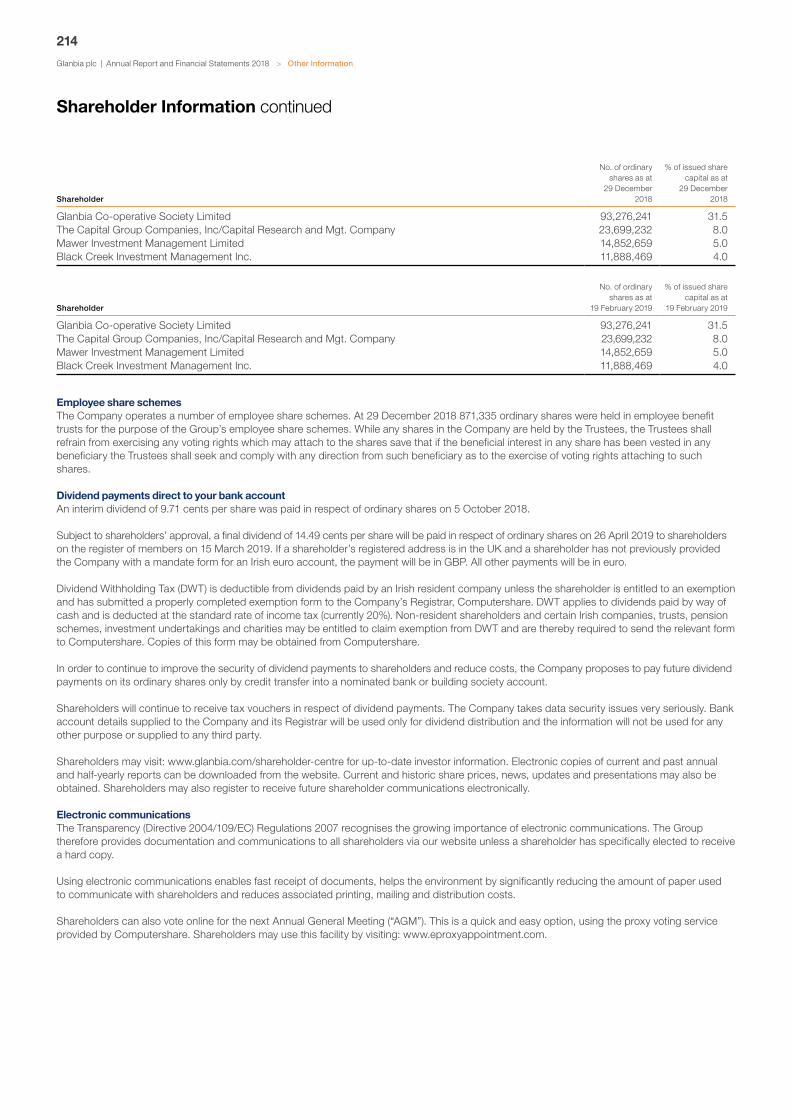
Glanbia plc | Annual Report and Financial Statements 2018
214
> Other Information
Shareholder Information continued
Shareholder
No. of ordinary shares as at
29 December 2018
% of issued share capital as at
29 December 2018
Glanbia Co-operative Society Limited 93,276,241 31.5The Capital Group Companies, Inc/Capital Research and Mgt. Company 23,699,232 8.0Mawer Investment Management Limited 14,852,659 5.0Black Creek Investment Management Inc. 11,888,469 4.0
Shareholder
No. of ordinary shares as at
19 February 2019
% of issued share capital as at
19 February 2019
Glanbia Co-operative Society Limited 93,276,241 31.5The Capital Group Companies, Inc/Capital Research and Mgt. Company 23,699,232 8.0Mawer Investment Management Limited 14,852,659 5.0Black Creek Investment Management Inc. 11,888,469 4.0
Employee share schemesThe Company operates a number of employee share schemes. At 29 December 2018 871,335 ordinary shares were held in employee benefit trusts for the purpose of the Group’s employee share schemes. While any shares in the Company are held by the Trustees, the Trustees shall refrain from exercising any voting rights which may attach to the shares save that if the beneficial interest in any share has been vested in any beneficiary the Trustees shall seek and comply with any direction from such beneficiary as to the exercise of voting rights attaching to such shares.
Dividend payments direct to your bank account An interim dividend of 9.71 cents per share was paid in respect of ordinary shares on 5 October 2018.
Subject to shareholders’ approval, a final dividend of 14.49 cents per share will be paid in respect of ordinary shares on 26 April 2019 to shareholders on the register of members on 15 March 2019. If a shareholder’s registered address is in the UK and a shareholder has not previously provided the Company with a mandate form for an Irish euro account, the payment will be in GBP. All other payments will be in euro.
Dividend Withholding Tax (DWT) is deductible from dividends paid by an Irish resident company unless the shareholder is entitled to an exemption and has submitted a properly completed exemption form to the Company’s Registrar, Computershare. DWT applies to dividends paid by way of cash and is deducted at the standard rate of income tax (currently 20%). Non-resident shareholders and certain Irish companies, trusts, pension schemes, investment undertakings and charities may be entitled to claim exemption from DWT and are thereby required to send the relevant form to Computershare. Copies of this form may be obtained from Computershare.
In order to continue to improve the security of dividend payments to shareholders and reduce costs, the Company proposes to pay future dividend payments on its ordinary shares only by credit transfer into a nominated bank or building society account.
Shareholders will continue to receive tax vouchers in respect of dividend payments. The Company takes data security issues very seriously. Bank account details supplied to the Company and its Registrar will be used only for dividend distribution and the information will not be used for any other purpose or supplied to any third party.
Shareholders may visit: www.glanbia.com/shareholder-centre for up-to-date investor information. Electronic copies of current and past annual and half-yearly reports can be downloaded from the website. Current and historic share prices, news, updates and presentations may also be obtained. Shareholders may also register to receive future shareholder communications electronically.
Electronic communications The Transparency (Directive 2004/109/EC) Regulations 2007 recognises the growing importance of electronic communications. The Group therefore provides documentation and communications to all shareholders via our website unless a shareholder has specifically elected to receive a hard copy.
Using electronic communications enables fast receipt of documents, helps the environment by significantly reducing the amount of paper used to communicate with shareholders and reduces associated printing, mailing and distribution costs.
Shareholders can also vote online for the next Annual General Meeting (“AGM”). This is a quick and easy option, using the proxy voting service provided by Computershare. Shareholders may use this facility by visiting: www.eproxyappointment.com.

Glanbia plc | Annual Report and Financial Statements 2018
215
Financial calendarAnnouncement of 2018 Full Year Results 20 February 2019Ex-dividend date 14 March 2019Record date for dividend 15 March 2019Date for receipt of proxy forms 22 April 2019Record date for AGM 22 April 2019AGM 24 April 2019Dividend payment date 26 April 2019
AGM The AGM will be held on 24 April 2019. The notice of meeting, together with details of the business to be conducted at the meeting will be available 20 business days before the meeting on: www.glanbia.com/agm.
The voting results for the 2019 AGM, including proxy votes and votes withheld will be available on our website shortly after the meeting at the following address: www.glanbia.com/agm.
Conditions for participating in a meeting Every shareholder, irrespective of how many Glanbia plc shares they hold, has the right to attend, speak, ask questions and vote at the AGM. Completion of a proxy form will not affect a shareholder’s right to attend, speak, ask questions and vote at the meeting in person.
The quorum for a general meeting of the Company is constituted by three persons entitled to vote upon the business of the meeting, each being a shareholder or a proxy or corporate representative for a shareholder.
The right to participate in the AGM is subject to the registration of the shares prior to the date of the meeting (the record date). For the 2019 AGM the record date is 5:00 pm on 22 April 2019 (or in the case of an adjournment 5:00 pm, on the day prior to the day before the time fixed for the adjourned meeting).
Appointment of proxyWhere a shareholder is unable to attend the AGM in person, a proxy (or proxies) may be appointed to attend, speak, ask questions and vote on their behalf. For this purpose a form of proxy is posted to all shareholders. Copies of these documents may be requested by telephoning the Company’s Registrar on 01 247 5349 (within Ireland), 00353 1 247 5349 (outside Ireland), or by logging on to www.investorcentre.com/ie/contactus or by writing to the Group Secretary at Glanbia plc, Glanbia House, Kilkenny, Ireland.
Alternatively, a shareholder may appoint a proxy electronically, by visiting: www.eproxyappointment.com and submitting their proxy details. They will be asked to enter the Control Number, the Shareholder Reference Number (“SRN”) and PIN and agree to certain terms and conditions. The Control Number, the SRN and the PIN can be found on the top of the form of proxy.
CREST members who wish to appoint a proxy or proxies through the CREST electronic proxy appointment service may do so for the meeting and any adjournment(s) thereof by using the procedures described in the CREST manual.
How to exercise shareholders rightsShareholders have several ways to exercise their right to vote:• by attending the AGM in person;• by appointing the Chairman or another person as a proxy to vote on their behalf;• by visiting www.eproxyappointment.com and submitting their proxy details; or• by appointing a proxy via the CREST system.
The passing of resolutions at a meeting of the Company, other than special resolutions, requires a simple majority. To be passed, a special resolution requires at least 75% of the votes cast to be in favour of the resolution.
Tabling agenda itemsA shareholder, or a group of shareholders acting together, who hold at least 3% of the issued share capital of the Company, has the right to put an item on the agenda of the AGM. In order to exercise this right, written details of the item to be included on the 2019 AGM agenda together with a written explanation why the item is to be included on the agenda and evidence of the shareholding must be received by the Group Secretary at Glanbia plc, Glanbia House, Kilkenny, Ireland or by email to [email protected] /[email protected] no later than 14 March 2019 (i.e. 42 days before the AGM).
An item cannot be included on the AGM agenda unless it is accompanied by the written explanation and received at either of these addresses by this deadline.
Glanbia plc | Annual Report and Financial Statements 2018
216
> Other Information
Tabling draft resolutionsA shareholder, or a group of shareholders acting together, who hold at least 3% of the issued share capital of the Company, has the right to table a draft resolution for inclusion on the agenda of the 2019 AGM subject to any contrary provision in company law.
In order to exercise this right, the text of the draft resolution and evidence of shareholding must be received no later than 14 March 2019 (i.e. 42 days before the AGM) by post to the Group Secretary at Glanbia plc, Glanbia House, Kilkenny, Ireland or by email to [email protected] /[email protected]. A resolution cannot be included on the 2019 AGM agenda unless it is received at either of these addresses by this deadline. Furthermore, shareholders are reminded that there are provisions in company law which impose other conditions on the right of shareholders to propose resolutions at the general meeting of a company.
How to ask a question before or at the meetingThe AGM is an opportunity for shareholders to put a question to the Chairman during the question and answer session. Before the 2019 AGM, a shareholder may also submit a question in writing by sending a letter and evidence of shareholding at least four business days before the 2019 AGM (i.e. 17 April 2019) to the Group Secretary, Glanbia plc, Glanbia House, Kilkenny, Ireland or by email to [email protected] /[email protected].
Dividend rights The Company may, by ordinary resolution, declare dividends in accordance with the respective rights of shareholders, but no dividend shall exceed the amount recommended by the Directors. The Directors may also declare and pay interim dividends if it appears to them that the interim dividends are justified by the profits of the Company available for distribution.
Distribution on winding upIf the Company shall be wound up and the assets available for distribution among shareholders shall be insufficient to repay the whole of the paid up or credited as paid up share capital, such assets shall be distributed so that, as nearly as may be, the losses shall be borne by shareholders in proportion to the capital paid up or credited as paid up at the commencement of the winding up on the shares held by them respectively. Further if, in a winding up, the assets available for distribution among shareholders shall be more than sufficient to repay the whole of the share capital paid up or credited as paid up at the commencement of the winding up, the excess shall be distributed among shareholders in proportion to the capital at the commencement of the winding up paid up or credited as paid up on the said shares held by them respectively.
Shareholder Information continued

Glanbia plc | Annual Report and Financial Statements 2018
217
Group Secretary and Registered OfficeMichael Horan, Glanbia plc, Glanbia House, Kilkenny, Ireland.
StockbrokersDavy Stockbrokers, 49 Dawson Street, Dublin 2, Ireland. (Joint Broker)
Jefferies Hoare Govett, Vintners Place, 68 Upper Thames Street, London EC4V 3BJ, United Kingdom. (Joint Broker)
AuditorDeloitte, Ireland LLP Deloitte & Touche House, Earlsfort Terrace, Dublin 2, Ireland.
SolicitorsArthur Cox, Earlsfort Centre, Earlsfort Terrace, Dublin 2, Ireland.
Pinsent Masons, 3 Colmore Circus, Birmingham B4 6BH, United Kingdom.
Principal BankersAllied Irish Banks, plcThe Governor and Company of the Bank of IrelandBarclays Bank Ireland plcDanske Bank A/SRabobank DublinUlster Bank Ireland DACCitibank N.A., London BranchBNP Paribas, Dublin BranchHSBC Bank plc
RegistrarComputershare Investor Services (Ireland) Limited, 3100 Lake Drive, Citywest Business Campus, Dublin 24, Ireland.
Contacts

Glanb
ia plc A
nnual Rep
ort and Financial Statem
ents 2018
Glanbia plcGlanbia HouseKilkennyIrelandTel: +353 56 777 2200Email: [email protected]