global entrepreneurship monitor 2014 report for belgium ... · global entrepreneurship monitor ......
TRANSCRIPT

STEUNPUNT ONDERNEMEN EN REGIONALE ECONOMIE NAAMSESTRAAT 61 – BUS 3550 BE-3000 LEUVEN TEL + 32 16 32 66 61 | FAX + 32 16 37 35 11
[email protected] www.steunpuntore.be
STORE-B-15-009
Global Entrepreneurship Monitor 2014
Report for Belgium & Flanders
Tine Holvoeta, Niels Bosmaa,b & Hans Crijnsa 1
aVlerick Business School bUtrecht University School of Economics
December 2015
1 This report reflects the opinion of the authors and not those of the Flemish Government. The Flemish
Government is not liable for any use that might be made of the data included in this publication.

1
CONTENTS
1. INTRODUCTION 2
1.1. The Global Entrepreneurship Monitor 2
1.2. Reporting Philosophy and Reader Guide 3
1.3. Policy Research Center STORE 3
2. THE GEM PROJECT 3
2.1. GEM Methodology: Key Issues 4
2.2. The GEM Model 5
3. ADULT POPULATION SURVEY: ATTITUDES, ACTIVITY,
GROWTH ASPIRATIONS 7
3.1. Entrepreneurial Attitudes 7
3.1.1.Individual Self-Perceptions 7
3.1.2.National Societal Impressions 11
3.2. Entrepreneurial Activities: phases of entrepreneurial activity 12
3.2.1.Total early-stage Entrepreneurial Activity 13
3.3. Entrepreneurial Aspirations 17
3.3.1.Growth-orientation (job creation) 17
3.3.2.Innovative orientation 18
3.3.3.International orientation 19
3.4. Entrepreneurial Employee Activity 20
4. NATIONAL EXPERT SURVEY (NES): CONDITIONS FOR
ENTREPRENEURSHIP 21
4.1. Entrepreneurial Framework Conditions (EFCs) 21
4.2. The state of the entrepreneurship ecosystem in 2014 21
5. CONCLUSION 24
5.1 Individual Self-Perceptions 24
5.2 National Societal Impressions 24
5.3 Entrepreneurial Activity 25
5.4 Entrepreneurial Motivation 25
5.5 Entrepreneurial Aspirations 25
5.6 Conditions for Entrepreneurship 25
5.7 Overview for Belgium and Flanders 26
REFERENCES 29
Annex I: Definitions of Main Measures 31
Annex II: NES Experts 2014 32

2
1. INTRODUCTION The Global Entrepreneurship Monitor offers insights in entrepreneurial attributes and activities both individually and globally. In this report for Belgium and Flanders we present a very specific set of indicators that allow to measure entrepreneurial activity rates, and to obtain insights in entrepreneurial attitudes of the adult population in Belgium and the Flemish Region2 and in the growth aspirations of (prospective) business owner-managers. For the Belgian GEM Adult Population Survey, data from 2004 respondents was collected in 2014 (from 28 August until 27 September) by vendor TNS Dimarso and analyzed by Vlerick Business School in 2015. In addition, 29 experts’ views are added to explore further the Belgian entrepreneurship ecosystem. GEM was initially conceived in 1997, and the first report was published in 1999. The first cycle for Belgium and Flanders was completed in 2001. The survey, that started as an initiative of two researchers (Michael Hay, London Business School, and Bill Bygrave, Babson College) in 1997, by asking a simple question (“Why are some countries more entrepreneurial than others?”), evolved into a global survey conducted annually, which covers all the regions in the world (Africa, Latin America & Caribbean, Asia & Oceania, Europe, North America). The 2014 global GEM survey covered 73 economies, representing 72.4% of the world’s population and 90% of the world’s GDP. These global findings are reported by Singer et al. (2015) in the GEM 2014 Global Report. The continuity of this world’s largest survey on entrepreneurship would not be possible without the financial support of many national sponsors (ministries, government agencies, banks, universities, chambers of commerce, international development organizations), as well as of four global sponsors: Babson College (U.S.A.), Universidad del Desarrollo (Chile), University Tun Abdul Razak (Malaysia), and as of 2015 the Tecnologico de Monterrey (Mexico). In Belgium, GEM 2014 is made possible with support of the Flemish Government. The GEM findings for Belgium and Flanders are collected, analyzed and reported within the framework of the Policy Research Centre for Entrepreneurship & Regional Economics (STORE).3
1.1. The Global Entrepreneurship Monitor As shared definitions, approaches and agreed operational definitions are scarce in the academic field of entrepreneurship (Holvoet et al. 2013), GEM responds to a persistent need for comparable measures on entrepreneurial attitudes, activities and performance4. To this end a carefully designed, harmonized approach was developed. After the first study appeared in 1999, a few years were required for the GEM methodology to establish itself and to come up with consistent measures of entrepreneurship. For GEM the idea has, from the start, been that for measuring entrepreneurship, the level of the individual (the entrepreneur or the potential entrepreneur) should be put central. Consequently GEM sets of from a behavioral perspective and not an occupational one, and focusses on the entrepreneurial process rather than on the event of business startup. This in contrast to many monitoring instruments based on administrative data on the company level. The main advantages of this method are (1) the international comparability over different country-specific administrative regulations, (2) the possibility to also detect latent entrepreneurship and (3) inform on less tangible elements of entrepreneurial culture such as entrepreneurial mentality. GEM data collection is based on an annual adult population survey (APS) directed to individuals in all participating economies and views from national experts (NES) to gain insights on important conditions for fostering entrepreneurial activity5. The results are published in annual GEM Global Reports as well as GEM National reports, all available on www.gemconsortium.org. Additionally, GEM introduces annually a ‘special topic’ and has shed light on topics such as entrepreneurship and well-being, entrepreneurial finance (informal investment), women entrepreneurship, entrepreneurship education & training, social entrepreneurship, entrepreneurial employees, entrepreneurship and migration.
2 In the remainder of this document we define Flanders in correspondence with the European Nuts1 classification, meaning the region of Flanders excluding Brussels. Respondents to the Belgian part of the GEM Adult Population survey are regionally stratified based on their domicile address. 3 For more information, visit http://steunpuntore.be. 4 Wennekers & Thurik (1999) for example detect no less than 13 definitions for 'entrepreneurship' only within the economic field and also Karlsson, Friis & Paulsson (2005) note how broad theoretical constructs are distinct from their operational counterparts that are most often only focusing on limited aspects of entrepreneurial behavior. 5 These National Expert Surveys (NES) data are available for Belgium for 2001-2007, 2009, 2012-2014.

3
1.2. Reporting Philosophy and Reader Guide This report is targeted at readers from a wide audience with specific interest in the entrepreneurial performance of Belgium and Flanders. To further enable policy makers to derive conclusions from the GEM results, the results of the main indicators are presented in three different ways throughout the report:
- Tables that capture the most recent outcomes of the GEM Adult Population Survey, for Belgium as a whole, for Flanders, for a set of seven benchmark economies (Denmark, France, Germany, Luxembourg, Netherlands, Spain and the United Kingdom)6 and for the remaining 21 innovation-driven economies that were part of the 2014 GEM assessment.7
- Figures that highlight the development of the main measures over time, for Belgium and Flanders.
- Spider diagrams that highlight the overall ‘profiles’ of entrepreneurial attitudes and entrepreneurial activities, in an international context.
Furthermore, for some indicators, GEM data for several years have been merged to yield more precise estimates. In particular this concerns measures on entrepreneurial aspirations and demographic characteristics of entrepreneurial attitudes and (early-stage) entrepreneurial activity. In case there are differences in outcomes, for example between countries or between specific groups in the Belgian or Flemish population, we address the statistical significance of these differences. The next chapter discusses the origin and development of the GEM project and highlights the key methodological issues. It also discusses the conceptual model that drives GEM research and that highlights entrepreneurial attitudes, activities and aspirations as dynamic components of the entrepreneurial profile in national economies. Therefore, chapters 3-4 describe the main GEM 2014 Adult Population and Expert Survey results. Finally, Chapter 5 concludes.
1.3. Policy Research Center STORE From 2012 to 2015 the GEM research for Belgium is conducted within the framework of the Policy Research Centre for Entrepreneurship & Regional Economics (STORE8), formerly STOIO and STOOI. The GEM databank is an important indicator for the consortium that has as its main task to advise the Flemish Government on entrepreneurship and regional economy by fundamental and applied economic research excellence. Vlerick Business School, representing the Belgium national team since 2001, is providing the annual assessment on the framework conditions of entrepreneurship and the level of entrepreneurial attitudes, activity and aspirations in Belgium and Flanders. Yearly, both an extensive report on Belgium and Flanders (English) and an executive summary (Dutch) inform on the major findings. Also, we aggregate our insights in a synthesis report for 2011-2015 (STORE-B15-011).
2. THE GEM PROJECT The Global Entrepreneurship Monitor was conceived in 1997 by Michael Hay of London Business School (LBS) and Bill Bygrave of Babson College. LBS and Babson funded a prototype study that year. Ten national teams conducted the first GEM Global study in 1999 with Paul Reynolds as the principal investigator. The Belgium national team, represented by Vlerick Business School, is participating since 2001. The Global Entrepreneurship Research Association (GERA) was formed in 2004 to serve as the oversight body for GEM. GERA is a not-for-profit organization governed by representatives of the national teams, the two founding institutions and sponsoring institutions. GERA’s mission is to contribute to global economic development through entrepreneurship. To achieve this, GERA seeks to increase worldwide knowledge about entrepreneurship by conducting and disseminating world-class research that:
- Uncovers and measures factors impacting the level of entrepreneurial activity among economies.
- Aids in identifying policies that may lead to appropriate levels of entrepreneurial activity, and - Increases the influence of education in supporting successful entrepreneurship.
GEM focuses on three main objectives:
- To measure differences in entrepreneurial attitudes, activity and aspirations among economies. - To uncover factors determining the nature and level of national entrepreneurial activity. - To identify policy implications for enhancing entrepreneurship in an economy.
6 These reference countries are selected based on both geographic region, institutional setting and economic development level. 7 GEM adopts the categorization for innovation-driven economies from the Global Competitiveness Report (http://www3.weforum.org). Also included were 32 efficiency-driven economies and 11 factor-driven economies (see Singer et al., 2015). 8 Steunpunt Ondernemen en Regionale Economie. For more information, visit http://steunpuntore.be.

4
GEM is based on the following premises. First, an economy’s prosperity is highly dependent on a dynamic entrepreneurship sector. While this is true across all stages of development, the nature of this activity can vary in character and impact. Necessity-driven entrepreneurship, particularly in less developed regions or those experiencing declines in employment, can help an economy benefit from self-employment initiatives when there are fewer work options available. More developed economies, on the other hand, generate entrepreneurial opportunities as a result of their wealth and innovation capacity, yet they also offer more wage employment options to attract those that might otherwise become independent entrepreneurs. If these opportunities for entrepreneurship and innovation are to be captured, such economies need to instill opportunity-based motives and entrepreneurial incentives. Second, an economy’s entrepreneurial capacity is based on individuals with the ability and motivation to start businesses, and may be strengthened by positive societal perceptions about entrepreneurship. Entrepreneurship benefits from participation by all groups in society, including women, disadvantaged minorities and a range of age groups and education levels. Finally, high-growth entrepreneurship is a key contributor to new employment in an economy, and national competitiveness depends on innovative and cross-border entrepreneurial ventures.
2.1. GEM Methodology: Key Issues While entrepreneurship is a multifaceted phenomenon with many different meanings and definitions, GEM operationalizes entrepreneurship as:
“Any attempt at new business or new venture creation, such as self-employment, a new business organization, or the expansion of an existing business, by an individual, a team of individuals, or an established business.”
Thus, while GEM defines entrepreneurship rather narrowly as new business activity, it takes a broad view of what it recognizes (new) business activity to be. For example, unlike many official records of new business activity, GEM’s definition is not restricted to newly registered businesses. GEM thus adopts the behavioral perspective of entrepreneurship, looking further than individuals officially registered as self-employed, for example by identifying employees within organizations who behave entrepreneurially and individuals who can be characterized as ‘latent’ or ‘nascent’ entrepreneurs without having registered their business (yet). GEM looks at entrepreneurship as a process rather than a (start-up or discontinuation) event. For years GEM has focused on the phase that combines the stage in advance of the start of a new firm (nascent entrepreneurship, this is being involved in a new business for less than 3 months) and the stage directly after the start of a new firm (owning-managing a new firm, this is being involved in a new business for less than 42 months). Taken together this phase is denoted as “total early-stage entrepreneurial activity” (TEA)9. In addition, individuals with entrepreneurial attitudes – potentially leading to nascent entrepreneurial activity – and individuals involved as owner-managers in established or discontinuing firms are identified. Recently, GEM also identified Entrepreneurial Employee Activity (EEA) as a relevant type of entrepreneurial activity. Dependent on individual drivers, organizational contexts and macro-level (institutional) characteristics, individuals may opt to pursue their entrepreneurial ambitions as an employee rather than being self-employed. Fig. 2.1 shows some details of the processes individuals may go through, as conceptualized by the GEM research framework. There is also a potential overlap between TEA and EEA, in the sense that individuals who are starting a venture for their employer may be, or expect to be, one of the owner-managers of that venture. The GEM data suggest that this concerns a minor share of the entrepreneurial employees (Bosma et al. 2013a, p. 8).
9 The acronym TEA originally expressed “total entrepreneurial activity”. Here, the word ‘total’ was meant to capture the ‘total’ collection of new firm activities, including agriculture. This led to some confusion (see e.g. Hindle 2006) as the suggestion was made that, for instance; also entrepreneurial activities in established firms were captured in the measure. Hence, the words ‘early-stage’ are usually included in describing the TEA acronym that has been retained, as the measure itself has not been altered since 2001.

5
Fig. 2.1 The Entrepreneurship Process and GEM Operational Definitions
Source: Bosma et al. (2013)
2.2. The GEM Model Since its inception, GEM has sought to explore the two-way link between entrepreneurship and economic development globally (Wennekers and Thurik, 1999; Carree and Thurik, 2003; Acs, 2006; Audretsch 2007). The complexity of these causal relationships was revised, identifying different types and phases of entrepreneurship (Bosma et al., 2009; Bosma and Levie, 2010).10 The revised model introduced a more nuanced distinction between phases of economic development, in line with Porter’s typology of “factor-driven economies”, “efficiency-driven economies” and “innovation-driven economies” (Porter et al., 2002), and recognized that GEM’s unique contribution was to describe and measure, in detail, the conditions under which entrepreneurship and innovation can thrive. The revised model also incorporates the three main components that capture the multi-faceted nature of entrepreneurship: entrepreneurial attitudes, entrepreneurial activity, and entrepreneurial aspirations. They are included in the model as components of a “black box” that produces innovation, economic growth and job creation, without spelling out in detail how they affect and reinforce each other. This ambiguity was deliberate; it reflected the view that all three elements may affect each other rather than being components of a linear process and it was expected that further theoretical and empirical work would open up this black box. While the first model included capability and opportunity, it was never clear – and scholars still dispute – whether these are objective realities or subjective constructs, and aspiration was notably absent from the model. Aspiration or ambition is relevant because researchers increasingly realize that all entrepreneurial activity does not equally contribute to development. For example, in many countries, much employment creation comes from a small number of ambitious, fast-growing new businesses (Autio, 2007). Furthermore, potentially ambitious entrepreneurs react differently to different regulatory and legal regimes than those who are less ambitious (Levie and Autio, 2011). Finally, the revised GEM model highlights the contributions of entrepreneurial employees as well as their role as potential future independent entrepreneurs. The current GEM conceptual model is shown in Figure 2.2.
10 See Levie and Autio (2008) for a theoretical grounding and e.g. Shane (2009) for the importance of identifying differences in types and phases of entrepreneurship.
Total Early-stage Entrepreneurial Activity (TEA)
Discontinuance
Potential Entrepreneurs: Beliefs and Attitudes Nascent Established New
Entrepreneurship Phases
Intentions
Preparation and Exploitation Idea Development
Entrepreneurial Employee Activity Phases
Potential Entrepreneurial Employees: Individual Drivers, Organizational Context and Institutional Levers

6
Fig. 2.2 GEM Conceptual Model
Source: Kelley et al. (2012) Based on an understanding of how economies change as they develop, the revised GEM model incorporates the changing nature and contribution of entrepreneurship across subsequent stages of development (Porter et al., 2002). The appropriate government emphasis for each stage of development is described in Figure 2.3. At the so-called factor-driven stage, production is based upon the mobilization of primary factors of production: land, primary commodities and unskilled labor. For factor-driven economies, economic development is primarily driven by improvements of basic requirements: development of institutions, infrastructure, macroeconomic stability and health and primary education. In efficiency-driven economies, at the next stage, government focus is (or should be) on getting labor and capital markets working more properly, attracting foreign direct investment and educating the workforce to successfully adopt technologies developed elsewhere. The key processes in moving from the first to the second stage are capital accumulation and technological diffusion (Wennekers et al., 2005). Even though these conditions are not directly related to entrepreneurship in the Schumpeterian sense of “creative destruction”, they are indirectly related since the development of markets will also attract and enable more opportunity-based entrepreneurship. Finally, countries whose economic development is primarily innovation-driven, innovate at the global technological frontier in at least some sectors (Porter et al., 2002). This stage also implies higher per capita income. The transition to this stage requires a country to develop its ability to generate as well as commercialize new knowledge (Wennekers et al., 2005). As countries develop economically, entrepreneurial framework conditions become more important to further economic development. The outcome of the model is national economic development in terms of innovation, job creation and social value creation. In this report we focus on innovation-driven economies and a selection of benchmark countries in particular. These benchmark countries are Denmark, France, Germany, Luxembourg, the Netherlands, Spain and the United Kingdom – countries that are close to Belgium both physically and in terms of the geographic, institutional and economic setting.
Social, Cultural,Political Context
Basic requirements
- Institutions- Infrastructure- Macroeconomic stability- Health and primary
educationEstablished Firms
Socio-Economic Development
(Jobs, Innovation, Social value)
Efficiency enhancers
- Higher education & training
- Goods market efficiency- Labor market efficiency- Financial market
sophistication- Technological readiness- Market size
Innovation and entrepreneurship
- Entrepreneurial finance- Government policy- Government
entrepreneurship programs
- Entrepreneurship education
- R&D transfer- Internal market openness- Physical infrastructure for
entrepreneurship- Commercial, legal
infrastructure for entrepreneurship
- Cultural and social norms
Attitudes:Perceived opportunities & capabilities; Fear of Failure; Status of entrepreneurship
Aspirations:Growth, InnovationInternational orientationSocial value creation
Activity:Opportunity/Necessity-driven, Early-stage; Inclusiveness; Industry; Exits
Entrepreneurship Profile
From other available sources Entrepreneurial
EmployeeActivity
From GEM
National ExpertSurveys (NES)
From GEM Adult PopulationSurveys (APS)
From GEM 2011 Adult Population Surveys (APS)

7
Fig. 2.3 Characteristics of Economic Groups & Key Development Focus
3. ADULT POPULATION SURVEY: ATTITUDES, ACTIVITY, GROWTH ASPIRATIONS
In 2014, more than 206.000 adults across 73 economies took part in the GEM survey. GEM research teams in each economy administered this annual survey to at least 2.000 adults. Belgium is participating in GEM since 2001. The GEM harmonization process allows exploring patterns over time and across countries. In 2014 a representative sample of 2,004 individuals in the population between 18-64 years was ensured. This telephone survey (fixed line via national telephone directory and mobile via random digital dialing) covered 1,178 individuals in Flanders (and an additional 191 for Brussels Capital Region and 635 for Wallonia).11 Respondent selection within a household was based on the next birthday method. This implies that after contacting a household, the person to be interviewed is the (adult) person in the household whose birthday is closest. In case this person is not available at the first contact with the household, new attempts are scheduled up to five of such ‘call backs’. The sample for landline phones was stratified by geographic region and additionally used quotas on gender and age.12 In this chapter we will report in detail on the Adult Population Survey data gathered in 2014 (from 28 August until 27 September) by vendor TNS Dimarso and analyzed by Vlerick Business School in 2015.
3.1. Entrepreneurial Attitudes
3.1.1. Individual Self-Perceptions Since entrepreneurship is primarily an individual-level phenomenon, perceptions that relate to opportunity recognition, skills and risk attitude can be important predictors of future entrepreneurial activity. However, even though important, the perception of for instance existing opportunities for startups and that of (matching) personal capabilities do not necessarily represent sufficient determinants of making the step to entrepreneurial activity. McMullen and Shepherd (2006) for instance, argue that individuals first react to opportunities when they are presented to them – only afterwards considerations about desirability and feasibility are made. Fear of failure when it comes to starting a business (and the consequences of failure) could also deter an individual from exploiting perceived entrepreneurial opportunities. Next to these individual characteristics also elements of the context, such as the availability of (good) job alternatives in an economy can make a difference for those perceiving market opportunities and having confidence in their own entrepreneurial capabilities to actually engage in independent entrepreneurial activity or not. GEM provides insight into perceptions towards entrepreneurial activity by asking the individuals in the GEM adult population the following questions:
- Do you know someone personally who started a business in the past 2 years? - In the next six months, do you see good opportunities to start a business in the area where
you live? - Do you have the skills and knowledge required to start a business yourself? - Would fear of failure prevent you from starting a business?
11 This report adopts the Nuts1 classification, meaning the region of Flanders excluding Brussels. Respondents are regionally stratified based on their domicile address. 12 For more information on GEM data collection in general we refer to the GEM Manual that is available on www.gemconsortium.org.
Factor-Driven Economies
Innovation-Driven Economies
Increased industrialization and economies of scale. Large firms dominate, but supply chain niches open up for small and medium enterprises.
Basic Requirements
From subsistence agriculture to extraction of natural resources, creating regional scale-intensive agglomerations.
R&D, knowledge intensity, and expanding service sector. Greater potential for innovative entrepreneurial activity.
Efficiency-Driven Economies
Efficiency Enhancers Entrepreneurship & Innovation Conditions

8
In addition, the respondents are asked whether they have startup intentions, i.e. if they expect to start a business within the next three years:
- Are you, alone or with others, currently trying to start a new business, including any self-employment or selling any goods or services to others?
- Are you, alone or with others, currently trying to start a new business or a new venture for your employer as part of your normal work?
Taken together, these measures provide an indication of the entrepreneurial culture across economies. In an empirical study explaining and linking entrepreneurial attitudes and activities for European regions using GEM data, Bosma and Schutjens (2011) find (only) a weakly positive relation between regional variations in entrepreneurial perceptions and those in entrepreneurial activity. This supports the notion that there is much in between. So, while positive attitudes and perceptions towards entrepreneurship may be instrumental in achieving new (high-value) entrepreneurial activities in some societies, it does certainly not form a sufficient condition for entrepreneurial activity in many societies. Bearing this in mind, we can see in Table 3.1 how innovation-driven countries compare to each other in terms of entrepreneurial perceptions and attitudes as measured through the most recent GEM APS.
Table 3.1 Individual Self-Perceptions, 2014 (% 18-64 pop.)
Perceived Opportunities
Perceived Capabilities
Fear of Failure *
Startup Intentions **
Belgium 36 30 49 11
Flanders 41 29 50 9
Benchmark Economies
Denmark 60 35 41 7
France 28 35 41 14
Germany 38 36 40 6
Luxembourg 43 38 42 12
Netherlands 46 44 35 9
Spain 23 48 38 7
United Kingdom 41 46 37 7
Average 40 40 39 9
Other Innovation-driven Economies
Australia 46 47 39 10
Austria 44 49 35 8
Canada 56 49 37 12
Estonia 49 42 42 10
Finland 42 35 37 8
Greece 20 46 62 10
Ireland 33 47 39 7
Italy 27 31 49 11
Japan 7 12 55 3
Norway 63 31 38 5
Portugal 23 47 38 16
Puerto Rico 25 49 24 12
Qatar 63 61 26 50
Singapore 17 21 39 9
Slovakia 24 54 36 15
Slovenia 17 49 29 11
Sweden 70 37 37 8
Switzerland 44 42 29 7
Taiwan 33 29 37 26
Trinidad & Tobago 59 75 17 34
United States 51 53 30 12
Average all innovation-driven economies
39 42 38 12
* Fear of failure measured only for the respondents who perceive good opportunities to start a business. ** Startup intentions measured only for the respondents who are currently not actively involved in entrepreneurial activity (as a nascent entrepreneur or owner-manager in new/established firm).

9
Perceived opportunities differ widely between the benchmark economies. Belgium and Flanders score higher than for instance France and Spain, but much lower than Denmark. Whereas perceived opportunities in Belgium and Flanders are roughly on the same level as in Germany, the Netherlands and UK, the other indicators for self-perceptions towards entrepreneurial activity show a less positive picture. Perceived skills to start a business are reported by only 3 in every 10 persons. All other benchmark economies score higher on this indicator (average in the benchmark economies is 4 in 10). Regarding fear of failure, in none of the other benchmark countries, we see the high level of fear of failure among those who see good opportunities to start a business. In Belgium and Flanders, about five in ten individuals who see such opportunities state that fear of failure would prevent them from actually starting a business. We see similar rates in Italy and Japan, only in Greece, we see more fear of failure. Startup intentions for Belgium (those expecting to start a business in the next three years excluding the individuals who are already active in setting up or owning-managing a business) are roughly similar to the benchmark economies, except for France and Luxembourg. Developments for Belgium and Flanders over time are shown in Figures 3.1 (for Belgium) and 3.2 (for Flanders). It shows that, while intentions to start a business increase, fear of failure when it comes to starting a business tends to increase as well. This would not have been a serious issue if those who are expecting to start a business are free from fear of failure. However, additional analysis shows that even though individuals that intend to start a business do have significantly lower levels of fear of failure, the percentage is still rather high. In Flanders the percentage of people indicating that fear of failure would prevent them from starting a business, among those who intend to start a business, equals 42% (for Belgium: 39%), taken over the period 2011-2014. Fig. 3.1 and 3.2 demonstrate that the measure of perceived business opportunities is rather dynamic; it should be noted that these are perceptions that may represent the sentiment on business opportunities even though the actual pursuit of business opportunities may prove to be more stable. In 2014, almost 4 in 10 persons see opportunities to start-up. One in 10 persons currently not actively involved in entrepreneurial activity, intends to effectively set up a new company within the next three years. The 2014 scores for Belgium and Flanders confirm fear of failure to be an important structural barrier for latent entrepreneurs who see good opportunities. Half of respondents who feel there are good opportunities for the launch of a new company also state that fear of failure keeps them from moving forward. This indicator shows an upward trend over the past five years.
Fig. 3.1 Development Individual Self-Perceptions Belgium 2001-2014
- Fear of failure measured only for the respondents who perceive good opportunities. - Startup intentions measured only for the respondents who are currently not actively involved in
entrepreneurial activity (as a nascent entrepreneur or owner-manager in new/established firm).
2001 2002 2003 2004 2005 2006 2007 2008 2009 2010 2011 2012 2013 2014
Perceived opportunities to start business inthe next 6 months
20% 16% 18% 38% 43% 15% 16% 14% 15% 40% 43% 33% 31% 36%
Perceived skills & knowledge to startbusiness
30% 35% 35% 39% 44% 35% 37% 36% 37% 45% 44% 37% 34% 30%
Fear of failure for those perceivingopportunities
38% 31% 26% 32% 29% 36% 28% 33% 28% 37% 41% 41% 47% 49%
Intentions to start a business for those notactive in entrepreneurship
5% 5% 6% 6% 6% 6% 6% 5% 8% 11% 9% 8% 11%
0%
10%
20%
30%
40%
50%
60%
Pe
rce
nta
ge o
f in
div
idu
als
in t
he
18
-64
po
pu
lati
on

10
Fig. 3.2 Development Individual Self-Perceptions Flanders 2001-2014
- Fear of failure measured only for the respondents who perceive good opportunities. - Startup intentions measured only for the respondents who are currently not actively involved in
entrepreneurial activity (as a nascent entrepreneur or owner-manager in new/established firm).
Regarding perceived capabilities to start a business, a rather stable indicator, we do note the lowest score in a decade. Perceived skills are particularly low for women. Based on the pooled GEM data from 2011-2014, the prevalence rate of perceived skills among women equals to only 22% in Flanders (compared to 43% for men). For Belgium as a whole, the prevalence rates amount to 26% for women and 45% for men. Gender gaps also exist in the benchmark countries, but the score for women in Flanders believing in their own capabilities to start-up is the lowest in the benchmark (see Fig. 3.3).
Fig. 3.3 Gender Gap: Perceived Skills & Knowledge to Start a Business 2011-2014
2001 2002 2003 2004 2005 2006 2007 2008 2009 2010 2011 2012 2013 2014
Perceived opportunities to start business inthe next 6 months
21% 13% 16% 39% 40% 12% 21% 13% 13% 38% 40% 33% 34% 41%
Perceived skills & knowledge to startbusiness
33% 37% 37% 40% 47% 36% 42% 39% 38% 41% 40% 37% 33% 29%
Fear of failure for those perceivingopportunities
36% 26% 25% 34% 26% 26% 24% 32% 22% 36% 39% 42% 47% 50%
Intentions to start a business for those notactive in entrepreneurship
3% 3% 4% 6% 3% 6% 5% 4% 7% 8% 8% 6% 9%
0%
10%
20%
30%
40%
50%
60%
Pe
rce
nta
ge o
f in
div
idu
als
in t
he
18
-64
po
pu
lati
on
0%
10%
20%
30%
40%
50%
60%
Male
Female

11
3.1.2. National Societal Impressions
Another way of addressing entrepreneurial culture is to assess the visibility and attractiveness of entrepreneurship in a country. Here the GEM Adult Population Survey provides 3 relevant questions:
- In Belgium, starting a business is considered as a good career choice - In Belgium, persons growing a successful business receive a high status
- In Belgium, there is lots of positive media coverage for new businesses We should stress that all individuals in the Belgian sample answered these questions for Belgium as a country. However, there may still be regional differences in societal impressions in terms of media coverage for example, certainly since most of the relevant media tend to cover regions rather than countries. Table 3.2 shows that the results for Belgium and Flanders compare well with each other; differences are not statistically different. For Belgium and Flanders, about half of the respondents agree that entrepreneurship is a good career choice, that successful entrepreneurs receive high status and
confirm positive media attention for entrepreneurship. Compared internationally, the score for status of successful entrepreneurs is again remarkably low. In 2014, in the European Union, only Spain and Croatia score lower on this indicator. This is in line with our findings on entrepreneurial mentality reported in Holvoet et al. (2015): the status perception of entrepreneurs is a structural barrier for entrepreneurship. Nevertheless, we see that media attention for entrepreneurship is catching up with the benchmark.
Table 3.2 National Societal Impressions, 2014 (% 18-64 pop.)*
Entrepreneurship as a good career choice
High Status to successful entrepreneurs
Media attention for entrepreneurship
Belgium 52 52 51
Flanders 53 54 50
Benchmark Economies
Denmark
France 59 70 39
Germany 52 79 51
Luxembourg 41 68 44
Netherlands 79 68 56
Spain 54 49 46
United Kingdom 60 75 58
Average 58 68 49
Other Innovation-driven Economies
Australia 53 67 73
Austria
Canada 57 70 68
Estonia 56 65 43
Finland 41 84 67
Greece 58 66 46
Ireland 49 77 76
Italy 65 72 48
Japan 31 56 59
Norway 58 83
Portugal 62 63 70
Puerto Rico 19 51 73
Qatar 76 87 77
Singapore 52 63 79
Slovakia 45 58 53
Slovenia 53 72 58
Sweden 52 71 60
Switzerland 42 66 50
Taiwan 75 63 84
Trinidad & Tobago 79 69 66
United States 65 77 76
Average all innovation -driven economies
55 68 60
* These data have not been collected in Austria and Denmark. The indicator on media attention for entrepreneurship has not been included in the survey in Norway ).

12
Fig. 3.4 Development National Societal Impressions Belgium 2003-2014
Fig. 3.5. Development National Societal Impressions Flanders 2003-2014
3.2. Entrepreneurial Activities: phases of entrepreneurial activity As shown in Figure 2.1 earlier in this report, GEM conceptualizes entrepreneurship as a continuous process that includes nascent entrepreneurs involved in setting up a business, entrepreneurs who own and manage a new business and entrepreneurs who own and manage an established business.13 In addition, GEM assesses the rate and nature of business discontinuations. As a result, indicators on several phases of the entrepreneurial process are available. In this section we elaborate on these phases of entrepreneurial activity. As usual, most attention is paid to the phase of early-stage
13 For a more detailed explanation of these measures, see Annex I.
2001 2002 2003 2004 2005 2006 2007 2008 2009 2010 2011 2012 2013 2014
Belief: starting a business is considered as agood carreer choice
56% 71% 67% 47% 45% 47% 46% 60% 64% 62% 55% 52%
Belief: persons growing a succesful newbusiness receive high status
54% 69% 72% 53% 51% 46% 49% 51% 55% 57% 52% 52%
Belief: lots of media coverage for newbusinesses
40% 40% 48% 37% 37% 38% 33% 46% 47% 54% 44% 51%
0%
10%
20%
30%
40%
50%
60%
70%
80%
Pe
rce
nta
ge o
f in
div
idu
als
in t
he
18
-64
po
pu
lati
on
2001 2002 2003 2004 2005 2006 2007 2008 2009 2010 2011 2012 2013 2014
Belief: starting a business is considered as agood carreer choice
57% 75% 66% 46% 44% 43% 44% 63% 68% 66% 58% 53%
Belief: persons growing a succesful newbusiness receive high status
52% 69% 74% 54% 51% 44% 48% 53% 59% 60% 54% 54%
Belief: lots of media coverage for newbusinesses
42% 48% 52% 42% 43% 41% 37% 45% 48% 55% 41% 50%
0%
10%
20%
30%
40%
50%
60%
70%
80%
Pe
rce
nta
ge o
f in
div
idu
als
in t
he
18
-64
po
pu
lati
on

13
entrepreneurial activity. This is the phase that is crucial for most entrepreneurs, while at the macro level, most dynamism, future job creation and innovation can be expected from this group of entrepreneurs.
3.2.1. Total early-stage Entrepreneurial Activity An economy’s Total early-stage Entrepreneurial Activity (TEA) rate is defined as the prevalence rate of individuals in the working age population who are actively involved in business startups, either in the phase in advance of the birth of the firm (nascent entrepreneurs), or the phase spanning 42 months after the birth of the firm (owner-managers of new firms). As such, GEM takes the payment of any wages for more than three months as the ‘birth event’ of the firm. Several other definitions for what constitutes the birth of a firm have been put forward in the entrepreneurship literature, using different perspectives. The payment of wages proved to be the best approach for making international comparisons. Individuals who are actively committing resources to start a business (that they expect to own or co-own) but for whom the business has not yet yielded wages or salaries are labeled nascent entrepreneurs. The individuals who did pass this ‘birth event’ but are operational for less than 42 months are labeled as owner-managers in new firms. The cut-off point of 42 months has been based on a combination of theoretical and practical considerations.14 Table 3.3 shows the prevalence rates of TEA, as well as those of its two components (nascent entrepreneurs and owner-managers in new firms), established entrepreneurship and discontinuations by owner-managers.
Table 3.3 Phases of Entrepreneurial Activity in the GEM Countries, 2014
Nascent entrepreneur-
ship rate
New business ownership
rate
Early-stage entrepreneurial activity (TEA)
Established business
ownership rate
Discontinuation of businesses
Belgium 2.9 2.5 5.4 3.5 2.3
Flanders 2.6 2.2 4.7 3.7 1.0
Benchmark Economies
Denmark 3.1 2.5 5.5 5.1 2.2
France 3.7 1.7 5.3 2.9 1.7
Germany 3.1 2.3 5.3 5.2 1.7
Luxembourg 4.9 2.3 7.1 3.7 2.6
Netherlands 5.2 4.5 9.5 9.6 1.8
Spain 3.3 2.2 5.5 7.0 1.9
United Kingdom 6.3 4.5 10.7 6.5 1.9
Average 4.2 2.9 7.0 5.7 2.0
Other Innovation-driven Economies
Australia 7.6 5.7 13.1 9.8 3.9
Austria 5.8 3.1 8.7 9.9 2.7
Canada 7.9 5.6 13.0 9.4 4.2
Estonia 6.3 3.5 9.4 5.7 2.0
Finland 3.4 2.3 5.6 6.6 2.3
Greece 4.6 3.4 7.9 12.8 2.8
Ireland 4.4 2.5 6.5 9.9 1.9
Italy 3.2 1.3 4.4 4.3 2.1
Japan 2.7 1.3 3.8 7.2 1.1
Norway 2.8 3.0 5.7 5.4 1.9
Portugal 5.8 4.4 10.0 7.6 3.0
Puerto Rico 8.8 1.3 10.0 1.3 3.6
Qatar 11.3 5.4 16.4 3.5 4.8
Singapore 6.4 4.8 11.0 2.9 2.4
Slovakia 6.7 4.4 10.9 7.8 5.2
Slovenia 3.8 2.7 6.3 4.8 1.5
Sweden 4.9 1.9 6.7 6.5 2.1
Switzerland 3.4 3.8 7.1 9.1 1.5
Taiwan 4.4 4.1 8.5 12.2 5.1
Trinidad & Tobago 7.5 7.4 14.6 8.5 2.8
United States 9.7 4.3 13.8 6.9 4.0
Average Innovation-driven Economies
5.3 3.4 8.5 6.7 2.6
Note: all figures denote percentage of the population 18-64 years.
14 This is explained in Annex I. See also Reynolds et al. (2005).

14
Fig. 3.6 Prevalence rates of Total early-stage Entrepreneurial Activity, 2014
0%
5%
10%
15%
20%
25%
30%
35%
40%
45%In
dia
Vie
tnam Iran
Ph
ilip
pin
es
An
gola
Bu
rkin
a Fa
so
Bo
livia
Bo
tsw
ana
Uga
nd
a
Cam
ero
on
Suri
nam
e
Ko
sovo
Ru
ssia
Mal
aysi
a
Sou
th A
fric
a
Bel
ize
Geo
rgia
Bo
snia
an
d H
erze
govi
na
Cro
atia
Po
lan
d
Hu
nga
ry
Lith
uan
ia
Co
sta
Ric
a
Ro
man
ia
Bar
bad
os
Kaz
akh
stan
Ind
on
esi
a
Arg
enti
na
Ch
ina
Uru
guay
Pan
ama
Bra
zil
Co
lom
bia
Mex
ico
Jam
aica
El S
alva
do
r
Gu
atem
ala
Thai
lan
d
Ch
ile
Per
u
Ecu
ado
r
Jap
an
Ital
y
Flan
de
rs
Ger
man
y
Fran
ce
Bel
giu
m
Den
mar
k
Spai
n
Fin
lan
d
No
rway
Slo
ven
ia
Irel
and
Swed
en
Swit
zerl
and
Luxe
mb
ou
rg
Gre
ece
Taiw
an
Au
stri
a
Esto
nia
Net
her
lan
ds
Po
rtu
gal
Pu
erto
Ric
o
Un
ited
Kin
gdo
m
Slo
vaki
a
Sin
gap
ore
Can
ada
Au
stra
lia
Un
ited
Sta
tes
Trin
idad
an
d T
ob
ago
Qat
ar
Factor-driven economies Efficiency-driven economies Innovation-driven economies
Pe
rce
nta
ge o
f ad
ult
po
pu
lati
on
(1
8-6
4 y
ear
s)

15
Figure 3.6 shows the point estimates of the TEA rates for each of the 73 economies that participated in GEM 2014, by phase of economic development. The confidence intervals facilitate in interpreting differences between countries. They constitute the range within which the average value of 95 out of 100 replications of the survey would be expected to lie. Thus, in 2014 the TEA rate estimated for Flanders, 4.7%, is significantly below that of Luxembourg and the economies to the right of Luxembourg (for Belgium, the same holds for Greece). Adopting the 95% statistical significance level, the rates for Belgium and Flanders do not significantly differ from those of Japan, Italy, Germany, Denmark, Spain, Finland, Norway, Slovenia, Ireland, Sweden and Switzerland. Within our benchmark, the Netherlands and the United Kingdom are rare examples in which about ten out of 100 persons between 18-64 years are involved in Total early-stage Entrepreneurial Activity, relatively close to Canada, Australia and the United States. In understanding these rates, we note that some countries show larger discrepancy between nascent entrepreneurship rate and the rate of owner-managers in new firms, i.e. those who have actually managed to get their business started. For example, the high TEA rate in the United States is largely accounted for by nascent entrepreneurs. While much of entrepreneurship literature documents the relevance of opportunity recognition (Shane & Venkataraman, 2000), some of the entrepreneurs in the GEM samples indicate to have acted out of necessity rather than that they saw an opportunity to start. When further asking those who reported to be pursuing a recognized opportunity (rather than necessity), most indicated that the main driver for becoming an entrepreneur was to become more independent or to increase their personal income (taken together indicated as ‘improvement-driven opportunity’ in Table 3.4), rather than ‘just’ maintaining income.
Table 3.4 Motivations for Total early-stage Entrepreneurial Activity, 2014
Early-stage entrepreneurial
activity (TEA)
Necessity-driven
(% of TEA)
Improvement-driven
opportunity (% of TEA)
Mixed / Other (% of TEA)
Ratio Opportunity /
Necessity
Belgium 5.4 31 43 26 1.4
Flanders 4.7 43 31 26 0.7
Benchmark Economies
Denmark 5.5 5 60 34 11.1
France 5.3 16 69 15 4.3
Germany 5.3 23 54 23 2.3
Luxembourg 7.1 12 60 28 5.1
Netherlands 9.5 16 63 22 4.0
Spain 5.5 30 33 37 1.1
United Kingdom 10.7 13 53 34 4.1
Average 7.0 16 56 28 4.6
Other Innovation-driven Economies
Australia 13.1 18 64 19 3.6
Austria 8.7 11 37 52 3.4
Canada 13 16 63 21 4.0
Estonia 9.4 15 41 44 2.7
Finland 5.6 16 63 21 4.0
Greece 7.9 35 31 35 0.9
Ireland 6.5 30 49 22 1.6
Italy 4.4 14 39 48 2.8
Japan 3.8 19 68 13 3.6
Norway 5.7 4 69 27 19.5
Portugal 10 27 49 23 1.8
Puerto Rico 10 21 51 28 2.5
Qatar 16.4 22 54 24 2.5
Singapore 11 11 71 18 6.2
Slovakia 10.9 33 52 16 1.6
Slovenia 6.3 25 45 30 1.8
Sweden 6.7 8 56 36 7.1
Switzerland 7.1 14 58 28 4.1
Taiwan 8.5 13 66 21 5
Trinidad & Tobago 14.6 12 64 24 5.4
United States 13.8 14 67 20 5
Average Innovation-driven Economies
8.5 18 55 27 4.2
Note: TEA (first column) denotes percentage of the population 18-64 years, columns 2-4 denote percentage of early-stage entrepreneurs. The final column is obtained by dividing columns 3 and 2 (for precision in the calculation we use the scores with 2 decimal places before rounding).

16
The results in Table 3.4 indicate that the percentage of early-stage entrepreneurs acting out of necessity was high for Belgium and Flanders in 2014, as in 2013, whereas they were in par with the benchmark economies in 2012. The results even suggest that Flanders and Belgium have among the highest percentages of necessity entrepreneurs among innovation-driven economies. We thus see a confirmation of last year’s result. The final column in Table 3.4 indicates a motivational index based on the measures of improvement-driven opportunity and necessity-driven opportunities (see also Singer et al. 2015). Here, Belgium and Flanders (in particular) score very low in comparison with other economies. Economies that have most similar ratios are Spain, Greece and Slovakia. Having addressed the cross-country comparison of entrepreneurial activity, we now turn to the development of nascent entrepreneurship, owner-managers in new firms and the resulting early-stage entrepreneurship over time. Figures 3.7 and 3.8 show the developments over 2001-2014 for Belgium and Flanders respectively. In Flanders, nascent entrepreneurship dropped in 2012, but has risen accordingly in 2013 and 2014 and compares well with the rate observed in 2011. Thus, the low score in 2012 can be considered as an outlier.
Fig. 3.7 Development of Entrepreneurial Activity in Belgium, 2001-2014

17
Fig. 3.8 Development of Entrepreneurial Activity in Flanders, 2001-2014
3.3. Entrepreneurial Aspirations As not all business startups are the same, GEM gives an indication of the differential impact entrepreneurs can have on their economies. GEM measures the expectations for job creation, innovation, and internationalization of entrepreneurs, which may all three be viewed as impact factors. These forms of entrepreneurial aspirations have been positively associated with economic development (see e.g. Wong et al. 2005; Wennekers et al., 2010)15. In this section, these impact profiles are assessed for early-stage entrepreneurs. The results shown in this section are based on pooling the GEM data for the periods 2003-2006 (before the crisis), 2007-2010 (during the global financial crisis) and 2011-2014 (Euro crisis). By merging the data over years, the estimates of the various indicators of entrepreneurial aspirations are made with higher precision16.
3.3.1. Growth-orientation (job creation) Growth aspirations constitute a key dimension of the impact profiles by early-stage entrepreneurs. It is the clearest manifestation of entrepreneurship that can directly be linked to the number one objective of most governments: to create more jobs. Most studies on entrepreneurial aspirations, also denoted as ambitious entrepreneurship (Stam et al., 2012) or high-impact entrepreneurship (Acs, 2008), involve analyses focused on job creation. These analyses evolve around entrepreneurial attitudes, ambitions, expectations, and realizations in terms of job creation (see e.g. Davidsson, 1991; Wiklund and Shepherd, 2003; Wiklund et al., 2009; Levie and Autio, 2011). The typical GEM-based measures in the domain of growth aspirations are linked to job (growth) expectations. It should therefore be acknowledged that early-stage entrepreneurs may be optimistic in their expectations and that expectations for job creation certainly not always lead to realizations. At the same time, it is also well established that growth realization is seldom achieved without having expectations or ambitions for growth (Stam et al., 2012). Thus, building on these findings, country variations in the degree of (high) job growth expectations can be assumed to approximate variations in realized job creation. Individuals who are ‘identified’ as being involved in early-stage entrepreneurship or as an owner-manager of an established business by means of the GEM Adult Population Survey are asked about the number of jobs provided at the moment of the survey as well as their expected number of jobs five years ahead. In line with previous reports we categorized the expected number of jobs five years ahead (irrespective of the current amount of jobs) for early-stage entrepreneurs as follows:
15 See also Hessels et al. (2008) for an analysis on the determinants of these three distinctive entrepreneurial impact factors. 16 The assumption made here is that during the periods concerned the general aspirations profiles within economies have not substantially changed.

18
- Solo early-stage entrepreneurial activity (SEA): expects no jobs (i.e. outside the entrepreneur); - Low job expectation early-stage entrepreneurial activity (LEA): expects between 1-4 jobs;
- Medium job expectation early-stage entrepreneurial activity (MEA): expects between 5-19 jobs; - High job expectation early-stage entrepreneurial activity (HEA): expects 20 jobs or more.
The distinction between these four categories mirrors differences in underlying reasons for the expected amount of job creation. The first group consists of entrepreneurs who are self-employed and do not aim at creating any employment (SEA). This group includes both necessity-driven entrepreneurs as well as those who are very satisfied working as an independent professional. The low job expectation early-stage entrepreneurs are modest job creators and often employ people from their own personal network (such as family members and friends). Medium job expectation entrepreneurs are keen to employ people, however they may want to keep their business manageable and do not expect or desire further growth. The high job expectation measure corresponds to the measure that is used in the two GEM Special Reports on high-expectations Entrepreneurship (Autio, 2005, 2007) and in several academic publications (e.g. Wong et al., 2005; Levie and Autio, 2011). These entrepreneurs are very ambitious; even if they overestimate the number of jobs they expect to generate, as a group their impact on realized job creation is likely to be substantial.
Fig. 3.9 Development of Medium-high early-stage Entrepreneurial Activity (MHEA)
Note: Denmark - in previous reports also one of the benchmark economies - did not participate in the GEM 2013 data collection. For Fig. 3.9 we pool 2011-2012, 2014 data for Denmark.
As the MEA indicator constitutes the main distinctions between considerable (five or more, which is high considering a representative, random group of individuals in the process of starting a firm), we take this indicator and merge it with HEA to denote ‘medium-high’ job expectation (MHEA). Figure 3.9 shows the development of the MHEA indicator over time. Belgium and Flanders, like most benchmark economies, witness an increase in job-growth expectation early-stage entrepreneurship. The rates have declined in Spain and leveled in Denmark in the same time period. Flanders scores among the lowest among the benchmark countries at about one percent – twice as low as the Netherlands and the United Kingdom. Modest expectations and/or modest ambitions may also be caused by a perception of (nascent) entrepreneurs that regulations hinder hiring employees. At the same time, we cannot rule out that Belgian entrepreneurs may exhibit more realistic expectations concerning job creation than individuals in other countries who may be overly optimistic.
3.3.2. Innovative orientation While job growth (expectations and realizations) arguably constitute the most visible medium term impact of entrepreneurship, innovative orientation impacts structural renewal in the long term. Innovation is viewed from the perspective of the market and industry, in line with Schumpeter’s view of innovative entrepreneurship as new product-market combinations destructing older, obsolete products and services and pushing the production frontier forwards (Schumpeter 1942). It represents the perceived extent to which an entrepreneur’s product or service is new to some or all customers and where few or no other businesses offer the same product. When comparing countries, it must be kept in mind that what may seem new to customers in one economy may already be familiar to customers in other ones.
Belgium FlandersBenchmark
AverageDenmark France Germany
Nether-lands
SpainUnited
Kingdom
2003-2006 1,26% 1,00% 1,73% 1,99% 1,08% 1,61% 1,37% 1,83% 2,51%
2007-2010 1,17% 1,08% 1,68% 2,00% 1,45% 1,13% 1,63% 1,90% 1,96%
2011-2014 1,47% 1,12% 1,93% 1,92% 1,76% 1,80% 2,40% 1,28% 2,42%
0,0%
0,5%
1,0%
1,5%
2,0%
2,5%
3,0%
Ind
ivid
uals
in
TE
A e
xp
ecti
ng
to
cre
ate
5+
jo
bs
Perc
en
tag
e o
f p
op
ula
tio
n b
etw
een
18
-64 y
ears

19
Nevertheless, a high degree of innovative orientation in the former economy is still expected to have a positive impact on economic development. Innovative orientation as measure in the GEM framework is therefore a context-dependent measure. Figure 3.10 shows the percentage of early-stage entrepreneurs with innovative orientations. Among the benchmark economies, more early-stage entrepreneurs in Denmark and France esteem their products and services innovative. Even though there may be fewer early-stage entrepreneurs in these countries, the higher proportion of innovative drive is a quality dimension that should also be considered. The Belgian percentage of early-stage entrepreneurs with an innovative orientation is similar to those of Germany, the Netherlands, Spain and the United Kingdom. For Flanders it seems to have dropped to an estimate of 21% of early-stage entrepreneurs in 2011-2014.
Fig. 3.10 Development of Innovation-Oriented early-stage Entrepreneurial Activity
Note: Denmark - in previous reports also one of the benchmark economies - did not participate in the GEM 2013 data collection. For Fig. 3.10 we pool 2011-2012, 2014 data for Denmark.
3.3.3. International orientation A specific GEM measure assesses the extent to which entrepreneurs sell to customers outside their economies. Figure 3.11 shows, for the benchmark economies, the proportion of early-stage entrepreneurs who estimate to have at least 25% foreign customers over the three periods that were distinguished.
Fig. 3.11 Development Internationally oriented early-stage Entrepreneurial Activity
Note: Denmark - in previous reports also one of the benchmark economies - did not participate in the GEM 2013 data collection. For Fig. 3.11 we pool 2011-2012, 2014 data for Denmark.
Belgium FlandersBenchmark
AverageDenmark France Germany
Nether-lands
SpainUnited
Kingdom
2003-2006 23% 23% 29% 44% 35% 27% 22% 17% 30%
2007-2010 30% 28% 30% 39% 33% 27% 30% 26% 27%
2011-2014 28% 21% 33% 48% 39% 27% 29% 27% 29%
0%
10%
20%
30%
40%
50%
60%
Perc
en
tag
e o
f T
EA
wit
h i
nn
ovati
ve o
rien
tati
on
Belgium FlandersBenchmark
AverageDenmark France Germany
Nether-lands
SpainUnited
Kingdom
2003-2006 30% 24% 19% 18% 29% 13% 20% 14% 19%
2007-2010 40% 28% 21% 32% 22% 18% 16% 19% 17%
2011-2014 28% 30% 17% 18% 23% 17% 14% 11% 17%
0%
5%
10%
15%
20%
25%
30%
35%
40%
45%
Perc
en
tag
e o
f T
EA
wit
h i
nte
rnati
on
al
ori
en
tati
on

20
International orientation is relatively high in Belgium and Flanders. Of course this should be placed in the context of small countries and the existence of obvious partners in neighboring economies. Still, the international orientation of the average Belgian early-stage entrepreneurs is high (the high level in the period 2007-2010 may be an outlier; there are no obvious explanations for this particular finding). It signals that even though there appears to be fewer early-stage entrepreneurs in comparison to other countries, the international orientation is adequate.
3.4. Entrepreneurial Employee Activity While the attention so far has been focused on entrepreneurial individuals who are in the process of owning and managing a business, this is not the complete picture when it comes to assessing entrepreneurial activity. Not only is it relevant to explore different types of early-stage entrepreneurship as we showed in section 3.3., it is also relevant to consider entrepreneurial behavior among people who are employed by business owners. This section elaborates on the concept of entrepreneurial employee activity (EEA), that has been introduced in the GEM data collection in 2011. For an extensive discussion on the measure and global patterns we refer to Bosma et al (2013). In 2014 a second worldwide assessment has been conducted in the GEM data collection. In this section we therefore combine the 2011 and 2014 EEA results. Figure 3.12 presents the overall outcomes and shows that some of the countries in our benchmark group that have among the lowest TEA rates, may have high EEA rates. In Denmark, entrepreneurial employees actually outnumber the independent early-stage entrepreneurs. This result hints at a possible substitution effect between independent entrepreneurship and entrepreneurial employee activity (which could be caused by historical, cultural and regulatory characteristics) and could provide important information to entrepreneurship scholars and policy makers. For policy makers, these results should especially signal that a comprehensive policy approach to entrepreneurship should not only take into account entrepreneurial efforts by independent entrepreneurs but also those by entrepreneurial employees. However, for Belgium and Flanders, the 2014 data gathering, counters the information in the 2011 analysis with very high scores for Belgium (8,6%) and Flanders (9,4%). Fig. 3.12 Total early-stage Entrepreneurial Activity (TEA) and Entrepreneurial Employee Activity (EEA), 2014
Belgium FlandersBenchmark
AverageDenmark France Germany Netherlands Spain
UnitedKingdom
EEA 2014 4,01 4,78 4,59 8,58 2,64 3,45 5,21 1,47 6,17
TEA 2014 5,40 4,73 6,95 5,47 5,34 5,27 9,46 5,47 10,66
0
2
4
6
8
10
12
Perc
en
tag
e i
n p
op
ula
tio
n b
etw
een
18
-64 y
ears
21
4. NATIONAL EXPERT SURVEY (NES): CONDITIONS FOR ENTREPRENEURSHIP
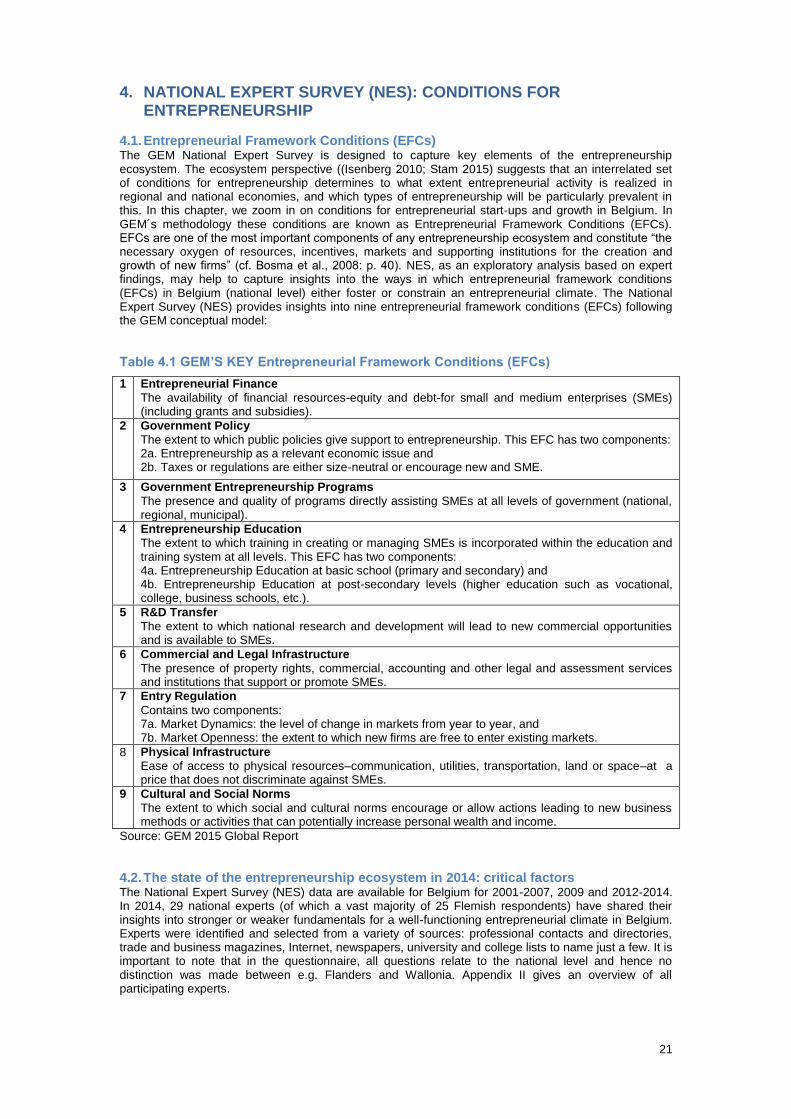
4.1. Entrepreneurial Framework Conditions (EFCs) The GEM National Expert Survey is designed to capture key elements of the entrepreneurship ecosystem. The ecosystem perspective ((Isenberg 2010; Stam 2015) suggests that an interrelated set of conditions for entrepreneurship determines to what extent entrepreneurial activity is realized in regional and national economies, and which types of entrepreneurship will be particularly prevalent in this. In this chapter, we zoom in on conditions for entrepreneurial start-ups and growth in Belgium. In GEM´s methodology these conditions are known as Entrepreneurial Framework Conditions (EFCs). EFCs are one of the most important components of any entrepreneurship ecosystem and constitute “the necessary oxygen of resources, incentives, markets and supporting institutions for the creation and growth of new firms” (cf. Bosma et al., 2008: p. 40). NES, as an exploratory analysis based on expert findings, may help to capture insights into the ways in which entrepreneurial framework conditions (EFCs) in Belgium (national level) either foster or constrain an entrepreneurial climate. The National Expert Survey (NES) provides insights into nine entrepreneurial framework conditions (EFCs) following the GEM conceptual model:
Table 4.1 GEM’S KEY Entrepreneurial Framework Conditions (EFCs)
1 Entrepreneurial Finance
The availability of financial resources-equity and debt-for small and medium enterprises (SMEs) (including grants and subsidies).
2 Government Policy
The extent to which public policies give support to entrepreneurship. This EFC has two components: 2a. Entrepreneurship as a relevant economic issue and 2b. Taxes or regulations are either size-neutral or encourage new and SME.
3 Government Entrepreneurship Programs
The presence and quality of programs directly assisting SMEs at all levels of government (national, regional, municipal).
4 Entrepreneurship Education
The extent to which training in creating or managing SMEs is incorporated within the education and training system at all levels. This EFC has two components: 4a. Entrepreneurship Education at basic school (primary and secondary) and 4b. Entrepreneurship Education at post-secondary levels (higher education such as vocational, college, business schools, etc.).
5 R&D Transfer
The extent to which national research and development will lead to new commercial opportunities and is available to SMEs.
6 Commercial and Legal Infrastructure
The presence of property rights, commercial, accounting and other legal and assessment services and institutions that support or promote SMEs.
7 Entry Regulation
Contains two components: 7a. Market Dynamics: the level of change in markets from year to year, and 7b. Market Openness: the extent to which new firms are free to enter existing markets.
8 Physical Infrastructure
Ease of access to physical resources–communication, utilities, transportation, land or space–at a price that does not discriminate against SMEs.
9 Cultural and Social Norms
The extent to which social and cultural norms encourage or allow actions leading to new business methods or activities that can potentially increase personal wealth and income.
Source: GEM 2015 Global Report
4.2. The state of the entrepreneurship ecosystem in 2014: critical factors The National Expert Survey (NES) data are available for Belgium for 2001-2007, 2009 and 2012-2014. In 2014, 29 national experts (of which a vast majority of 25 Flemish respondents) have shared their insights into stronger or weaker fundamentals for a well-functioning entrepreneurial climate in Belgium. Experts were identified and selected from a variety of sources: professional contacts and directories, trade and business magazines, Internet, newspapers, university and college lists to name just a few. It is important to note that in the questionnaire, all questions relate to the national level and hence no distinction was made between e.g. Flanders and Wallonia. Appendix II gives an overview of all participating experts.

22
The NES is different from the APS as its key objective is to have qualified opinions. We detect the areas that might be critical using both items and open questions linked to each of nine EFCs. We then can compare the EFCs valued most positive and most negative. For each participating economy, a set of 5-point Likert scales are included in the survey and the statements are phrased so that a score of 4 or 5 would indicate that the expert regards the factor as positive for entrepreneurship, while a score of 1 or 2 would indicate that the expert regarded the factor as negative for entrepreneurship.
Table 4.2 Entrepreneurial Framework Conditions (EFCs) - LIKERT SCALES
1 Finance 2a National Policy (General Policy) 2b National Policy (Regulation) 3 Government Programs 4a Education (Primary & Secondary) 4b Education (Post-Secondary) 5 R&D Transfer 6 Commercial Infrastructure 7a Internal Market (Dynamics) 7b Internal Market (Openness) 8 Physical Infrastructure 9 Cultural and Social Norms
European Union 1 2a 2b 3 4a 4b 5 6 7a 7b 8 9
Belgium 3.4 2.6 2.0 2.7 2.0 2.8 3.0 3.7 2.5 3.2 3.8 2.2
Austria 2.5 2.5 2.6 3.6 1.7 3.0 2.8 3.4 2.5 3.3 4.1 2.5
Croatia 2.3 2.2 1.6 2.3 1.7 2.4 2.0 2.9 3.4 2.1 3.7 2.0
Denmark 2.7 3.3 3.3 3.4 3.1 3.4 2.8 3.6 2.4 3.4 4.5 2.8
Estonia 2.9 2.4 3.6 3.4 2.6 3.0 2.9 3.2 3.4 3.1 4.4 3.4
Finland 2.8 3.2 3.0 2.8 2.3 2.7 2.6 3.2 3.2 2.7 4.3 2.8
France 2.8 3.0 3.0 3.2 1.8 2.9 2.7 3.1 3.0 2.3 4.0 2.1
Germany 2.8 2.9 2.9 3.5 2.1 2.8 2.8 3.3 2.8 2.8 3.8 2.7
Greece 2.1 2.1 1.7 2.0 1.5 2.3 2.3 3.1 3.4 2.1 3.5 2.5
Hungary 2.6 2.4 1.9 2.4 1.7 2.8 2.4 3.3 3.1 2.6 3.9 2.3
Ireland 2.9 3.2 2.6 3.3 2.1 3.0 2.8 3.3 2.6 3.1 3.7 3.0
Italy 2.6 2.4 1.5 2.1 1.7 2.3 2.2 2.8 3.5 2.6 2.9 2.2
Latvia 2.6 2.6 2.5 2.8 2.5 3.2 2.3 3.7 2.3 2.8 4.0 2.9
Lithuania 3.2 2.4 2.5 2.7 2.4 3.1 2.6 3.9 3.4 2.7 4.2 3.1
Luxembourg 2.8 3.4 3.2 3.5 2.1 2.9 3.0 3.5 2.8 3.1 4.0 2.6
Netherlands 2.8 2.6 3.1 3.2 2.9 3.2 2.9 3.7 2.9 3.4 4.8 3.6
Poland 2.8 3.1 2.2 2.8 1.8 2.5 2.4 2.8 4.0 2.8 3.8 3.0
Portugal 2.7 2.6 2.0 3.0 2.0 3.0 2.8 3.3 2.4 2.8 4.4 2.6
Romania 2.4 2.5 2.2 2.5 2.3 2.7 2.6 3.1 3.1 2.9 2.9 2.6
Slovakia 2.7 2.3 2.2 2.3 2.2 3.0 2.1 3.1 2.6 2.8 3.9 2.4
Slovenia 2.3 2.1 1.9 2.4 1.8 2.3 2.3 2.7 3.0 2.6 3.6 2.1
Spain 2.1 2.5 2.4 2.9 1.8 2.6 2.5 3.0 2.9 2.5 3.6 2.6
Sweden 2.6 2.7 2.5 3.0 2.6 2.8 2.7 3.3 3.1 2.8 4.3 3.1
United Kingdom 2.8 2.9 2.3 2.6 2.4 3.0 2.2 3.0 3.3 2.7 3.5 2.8
Average 2.6 2.7 2.5 2.8 2.1 2.8 2.5 3.2 3.0 2.8 3.9 2.7
Note: 4 or 5 would indicate that the expert regards the factor as positive for entrepreneurship, while a score of 1 or 2 would indicate that the expert regarded the factor as negative for entrepreneurship. Source: GEM 2014 Global Report (Singer et al., 2015)
Based on the Likert Scales, we see that Belgium scores higher than the average European benchmark on Finance, R&D Transfer, Commercial Infrastructure, and Internal Market (Openness). Remarkable is a score of 3.4 for Entrepreneurial Finance, this is the highest score in EU countries in 2014, and a strong improvement compared with 2013 (Belgium: 2.6, than equal to the average for EU in 2013). In line with the benchmark countries, Infrastructure – both commercial and physical infrastructure – is regarded by the Belgian experts as a positive factor for entrepreneurship in Belgium. As in previous years, physical infrastructure (roads, utilities, communications, water disposal) tends to obtain the highest evaluations in global experts’ ratings, with averages close to 4 or over 4 in all regions except Africa (whose EFC is evaluated as the best among other EFCs, but still at a much lower level than in other parts of the world). This Entrepreneurial Framework Condition was granted outstanding evaluations in the Netherlands, Denmark and Japan. In contrast, National Policy (Regulation), Education (Primary and Secondary), and Cultural and Social Norms are regarded as negative factors for entrepreneurship in Belgium as these items all score below 2.5. These findings are in line with the NES 2013 survey and show National Policy (Regulation), Education (Primary and Secondary), and Cultural and Social Norms to be perceived as structural barriers. Entrepreneurship education at basic levels (primary and secondary school) is rated rather unfavorably in most economies – only a few of them (Denmark, Singapore, Philippines and the

23
Netherlands) stand out. This information is very important for policy makers, as this score shows the extent to which primary and secondary education encourages creativity, self-sufficiency, and personal initiative, provides adequate instruction on market economic principles, and pays adequate attention to entrepreneurship and new firms’ creation (see also Singer et al., 2015). Additional to the Likert Scales, nine open-ended questions are included. The survey detects 3 factors that respondents consider inhibits or constraints for entrepreneurship in Belgium, 3 factors that enhance or support entrepreneurship in Belgium and 3 recommendations from the experts to improve the entrepreneurial framework. Table 4.3 gives an overview of the Top 3 themes for restrictions, supports and suggestions mentioned for these 9 open ended questions. In 2014, Government Policy is again confirmed as the most cited factor, both as a constraint for entrepreneurship and issue for recommendations. Other critical factors according to the experts are Cultural and Social Norms and (Entrepreneurial) Education. Government Entrepreneurship Programs (as a support) is less cited compared to the NES 2013 survey, whereas Cultural and Social Norms is gaining importance. Most cited restrictions:
1. Government Policy (top 3 constraints by 25 of 29 experts; 41 times cited) 2. Cultural and Social Norms (top 3 constraints by 13 of 29 experts; 19 times cited) Most cited supports:
1. (Entrepreneurial) Education (top 3 support by 17 of 29 experts; 18 times cited) 2. Cultural and Social Norms (top 3 support by 9 of 29 experts; 12 times cited) Most cited suggestions for improvement:
1. Government Policy (top 3 suggestion for improvement by 18 of 29 experts; 32 times cited) 2. (Entrepreneurial) Education (top 3 suggestion by 12 of 29 experts; 12 times cited) 3. Cultural and Social Norms (top 3 suggestion by 11 of 29 experts; 12 times cited)
Table 4.3 Entrepreneurial Framework Conditions (EFCs) – OPEN QUESTIONS
Entrepreneurial Framework Condition
Restrictions Supports Suggestions
N°
1 N°2 N°3
Total
N°1 N°2 N°3
Total
N°1 N°2 N°3
Total
Entrepreneurial Finance
2 0 1 3 1 1 1 3 1 3 0 4
Government Policy
12 13 16 41 2 3 0 5 14 11 7 32
Government Entrepre-neurship Programs
2 0 0 2 4 2 1 7 0 2 2 4
Entrepreneurial Education
2 1 0 3 6 7 5 18 5 3 4 12
R&D transfer 0 0 0 0 1 1 4 6 0 0 0 0
Commercial and legal infrastructure
1 1 0 2 2 1 1 4 0 2 0 2
Entry regulation 3 1 0 4 4 3 1 8 0 1 0 1
Physical infrastructure
0 0 1 1 4 2 2 8 1 1 3 5
Cultural and social norms
3 9 7 19 1 4 7 12 4 2 6 12
*Number of experts indicating an EFC in their top 3 as an area of restriction, support or a topic of suggestion for improvement respectively. N=29 (the overrepresentation of Flemish experts, n=25 of 29 experts, should be taken into account to interpret the findings.)
The assessment for Belgium in 2014 signals that Government Policy remains a critical factor. Other hot topics according to the experts are Entrepreneurial Education (a strength) and Cultural and Social Norms (both indicated as a strength and a restriction). Remarkable is the importance of Entrepreneurial Finance indicated by the Likert scales versus the few times this item is cited by the experts in the open questions. As this factor is not explicitly mentioned as

24
a strength by the experts in the open ended questions, we could say that entrepreneurial finance as a strength seems to stay under the radar. Consulting the experts’ open answers, we gain some insights. Regarding Government Policy as a structural barrier, the experts mention particularly a lack of vision (and scattered initiatives to enhance entrepreneurship), the discrepancy between self-employed versus employee (and thus a golden cage for employees), red tape, a rigid labor market, political instability and non-transparent legislation, high labor costs, high taxation, lack of safety net. Many experts mention a lack of Belgian entrepreneurial mentality and see risk-aversion, fear of failure, lack of pro-activeness and few sense of responsibility. As a positive, infrastructure and human capital is often mentioned, regarding the latter, in particular strong networks of family and friends are mentioned as a typical support.
5. CONCLUSION The GEM 2014 report for Belgium and Flanders presents an overview of a very specific set of indicators that measure not only entrepreneurial activity rates, but also give insights in entrepreneurial attitudes (individual self-perceptions and national societal impressions) of the adult population in Belgium and the Flemish Region and in the growth aspirations of (prospective) business owner-managers. In addition, experts’ views are added to explore further the Belgian entrepreneurial ecosystem. The main advantages of the GEM method are (1) the international comparability over different country-specific administrative regulations, (2) the possibility to also detect latent entrepreneurship and (3) inform on less tangible elements of entrepreneurial culture. Figure 5.1 and tables 5.1 and 5.2 at the end of this chapter give a complete overview of the most important GEM indicators for Belgium and Flanders, both in relation to the benchmark economies and in terms of development over time, between 2001 and 2014. We conclude for Belgium and Flanders for the following categories:
1. Individual self-perceptions 2. National societal impressions 3. Entrepreneurial activity 4. Entrepreneurial motivation 5. Entrepreneurial aspirations 6. Conditions for Entrepreneurship
5.1 Individual Self-Perceptions When it comes to self-perceptions to starting a business in Belgium and Flanders, the overall results reconfirm the conclusions made by Holvoet et al. (2015), stressing the lack of an entrepreneurial culture in Flanders. The 2014 scores for Belgium and Flanders confirm fear of failure to be an important structural barrier for latent entrepreneurs who do see good opportunities. Half of respondents who feel there are good opportunities for the launch of a new company state that fear of failure keeps them from moving forward. This indicator shows an upward trend over the past five years. In none of 7 benchmark countries (Denmark, France, Germany, Luxembourg, Netherlands, Spain and the United Kingdom), we see this high level of fear of failure among those who see good opportunities to start a business. Compared to all innovation-driven countries, we see similar high levels in Italy and Japan, only in Greece, we detect even more fear of failure. Regarding perceived capabilities to start a business, a rather stable indicator, we do note the lowest score in a decade. Perceived skills are particularly low for women based on pooled data from 2011-2014. Gender gaps also exist in the benchmark countries17, but the score for women believing in their own capabilities to start-up is the lowest in Flanders.
5.2 National Societal Impressions National societal impressions provide a normative image of entrepreneurship in Belgium and Flanders. The measures shown in Figure 5.1 provide a picture that is consistent with results from previous years. Belgian and Flemish adults believe entrepreneurship to be a good career choice (even though this measure appears to have dropped in the past two years) but do not attach high status to successful
entrepreneurs. Such an attitude may invoke more hesitance and fear of failure among potential ambitious entrepreneurs. Compared internationally, the score for status of successful entrepreneurs is again remarkably low. In 2014, in the European Union, only Spain and Croatia score lower on this indicator. This is in line with our findings on entrepreneurial mentality reported in Holvoet et al. (2015): the status perception of entrepreneurs is a structural barrier for entrepreneurship. Nevertheless, we see that media attention for entrepreneurship is catching up with the benchmark.
17 We have no data availability to pool data for Luxembourg for 2011-2014, this conclusion is based on 6 benchmark countries: Denmark, France, Germany, Netherlands, Spain and the United Kingdom.
25
5.3 Entrepreneurial Activity Even though the observed rate of early-stage entrepreneurial activity (TEA) appears to be on roughly the same level as 2011 and 2013 in Flanders (a temporary dip was observed in 2012), this rate is still rather low in international comparison. The 2014 assessment on entrepreneurial employee activity (EEA) hints that in Belgium this may be compensated by a fair degree of entrepreneurial employees. However, the 2014 data for Belgium (4,01%) and Flanders (4,78%) nuance the expectations of the 2011 analysis, where very high scores for Belgium (8,6%) and Flanders (9,4%) were noted. Nevertheless, the GEM research outcomes should drive policy makers to acknowledge the role of EEA in the context of Belgium and Flanders.
5.4 Entrepreneurial Motivation Regarding start-up motivation, the 2014 data for Belgium and Flanders reconfirm a high percentage of early-stage entrepreneurs acting out of necessity, as noted in 2013, whereas they were still in par with the benchmark economies in 2012. The recent results even suggest that Flanders and Belgium have among the highest percentages of necessity entrepreneurs among innovation-driven economies.
5.5 Entrepreneurial Aspirations Striking about the entrepreneurial aspirations is the apparent lack of innovative orientation and (job) growth orientation among (in particular) the Flemish early-stage entrepreneurial entrepreneurs over the past four years. On the contrary, Belgian and Flemish early-stage entrepreneurs are still among the most prone to exhibit an international orientation. Part of this result is probably driven by the small and open economy that characterizes both Belgium as a whole and Flanders as one of its regions.
5.6 Conditions for Entrepreneurship The expert assessment for Belgium in 2014 signals that Government Policy remains a critical factor for entrepreneurship. Other hot topics according to the experts are Entrepreneurial Education and Cultural and Social Norms. These findings are in line with the NES 2013 survey and indicate these topics to be perceived as structural barriers. Government Entrepreneurship Programs (as a support) is less cited compared to the NES 2013 survey, whereas Cultural and Social Norms is gaining importance (both as a constraint and a support). Remarkable is the score of 3.4 for Entrepreneurial Finance, this is the highest score in EU countries in 2014, and a strong improvement compared to 2013. Surprisingly, Entrepreneurial Finance is not explicitly mentioned as a strength by the experts in the open ended questions, we could conclude that entrepreneurial finance as a positive, still stays under the radar. A thorough consultation with the experts, e.g. in the form of a dialogue and by linking to the GEM results on entrepreneurial perceptions and entrepreneurial activity, may help to further understand the entrepreneurial (financial) climate. The overrepresentation of Flemish experts (n=25 of 29 experts) should be taken into account to interpret the NES 2014 findings.

26
5.7 Overview for Belgium and Flanders
Fig. 5.1 GEM profile for Belgium and Flanders, 2014
Note: All indicators based on 2014 data, except for indicators on growth orientation, innovative orientation and international orientation (based on 2011-2014 pooled data in order to enhance statistical precision, see section 3). All indicators have been transferred into ‘standardized’ measures, which means that the values have been transferred such that the average equals zero (as reflected by the dashed line in the figure) and the standard deviation equals one. Hence, scores above 1 and below -1 indicate moderate deviation to the average, while scores close to -2 and 2 reflect substantial deviations from the average. Luxembourg is not included among the benchmark countries due to lack of data preceding 2014.
-2
-1
0
1
2
3
Perceived Opportunities
Perceived capabilities
Fear of failure
Startup intentions
Belief: entrepreneurship goodcareer choice
Belief: high status to successfulentrepreneurs
nascent entrepreneurshipOwner-managers in new firms
Total early-stage EntrepreneurialActivity (TEA)
Entrepreneurial EmployeeActivity (EEA)
TEA & expects at least fiveemployees
Innovative orientation (% of TEA)
International orientation (% ofTEA)
Flanders (relative to benchmark countries)
Belgium (relative to benchmark countries)
Highest score among benchmark countries
Average benchmark countries

27
Table 5.1 GEM indicators for Belgium 2001-2014 (%18-64 pop.)
2001 2002 2003 2004 2005 2006 2007 2008 2009 2010 2011 2012 2013 2014
Individual self-perceptions
Perceived opportunities to start business in the next 6 months
20 16 18 38 43 15 16 14 15 40 43 33 31 36
Perceived skills & knowledge to start a business
30 35 35 39 44 35 37 36 37 45 44 37 34 30
Knows someone who started a business in the past 2 years
30 28 31 30 37 28 31 29 29 24 26 22 19 19
Fear of failure for those perceiving opportunities *
38 31 26 32 29 36 28 33 28 37 41 41 47 49
Intentions to start a business ** . 5 5 6 6 6 6 6 5 8 11 9 8 11
National societal impressions
Entrepreneurship as a good career choice
. . 56 71 67 47 45 47 46 60 64 62 55 52
High status to successful entrepreneurs
. . 54 69 72 53 51 46 49 51 55 57 52 52
Media attention for entrepreneurship
. . 40 40 48 37 37 38 33 46 47 54 44 51
Prevalence rates of total early-stage entrepreneurial activity
Nascent Entrepreneurship (activity less than 3 months)
2.0 2.1 2.8 2.2 2.9 1.8 2.7 2.0 2.0 2.3 2.7 3.3 3.1 2.9
New Entrepreneurship (3 to 42 months)
1.2 1.1 1.2 1.4 1.2 1.1 0.4 0.9 1.6 1.4 3.0 2.0 1.9 2.5
TEA-indicator (nascent and new entrepreneurship)
3.1 3.0 3.9 3.4 3.9 2.7 3.1 2.9 3.5 3.7 5.7 5.2 4.9 5.4
* Fear of failure measured only for the respondents who perceive good opportunities to start a business. ** Startup intentions measured only for the respondents who are currently not actively involved in entrepreneurial activity (as a nascent entrepreneur or owner-manager in new/established firm).

28
Table 5.2 GEM indicators for Flanders 2001-2014 (%18-64 pop.)
2001 2002 2003 2004 2005 2006 2007 2008 2009 2010 2011 2012 2013 2014
Individual self-perceptions
Perceived opportunities to start business in the next 6 months
21 13 16 39 40 12 21 13 13 38 40 33 34 41
Perceived skills & knowledge to start a business
33 37 37 40 47 36 42 39 38 41 40 37 33 29
Knows someone who started a business in the past 2 years
33 29 33 31 37 30 35 29 30 22 23 15 17 17
Fear of failure for those perceiving opportunities *
36 26 25 34 26 26 24 32 22 36 39 42 47 50
Intentions to start a business ** . 3 3 4 6 3 6 5 4 7 8 8 6 9
National societal impressions
Entrepreneurship as a good career choice
. . 57 75 66 46 44 43 44 63 67 66 58 53
High status to successful entrepreneurs
. . 52 69 74 54 51 44 48 53 59 60 54 54
Media attention for entrepreneurship
. . 42 48 52 42 43 41 37 45 48 55 41 50
Prevalence rates of total early-stage entrepreneurial activity
Nascent Entrepreneurship (activity less than 3 months)
1.8 1.7 3.1 1.5 2.6 2.1 2.7 2.1 1.6 2.2 2.3 1.3 2.8 2.6
New Entrepreneurship (3 to 42 months)
0.7 1.0 1.5 1.2 1.3 1.2 0.7 1.0 1.8 1.3 2.5 1.6 1.7 2.2
TEA-indicator (nascent and new entrepreneurship)
2.4 2.6 4.4 2.7 3.7 3.2 3.4 3.0 3.3 3.5 4.8 2.8 4.4 4.7
* Fear of failure measured only for the respondents who perceive good opportunities to start a business. ** Startup intentions measured only for the respondents who are currently not actively involved in entrepreneurial activity (as a nascent entrepreneur or owner-manager in new/established firm.

29
REFERENCES Acs, Z.J. (2006). How Is Entrepreneurship Good for Economic Growth? Innovations Technology
Governance Globalization, 1(1): 97-107. Acs, Z.J. (2008). Foundations of High Impact Entrepreneurship. Foundations and Trends in
Entrepreneurship, 4 (6), 535-620. Audretsch, D. B. (2007). The Entrepreneurial Society. Oxford: Oxford University Press. Autio, E. (2005). Global Entrepreneurship Monitor 2005, Report on High-Expectation Entrepreneurship,
London Business School/Mazars/Babson. Autio, E. (2007). Global Entrepreneurship Monitor 2007 Global Report on High-Growth
Entrepreneurship. London, U.K: London Business School; and Babson Park, MA: Babson College. Bosma, N., Jones, K., Autio, E. and Levie, J. (2008). Global Entrepreneurship Monitor, 2007 Executive
Report. Wellesley, Mass., London, UK: Babson College and London Business School Bosma, N.S., Acs, Z., Autio, E., Coduras, A. and Levie, J. (2009). Global Entrepreneurship Monitor 2008
Executive Report. London Business School, London, UK, Universidad del Desarrollo, Santiago, Chile, and Babson College, Wellesley, MA, US.
Bosma, N.S. and Levie, J. (2010). Global Entrepreneurship Monitor, 2009 Executive Report. Babson Park, MA, U.S.: Babson College; Santiago, Chile: Universidad del Desarrollo; Reykjavík, Iceland: Háskólinn Reykjavík University; and London, U.K.: Global Entrepreneurship Research Association.
Bosma, N.S., and Schutjens, V. (2011). Understanding regional variation in entrepreneurial activity and entrepreneurial attitude in Europe. The Annals of Regional Science.Vol 47 (3): 711-742.
Bosma, N.S., Wennekers, A.R.M, Amorós, J.E., Guerrero, M., Martiarena, A. And Singer, S. (2013a). Global Entrepreneurship Monitor Special Report On Entrepreneurial Employee Activity. Babson Park, MA: Babson College, Santiago, Chile: Universidad del Desarollo, Kuala Lumpur, Malaysia: Universiti Tun Abdul Razak, GERA: London.
Bosma, N., Holvoet, T. and Crijns H. (2013b). Global Entrepreneurship Monitor 2012. Report for Belgium & Flanders. Steunpunt Ondernemen en Regionale Economie http://Steunpuntore.be.
Holvoet, T., Bosma, N., and Crijns H. (2016). Global Entrepreneurship Monitor 2011-2015. Steunpunt Ondernemen en Regionale Economie http://Steunpuntore.be.
Carree, M.A., and Thurik, A.R. (2003). The impact of entrepreneurship on economic growth, in: Z.J. Acs and D.B. Audretsch (eds.), Handbook of Entrepreneurship Research, Boston: Kluwer Academic Publishers, 437-471.
Davidsson, P. (1991). Continued entrepreneurship: Ability, need, and opportunity as determinants of small firm growth. Journal of Business Venturing, 6: 405-429.
Diener, E. (1984). Subjective well-being. Psychological Bulletin, 95, 542–575. Hessels, J., Van Gelderen, M., and Thurik, R. (2008). Entrepreneurial aspirations, motivations, and their
drivers. Small Business Economics, 31(3), 323-339. Hindle, K. (2006). A measurement framework for international entrepreneurship policy research: from
impossible index to malleable matrix. International Journal of Entrepreneurship and Small Business, 3 (2), 139-182.
Holvoet, T., Bosma, N. and Crijns, H. (2013). Ondernemerschapscultuur: literatuurstudie. Beleidsrapport STORE-B-13-001, Steunpunt Ondernemen en Regionale Economie Steunpuntore.be.
Holvoet, T., Bosma, N. and Crijns, H. (2015). Ondernemerschapsmentaliteit in Vlaanderen: Landschapstekening. Beleidsrapport STORE-B-13-0028, Steunpunt Ondernemen en Regionale Economie Steunpuntore.be.
Isenberg, D.J. (2010). How to Start an Entrepreneurial Revolution. Harvard Business Review, June Karlsson, C., Friis, C. and Paulsson, T. (2005). Relating Entrepreneurship to economic growth. In
Johansson, B. (ed.), The Emerging Digital Economy: Entrepreneurship, Clusters and Policy. Berlijn: Springer-Verlag.
Kelley, D., Herrington, M. and Singer, S. (2012). Global Entrepreneurship Monitor 2011, Executive Report. Babson Park, MA: Babson College, Santiago, Chile: Universidad del Desarollo, Kuala Lumpur, Malaysia: Universiti Tun Tun Abdul Razak.
Levie, J. and Autio, E. (2008). A theoretical grounding and test of the GEM model. Small Business Economics. (31), 235-63.
Levie, J. and Autio, E. (2011). Regulatory Burden, Rule of Law, and Entry of Strategic Entrepreneurs: An International Panel Study. Journal of Management Studies, 48: 1392–1419.
McMullen, J.S. and Shepherd, D.A. (2006). Entrepreneurial action and the role of uncertainty in the theory of the entrepreneur. Academy of Management Review, 31(1): 132–152.
Porter, M.E., Sachs, J.J., and McArthur, J. (2002). Executive Summary: Competitiveness and Stages of Economic Development. In The Global Competitiveness Report 2001–2002, edited by M.E. Porter, J.J. Sachs, P.K. Cornelius, J.W. McArthur and K. Schwab, 16–25. New York, NY: Oxford University Press.
Reynolds, P., Bosma, N., Autio, E., Hunt, S., De Bono, N., Servais, I., Lopez-Garcia, P., and Chin, N. (2005). Global Entrepreneurship Monitor: Data Collection Design and Implementation 1998–2003. Small Business Economics, 24 (3): 205–31.
Schumpeter, J. (1942). Capitalism, Socialism, and Democracy. New York: Harper and Brothers.

30
Shane, S. and Venkataraman, S. (2000). The promise of entrepreneurship and economic growth. Small Business Economics, (13), 27-55.
Shane, S. (2009). Why encouraging more people to become entrepreneurs is bad public policy. Small Business Economics 33 (2), 141-149.
Singer, S., Amorós, J.E. and Moska, D. (2015). Global Entrepreneurship Monitor 2014 Global Report. Babson Park, USA: Babson College; Santiago, CL: Universidad del Desarrollo; Razak, MY: Universiti Tun Abdul Razak; Monterrey, Mexico: Technológico de Monterrey and London, U.K: London Business School.
Stam, E., Bosma, N., Van Witteloostuijn, A., De Jong, J., Bogaert, S., Edwards, N. and Jaspers, F. (2012). Ambitious Entrepreneurship. A review of the academic literature and new directions for public policy, AWT report, 41. The Hague: AWT.
Stam, E. (2015). Entrepreneurial ecosystems and regional policy: A sympathetic critique. European Planning Studies, 23(9), 1759-1769.
Wennekers, S. and Thurik, A.R. (1999). Linking entrepreneurship and economic growth. Small Business Economics, 13(1): 27-55.
Wennekers, S., van Stel, A., Thurik, A. R., and Reynolds, P. (2005). Nascent Entrepreneurship and the Level of Economic Development. Small Business Economics, 24 (3): 293–309.
Wennekers, S., Van Stel, A., Carree, M. and Thurik, A.R. (2010). The relation between entrepreneurship and economic development: is it U-shaped? Foundations and Trends in Entrepreneurship, 6(3), 167-237.
Wiklund, J., and Shepherd, D. (2003). Aspiring for, and Achieving Growth: The Moderating Role of Resources and Opportunities. Journal of Management Studies, 40(8):1919–1941.
Wiklund, J., Patzelt, H., and Shepherd, D. (2009). Building an integrative model of small business growth. Small Business Economics, 32(4): 351-374.
Wong, P. K., Y. P. Ho, and E. Autio (2005). Entrepreneurship, Innovation and Economic Growth: Evidence from GEM Data. Small Business Economics, 24 (3): 335–50.

31
Annex I: Definitions of Main Measures
Measure
Description
Entrepreneurial Attitudes and Perceptions Perceived opportunities
Percentage of 18–64 age group who see good opportunities to start a firm in the area where they live
Perceived skills Percentage of 18–64 age group who believe to have the required skills and knowledge to start a business
Entrepreneurial Intention Percentage of 18–64 age group (individuals involved in any stage of entrepreneurial activity excluded) who intend to start a business within three years
Fear of Failure Percentage of 18–64 age group with positive perceived opportunities who indicate that fear of failure would prevent them from setting up a business
Belief: good career choice Percentage of 18–64 age group who agree with the statement that in their country, most people consider starting a business as a desirable career choice
Belief: high status successful entrepreneurs
Percentage of 18–64 age group who agree with the statement that in their country, successful entrepreneurs receive high status
Belief: media attention for entrepreneurship
Percentage of 18–64 age group who agree with the statement that in their country, they will often see stories in the public media about successful new businesses
Entrepreneurial Activity Nascent Entrepreneurship
Rate Percentage of 18–64 age group who are currently a nascent entrepreneur, i.e., actively
involved in setting up a business they will own or co-own; this business has not paid salaries, wages or any other payments to the owners for more than three months
New Business Ownership Rate
Percentage of 18–64 age group who are currently an owner-manager of a new business, i.e., owning and managing a running business that has paid salaries, wages or any other payments to the owners for more than three months, but not more than 42 months
Total Early-Stage Entrepreneurial Activity (TEA)
Percentage of 18–64 age group who are either a nascent entrepreneur or owner-manager of a new business (as defined above)
Necessity-Driven Entrepreneurial Activity: Relative Prevalence
Percentage of those involved in total early-stage entrepreneurial activity (as defined above) who are involved in entrepreneurship because they had no other option for work
Improvement-Driven Opportunity Entrepreneurial Activity: Relative Prevalence
Percentage of those involved in total early-stage entrepreneurial activity (as defined above) who (i) claim to be driven by opportunity, as opposed to finding no other option for work; and (ii) who indicate the main driver for being involved in this opportunity is being independent or increasing their income, rather than just maintaining their income
Entrepreneurial Aspirations Medium/High Job
Expectation early-stage Entrepreneurial Activity (MHEA)
Percentage of 18–64 age group who are either a nascent entrepreneur or owner-manager of a new business (as defined above) and expect to provide 5 or more jobs five years from now.
Innovation Oriented Early-Stage Entrepreneurial Activity: Relative Prevalence
Percentage of total early-stage entrepreneurs (as defined above) who indicate that their product or service is new to at least some customers and indicate that not many businesses offer the same product or service.
International Orientation early-stage Entrepreneurial Activity
Percentage of total early-stage entrepreneurs (as defined above) with more than 25% of the customers coming from other countries.
Entrepreneurial Employee Activity Entrepreneurial Employee
Activity (EEA) Percentage of 18–64 age group who are currently involved in developing new
entrepreneurial activities for their employer and fulfill a leading role in this activity.

32
Annex II: NES Experts 2014
The 2014 NES experts’ main expertise was stratified on nine critical framework conditions as follows: two experts in the entrepreneurial financing system, i.e. bankers, venture capitalists, private investors, business angels, public subsidies and other specialists in this field. Two experts mainly related with governmental public policies for entrepreneurs, i.e. members of government staff, members of public agencies related with firm creation and development, state secretaries and others of a similar nature. Four experts are mainly related with governmental public programs for entrepreneurs, i.e. policy makers, local development agencies, institutes and foundations that launch entrepreneurship programs, Chambers of Commerce, women’s business associations and similar. Five experts are related with entrepreneurial education and training, i.e. professors and teachers from any educational institution (from schools to universities) as well as professional or vocational instructors. They also include people from agencies who are involved in entrepreneurship training programs. Five experts are related with R&D transfer, i.e. researchers, personnel of technological and scientific parks, technological incubators, developers of scientific or technological programs. Three experts are related with the commercial and professional infrastructure. Three experts are related to the internal market openness. Two experts are related to the physical infrastructure and services. Three experts are related to cultural and social norms. This category includes persons that have opinions in entrepreneurial, creative and business associations, journalists, sociologists, psychologists, researchers in this field and the like. Nevertheless, the overrepresentation of Flemish experts (n=25 of 29 experts) should be taken into account to interpret the NES 2014 findings. For more information concerning the methodology and questionnaire, we refer to www.gemconsortium.org. Thank you 2014 NES Experts:
Beazar Guido VKW & Merisco
Bogdan Oana Bogdan & Van Broeck Architects
Buysse Bärbel Sepia
Clarinval Didier Agence de Stimulation Economique de la Région Wallonne
Cools Pascal Flanders DC
Cosaert Marc Ernst & Young
De Bock Ignace Management Interface
De Stobbeleir Katleen Vlerick Business School
Dejardin Marcus FUNDP (FASEG + CERPE)
Delva Philippe Seagull
Eeraerts Nadine Markant/Artemis
Gabriëls Wouter Lazard
Ghys Laurent Eurofed Team
Goossens Hilde Ernst & Young
Manigart Sophie Vlerick Business School
Meuleman Miguel Vlerick Business School
Sanders Jo Focus Leadership Advisory
Schildermans Johan VKW
Thurik Roy Erasmus School of Economics
Uytterhaegen Muriel GIMV
Van Der Beken Wim Idea Consult
Van Eetvelt Karel UNIZO
Vandorpe Gilles UNIZO
Verbaere Eric VD&P
Vermeire Jacob Vlerick Business School
Vermeylen Wouter Yesplan
Verzele Frank Vlerick Business School
Villers Thierry Asbl Young Enterprises / Les jeunes Entreprises
Vyncke Dirk Vyncke