global positioning system (gps) standard … positioning system (gps) standard positioning service...
TRANSCRIPT

Global Positioning System (GPS)
Standard Positioning Service (SPS) Performance Analysis Report
Submitted To
Federal Aviation Administration
GPS Product Team
1284 Maryland Avenue SW
Washington, DC 20024
Report #86
July 31, 2014
Reporting Period: 1 April – 30 June 2014
Submitted by
William J. Hughes Technical Center
NSTB/WAAS T&E Team
Atlantic City International Airport, NJ 08405

FAA GPS Performance Analysis Report July 31, 2014
2 Report 85
Executive Summary
The GPS Product Team has tasked the Navigation Systems Verification and Monitoring Branch at the William J. Hughes Technical Center to document the Global Positioning System (GPS) Standard Positioning Service (SPS) performance in quarterly GPS Performance Analysis (PAN) Reports. The report contains the analysis performed on data collected at twenty-eight Wide Area Augmentation System (WAAS) Reference Stations. This analysis verifies the GPS SPS performance as compared to the performance parameters stated in the SPS Specification (September 2008).
This report, Report #86, includes data collected from 1 April through 30 June 2014. The next quarterly report will be issued October 31, 2014.
Analysis of this data includes the following standards and categories: PDOP Availability, NANU Summary and Evaluation, Service Availability, Position and Range Accuracy and Solar Storm Effects on GPS SPS performance.
PDOP availability is based on Position Dilution of Precision (PDOP). Utilizing the weekly almanac posted on the US Coast Guard navigation web site, the coverage for every 5o grid point between 180W to 180E and 80S and 80N was calculated for every minute over a 24-hour period for each of the weeks covered in the reporting period. For this reporting period, the global availability based on PDOP less than six for CONUS was 100%.
NANU summary and evaluation was achieved by reviewing the “Notice: Advisory to Navstar Users” (NANU) reports issued between 1 April and 30 June 2014. Using this data, we compute a set of statistics that give a relative idea of constellation health for both the current and combined history of past quarters. A total of six outages were reported in the NANU’s this quarter. All six outages were scheduled and no unscheduled NANU’s were issued.
The quarterly service availability standard was verified using 24-hour position accuracy values computed from data collected at one-second intervals. All of the sites achieved a 100% availability, which exceeds the SPS “average location” value of 99% and the “worst-case location” value of 90%.
Calculating the 24-hour 95% horizontal and vertical position error values verified the accuracy standards. The User Range Error standard was verified for each satellite from 24-hour accuracy values computed using data collected at the following six sites: Boston, Honolulu, Los Angeles, Miami, San Juan and Juneau. This data was also collected in one-second samples. All sites achieved 100% reliability, meeting the SPS specification. The maximum range error recorded was 25.495 meters on Satellite PRN 26. The SPS specification states that the range error should never exceed 30 meters for less than 99.79% of the day for a worst-case point and 99.94% globally. The maximum RMS range error value of 2.598 was recorded on satellite PRN 28. The SPS specification states that RMS URE cannot exceed 6 meters in any 24-hour interval.
Geomagnetic storms had little to no effect on GPS performance this quarter. All sites met all GPS Standard Positioning Service (SPS) specifications on those days with the most significant solar activity.
The IGS is a voluntary federation of many worldwide agencies that pool resources and permanent GNSS station data to generate precise GNSS products. During the evaluation period, the maximum 95% horizontal and vertical SPS errors were 7.78 meters at Maspalomas, Spain and 9.23 meters at Dededo, Guam respectively.
From the analysis performed on data collected between 1 April and 30 June 2014, the GPS performance met all SPS requirements that were evaluated.

FAA GPS Performance Analysis Report July 31, 2014
3 Report 85
Table of Contents
List of Figures ............................................................................................................................................... 4
List of Tables ................................................................................................................................................ 5
1 Introduction ........................................................................................................................................... 6
1.1 Objective of GPS SPS Performance Analysis Report ................................................................... 6
1.2 Report Overview ........................................................................................................................... 7
1.3 Summary of Performance Requirements and Metrics .................................................................. 7
2 PDOP Availability Standard ............................................................................................................... 12
3 NANU Summary and Evaluation ....................................................................................................... 15
3.1 Satellite Outages from NANU Reports ....................................................................................... 15
3.2 Service Availability Standard ..................................................................................................... 17
4 Service Reliability Standard................................................................................................................ 19
5 Accuracy Standard .............................................................................................................................. 20
5.1 Position Accuracy ....................................................................................................................... 21
5.2 Time Transfer Accuracy ............................................................................................................. 23
5.3 Range Domain Accuracy ............................................................................................................ 24
6 Solar Storms ........................................................................................................................................ 30
7 IGS Data.............................................................................................................................................. 33
8 RAIM Performance ............................................................................................................................. 36
8.1 Site Performance ......................................................................................................................... 36
8.2 RAIM Coverage .......................................................................................................................... 37
8.3 RAIM Airport Analysis .............................................................................................................. 40
9 GPS Test NOTAMs Summary ............................................................................................................ 44
9.1 GPS Test NOTAMs Issued ......................................................................................................... 44
9.2 Tracking and Trending of GPS Test NOTAMs .......................................................................... 44
9.3 GPS Availability ......................................................................................................................... 47
10 Appendices ...................................................................................................................................... 53
10.1 Appendix A: Performance Summary .......................................................................................... 53
10.2 Appendix B: Geomagnetic Data ................................................................................................. 56
10.3 Appendix C: Performance Analysis (PAN) Problem Report ...................................................... 58

FAA GPS Performance Analysis Report July 31, 2014
4 Report 85
10.4 Appendix D: Glossary ................................................................................................................. 59
List of Figures
Figure 2-1 World GPS Maximum PDOP ................................................................................................... 13Figure 2-2 Satellite Visibility Profile for Worst-Case Point ....................................................................... 14Figure 5-1 Global Vertical Error Histogram ............................................................................................... 22Figure 5-2 Global Horizontal Error Histogram ........................................................................................... 22Figure 5-3 Time Transfer Error .................................................................................................................. 23Figure 5-4 Distribution of Daily Max Range Errors ................................................................................... 27Figure 5-5 Distribution of Daily Max Range Rate Errors ........................................................................... 27Figure 5-6 Distribution of Daily max Range Acceleration Errors .............................................................. 28Figure 5-7 Range Error Histogram ............................................................................................................. 28Figure 5-8 Maximum Range Error Per Satellite ......................................................................................... 29Figure 5-9 Maximum Range Rate Error Per Satellite ................................................................................. 29Figure 5-10 Maximum Range Acceleration Error Per Satellite .................................................................. 29Figure 6-1 K-Index for 7-9 June 2014 ........................................................................................................ 31Figure 6-2 K-Index for 11-13 April 2014 ................................................................................................... 31Figure 6-3 K-Index for 22-24 May 2014 .................................................................................................... 31Figure 7-1 Selected IGS Site Locations ...................................................................................................... 34Figure 7-2 GPS SPS 95% Horizontal Accuracy Trends at Selected IGS Sites ........................................... 35Figure 7-3 GPS SPS 95% Vertical Accuracy Trends at Selected IGS Sites ............................................... 35Figure 8-1 RAIM RNP 0.1 Coverage ......................................................................................................... 38Figure 8-2 RAIM RNP 0.3 Coverage ......................................................................................................... 38Figure 8-3 RAIM World Wide Coverage Trend ......................................................................................... 39Figure 8-4 RAIM RNP Coverage Trend for WAAS NPA Service Area .................................................... 39Figure 8-5 RAIM RNP 0.1 Airport Availability ......................................................................................... 40Figure 8-6 RAIM RNP 0.3 Airport Availability ......................................................................................... 41Figure 8-7 RAIM RNP 0.1 Airport Outages ............................................................................................... 42Figure 8-8 RAIM RNP 0.3 Airport Outages ............................................................................................... 43Figure 9-1 GPS Test NOTAMs @ FL400 .................................................................................................. 45Figure 9-2 GPS NOTAMs @ FL250 .......................................................................................................... 45Figure 9-3 GPS NOTAMs @ 10k Feet ....................................................................................................... 46Figure 9-4 GPS NOTAMs @ 4k Feet ......................................................................................................... 46Figure 9-5 GPS NOTAMs @ 50 Feet ......................................................................................................... 46

FAA GPS Performance Analysis Report July 31, 2014
5 Report 85
List of Tables
Table 1-1 SPS SIS Performance Requirements Standards ........................................................................... 8Table 2-1 PDOP Availability Statistics ...................................................................................................... 12Table 3-1 NANUs Affecting Satellite Availability ..................................................................................... 15Table 3-2 NANUs Forecasted to Affect Satellite Availability ................................................................... 16Table 3-3 Cancelled NANUs ...................................................................................................................... 16Table 3-4 GPS Satellite Maintenance Statistics .......................................................................................... 16Table 3-5 Accuracies Exceeding Threshold Statistics ................................................................................ 18Table 4-1 User Range Error Accuracy ........................................................................................................ 19Table 5-1 Horizontal & Vertical Accuracy Statistics for the Quarter ......................................................... 21Table 5-2 Range Error Statistics ................................................................................................................. 24Table 5-3 Range Rate Error Statistics ......................................................................................................... 25Table 5-4 Range Acceleration Error Statistics ............................................................................................ 26Table 6-1 Horizontal & Vertical Accuracy Statistics for June 8, 2014 ....................................................... 32Table 7-1 Selected IGS Site Information .................................................................................................... 33Table 7-2 GPS SPS Performance at Selected High Rate IGS Sites ............................................................ 34Table 8-1 RAIM Site Statistics ................................................................................................................... 37Table 9-1 GPS test NOTAM Durations ...................................................................................................... 44Table 9-2 GPS Test NOTAM Affected Areas (Square Miles) by Altitude ................................................ 44Table 9-3 NOTAM Impact to GPS Availability ......................................................................................... 47Table 10-1 Performance Summary ............................................................................................................. 53

FAA GPS Performance Analysis Report July 31, 2014
6 Report 85
1 Introduction
1.1 Objective of GPS SPS Performance Analysis Report
In 1993, the FAA began monitoring and analyzing Global Positioning System (GPS) Standard Positioning Service (SPS) performance data. At present, the FAA has approved GPS and WAAS for IFR operations and is developing Local Area Augmentation (LAAS), which is an additional GPS augmentation system. In order to ensure the safe and effective use of GPS and its augmentation systems within the NAS, it is critical that characteristics of GPS performance as well as specific causes for service outages be monitored and understood. To accomplish this objective, GPS SPS performance data is documented in a quarterly GPS Analysis report. This report contains data collected at the following twenty-eight WAAS reference station locations:
• Bethel, AK • Billings, MT • Fairbanks, AK • Cold Bay, AK • Kotzebue, AK • Juneau, AK • Albuquerque, NM • Anchorage, AK • Boston, MA • Washington, D.C. • Honolulu, HI • Houston, TX • Kansas city, KS • Los Angeles, CA • Salt Lake City, UT • Miami, FL • Minneapolis, MI • Oakland, CA • Cleveland, OH • Seattle, WA • San Juan, PR • Atlanta, GA • Barrow, AK • Merida, Mexico • Gander, Canada • Tapachula, Mexico • San Jose Del Cabo, Mexico • Iqaluit, Canada
The analysis of the data is divided into the four performance categories stated in the Standard Positioning Service Performance Specification (September 2008). These categories are:
• PDOP Availability Standard • Service Availability Standard • Service Reliability Standard • Positioning, Ranging and Timing Accuracy Standard
The results were then compared to the performance parameters stated in the SPS.
FAA GPS Performance Analysis Report July 31, 2014
7 Report 85
1.2 Report Overview Section 2 of this report summarizes the results obtained from the coverage calculation program developed by the WAAS test team at the William J. Hughes Technical Center. The SPS coverage area program uses the GPS satellite almanacs to compute each satellite position as a function of time for a selected day of the week. This program establishes a 5-degree grid between 180 degrees east and 180 degrees west, and from 80 degrees north and 80 degrees south. The program then computes the PDOP at each grid point (1485 total grid points) every minute for the entire day and stores the results. After the PDOP’s have been saved the 99.99% index of 1-minute PDOP at each grid point is determined and plotted as contour lines (Figure 2-1). The program also saves the number of satellites used in PDOP calculation at each grid point for analysis. Section 3 summarizes the GPS constellation performance by providing the “Notice: Advisory to Navstar Users” (NANU) messages to calculate the total time of forecasted and actual satellite outages. This section also evaluates the Service Availability Standard using 24-hour 95% horizontal and vertical position accuracy values. Section 4 summarizes service reliability performance. It will be reported at the end of the first year of this analysis because the SPS standard is based on a measurement interval of one year. Data for the quarter is provided for completeness. Section 5 provides the position accuracies based on data collected on a daily basis at one-second intervals. This section also provides the statistics on the range error, range error rate and range acceleration error for each satellite. The overall average, maximum, minimum and standard deviations of the range rates and accelerations are tabulated for each satellite. In Section 6, the data collected during solar storms is analyzed to determine the effects, if any, of GPS SPS performance. Section 7 provides an analysis of GPS-SPS accuracy performance from a selection of high rate IGS stations around the world. Section 8 provides a summary of GPS Test NOTAMs. Section 9 provides four appendices to summarize the data found in this report and provide further information.
Appendix A provides a summary of all the results as compared to the SPS specification.
Appendix B provides the geomagnetic data used for Section 6.
Appendix C provides a PAN Problem Report.
Appendix D provides a glossary of terms used in this PAN report. This glossary was obtained directly from the GPS SPS specification document (September 2008).
1.3 Summary of Performance Requirements and Metrics Table 1-1 over the next four pages lists the performance parameters from the SPS and identifies those parameters verified in this report.

FAA GPS Performance Analysis Report July 31, 2014
8 Report 85
Table 1-1 SPS SIS Performance Requirements Standards
Per-Satellite Coverage Conditions and Constraints Evaluated in This Report
Terrestrial Service Volume: 100% Coverage Space Service Volume: No Coverage Performance Specified
• For any health or marginal SPS SIS
Constellation Coverage Conditions and Constraints Terrestrial Service Volume: 100% Coverage Space Service Volume: No Coverage Performance Specified
• For any healthy or marginal SPS SIS
User Range Error Accuracy
Conditions and Constraints
Single Frequency C/A-Code • ≤ 7.8m 9%% Global Average URE during normal operations over All AODs • ≤ 6.0m 95% Global Average URE during operations at Zero AOD • ≤ 12.8m 95% Global Average URE during normal operations at Any AOD
• For any healthy SPS SIS • Neglecting single-frequency ionospheric delay model errors • Including group delay time correction (TGD) errors at L1 • Including inter-signal bias (P(Y)-code to C/A-code) errors at L1
Single Frequency C/A-Code • ≤ 30m 99.94% Global Average URE during normal operations • ≤ 30m 99.79% Worst Case single point average during normal operations.
• For any healthy SPS SIS. • Neglecting single-frequency ionospheric delay model errors • Including group delay time correction (TGD) errors at L1 • Including inter-signal bias (P(Y)-code to C/A-code) errors at L1 • Standard based on measurement interval of one year; average of daily values within service volume • Standard based on 3 service failures per year, lasting no more than 6 hours each
User Range Rate Error Accuracy
Conditions and Constraints
Single-Frequency C/A-Code: • ≤ 6 mm/sec 95% Global Average URRE over any 3-second interval during normal operations at Any AOD
• For any healthy SPS SIS • Neglecting all perceived pseudorange rate errors attributable to pseudorange step changes caused by NAV message data cutovers • Neglecting single-frequency ionospheric delay model errors

FAA GPS Performance Analysis Report July 31, 2014
9 Report 85
User Range Acceleration Error Accuracy
Conditions and Constraints Evaluated in This Report
Single-Frequency C/A-Code: • ≤ 2 mm/sec2 95% Global average URAE over any 3-second interval during normal operations at Any AOD
• For any healthy SPS SIS • Neglecting all perceived pseudorange rate errors attributable to pseudorange step changes caused by NAV message data cutovers • Neglecting single-frequency ionospheric delay model errors
Coordinated Universal Time Offset Error
Accuracy
• ≤ 40 nanoseconds 95% Global average UTCOE during normal operations at Any AOD.
• For any healthy SPS SIS
Instantaneous URE Integrity
Conditions and Constraints
Single-Frequency C/A-Code: • ≤ 1x10⁻⁵ Probability over any hour of the SPS SIS Instantaneous URE exceeding the NTE tolerance without a timely alert during normal operations.
• For any healthy SPS SIS • SPS SIS URE NTE tolerance defined to be ±4.42 times the upper bound on the URA value corresponding to the URA index “N” currently broadcast by the satellite. • Given that the maximum SPS SIS instantaneous URE did not exceed the NTE tolerance at the start of the hour • Worst case for delayed alert is 6 hours. • Neglecting singe-frequency ionospheric delay model errors
Please see results in the WAAS PAN report.
Instantaneous UTCOE Integrity
Conditions and Constraints
Single-Frequency C/A-Code: • ≤ 1x10⁻⁵ Probability over any hour of the SPS SIS Instantaneous UTCOE exceeding the NTE tolerance without a timely alert during normal operations.
• For any healthy SPS SIS • SPS SIS URE NTE tolerance defined
Unscheduled Failure Interruption Continuity
Conditions and Constraints
Unscheduled Failure Interruptions: • ≥ 0.9998 Probability over any hour of not losing the SPS SIS availability from a slot due to unscheduled interruption
• Calculated as an average over all slots in the 24-slot constellation, normalized annually • Given that the SPS SIS is available from the slot at the start of the hour

FAA GPS Performance Analysis Report July 31, 2014
10 Report 85
Status and Problem Reporting Conditions and Constraints Evaluated in This Report
Scheduled event affecting service • Appropriate NANU issued to the Coast Guard and the FAA at least 48 hours prior to the event
• For any SPS SIS
Unscheduled outage or problem affecting service • Appropriate NANU issued to the Coast Guard and the FAA as soon as possible after the event
• For any SPS SIS
Per-Slot Availability Conditions and Constraints • ≥ 0.957 Probability that a slot in the baseline 24-slot configuration will be occupied by a satellite broadcasting a healthy SPS SIS • ≥ 0.957 Probability that a slot in the expanded configuration will be occupied by a pair of satellites each broadcasting a health SPS SIS
• Calculated as an average over all slots in the 24-slot constellation, normalized annually • Applies to satellites broadcasting a healthy SPS SIS that also satisfy the other performance standards in the SPS performance standard.
Constellation Availability Conditions and Constraints • ≥ 0.98 Probability that at least 21 slots out of the 24 will be occupied either by a satellite broadcasting a healthy SPS SIS in the baseline 24-slot configuration or by a pair of satellites each broadcasting a healthy SPS SIS in the expanded slot configuration • ≥ 0.99999 Probability that at least 20 slots out of the 24 will be occupied either by a satellite broadcasting a healthy SPS SIS in the baseline 24-slot configuration or by a pair of satellites each broadcasting a healthy SPS SIS in the expanded slot configuration
• Calculated as an average over all slots in the 24-slot constellation, normalized annually. • Applies to satellites broadcasting a healthy SPS SIS that also satisfies the other performance standards in the SPS performance standard.
Operational Satellite Count Conditions and Constraints • ≥ 0.95 Probability that the constellation will have at least 24 operational satellites regardless of whether those operational satellites are located in slots or not
• Applies to the total number of operational satellites in the constellation (averaged over any day); where any satellite which appears in the transmitted navigation message almanac is defined to be an operation satellite regardless of whether that satellite is currently broadcasting a healthy SPS SIS or not and regardless of whether the broadcast SPS SIS also satisfies the other performance standards in the SPS performance standard or not.

FAA GPS Performance Analysis Report July 31, 2014
11 Report 85
PDOP Availability Conditions and Constraints Evaluated in This Report
• ≥ 98% global PDOP of 6 or less • ≥ 88% worst site PDOP of 6 or less
• Defined for a position/time solution meeting the representative user conditions and operating within the service volume over any 24-hour interval
Service Availability Conditions and Constraints • ≥ 99% Horizontal Service Availability, average location • ≥ 99% Vertical Service Availability, average location
• 17m Horizontal (SIS only) 95% threshold • 37m Vertical (SIS only) 95% threshold • Defined for a position/time solution meeting the representative user conditions and operating within the service volume over any 24-hour interval.
• ≥ 90% Horizontal Service Availability, worst-case location • ≥ 90% Vertical Service Availability, worst-case location
• 17m Horizontal (SIS only) 95% threshold • 37m Vertical (SIS only) 95% threshold • Defined for a position/time solution meeting the representative user conditions and operating within the service volume over any 24-hour interval.
Position/Time Accuracy Conditions and Constraints Global Average Position Domain Accuracy • ≤ 9m 95% Horizontal Error • ≤ 15m 95% Vertical Error
• Defined for a position/time solution meeting the representative user conditions • Standard based on a measurement interval of 24 hours averaged over all points in the service volume.
Worst Site Position Domain Accuracy • ≤ 17m 95% Horizontal Error • ≤ 37m 95% Vertical Error
• Defined for a position/time solution meeting the representative user conditions • Standard based on a measurement interval of 24 hours averaged over all points in the service volume.
Time Transfer Domain Accuracy • ≤ 40 nanoseconds time transfer error 95% of time (SIS only)
• Defined for a time transfer solution meeting the representative user conditions • Standard based on a measurement interval of 24 hours averaged over all points in the service volume.

FAA GPS Performance Analysis Report July 31, 2014
12 Report 85
2 PDOP Availability Standard
PDOP Availability Standard Conditions and Constraints ≥ 98% global PDOP of 6 or less ≥ 88% worst site PDOP of 6 or less
• Defined for a position/time solution meeting the
representative user conditions and operating within the service volume over any 24-hour interval
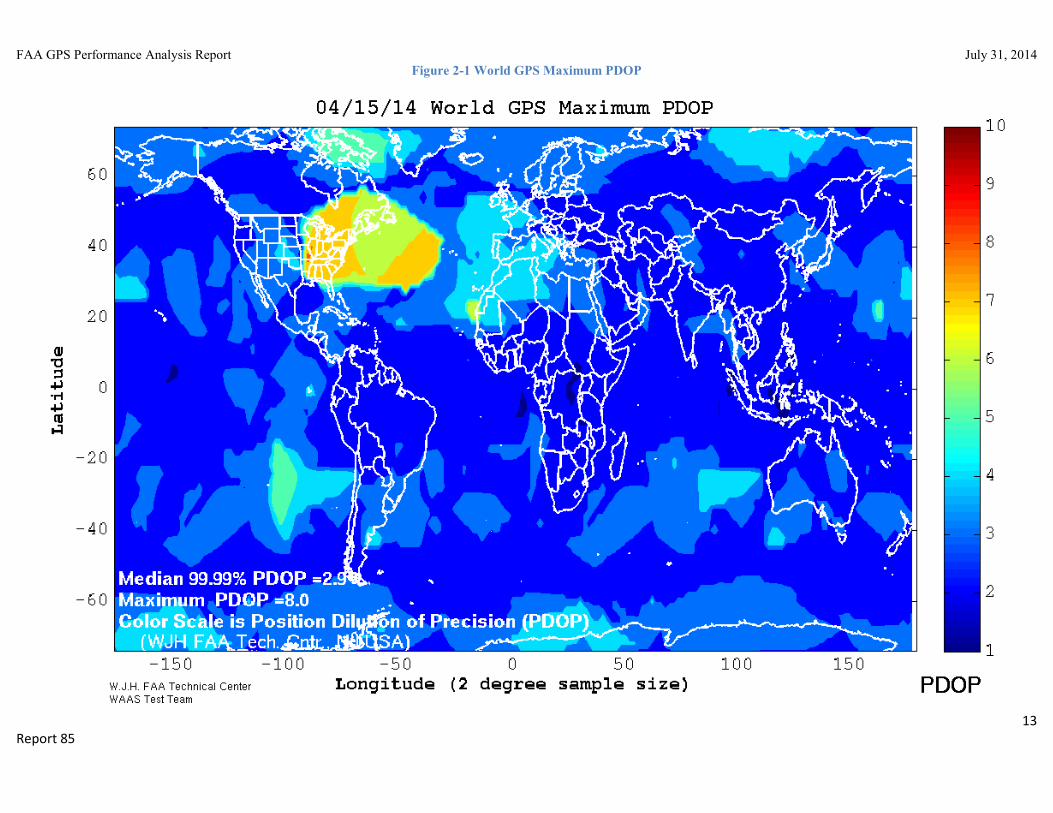
Almanacs for GPS weeks used for this coverage portion of the report were obtained from the Coast Guard web site (www.navcen.uscg.mil). Using these almanacs, an SPS coverage area program developed by the WAAS test team was used to calculate the PDOP at every 5o point between longitudes of 180W to 180E and 80S and 80N at one-minute intervals. This gives a total of 1440 samples for each of the 2376 grid points in the coverage area. Table 2-1 provides the global averages and worst-case availability over a 24-hour period for each week. Table 2-1 also gives the global 99.9% PDOP value for each of the thirteen GPS Weeks. The PDOP was 2.963 or better 99.9% of the time for each of the 24-hour intervals. Figure 2-1 is a contour plot of PDOP values over the entire globe. Inside each contour area, the PDOP value is greater than or equal to the contour value shown in the legend for that color line. That areas’ value is also less than the next higher contour value, unless another contour line lies within the current area. A single “DOP hole” where the PDOP value is greater than 6 was evaluated for satellite visibility for one 24-hour interval from the week shaded in Table 2-1. The histogram in Figure 2-2 shows the satellite visibility at the DOP hole position for the 24 hour interval in question. The GPS coverage performance evaluated met the specifications stated in the SPS.
Table 2-1 PDOP Availability Statistics
Date Range of Week Global 99.9% PDOP Value
Global Average (Spec: > 98%)
Worst-Case Point (Spec: > 88%)
30 Mar – 5 Apr 2.948 100 99.861 6 – 12 Apr 2.942 100 99.861
13 – 19 Apr 2.934 100 99.931 20 – 26 Apr 2.933 100 99.931
27 Apr – 3 May 2.931 100 100 4 – 10 May 2.929 100 99.931
11 – 17 May 2.928 100 100 18 – 24 May 2.957 100 100 25 – 31 May 2.963 100 100
1 – 7 Jun 2.955 100 100 8 – 14 Jun 2.954 100 100
15 – 21 Jun 2.899 100 99.931 22 – 28 Jun 2.904 100 99.861
Dilution of Precision (DOP): The magnifying effect on GPS position error induced by mapping GPS range errors into position within the specified coordinate system through the geometry of the position solution. The DOP varies as a function of satellite positions relative to user position. The DOP may be represented in any user local coordinate desired. Examples are HDOP for local horizontal, VDOP for local vertical, PDOP for all three coordinates, and TDOP for time.
PDOP Availability: The percentage of time over any 24-hour interval that the PDOP value is less than or equal to its threshold for any point within the service volume.
FAA GPS Performance Analysis Report July 31, 2014
13 Report 85
Figure 2-1 World GPS Maximum PDOP

FAA GPS Performance Analysis Report July 31, 2014
14 Report 85
Figure 2-2 Satellite Visibility Profile for Worst-Case Point
FAA GPS Performance Analysis Report July 31, 2014
15 Report 85
3 NANU Summary and Evaluation
Status and Problem Reporting Conditions and Constraints
Scheduled event affecting service • Appropriate NANU issued to the Coast Guard and the FAA at least 48 hours prior to the event
• For any SPS SIS
Unscheduled outage or problem affecting service • Appropriate NANU issued to the Coast Guard and the FAA as soon as possible after the event
• For any SPS SIS
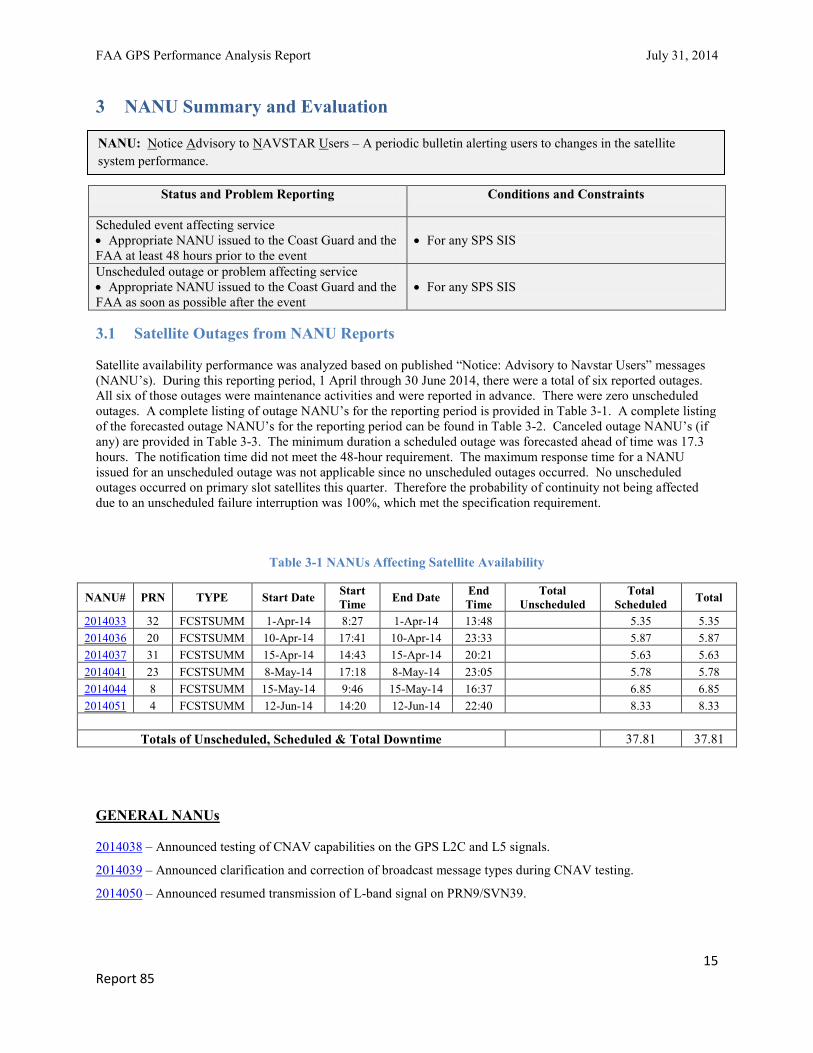
3.1 Satellite Outages from NANU Reports Satellite availability performance was analyzed based on published “Notice: Advisory to Navstar Users” messages (NANU’s). During this reporting period, 1 April through 30 June 2014, there were a total of six reported outages. All six of those outages were maintenance activities and were reported in advance. There were zero unscheduled outages. A complete listing of outage NANU’s for the reporting period is provided in Table 3-1. A complete listing of the forecasted outage NANU’s for the reporting period can be found in Table 3-2. Canceled outage NANU’s (if any) are provided in Table 3-3. The minimum duration a scheduled outage was forecasted ahead of time was 17.3 hours. The notification time did not meet the 48-hour requirement. The maximum response time for a NANU issued for an unscheduled outage was not applicable since no unscheduled outages occurred. No unscheduled outages occurred on primary slot satellites this quarter. Therefore the probability of continuity not being affected due to an unscheduled failure interruption was 100%, which met the specification requirement.
Table 3-1 NANUs Affecting Satellite Availability
NANU# PRN TYPE Start Date Start Time End Date End
Time Total
Unscheduled Total
Scheduled Total
32 2014033 FCSTSUMM 1-Apr-14 8:27 1-Apr-14 13:48 5.35 5.35 20 2014036 FCSTSUMM 10-Apr-14 17:41 10-Apr-14 23:33 5.87 5.87 31 2014037 FCSTSUMM 15-Apr-14 14:43 15-Apr-14 20:21 5.63 5.63 23 2014041 FCSTSUMM 8-May-14 17:18 8-May-14 23:05 5.78 5.78 8 2014044 FCSTSUMM 15-May-14 9:46 15-May-14 16:37 6.85 6.85 4 2014051 FCSTSUMM 12-Jun-14 14:20 12-Jun-14 22:40 8.33 8.33
Totals of Unscheduled, Scheduled & Total Downtime 37.81 37.81
GENERAL NANUs
2014038 – Announced testing of CNAV capabilities on the GPS L2C and L5 signals.
2014039 – Announced clarification and correction of broadcast message types during CNAV testing.
2014050 – Announced resumed transmission of L-band signal on PRN9/SVN39.
NANU: Notice Advisory to NAVSTAR Users – A periodic bulletin alerting users to changes in the satellite system performance.

FAA GPS Performance Analysis Report July 31, 2014
16 Report 85
Table 3-2 NANUs Forecasted to Affect Satellite Availability
NANU # PRN Type Start Date
Start Time
End Date
End Time
Total Comments
32 2014031 FCSTDV 1-Apr 8:00 1-Apr 20:00 12 2014033 20 2014034 FCSTDV 10-Apr 17:00 11-Apr 5:00 12 2014036 31 2014035 FCSTDV 15-Apr 14:30 16-Apr 2:30 12 2014037 23 2014040 FCSTDV 8-May 17:00 9-May 5:00 12 2014041 8 2014043 FCSTDV 15-May 9:00 15-May 21:00 12 2014044 4 2014048 FCSTDV 12-Jun 14:00 13-Jun 2:00 12
2014051
Total Forecasted Downtime 72
Table 3-3 Cancelled NANUs
NANU# PRN Type Start Date Start Time Comments
Satellite Reliability, Maintainability, and Availability (RMA) data is being collected based on published “Notice: Advisory to Navstar Users” messages (NANU’s). This data has been summarized in Table 3-4. The “Total Satellite Observed MTTR” was calculated by taking the average downtime of all satellite outage occurrences. Scheduled downtime was forecasted in advance via NANU’s. All other downtime reported via NANU was considered unscheduled. The “Percent Operational” was calculated based on the ratio of total actual operating hours to total available operating hours for every satellite.
Table 3-4 GPS Satellite Maintenance Statistics
Satellite Reliability/Maintainability/Availability (RMA) Parameter
1-Apr-14 30-Jun-14
1-Jan-00 30-Jun-14
Total Forecast Downtime (hrs): 72 10176.82
Total Actual Downtime (hrs): 37.81 38255.63
Total Actual Scheduled Downtime (hrs): 37.81 5949.42
Total Actual Unscheduled Downtime (hrs): 0 32306.21
Total Satellite Observed MTTR (hrs): 6.3 48.73
Scheduled Satellite Observed MTTR (hrs): 6.3 9.6
Unscheduled Satellite Observed MTTR (hrs): N/A 195.80
# Total Satellite Outages: 6 785
# Scheduled Satellite Outages: 6 620
# Unscheduled Satellite Outages: 0 165
Percent Operational -- Scheduled Downtime: 99.94 99.85
Percent Operational -- All Downtime: 99.94 99.03
FAA GPS Performance Analysis Report July 31, 2014
17 Report 85
3.2 Service Availability Standard
pa
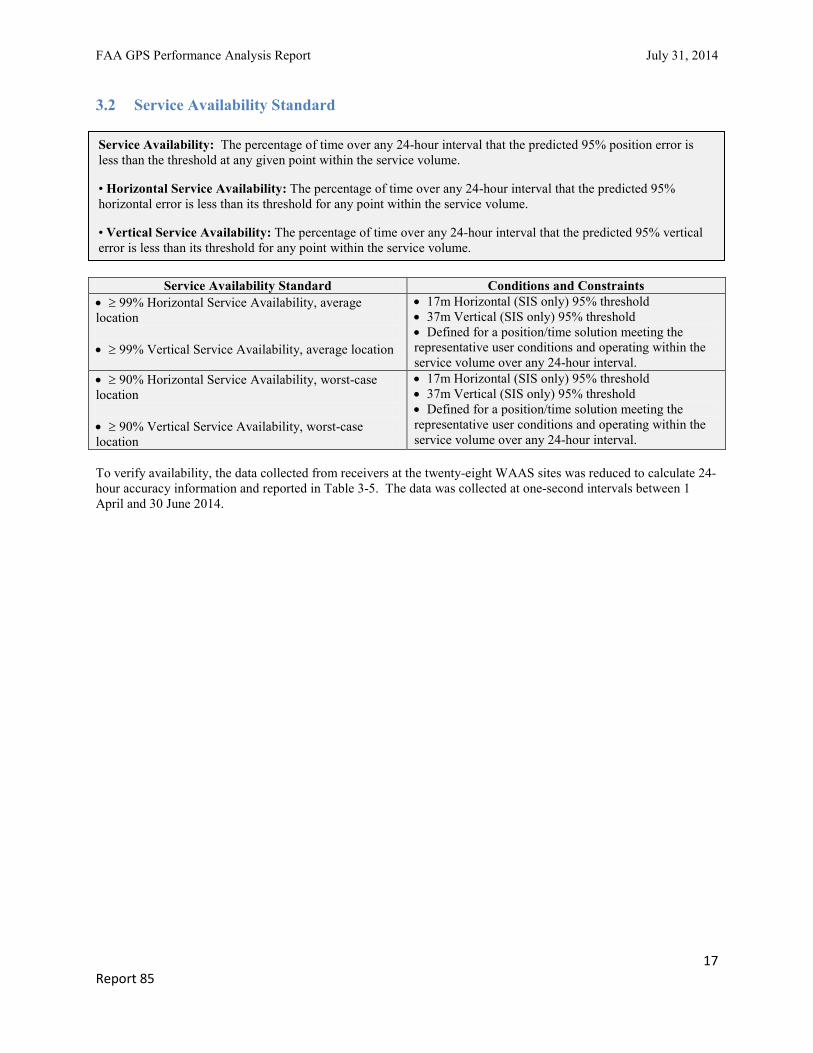
Service Availability Standard Conditions and Constraints • ≥ 99% Horizontal Service Availability, average location • ≥ 99% Vertical Service Availability, average location
• 17m Horizontal (SIS only) 95% threshold • 37m Vertical (SIS only) 95% threshold • Defined for a position/time solution meeting the representative user conditions and operating within the service volume over any 24-hour interval.
• ≥ 90% Horizontal Service Availability, worst-case location • ≥ 90% Vertical Service Availability, worst-case location
• 17m Horizontal (SIS only) 95% threshold • 37m Vertical (SIS only) 95% threshold • Defined for a position/time solution meeting the representative user conditions and operating within the service volume over any 24-hour interval.
To verify availability, the data collected from receivers at the twenty-eight WAAS sites was reduced to calculate 24-hour accuracy information and reported in Table 3-5. The data was collected at one-second intervals between 1 April and 30 June 2014.
Service Availability: The percentage of time over any 24-hour interval that the predicted 95% position error is less than the threshold at any given point within the service volume.
• Horizontal Service Availability: The percentage of time over any 24-hour interval that the predicted 95% horizontal error is less than its threshold for any point within the service volume.
• Vertical Service Availability: The percentage of time over any 24-hour interval that the predicted 95% vertical error is less than its threshold for any point within the service volume.

FAA GPS Performance Analysis Report July 31, 2014
18 Report 85
Table 3-5 Accuracies Exceeding Threshold Statistics
Site Total Number of Seconds of SPS Monitoring
Instances of 24-hour Threshold Failures
Quarters Service Availability %
Albuquerque 7862200 0 100% Anchorage 7857353 0 100% Atlanta 7862201 0 100% Barrow 7860139 0 100% Bethel 7860258 0 100% Billings 7848812 0 100% Boston 7860795 0 100% Cleveland 7862200 0 100% Cold Bay 7860542 0 100% Fairbanks 7854503 0 100% Gander 7858411 0 100% Honolulu 7862165 0 100% Houston 7859444 0 100% Iqaluit 7847846 0 100% Juneau 7862104 0 100% Kansas City 7862159 0 100% Kotzebue 7862067 0 100% Los Angeles 7862200 0 100% Merida 7855130 0 100% Miami 7862170 0 100% Minneapolis 7862205 0 100% Oakland 7862111 0 100% Salt Lake City 7860741 0 100% San Jose Del Cabo 7861875 0 100% San Juan 7862195 0 100% Seattle 7859502 0 100% Tapachula 7855281 0 100% Washington, DC 7862030 0 100%
Global Average over Reporting Period = 100% (SPS Spec. > 95.87%)

FAA GPS Performance Analysis Report July 31, 2014
19 Report 85
4 Service Reliability Standard
User Range Error Accuracy Conditions and Constraints
Single Frequency C/A-Code • ≤ 30m 99.94% Global Average URE during normal operations • ≤ 30m 99.79% Worst Case single point average during normal operations.
• For any healthy SPS SIS. • Neglecting single-frequency ionospheric delay model errors • Including group delay time correction (TGD) errors at L1 • Including inter-signal bias (P(Y)-code to C/A-code) errors at L1 • Standard based on measurement interval of one year; average of daily values within service volume • Standard based on 3 service failures per year, lasting no more than 6 hours each
Table 4-1 shows a comparison to the service reliability standard for range data collected at a set of six receivers across North America. Although the specification calls for yearly evaluations, we will be evaluating this SPS requirement at quarterly intervals. Additional range analysis results can be found in table 5-2. The maximum User Range Error recorded this quarter was 25.495 meters on satellite PRN 26.
Table 4-1 User Range Error Accuracy
Date Range of Data Collection
Site Number of Samples This Quarter
Number of Samples where SPS URE
> 30m NTE
Percentage
1 Jan – 31 Mar 2014 Boston 65,564,799 0 100% 1 Jan – 31 Mar 2014 Honolulu 68,346,087 0 100% 1 Jan – 31 Mar 2014 Los Angeles 67,699,525 0 100% 1 Jan – 31 Mar 2014 Miami 64,698,365 0 100% 1 Jan – 31 Mar 2014 Merida 68,066,686 0 100% 1 Jan – 31 Mar 2014 Juneau 66,873,690 0 100%
1 Jan – 31 Mar 2014 Global 401,249,152 0 100%
Service Reliability: The percentage of time over a specific time interval that the instantaneous SIS SPS URE is maintained within a specified reliability threshold at any given point within the service volume, for all healthy GPS satellites.

FAA GPS Performance Analysis Report July 31, 2014
20 Report 85
5 Accuracy Standard
Position/Time Accuracy Conditions and Constraints
Global Average Position Domain Accuracy • ≤ 9m 95% Horizontal Error • ≤ 15m 95% Vertical Error
• Defined for a position/time solution meeting the representative user conditions • Standard based on a measurement interval of 24 hours averaged over all points in the service volume.
Worst Site Position Domain Accuracy • ≤ 17m 95% Horizontal Error • ≤ 37m 95% Vertical Error
• Defined for a position/time solution meeting the representative user conditions • Standard based on a measurement interval of 24 hours averaged over all points in the service volume.
Time Transfer Domain Accuracy • ≤ 40 nanoseconds time transfer error 95% of time (SIS only)
• Defined for a time transfer solution meeting the representative user conditions • Standard based on a measurement interval of 24 hours averaged over all points in the service volume.
User Range Accuracy Conditions and Constraints Single Frequency C/A-Code • ≤ 7.8m 9%% Global Average URE during normal operations over All AODs • ≤ 6.0m 95% Global Average URE during operations at Zero AOD • ≤ 12.8m 95% Global Average URE during normal operations at Any AOD
• For any healthy SPS SIS • Neglecting single-frequency ionospheric delay model errors • Including group delay time correction (TGD) errors at L1 • Including inter-signal bias (P(Y)-code to C/A-code) errors at L1
Single-Frequency C/A-Code: • ≤ 6 mm/sec 95% Global Average URRE over any 3-second interval during normal operations at Any AOD
• For any healthy SPS SIS • Neglecting all perceived pseudorange rate errors attributable to pseudorange step changes caused by NAV message data cutovers • Neglecting single-frequency ionospheric delay model errors
Single-Frequency C/A-Code: • ≤ 2 mm/sec2 95% Global average URAE over any 3-second interval during normal operations at Any AOD
• For any healthy SPS SIS • Neglecting all perceived pseudorange rate errors attributable to pseudorange step changes caused by NAV message data cutovers • Neglecting single-frequency ionospheric delay model errors
Coordinated Universal Time Offset Error Accuracy Conditions and Constraints • ≤ 40 nanoseconds 95% Global average UTCOE during normal operations at Any AOD.
• For any healthy SPS SIS
Positioning Accuracy: The statistical difference, at a 95% probability, between position measurements and a surveyed benchmark for any point within the service volume over any 24-hour interval.
• Horizontal Positioning Accuracy: The statistical difference, at a 95% probability, between horizontal position measurements and a surveyed benchmark for any point within the service volume over any 24-hour interval.
• Vertical Positioning Accuracy: The statistical difference, at a 95% probability, between vertical position measurements and a surveyed benchmark for any point within the service volume over any 24-hour interval.

FAA GPS Performance Analysis Report July 31, 2014
21 Report 85
5.1 Position Accuracy The data used for this section was collected for every second from 1 April through 30 June 2014 at the selected WAAS locations. Table 5-1 provides the 95% and 99.99% horizontal and vertical error accuracies for the quarter. Every twenty-four hour analysis period this quarter passed both the worst-case and global position accuracy requirements set forth by the SPS specification.
Table 5-1 Horizontal & Vertical Accuracy Statistics for the Quarter
Site 95% Vertical (Meters)
95% Horizontal (Meters)
99.99% Vertical (Meters)
99.99% Horizontal (Meters)
Albuquerque 4.286 3.021 10.590 6.102 Anchorage 4.272 3.264 10.808 6.979 Atlanta 4.163 3.098 8.704 6.345 Barrow 4.650 3.164 12.593 6.573 Bethel 4.395 3.127 11.264 7.044 Billings 4.084 2.299 8.569 4.723 Boston 4.158 2.504 9.497 4.865 Cleveland 4.063 2.567 9.794 4.744 Cold Bay 4.529 2.415 11.436 5.034 Fairbanks 4.200 3.412 10.539 7.052 Gander 4.102 2.540 8.642 5.735 Honolulu 7.057 8.465 19.354 16.851 Houston 4.587 3.766 10.657 7.221 Iqaluit 4.753 2.322 14.033 5.217 Juneau 4.044 3.029 10.620 6.652 Kansas City 4.145 2.580 9.020 5.266 Kotzebue 4.437 3.524 11.456 7.149 Los Angeles 4.567 3.421 11.446 7.208 Merida 5.828 4.604 13.923 12.009 Miami 5.023 4.019 12.837 9.467 Minneapolis 4.029 2.361 9.180 4.949 Oakland 4.610 3.107 11.515 6.805 Salt Lake City 4.148 2.510 9.526 5.544 San Jose Del Cabo 5.725 4.951 15.827 10.842 San Juan 6.406 3.943 17.545 14.096 Seattle 4.146 2.192 10.191 5.981 Tapachula 6.599 4.966 15.028 10.876 Washington, DC 4.135 2.652 9.979 4.595
Figures 5-1 and 5-2 are the combined histograms of the vertical and horizontal errors for all twenty-eight WAAS sites from 1 April to 30 June 2014.

FAA GPS Performance Analysis Report July 31, 2014
22 Report 85
Figure 5-1 Global Vertical Error Histogram
Figure 5-2 Global Horizontal Error Histogram

FAA GPS Performance Analysis Report July 31, 2014
23 Report 85
5.2 Time Transfer Accuracy The GPS time error data between 1 April and 30 June 2014 was downloaded from USNO Internet site. The USNO data file contains the time difference between the USNO master clock and GPS system time for each GPS satellites during the time period. Over 10,000 samples of GPS time error are contained in the USNO data file. In order to evaluate the GPS time transfer error, the data file was used to create a histogram (Fig 5-3) to represent the distribution of GPS time error. The histogram was created by taking the absolute value of time difference between the USNO master clock and GPS system time, then creating data bins with one nanosecond precision. The number of samples in each bin was then plotted to form the histogram in Fig 5-3. The maximum instantaneous UTC offset error (UTCOE) for the quarter was 60.2 nanoseconds. The mean, standard deviation and 95% index of Time Transfer Error, and the maximum UTCOE are all within the requirements of GPS SPS time error.
Figure 5-3 Time Transfer Error
FAA GPS Performance Analysis Report July 31, 2014
24 Report 85
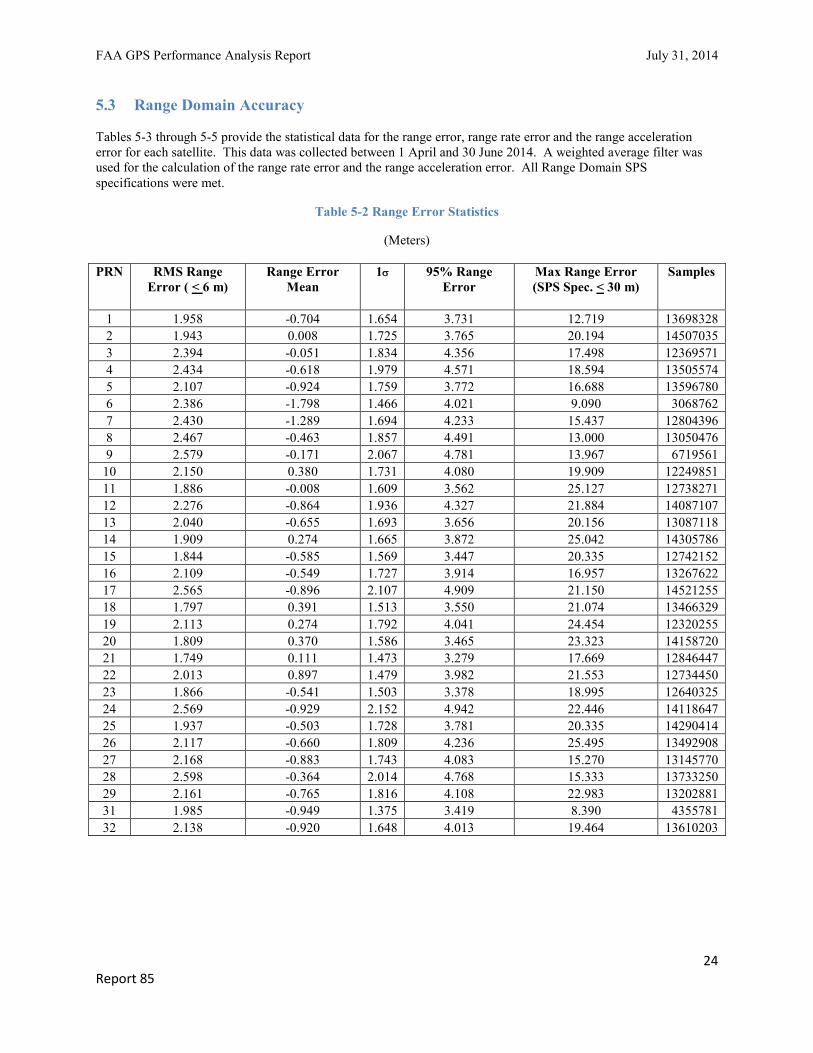
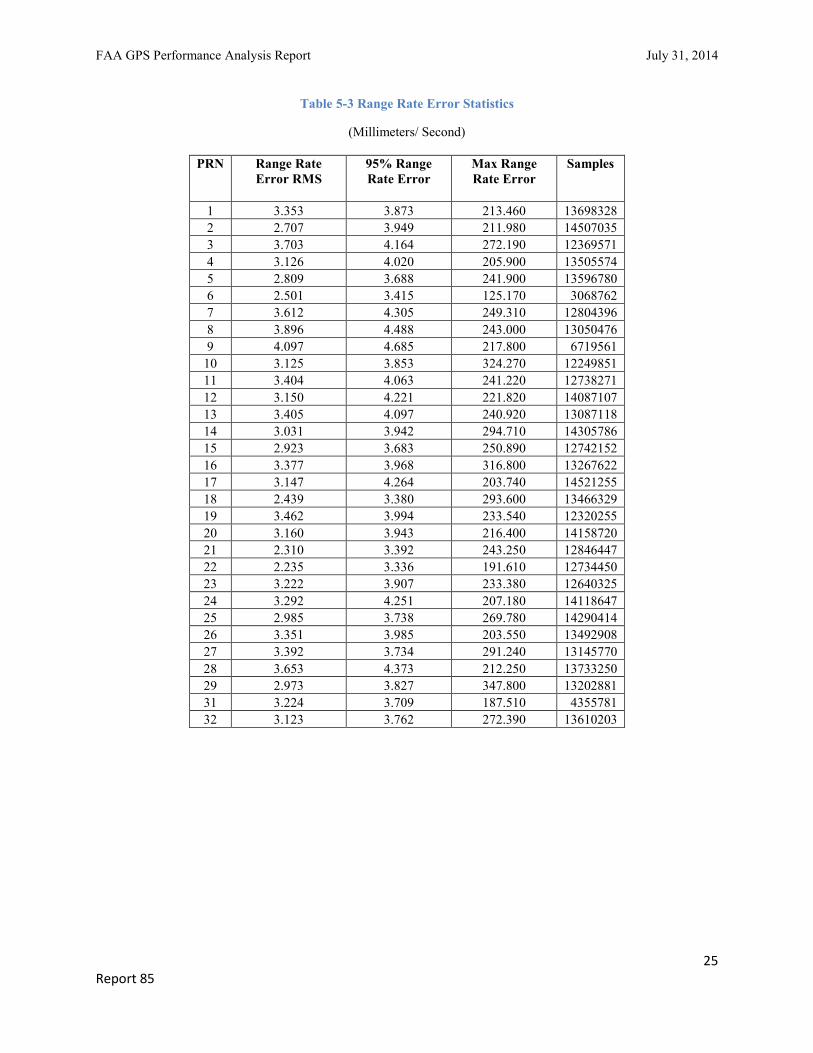
5.3 Range Domain Accuracy Tables 5-3 through 5-5 provide the statistical data for the range error, range rate error and the range acceleration error for each satellite. This data was collected between 1 April and 30 June 2014. A weighted average filter was used for the calculation of the range rate error and the range acceleration error. All Range Domain SPS specifications were met.
Table 5-2 Range Error Statistics
(Meters)
PRN RMS Range Error ( <
6 m)
Range Error Mean
1σ 95% Range Error
Max Range Error (SPS Spec. < 30 m)
Samples
1 1.958 -0.704 1.654 3.731 12.719 13698328 2 1.943 0.008 1.725 3.765 20.194 14507035 3 2.394 -0.051 1.834 4.356 17.498 12369571 4 2.434 -0.618 1.979 4.571 18.594 13505574 5 2.107 -0.924 1.759 3.772 16.688 13596780 6 2.386 -1.798 1.466 4.021 9.090 3068762 7 2.430 -1.289 1.694 4.233 15.437 12804396 8 2.467 -0.463 1.857 4.491 13.000 13050476 9 2.579 -0.171 2.067 4.781 13.967 6719561
10 2.150 0.380 1.731 4.080 19.909 12249851 11 1.886 -0.008 1.609 3.562 25.127 12738271 12 2.276 -0.864 1.936 4.327 21.884 14087107 13 2.040 -0.655 1.693 3.656 20.156 13087118 14 1.909 0.274 1.665 3.872 25.042 14305786 15 1.844 -0.585 1.569 3.447 20.335 12742152 16 2.109 -0.549 1.727 3.914 16.957 13267622 17 2.565 -0.896 2.107 4.909 21.150 14521255 18 1.797 0.391 1.513 3.550 21.074 13466329 19 2.113 0.274 1.792 4.041 24.454 12320255 20 1.809 0.370 1.586 3.465 23.323 14158720 21 1.749 0.111 1.473 3.279 17.669 12846447 22 2.013 0.897 1.479 3.982 21.553 12734450 23 1.866 -0.541 1.503 3.378 18.995 12640325 24 2.569 -0.929 2.152 4.942 22.446 14118647 25 1.937 -0.503 1.728 3.781 20.335 14290414 26 2.117 -0.660 1.809 4.236 25.495 13492908 27 2.168 -0.883 1.743 4.083 15.270 13145770 28 2.598 -0.364 2.014 4.768 15.333 13733250 29 2.161 -0.765 1.816 4.108 22.983 13202881 31 1.985 -0.949 1.375 3.419 8.390 4355781 32 2.138 -0.920 1.648 4.013 19.464 13610203
FAA GPS Performance Analysis Report July 31, 2014
25 Report 85
Table 5-3 Range Rate Error Statistics
(Millimeters/ Second)
PRN Range Rate Error RMS
95% Range Rate Error
Max Range Rate Error
Samples
1 3.353 3.873 213.460 13698328 2 2.707 3.949 211.980 14507035 3 3.703 4.164 272.190 12369571 4 3.126 4.020 205.900 13505574 5 2.809 3.688 241.900 13596780 6 2.501 3.415 125.170 3068762 7 3.612 4.305 249.310 12804396 8 3.896 4.488 243.000 13050476 9 4.097 4.685 217.800 6719561
10 3.125 3.853 324.270 12249851 11 3.404 4.063 241.220 12738271 12 3.150 4.221 221.820 14087107 13 3.405 4.097 240.920 13087118 14 3.031 3.942 294.710 14305786 15 2.923 3.683 250.890 12742152 16 3.377 3.968 316.800 13267622 17 3.147 4.264 203.740 14521255 18 2.439 3.380 293.600 13466329 19 3.462 3.994 233.540 12320255 20 3.160 3.943 216.400 14158720 21 2.310 3.392 243.250 12846447 22 2.235 3.336 191.610 12734450 23 3.222 3.907 233.380 12640325 24 3.292 4.251 207.180 14118647 25 2.985 3.738 269.780 14290414 26 3.351 3.985 203.550 13492908 27 3.392 3.734 291.240 13145770 28 3.653 4.373 212.250 13733250 29 2.973 3.827 347.800 13202881 31 3.224 3.709 187.510 4355781 32 3.123 3.762 272.390 13610203
FAA GPS Performance Analysis Report July 31, 2014
26 Report 85
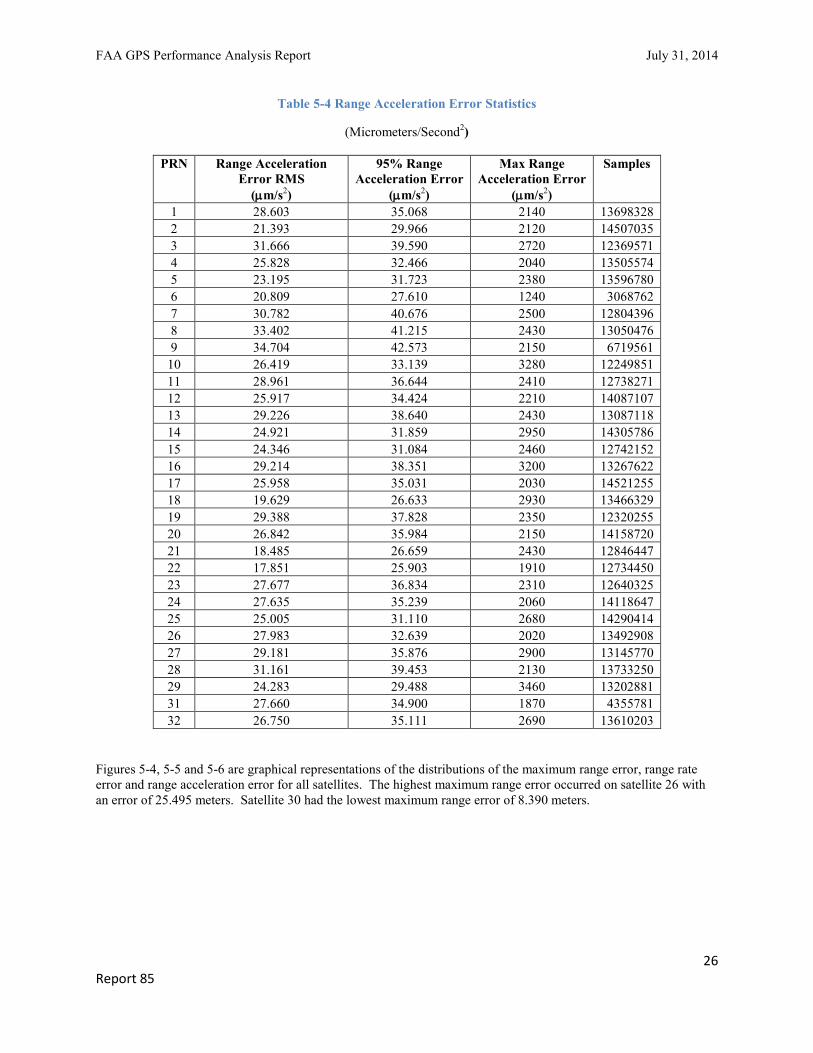
Table 5-4 Range Acceleration Error Statistics
(Micrometers/Second2)
PRN Range Acceleration Error RMS
(µm/s2)
95% Range Acceleration Error
(µm/s2)
Max Range Acceleration Error
(µm/s2)
Samples
1 28.603 35.068 2140 13698328 2 21.393 29.966 2120 14507035 3 31.666 39.590 2720 12369571 4 25.828 32.466 2040 13505574 5 23.195 31.723 2380 13596780 6 20.809 27.610 1240 3068762 7 30.782 40.676 2500 12804396 8 33.402 41.215 2430 13050476 9 34.704 42.573 2150 6719561
10 26.419 33.139 3280 12249851 11 28.961 36.644 2410 12738271 12 25.917 34.424 2210 14087107 13 29.226 38.640 2430 13087118 14 24.921 31.859 2950 14305786 15 24.346 31.084 2460 12742152 16 29.214 38.351 3200 13267622 17 25.958 35.031 2030 14521255 18 19.629 26.633 2930 13466329 19 29.388 37.828 2350 12320255 20 26.842 35.984 2150 14158720 21 18.485 26.659 2430 12846447 22 17.851 25.903 1910 12734450 23 27.677 36.834 2310 12640325 24 27.635 35.239 2060 14118647 25 25.005 31.110 2680 14290414 26 27.983 32.639 2020 13492908 27 29.181 35.876 2900 13145770 28 31.161 39.453 2130 13733250 29 24.283 29.488 3460 13202881 31 27.660 34.900 1870 4355781 32 26.750 35.111 2690 13610203
Figures 5-4, 5-5 and 5-6 are graphical representations of the distributions of the maximum range error, range rate error and range acceleration error for all satellites. The highest maximum range error occurred on satellite 26 with an error of 25.495 meters. Satellite 30 had the lowest maximum range error of 8.390 meters.

FAA GPS Performance Analysis Report July 31, 2014
27 Report 85
Figure 5-4 Distribution of Daily Max Range Errors
Figure 5-5 Distribution of Daily Max Range Rate Errors

FAA GPS Performance Analysis Report July 31, 2014
28 Report 85
Figure 5-6 Distribution of Daily max Range Acceleration Errors
Figure 5-7 Range Error Histogram

FAA GPS Performance Analysis Report July 31, 2014
29 Report 85
Figure 5-8 Maximum Range Error Per Satellite
Figure 5-9 Maximum Range Rate Error Per Satellite
Figure 5-10 Maximum Range Acceleration Error Per Satellite
0.000
5.000
10.000
15.000
20.000
25.000
30.000
1 2 3 4 5 6 7 8 9 10 11 12 13 14 15 16 17 18 19 20 21 22 23 24 25 26 27 28 29 30 31 32
Max
imum
Ran
ge E
rror
(Met
ers)
Satellite PRN Number
0.000 50.000
100.000 150.000 200.000 250.000 300.000 350.000 400.000
1 2 3 4 5 6 7 8 9 10 11 12 13 14 15 16 17 18 19 20 21 22 23 24 25 26 27 28 29 30 31 32
Max
imum
Ran
ge R
ate
Erro
r (M
illim
eter
s/Se
cond
)
Satellite PRN Number
0
500
1000
1500
2000
2500
3000
3500
4000
1 2 3 4 5 6 7 8 9 10 11 12 13 14 15 16 17 18 19 20 21 22 23 24 25 26 27 28 29 30 31 32
Max
imum
Ran
ge A
ccel
. Err
or
(Mic
rom
eter
s/[S
ec *
Sec
])
Satellite PRN Number

FAA GPS Performance Analysis Report July 31, 2014
30 Report 85
6 Solar Storms
Solar storm activity is being monitored in order to assess the possible impact on GPS SPS performance. Solar activity is reported by the Space Weather Prediction Center (SWPC), a division of the National Oceanic and Atmospheric Administration (NOAA). When storm activity is indicated, ionospheric delays of the GPS signal, satellite outages, position accuracy and availability will be analyzed.
The following article was taken from the SEC web site http://swpc.noaa.gov. It briefly explains some of the ideas behind the association of the aurora with geomagnetic activity and a bit about how the ‘K-index’ or ‘K-factor’ works.
The aurora is caused by the interaction of high-energy particles (usually electrons) with neutral atoms in the earth's upper atmosphere. These high-energy particles can ‘excite’ (by collisions) valence electrons that are bound to the neutral atom. The ‘excited’ electron can then ‘de-excite’ and return back to its initial, lower energy state, but in the process it releases a photon (a light particle). The combined effect of many photons being released from many atoms results in the aurora display that you see.
The details of how high energy particles are generated during geomagnetic storms constitute an entire discipline of space science in its own right. The basic idea, however, is that the Earth’s magnetic field (let us say the ‘geomagnetic field’) is responding to an outwardly propagating disturbance from the Sun. As the geomagnetic field adjusts to this disturbance, various components of the Earth’s field change form, releasing magnetic energy and thereby accelerating charged particles to high energies. These particles, being charged, are forced to stream along the geomagnetic field lines. Some end up in the upper part of the earth’s neutral atmosphere and the auroral mechanism begins.
An instrument called a magnetometer may also measure the disturbance of the geomagnetic field. At NOAA’s operations center magnetometer data is received from dozens of observatories in one-minute intervals. The data is received at or near to ‘real-time’ and allows NOAA to keep track of the current state of the geomagnetic conditions. In order to reduce the amount of data NOAA converts the magnetometer data into three-hourly indices, which give a quantitative, but less detailed measure of the level of geomagnetic activity. The K-index scale has a range from 0 to 9 and is directly related to the maximum amount of fluctuation (relative to a quiet day) in the geomagnetic field over a three-hour interval.
The K-index is therefore updated every three hours. The K-index is also necessarily tied to a specific geomagnetic observatory. For locations where there are no observatories, one can only estimate what the local K-index would be by looking at data from the nearest observatory, but this would be subject to some errors from time to time because geomagnetic activity is not always spatially homogenous.
Another item of interest is that the location of the aurora usually changes geomagnetic latitude as the intensity of the geomagnetic storm changes. The location of the aurora often takes on an ‘oval-like’ shape and is appropriately called the auroral oval.
Figures 6-1 through 6-3 show the K-index for three time periods with significant solar activity. Although there were other days with increased solar activity, these time periods were selected as examples. (See Appendix B for the actual geomagnetic data for this reporting period.)

FAA GPS Performance Analysis Report July 31, 2014
31 Report 85
Figure 6-1 K-Index for 7-9 June 2014
Figure 6-2 K-Index for 11-13 April 2014
Figure 6-3 K-Index for 22-24 May 2014

FAA GPS Performance Analysis Report July 31, 2014
32 Report 85
Table 6-1 shows the position accuracy information for the day corresponding to Figure 6-1. The GPS SPS performance met all requirements during all storms that occurred during this quarter.
Table 6-1 Horizontal & Vertical Accuracy Statistics for June 8, 2014
Site 95% Horizontal (Meters)
95% Vertical (Meters)
Maximum Horizontal (Meters)
Maximum Vertical (Meters)
Albuquerque 2.457 3.833 3.493 5.726 Anchorage 3.005 3.507 4.112 5.155 Atlanta 2.289 4.455 2.909 6.060 Barrow 1.835 3.524 2.839 6.020 Bethel 2.817 3.986 3.543 5.397 Billings 2.090 3.227 2.751 4.539 Boston 2.199 4.439 2.852 5.338 Cleveland 2.093 4.283 2.458 5.975 Cold Bay 2.537 2.600 3.063 3.835 Fairbanks 2.786 2.941 4.165 3.969 Gander 2.204 3.921 2.769 5.439 Honolulu 3.289 4.347 4.816 7.937 Houston 2.496 4.374 3.282 5.087 Iqaluit 1.826 4.024 2.780 5.482 Juneau 2.977 3.341 4.550 4.270 Kansas City 2.068 3.522 2.377 4.919 Kotzebue 2.767 3.271 3.918 5.508 Los Angeles 3.292 3.807 4.239 4.984 Merida 2.446 5.386 3.283 7.827 Miami 2.646 6.114 3.205 9.085 Minneapolis 2.041 3.375 2.828 4.798 Oakland 3.222 3.797 3.728 4.888 Salt Lake City 2.179 3.660 2.724 5.077 San Jose Del Cabo 3.641 3.936 4.339 5.522 San Juan 3.294 7.051 4.135 9.460 Seattle 2.186 2.835 2.688 4.986 Tapachula 2.591 4.613 3.989 5.897 Washington, DC 2.510 4.568 2.884 5.811

FAA GPS Performance Analysis Report July 31, 2014
33 Report 85
7 IGS Data
GPS SPS accuracy performance was evaluated at a selection of high rate IGS stations(1). The IGS is a voluntary federation of many worldwide agencies that pool resources and permanent GNSS station data to generate precise GNSS products.
High data rate (1 Hz) sites with good availability that were outside of the WAAS service area, and provided a good geographic distribution have been selected. To facilitate differentiating between GPS accuracy issues and receiver tracking problems, an automatic data screening function excluded errors greater than 500 meters and or times when VDOP or HDOP were greater than 10. The remaining receiver tracking issues are still included in the processing and are forced into the 50.1 meter histogram bin and cause the outliers in the 99.99% statistics and are visible in the 95% accuracy trend plots.
High quality broadcast navigation data and Klobachar model data is created by voting across all available IGS high rate RINEX navigation data. Some manual review was necessary to recover missing navigation data where the number of IGS sites reporting navigation data was below the voting threshold (i.e. 4).
Table 7.1 and Figure 7-1 show the IGS site information and locations. Table 7.2 shows the GPS SPS Accuracy Performance observed at a selection of High Rate IGS sites. Figure 7-2 shows the 95% horizontal accuracy trends at these sites. Figure 7-3 shows the 95% vertical accuracy trends at these sites. A value of zero indicates no data.
(1) J.M. Dow, R.E. Neilan, G. Gendt, "The International GPS Service (IGS): Celebrating the 10th Anniversary and Looking to the Next Decade," Adv. Space Res. 36 vol. 36, no. 3, pp. 320-326, 2005. Doi: 10.1016/j.asr.2005.05.125
Table 7-1 Selected IGS Site Information
ID City Country BOGT Bogota Colombia GUAM Dededo Guam IISC Bangalore India KIRU Kiruna Sweden KOUR Kourou French Guyana MADR Robledo Spain MAL2 Malindi Kenya MAS1 Maspalomas Spain MATE Matera Italy MOBN Obninsk Russian Federation NNOR New Norcia Australia NRIL Norilsk Russian Federation PETS Petropavlovsk-Kamchatka Russian Federation POL2 Bishkek Kyrghyzstan SANT Santiago Chile SUTM Sutherland South Africa TIDB Tidbinbilla Australia UNSA Salta Argentina USUD Usuda Japan

FAA GPS Performance Analysis Report July 31, 2014
34 Report 85
Figure 7-1 Selected IGS Site Locations
Table 7-2 GPS SPS Performance at Selected High Rate IGS Sites
Site 95% Horizontal Error (m)
95% Vertical
Error (m)
99.99% Horizontal Error (m)
99.99% Vertical
Error (m)
Percent Data
Available BOGT 4.37 7.64 8.88 29.61 95.92% GLPS 4.84 6.13 19.84 46.77 98.88%
GUAM 3.74 9.23 8.12 29.27 99.96% IISC 3.83 7.71 8.64 24.69 91.35%
KIRU 2.67 4.40 4.75 9.21 100.00% KOUR 5.36 6.07 13.63 24.01 99.99% MAL2 3.87 4.68 12.95 17.48 98.86% MAS1 5.08 6.68 14.09 22.52 99.39% MATE 7.78 7.49 15.34 25.44 99.99% MOBN 3.19 4.08 10.56 12.32 57.23% NNOR 2.65 5.07 7.26 12.13 64.85% NRIL 2.01 3.85 4.13 9.46 62.29% PETS 2.62 4.93 5.64 15.32 64.57% POL2 2.83 6.15 5.26 11.22 66.52% SANT 3.51 5.38 30.29 27.19 82.94% SUTM 2.23 4.48 6.84 15.25 96.18% TIDB 2.54 4.08 5.19 14.41 99.49% UNSA 5.96 6.63 13.08 24.42 97.45% USUD 4.84 5.57 22.57 33.82 99.97%

FAA GPS Performance Analysis Report July 31, 2014
35 Report 85
Figure 7-2 GPS SPS 95% Horizontal Accuracy Trends at Selected IGS Sites
Figure 7-3 GPS SPS 95% Vertical Accuracy Trends at Selected IGS Sites

FAA GPS Performance Analysis Report July 31, 2014
36 Report 85
8 RAIM Performance Receiver autonomous integrity monitoring (RAIM) is a technology developed to assess the integrity of GPS signals in a GPS receiver system. It is especially important in safety critical GPS applications, such as aviation. In order for a GPS receiver to perform RAIM or fault detection (FD) function, a minimum of five visible satellites with satisfactory geometry must be visible. RAIM has various kinds of implementations; one of them performs consistency checks between all position solutions obtained with various subsets of the visible satellites. The receiver provides an alert to the pilot if the consistency checks fail.
Availability is a performance indicator of the RAIM algorithm. Availability is a function of the geometry of the constellation in view and of other environmental conditions. All the analysis performed here is utilizing the “Fault-Detection with no baro-aiding and SA off” RAIM implementation. Additional modes will be assessed at a future date. The test statistic used is a function of the pseudorange measurement residual (the difference between the expected measurement and the observed measurement) and the amount of redundancy. The test statistic is compared with a threshold value, and is determined based on the requirements for the probability of false alarm (Pfa), the probability of missed detection (Pmd), and the expected measurement noise. In aviation systems, the Pfa is fixed at 1/15000.
The horizontal protection limit (HPL) is a figure which represents the radius of a circle centered on the GPS position solution and is guaranteed to contain the true position of the receiver to within the specifications of the RAIM scheme (i.e. meets the Pfa and Pmd). The HPL is calculated as a function of the RAIM threshold and the satellite geometry at the time of the measurement. The HPL is compared with the horizontal alarm limit (HAL) to determine if RAIM is available. The RNP values shown here are measured in nautical miles, the computed HPL must be less than the RNP value for the service to be available.
8.1 Site Performance Table 8-1 shows the RAIM performance for the twenty-eight sites evaluated. For all sites collected, the minimum percent of time in RNP 0.1 mode was 99.240% at Boston. The minimum percent of time spent in RNP 0.3 mode was 99.996% at Honolulu. The maximum 99% HPL value was 176.442 meters at Washington, DC.

FAA GPS Performance Analysis Report July 31, 2014
37 Report 85
Table 8-1 RAIM Site Statistics
CITY 99% HPL Percent RNP 0.1 Percent RNP 0.1 Albuquerque 123.803 99.933 100 Anchorage 148.967 99.985 100 Atlanta 138.835 99.432 99.997 Barrow 139.973 99.976 100 Bethel 152.270 99.848 100 Billings 145.108 99.955 100 Boston 167.800 99.198 100 Cleveland 163.578 99.923 99.999 Cold Bay 141.943 99.960 100 Fairbanks 136.748 99.991 100 Gander 138.388 99.974 99.997 Honolulu 143.985 99.261 100 Iqaluit 107.571 99.991 99.998 Juneau 160.025 99.533 99.999 Kansas City 135.354 99.982 100 Kotzebue 112.665 99.772 100 Los Angeles 147.256 99.940 100 Merida 126.14 99.990 100 Miami 89.704 100 100 Minneapolis 96.512 99.991 100 Oakland 129.83 99.962 100 Salt Lake City 130.851 99.984 100 San Jose Del Cabo 140.248 99.977 100 San Juan 101.015 100 100 Seattle 118.070 100 100 Tapachula 119.595 99.998 100 Washington DC 85.488 100 100
8.2 RAIM Coverage Figures 8-1 through 8-2 show the world wide RAIM coverage for both RNP 0.1 and RNP 0.3 respectively. Figures 8-3 through 8-4 show the daily RAIM coverage trends between 1 April and 30 June 2014.

FAA GPS Performance Analysis Report July 31, 2014
38 Report 85
Figure 8-1 RAIM RNP 0.1 Coverage
Figure 8-2 RAIM RNP 0.3 Coverage

FAA GPS Performance Analysis Report July 31, 2014
39 Report 85
Figure 8-3 RAIM World Wide Coverage Trend
Figure 8-4 RAIM RNP Coverage Trend for WAAS NPA Service Area

FAA GPS Performance Analysis Report July 31, 2014
40 Report 85
8.3 RAIM Airport Analysis Figures 8-5 and 8-6 shows RAIM RNP 0.1 and RNP 0.3 availability at all U.S. and Canadian airports that have an RNAV (GPS) published approach or better.
Figure 8-5 RAIM RNP 0.1 Airport Availability

FAA GPS Performance Analysis Report July 31, 2014
41 Report 85
Figure 8-6 RAIM RNP 0.3 Airport Availability
Figures 8-7 and 8-8 respectively show the number of RAIM RNP 0.1 and RAIM RNP 0.3 outages for every airport in the U.S. and Canada that have a RNAV (GPS) published approach or better.

FAA GPS Performance Analysis Report July 31, 2014
42 Report 85
Figure 8-7 RAIM RNP 0.1 Airport Outages

FAA GPS Performance Analysis Report July 31, 2014
43 Report 85
Figure 8-8 RAIM RNP 0.3 Airport Outages

FAA GPS Performance Analysis Report July 31, 2014
44 Report 85
9 GPS Test NOTAMs Summary
GPS test NOTAM: Global Positioning System test Not
ices to Airmen - GPS test NOTAMs are issued in the event that GPS is predicted to be unreliable and/or unavailable at a defined location for specific times, as indicated in the NOTAM, due to scheduled testing events.
Status and Problem Reporting Conditions and Constraints
Scheduled event affecting service
• Appropriate GPS Test NOTAM issued to the FAA at least 5 hours prior to the event
• For any SPS SIS
9.1 GPS Test NOTAMs Issued GPS test NOTAMs were tracked and trended from GPS test NOTAMs posted on the FAA PilotWeb website (https://pilotweb.nas.faa.gov/PilotWeb/). During this reporting period, 1 April through 30 June 2014, there were a total of 90 GPS test NOTAMs. The total number of days affected in this reporting period is 67. Tables 8.1 and 8.2 below list the statistics of areas affected and durations. Note that the minimum, average, and maximum durations are on a per GPS test NOTAM basis.
Table 9-1 GPS test NOTAM Durations
Cumulative duration 366.60 hours
Minimum duration 0.50 hours
Average duration 4.03 hours
Maximum duration 10.50 hours
Table 9-2 GPS Test NOTAM Affected Areas (Square Miles) by Altitude
40,000 feet 25,000 feet 10,000 feet 4,000 feet 50 feet
Minimum 114,644 55,982 30,059 19,238 936
Average 717,073 561,296 361,166 333,282 261,302
Maximum 1,073,647 903,454 672,336 668,995 557,309
9.2 Tracking and Trending of GPS Test NOTAMs The GPS Test NOTAMs that are tracked and trended for this reporting period were done with a specialized software analysis tool that is designed to not only trend but also archive GPS Test NOTAMs. It is designed to trend archived GPS Test NOTAMs for any specified time frame. In addition to the data provided in this report, this tool will provide all data presented here along with airports with affected procedures via a web interface. The web interface is available at the following URL: http://waas.faa.gov/static/sog/notam/index.html.

FAA GPS Performance Analysis Report July 31, 2014
45 Report 85
The five plots below illustrate a visual depiction of the affected areas at their corresponding altitudes along with the impacted RNAV routes (indicated in red). Note that some GPS Test NOTAMs occupy the same area and position but differ in effective dates and/or durations.
Figure 9-1 GPS Test NOTAMs @ FL400
Figure 9-2 GPS NOTAMs @ FL250

FAA GPS Performance Analysis Report July 31, 2014
46 Report 85
Figure 9-3 GPS NOTAMs @ 10k Feet
Figure 9-4 GPS NOTAMs @ 4k Feet
Figure 9-5 GPS NOTAMs @ 50 Feet

FAA GPS Performance Analysis Report July 31, 2014
47 Report 85
9.3 GPS Availability The impacts to GPS availability are listed below for the corresponding locations and times. The percent impact to GPS availability over CONUS indicates that GPS is impacted for X % of the total area (total area of CONUS), centered at the indicated latitude/longitude. The last five columns in each table represent the impact to GPS availability at the corresponding altitude range. Altitudes 4,000 feet and under are with respect to above ground level (AGL), all remaining altitudes are with respect to MSL (mean sea level). Each row of the following table represents one GPS Test NOTAM. The remaining tables each represent one GPS Test NOTAM.
Table 9-3 NOTAM Impact to GPS Availability
Percent Impact at each altitude
Start Date End Date Latitude Longitude 50 4000 10000 FL250 FL400
2014-04-01 03:00:00 2014-04-01 12:00:00 33.2339N -106.3058W 11.87 12.69 13.00 17.23 20.74
2014-04-01 14:00:00 2014-04-01 16:00:00 30.3319N -86.4626W 0.00 0.41 0.83 1.44 2.68
2014-04-02 03:30:00 2014-04-02 14:00:00 33.2339N -106.3058W 11.87 12.69 13.00 17.23 20.74
2014-04-03 04:00:00 2014-04-03 14:00:00 33.2339N -106.3058W 11.87 12.69 13.00 17.23 20.74
2014-04-04 03:00:00 2014-04-04 12:00:00 33.2339N -106.3058W 11.87 12.69 13.00 17.23 20.74
2014-04-08 22:00:00 2014-04-08 23:30:00 39.3835N -117.4702W 7.02 8.05 7.95 12.80 16.00
2014-04-09 20:30:00 2014-04-09 22:00:00 39.3835N -117.4702W 7.02 8.05 7.95 12.80 16.00
2014-04-10 22:00:00 2014-04-10 23:30:00 39.3835N -117.4702W 7.02 8.05 7.95 12.80 16.00
2014-04-14 18:30:00 2014-04-15 22:30:00 31.2404N -110.2454W 0.93 1.55 2.58 4.64 6.71
2014-04-15 04:00:00 2014-04-16 09:00:00 32.0300N -109.2115W 8.77 11.04 11.04 14.45 17.13
2014-04-16 09:01:00 2014-04-16 14:00:00 33.2339N -106.3058W 11.87 12.69 13.00 17.23 20.74
2014-04-16 16:00:00 2014-04-16 17:30:00 39.3835N -117.4702W 7.02 8.05 7.95 12.80 16.00

FAA GPS Performance Analysis Report July 31, 2014
48 Report 85
Percent Impact at each altitude
Start Date End Date Latitude Longitude 50 4000 10000 FL250 FL400
2014-04-16 18:30:00 2014-04-16 22:00:00 31.2404N -110.2454W 0.93 1.55 2.58 4.64 6.71
2014-04-16 22:00:00 2014-04-16 23:30:00 39.3835N -117.4702W 7.02 8.05 7.95 12.80 16.00
2014-04-17 05:00:00 2014-04-17 10:00:00 32.0300N -109.2115W 8.77 11.04 11.04 14.45 17.13
2014-04-17 18:30:00 2014-04-17 22:30:00 31.2404N -110.2454W 0.93 1.55 2.58 4.64 6.71
2014-04-18 04:00:00 2014-04-18 09:00:00 32.0300N -109.2115W 8.77 11.04 11.04 14.45 17.13
2014-04-18 09:01:00 2014-04-18 14:00:00 33.2339N -106.3058W 11.87 12.69 13.00 17.23 20.74
2014-04-18 18:30:00 2014-04-18 22:30:00 31.2404N -110.2454W 0.93 1.55 2.58 4.64 6.71
2014-04-19 04:00:00 2014-04-19 09:00:00 32.0300N -109.2115W 8.77 11.04 11.04 14.45 17.13
2014-04-22 22:00:00 2014-04-22 22:30:00 37.2000N -115.3330W 4.02 6.81 6.50 11.76 15.27
2014-04-23 03:00:00 2014-04-23 09:00:00 33.2339N -106.3058W 11.87 12.69 13.00 17.23 20.74
2014-04-23 18:30:00 2014-04-23 22:30:00 31.2404N -110.2454W 0.93 1.55 2.58 4.64 6.71
2014-04-24 18:30:00 2014-04-24 22:30:00 31.2404N -110.2454W 0.93 1.55 2.58 4.64 6.71
2014-04-25 18:30:00 2014-04-25 22:30:00 31.2404N -110.2454W 0.93 1.55 2.58 4.64 6.71
2014-04-29 18:30:00 2014-05-02 22:30:00 32.2425N -105.5650W 6.19 6.71 7.02 11.25 13.73
2014-04-29 19:00:00 2014-04-29 22:30:00 35.5629N -117.3903W 4.13 5.88 8.57 10.84 11.76
2014-05-01 19:00:00 2014-05-01 22:30:00 35.5629N -117.3903W 4.13 5.88 8.57 10.84 11.76
2014-05-03 15:00:00 2014-05-03 17:30:00 40.1840N -113.3428W 13.21 14.96 14.04 21.57 27.45
2014-05-05 15:00:00 2014-05-06 17:30:00 40.1840N -113.3428W 13.21 14.96 14.04 21.57 27.45

FAA GPS Performance Analysis Report July 31, 2014
49 Report 85
Percent Impact at each altitude
Start Date End Date Latitude Longitude 50 4000 10000 FL250 FL400
2014-05-05 18:30:00 2014-05-06 20:00:00 40.1840N -113.3428W 13.21 14.96 14.04 21.57 27.45
2014-05-07 03:00:00 2014-05-10 07:00:00 32.2425N -105.5650W 6.19 6.71 7.02 11.25 13.73
2014-05-07 15:00:00 2014-05-09 17:30:00 40.1840N -113.3428W 13.21 14.96 14.04 21.57 27.45
2014-05-07 18:30:00 2014-05-09 22:00:00 40.1840N -113.3428W 13.21 14.96 14.04 21.57 27.45
2014-05-07 20:00:00 2014-05-09 22:30:00 32.2425N -105.5650W 6.19 6.71 7.02 11.25 13.73
2014-05-10 07:00:00 2014-05-12 12:00:00 32.5511N -113.4746W 1.24 2.68 3.41 5.88 7.12
2014-05-10 18:30:00 2014-05-10 22:30:00 32.2425N -105.5650W 6.19 6.71 7.02 11.25 13.73
2014-05-11 03:00:00 2014-05-11 07:00:00 32.2425N -105.5650W 6.19 6.71 7.02 11.25 13.73
2014-05-11 18:30:00 2014-05-11 22:30:00 32.2425N -105.5650W 6.19 6.71 7.02 11.25 13.73
2014-05-12 03:00:00 2014-05-12 07:00:00 32.2425N -105.5650W 6.19 6.71 7.02 11.25 13.73
2014-05-12 15:00:00 2014-05-12 17:30:00 40.1840N -113.3428W 13.21 14.96 14.04 21.57 27.45
2014-05-12 18:30:00 2014-05-12 22:00:00 40.1840N -113.3428W 13.21 14.96 14.04 21.57 27.45
2014-05-13 03:00:00 2014-05-13 04:00:00 32.3807N -112.2432W 2.06 3.20 3.82 6.40 7.43
2014-05-13 04:01:00 2014-05-13 07:00:00 32.2425N -105.5650W 6.19 6.71 7.02 11.25 13.73
2014-05-13 15:00:00 2014-05-15 17:30:00 40.1840N -113.3428W 13.21 14.96 14.04 21.57 27.45
2014-05-13 18:30:00 2014-05-15 22:00:00 40.1840N -113.3428W 13.21 14.96 14.04 21.57 27.45
2014-05-13 22:00:00 2014-05-13 23:30:00 39.3835N -117.4702W 7.02 8.05 7.95 12.80 16.00
2014-05-14 03:00:00 2014-05-14 04:59:00 32.2425N -105.5650W 6.19 6.71 7.02 11.25 13.73

FAA GPS Performance Analysis Report July 31, 2014
50 Report 85
Percent Impact at each altitude
Start Date End Date Latitude Longitude 50 4000 10000 FL250 FL400
2014-05-14 04:00:00 2014-05-14 05:30:00 39.3835N -117.4702W 7.02 8.05 7.95 12.80 16.00
2014-05-14 05:00:00 2014-05-14 07:00:00 32.3807N -112.2432W 2.06 3.20 3.82 6.40 7.43
2014-05-14 13:00:00 2014-05-14 17:00:00 30.3326N -86.4816W 0.10 0.93 1.75 3.51 5.16
2014-05-14 22:00:00 2014-05-14 23:30:00 39.3835N -117.4702W 7.02 8.05 7.95 12.80 16.00
2014-05-15 03:00:00 2014-05-18 07:00:00 32.2425N -105.5650W 6.19 6.71 7.02 11.25 13.73
2014-05-15 07:00:00 2014-05-15 12:00:00 32.5511N -113.4746W 1.24 2.68 3.41 5.88 7.12
2014-05-15 22:00:00 2014-05-15 23:30:00 39.3835N -117.4702W 7.02 8.05 7.95 12.80 16.00
2014-05-16 18:30:00 2014-05-17 22:30:00 32.2425N -105.5650W 6.19 6.71 7.02 11.25 13.73
2014-05-17 03:00:00 2014-05-17 07:00:00 32.2425N -105.5650W 6.19 6.71 7.02 11.25 13.73
2014-05-19 13:00:00 2014-05-19 17:00:00 30.3326N -86.4816W 0.10 0.93 1.75 3.51 5.16
2014-05-19 18:31:00 2014-05-20 22:30:00 31.4800N -119.1800W 0.93 1.03 1.65 2.48 3.92
2014-05-21 18:31:00 2014-05-21 22:00:00 31.4800N -119.1800W 0.93 1.03 1.65 2.48 3.92
2014-05-21 22:00:00 2014-05-21 23:30:00 39.3835N -117.4702W 7.02 8.05 7.95 12.80 16.00
2014-05-22 04:00:00 2014-05-22 05:30:00 39.3835N -117.4702W 7.02 8.05 7.95 12.80 16.00
2014-05-22 18:31:00 2014-05-22 22:30:00 31.4800N -119.1800W 0.93 1.03 1.65 2.48 3.92
2014-05-28 03:00:00 2014-05-28 12:00:00 33.0702N -106.2540W 9.80 10.94 11.35 15.27 17.96
2014-05-28 19:00:00 2014-05-28 22:30:00 35.5629N -117.3903W 4.13 5.88 8.57 10.84 11.76
2014-05-29 03:00:00 2014-05-31 12:00:00 33.0702N -106.2540W 9.80 10.94 11.35 15.27 17.96

FAA GPS Performance Analysis Report July 31, 2014
51 Report 85
Percent Impact at each altitude
Start Date End Date Latitude Longitude 50 4000 10000 FL250 FL400
2014-05-29 19:00:00 2014-05-29 22:00:00 35.5629N -117.3903W 4.13 5.88 8.57 10.84 11.76
2014-06-03 12:30:00 2014-06-03 13:00:00 33.0702N -106.2540W 9.80 10.94 11.35 15.27 17.96
2014-06-04 07:00:00 2014-06-04 12:30:00 37.4245N -116.3518W 1.24 3.20 2.99 5.37 9.18
2014-06-04 13:00:00 2014-06-04 14:00:00 33.0702N -106.2540W 9.80 10.94 11.35 15.27 17.96
2014-06-07 03:00:00 2014-06-07 12:00:00 33.0702N -106.2540W 9.80 10.94 11.35 15.27 17.96
2014-06-09 14:00:00 2014-06-13 22:00:00 31.3548N -110.1659W 0.00 0.00 0.00 0.00 0.00
2014-06-10 18:30:00 2014-06-10 22:30:00 33.0702N -106.2540W 9.80 10.94 11.35 15.27 17.96
2014-06-13 03:00:00 2014-06-13 09:00:00 33.0702N -106.2540W 9.80 10.94 11.35 15.27 17.96
2014-06-16 14:00:00 2014-06-20 22:00:00 31.3548N -110.1659W 0.00 0.00 0.00 0.00 0.00
2014-06-17 18:30:00 2014-06-17 22:30:00 33.0702N -106.2540W 9.80 10.94 11.35 15.27 17.96
2014-06-19 03:00:00 2014-06-19 06:00:00 37.2000N -115.3330W 2.58 6.50 6.50 11.35 15.27
2014-06-21 03:00:00 2014-06-21 12:00:00 33.0702N -106.2540W 9.80 10.94 11.35 15.27 17.96
2014-06-21 12:01:00 2014-06-22 14:00:00 33.0702N -106.2540W 9.80 10.94 11.35 15.27 17.96
2014-06-21 18:30:00 2014-06-21 21:00:00 37.2000N -115.3330W 2.58 6.50 6.50 11.35 15.27
2014-06-21 18:30:00 2014-06-22 22:30:00 38.3140N -104.5446W 0.21 0.21 0.21 0.21 0.21
2014-06-23 04:00:00 2014-06-23 07:00:00 37.2000N -115.3330W 2.58 6.50 6.50 11.35 15.27
2014-06-23 07:01:00 2014-06-23 12:00:00 33.0702N -106.2540W 9.80 10.94 11.35 15.27 17.96
2014-06-24 03:00:00 2014-06-24 07:00:00 37.2000N -115.3330W 2.58 6.50 6.50 11.35 15.27

FAA GPS Performance Analysis Report July 31, 2014
52 Report 85
Percent Impact at each altitude
Start Date End Date Latitude Longitude 50 4000 10000 FL250 FL400
2014-06-24 07:01:00 2014-06-24 12:00:00 33.0702N -106.2540W 9.80 10.94 11.35 15.27 17.96
2014-06-25 03:00:00 2014-06-25 05:00:00 36.1307N -115.0308W 1.14 1.14 1.24 3.30 5.26
2014-06-25 04:00:00 2014-06-25 07:00:00 37.2000N -115.3330W 2.58 6.50 6.50 11.35 15.27
2014-06-25 07:01:00 2014-06-25 09:15:00 33.0702N -106.2540W 9.80 10.94 11.35 15.27 17.96
2014-06-26 03:00:00 2014-06-26 12:00:00 33.0702N -106.2540W 9.80 10.94 11.35 15.27 17.96
2014-06-27 07:00:00 2014-06-27 12:00:00 33.0702N -106.2540W 9.80 10.94 11.35 15.27 17.96
2014-06-28 03:00:00 2014-06-30 12:00:00 33.0702N -106.2540W 11.87 12.59 12.80 17.23 20.23

FAA GPS Performance Analysis Report July 31, 2014
53 Report 85
10 Appendices
10.1 Appendix A: Performance Summary
Table 10-1 Performance Summary
User Range Error Accuracy Conditions and Constraints Measured Performance
Single Frequency C/A-Code • ≤ 7.8m 95% Global Average URE during normal operations over All AODs • ≤ 6.0m 95% Global Average URE during operations at Zero AOD • ≤ 12.8m 95% Global Average URE during normal operations at Any AOD
• For any healthy SPS SIS • Neglecting single-frequency ionospheric delay model errors • Including group delay time correction (TGD) errors at L1 • Including inter-signal bias (P(Y)-code to C/A-code) errors at L1
≤ 4.000 m
N/A
N/A
Single Frequency C/A-Code • ≤ 30m 99.94% Global Average URE during normal operations • ≤ 30m 99.79% Worst Case single point average during normal operations.
• For any healthy SPS SIS. • Neglecting single-frequency ionospheric delay model errors • Including group delay time correction (TGD) errors at L1 • Including inter-signal bias (P(Y)-code to C/A-code) errors at L1 • Standard based on measurement interval of one year; average of daily values within service volume • Standard based on 3 service failures per year, lasting no more than 6 hours each
100% Global
100% WCP
User Range Rate Error Accuracy
Conditions and Constraints
Single-Frequency C/A-Code: • ≤ 6 mm/sec 95% Global Average URRE over any 3-second interval during normal operations at Any AOD
• For any healthy SPS SIS • Neglecting all perceived pseudorange rate errors attributable to pseudorange step changes caused by NAV message data cutovers • Neglecting single-frequency ionospheric delay model errors
≤ 3.920 mm/sec
User Range Acceleration Error Accuracy
Conditions and Constraints
Single-Frequency C/A-Code: • ≤ 2 mm/sec2 95% Global average URAE over any 3-second interval during normal operations at Any AOD
• For any healthy SPS SIS • Neglecting all perceived pseudorange rate errors attributable to pseudorange step changes caused by NAV message data cutovers • Neglecting single-frequency ionospheric delay model errors
≤ 0.034 mm/s2

FAA GPS Performance Analysis Report July 31, 2014
54 Report 85
Per-Satellite Coverage Conditions and Constraints Measured Performance
Terrestrial Service Volume: • 100% Coverage
• For any health or marginal SPS SIS 100%
Constellation Coverage Conditions and Constraints Terrestrial Service Volume: • 100% Coverage
• For any health or marginal SPS SIS 100%
Status and Problem Reporting Conditions and Constraints Scheduled event affecting service • Appropriate NANU issued to the Coast Guard and the FAA at least 48 hours prior to the event
• For any SPS SIS
≥ 17.3 hours Prior to event
Unscheduled outage or problem affecting service • Appropriate NANU issued to the Coast Guard and the FAA as soon as possible after the event
• For any SPS SIS
Not Applicable (No unscheduled)
Unscheduled Failure Interruption Continuity • ≥ 0.9998 Probability over any hour of not losing the SPS SIS availability from a slot due to unscheduled interruption.
• Calculated as an average over all slots in the 24-slot constellation, normalized annually • Given that the SPS SIS is available from the slot at the start of the hour.
100%
Operational Satellite Count Conditions and Constraints • ≥ 0.95 Probability that the constellation will have at least 24 operational satellites regardless of whether those operational satellites are located in slots or not
• Applies to the total number of operational satellites in the constellation (averaged over any day); where any satellite which appears in the transmitted navigation message almanac is defined to be an operation satellite regardless of whether that satellite is currently broadcasting a healthy SPS SIS or not and regardless of whether the broadcast SPS SIS also satisfies the other performance standards in the SPS performance standard or not.
100%
PDOP Availability Conditions and Constraints • ≥ 98% global PDOP of 6 or less • ≥ 88% worst site PDOP of 6 or less
• Defined for a position/time solution meeting the representative user conditions and operating within the service volume over any 24-hour interval
100 %
100 %
Service Availability Conditions and Constraints • ≥ 99% Horizontal Service Availability, average location • ≥ 99% Vertical Service Availability, average location
• 17m Horizontal (SIS only) 95% threshold • 37m Vertical (SIS only) 95% threshold • Defined for a position/time solution meeting the representative user conditions and operating within the service volume over any 24-hour interval.
100% Horizontal
100% Vertical
• ≥ 90% Horizontal Service Availability, worst-case location • ≥ 90% Vertical Service Availability, worst-case location
• 17m Horizontal (SIS only) 95% threshold • 37m Vertical (SIS only) 95% threshold • Defined for a position/time solution meeting the representative user conditions and operating within the service volume over any 24-hour interval.
100% Horizontal
100% Vertical

FAA GPS Performance Analysis Report July 31, 2014
55 Report 85
Position/Time Accuracy Conditions and Constraints Global Average Position Domain Accuracy • ≤ 9m 95% Horizontal Error • ≤ 15m 95% Vertical Error
• Defined for a position/time solution meeting the representative user conditions • Standard based on a measurement interval of 24 hours averaged over all points in the service volume.
≤ 3.351 m Horizontal
≤ 4.684 m Vertical
Worst Site Position Domain Accuracy • ≤ 17m 95% Horizontal Error • ≤ 37m 95% Vertical Error
• Defined for a position/time solution meeting the representative user conditions • Standard based on a measurement interval of 24 hours averaged over all points in the service volume.
≤ 8.465 m Horiz.
≤ 7.057 m Vert.
Time Transfer Domain Accuracy • ≤ 40 nanoseconds time transfer error 95% of time (SIS only)
• Defined for a time transfer solution meeting the representative user conditions • Standard based on a measurement interval of 24 hours averaged over all points in the service volume.
≤ 18 nanoseconds
Instantaneous UTCOE Integrity • NTE ±120 nanoseconds 99.999% of time without a timely alert (SIS only)
• For any healthy SPS SIS • Worst case for delayed alert is 6 hours
≤ 60.2 nanoseconds
Per-Slot Availability Conditions and Constraints • ≥ 0.957 Probability that a slot in the baseline 24-slot configuration will be occupied by a satellite broadcasting a healthy SPS SIS • ≥ 0.957 Probability that a slot in the expanded configuration will be occupied by a pair of satellites each broadcasting a healthy SPS SIS
• Calculated as an average over all slots in the 24-slot constellation, normalized annually • Applies to satellites broadcasting a healthy SPS SIS that also satisfy the other performance standards in the SPS performance standard.
100%
100%
Constellation Availability Conditions and Constraints • ≥ 0.98 Probability that at least 21 slots out of the 24 will be occupied either by a satellite broadcasting a healthy SPS SIS in the baseline 24-slot configuration or by a pair of satellites each broadcasting a healthy SPS SIS in the expanded slot configuration • ≥ 0.99999 Probability that at least 20 slots out of the 24 will be occupied either by a satellite broadcasting a healthy SPS SIS in the baseline 24-slot configuration or by a pair of satellites each broadcasting a healthy SPS SIS in the expanded slot configuration
• Calculated as an average over all slots in the 24-slot constellation, normalized annually. • Applies to satellites broadcasting a healthy SPS SIS that also satisfies the other performance standards in the SPS performance standard.
100%
100%

FAA GPS Performance Analysis Report July 31, 2014
56 Report 85
10.2 Appendix B: Geomagnetic Data Prepared by the U.S. Dept. of Commerce, NOAA, Space Weather Prediction Center
Current Quarter Daily Geomagnetic Data Middle Latitude High Latitude Estimated - Fredericksburg - ---- College ---- --- Planetary –-- Date A K-indices A K-indices A K-indices 2014 04 01 5 1 1 0 2 2 2 1 2 4 1 0 1 0 1 3 1 1 6 1 1 1 1 2 2 1 3 2014 04 02 6 1 1 1 2 2 2 2 2 2 1 1 0 1 0 1 1 1 5 1 1 1 1 2 1 1 2 2014 04 03 7 1 1 1 3 3 2 1 1 9 1 1 1 3 4 3 1 1 6 1 2 1 2 2 1 1 2 2014 04 04 5 1 1 1 2 2 2 1 1 3 0 1 2 1 2 0 0 0 6 1 2 2 2 2 2 1 1 2014 04 05 11 1 0 2 3 3 3 3 3 17 1 1 2 5 5 3 2 2 14 2 1 2 4 4 3 3 3 2014 04 06 3 2 0 0 1 2 1 1 1 2 2 1 0 0 0 1 0 1 5 3 1 1 1 1 1 0 2 2014 04 07 10 2 0 2 2 3 4 2 2 16 1 1 1 2 4 6 1 1 11 3 2 2 1 3 4 2 2 2014 04 08 4 2 1 0 2 2 2 1 0 4 1 1 0 2 3 0 0 0 5 2 1 0 2 2 1 1 0 2014 04 09 5 0 1 2 2 2 2 2 1 6 0 0 2 2 4 2 1 0 5 1 1 2 2 2 2 2 1 2014 04 10 4 0 0 0 2 2 2 2 1 1 0 0 1 1 0 0 0 0 3 0 1 1 1 1 0 1 0 2014 04 11 7 0 2 2 2 2 2 2 3 5 0 0 2 1 2 3 2 1 8 1 2 2 2 1 2 2 3 2014 04 12 16 4 3 3 3 3 3 3 2 37 4 4 5 4 7 3 2 2 25 5 5 5 3 3 2 3 3 2014 04 13 13 3 3 3 3 3 2 3 2 21 3 4 5 5 3 2 2 1 16 4 4 3 3 2 2 3 2 2014 04 14 7 2 1 3 1 2 2 2 2 6 2 1 3 2 0 1 2 1 8 3 2 3 2 1 1 2 2 2014 04 15 5 1 2 2 1 2 1 1 1 3 1 1 2 2 1 0 1 0 6 2 3 2 2 1 1 1 1 2014 04 16 5 0 1 1 2 2 1 2 2 4 0 0 0 3 3 0 1 0 5 1 1 1 2 2 0 1 2 2014 04 17 11 3 3 2 2 3 3 2 2 15 3 2 1 2 4 5 2 1 11 3 3 2 2 2 3 2 1 2014 04 18 7 1 2 1 2 2 2 1 3 6 2 3 0 2 1 1 2 2 8 2 2 1 2 2 1 2 3 2014 04 19 13 3 3 3 2 3 3 3 2 19 2 3 4 4 4 4 3 1 15 4 4 3 3 2 3 3 2 2014 04 20 20 3 2 1 4 5 3 3 4 18 3 2 1 3 4 5 3 3 22 3 2 1 3 5 4 4 4 2014 04 21 18 4 4 3 4 3 3 2 2 30 4 5 3 5 5 5 1 1 18 4 4 3 4 3 4 2 2 2014 04 22 4 1 2 2 1 1 1 0 1 2 1 1 1 1 0 1 0 0 5 1 2 1 2 1 1 0 1 2014 04 23 6 0 1 1 3 2 2 2 1 7 0 1 1 4 2 2 1 1 7 1 1 1 2 2 2 2 2 2014 04 24 8 2 1 2 2 3 2 2 2 18 2 2 3 5 4 4 2 2 10 3 2 3 2 2 2 2 3 2014 04 25 7 3 2 0 2 3 1 2 1 11 2 3 1 3 4 2 2 1 9 3 3 1 2 2 2 2 1 2014 04 26 8 1 3 2 1 3 2 1 2 6 1 2 2 3 3 1 0 0 6 1 3 2 1 2 1 1 2 2014 04 27 4 1 0 0 1 3 1 2 1 1 2 0 0 0 0 1 0 0 4 1 1 1 0 1 1 1 2 2014 04 28 7 1 2 2 2 3 1 1 2 9 2 2 2 5 1 0 0 0 6 2 3 2 2 1 1 0 1 2014 04 29 7 1 0 0 1 3 1 1 4 1 1 0 0 0 0 0 0 2 6 2 1 1 1 1 1 1 4 2014 04 30 12 3 2 3 3 4 2 2 1 36 3 4 5 5 5 6 3 2 18 3 3 4 3 4 3 3 1 2014 05 01 5 1 3 2 1 2 1 1 0 5 2 3 1 0 1 1 2 1 6 2 3 2 1 1 1 1 1 2014 05 02 3 1 2 1 1 2 0 1 0 1 1 1 0 0 0 0 0 0 3 1 2 1 1 1 0 0 0 2014 05 03 5 0 0 0 1 2 2 2 3 2 0 0 0 0 0 0 2 2 7 1 1 1 1 1 2 3 3 2014 05 04 15 2 4 4 3 4 2 1 1 25 3 5 6 4 3 2 2 1 16 3 4 4 3 3 2 2 1 2014 05 05 11 1 3 3 3 3 2 2 2 10 1 3 3 3 2 3 2 1 10 2 3 3 2 2 2 2 2 2014 05 06 4 1 1 1 1 2 1 1 1 1 1 1 1 0 0 0 0 0 3 1 1 1 1 1 0 0 0 2014 05 07 5 0 0 0 2 3 1 2 2 3 0 0 0 0 3 1 0 1 4 0 1 1 1 2 1 1 2 2014 05 08 13 2 3 3 3 2 3 3 3 41 3 4 5 7 3 5 2 4 20 2 4 3 4 3 4 3 4 2014 05 09 8 3 2 3 1 2 1 2 1 9 4 2 4 2 0 0 0 1 8 3 2 3 2 1 1 1 1 2014 05 10 10 2 3 2 2 3 1 2 3 8 2 3 3 2 0 1 2 2 9 2 3 2 1 1 1 3 3 2014 05 11 10 3 3 1 2 3 2 2 2 18 4 4 3 5 2 2 1 2 12 4 3 2 3 2 2 2 3 2014 05 12 10 2 2 3 2 4 2 2 1 12 2 3 3 4 3 2 1 1 8 2 2 3 2 2 2 2 2 2014 05 13 7 1 2 1 2 3 2 2 2 -1 1 1 2 2 1 1 1-1 5 1 2 1 1 1 1 1 2 2014 05 14 8 1 1 1 2 4 2 1 2 6 -1 2 1 1 3 1 1 2 6 1 1 1 1 2 2 1 2 2014 05 15 5 1 1 1 1 3 1 1 1 3 -1 2 1 0 0 1 1 1 5 2 2 1 1 1 1 1 1 2014 05 16 6 1 1 1 2 3 2 2 1 4 2 1 1 1 2 2 1 0 5 2 1 1 1 2 2 1 1 2014 05 17 4 1 0 0 1 3 2 1 1 2 1 1 1 2 1 0 0 0 4 1 1 1 1 1 1 0 1 2014 05 18 5 2 1 1 1 2 2 2 1 5 2 2 1 1 1 2 1 1 5 2 2 1 1 1 2 1 1 2014 05 19 4 0 2 1 1 2 1 1 2 4 1 2 2 1 2 1 0 1 4 1 1 1 1 1 1 1 2 2014 05 20 4 1 1 1 1 2 2 1 1 3 1 1 2 2 2 0 0 0 4 1 1 2 1 1 1 0 0 2014 05 21 3 0 0 1 1 2 1 1 1 2 1 1 1 1 1 0 0 0 3 1 1 1 1 1 0 0 1

FAA GPS Performance Analysis Report July 31, 2014
57 Report 85
2014 05 22 9 2 1 1-1-1-1 3 3 7 1 1 1 2 2 3 2 2 9 1 1 2 1 2 3 2 3 2014 05 23 17 3 3 1 1 2 3 4 5 12 3 2 2 1 1 3 3 4 19 3 2 1 1 2 4 4 5 2014 05 24 -1 2 2 2 1-1-1-1-1 6 2 2 2 1 3 2 0 1 6 2 2 2 1 1 1 1 2 2014 05 25 -1 -1-1-1-1-1-1-1-1 4 2 2 1 1 1 1 1 0 4 2 2 1 0 1 1 0 1 2014 05 26 -1 -1-1-1-1-1-1-1-1 2 1 1 2 1 1 0 0 0 4 2 1 2 1 0 0 0 0 2014 05 27 -1 4-1-1-1 2 2 1-1 2 0 0 1 1 1 0 1 0 4 1 1 1 1 1 1 1 2 2014 05 28 5 -1-1-1-1 2 1 2 1 4 2 2 1 1 1 0 1 1 4 2 1 1 1 1 1 1 2 2014 05 29 8 1 0 1 3 3 3 2 2 10 1 1 1 4 4 2 2 1 7 1 1 1 3 2 2 2 1 2014 05 30 8 0 2 2 3 2 2 3 2 12 1 1 3 3 4 3 3 1 9 0 2 2 2 2 2 4 2 2014 05 31 4 1 2 1 1 1 2 1 1 2 1 1 1 1 1 0 0 0 4 1 2 1 1 1 1 1 1 2014 06 01 5 1 1 2 2 2 2 1 1 1 0 0 1 1 1 0 0 0 5 1 1 1 2 1 1 1 1 2014 06 02 5 1 1 1 1 2 1 2 2 2 1 1 0 0 0 0 1 1 5 1 1 1 1 1 1 1 3 2014 06 03 5 2-1-1-1 1 2 2 1 5 3 2 1 1 0 1 1 1 7 3 2 1 1 1 1 2 1 2014 06 04 6 1 2 2 1 2 2 2 1 5 2 2 1 3 0 1 1 1 5 1 2 2 1 1 2 1 2 2014 06 05 7 1 2-1-1 1 2 2 3 8 1 2 1 4 2 1 2 2 7 2 2 1 2 1 1 2 3 2014 06 06 5 2 1 0 1 2 2 2 2 3 2 2 0 0 0 1 1 2 6 2 2 0 1 1 2 2 2 2014 06 07 14 2 2 2 1 3 3 4 4 11 2 2 2 4 2 2 3 2 13 2 2 2 2 2 4 4 4 2014 06 08 -1 4 5 5-1-1-1-1-1 36 4 5 5 6 5 3 3 2 39 3 6 6 5 5 4 3 2 2014 06 09 3 -1-1-1-1-1 1 2 0 11 1 2 3 5 2 1 1 1 5 1 1 2 2 1 1 2 1 2014 06 10 7 1 1 2 2 3 2 2 2 4 1 1 1 1 1 1 2 2 7 1 1 2 2 2 2 2 2 2014 06 11 8 2 2 2 3 3 1 2 1 9 2 1 1 4 3 2 2 1 7 2 2 2 3 2 2 2 1 2014 06 12 5 1 2 0 2 2 1 2 1 2 1 2 0 0 0 0 0 1 4 1 2 1 1 1 1 1 1 2014 06 13 6 1 0 1 2 3 2 2 2 2 1 0 0 0 1 1 1 1 5 1 1 1 1 2 2 2 2 2014 06 14 8 2 2 3 2 2 2 2 2 11 3 3 4 3 1 1 0 2 8 3 2 3 2 1 1 2 2 2014 06 15 9 2 1 2 4 2 2 2 1 4 2 1 2 2 1 0 1 0 5 2 1 2 2 1 1 1 1 2014 06 16 7 1 1 1 2 3 2 2 2 5 1 1 1 0 3 2 1 1 5 1 1 1 1 2 2 1 1 2014 06 17 9 2 2 3 1 2 2 2 3 7 2 2 3 2 2 1 1 2 8 2 2 3 2 2 1 2 3 2014 06 18 13 3 1 2 3 2 3 3 4 18 3 3 4 3 3 3 3 4 16 3 2 2 2 2 3 4 5 2014 06 19 10 3 3 3 2 2 2 2 2 13 3 3 4 3 3 2 1 1 8 3 3 2 2 1 2 2 2 2014 06 20 10 1 1 3 3 3 2 2 3 18 2 2 5 5 3 3 1 1 9 1 2 2 2 3 3 2 3 2014 06 21 7 1 2 2 3 2 2 1 1 8 2 2 4 3 1 0 0 1 6 2 2 2 2 1 1 1 1 2014 06 22 7 1 2 1 2 3 2 2 1 2 1 1 0 0 1 1 1 1 4 1 2 1 1 1 1 1 2 2014 06 23 7 1 0 0 1 3 2 1 4 1 0 0 0 0 0 0 0 2 5 1 1 0 0 1 1 0 3 2014 06 24 7 2 3 2 1 2 1 2 1 5 3 2 3 1 0 1 0 0 6 3 3 2 1 1 1 2 1 2014 06 25 8 1 1 2 2 2 3 2 3 4 0 1 3 2 0 1 0 1 6 1 1 2 2 1 2 2 2 2014 06 26 7 1 0 1 3 3 2 2 1 6 0 0 0 3 4 1 0 0 5 1 1 1 2 2 1 1 1 2014 06 27 4 1 1 0 1 2 1 2 2 2 1 0 0 1 1 0 1 1 4 1 1 0 1 1 1 2 1 2014 06 28 6 1 1 1 2 3 2 2 1 16 1 2 1 3 5 5 0 0 6 1 2 1 2 3 2 2 1 2014 06 29 7 2 2 2 1 2 1 2 3 5 2 1 2 1 2 0 1 2 8 3 2 2 1 1 1 2 3 2014 06 30 7 3 1 1 2 2 2 2 2 4 3 2 1 0 0 1 1 0 6 3 1 1 1 1 1 2 1

FAA GPS Performance Analysis Report July 31, 2014
58 Report 85
10.3 Appendix C: Performance Analysis (PAN) Problem Report
In 1993, the FAA began monitoring and analyzing Global Positioning System (GPS) Standard Positioning Service (SPS) performance data. At present, the FAA has approved GPS for IFR and is developing WAAS and LAAS, both of which are GPS augmentation systems. In order to ensure the safe and effective use of GPS and its augmentation systems within the NAS, it is critical that characteristics of GPS performance as well as specific causes for service outages be monitored and understood. To accomplish this objective, GPS SPS performance data is documented in a quarterly GPS Performance Analysis (PAN) report. The PAN report contains data collected at various National Satellite Test Bed (NSTB) and Wide Area Augmentation System (WAAS) reference station locations. This PAN Problem Report will be issued only when the performance data fails to meet the GPS Standard Positioning Service (SPS) Signal Specification.
Problem Description:

FAA GPS Performance Analysis Report July 31, 2014
59 Report 85
10.4 Appendix D: Glossary
The terms and definitions discussed below are taken from the Standard Positioning Service Performance Specification (September 2008). An understanding of these terms and definitions is a necessary prerequisite to full understanding of the Signal Specification.
Almanac Longitude of the Ascending Node (.o): Equatorial angle from the Prime Meridian (Greenwich) at the weekly epoch to the ascending node at the ephemeris reference epoch.
General Terms and Definitions
Coarse/Acquisition (C/A) Code: A PRN code sequence used to modulate the GPS L1 carrier.
Corrected Longitude of Ascending Node (Ωk) and Geographic Longitude of the Ascending Node (GLAN): Equatorial angle from the Prime Meridian (Greenwich) to the ascending node, both at arbitrary time Tk.
Dilution of Precision (DOP): The magnifying effect on GPS position error induced by mapping GPS ranging errors into position within the specified coordinate system through the geometry of the position solution. The DOP varies as a function of satellite positions relative to user position. The DOP may be represented in any user local coordinate desired. Examples are HDOP for local horizontal, VDOP for local vertical, PDOP for all three coordinates, and TDOP for time.
Equatorial Angle: An angle along the equator in the direction of Earth rotation.
Geometric Range: The difference between the estimated locations of a GPS satellite and an SPS receiver.
Ground track Equatorial Crossing (GEC, λ, 2 SOPS GLAN): Equatorial angle from the Prime Meridian (Greenwich) to the location a ground track intersects the equator when crossing from the Southern to the Northern hemisphere. GEC is equal to Ωk when the argument of latitude (Ф) is zero.
Instantaneous User Range Error (URE): The difference between the pseudo range measured at a given location and the expected pseudo range, as derived from the navigation message and the true user position, neglecting the bias in receiver clock relative to GPS time. A signal-in-space (SIS) URE includes residual orbit, satellite clock, and group delay errors. A system URE (sometimes known as a User Equivalent Range Error, or UERE) contains all line-of-sight error sources, to include SIS, single-frequency ionosphere model error, troposphere model error, multipath and receiver noise.
Longitude of Ascending Node (LAN): A general term for the location of the ascending node – the point that an orbit intersects the equator when crossing from the Southern to the Northern hemisphere.
Longitude of the Ground track Equatorial Crossing (GEC, λ, 2 SOPS GLAN): Equatorial angle from the Prime Meridian (Greenwich) to the location a ground track intersects the equator when crossing from the Southern to the Northern hemisphere. GEC is equal to Ωk when the argument of latitude (Ф) is zero.
Mean Down Time (MDT): A measure of time required to restore function after any downing event.
Mean Time Between Downing Events (MTBDE): A measure of time between any downing events.
Mean Time Between Failures (MTBF): A measure of time between unscheduled downing events.
Mean Time to Restore (MTTR): A measure of time required to restore function after an unscheduled downing event.
Navigation Message: Data contained in each satellite's ranging signal and consisting of the ranging signal time-of-transmission, the transmitting satellite's orbital elements, an almanac containing abbreviated orbital element

FAA GPS Performance Analysis Report July 31, 2014
60 Report 85
information to support satellite selection, ranging measurement correction information, and status flags. The message structure is described in Section 2.1.2 of the SPS Performance Standard.
Operational Satellite: A GPS satellite which is capable of, but is not necessarily transmitting a usable ranging signal.
PDOP Availability: Defined to be the percentage of time over any 24-hour interval that the PDOP value is less than or equal to its threshold for any point within the service volume.
Positioning Accuracy: Defined to be the statistical difference, at a 95% probability, between position measurements and a surveyed benchmark for any point within the service volume over any 24-hour interval.
• Horizontal Positioning Accuracy: Defined to be the statistical difference, at a 95% probability, between horizontal position measurements and a surveyed benchmark for any point within the service volume over any 24-hour interval.
• Vertical Positioning Accuracy: Defined to be the statistical difference, at a 95% probability, between vertical position measurements and a surveyed benchmark for any point within the service volume over any 24-hour interval.
Position Solution: An estimate of a user’s location derived from ranging signal measurements and navigation data from GPS.
Position Solution Geometry: The set of direction cosines that define the instantaneous relationship of each satellite's ranging signal vector to each of the position solution coordinate axes.
Pseudo Random Noise (PRN): A binary sequence that appears to be random over a specified time interval unless the shift register configuration and initial conditions for generating the sequence are known. Each satellite generates a unique PRN sequence that is effectively uncorrelated (orthogonal) to any other satellite’s code over the integration time constant of a receiver’s code tracking loop.
Representative SPS Receiver: The minimum signal reception and processing assumptions employed by the U.S. Government to characterize SPS performance in accordance with performance standards defined in Section 3 of the SPS Performance Standard. Representative SPS receiver capability assumptions are identified in Section 2.2 of the SPS Performance Standard.
Right Ascension of Ascending Node (RAAN): Equatorial angle from the celestial principal direction to the ascending node.
Root Mean Square (RMS) SIS URE: A statistic that represents instantaneous SIS URE performance in an RMS sense over some sample interval. The statistic can be for an individual satellite or for the entire constellation. The sample interval for URE assessment used in the SPS Performance Standard is 24 hours.
Selective Availability: Protection technique formerly employed to deny full system accuracy to unauthorized users. SA was discontinued effective midnight May 1, 2000.
Service Availability: Defined to be the percentage of time over any 24-hour interval that the predicted 95% positioning error is less than its threshold for any given point within the service volume.
• Horizontal Service Availability: Defined to be the percentage of time over any 24-hour interval that the predicted 95% horizontal error is less than its threshold for any point within the service volume.
• Vertical Service Availability: Defined to be the percentage of time over any 24-hour interval that the predicted 95% vertical error is less than its threshold for any point within the service volume.
Service Degradation: A condition over a time interval during which one or more SPS performance standards are not supported.

FAA GPS Performance Analysis Report July 31, 2014
61 Report 85
Service Failure: A condition over a time interval during which a healthy GPS satellite’s ranging signal exceeds the Not-to-Exceed (NTE) SPS SIS URE tolerance.
Service Reliability: The percentage of time over a specified time interval that the instantaneous SIS SPS URE is maintained within a specified reliability threshold at any given point within the service volume, for all healthy GPS satellites.
Service Volume: The spatial volume supported by SPS performance standards. Specifically, the SPS Performance Standard supports the terrestrial service volume. The terrestrial service volume covers from the surface of the Earth up to an altitude of 3,000 kilometers.
SPS Performance Envelope: The range of nominal variation in specified aspects of SPS performance.
SPS Performance Standard: A quantifiable minimum level for a specified aspect of GPS SPS performance. SPS performance standards are defined in Section 3.0.
SPS Ranging Signal: An electromagnetic signal originating from an operational satellite. The SPS ranging signal consists of a Pseudo Random Noise (PRN) C/A code, a timing reference and sufficient data to support the position solution generation process. A description of the GPS SPS signal is provided in Section 2. The formal definition of the SPS ranging signal is provided in ICD IS-GPS-200G.
SPS Ranging Signal Measurement: The difference between the ranging signal time of reception (as determined by the receiver's clock) and the time of transmission derived from the navigation signal (as defined by the satellite's clock) multiplied by the speed of light. Also known as the pseudo range.
SPS SIS User Range Error (URE) Statistic:
• A satellite SPS SIS URE statistic is defined to be the Root Mean Square (RMS) difference between SPS ranging signal measurements (neglecting user clock bias and errors due to propagation environment and receiver), and “true” ranges between the satellite and an SPS user at any point within the service volume over a specified time interval.
• A constellation SPS SIS URE statistic is defined to be the average of all satellite SPS SIS URE statistics over a specified time interval.
Time Transfer Accuracy Relative to UTC (USNO): The difference at a 95% probability between user UTC time estimates and UTC (USNO) at any point within the service volume over any 24-hour interval.
Transient Behavior: Short-term behavior not consistent with steady-state expectations.
Usable SPS Ranging Signal: An SPS ranging signal that can be received, processed, and used in a position solution by a receiver with representative SPS receiver capabilities.
User Navigation Error (UNE): Given a sufficiently stationary and ergodic satellite constellation ranging error behavior over a minimum sample interval, multiplication of the DOP and a constellation ranging error standard deviation value will yield an approximation of the RMS position error. This RMS approximation is known as the UNE (UHNE for horizontal, UVNE for vertical, and so on). The user is cautioned that any divergence away from the stationary and ergodic assumptions will cause the UNE to diverge from a RMS value based on actual measurements.
User Range Accuracy (URA): A conservative representation of each satellite’s expected (1σ) SIS URE performance (excluding residual group delay) based on historical data. A URA value is provided that is representative over the curve fit interval of the navigation data from which the URA is read. The URA is a coarse representation of the URE statistic in that it is quantized to levels represented in ICD IS-GPS-200G.