global tactical asset allocation october 2003 giorgio de santis managing director quantitative...
TRANSCRIPT

Global Tactical Asset Allocation
October 2003
Giorgio De SantisManaging DirectorQuantitative Strategies Group

2Global Tactical Asset Allocation
A Overview of GTAA
i) Definition and objectives
ii) A brief history of (G)TAA
B Motivating GTAA
i) Theoretical justifications
ii) Some empirical evidence
C Implementing a GTAA program
i) Portfolio construction
ii) An example: Risk budget and optimal portfolio
iii) Benefits of using futures and forwards
D Concluding remarks
Discussion outline

Overview of GTAA
4Global Tactical Asset Allocation
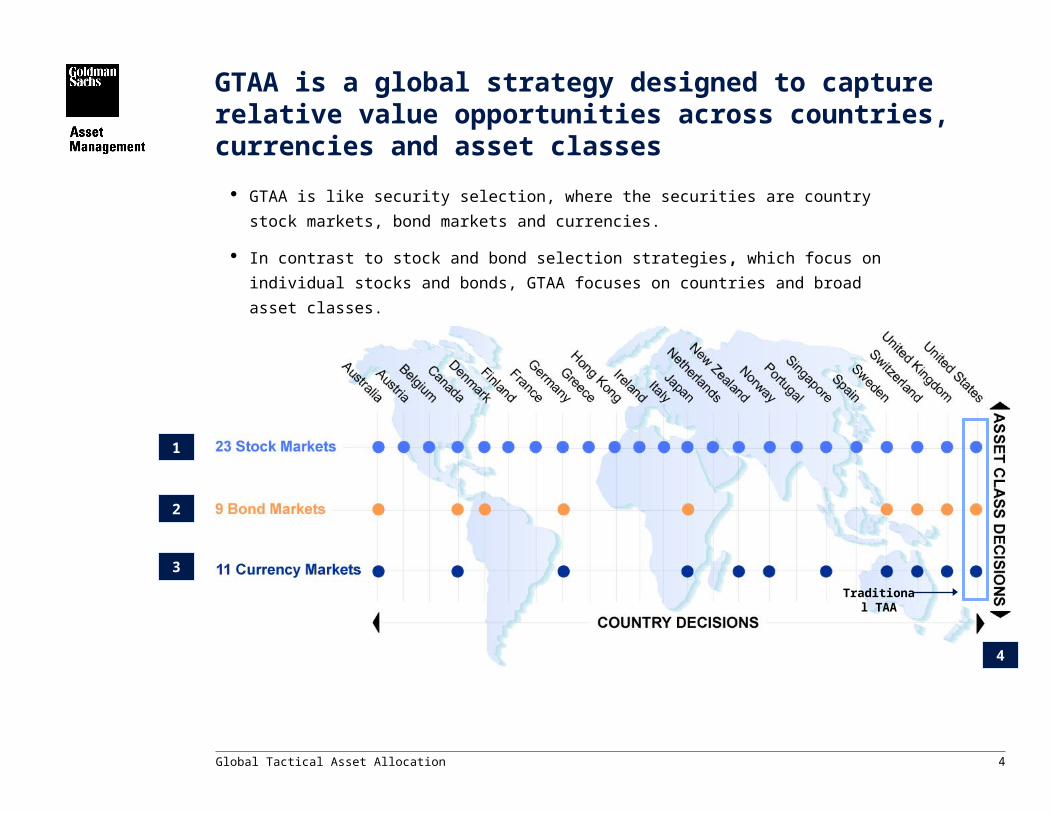
GTAA is like security selection, where the securities are country stock markets, bond markets
and currencies.
In contrast to stock and bond selection strategies, which focus on individual stocks and
bonds, GTAA focuses on countries and broad asset classes.
GTAA is a global strategy designed to capture relative value opportunities across countries, currencies and asset classes
Traditional TAA
1
2
3
4

5Global Tactical Asset Allocation
1990s: Value-oriented TAA
managers experience difficult environment
Top-tier GTAA managers continue to deliver promising
results
2000: Renewed interest in GTAA strategies due to:
Increasing liquidity in global derivative markets
Increasing evidence of return predictability across and within asset
classes
Recognition that quantitative models can manage risk effectively
Increased familiarity of institutional investors with GTAA
1952 1960 1970 1980 1990 2000
Mid 1970s: Tactical Asset Allocation
(TAA) first used by US. pensions to capitalize on changing opportunities in a single country’s stock, bond and cash markets
Late 1980s: Interest in TAA increases
significantly following 1987 market crash
GTAA first used by US pensions to capitalize on changing opportunities at the country and global asset class level
1986: Brinson, Hood and Beebower
Strategic asset allocation explains more than 90% of institutional portfolio risk
Harry Markowitz publishes “Portfolio Selection”
Given a set of expected returns and risk estimates, portfolios with maximum return per unit of risk can be constructed
1964: Sharpe’s “Capital Asset Pricing Model”
In equilibrium, optimal portfolios are combinations of T-bills and the market capitalization portfolio
1991: Black-Litterman propose practical model to overcome shortcomings of traditional mean-variance analysis
1990: Black’s “Universal Hedging” defines global market equilibrium
A timeline of asset allocationThe evolution of modern portfolio theory
6Global Tactical Asset Allocation
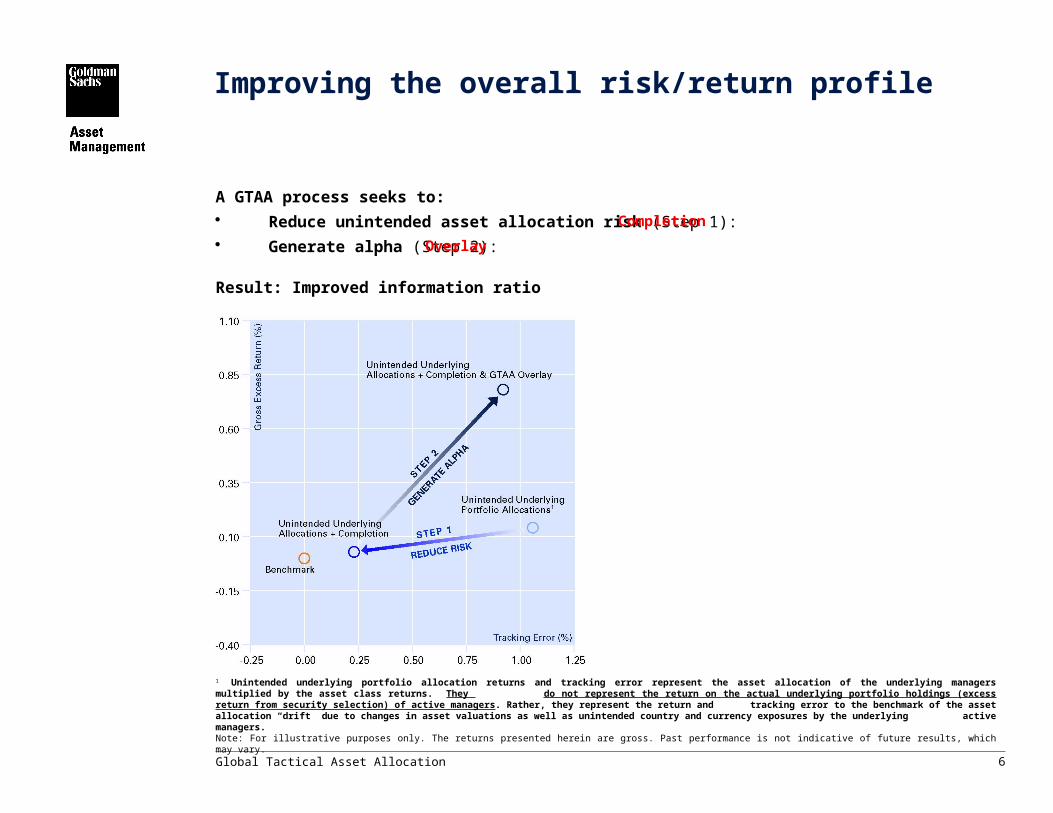
A GTAA process seeks to: Reduce unintended asset allocation risk (Step 1): Generate alpha (Step 2):
Result: Improved information ratio
1 Unintended underlying portfolio allocation returns and tracking error represent the asset allocation of the underlying managers multiplied by the asset class returns. They do not represent the return on the actual underlying portfolio holdings (excess return from security selection) of active managers. Rather, they represent the return and
tracking error to the benchmark of the asset allocation “drift” due to changes in asset valuations as well as unintended country and currency exposures by the underlying active managers.Note: For illustrative purposes only. The returns presented herein are gross. Past performance is not indicative of future results, which may vary.
Improving the overall risk/return profile
Completion
Overlay
7Global Tactical Asset Allocation
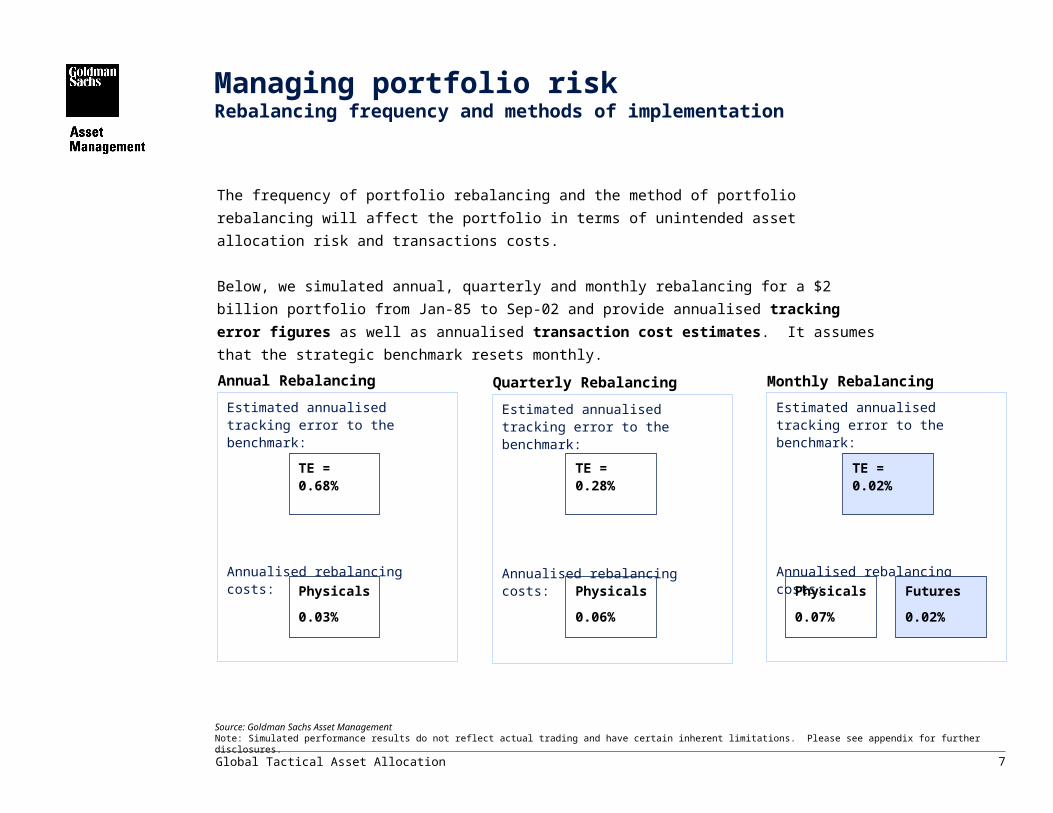
Managing portfolio riskRebalancing frequency and methods of implementation
The frequency of portfolio rebalancing and the method of portfolio rebalancing will affect the portfolio
in terms of unintended asset allocation risk and transactions costs.
Below, we simulated annual, quarterly and monthly rebalancing for a $2 billion portfolio from Jan-85
to Sep-02 and provide annualised tracking error figures as well as annualised transaction cost
estimates. It assumes that the strategic benchmark resets monthly.
Estimated annualised tracking error to the benchmark:
Annualised rebalancing costs:
Annual Rebalancing
Physicals
0.03%
TE = 0.68%
Estimated annualised tracking error to the benchmark:
Annualised rebalancing costs:
Quarterly Rebalancing
Physicals
0.06%
TE = 0.28%
Monthly Rebalancing
Estimated annualised tracking error to the benchmark:
Annualised rebalancing costs:
Physicals
0.07%
Futures
0.02%
TE = 0.02%
Source: Goldman Sachs Asset ManagementNote: Simulated performance results do not reflect actual trading and have certain inherent limitations. Please see appendix for further disclosures.

Theory and evidence in support of a GTAA program

9Global Tactical Asset Allocation
Theoretical and intuitive motivation for GTAA
In theory, asset class and country returns should be predictable
Valuations can drift away from fair
Investors may be slow to incorporate new information
Risk premia change over time
Structural barriers exist (market segmentation)
Market participants may not be motivated by profits (central banks)
10Global Tactical Asset Allocation
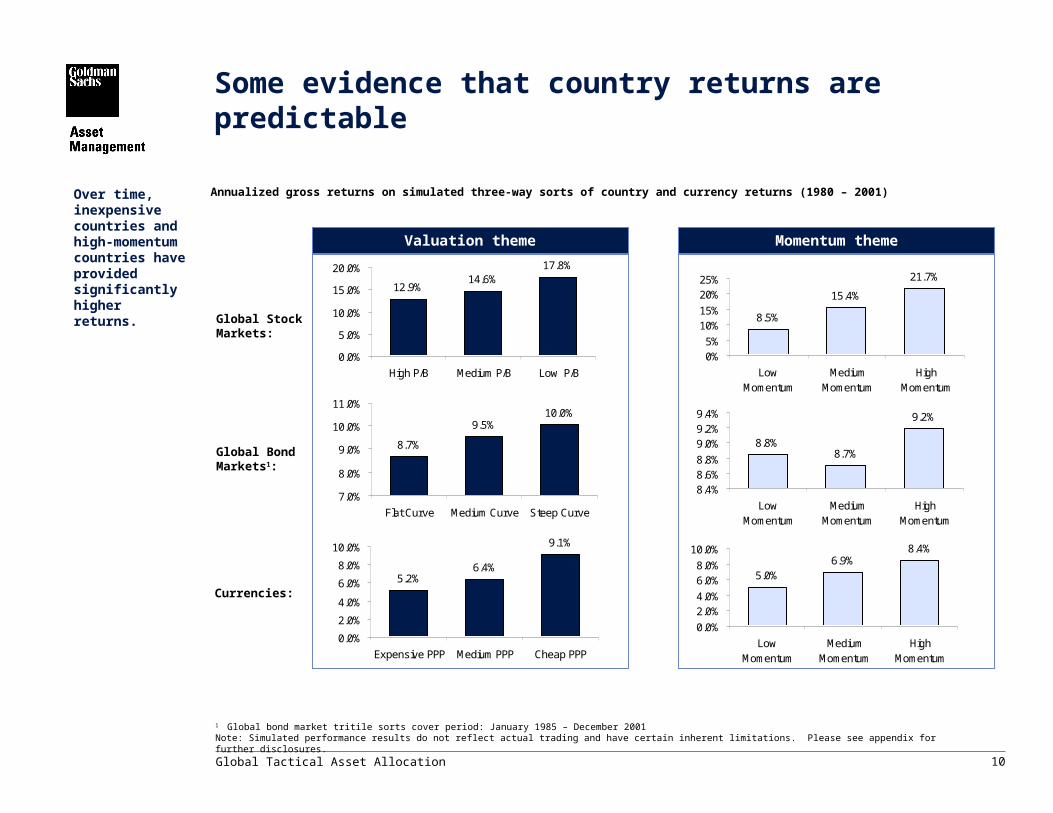
1 Global bond market tritile sorts cover period: January 1985 – December 2001Note: Simulated performance results do not reflect actual trading and have certain inherent limitations. Please see appendix for further disclosures.
Some evidence that country returns are predictable
Annualized gross returns on simulated three-way sorts of country and currency returns (1980 – 2001)
Currencies:
Global BondMarkets1:
Global Stock Markets:
Over time, inexpensive countries and high-momentum countries have provided significantly higher returns.
12.9%14.6%
17.8%
0.0%
5.0%
10.0%
15.0%
20.0%
High P/B Medium P/B Low P/B
Valuation theme
8.7%
9.5%10.0%
7.0%
8.0%
9.0%
10.0%
11.0%
Flat Curve Medium Curve Steep Curve
5.2%6.4%
9.1%
0.0%
2.0%
4.0%
6.0%
8.0%
10.0%
Expensive PPP Medium PPP Cheap PPP
Momentum theme
8.5%
15.4%
21.7%
0%5%
10%15%
20%25%
LowMomentum
MediumMomentum
HighMomentum
8.8%8.7%
9.2%
8.4%8.6%8.8%
9.0%9.2%9.4%
LowMomentum
MediumMomentum
HighMomentum
5.0%6.9%
8.4%
0.0%
2.0%4.0%
6.0%8.0%
10.0%
LowMomentum
MediumMomentum
HighMomentum
11Global Tactical Asset Allocation
The performance results stated above are backtested based on a methodology that is derived from an analysis of past market data with the benefit of hindsight. These results do not reflect the performance of a GSAM managed account or composite and are being shown for informational purposes only. If GSAM had managed your account during the period shown above it is highly improbable that your account would have been managed in a similar fashion due to differences in economic and market conditions. The performance results disclosed herein do not represent the results of actual trading using client assets. The backtested performance results depicted above do not reflect the deduction of advisory fees, brokerage or other commissions or exchange fees or any other expenses a client would have to pay.
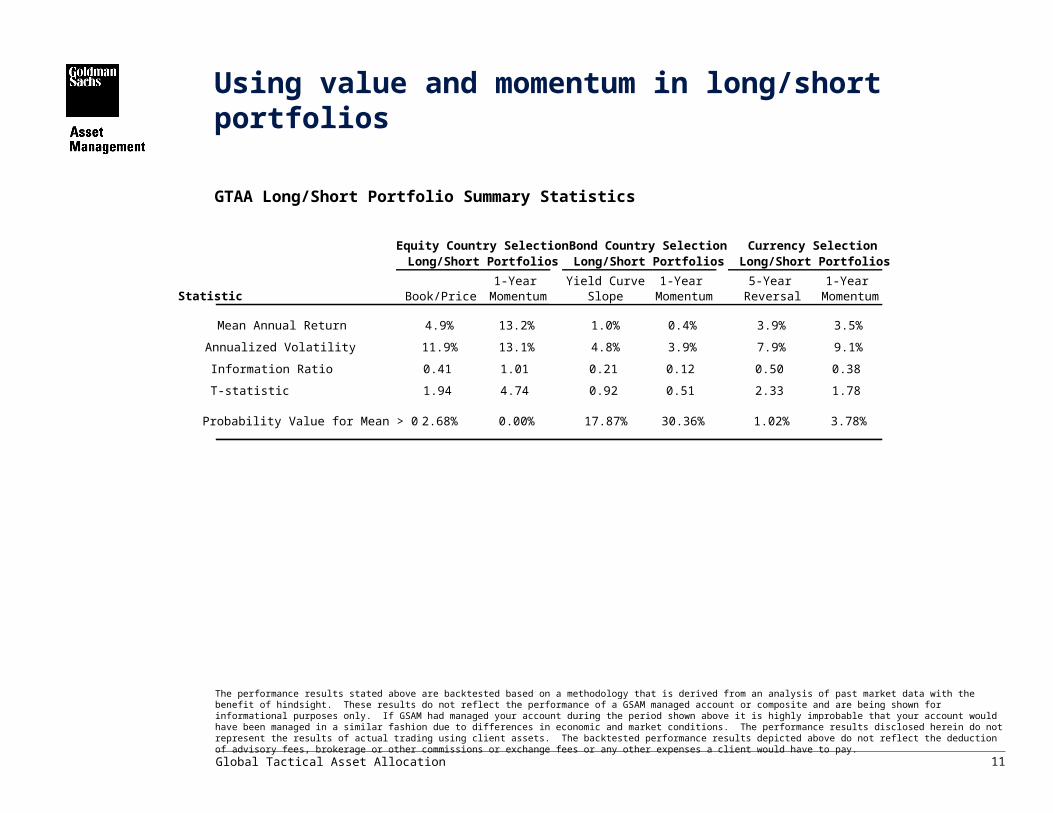
Using value and momentum in long/short portfolios
GTAA Long/Short Portfolio Summary Statistics
Equity Country Selection Long/Short Portfolios
Bond Country Selection Long/Short Portfolios
Currency Selection Long/Short Portfolios
Statistic Book/Price1-Year
MomentumYield Curve
Slope1-Year
Momentum5-Year
Reversal1-Year
Momentum
Mean Annual Return 4.9% 13.2% 1.0% 0.4% 3.9% 3.5%
Annualized Volatility 11.9% 13.1% 4.8% 3.9% 7.9% 9.1%
Information Ratio 0.41 1.01 0.21 0.12 0.50 0.38
T-statistic 1.94 4.74 0.92 0.51 2.33 1.78
Probability Value for Mean > 0 2.68% 0.00% 17.87% 30.36% 1.02% 3.78%

12Global Tactical Asset Allocation
The benefits of combining factors
1980 1981 1982 1983 1984 1985 1986 1987 1988 1989 1990 1991 1992 1993 1994 1995 1996 1997 1998 1999 2000 2001
Cu
mu
lati
ve
Ex
ce
ss
Re
turn
on
$1
(L
og
Sc
ale
)
B/P
1-Year Momentum
B/P + 1-Year Momentum
Source: Goldman Sachs Asset ManagementNote: The performance results stated above are backtested based on a methodology that is derived from an analysis of past market data with the benefit of hindsight. These results do not reflect the performance of a GSAM managed account or composite and are being shown for informational purposes only. If GSAM had managed your account during the period shown above it is highly improbable that your account would have been managed in a similar fashion due to differences in economic and market conditions. The performance results disclosed herein do not represent the results of actual trading using client assets. The backtested performance results depicted above do not reflect the deduction of advisory fees, brokerage or other commissions or exchange fees or any other expenses a client would have to pay.
Backtested cumulative excess return on Global Equity Country Long/Short portfolios 1980 – 2001
Due to the low correlation between value and momentum, a strategy that combines the
two signals outperforms each of the two strategies based on a single signal
13Global Tactical Asset Allocation
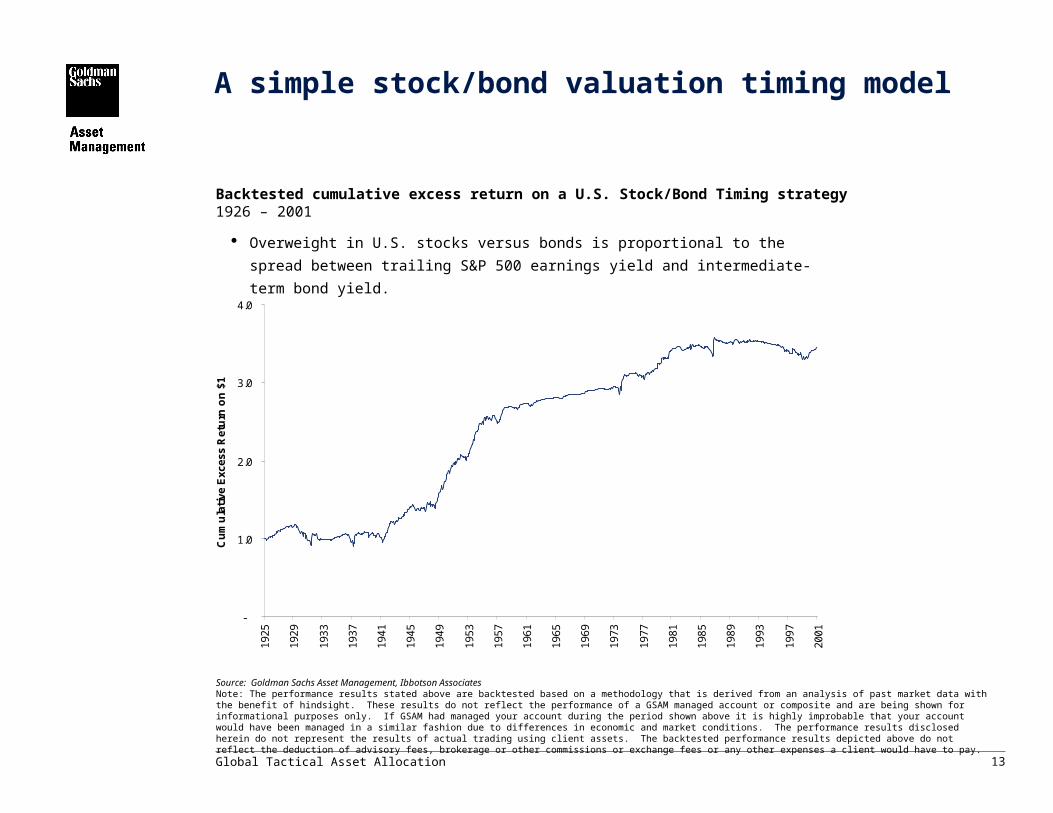
A simple stock/bond valuation timing model
Backtested cumulative excess return on a U.S. Stock/Bond Timing strategy 1926 – 2001
-
1.0
2.0
3.0
4.0
1925
1929
1933
1937
1941
1945
1949
1953
1957
1961
1965
1969
1973
1977
1981
1985
1989
1993
1997
2001
Cu
mu
lati
ve E
xces
s R
etu
rn o
n $
1
Source: Goldman Sachs Asset Management, Ibbotson AssociatesNote: The performance results stated above are backtested based on a methodology that is derived from an analysis of past market data with the benefit of hindsight. These results do not reflect the performance of a GSAM managed account or composite and are being shown for informational purposes only. If GSAM had managed your account during the period shown above it is highly improbable that your account would have been managed in a similar fashion due to differences in economic and market conditions. The performance results disclosed herein do not represent the results of actual trading using client assets. The backtested performance results depicted above do not reflect the deduction of advisory fees, brokerage or other commissions or exchange fees or any other expenses a client would have to pay.
Overweight in U.S. stocks versus bonds is proportional to the spread between trailing
S&P 500 earnings yield and intermediate-term bond yield.
Implementation of a GTAA program

15Global Tactical Asset Allocation
A Global Tactical Asset Allocation (GTAA) program can generally be thought of as
four separate strategies trading more than 40 assets:
GTAA is usually coupled with a rebalancing strategy to seek to reduce unintended
asset class risk in the underlying portfolio
GTAA is best implemented using liquid derivative instruments like futures and
forward contracts
A GTAA overlay strategy can be implemented with minimal capital outlay and
limited disruption to existing managers
How should a Global Tactical Asset Allocation (GTAA) program be implemented?
Strategy Assets
1. Asset class timing (3 assets) Stocks, bonds, cash
2. Equity country selection (23 assets) DAX, FTSE, S&P, Nikkei, ....
3. Fixed income country selection (9 assets)
Eurobund, Gilt, US Treas, JGB, ....
4. Currency selection (11 assets) Euro, pound, yen, dollar....

16
The ‘output’ of Black-Litterman is a vector of mixed expected returns.
Additional Views
(e.g. anomalies)
Black-Litterman Model
Black-Litterman ‘mixed’ E(R)s
Benchmark
Risk Aversion
Transaction Costs
Mean-Variance
OptimizationOptimal Portfolio
Weights
Equilibrium E(R)s
(we use CAPM)
Historical Data
Covariance
Matrix
From Views to an Optimal Portfolio:The Black-Litterman Model
17Global Tactical Asset Allocation
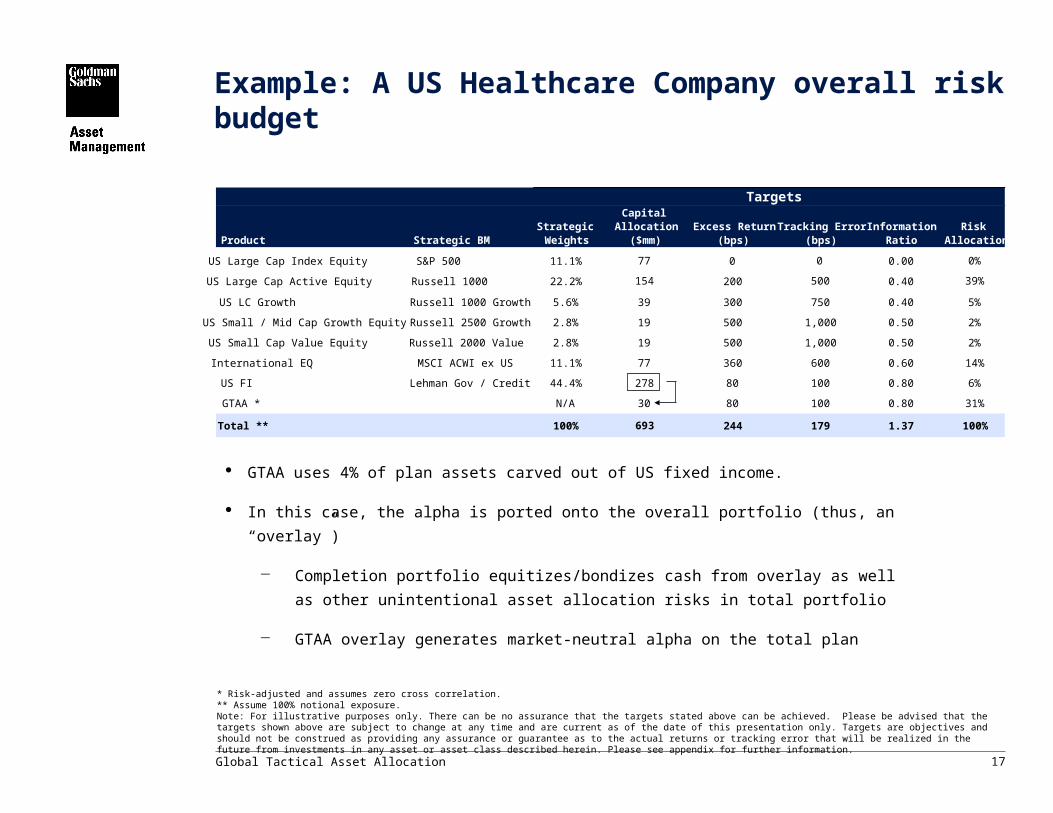
Example: A US Healthcare Company overall risk budget
GTAA uses 4% of plan assets carved out of US fixed income.
In this case, the alpha is ported onto the overall portfolio (thus, an “overlay”)
Completion portfolio equitizes/bondizes cash from overlay as well as other
unintentional asset allocation risks in total portfolio
GTAA overlay generates market-neutral alpha on the total plan
* Risk-adjusted and assumes zero cross correlation. ** Assume 100% notional exposure.Note: For illustrative purposes only. There can be no assurance that the targets stated above can be achieved. Please be advised that the targets shown above are subject to change at any time and are current as of the date of this presentation only. Targets are objectives and should not be construed as providing any assurance or guarantee as to the actual returns or tracking error that will be realized in the future from investments in any asset or asset class described herein. Please see appendix for further information.
Product Strategic BMStrategic Weights
Capital Allocation
($mm)Excess Return
(bps)Tracking Error
(bps)Information
RatioRisk
Allocation
US Large Cap Index Equity S&P 500 11.1% 77 0 0 0.00 0%
US Large Cap Active Equity Russell 1000 22.2% 154 200 500 0.40 39%
US LC Growth Russell 1000 Growth 5.6% 39 300 750 0.40 5%
US Small / Mid Cap Growth Equity Russell 2500 Growth 2.8% 19 500 1,000 0.50 2%
US Small Cap Value Equity Russell 2000 Value 2.8% 19 500 1,000 0.50 2%
International EQ MSCI ACWI ex US 11.1% 77 360 600 0.60 14%
US FI Lehman Gov / Credit 44.4% 278 80 100 0.80 6%
GTAA * N/A 30 80 100 0.80 31%
Total ** 100% 693 244 179 1.37 100%
Targets
18
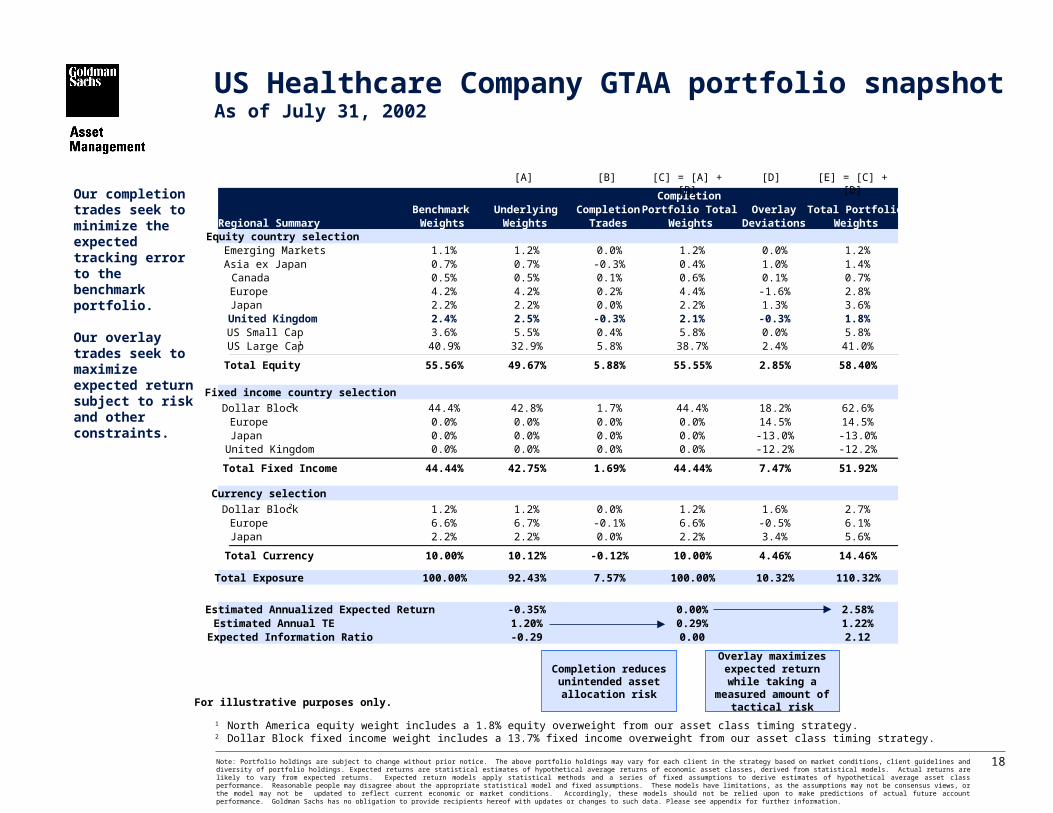
Our completion trades seek to minimize the expected tracking error to the benchmark portfolio.
Our overlay trades seek to maximize expected return subject to risk and other constraints.
1 North America equity weight includes a 1.8% equity overweight from our asset class timing strategy.2 Dollar Block fixed income weight includes a 13.7% fixed income overweight from our asset class timing strategy.
Overlay maximizes expected return while
taking a measured amount of tactical risk
Note: Portfolio holdings are subject to change without prior notice. The above portfolio holdings may vary for each client in the strategy based on market conditions, client guidelines and diversity of portfolio holdings. Expected returns are statistical estimates of hypothetical average returns of economic asset classes, derived from statistical models. Actual returns are likely to vary from expected returns. Expected return models apply statistical methods and a series of fixed assumptions to derive estimates of hypothetical average asset class performance. Reasonable people may disagree about the appropriate statistical model and fixed assumptions. These models have limitations, as the assumptions may not be consensus views, or the model may not be updated to reflect current economic or market conditions. Accordingly, these models should not be relied upon to make predictions of actual future account performance. Goldman Sachs has no obligation to provide recipients hereof with updates or changes to such data. Please see appendix for further information.
For illustrative purposes only.
Benchmark Weights
UnderlyingWeights
CompletionTrades
Completion Portfolio Total
WeightsOverlay
DeviationsTotal Portfolio
WeightsEquity country selection
Emerging Markets 1.1% 1.2% 0.0% 1.2% 0.0% 1.2%Asia ex Japan 0.7% 0.7% -0.3% 0.4% 1.0% 1.4%Canada 0.5% 0.5% 0.1% 0.6% 0.1% 0.7%Europe 4.2% 4.2% 0.2% 4.4% -1.6% 2.8%Japan 2.2% 2.2% 0.0% 2.2% 1.3% 3.6%United Kingdom 2.4% 2.5% -0.3% 2.1% -0.3% 1.8%US Small Cap 3.6% 5.5% 0.4% 5.8% 0.0% 5.8%US Large Cap1 40.9% 32.9% 5.8% 38.7% 2.4% 41.0%
Total Equity 55.56% 49.67% 5.88% 55.55% 2.85% 58.40%
Fixed income country selection
Dollar Block2 44.4% 42.8% 1.7% 44.4% 18.2% 62.6%Europe 0.0% 0.0% 0.0% 0.0% 14.5% 14.5%Japan 0.0% 0.0% 0.0% 0.0% -13.0% -13.0%United Kingdom 0.0% 0.0% 0.0% 0.0% -12.2% -12.2%
Total Fixed Income 44.44% 42.75% 1.69% 44.44% 7.47% 51.92%
Currency selection
Dollar Block 1.2% 1.2% 0.0% 1.2% 1.6% 2.7%Europe 6.6% 6.7% -0.1% 6.6% -0.5% 6.1%Japan 2.2% 2.2% 0.0% 2.2% 3.4% 5.6%
Total Currency 10.00% 10.12% -0.12% 10.00% 4.46% 14.46%
Total Exposure 100.00% 92.43% 7.57% 100.00% 10.32% 110.32%
Estimated Annualized Expected Return -0.35% 0.00% 2.58%Estimated Annual TE 1.20% 0.29% 1.22%Expected Information Ratio -0.29 0.00 2.12
Regional Summary
[A] [B] [C] = [A] + [B] [D] [E] = [C] + [D]
2
Completion reduces unintended asset
allocation risk
US Healthcare Company GTAA portfolio snapshotAs of July 31, 2002
19Global Tactical Asset Allocation
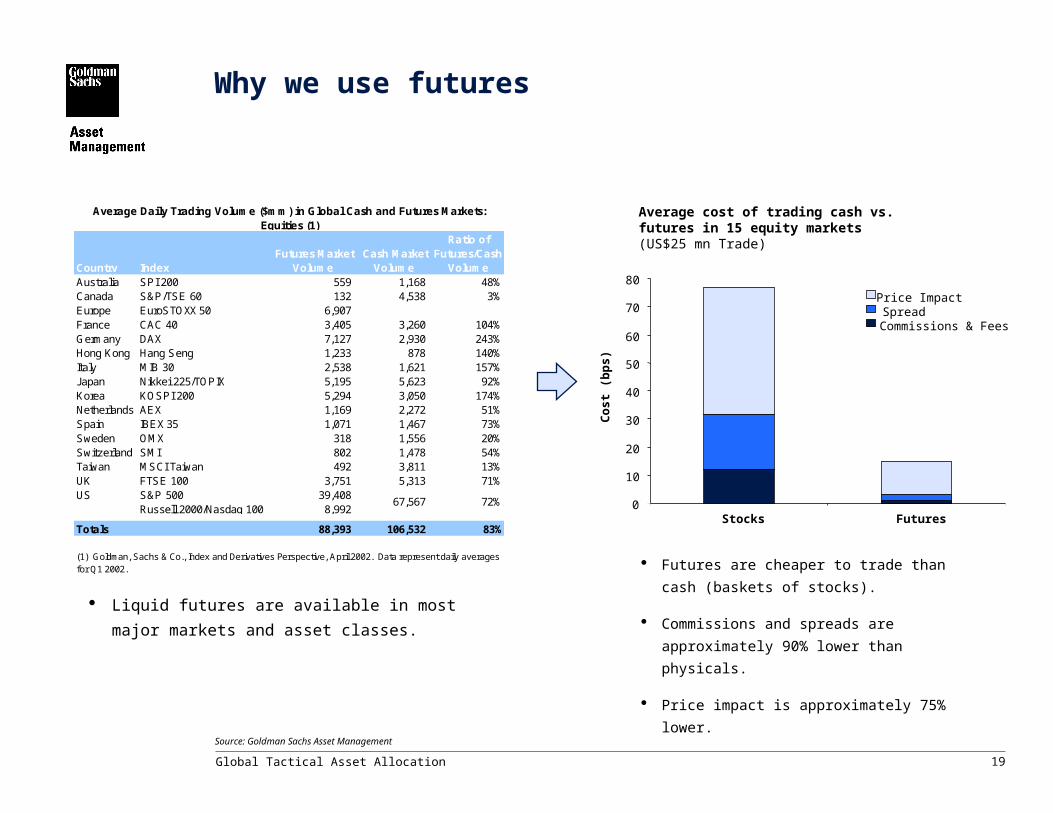
Why we use futures
Futures are cheaper to trade than cash
(baskets of stocks).
Commissions and spreads are
approximately 90% lower than physicals.
Price impact is approximately 75% lower.
Source: Goldman Sachs Asset Management
Average cost of trading cash vs. futures in 15 equity markets (US$25 mn Trade)
0
10
20
30
40
50
60
70
80
Stocks Futures
Co
st
(bp
s)
Price ImpactSpreadCommissions & Fees
Country Index Futures Market
Volume Cash Market
Volume
Ratio of Futures/Cash
VolumeAustralia SPI 200 559 1,168 48%Canada S&P/TSE 60 132 4,538 3%Europe EuroSTOXX 50 6,907 France CAC 40 3,405 3,260 104%Germany DAX 7,127 2,930 243%Hong Kong Hang Seng 1,233 878 140%Italy MIB 30 2,538 1,621 157%Japan Nikkei 225/TOPIX 5,195 5,623 92%Korea KOSPI 200 5,294 3,050 174%Netherlands AEX 1,169 2,272 51%Spain IBEX 35 1,071 1,467 73%Sweden OMX 318 1,556 20%Switzerland SMI 802 1,478 54%Taiwan MSCI Taiwan 492 3,811 13%UK FTSE 100 3,751 5,313 71%US S&P 500 39,408
Russell 2000/Nasdaq 100 8,992
Totals 88,393 106,532 83%
(1) Goldman, Sachs & Co., Index and Derivatives Perspective, April 2002. Data represent daily averages for Q1 2002.
67,567 72%
Average Daily Trading Volume ($mm) in Global Cash and Futures Markets: Equities (1)
Liquid futures are available in most major markets
and asset classes.

Summary
21Global Tactical Asset Allocation
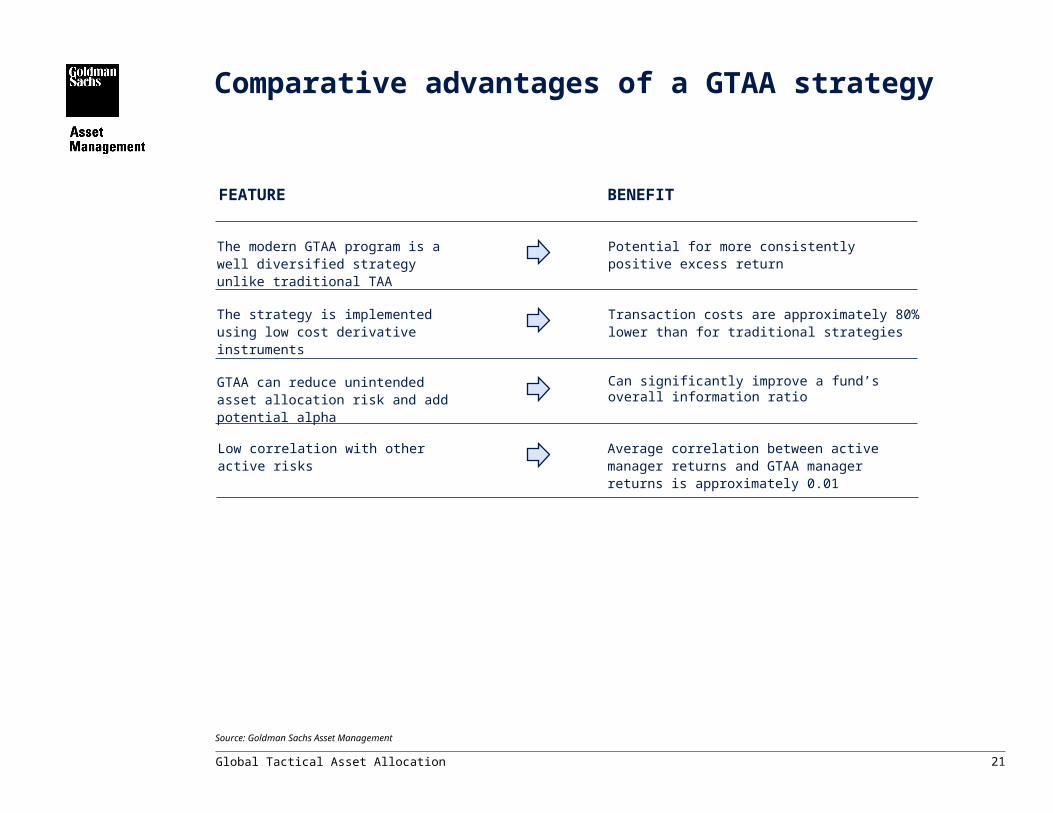
The modern GTAA program is a well diversified strategy unlike traditional TAA
Potential for more consistently positive excess return
The strategy is implemented using low cost derivative instruments
Transaction costs are approximately 80% lower than for traditional strategies
GTAA can reduce unintended asset allocation risk and add potential alpha
Can significantly improve a fund’s overall information ratio
FEATURE BENEFIT
Low correlation with other active risks Average correlation between active manager returns and GTAA manager returns is approximately 0.01
Comparative advantages of a GTAA strategy
Source: Goldman Sachs Asset Management

22Global Tactical Asset Allocation
A Quantitative Approach to Portfolio Management
23Global Tactical Asset Allocation
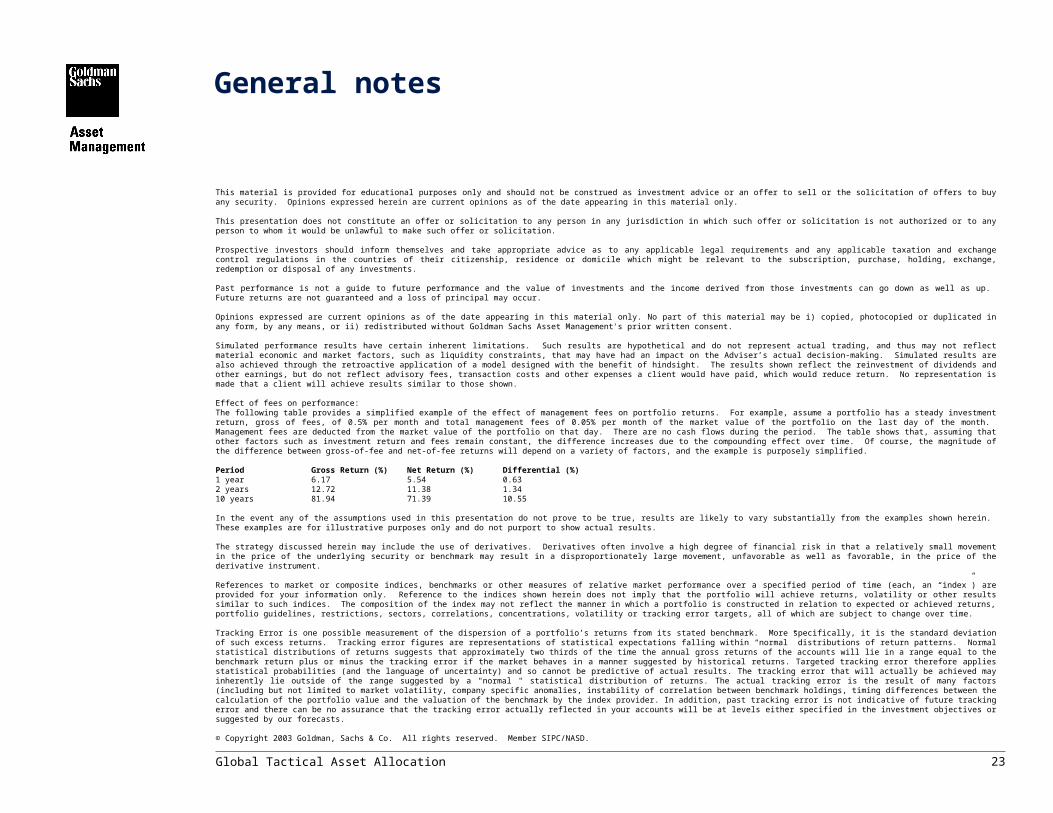
This material is provided for educational purposes only and should not be construed as investment advice or an offer to sell or the solicitation of offers to buy any security. Opinions expressed herein are current opinions as of the date appearing in this material only.
This presentation does not constitute an offer or solicitation to any person in any jurisdiction in which such offer or solicitation is not authorized or to any person to whom it would be unlawful to make such offer or solicitation.
Prospective investors should inform themselves and take appropriate advice as to any applicable legal requirements and any applicable taxation and exchange control regulations in the countries of their citizenship, residence or domicile which might be relevant to the subscription, purchase, holding, exchange, redemption or disposal of any investments.
Past performance is not a guide to future performance and the value of investments and the income derived from those investments can go down as well as up. Future returns are not guaranteed and a loss of principal may occur.
Opinions expressed are current opinions as of the date appearing in this material only. No part of this material may be i) copied, photocopied or duplicated in any form, by any means, or ii) redistributed without Goldman Sachs Asset Management's prior written consent.
Simulated performance results have certain inherent limitations. Such results are hypothetical and do not represent actual trading, and thus may not reflect material economic and market factors, such as liquidity constraints, that may have had an impact on the Adviser’s actual decision-making. Simulated results are also achieved through the retroactive application of a model designed with the benefit of hindsight. The results shown reflect the reinvestment of dividends and other earnings, but do not reflect advisory fees, transaction costs and other expenses a client would have paid, which would reduce return. No representation is made that a client will achieve results similar to those shown.
Effect of fees on performance:The following table provides a simplified example of the effect of management fees on portfolio returns. For example, assume a portfolio has a steady investment return, gross of fees, of 0.5% per month and total management fees of 0.05% per month of the market value of the portfolio on the last day of the month. Management fees are deducted from the market value of the portfolio on that day. There are no cash flows during the period. The table shows that, assuming that other factors such as investment return and fees remain constant, the difference increases due to the compounding effect over time. Of course, the magnitude of the difference between gross-of-fee and net-of-fee returns will depend on a variety of factors, and the example is purposely simplified. Period Gross Return (%) Net Return (%) Differential (%)1 year 6.17 5.54 0.632 years 12.72 11.38 1.3410 years 81.94 71.39 10.55
In the event any of the assumptions used in this presentation do not prove to be true, results are likely to vary substantially from the examples shown herein. These examples are for illustrative purposes only and do not purport to show actual results.
The strategy discussed herein may include the use of derivatives. Derivatives often involve a high degree of financial risk in that a relatively small movement in the price of the underlying security or benchmark may result in a disproportionately large movement, unfavorable as well as favorable, in the price of the derivative instrument.
References to market or composite indices, benchmarks or other measures of relative market performance over a specified period of time (each, an “index”) are provided for your information only. Reference to the indices shown herein does not imply that the portfolio will achieve returns, volatility or other results similar to such indices. The composition of the index may not reflect the manner in which a portfolio is constructed in relation to expected or achieved returns, portfolio guidelines, restrictions, sectors, correlations, concentrations, volatility or tracking error targets, all of which are subject to change over time.
Tracking Error is one possible measurement of the dispersion of a portfolio’s returns from its stated benchmark. More specifically, it is the standard deviation of such excess returns. Tracking error figures are representations of statistical expectations falling within “normal” distributions of return patterns. Normal statistical distributions of returns suggests that approximately two thirds of the time the annual gross returns of the accounts will lie in a range equal to the benchmark return plus or minus the tracking error if the market behaves in a manner suggested by historical returns. Targeted tracking error therefore applies statistical probabilities (and the language of uncertainty) and so cannot be predictive of actual results. The tracking error that will actually be achieved may inherently lie outside of the range suggested by a "normal " statistical distribution of returns. The actual tracking error is the result of many factors (including but not limited to market volatility, company specific anomalies, instability of correlation between benchmark holdings, timing differences between the calculation of the portfolio value and the valuation of the benchmark by the index provider. In addition, past tracking error is not indicative of future tracking error and there can be no assurance that the tracking error actually reflected in your accounts will be at levels either specified in the investment objectives or suggested by our forecasts.
© Copyright 2003 Goldman, Sachs & Co. All rights reserved. Member SIPC/NASD.
General notes