globalscope newsletter - atout capital contents globalscope conference highlights of discussions...
TRANSCRIPT

2017 H2
Globalscope Newsletterreporting on global M&A activity and the latest semi-annual conference
“The starting point for business valuation across
all sectors in any region in the global marketplace”
Perth 2017 H2
in association with

1Issue 7
Published November 2017
About Globalscope
What we do
Our focus is on mergers and acquisitions (M&A). This often
includes representing clients who wish to divest or acquire a
company and advising our clients on the related fine details
including, for example, restructuring, international joint
ventures and licensing initiatives.
We work with the senior management of private and public
companies as well as private equity firms.
Who we are
Globalscope was founded in 1987 when a small group of entrepreneurial corporate finance and business advisers came together
to support clients in cross-border transactions.
We now have 54 member firms, with more than 600 professionals on the ground across 45 countries:
AFRICA
Kenya Fieldstone Africa
South Africa Fieldstone Africa
AMERICAS
Argentina Ficus Capital S.A.
Brazil Pactor Finanças Corporativas
Canada Osprey Capital Partners Inc.
Mexico Allegiance Capital Corporation
United States Allegiance Capital Corporation
Brooks Houghton
Greif & Co.
MelCap Partners
Paramax Corporation
Panama Insignia Financial Advisors
Uruguay Ficus Capital S.A.
ASIAPAC
Australia Terrain Capital
Tomkins Turner
China Beijing HRS Consulting
India MAPE Advisory Group Pvt Ltd
RCS Advisors (India) Pvt. Ltd.
Indonesia NaXel iPartners
Japan Kaede Financial Advisory Inc.
Singapore Stirling Coleman
South Korea H-Partners Korea
Uzbekistan RB Partners
Vietnam Nexus Group
EUROPE
Armenia EV Consulting
Belarus Capital Times
Belgium Common Ground Corporate Finance
Bulgaria First Southeast Investment Partners
Croatia Grubišić & Partners
Czech Republic Venture Investors Corporate Finance
Denmark Dansk Merchant Capital A/S
Finland Summa Capital
France Atout Capital
CMW Corporate Finance
Georgia Alliance Group Capital
Germany CatCap
CCI Management
Transfer Partners Group
Greece First Athens Corporate Finance SA
Hungary Heal Partners
Israel Portofino Investments
Italy Benedetti & Associates
Palladio Corporate Finance
Luxembourg Tenzing Partners SA
Netherlands DEX international M&A
Stratégique
Norway Impello Management AS
Poland Augeo Ventures
Aventis Capital
Portugal Bluemint Capital
Russia RB Partners
Spain Next Corporate
Sweden Jarl Securities
Switzerland IFBC
InternationalScope Ltd.
Turkey Orion Capital Partners
Ukraine Capital Times
United Kingdom Corbett Keeling
Silverpeak Investment Bank
Produced and edited by:
Matt Dixon, Corbett Keeling
Global Marketing Director
Why we do it
With 20 – 25% of all M&A transactions being cross-border
(defined in this report as involving buyers from a different
country to the target company), it is essential for our
member firms’ clients, whether they be buyers, sellers or
targets, to have access to an international network of
corporate finance advisors.

2
Contents
Globalscope ConferenceHighlights of discussions from the latest
Globalscope conference held in Perth, Australia
New developments 5
Conference report 6
Global M&A market landscape 7
Lower-mid market sector highlights 8
($5-150m enterprise value transactions)
Regional Valuation StatisticsCountry by country and region by region analysis
of business valuation statistics
Transaction data by region 11
Listed companies data by region 13
The starting point for
business valuation across
all sectors in any region in
the global marketplace
Sector-Specific AnalysisA closer look at the underlying sector-specific structural
drivers, new developments, recent M&A and projections
Consumer 17
Financial Services 19
Life Sciences 21
Industrials 23
Services 25
Technology, Media & Telecoms (TMT) 27

3
Data analysed by:Data supplied by:
Definitions and notes
Definitions
TEV - “Total Enterprise Value”
TEV is an economic measure reflecting the market value of a whole business independent of a business’ capital structure. The analysis in this
document calculates TEV as follows:
• For transaction data, by reference to the target company of each transaction, from the transaction consideration, share of equity
acquired, and other disclosed details such as the target’s net debt, as at the transaction date,
• For listed company data, from the listed share price of each company, together with known details of its capital structure including issued
shares and net debt, as at the stated date.
EBITDA - “Earnings Before Interest, Tax, Depreciation and Amortisation”
EBITDA is a business’ net income with interest, taxes, depreciation and amortisation added back which is often taken as a proxy for the cash
generation rate of a business. The analysis in this document calculates EBITDA as follows:
• For transaction data, by reference to the target company of each transaction, from the most recent known historic 12 months’ reported
value as at the transaction date,
• For listed company data, from the most recent known historic 12 months’ reported value as at the stated date.
TEV/EBITDA - “TEV/EBITDA Multiple”
The TEV/EBITDA Multiple is calculated for each transaction where more than 40% of the target’s equity is sold or for each listed company
where the required data is disclosed. Where appropriate, the analysis in this document uses weighted averages calculated as follows:
• For transaction data analysis, selected transaction TEV/EBITDA Multiples, within a given six month period, are weighted by reference to
each transaction’s reported consideration or “transaction value”,
• For listed company data analysis, selected listed company TEV/EBITDA Multiples, on the stated date, are weighted by reference to each
listed company’s TEV,
• Anomalous outlying data points are excluded.
Size
The size classifications used in this document are Globalscope defined limits with respect to the value of the included transactions or listed
companies as follows:
• For transaction data, transactions are included where the TEV of the target is disclosed and identified by Capital IQ as being greater than
or equal to $5m (All Market Transactions), or greater than or equal to $5m and lower than or equal to $150m (Lower-Mid Market
Transactions).
• For listed company data, companies are included where there is a stock market listing, and a TEV of the company that is disclosed and
identified by Capital IQ as being greater than or equal to $5m (All Market Listed Companies), or greater than or equal to $5m and lower
than or equal to $150m (Lower-Mid Market Listed Companies).
Sectors
The sector classifications used in this document are Globalscope defined aggregations of similar business activities based on sub-sectors
defined by reference to the primary Capital IQ industry classification as follows:
• For transaction data, the target company of each transaction,
• For listed company data, each listed company.
Regions
The regional classifications used in this document are defined by reference to the Capital IQ regional classification as follows:
• For transaction data, the target company of each transaction,
• For listed company data, each listed company.
Note on using multiples for business valuation:
It is important to note that TEV/EBITDA Multiples calculated as set out above and applied to the EBITDA of a typical lower-mid market
business would, in the majority of cases, be expected to overstate the value of the business. This can in part be due to the net impact of a
combination of the following factors:
• A discount may be applied due to reduced liquidity of shares in a lower-mid market business,
• A premium may be applied due to the additional value of owning a controlling equity share,
• A (perceived) lack of transparency with respect to a lower-mid market business’ affairs,
• “TEV” is based on forecast profits (which usually assume growth) whereas these multiples are based on historic profits.
4
Globalscope ConferenceHighlights of discussions from the latest
Globalscope conference held in Perth, Australia
New developments 5
Conference report 6
Global M&A market landscape 7
Lower-mid market sector highlights 8
($5-150m enterprise value transactions)
5
New developments
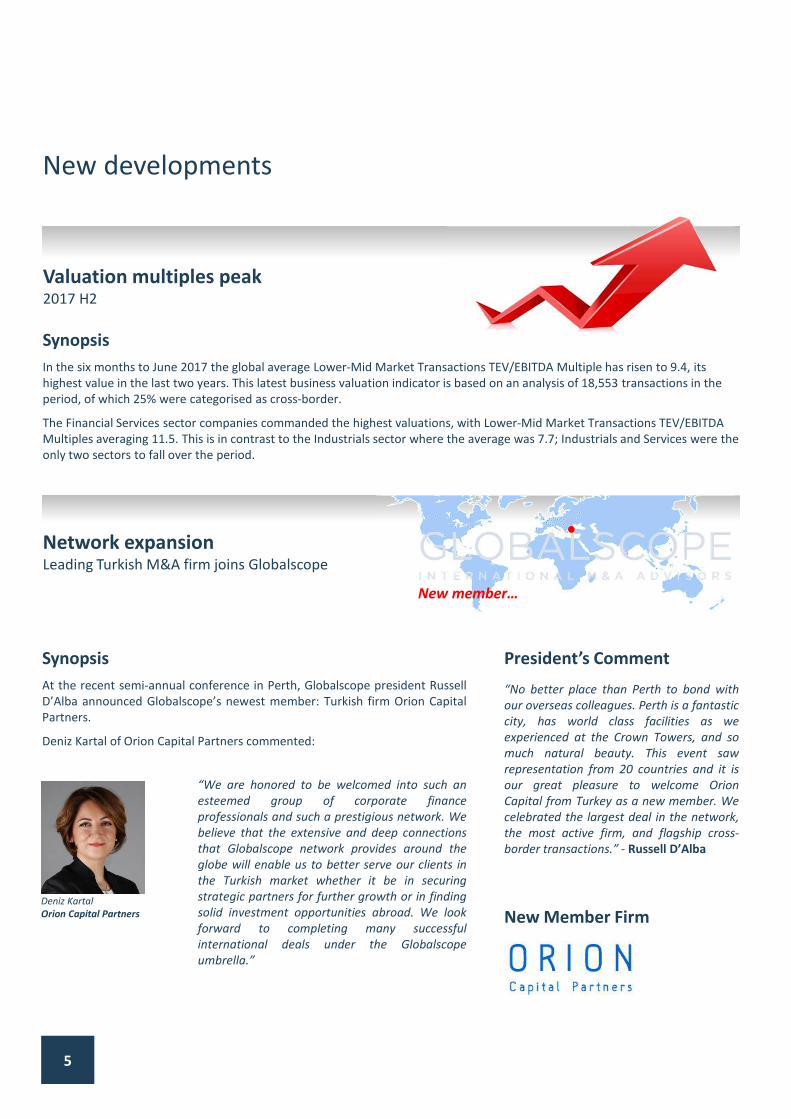
Valuation multiples peak 2017 H2
Synopsis
In the six months to June 2017 the global average Lower-Mid Market Transactions TEV/EBITDA Multiple has risen to 9.4, its
highest value in the last two years. This latest business valuation indicator is based on an analysis of 18,553 transactions in the
period, of which 25% were categorised as cross-border.
The Financial Services sector companies commanded the highest valuations, with Lower-Mid Market Transactions TEV/EBITDA
Multiples averaging 11.5. This is in contrast to the Industrials sector where the average was 7.7; Industrials and Services were the
only two sectors to fall over the period.
Synopsis
At the recent semi-annual conference in Perth, Globalscope president Russell
D’Alba announced Globalscope’s newest member: Turkish firm Orion Capital
Partners.
Deniz Kartal of Orion Capital Partners commented:
President’s Comment
“No better place than Perth to bond with
our overseas colleagues. Perth is a fantastic
city, has world class facilities as we
experienced at the Crown Towers, and so
much natural beauty. This event saw
representation from 20 countries and it is
our great pleasure to welcome Orion
Capital from Turkey as a new member. We
celebrated the largest deal in the network,
the most active firm, and flagship cross-
border transactions.” - Russell D’Alba
“We are honored to be welcomed into such an
esteemed group of corporate finance
professionals and such a prestigious network. We
believe that the extensive and deep connections
that Globalscope network provides around the
globe will enable us to better serve our clients in
the Turkish market whether it be in securing
strategic partners for further growth or in finding
solid investment opportunities abroad. We look
forward to completing many successful
international deals under the Globalscope
umbrella.”
Deniz Kartal
Orion Capital Partners New Member Firm
Network expansionLeading Turkish M&A firm joins Globalscope
New member…

Conference report
Synopsis
The two day conference programme, hosted by
Globalscope’s member firm in Perth, Tompkins Turner, was
attended by 30 delegates from Globalscope’s member firms.
The semi-annual conference included best practice
presentations given by CatCap, and a presentation on
interacting with PE by Corbett Keeling. In addition, guest
speakers Tony Chong, Partner at Lavan Legal, and Ian
Thubron, founder of Asia Strategies and former Executive VP
at TBWA Asia Pacific, gave talks on M&A in Asia.
Comment“We were honored to host the
Globalscope conference in Perth to
develop deeper member collaboration,
share more techniques learned through
best practices and generate the means
to increase the volume of partnership
deals. We also found at least three new
potential global buyers for a business we
are currently marketing.”Todd Grover
Tompkins Turner
Host member firm
Tompkins Turner, an Australian
advisory firm based in Perth
offers mergers and acquisitions
advice to mid-market companies.
Headlines
Next
The next Globalscope
conference will be held in
Panama City in April 2018.
Greatest number of transactions:
CatCap (Germany) reported 6 deals completed in the last 6
months.
Largest transaction:
Summa Capital (Finland) for their transaction with YIT and
Lemminkäinen.
Intra-Globalscope deal:
Stratégique (Netherlands) and Atout Capital (France) which
respectively advised The Surgical Group, a Dutch medical
products company, on its acquisition of a majority stake in
Axess Vision, a French medical devices company
Globalscope’s M&A
track record continues
to gain momentum
with the following
headlines in the last
six months:
6

2012 2013 2014 2015 2016 2017
7
Global M&A market landscape
Thousands of M&A transactions all across the globe are
closed in any given six month period.
Transaction data, such as the latest published EBITDA and
the TEV (see definitions on page 3) at the time of sale of the
target company, are sometimes published. These data can
be used to calculate average transaction TEV/EBITDA
Multiples i.e. the average TEV/EBITDA Multiple across all
transactions for which data is disclosed for each six month
period.
Across a large enough sample of transactions, these average
TEV/EBITDA Multiples are a useful tool for assessing global
valuation trends, as set out in the first chart below.
All Market Transactions
Dot-dash lines show average data from all disclosed
transactions where the transaction value was at least $5m.
The resulting All Market Transactions TEV/EBITDA Multiple,
which can be used as a proxy for the M&A market as a whole,
shows a further rise to an historic peak.
Lower-Mid Market Transactions
Solid lines show average data from all disclosed transactions
where the transaction value was at least $5m but no greater
than $150m. The resulting Lower-Mid Market Transactions
TEV/EBITDA Multiple shows a slight increase maintaining a
relatively steady historic average.
TE
V/E
BIT
DA
Vo
lum
e
Lower-Mid Market
Transactions
TEV/EBITDA Multiple
(Values in range $5m-$150m)
has risen to 9.4 from 8.9 in 2016
H2
All Market
Transactions
TEV/EBITDA Multiple
(Values over $5m)
has risen further to 14.1 from
the low of 11.3 in 2015 H1
‘00
0s
This compares to the current
All Market Listed Companies
TEV/EBITDA Multiple of 12.8
This compares to the current
Lower-Mid Market Listed
Companies TEV/EBITDA Multiple
of 11.6
Comment Context
All
Transactions
Volume
Transaction volumes have
decreased, and are now below
the 5 year average
Cross-Border
Transactions
Volume
remaining at a consistent
22% - 25% of the total
Listed Companies made
3,641 strategic acquisitions
in the last 6 months, this is below
the average of 3,952 strategic
acquisitions per six month period
over the last three years
Lower-Mid Market Listed
Companies made
561 strategic acquisitions
in the last six months, this is
above the average of 529
strategic acquisitions per six
month period over the last three
years
Data supplied by:
0
5
10
15
20
25
Data analysed by:
6,0
7,0
8,0
9,0
10,0
11,0
12,0
13,0
14,0
15,0
16,0

‘00
0s
8
Lower-mid market sector highlights
TE
V/E
BIT
DA
Vo
lum
e
Generally these data are significantly more volatile than the
global average as they are based on fewer transactions and
global events may affect each sector differently.
The following charts show global Lower-Mid Market
Transaction TEV/EBITDA Multiple trends of six underlying
sectors as identified and tracked by Globalscope.
Each of these average TEV/EBITDA Multiple data points
represent transactions involving target companies operating
in broadly the same sectors, wherever they were located
across the globe, where the target company’s enterprise
value was at least $5m but no greater than $150m.
2012 2013 2014 2015 2016 2017 Comment Context
Limited data for Financial
Services sector in 2012 H1 and
2017 H1 so interpolated values
used.
All
Transactions
Volume
by sector in 2017 H1 there were:
Consumer: 3,119
Financial Services: 1,430
Life Sciences: 1,335
Industrials: 4,151
Services: 4,839
TMT: 3,679
Lower-Mid Market
Transactions
TEV/EBITDA Multiples
(Values in range $5m-$150m)
by sector in 2017 H1 were:
Financial Services: 11.5
Life Sciences: 11.1
Consumer: 10.8
TMT: 10.5
Services: 7.8
Industrials: 7.7
Analysis performed by:Data supplied by:
0
5
10
15
20
25
Listed Companies in each of
these sectors made the following
strategic acquisitions in the six
months to mid August 2017:
Consumer: 577
Financial Services: 151
Life Sciences: 322
Industrials: 1,337
Services: 443
TMT: 811
Lower-Mid Market Listed
Companies in each of these
sectors had the following average
TEV/EBITDA Multiples as at mid
August 2017:
Financial Services: 10.7
Life Sciences: 15.1
Consumer: 11.8
TMT: 12.6
Services: 12.5
Industrials: 10.4
4
5
6
7
8
9
10
11
12
13
14

9

10
Regional Valuation StatisticsCountry by country and region by region analysis
of business valuation statistics
Transaction data by region 11
Listed companies data by region 13

11
Transactions data by region
Eu
rop
e
2012 2013 2014 2015 2016 2017 Comment Context
Lower-Mid Market
European Transactions
TEV/EBITDA Multiple
(Values in range $5m-$150m)
has fallen to 8.6 from 9.9 in 2014
H2
All Market
European Transactions
TEV/EBITDA Multiple
(Values over $5m)
has fallen slightly to 14.8 from
14.9 in 2016 H2
This compares to the current
All Market European Listed
Companies TEV/EBITDA Multiple
of 11.4
This compares to the current
Lower-Mid Market European
Listed Companies TEV/EBITDA
Multiple of 12.3
Un
ite
d S
tate
s &
Ca
na
da
Lower-Mid Market
US & Canada Transactions
TEV/EBITDA Multiple
(Values in range $5m-$150m)
has risen to 11.0 from 8.6 in
2016 H2
All Market
US & Canada Transactions
TEV/EBITDA Multiple
(Values over $5m)
has risen to 14.6 from 12.4 in
2016 H2
This compares to the current
All Market US & Canada Listed
Companies TEV/EBITDA Multiple
of 13.4
This compares to the current
Lower-Mid Market US & Canada
Listed Companies TEV/EBITDA
Multiple of 11.8
Asi
a &
Pa
cifi
c
All Market
Asian Transactions
TEV/EBITDA Multiple
(Values over $5m)
has fallen to 10.6 from 11.0 in
2016 H2
This compares to the current
All Market Asian Listed
Companies TEV/EBITDA Multiple
of 13.4
Lower-Mid Market
Asian Transactions
TEV/EBITDA Multiple
(Values in range $5m-$150m)
has fallen to 8.0 from 8.6 in 2016
H2
This compares to the current
Lower-Mid Market Asian Listed
Companies TEV/EBITDA Multiple
of 11.6
Data supplied by: Data analysed by:
Lower-Mid Market Transactions (solid lines)
The solid line shows average TEV/EBITDA Multiple data from
all disclosed transactions where the transaction value was at
least $5m but no greater than $150m and the target location
was recorded in one of the five global regions.
Multiples for Africa & Middle East and Latin America have
both risen sharply. Multiples in United States & Canada have
also increased over the period.
All Market Transactions (dot-dash lines)
Dot-dash lines show average TEV/EBITDA Multiple data from
all disclosed transactions where the transaction value was at
least $5m and the target location was recorded in one of the
five global regions.
Multiples for Africa & Middle East have risen over the period.
Both Europe and Asia & Pacific, by contrast, have fallen.
4
6
8
10
12
14
16
4
6
8
10
12
14
16
4
6
8
10
12
14
16

0
5
10
15
20
25
Mil
lie
rs
2012 2013 2014 2015 2016 2017
12
Africa
& M
idd
le E
ast
Latin
Am
erica
Comment Context
All Market
African Transactions
TEV/EBITDA Multiple
(Values over $5m)
has risen to 13.9 from 8.5 in
2016 H1
This compares to the current
All Market African Listed
Companies TEV/EBITDA Multiple
of 11.1
Lower-Mid Market
African Transactions
TEV/EBITDA Multiple
(Values in range $5m-$150m)
has risen to 9.1 from 6.4 in 2016
H2
This compares to the current
Lower-Mid Market African Listed
Companies TEV/EBITDA Multiple
of 10.8
All Market
Latin America Transactions
TEV/EBITDA Multiple
(Values over $5m)
has risen to 10.3 from 9.9 in
2016 H2
This compares to the current
All Market Latin America Listed
Companies TEV/EBITDA Multiple
of 10.1
Lower-Mid Market
Latin America Transactions
TEV/EBITDA Multiple
(Values in range $5m-$150m)
has risen to 11.0 from 3.8 in
2016 H2
This compares to the current
Lower-Mid Market Latin America
Listed Companies TEV/EBITDA
Multiple of 12.1
Vo
lum
e
All
Transaction
Volumes
by region in 2017 H1 were:
Europe: 6,835
US & Canada: 7,319
Asia & Pacific: 3,307
Africa & ME: 569
Latin America: 523
Africa & Middle East and Latin America lower-mid market transaction data are more scarce than those for the other regions. As
such these average transaction multiples are significantly more volatile and are included for completeness as much as for
providing a guide to valuation trends in these regions.
Data supplied by:
‘00
0s
Data analysed by:
Listed Companies in each of
these regions made the following
strategic acquisitions in the six
months to mid August 2017:
Europe: 996
US & Canada: 1,016
Asia & Pacific: 1,509
Africa & ME: 75
Latin America: 45
4
6
8
10
12
14
16
2
4
6
8
10
12
14
16

Europe Asia &
Pacific
Africa
& ME
US &
Canada
Latin
America
Listed companies’ TEVs are calculated from each company’s
current share price (which reflects the market’s expectation
of future EBITDA performance).
The EBITDA figures used to calculate the Listed Company
TEV/EBITDA Multiples shown here are the reported EBITDA
values of each company for the last 12 months (LTM) – this
gives TEV/EBITDA Multiples more directly comparable to
Transaction TEV/EBITDA Multiples than if forecast (NTM)
EBITDA is used. A discount should be applied if using these
figures for a valuation of a growing business, which would
normally use forecast performance data.
13
Listed companies data by region
All Market Listed Companies (light)
The light blue bars show average data from listed companies
with TEV of at least $5m. The results can be used as proxies
of TEV/EBITDA Multiples for the current market as a whole.
Lower-Mid Market Listed Companies (dark)
The dark blue bars show average data from listed companies
with TEV of at least $5m but no greater than $150m. The
results can be used as proxies of TEV/EBITDA Multiples for
the current lower-mid market as a whole.
Lower-Mid Market
Listed Companies
Volume
(Values in range $5m-$150m)
is again particularly low in Latin
America at 112
All Market
Listed Companies
Volume
(Values over $5m)
is significantly higher in Asia &
Pacific than anywhere else at
13,308
The global total number of All
Market Listed Companies is
21,849
The global total number of Lower-
Mid Market Listed Companies is
7,962
Comment Context
Lower-Mid Market
Listed Companies
TEV/EBITDA Multiple
(Values in range $5m-$150m)
is highest in Europe at 12.3, 15%
higher than the lowest in Africa &
ME of 10.8
All Market
Listed Companies
TEV/EBITDA Multiple
(Values over $5m)
is highest in Asia & Pacific at 13.4,
33% higher than the lowest in
Latin America of 10.1
This compares to the global total
All Market Listed Companies
TEV/EBITDA Multiple of 12.8
This compares to the global total
Lower-Mid Market Listed
Companies TEV/EBITDA Multiple
of 11.6
Vo
lum
eT
EV
/EB
ITD
AA
cqu
isit
ion
s
‘00
0s
As at:
mid August 2017
Data supplied by:
All Market
Listed Companies
(Values over $5m)
Acquisitions in last six months
is highest in Asia & Pacific in
absolute terms at 1,509
acquisitions, but highest is United
States on an acquisitions per Listed
Company basis at 32%, compared
to Africa & ME’s 6%
In total there were 3,641
strategic acquisitions by All
Market Listed Companies in the
six months to mid August 2017.
These compare to All Market
Transaction Volumes in 2017 H1
by region of (in ‘000s):
Europe: 6.8
Asia & Pacific: 3.3
Africa & ME: 0.6
US & Canada: 7.3
Latin America: 0.5
‘00
0s
Data analysed by:
11,4
13,4
11,1
13,4
10,1
12,311,6
10,811,8 12,1
0
2
4
6
8
10
12
14
16
3,5
13,3
1,3
3,2
0,51,2
5,6
0,6 0,50,1
0
2
4
6
8
10
12
14
1,0
1,5
0,1
1,0
0,0
0,0
0,2
0,4
0,6
0,8
1,0
1,2
1,4
1,6

14
The following data are compiled for each sub-region with a Globalscope member presence for which statistics are available.
All Market
Listed Companies(Values over $5m)
Lower-Mid Market
Listed Companies(Values in range $5m-$150m)
Data supplied by: Data analysed by:
As at:
mid August 2017Number
listed
TEV/EBITDA
Multiples
Number
listed
TEV/EBITDA
Multiples
British Isles 2 648 11.6 135 11.8
East Europe 8 504 8.8 330 11.0
North Europe 5 763 10.6 255 12.8
South Europe 6 438 10.6 144 13.1
West Europe 17 1,131 11.8 304 13.1
Total Europe 38 3,484 10.9 1,168 12.3
Indian Ocean 6 1,960 16.2 1,177 12.5
North & East Asia 6 8,650 13.3 3,034 11.2
Pacific 2 2,698 12.5 1,374 11.8
Total Asia / Pacific 14 13,308 13.6 5,585 11.6
Africa 2 554 10.6 261 9.7
Middle East 1 754 11.4 289 11.5
Total Africa / Middle East 3 1,308 11.1 550 10.7
Brazil 1 190 9.9 33 15.8
Uruguay 1 - - - -
Others 3 358 10.3 79 10.0
Latin America 5 548 10.1 112 12.1
Globalscope
Offices
Eu
rop
eU
SA
& C
an
ad
aA
sia
& P
aci
fic
Afr
ica
&
Mid
dle
Ea
stLa
tin
Am
eri
ca
Canada 5 543 12.8 181 11.0
United States 9 2,507 13.4 252 11.9
Others 1 151 12.1 114 13.1
United States and Canada 15 3,201 13.4 547 11.8

15

16
Sector-Specific AnalysisA closer look at the underlying sector-specific structural
drivers, new developments, recent M&A and projections
Consumer 17
Financial Services 19
Life Sciences 21
Industrials 23
Services 25
Technology, Media & Telecoms (TMT) 27

+31 6130 85245
Martijn Peters
Consumer Co-Lead
Consumer
17
The sector M&A landscape
During the Perth 2017 Globalscope conference, the network’s global Consumer sector team met to discuss recent
transactions and the evolving underlying structural drivers of the global sector M&A landscape.
A key theme is the growth of social media and its increasing influence over consumer spending habits. More details can
be obtained from team members or regional heads – see contact details below.
Lower-mid market observations
Sector contacts
Notable recent transactions
Sector themes
Polarised Consumer Spending
Customers within the food and beverage sector have tended
to favour the extremities of the market, as trends such as
affordable indulgence and healthier eating have grown
alongside staples sold in budget supermarkets such as Aldi
and Lidl.
Overseas Buyers Enticed by Devalued Pound
The devaluation of sterling meant UK assets were
exceptionally good value and international buyers seized the
opportunity to invest.
Amazon Gobbles up Whole Foods
Amazon.com Inc. will acquire Whole Foods Market Inc. for
$13.7bn, creating a launchpad for the e-commerce
company’s grocery sales. This acquisition follows Amazon’s
tie-up with UK supermarket chain Morrison's in late 2016.
Sycamore Partners Acquires Staples
The private equity firm has put together a $6.9bn turnaround
plan that includes reducing the retail footprint of the office
supplies company.
LVMH Takes Full Control of Christian Dior
French billionaire and LVMH chairman Bernard Arnault
moved to consolidate control over Christian Dior for
approximately $14.1bn.
Online Shopping’s Continued Rise in Importance
The volume of products bought online continues to grow at
an exceptional rate, with particular focus on purchases from
mobile devices. The increased necessity for sufficient
cybersecurity has added another layer of sophistication to
the platforms.
“Midorexia” and its Associated Spend
The stock coined phrase ‘mid-life crisis’ has a subdivision for
those customers who are acting, and therefore spending,
younger than their years might suggest. The phenomenon
can be witnessed in the fashion industry, as well as fitness
related tech and apparel.
+813 6205 7994
Pankaj Rungta
Consumer Co-Lead
Personalised Products
From holidays to hoodies, consumers continue to search for
(seemingly) entirely tailorable products. Offering a wide
range of services should help retailers build a stronger
emotional attachment to their customers. It is now expected
that all services possess some element of adaptability.
Social Media Influencer Marketing
The use of Instagram influencers by big brands has grown
exponentially, although it is now expecting a crackdown from
consumer protection bodies in the UK and US.
18
Durables
& Apparel
Consumer
Services
Retailing Food
Staples
Food
Luxuries
Europe Asia &
Pacific
Africa &
ME
US &
Canada
Latin
America
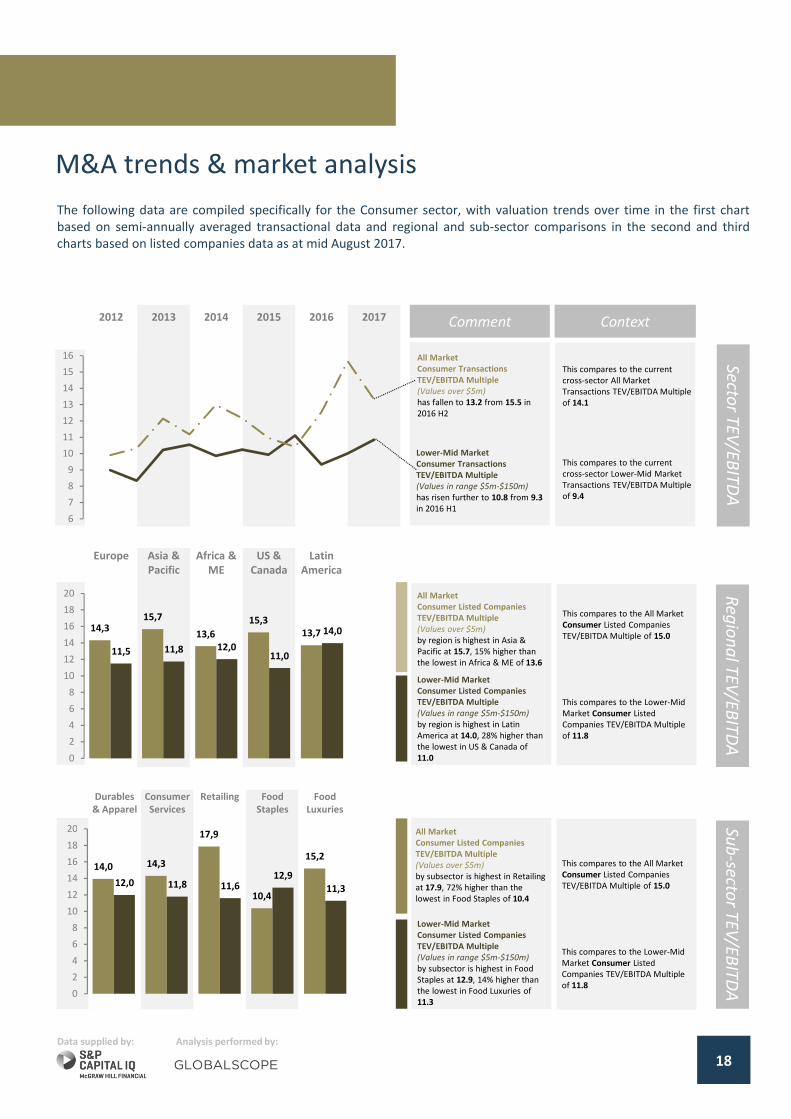
M&A trends & market analysis
The following data are compiled specifically for the Consumer sector, with valuation trends over time in the first chart
based on semi-annually averaged transactional data and regional and sub-sector comparisons in the second and third
charts based on listed companies data as at mid August 2017.
2012 2013 2014 2015 2016 2017
Lower-Mid Market
Consumer Transactions
TEV/EBITDA Multiple
(Values in range $5m-$150m)
has risen further to 10.8 from 9.3
in 2016 H1
All Market
Consumer Transactions
TEV/EBITDA Multiple
(Values over $5m)
has fallen to 13.2 from 15.5 in
2016 H2
This compares to the current
cross-sector All Market
Transactions TEV/EBITDA Multiple
of 14.1
This compares to the current
cross-sector Lower-Mid Market
Transactions TEV/EBITDA Multiple
of 9.4
Comment Context
Lower-Mid Market
Consumer Listed Companies
TEV/EBITDA Multiple
(Values in range $5m-$150m)
by subsector is highest in Food
Staples at 12.9, 14% higher than
the lowest in Food Luxuries of
11.3
All Market
Consumer Listed Companies
TEV/EBITDA Multiple
(Values over $5m)
by subsector is highest in Retailing
at 17.9, 72% higher than the
lowest in Food Staples of 10.4
Re
gio
na
l TE
V/E
BIT
DA
Sub
-secto
r TE
V/E
BIT
DA
Secto
r TE
V/E
BIT
DA
Lower-Mid Market
Consumer Listed Companies
TEV/EBITDA Multiple
(Values in range $5m-$150m)
by region is highest in Latin
America at 14.0, 28% higher than
the lowest in US & Canada of
11.0
All Market
Consumer Listed Companies
TEV/EBITDA Multiple
(Values over $5m)
by region is highest in Asia &
Pacific at 15.7, 15% higher than
the lowest in Africa & ME of 13.6
This compares to the All Market
Consumer Listed Companies
TEV/EBITDA Multiple of 15.0
This compares to the Lower-Mid
Market Consumer Listed
Companies TEV/EBITDA Multiple
of 11.8
Analysis performed by:Data supplied by:
6
7
8
9
10
11
12
13
14
15
16
This compares to the All Market
Consumer Listed Companies
TEV/EBITDA Multiple of 15.0
This compares to the Lower-Mid
Market Consumer Listed
Companies TEV/EBITDA Multiple
of 11.8
14,315,7
13,6
15,3
13,7
11,5 11,8 12,011,0
14,0
0
2
4
6
8
10
12
14
16
18
20
14,0 14,3
17,9
10,4
15,2
12,0 11,8 11,612,9
11,3
0
2
4
6
8
10
12
14
16
18
20
Financial Services
19
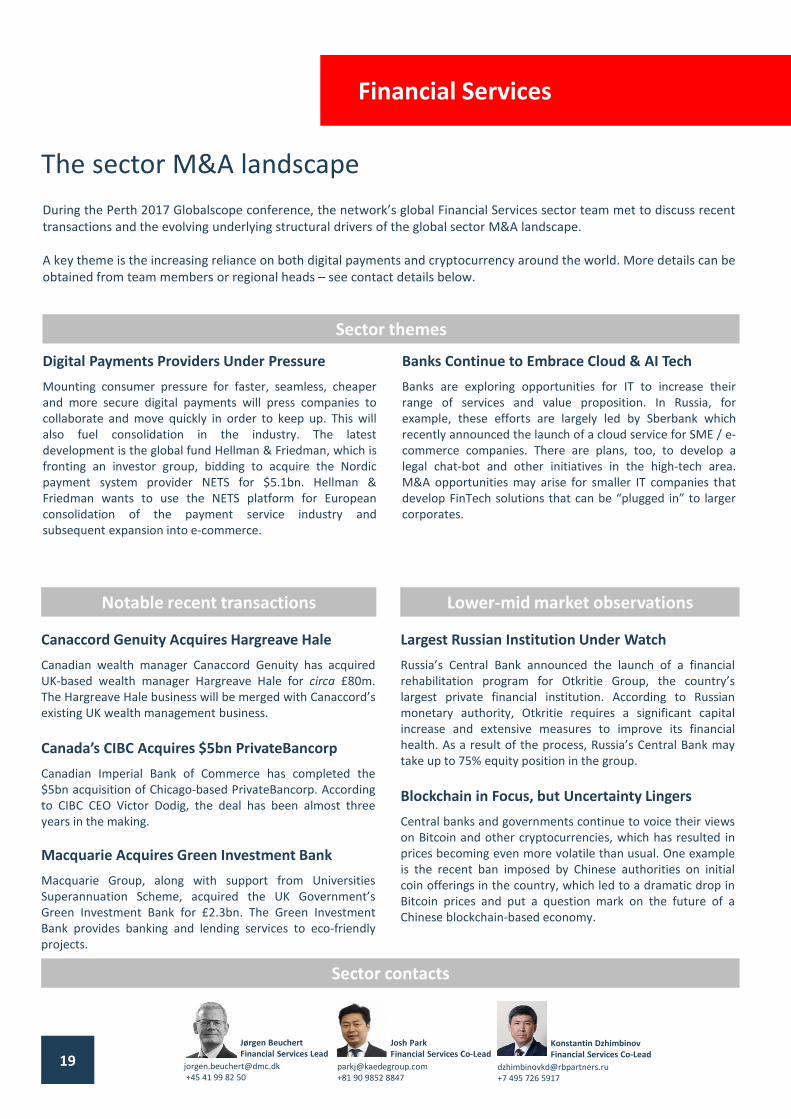
The sector M&A landscape
During the Perth 2017 Globalscope conference, the network’s global Financial Services sector team met to discuss recent
transactions and the evolving underlying structural drivers of the global sector M&A landscape.
A key theme is the increasing reliance on both digital payments and cryptocurrency around the world. More details can be
obtained from team members or regional heads – see contact details below.
Jørgen Beuchert
Financial Services Lead
+45 41 99 82 50
+81 90 9852 8847
Josh Park
Financial Services Co-Lead
Largest Russian Institution Under Watch
Russia’s Central Bank announced the launch of a financial
rehabilitation program for Otkritie Group, the country’s
largest private financial institution. According to Russian
monetary authority, Otkritie requires a significant capital
increase and extensive measures to improve its financial
health. As a result of the process, Russia’s Central Bank may
take up to 75% equity position in the group.
Blockchain in Focus, but Uncertainty Lingers
Central banks and governments continue to voice their views
on Bitcoin and other cryptocurrencies, which has resulted in
prices becoming even more volatile than usual. One example
is the recent ban imposed by Chinese authorities on initial
coin offerings in the country, which led to a dramatic drop in
Bitcoin prices and put a question mark on the future of a
Chinese blockchain-based economy.
Canaccord Genuity Acquires Hargreave Hale
Canadian wealth manager Canaccord Genuity has acquired
UK-based wealth manager Hargreave Hale for circa £80m.
The Hargreave Hale business will be merged with Canaccord’s
existing UK wealth management business.
Canada’s CIBC Acquires $5bn PrivateBancorp
Canadian Imperial Bank of Commerce has completed the
$5bn acquisition of Chicago-based PrivateBancorp. According
to CIBC CEO Victor Dodig, the deal has been almost three
years in the making.
Macquarie Acquires Green Investment Bank
Macquarie Group, along with support from Universities
Superannuation Scheme, acquired the UK Government’s
Green Investment Bank for £2.3bn. The Green Investment
Bank provides banking and lending services to eco-friendly
projects.
Digital Payments Providers Under Pressure
Mounting consumer pressure for faster, seamless, cheaper
and more secure digital payments will press companies to
collaborate and move quickly in order to keep up. This will
also fuel consolidation in the industry. The latest
development is the global fund Hellman & Friedman, which is
fronting an investor group, bidding to acquire the Nordic
payment system provider NETS for $5.1bn. Hellman &
Friedman wants to use the NETS platform for European
consolidation of the payment service industry and
subsequent expansion into e-commerce.
Banks Continue to Embrace Cloud & AI Tech
Banks are exploring opportunities for IT to increase their
range of services and value proposition. In Russia, for
example, these efforts are largely led by Sberbank which
recently announced the launch of a cloud service for SME / e-
commerce companies. There are plans, too, to develop a
legal chat-bot and other initiatives in the high-tech area.
M&A opportunities may arise for smaller IT companies that
develop FinTech solutions that can be “plugged in” to larger
corporates.
Lower-mid market observations
Sector contacts
Notable recent transactions
Sector themes
+7 495 726 5917
Konstantin Dzhimbinov
Financial Services Co-Lead

Europe Asia &
Pacific
Africa &
ME
US &
Canada
Latin
America
20
M&A trends & market analysis
The following data are compiled specifically for the Financial Services sector, with valuation trends over time in the first
chart based on semi-annually averaged transactional data and regional and sub-sector comparisons in the second and
third charts based on listed companies data as at mid August 2017.
2012 2013 2014 2015 2016 2017
All Market
Financial Services Transactions
TEV/EBITDA Multiple
(Values over $5m)
has fallen to 13.2 from 15.3 in
2016 H2
Lower-Mid Market
Financial Services Transactions
TEV/EBITDA Multiple
(Values in range $5m-$150m)
has risen to 11.5 from 9.1 in
2016 H1
Comment Context
Lower-Mid Market
Financial Services Listed
Companies TEV/EBITDA Multiple
(Values in range $5m-$150m)
by subsector is highest in Banks
at 13.4, 41% higher than the
lowest in Insurance of 9.5
All Market
Financial Services Listed
Companies TEV/EBITDA Multiple
(Values over $5m)
by subsector is highest in Real
Estate at 15.8, 31% higher than
the lowest in Insurance of 12.1
Lower-Mid Market
Financial Services Listed
Companies TEV/EBITDA Multiple
(Values in range $5m-$150m)
by region is highest in Asia &
Pacific at 11.7, 80% higher than
the lowest in Latin America of 6.5
All Market
Financial Services Listed
Companies TEV/EBITDA Multiple
(Values over $5m)
by region is highest in Asia &
Pacific at 15.6, 81% higher than
the lowest in Latin America of
8.6
Analysis performed by:Data supplied by:
Banks Diversified Insurance Real Estate
4
6
8
10
12
14
16
18
This compares to the All Market
Financial Services Listed
Companies TEV/EBITDA Multiple
of 12.9
This compares to the Lower-Mid
Market Financial Services Listed
Companies TEV/EBITDA Multiple
of 10.7
Re
gio
na
l TE
V/E
BIT
DA
Sub
-secto
r TE
V/E
BIT
DA
Secto
r TE
V/E
BIT
DA
This compares to the All Market
Financial Services Listed
Companies TEV/EBITDA Multiple
of 12.9
This compares to the Lower-Mid
Market Financial Services Listed
Companies TEV/EBITDA Multiple
of 10.7
This compares to the current
cross-sector All Market
Transactions TEV/EBITDA Multiple
of 14.1
This compares to the current
cross-sector Lower-Mid Market
Transactions TEV/EBITDA Multiple
of 9.4
10,2
15,6
12,9 12,8
8,610,0
11,710,4
9,7
6,5
0
2
4
6
8
10
12
14
16
18
20
13,0 13,512,1
15,8
13,4
11,5
9,5
12,0
0
2
4
6
8
10
12
14
16
18
20

Life Sciences
21
The sector M&A landscape
During the Perth 2017 Globalscope conference, the network’s global Life Sciences sector team met to discuss recent
transactions and the evolving underlying structural drivers of the global sector M&A landscape.
A key theme is the continued tightening of regulation, in spite of some policy uncertainty. More details can be obtained
from team members or regional heads – see contact details below.
+91 22 6154 4500
+49 89 255 4953 10
Jacob Matthew
Pharma Lead
Caspar Graf Stauffenberg
Life Sciences Lead
+49 40 300 836 0
Dr. Manfred Drax
Life Sciences Co-Lead
MDR – Medical Device Regulation for CE marking
In May 2017 the MDR was published and will be mandatory
from May 2020 onwards. Slowly, more and more potential
impacts are coming to light. For instance, several products,
and even some software, that had previously not been
classified as a medical product will be classified as such.
Extensive clinical data will be required, not only for new
products, but also for the re-certification of proven products.
Overall, quality management and regulatory affair (QM/RA)
costs will noticeably increase resulting in a higher barrier to
entry in favour of established oligopolists.
Shortfall in QM/RA Capacities Expected
Due to the MDR, notified bodies themselves need to
recertify. Smaller institutions might not be able to comply.
Therefore, we expect a consolidation wave in the sector.
Over the next few years, both corporates and notified bodies
will need more QM/RA capacities leading to a shortage in
that area.
Johnson & Johnson acquired Actelion
J&J has closed the acquisition of Swiss company Actelion for
$29.4bn. Actelion has spun off its drug discovery operations
and early-stage clinical development assets into a newly
created Swiss biopharmaceutical company, Idorsia Ltd.
Becton Dickinson to Acquire Bard
The $24bn deal adds Bard’s devices to Becton Dickinson’s
portfolio in the high-growth sectors of oncology and surgery.
The deal is the latest in a string of deals in the MedTech
sector.
Gilead to Acquire Kite Pharma
Kite is a leader in the emerging field of cell therapy in which a
patient’s immune cells are activated to fight cancer. The deal
is expected to be worth $11.9bn. Gilead’s focus previously
has been on infectious diseases, and this deal is seen as a
move to diversify its portfolio.
Cyberattacks
Some of the industry’s most established companies, including
Merck, Beiersdorf and the British NHS, were subject to the
WannaCry ransomware attack this summer. Many healthcare
institutions have taken to implementing some more
sophisticated IT systems, as well as adhering to more
stringent digital housekeeping. At the end of August 2017,
the FDA announced that approximately 500,000 implantable
cardiac pacemakers require a firmware update to address
cybersecurity vulnerabilities. One lesson learned is that
healthcare products with digital components require special
quality management attention in general and even post
market introduction to remain secure.
US Big Dealmaking Declines
Companies have been shying away from large takeovers
following President Donald Trump’s failure to move ahead
with overhauling the American tax code. This is coupled with
European uncertainty around Britain’s extraction from the
European Union.
Medical Services Activity Up
Low interest rates, higher deal leverage multiples, cash on
private equity and strategic balance sheets allowed for
continued consolidation in the medical services sub-sector.
This has been further driven by greater demand for, amongst
other things, non-invasive surgeries.
Lower-mid market observations
Sector contacts
Notable recent transactions
Sector themes

Europe Asia &
Pacific
Africa &
ME
US &
Canada
Latin
America
22
M&A trends & market analysis
The following data are compiled specifically for the Life Sciences sector, with valuation trends over time in the first chart
based on semi-annually averaged transactional data and regional and sub-sector comparisons in the second and third
charts based on listed companies data as at mid August 2017.
2012 2013 2014 2015 2016 2017
Lower-Mid Market
Life Sciences Transactions
TEV/EBITDA Multiple
(Values in range $5m-$150m)
has risen further to 11.1 from 9.7
in 2016 H1
All Market
Life Sciences Transactions
TEV/EBITDA Multiple
(Values over $5m)
has risen to 16.5 from 15.3 in
2016 H2
Comment Context
Lower-Mid Market
Life Sciences Listed Companies
TEV/EBITDA Multiple
(Values in range $5m-$150m)
by subsector is highest in
BioTech at 18.3, 31% higher than
the lowest in Providers &
Services of 14.0
All Market
Life Sciences Listed Companies -
TEV/EBITDA Multiple
(Values over $5m)
by subsector is highest in
MedTech at 21.9, 75% higher
than the lowest in Providers &
Services of 12.5
Lower-Mid Market
Life Sciences Listed Companies
TEV/EBITDA Multiple
(Values in range $5m-$150m)
by region is highest in Latin
American at 16.8, 62% higher
than the lowest in Africa & ME of
10.4
All Market
Life Sciences Listed Companies -
TEV/EBITDA Multiple
(Values over $5m)
by region is highest in Asia &
Pacific at 18.6, 41% higher than
the lowest in Europe of 13.2
Analysis performed by:Data supplied by:
4
6
8
10
12
14
16
18
Equipment
& Supplies
Providers &
Services
MedTech BioTech Pharma
This compares to the All Market
Life Sciences Listed Companies
TEV/EBITDA Multiple of 14.7
This compares to the Lower-Mid
Market Life Sciences Listed
Companies TEV/EBITDA Multiple
of 15.1
Re
gio
na
l TE
V/E
BIT
DA
Sub
-secto
r TE
V/E
BIT
DA
Secto
r TE
V/E
BIT
DA
This compares to the All Market
Life Sciences Listed Companies
TEV/EBITDA Multiple of 14.7
This compares to the Lower-Mid
Market Life Sciences Listed
Companies TEV/EBITDA Multiple
of 15.1
This compares to the current
cross-sector All Market
Transactions TEV/EBITDA Multiple
of 14.1
This compares to the current
cross-sector Lower-Mid Market
Transactions TEV/EBITDA Multiple
of 9.4
13,2
18,6
16,6
14,215,215,1 15,5
10,4
14,6
16,8
0
2
4
6
8
10
12
14
16
18
20
22
17,6
12,5
21,9
15,014,0
16,1
14,0 14,5
18,3
14,0
0
2
4
6
8
10
12
14
16
18
20
22
24
The sector M&A landscape
Industrials
During the Perth 2017 Globalscope conference, the network’s global Industrials sector team met to discuss recent
transactions and the evolving underlying structural drivers of the global sector M&A landscape.
A key theme is the emergence of technology and Internet of Things as a facet of manufacturing. More details can be
obtained from team members or regional heads – see contact details below.
23
Utilities Companies Empower Consumer
Schemes are being trialled that allow consumers to own grid-
tied solar panels. These panels, and energy storage thereof,
are provided by a utility company and allow the consumer to
be a “self-consumer” of power.
Manufacturing now Multifaceted
Modern-day manufacturing has now become a multi-sector
problem. With the rise of connected factories, and in-built
logistics systems, companies view manufacturing as an area
for sector-by-sector improvement.
Use of Data Analytics Shaping Maintenance
‘Condition-based maintenance’ is altering the way that
service contracts and warranties are provided by companies.
Constant monitoring of equipment allows companies to
monitor wear, usage patterns and service timelines.
SNC-Lavelin acquires WS Atkins
Diversified industrials company SNC-Lavelin has acquired WS
Atkins in a $2.7bn transformational deal. WS Atkins provides
consultancy services in design, engineering and project
management.
Rockwell Collins acquires B/E Aerospace
Aircraft interior manufacturer Rockwell Collins has completed
the $8.6bn acquisition of B/E Aerospace, a manufacturer of
aircraft interiors and accessories, including lighting, lavatory
systems and connectivity solutions.
Bridgepoint Acquires Miller Homes
Britain’s largest privately owned housebuilder, Miller Homes,
has been acquired by private equity group Bridgepoint
Capital in a deal worth $850m. Miller reported a 31% increase
in operating profit between 2015 and 2016.
New Era of Personal Transportation
Connected cars are making in-roads in the automotive
industry; software designers are now more in demand than
mechanical engineers. This coupled with the electrification of
vehicles will lead to manufacturers adjusting their strategy.
According to PWC’s global automotive M&A report, large
auto-tech deals quintupled in H1 2017 compared to H1 2016.
Digitalisation in the Chemicals Sector
Chemicals companies are seeking to improve customer
experience by utilising the latest digital technology. One
example of this is to track usage patterns of chemicals and
products and proactively addressing customer needs.
Emerging Economies Taking Market Share
Engineering and contracting firms in rapidly growing
economies have begun to adopt an outward-facing approach.
Previously, these firms focused on their respective domestic
markets, but are now competing on the world stage.
Low Cost Carriers Disrupting Airline Industry
The airline industry was once clear-cut in its definition of low-
cost carriers and full-service carriers. These distinctions
continue to be blurred as ultra low-cost carriers take market
share from the once dominant full-service carriers. Overall,
the industry continues to thrive as global passenger traffic
grew 7.9% in H1 2017 over H1 2016 according to IATA.
Lower-mid market observations
Sector contacts
Notable recent transactions
Sector themes
Pankaj Bhuwania
Industrials Co-Lead
+91 98 1045 8044
Al Melchiorre
Industrials Lead
+1 330 239 1990

Energy Materials Capital
Goods
Auto-
mobiles
Utilities
M&A trends & market analysis
The following data are compiled specifically for the Industrials sector, with valuation trends over time in the first chart
based on semi-annually averaged transactional data, and regional and sub-sector comparisons in the second and third
charts based on listed companies data as at mid August 2017.
2012 2013 2014 2015 2016 2017
Lower-Mid Market
Industrials Transactions
TEV/EBITDA Multiple
(Values in range $5m-$150m)
has remained flat at 7.7, its
previous high of 8.6 was in 2015
H2
All Market
Industrials Transactions
TEV/EBITDA Multiple
(Values over $5m)
has risen to 14.6 from 10.4 in
2016 H2
Comment Context
Lower-Mid Market
Industrials Listed Companies
TEV/EBITDA Multiples
(Values in range $5m-$150m)
by subsector is highest in Capital
Goods at 11.2, 28% higher than
the lowest in Energy of 8.7
All Market
Industrials Listed Companies
TEV/EBITDA Multiple
(Values over $5m)
by subsector is highest in Capital
Goods at 13.9, 51% higher than
the lowest in Automobiles of 9.2
Lower-Mid Market
Industrials Listed Companies
TEV/EBITDA Multiple
(Values in range $5m-$150m)
by region is highest in Europe at
11.2, 11% higher than the lowest
in US & Canada at 10.1
All Market
Industrials Listed Companies
TEV/EBITDA Multiple
(Values over $5m)
by region is highest in
US & Canada at 12.4, 46% higher
than the lowest in Latin America
of 8.5
Data analysed by:Data supplied by:
24
This compares to the All Market
Industrials Listed Companies
TEV/EBITDA Multiple of 11.3
This compares to the Lower-Mid
Market Industrials Listed
Companies TEV/EBITDA Multiple
of 10.4
Re
gio
na
l TE
V/E
BIT
DA
Sub
-secto
r TE
V/E
BIT
DA
Secto
r TE
V/E
BIT
DA
This compares to the All Market
Industrials Listed Companies
TEV/EBITDA Multiple of 11.3
This compares to the Lower-Mid
Market Industrials Listed
Companies TEV/EBITDA Multiple
of 10.4
4
6
8
10
12
14
16
Europe Asia &
Pacific
Africa &
ME
US &
Canada
Latin
America
This compares to the current
cross-sector All Market
Transactions TEV/EBITDA Multiple
of 14.1
This compares to the current
cross-sector Lower-Mid Market
Transactions TEV/EBITDA Multiple
of 9.4
9,3
12,010,5
12,4
8,5
11,210,2 10,3 10,1 10,6
0
2
4
6
8
10
12
14
16
18
20
9,6
11,2
13,9
9,210,7
8,79,8
11,2
9,5 9,8
0
2
4
6
8
10
12
14
16
18
20

25
Services
The sector M&A landscape
During the Perth 2017 Globalscope conference, the network’s global Services sector team met to discuss recent
transactions and the evolving underlying structural drivers of the global sector M&A landscape.
Key themes are acquirers undergoing unprecedented diversification, and how an understanding of the trends in digital
disruption is critical to determining the best potential acquirers of services businesses. More details can be obtained from
team members or regional heads – see contact details below.
+44 20 7626 6266
Jim Keeling
Services Co-Lead
+61 3 9665 2444
Dominic Marinelli
Services Lead
+31 6 13 08 52 45
Martijn Peters
Services Co-Lead
Lower-mid market observations
Sector contacts
Notable recent transactions
Sector themes
Small Firms Carving Out Strongholds
Whilst the consulting sector is still traditionally dominated by
the large firms, inclusive of the Big 4, smaller challengers are
gaining momentum by focusing solely on a niche and offering
a highly specialised service.
Consolidation Across the Consulting Market
More mature, mid-size, companies are being snapped up by
major players in a bid to provide a full suite of services. This
is, in turn, making it difficult for mid-size players to compete
in a market where scale benefits matter.
Freelance Employees Causing Disruption
Freelancers and network-based employees are disrupting
traditional professional service subsectors by offering more
tailored knowledge of buyers and providing a more ‘high-
touch’ service.
Political Headwinds Subsiding
2016 was the year of political upsets. Trump is now well into
his presidency, and whilst Brexit is still fraught with
uncertainty, it is largely ‘business as usual’ for UK companies
operating within the EU. Some believe, though, that Britain's
EU extraction may take five or more years.
Gartner Acquires CEB
Information technology research and advisory company
Gartner, Inc. has acquired US best practice and talent
management company CEB for approximately $2.6bn.
GoGoVan and 58 Suyun Merge
The merger between GoGoVan and 58 Suyun has created the
largest online intra-city logistics platform in Asia. The
combined company is worth in excess of $1bn. 58 Suyun is
the logistics business of online classifieds giant 58 Home.
General Electric Completes Penske Equity Sale
GE has sold its final 15.5% stake in Penske Truck Leasing to
the former partners of the business for around $674m.
Penske manages a fleet of around 250,000 trucks across
America.
Robotics Shaping the Future of Logistics
UPS, DHL and FedEx are all experimenting with robotic
loading and unloading of irregular parcels. Improved mapping
technologies will allow robots to evaluate packets more
accurately, as well as increasing efficient use of space in
shipping containers and lorries.
Digital Driving New Business Models
Management consultancies are looking to reduce their over-
reliance on senior consultants by applying more quantitative
analysis and using automation to decrease lead times and
increase efficiency.
2012 2013 2014 2015 2016 2017
Europe Asia &
Pacific
Africa &
ME
US &
Canada
Latin
America
26
Professional
Services
HR and
Employ-
ment
Real Estate
Mgmt
Research /
Consulting
Transport-
ation
M&A trends & market analysis
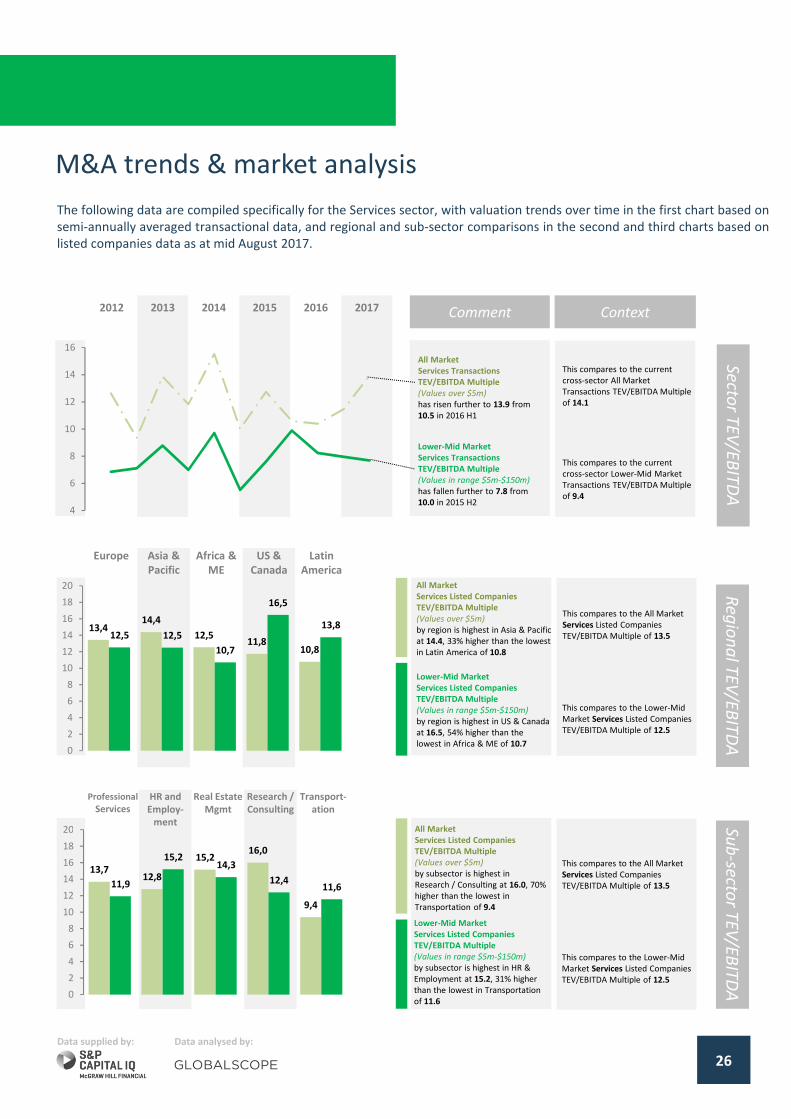
The following data are compiled specifically for the Services sector, with valuation trends over time in the first chart based on
semi-annually averaged transactional data, and regional and sub-sector comparisons in the second and third charts based on
listed companies data as at mid August 2017.
Lower-Mid Market
Services Transactions
TEV/EBITDA Multiple
(Values in range $5m-$150m)
has fallen further to 7.8 from
10.0 in 2015 H2
All Market
Services Transactions
TEV/EBITDA Multiple
(Values over $5m)
has risen further to 13.9 from
10.5 in 2016 H1
Comment Context
Lower-Mid Market
Services Listed Companies
TEV/EBITDA Multiple
(Values in range $5m-$150m)
by subsector is highest in HR &
Employment at 15.2, 31% higher
than the lowest in Transportation
of 11.6
All Market
Services Listed Companies
TEV/EBITDA Multiple
(Values over $5m)
by subsector is highest in
Research / Consulting at 16.0, 70%
higher than the lowest in
Transportation of 9.4
Lower-Mid Market
Services Listed Companies
TEV/EBITDA Multiple
(Values in range $5m-$150m)
by region is highest in US & Canada
at 16.5, 54% higher than the
lowest in Africa & ME of 10.7
All Market
Services Listed Companies
TEV/EBITDA Multiple
(Values over $5m)
by region is highest in Asia & Pacific
at 14.4, 33% higher than the lowest
in Latin America of 10.8
Data analysed by:Data supplied by:
4
6
8
10
12
14
16
This compares to the All Market
Services Listed Companies
TEV/EBITDA Multiple of 13.5
This compares to the Lower-Mid
Market Services Listed Companies
TEV/EBITDA Multiple of 12.5
This compares to the All Market
Services Listed Companies
TEV/EBITDA Multiple of 13.5
This compares to the Lower-Mid
Market Services Listed Companies
TEV/EBITDA Multiple of 12.5
Re
gio
na
l TE
V/E
BIT
DA
Sub
-secto
r TE
V/E
BIT
DA
Secto
r TE
V/E
BIT
DA
This compares to the current
cross-sector All Market
Transactions TEV/EBITDA Multiple
of 14.1
This compares to the current
cross-sector Lower-Mid Market
Transactions TEV/EBITDA Multiple
of 9.4
13,414,4
12,511,8
10,8
12,5 12,5
10,7
16,5
13,8
0
2
4
6
8
10
12
14
16
18
20
13,712,8
15,216,0
9,4
11,9
15,214,3
12,411,6
0
2
4
6
8
10
12
14
16
18
20

Technology, Media & Telecoms (TMT)
27
The sector M&A landscape
During the Perth 2017 Globalscope conference, the network’s global Technology, Media & Telecoms (TMT) sector team
met to discuss recent transactions and the evolving underlying structural drivers of the global sector M&A landscape.
A key theme is the establishment of venture capital arms by larger firms in order to nurture novel technologies. More
details can be obtained from team members or regional heads – see contact details below.
+44 20 7659 [email protected]
+494 0300 8360
Paddy MccGwire
Software & Tech LeadMark Miller
Digital & Internet Co-Lead
Sector contacts
Lower-mid market observationsNotable recent transactions
Sector themes
Rejuvenated Funding Market for Deep Tech
Investments in IP-based technology companies have
significantly increased in volume, across traditional sectors
such as semiconductors (e.g. Graphcore, Kalray, UltraSoC), as
well as more visionary areas such as flying cars (e.g. Lilium),
microsatellites (e.g. ICEYE) and simulated worlds (e.g.
Improbable). This environment seems likely to produce
significant M&A targets in the near future, that would be
expected to command high strategic prices.
Corporates Seek to Raise Visibility Over Targets
It is becoming increasingly common for trade buyers to
establish venture capital arms, as a means of enhancing their
visibility and understanding of the innovation taking place in
their operating markets, as well as to deepen their pipeline of
M&A targets. A nominal co-investment can often prove a
cheap way of obtaining optionality over whether to acquire a
potential target.
Amazon Acquires Online Retailer Souq.com
Amazon has sought to strengthen its e-commerce footprint
with expansion into the Middle Eastern market through the
acquisition of Souq.com for $580m in cash. The deal gives
Amazon a strong footing in a relatively untapped market.
HPE Acquires Hyper-Converged Player Nimble
HPE has agreed to acquire flash-optimised storage vendor
Nimble Storage for circa $1bn in cash. Nimble had never
turned a profit since its inception in 2008 and the price tag
reflects the value to HPE of broadening their flash portfolio.
Eventbrite Profits from Pandora Misfire
Eventbrite has acquired leading ticketing platform Ticketfly
from Pandora for $200m. This deal comes only 2 years after
Pandora acquired Ticketfly for $450m, in a deal that was
hailed as a landmark transaction linking music streaming data
with ticket sales.
PE Buyers are Setting the Tone in the Market
Between direct and bolt-on acquisitions, private equity
buyers are forecast to purchase c. 900 technology companies
in 2017. Private equity remains a favoured asset class for
institutional investors and the recycling of distributions from
successful exits into new capital has led to a fundraising
surge, generating substantial dry powder.
Cloud Transformation Fuels Activity in Software
As the enterprise market continues to slowly transition to the
cloud, the requirement to support hybrid IT environments
will drive M&A activity as larger players seek to broaden and
deepen their product/service portfolios.
Chinese Buyers Continue to Make Presence Felt
As part of the country’s One Belt, One Road initiative, China
continues to support and modernise its traditional
manufacturing industries through the acquisition of Western
technology companies. This aggressive strategy has seen
several deals fall foul of national regulators, such as the
decision to block the €780m sale of German chip equipment
maker Aixtron to a consortium of Chinese investors.
Automotive M&A Expected to Accelerate
The automotive sector has rapidly emerged as a key
technology battleground, that has seen established players
acquiring competence at all stages of the value chain.

6
7
8
9
10
11
12
13
14
Media Software Hardware Semi-
conductors
Telecoms
28
M&A trends & market analysis
The following data are compiled specifically for the TMT sector, with valuation trends over time in the first chart based on
semi-annually averaged transactional data and regional and sub-sector comparisons in the second and third charts based
on listed companies data as at mid August 2017.
Comment Context
Lower-Mid Market
TMT Listed Companies
TEV/EBITDA Multiple
(Values in range $5m-$150m)
by subsector is highest in
Software at 14.2, 41% higher
than the lowest in Telecoms of
10.1
All Market
TMT Listed Companies
TEV/EBITDA Multiple
(Values over $5m)
by subsector is highest in
Software at 17.5, 140% higher
than the lowest in Telecoms of
7.3
Lower-Mid Market
TMT Listed Companies
TEV/EBITDA Multiple
(Values in range $5m-$150m)
by region is highest in Europe at
14.3, 89% higher than the lowest
in Latin America of 7.6
All Market
TMT Listed Companies -
TEV/EBITDA Multiple
(Values over $5m)
by region is highest in US &
Canada at 13.1, 63% higher than
the lowest in Latin America of 8.1
Analysis performed by:Data supplied by:
This compares to the All Market
TMT Listed Companies
TEV/EBITDA Multiple of 12.4
This compares to the Lower-Mid
Market TMT Listed Companies
TEV/EBITDA Multiple of 12.6
This compares to the All Market
TMT Listed Companies
TEV/EBITDA Multiple of 12.4
This compares to the Lower-Mid
Market TMT Listed Companies
TEV/EBITDA Multiple of 12.6
Re
gio
na
l TE
V/E
BIT
DA
Sub
-secto
r TE
V/E
BIT
DA
Secto
r TE
V/E
BIT
DA
All Market
TMT Transactions
TEV/EBITDA Multiple
(Values over $5m)
has fallen to 10.3 from 12.1 in
2016 H2
Lower-Mid Market
TMT Transactions
TEV/EBITDA Multiple
(Values in range $5m-$150m)
has risen to 10.5 from 8.5 in
2016 H2
2012 2013 2014 2015 2016 2017
Europe Asia &
Pacific
Africa &
ME
US &
Canada
Latin
America
This compares to the current
cross-sector All Market
Transactions TEV/EBITDA Multiple
of 14.1
This compares to the current
cross-sector Lower-Mid Market
Transactions TEV/EBITDA Multiple
of 9.4
11,512,1
8,1
13,1
8,1
14,3
12,3
10,1
13,3
7,6
0
2
4
6
8
10
12
14
16
18
20
11,6
17,5
13,112,3
7,3
12,5
14,2
11,612,3
10,1
0
2
4
6
8
10
12
14
16
18
20