gold:protein stoichiometric analysis of albumin … oct 2018 us army research laboratory...
TRANSCRIPT

ARL-TR-8562● OCT 2018
US Army Research Laboratory
Gold:Protein Stoichiometric Analysis of Albumin-Stabilized Gold Nanoclusters by Kiwon Ok, Heather M Neu, Mark H Griep, and Sarah L J Michel Approved for public release; distribution is unlimited.
NOTICES
Disclaimers
The findings in this report are not to be construed as an official Department of the Army position unless so designated by other authorized documents.
Citation of manufacturer’s or trade names does not constitute an official endorsement or approval of the use thereof.
Destroy this report when it is no longer needed. Do not return it to the originator.
ARL-TR-8562 ● OCT 2018
US Army Research Laboratory
Gold:Protein Stoichiometric Analysis of Albumin-Stabilized Gold Nanoclusters by Kiwon Ok, Heather Neu, and Sarah L J Michel Department of Pharmaceutical Sciences, School of Pharmacy, University of Maryland, Baltimore, MD Mark H Griep Weapons and Materials Research Directorate, ARL Approved for public release; distribution is unlimited.

ii
REPORT DOCUMENTATION PAGE Form Approved OMB No. 0704-0188
Public reporting burden for this collection of information is estimated to average 1 hour per response, including the time for reviewing instructions, searching existing data sources, gathering and maintaining the data needed, and completing and reviewing the collection information. Send comments regarding this burden estimate or any other aspect of this collection of information, including suggestions for reducing the burden, to Department of Defense, Washington Headquarters Services, Directorate for Information Operations and Reports (0704-0188), 1215 Jefferson Davis Highway, Suite 1204, Arlington, VA 22202-4302. Respondents should be aware that notwithstanding any other provision of law, no person shall be subject to any penalty for failing to comply with a collection of information if it does not display a currently valid OMB control number. PLEASE DO NOT RETURN YOUR FORM TO THE ABOVE ADDRESS.
1. REPORT DATE (DD-MM-YYYY)
October 2018 2. REPORT TYPE
Technical Report 3. DATES COVERED (From - To)
August 2017–January 2018 4. TITLE AND SUBTITLE
Gold:Protein Stoichiometric Analysis of Albumin-Stabilized Gold Nanoclusters 5a. CONTRACT NUMBER
W911NF-17-20108 5b. GRANT NUMBER
5c. PROGRAM ELEMENT NUMBER
6. AUTHOR(S)
Kiwon Ok, Heather M Neu, Mark H Griep, and Sarah L J Michel 5d. PROJECT NUMBER
5e. TASK NUMBER
5f. WORK UNIT NUMBER
7. PERFORMING ORGANIZATION NAME(S) AND ADDRESS(ES)
Department of Pharmaceutical Sciences University of Maryland School of Pharmacy Baltimore, MD 21201
8. PERFORMING ORGANIZATION REPORT NUMBER
ARL-TR-8562
9. SPONSORING/MONITORING AGENCY NAME(S) AND ADDRESS(ES)
US Army Research Laboratory Weapons and Materials Research Directorate (RDRL-WMM-G) Aberdeen Proving Ground, MD 21005
10. SPONSOR/MONITOR'S ACRONYM(S)
11. SPONSOR/MONITOR'S REPORT NUMBER(S)
12. DISTRIBUTION/AVAILABILITY STATEMENT
Approved for public release; distribution is unlimited.
13. SUPPLEMENTARY NOTES
14. ABSTRACT
The field of bionanomaterials presents an opportunity to leverage the unique functionality inherent within the individual bio and nanocomponents to enable novel hybridized functionalities. Protein-stabilized nanoclusters are a primary example of such a bionano hybrid system, where enhanced coupled functionality has been demonstrated for sensor applications. Currently, however, the factors that control whether a protein component retains its activity are not well understood, but are believed to primarily relate to the location of the cluster stabilization within the host protein. In this work, foundational efforts toward identifying the stabilizing ligands coupled to the nanocluster are performed. Specifically, the gold:protein stoichiometry of a bovine serum albumin-nanocluster hybrid is characterized and purification strategies are optimized to allow for subsequent ligand identification routes.
15. SUBJECT TERMS
protein-stabilized gold nanoclusters, BSA-AuNCs, stoichiometry, nanophotonics, bionano hybrid
16. SECURITY CLASSIFICATION OF: 17. LIMITATION OF ABSTRACT
UU
18. NUMBER OF PAGES
17
19a. NAME OF RESPONSIBLE PERSON
Mark H Griep a. REPORT
Unclassified b. ABSTRACT
Unclassified
c. THIS PAGE
Unclassified
19b. TELEPHONE NUMBER (Include area code)
410-306-4953 Standard Form 298 (Rev. 8/98)
Prescribed by ANSI Std. Z39.18

Approved for public release; distribution is unlimited. iii
Contents
List of Figures iv
List of Tables iv
Acknowledgments v
1. Introduction 1
2. Experimental Procedure 1
2.1 Materials 1
2.2 Synthesis of BSA-AuNCs 1
2.3 UV-Visible (UV-Vis) Spectroscopy and Circular Dichroism 2
2.4 Emission Fluorescence Measurement 2
2.5 Protein Quantitation of BSA-AuNCs 2
2.6 Direct Measurement of [197Au] via Inductively Coupled Plasma-Mass Spectrometry (ICP-MS) 3
2.7 Liquid Chromatography Coupled ICP-MS 3
3. Results 3
3.1 UV-Vis and Circular Dichroism 3
3.2 Emission Spectrum of BSA-AuNCs 4
3.3 Direct Measurement of [197Au] 5
3.4 Liquid Chromatography Coupled ICP-MS 5
4. Conclusions 6
5. References 8
List of Symbols, Acronyms, and Abbreviations 9
Distribution List 10
Approved for public release; distribution is unlimited. iv
List of Figures
Fig. 1 Synthesis scheme of BSA-AuNCs ........................................................ 2
Fig. 2 A) UV-Vis absorption pattern comparison between reference BSA and BSA-AuNCs. Formation of BSA-AuNCs causes different UV-absorption pattern in 280-nm region. B) The far-UV CD scans were performed to examine the secondary structural change by the formation of AuNCs. ............................................................................ 4
Fig. 3 A) Emission wavelength peak at 630 nm is a typical feature of the BSA-AuNCs formed. Emission of BSA-AuNCs is dependent on solution pH. B) Visual change in BSA-AuNCs under visible light (left), and its emission fluorescence excited at 365 nm (right). ............ 5
Fig. 4 A) Liquid chromatograph ICP-MS analysis of diluted BSA-AuNC sample. The majority of [197Au] were detected at 12–15 min of retention time. B) Different molecular weight distributions among the reference BSA, BSA-AuNC, and size exclusion chromatography fractions of BSA-AuNCs by SDS-PAGE. ............................................ 6
List of Tables
Table 1 [Au]:[BSA] equivalents of BSA-AuNC estimation based on [197Au] and BSA concentration measured by direct ICP-MS and Bradford protein assay.......................................................................................... 5

Approved for public release; distribution is unlimited. v
Acknowledgments
The authors would like to thank Sasha Teymorian of the US Army Research Laboratory for helpful discussions and providing insight into the protein-nanocluster growth procedures.

Approved for public release; distribution is unlimited. 1
1. Introduction
Fluorescent gold-nanoclusters (AuNCs) have the potential to be used as novel imaging agents1 and sensors2,3 due to their distinct highest occupied molecular oribital–lowest unoccupied molecular orbital transition than better-studied gold nanoparticles.4 Among the AuNCs, protein-stabilized nanoclusters (PNCs) are subnanometer-sized particles that are formed via a simple one-pot reaction process that is initiated with a protein of interest.5 A number of applications for PNCs have been suggested including as fluorescence sensors of in situ cellular processes because of their lack of toxicity in biological settings.6 Currently, however, the molecular properties of PNCs are not well understood, and there is a limited understanding of their local structure. The field of PNCs is fairly small, with only handful of published examples with varying degrees of characterization.7 Within these examples, there is variability with respect to protein activity. In some cases, the protein retained native structure and activity when converted to the PNCs, and in others, the activity was diminished.8 The factors that control PNC activity are not well understood, including the gold:protein stoichiometry. Here, we report the synthesis and characterization of a bovine serum albumin (BSA)-AuNC using of a combination of liquid chromatographic and mass spectrometric application to determine gold:BSA stoichiometry.
2. Experimental Procedure
2.1 Materials
Milli-Q water was used for all solutions. All chemicals were purchased from Sigma-Aldrich (St. Louis, Missouri) and used without further purification except unspecified one. Primary chemicals are hydrochloric acid, chloroauric acid (HAuCl4), ascorbic acid, and sodium hydroxide (NaOH).
2.2 Synthesis of BSA-AuNCs
As shown in Fig. 1, the synthesis of BSA-AuNCs is a straightforward procedure involving the direct mixing of protein and metal precursors at select ratios and mixing at an elevated pH.

Approved for public release; distribution is unlimited. 2
Fig. 1 Synthesis scheme of BSA-AuNCs
In brief, a mixture solution of 2 mL of 50-mg/mL BSA with 2 mL of 10-mM HAuCl4 was stirred vigorously at 37 °C for 10 min and the measured solution pH was 3. The pH of the mixture was adjusted to 12 by adding 10 µL of 6-M NaOH and stirred vigorously for 2 h at 37 °C. After 2 h, to exclude excess gold salts, the reaction mixture was spin-filtered by 4-mL Amicon ultra centrifugal filter (30 kDa MW cutoff) by tabletop centrifuge with 5,000 g’s for 30 min. A filtered solution of BSA-AuNCs was diluted up to 1 mL by water and stored at 4 °C.
2.3 UV-Visible (UV-Vis) Spectroscopy and Circular Dichroism
Full scanned absorption spectra were obtained via a Perkin-Elmer Lamda 25 UV-Vis spectrophotometer with screw-capped quartz cuvette (Starna Cells). The far-UV circular dichroism (CD) analyses were performed via a JASCO-810 spectropolarimeter using a 1-mm path length quartz rectangular cuvette (Starna Cells). CD data were collected over the wavelength range of 180–280 nm, with a scan rate of 100 nm/min at 25 °C. Five scans were obtained for each point, and the average was determined and smoothed.
2.4 Emission Fluorescence Measurement
To measure emission fluorescence of synthesized BSA-AuNCs, an ISS K2 spectrofluorometer, configured in the L format, was utilized. Emission scans were performed at a range of 560–700 nm with the excitation wavelength/bandpass at 365 nm/1 nm in water solution at room temperature. The cuvettes used were Spectrosil far-UV quartz window fluorescence cuvettes (Starna Cells).
2.5 Protein Quantitation of BSA-AuNCs
Coomasie Plus Reagent (Pierce) for Bradford protein assay was performed by following the product manual. A series of diluted BSA samples was used to generate standard protein curve in range of 0.125–1.50 mg/mL.
Approved for public release; distribution is unlimited. 3
2.6 Direct Measurement of [197Au] via Inductively Coupled Plasma-Mass Spectrometry (ICP-MS)
ICP-MS was used to measure [197Au] of BSA-AuNCs. The concentration of gold ion in isolated protein samples was determined by injecting samples into an Agilent 7700X ICP-MS instrument (Agilent Technologies, Santa Clara, California), [197Au] ions were determined using an RF power of 1550 W, helium gas flow of 4.3 mL/min, an argon gas flow of 0.99 L/min, octopole RF of 190V, and an OctP bias of –18V. The AuNC sample was directly infused using the 7700X peristaltic pump with a speed of 0.1 rps and a micromist nebulizer. The [197Au] concentration was derived from a calibration generated by a series of dilution of atomic absorption standard (Fluka Analytical) prepared in the same matrix. Data analysis was performed via Agilent’s MassHunter software.
2.7 Liquid Chromatography Coupled ICP-MS
To separate the gold-containing BSA-AuNCs, high performance liquid chromatography (HPLC) equipped with size exclusion column (SEC) is directly coupled with an ICP-MS. The stock BSA-AuNC sample was diluted by 10-mM ammonium acetate at pH 7.4 and injected into an Agilent 1260 HPLC equipped with a BIO SEC-3 Guard column (3 μm, 300 Å, 4.6 × 50 mm) and an AdvancedBio SEC column (2.7 μm, 300 Å, 4.6 × 50 mm) in series. Eluent from HPLC was directly connected to the 7700X ICP-MS peristaltic pump with a micromist nebulizer. The [197Au] concentration was then measured and data analysis conducted by MassHunter software (Agilent).
3. Results
3.1 UV-Vis and Circular Dichroism
Synthesized BSA-AuNCs resulting from the reported synthetic procedure were scanned by a Perkin Elmer UV-Vis photospectrometer and a JASCO far-UV circular dichroism. As shown in Fig. 2, UV-Vis absorbance of synthesized BSA-AuNC showed a different absorption pattern at the 280-nm region with its reference protein due to an AuNCs formation. The CD experiment result demonstrated that the BSA-AuNC secondary structure is conserved after forming AuNCs with BSA. Although other protein-stabilized AuNCs results support protein secondary structure loss upon formation of AuNCs, this result, unlike smaller molecular weight proteins such as trypsin (23 kDa) and insulin (5.8 kDa), suggests that the BSA-AuNCs secondary structure can be similar to its reference BSA (66 kDa). The conserved secondary structure of BSA-AuNCs implicates that the

Approved for public release; distribution is unlimited. 4
protein used for stabilizing AuNCs might have their physiological functions after formation of AuNCs.
A)
Fig. 2 A) UV-Vis absorption pattern comparison between reference BSA and BSA-AuNCs. Formation of BSA-AuNCs causes different UV-absorption pattern in 280-nm region. B) The far-UV CD scans were performed to examine the secondary structural change by the formation of AuNCs.
3.2 Emission Spectrum of BSA-AuNCs
To confirm that the synthesized BSA-AuNC was fluorescently active (Fig. 3b), emission scanning was performed using an ISS K2 spectrofluorophotometer. As previously published, the synthesized BSA-AuNC exhibited an emission wavelength peak at 630 nm (excitation at 365 nm). This emission wavelength is dependent on pH. It is observed at high pH (11–12) and lost as the pH is lowered (Fig. 3a). BSA is known to maintain its structure between pH 7 and 7.5 and lose structure at pH 12. How the structure is affected in the context of the nanocluster requires further study.

Approved for public release; distribution is unlimited. 5
Fig. 3 A) Emission wavelength peak at 630 nm is a typical feature of the BSA-AuNCs formed. Emission of BSA-AuNCs is dependent on solution pH. B) Visual change in BSA-AuNCs under visible light (left), and its emission fluorescence excited at 365 nm (right).
3.3 Direct Measurement of [197Au]
To quantify the gold content of the PNC, ICP-MS was performed using diluted BSA-AuNC samples. The dilution factor was 41,250 due to the detection upper limit of [197Au] by 50–100 ppb. The Bradford method was used to quantify the protein. By comparing the gold and protein concentrations, the stoichiometry was then determined. The results shown in Table 1 are similar to those that have been reported using electrospray ionization mass spectrometry (ESI-MS).
Table 1 [Au]:[BSA] equivalents of BSA-AuNC estimation based on [197Au] and BSA concentration measured by direct ICP-MS and Bradford protein assay
ICP-MS [197Au] (ppb)
ICP-MS [197Au] (μM)
Bradford assay [BSA] (μM)
[Au] vs. [BSA] (equivalents)
Reported BSA-AuNC equivalents
22.01a 4069.3 556.7 7.31 9 a Dilution: 1/41,250
3.4 Liquid Chromatography Coupled ICP-MS
To determine the purity of the gold-containing BSA-AuNCs, an Agilent 1260 HPLC with SEC, directly coupled with ICP-MS, was used. Multiple protein-containing species (based upon a 280-nm protein absorbance) were observed. These data show that additional purification may be necessary to purify PNCs.
Approved for public release; distribution is unlimited. 6
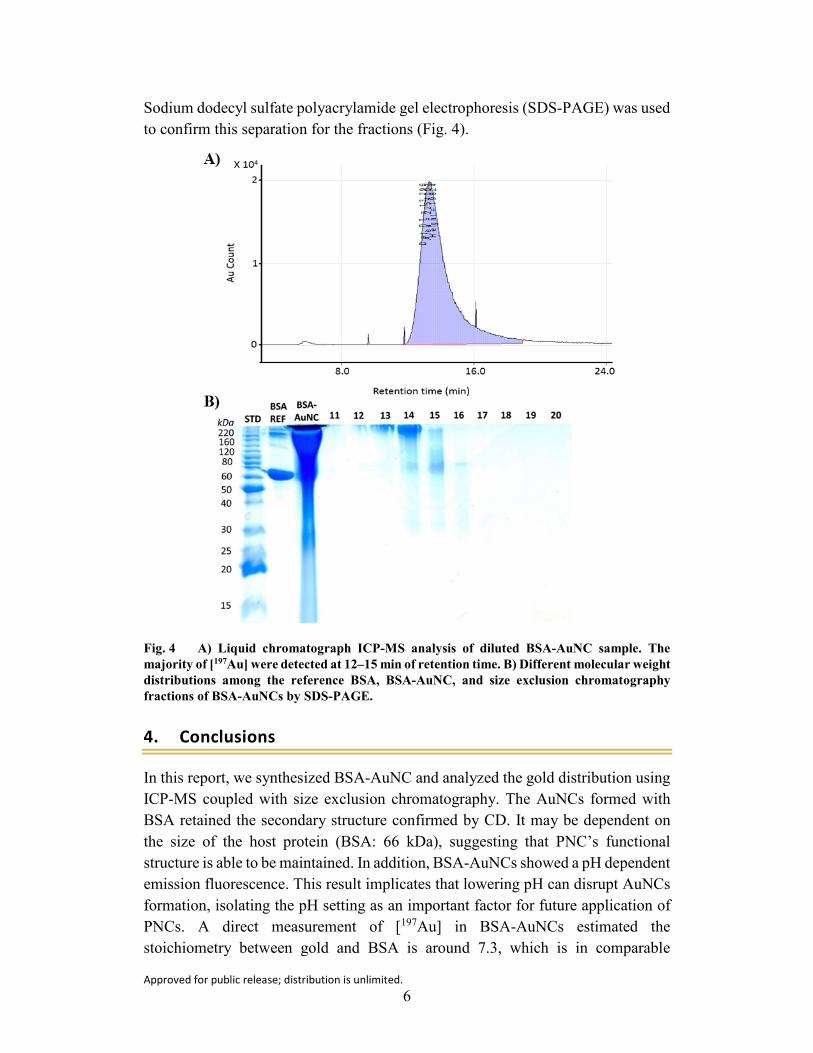
Sodium dodecyl sulfate polyacrylamide gel electrophoresis (SDS-PAGE) was used to confirm this separation for the fractions (Fig. 4).
Fig. 4 A) Liquid chromatograph ICP-MS analysis of diluted BSA-AuNC sample. The majority of [197Au] were detected at 12–15 min of retention time. B) Different molecular weight distributions among the reference BSA, BSA-AuNC, and size exclusion chromatography fractions of BSA-AuNCs by SDS-PAGE.
4. Conclusions
In this report, we synthesized BSA-AuNC and analyzed the gold distribution using ICP-MS coupled with size exclusion chromatography. The AuNCs formed with BSA retained the secondary structure confirmed by CD. It may be dependent on the size of the host protein (BSA: 66 kDa), suggesting that PNC’s functional structure is able to be maintained. In addition, BSA-AuNCs showed a pH dependent emission fluorescence. This result implicates that lowering pH can disrupt AuNCs formation, isolating the pH setting as an important factor for future application of PNCs. A direct measurement of [197Au] in BSA-AuNCs estimated the stoichiometry between gold and BSA is around 7.3, which is in comparable

Approved for public release; distribution is unlimited. 7
agreement to the resultant ratio of 9 using ESI-MS analysis. The liquid chromatography ICP-MS and SDS-PAGE results supported the evidence of BSA-AuNCs have multiple-sized protein formed with AuNCs and presents the purification pathway required to allow for subsequent gold-bound ligand identification.

Approved for public release; distribution is unlimited. 8
5. References
1. Wu X, He X, Wang K, Xie C, Zhou B, Qing Z. Ultrasmall near-infrared gold nanoclusters for tumor fluorescence imaging in vivo. Nanoscale. 2010;2(10):2244–2249.
2. West AL, Griep MH, Cole DP, Karna SP. DNase 1 retains endodeoxyribonuclease activity following gold nanocluster synthesis. Analytical Chemistry. 2014;86(15):7377–7382.
3. Chipara AC, Griep MH, Walter T, West AL. Fluorescent pressure response of protein-nanocluster polymer composites. Aberdeen Proving Ground (MD): Army Research Laboratory (US); 2016 May. Report No.: ARL-TN-0755.
4. Griep MH, West AL, Sellers MSP, Karna M, Zhan E, Hoque N. Biomediated atomic metal nanoclusters: synthesis and theory. In: Aliofkhazraei M, editor. Handbook of nanoparticles. Cham (Switzerland): Springer International Publishing; 2015. p. 1–24.
5. Xie J, Zheng Y, Ying JY. Protein-directed synthesis of highly fluorescent gold nanoclusters. J Am Chem Soc. 2009;131(3):888–889.
6. West AL, Schaeublin NM, Griep MH, Maurer-Gardner EI, Cole DP, Fakner AM, Hussain SM, Karna SP. In situ synthesis of fluorescent gold nanoclusters by nontumorigenic microglial cells. ACS Applied Materials & Interfaces. 2016;8(33):21221–21227.
7. Xu Y, Sherwood J, Qin Y, Crowley D, Bonizzoni M, Bao Y. The role of protein characteristics in the formation and fluorescence of Au nanoclusters. Nanoscale. 2014;6(3):1515–1524.
8. Chen L-Y, Wang C-W, Yuan Z, Chang H-T. Fluorescent gold nanoclusters: recent advances in sensing and imaging. Analytical Chemistry. 2015;87(1):216–229.

Approved for public release; distribution is unlimited. 9
List of Symbols, Acronyms, and Abbreviations
Au gold
AuNC gold nanocluster
BSA bovine serum albumin
CD circular dichroism
ESI-MS electrospray ionization mass spectrometry
HAuCl4 chloroauric acid
HPLC high performance liquid chromatography
ICP-MS inductively coupled plasma mass spectrometry
NaOH sodium hydroxide
PNC protein nanocluster
RF radio frequency
SDS-PAGE sodium dodecyl sulfate polyacrylamide gel electrophoresis
SEC size exclusion column
UV ultraviolet
Vis visible

Approved for public release; distribution is unlimited. 10
1 DEFENSE TECHNICAL (PDF) INFORMATION CTR DTIC OCA 2 DIR ARL (PDF) IMAL HRA RECORDS MGMT RDRL DCL TECH LIB 1 GOVT PRINTG OFC (PDF) A MALHOTRA 3 ARL (PDF) RDRL WMM A J SANDS RDRL WMM G J LENHART M GRIEP