graydon banning development, transportation impact study
TRANSCRIPT

Graydon Banning Development, Transportation Impact Study
Prepared for: Mattamy Homes Ltd.
Prepared by: Stantec Consulting Ltd.
August 2015


GRAYDON BANNING DEVELOPMENT, TRANSPORTATION IMPACT STUDY
Introduction August 2015
cm \\cd1215-f01\work_group\01650\active\160622238 - mattamy graydon banning\18_reports\rpt_gb_20150805.docx i
Table of Contents
1.0 INTRODUCTION ................................................................................................................ 1
2.0 PROPOSED DEVELOPMENT .............................................................................................. 2
3.0 EXISTING CONDITIONS .................................................................................................... 3 3.1 ROADS AND TRAFFIC CONTROL ....................................................................................... 3 3.2 NON-AUTO TRANSPORTATION MODES ............................................................................ 3
3.2.1 Transit .................................................................................................................. 3 3.2.2 Active Modes .................................................................................................... 4
3.3 TRAFFIC VOLUMES ............................................................................................................... 4 3.4 BASE YEAR (2015) TRAFFIC OPERATIONS .......................................................................... 4
4.0 FUTURE CONDITIONS ....................................................................................................... 7 4.1 BACKGROUND TRAFFIC ...................................................................................................... 7 4.2 SITE TRIP GENERATION ......................................................................................................... 7 4.3 TRIP DISTRIBUTION ................................................................................................................. 8 4.4 TRIP ASSIGNMENT ................................................................................................................. 8 4.5 TOTAL TRAFFIC ...................................................................................................................... 9
5.0 TRAFFIC IMPACT ASSESSMENT ...................................................................................... 10 5.1 FUTURE BACKGROUND TRAFFIC OPERATIONS .............................................................. 10 5.2 TOTAL FUTURE TRAFFIC OPERATIONS .............................................................................. 12
6.0 CONCLUSIONS ............................................................................................................... 16

GRAYDON BANNING DEVELOPMENT, TRANSPORTATION IMPACT STUDY
Introduction August 2015
cm \\cd1215-f01\work_group\01650\active\160622238 - mattamy graydon banning\18_reports\rpt_gb_20150805.docx ii
LIST OF TABLES Table 1 Existing Traffic Peak Hour Level of Service Analysis .................................................... 6 Table 2 Site Trip Generation ........................................................................................................... 8 Table 3 Trip Distribution by Study Area Approach ..................................................................... 8 Table 4 2020 Future Background Peak Hour Level of Service Analysis ............................... 10 Table 5 2025 Future Background Peak Hour Level of Service Analysis ............................... 11 Table 6 2020 Total Future Peak Hour Level of Service Analysis ........................................... 12 Table 7 2025 Total Future Peak Hour Level of Service Analysis ........................................... 14
LIST OF FIGURES Figure 1 - Study Area Figure 2 - Conceptual Site Plan Figure 3 – Dundas Street Future Lane Configurations Figure 4 – Oakville Transit Weekday Route Map Figure 5 – Oakville Recommended Cycling and Trails Network Figure 6 –Existing Base Year Traffic 2015 Figure 7 – EOK Traffic Impact Study Volumes Figure 8 – New Oakville Hospital Traffic Impact Study Volumes Figure 9 – Future Background Conditions 2020 Figure 10 – Future Background Conditions 2025 Figure 11 – Graydon Banning Net New Site Traffic Figure 12 – Gas Station Pass-By Traffic Figure 13 - Total Future Traffic 2020 Figure 14 - Total Future Traffic 2025
LIST OF APPENDICES Appendix A – Traffic Data and Signal Timing Information Appendix B – Existing Conditions Synchro Worksheets Appendix C – Background Traffic Excerpts Appendix D – Detailed Site Trip Generation Appendix E – Future Background Conditions Synchro Worksheets Appendix F – Future Total Traffic Conditions Synchro Worksheets

GRAYDON BANNING DEVELOPMENT, TRANSPORTATION IMPACT STUDY
Introduction August 2015
cm \\cd1215-f01\work_group\01650\active\160622238 - mattamy graydon banning\18_reports\rpt_gb_20150805.docx 1
1.0 INTRODUCTION
This Study has been prepared to assess the transportation impacts associated with proposed, primarily new residential development in the Town of Oakville, Halton Region. As shown in Figure 1, the development area is currently vacant land situated along the north side of Dundas Street West and bounded by Sixteen Mile Creek to the east and north and by vacant fields to the west. These lands will be bisected in the future by a new east-west arterial road, William Halton Parkway.
The scope of the Study is as follows:
A Study Area comprising the intersection of Proudfoot Trail at Dundas Street West, Neyagawa Boulevard at Dundas Street West, and the proposed site access intersections;
Traffic forecasts for the following horizon years:
o 2020, including Phase 1 lands south of future William Halton Parkway; o 2025, including Phase 2 lands north of future William Halton Parkway; and
Analysis time periods are the weekday a.m. and p.m. peak hours.
The methodology of the Study is summarized below:
Estimate the future peak hour background traffic for horizon years 2020 and 2025 based on growth rate information from the Dundas Street (Regional Road 5) Improvements Class Environmental Assessment Study, Bronte Road (Regional Road 25) to Proudfoot Trail, Environmental Study Report, MRC, December 2012 (Dundas Street ESR);
Estimate the net increase in traffic due to the development of Phase 1 for the 2020 horizon year;
Estimate the net increase in traffic due to full development (Phase 1 and Phase 2) for horizon year 2025;
Combine the future background traffic estimates with the net increase in site traffic to determine the total traffic volumes for each horizon year;
Analyze the peak hour intersection operations for future background and total traffic conditions for each horizon year; and
Determine the required transportation improvements and traffic control measures for the Study Area intersections, and identify the net impact of site traffic.
The Study has been done in general accordance with the Town’s and the Region’s Transportation/Traffic Impact Study (TIS) Guidelines and within the scope defined through pre-consultation with both municipalities.

N.T.S.
Subject site Figure 1Study Area
Town of Oakville
N

GRAYDON BANNING DEVELOPMENT, TRANSPORTATION IMPACT STUDY
Proposed Development August 2015
cm \\cd1215-f01\work_group\01650\active\160622238 - mattamy graydon banning\18_reports\rpt_gb_20151028.docx 2
2.0 PROPOSED DEVELOPMENT
The subject lands include the Graydon Banning and Schevchenko properties, which are illustrated in the concept site plan in Figure 2. The proposed development will include different residential densities and dwelling types. A section of these lands is referred to as “Dundas Urban Core”, which would be developed for residential apartments. In addition to residential, there are employment lands in the northwest and northeast quadrants of the Dundas Street West/Proudfoot Trail intersection. The development of the northeast quadrant is considered in this Study since the lands in the northwest quadrant only represent a fragment of a larger parcel that is outside of the Study Area. The proposed land use statistics are as follows: Graydon Banning Property
196 single-family detached residential units;
146 townhouse residential units;
282 apartment residential units; and
8 fueling position gas station on the employment lands east of Proudfoot Trail (Note: this has been assumed for trip generation purposes and is subject to change).
Schevchenko Property
52 single-family detached residential units;
40 townhouse residential units; and
266 apartment residential units.
The proposed phasing of the combined development comprises Phase 1 being built out by 2020 (lands south of the William Halton Parkway), while Phase 2 would be built out by 2025 (lands north of the William Halton Parkway).
Access to the subject lands would be provided along Proudfoot Trail for Phase 1, and along both Proudfoot Trail and William Halton Parkway for full development including Phase 2. This development area will eventually be served by an additional north-south roadway located to the east of Proudfoot Trail and opposite Fourth Line, and which will also provide access to Dundas Street West. This future roadway, which runs through the adjacent “CHWO” property, has not been considered in this Study due to uncertainty related to the development timing of the “CHWO” lands.

N.T.S.
Property Boundary Figure 2Traffic Zone Boundary Conceptual Site Plan
Town of Oakville
N
1 2
34

GRAYDON BANNING DEVELOPMENT, TRANSPORTATION IMPACT STUDY
Existing Conditions August 2015
cm \\cd1215-f01\work_group\01650\active\160622238 - mattamy graydon banning\18_reports\rpt_gb_20150805.docx 3
3.0 EXISTING CONDITIONS
3.1 ROADS AND TRAFFIC CONTROL
The characteristics of the existing roads and intersections in the vicinity of the subject site are described below. The Road to Change, Halton Region Transportation Master Plan 2031, Regional Municipality of Halton, September 2011 has been referenced for the road classifications.
Dundas Street West is a four lane east-west “Regional Road” (arterial) with a posted speed limit of 60km/h within the vicinity of the Study Area and is under the jurisdiction of Halton Region. This road is currently being widened and upon completion will have a six lane cross section including one lane in each direction dedicated for transit and HOV;
Proudfoot Trail is a north-south “Major Road” (minor arterial) with a posted speed limit of 50km/h and is under the jurisdiction of the Town of Oakville. This road intersects Dundas Street West at a signalized intersection. The road does not currently continue north of Dundas Street West; and
Fourth Line is a north-south “Local Road” with no posted speed limit and is under the jurisdiction of the Town of Oakville. It is assumed that the statutory speed limit of 50 km/h applies. This road starts at Dundas Street West and continues south for approximately 500m with access to a community centre as well as multi-use path connections. This road intersects Dundas Street West at a signalized intersection.
There are several planned roadway network improvements in the vicinity of the subject site as follows:
As noted above, improvements to Dundas Street West are currently under construction. Figure 3 shows the final lane arrangements from the Dundas Street ESR, which have been used in this Study for analysis; and
William Halton Parkway is a future east-west four lane Regional Road running north of and parallel to Dundas Street West. It is anticipated to be constructed within the Study Area by 2020.
3.2 NON-AUTO TRANSPORTATION MODES
3.2.1 Transit
Transit service is provided along Dundas Street by Oakville Transit by Route 5, which runs between Trafalgar Road and Bronte Road and Route 3 which runs along Third Line and Proudfoot Trail. The Oakville Transit Weekday Route Map is shown in Figure 4.

N.T.S.
Figure 3Dundas Street Future Lane ConfigurationExcerpt from Dundas Street ESR Plate 7
N

N.T.S.
Figure 4Oakville Transit Weekday Route Map
N

GRAYDON BANNING DEVELOPMENT, TRANSPORTATION IMPACT STUDY
Existing Conditions August 2015
cm \\cd1215-f01\work_group\01650\active\160622238 - mattamy graydon banning\18_reports\rpt_gb_20150805.docx 4
3.2.2 Active Modes
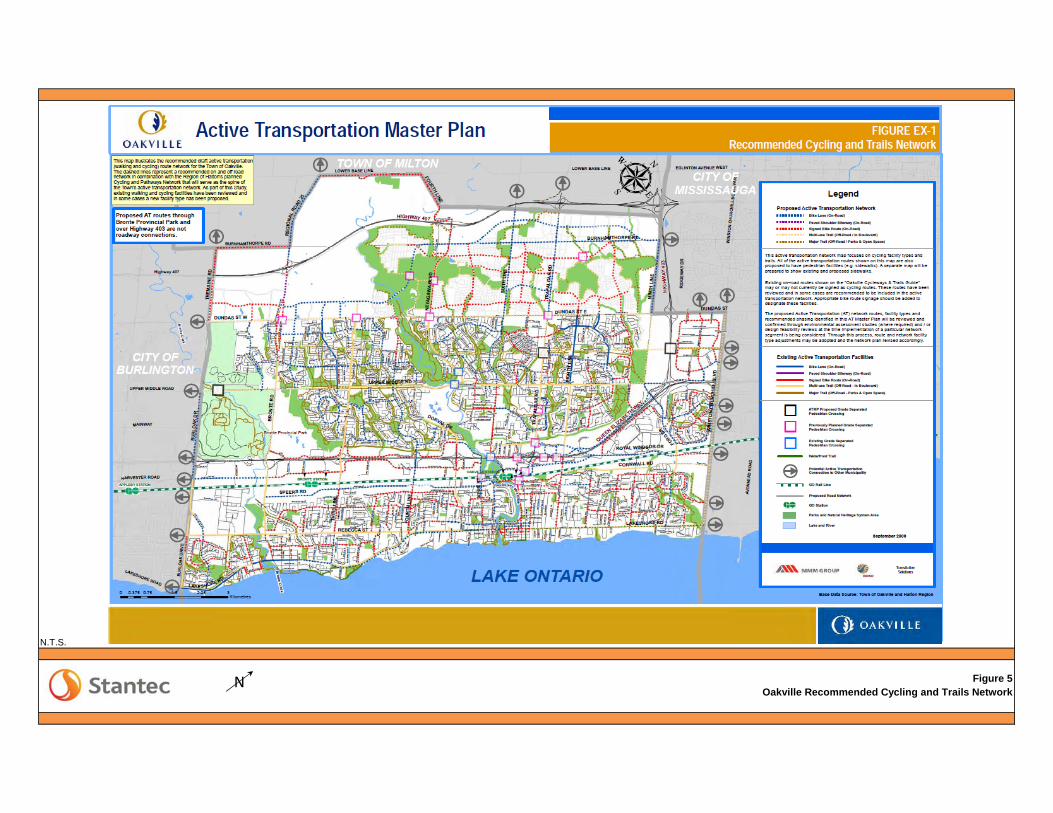
The existing and proposed Active Transportation facilities in and in proximity to the Study Area include:
Based on the Town’s Active Transportation Master Plan, off-road multi-use trails in the boulevard of Dundas Street West are proposed as well as a previously proposed grade separated pedestrian crossing at the intersection of Dundas Street West at Third Line (to the west of the Study Area;
Future William Halton Parkway is proposed to have on-road bike lanes;
Existing Proudfoot Trail has sidewalks and on-road bike lanes on both sides of the road; and
Fourth Line is proposed to be a signed on-road bike route and has a sidewalk on the west side between Dundas Street West and the Saint Volodymyr Cultural Centre.
The Recommended Cycling and Trails Network from the Town’s Active Transportation Master Plan is shown in Figure 5.
3.3 TRAFFIC VOLUMES
Traffic counts from 2014 were provided by Halton Region for the intersections of Dundas Street West at Proudfoot Trail and Fourth Line. However, due to ongoing construction, both the Region and Town requested that the 2012 counts from the Dundas Street ESR should be used as the basis for typical traffic conditions. For the intersection of Dundas Street West at Fourth Line, the 2014 count was used as the Dundas Street ESR did not include traffic data for this intersection.
To establish 2015 base year traffic volumes, a growth rate of 3% per annum was applied to the Dundas Street West through volumes and 2% per annum to the Proudfoot Trail traffic movements to account for traffic growth between 2012 and 2015. These growth rates were obtained from the Dundas Street ESR. For turning movements with minimal traffic volumes, a nominal value of 15 was assigned. The base year 2015 traffic volumes are shown in Figure 6.
3.4 BASE YEAR (2015) TRAFFIC OPERATIONS
The quality of intersection operations is typically measured in terms of level of service (LOS). The LOS is assigned on the basis of average delay per vehicle and includes deceleration delay, queue move-up time, stopped delay, and final acceleration delay. For signalized intersections LOS ranges from LOS A for 10 seconds or less average delay to LOS F for average delay greater than 80 seconds. For unsignalized intersections, the LOS ranges from LOS A for 10 seconds or less average delay to LOS F for average delay greater than 50 seconds. Capacity is evaluated in terms of the ratio of demand flow rate to capacity with an “at capacity” condition represented by a volume to capacity (v/c) ratio of 1.00 (i.e. volume demand equals capacity).
N.T.S.
Figure 5Oakville Recommended Cycling and Trails Network
N

YR 3GR 3.0% DundasGR 2.0% Proudfoot
Future William Halton Parkway
1,026 2,694 975 2,611 1,034 3,023 1,035 3,034 1,020 3,019 1,035 3,034 59 413 15 15
Dundas Street Dundas Street
1,296 2,460 1,250 2,412 51 386 1,416 2,798 1,419 2,808 1,404 2,793 15 15 1,419 2,808
46 49 84 166 15 15 15 15
458 30 108 437 30 30 249 30
AM Peak Hour 123 Figure 6PM Peak Hour 123 Existing Base Year Traffic 2015
Proudfoot Trail Fourth Line
N

GRAYDON BANNING DEVELOPMENT, TRANSPORTATION IMPACT STUDY
Existing Conditions August 2015
cm \\cd1215-f01\work_group\01650\active\160622238 - mattamy graydon banning\18_reports\rpt_gb_20150805.docx 5
According to the Region’s TIS Guidelines, the mitigation of traffic impacts at signalized intersections is required where:
Volume/capacity (V/C) ratios for overall operations, through movements, or shared through/turning movements increased to 0.85 or above;
V/C ratios for exclusive movements increased to 0.95 or above; or
Queues for an individual movement are projected to exceed available turning lane storage.
And similarly, for unsignalized intersections where:
Level of service (LOS), based on average delay per vehicle, on individual movements exceeds LOS “E”; or
The estimated 95th percentile queue length for an individual movement exceeds the available queue storage.
To assess the existing peak hour traffic conditions, a level of service analysis was undertaken for the Study Area intersections using TrafficWare Synchro 9.0, which implements the methods of the 2000 Highway Capacity Manual. The key parameters used in the analysis include:
Existing lane configurations, but with Dundas Street West based on the ESR lane configurations currently under construction1;
Signal timings as provided by the Town of Oakville;
Peak hour factors from the 2014 traffic counts (2012 PHFs were not available within the Dundas Street ESR);
Truck percentages for each movement have been calculated from the 2014 traffic counts (also not available in the 2012 data); and
Synchro default values for all other inputs.
1 While Dundas Street West is being widened from a basic 4-lane cross section to a 6-lane cross section, the additional through lane in each direction will be designated for high occupancy vehicles (HOV). According to the Dundas Street ESR, the HOV lane will be available to passenger cars with 2 or more people and buses up to the year 2031. After that, the HOV lane would become a bus only lane (bus rapid transit or BRT). For modeling the Dundas Street West signalized intersections within Synchro, the HOV lanes have been excluded from the analysis for existing and future conditions (i.e. the intersections are modeled with 2 through lanes, not 3). This was done to avoid having a modeled volume in the HOV lane that would be unrealistically high since the lane volumes would be assigned relatively equally within the software. Rather, a 15% reduction factor has been applied within Synchro to the Dundas Street West eastbound and westbound through traffic volumes to reflect the anticipated usage of the HOV lane by passenger cars with 2 or more people while maintaining an overall occupancy rate of approximately 1.2 persons per vehicle. This occupancy rate is referenced within the Dundas Street West ESR for both existing and 2021 conditions, and is anticipated to increase to 1.3 persons per vehicle by 2031.

GRAYDON BANNING DEVELOPMENT, TRANSPORTATION IMPACT STUDY
Existing Conditions August 2015
cm \\cd1215-f01\work_group\01650\active\160622238 - mattamy graydon banning\18_reports\rpt_gb_20150805.docx 6
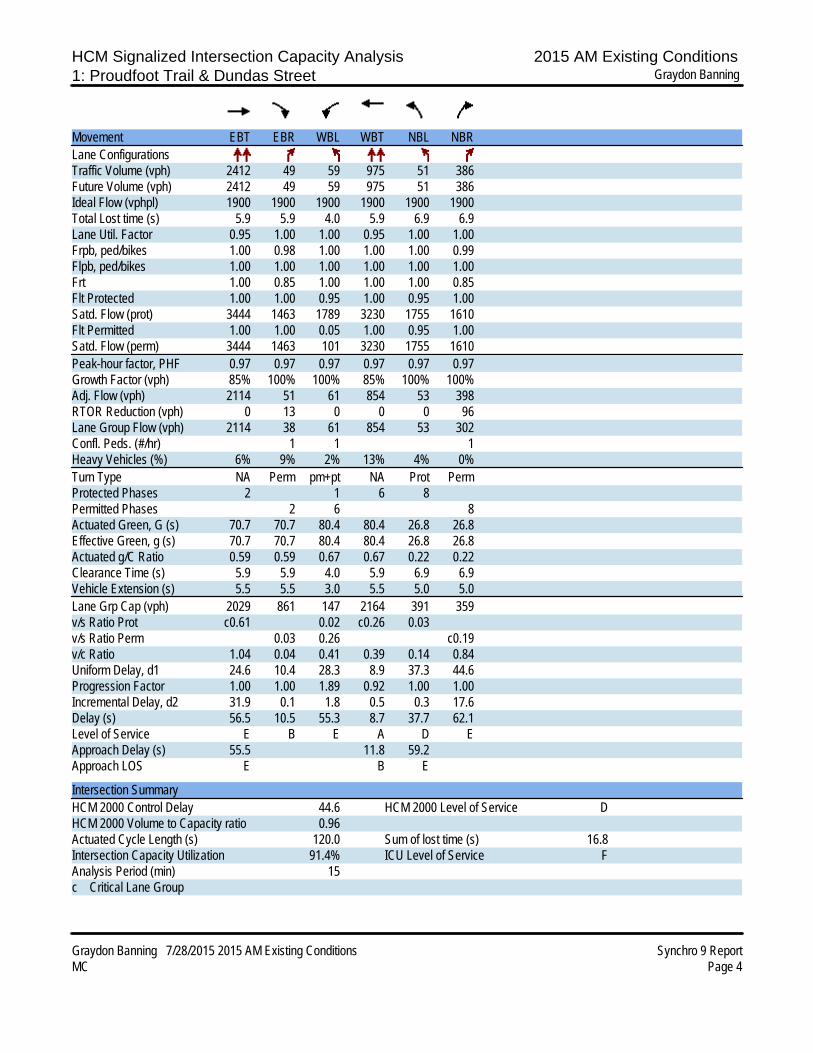
The results of the analysis are summarized in Table 1. The existing signal timing information and turning movement counts are provided in Appendix A. The Synchro analysis output is provided in Appendix B.
Table 1 Existing Traffic
Peak Hour Level of Service Analysis
Intersection Approach/Movement A.M. Peak Hour P.M. Peak Hour
LOS1 Delay2 v/c1 Q3 LOS1 Delay2 v/c1 Q3
Proudfoot Trail/ Dundas Street West Signalized
EB Thru E 57 1.04 #347 C 25 0.65 121 Right B 11 0.04 8 B 16 0.03 6
WB Left E 55 0.41 17 B 18 0.66 m73 Thru A 9 0.39 49 B 12 0.81 226
NB Left D 38 0.14 20 D 53 0.44 34
Right E 62 0.84 #109 D 49 0.10 19 Overall Intersection D 45 0.96 - B 18 0.79 -
Fourth Line/ Dundas Street West Signalized
EB Thru B 11 0.90 m107 A 1 0.46 5 Right A 2 0.01 m<1 A 0 0.01 m0
WB Left C 22 0.15 1 A 2 0.05 1 Thru A 2 0.33 28 A 10 0.89 262
NB Left E 58 0.21 11 E 58 0.21 11
Right E 55 0.01 7 E 55 0.01 0 Overall Intersection A 9 0.86 - A 8 0.90 -
1 v/c equal to or greater than 0.85 and LOS E/F is highlighted (if any); 2 Delay in seconds; 3 95th percentile queue in metres # 95th percentile volume exceeds capacity, queue may be longer. Queue shown is maximum after two cycles. m Volume for 95th percentile queue is metered by upstream signal.
The overall intersection operations at both intersections are shown to be at generally acceptable levels of service with the existing signal timings; however, there are some movements with volume to capacity ratios higher than the Region’s desired levels. In the a.m. peak hour, at the intersections of Dundas Street West at Proudfoot Trail and Fourth Line, the eastbound through movements are shown to operate at or approaching capacity. In the p.m. peak hour, the westbound through movement at Dundas Street West/Fourth Line is approaching capacity. While the HOV lanes have been excluded from the analysis, it can be reasonably assumed that they would operate at a much higher level of service than the general purpose through lanes. With the assumed 15% diversion of approach traffic to the HOV lanes, they would carry approximately 35% of the per lane volume in the general purpose lanes.
Since, under existing conditions, these intersections can be considered to be “built out” there are no mitigation measures except to optimize the existing signal timings. However, given the volume to capacity ratios for the critical movements as shown above, it would be expected that only modest improvements in the measures of effectiveness could be realized with signal timing adjustments.

GRAYDON BANNING DEVELOPMENT, TRANSPORTATION IMPACT STUDY
Future conditions August 2015
cm \\cd1215-f01\work_group\01650\active\160622238 - mattamy graydon banning\18_reports\rpt_gb_20150805.docx 7
4.0 FUTURE CONDITIONS
4.1 BACKGROUND TRAFFIC
The same growth rates from the Dundas Street ESR as previously referenced (3% per annum and 2% per annum for east-west and north-south traffic, respectively) were used to estimate the future 2020 and 2025 background traffic volumes for the subject Dundas Street West intersections. Traffic forecasts for the future William Halton Parkway were developed from the 2031 EMME model p.m. peak period forecasts provided by the Region. The 2031 model forecasts were reduced to reflect 2020 and 2025 horizon year conditions by applying a negative growth factor of 3% per annum. Forecasts for the a.m. peak hour were developed by reversing the eastbound and westbound directional flows, and reducing each by 86% to reflect the relationship between the a.m. and p.m. peak hour traffic volumes evident in the 2012 Dundas Street West counts.
Site traffic from other developments in the area, which are approved but not yet constructed, were also added to the background traffic volumes. These developments comprise the North Oakville ErinOakKids (EOK) children treatment centre (northwest quadrant of Third Line Extension/William Halton Parkway) and the New Oakville Hospital (northwest quadrant of Third Line/Dundas Street West). The traffic generated by these sites was obtained from transportation impact studies completed for these developments. Site traffic volumes for EOK and the New Oakville Hospital are shown in Figure 7 and Figure 8, respectively. For reference, excerpts from the transportation impact study reports for these developments are provided in Appendix C.
The 2020 and 2025 future background traffic volumes, which combine general growth as well as the new developments cited above, are shown in Figure 9 and Figure 10, respectively.
4.2 SITE TRIP GENERATION
The vehicular traffic that would be generated by the subject development site during the peak hours was estimated using information from the manual, “Trip Generation, 9th Edition”, which is published by the Institute of Transportation Engineers (ITE). The resultant peak hour site trip generation for the proposed development is shown in Table 2. To reflect a conservative approach to forecasting site traffic, no reductions have been made to account for an anticipated higher non-auto modal split in the future.

0 0 0 0 0 0 0 0
13 6 13 6 13 6 13 6 13 6 13 6
William Halton Parkway
17 4 17 4 17 4 17 4 17 4 17 4
0 0 0 0 0 0 0 0
0 0 0 0 0 0 0 0
44 21 44 21 44 21 44 21 44 21 44 21
Dundas Street
57 12 57 12 57 12 57 12 57 12 57 12
0 0 0 0 0 0 0 0
Proudfoot Trail Fourth Line
AM Peak Hour 123 Figure 7PM Peak Hour 123 EOK Traffic Impact Study Volumes
N

0 0 0 0 0 0 0 0
106 48 106 48 106 48 106 48 106 48 106 48
William Halton Parkway
100 50 100 50 100 50 100 50 100 50 100 50
0 0 0 0 0 0 0 0
0 0 0 0 0 0 0 0
219 99 198 90 198 90 198 90 198 90 198 90
Dundas Street
213 107 193 97 21 193 97 193 97 193 97 193 97
20 10 9
20 0 10 21 0 0 9 0
Proudfoot Trail Fourth Line
AM Peak Hour 123 Figure 8PM Peak Hour 123 New Oakville Hospital Traffic Impact Study Volumes
N

857 1,127 857 1,127
William Halton Parkway
975 977 975 977
1,449 3,239 1,372 3,137 1,438 3,593 1,438 3,593 1,423 3,578 1,438 3,593 66 456 15 15
Dundas Street Dundas Street
1,770 2,969 1,699 2,905 77 426 1,882 3,331 1,882 3,331 1,867 3,316 15 15 1,882 3,331
70 64 102 183 15 15 15 15
526 30 130 504 30 30 284 30
Proudfoot Trail Fourth Line
AM Peak Hour 123 Figure 9PM Peak Hour 123 Future Background Conditions 2020
N

979 1,303 979 1,303
William Halton Parkway
1,117 1,129 1,117 1,129
1,632 3,736 1,552 3,619 1,628 4,148 1,628 4,148 1,613 4,133 1,628 4,148 76 528 15 15
Dundas Street Dundas Street
2,008 3,126 1,930 3,059 80 450 2,142 3,509 2,142 3,509 2,127 3,494 15 15 2,142 3,509
78 67 116 212 15 15 15 15
607 30 143 530 30 30 328 30
Proudfoot Trail Fourth Line
AM Peak Hour 123 Figure 10PM Peak Hour 123 Future Background Conditions 2025
N

GRAYDON BANNING DEVELOPMENT, TRANSPORTATION IMPACT STUDY
Future conditions August 2015
cm \\cd1215-f01\work_group\01650\active\160622238 - mattamy graydon banning\18_reports\rpt_gb_20150805.docx 8
Table 2 Site Trip Generation
Land Use Units AM Peak Hour PM Peak Hour In Out Total In Out Total
Single Family Residential (ITE LUC 210)
247 46 137 183 149 88 237
Townhouse/Condominium (ITE LUC 230)
186 14 70 85 67 33 100
Apartment (ITE LUC 220)
548 54 218 272 207 112 319
Gasoline/Service Station, 8 Fueling Positions (ITE LUC 944)
8 49 48 97 55 56 111
Pass-by Reduction for Gas/Service Station (50%)
- -25 -24 -49 -28 -28 -56
Total 981 139 449 588 451 260 711
The site trip generation for Phase 1 and Phase 2 of the proposed development is provided for reference in Appendix D.
4.3 TRIP DISTRIBUTION
The trip distribution by Study Area approach is shown in Table 3. The distribution was based on Transportation Tomorrow Survey (TTS) data.
Table 3 Trip Distribution by Study Area Approach
Trips To/From % of Trips North 25% South 10% East 60% West 5%
TOTAL 100%
4.4 TRIP ASSIGNMENT
The site traffic was logically routed to the site access intersections and throughout the Study Area road network. The site traffic volumes are shown in Figure 11. The gas station pass-by traffic is shown in Figure 12. The site trip assignments for Phase 1 and Phase 2 are also provided for reference in Appendix D.

32 86 55 16 161 42 58 158
12 11 9 4 16 73 0 13 6 24 98 55 21 19 15 71 38 157 109 158 109 137 0 24 10 30 22 75
82 55 6 21William Halton Parkway
22 6 134 36 99 28 70 19 6 6 33 164 67 164 67 19 28 11 0 22 44 74
7 3 5 20 85 11 3 6 0 12
73 32 104 45 9 33 110 18
161 277 88 279
50 26 85 46 148 84 50 84 46 147 0 0 46 148 46 148 46 148 46 148
0 0 0 0Dundas Street
86 28 86 28 0 0 0 14 0 85 147 85 147 85 147 0 0 85 147
0 0 0 45 0 0 0 0 0
26 0 46 14 0 0 45 0
Proudfoot Trail In OutTota In Out Total Fourth Line
1,2,3,4 981 139 449 588 451 260 711
AM Peak Hour 123 Figure 11PM Peak Hour 123 Graydon Banning Net New Site Traffic
Zone Size/UnitAM PM
N

0 0 0 0 0 0 0 0
0 0 0 0 0 0 0 0
William Halton Parkway
0 0 0 0 0 0 0 0
0 0 0 0 0 0 0 0
28 24 24 28
28 24 28 0 0 24 -24 -28 0 0 0 0 0 0
Dundas Street
0 0 0 0 0 0 0 0
0 0 0 0 0 0 0 0
Proudfoot Trail Fourth Line
AM Peak Hour 123 Figure 12PM Peak Hour 123 Gas Station Pass-By Traffic
N

GRAYDON BANNING DEVELOPMENT, TRANSPORTATION IMPACT STUDY
Future conditions August 2015
cm \\cd1215-f01\work_group\01650\active\160622238 - mattamy graydon banning\18_reports\rpt_gb_20150805.docx 9
4.5 TOTAL TRAFFIC
The background traffic volumes were combined with the site traffic volumes to determine the weekday a.m. and p.m. peak hour total traffic forecasts. The future total traffic volumes for the 2020 and 2025 horizon years are shown in Figure 13 and Figure 14, respectively.
It is noted that the resultant Dundas Street West forecasts for 2020 are similar in order-of-magnitude to the 2021 traffic forecasts contained in the Dundas Street ESR.

874 1138 868 1,133 874 1147 874 1147 863 1,141 869 1162 6 14 6 21
William Halton Parkway
993 983 986 980 6 13 996 993 996 993 985 990 11 22 997 1012
7 3 5 10 11 3 6 12
21 32 9 19 9 33 15 18
137 205 86 211
70 14 53 54 117 1519 3281 94 24 87 1348 3,109 1468 3682 1468 3682 1453 3,667 1468 3682
66 456 15 15Dundas Street
71 24 1841 2993 1,699 2905 77 8 426 1935 3418 1935 3418 1,920 3403 15 15 1935 3418
70 64 102 23 183 15 15 15 15
540 30 154 512 30 30 307 30
Proudfoot Trail Fourth Line
AM Peak Hour 123 Figure 13PM Peak Hour 123 Total Future Traffic 2020
N

32 86 55 16 161 42 58 158
12 11 9 4 16 73 0 13 6 24 1077 1358 21 19 15 1050 1,341 1136 1412 1137 1412 137 0 24 989 1,333 1001 1378
82 55 6 21William Halton Parkway
22 6 134 36 1216 1157 1,187 1148 6 6 33 1281 1196 1281 1196 1,136 1157 11 0 22 1161 1203
7 3 5 20 85 11 3 6 0 12
73 32 104 45 9 33 110 18
189 301 112 307
78 26 85 70 176 1716 3786 108 46 147 1528 3,591 1674 4296 1674 4296 1659 4,281 1674 4296
76 528 15 15Dundas Street
86 28 2094 3154 1,930 3059 80 14 450 2227 3656 2227 3656 2,212 3641 15 15 2227 3656
78 67 116 45 212 15 15 15 15
633 30 189 544 30 30 373 30
Proudfoot Trail Fourth Line
AM Peak Hour 123 Figure 14PM Peak Hour 123 Total Future Traffic 2025
N

GRAYDON BANNING DEVELOPMENT, TRANSPORTATION IMPACT STUDY
Traffic Impact Assessment August 2015
cm \\cd1215-f01\work_group\01650\active\160622238 - mattamy graydon banning\18_reports\rpt_gb_20150805.docx 10
5.0 TRAFFIC IMPACT ASSESSMENT
5.1 FUTURE BACKGROUND TRAFFIC OPERATIONS
To assess the operating conditions for the future weekday a.m. and p.m. peak hour background traffic forecasts, a level of service analysis was undertaken using the same parameters as in the analysis of existing conditions with the exception of optimizing signal timing.
The results of the analysis for the 2020 and 2025 background traffic conditions are presented in Table 4 and Table 5, respectively. The Synchro analysis output is provided for reference in Appendix E.
Table 4 2020 Future Background
Peak Hour Level of Service Analysis
Intersection Approach/Movement A.M. Peak Hour P.M. Peak Hour
LOS1 Delay2 v/c1 Q3 LOS1 Delay2 v/c1 Q3
Proudfoot Trail/ Dundas Street West Signalized
EB Thru F 105 1.17 #420 C 32 0.85 191 Right A 9 0.06 8 B 16 0.06 10
WB Left E 62 0.53 19 C 33 0.91 m89 Thru A 9 0.53 58 B 17 0.98 m#244
NB Left D 42 0.23 30 D 54 0.49 40
Right F 172 1.22 #171 D 48 0.11 20 Overall Intersection F 82 1.16 - C 25 0.95 -
Fourth Line/ Dundas Street West Signalized
EB Thru D 44 1.07 m#103 A 2 0.61 7 Right A 3 0.01 m0 A 0 0.01 m0
WB Left D 41 0.15 1 A 4 0.07 1 Thru A 3 0.46 46 D 44 1.06 #492
NB Left E 58 0.21 11 E 58 0.21 11
Right E 55 0.01 7 E 55 0.01 7 Overall Intersection C 32 1.02 - C 29 1.06 -
1 v/c equal to or greater than 0.85 and LOS E/F is highlighted (if any); 2 Delay in seconds; 3 95th percentile queue in metres # 95th percentile volume exceeds capacity, queue may be longer. Queue shown is maximum after two cycles. m Volume for 95th percentile queue is metered by upstream signal.
In the a.m. peak hour, the eastbound through movements at the Dundas Street West intersections with Proudfoot Trail and Fourth Line would have traffic demands exceeding theoretical capacity. Similarly, the northbound right turn movement at Dundas Street West/Proudfoot Trail would exceed capacity. In the p.m. peak hour, the westbound through movements at the Dundas Street West intersections with Proudfoot Trail and Fourth Line would have traffic demands approaching and exceeding theoretical capacity, respectively.

GRAYDON BANNING DEVELOPMENT, TRANSPORTATION IMPACT STUDY
Traffic Impact Assessment August 2015
cm \\cd1215-f01\work_group\01650\active\160622238 - mattamy graydon banning\18_reports\rpt_gb_20150805.docx 11
Table 5 2025 Future Background
Peak Hour Level of Service Analysis
Intersection Approach/Movement A.M. Peak Hour P.M. Peak Hour
LOS1 Delay2 v/c1 Q3 LOS1 Delay2 v/c1 Q3
Proudfoot Trail/ Dundas Street West Signalized
EB Thru F 140 1.25 #458 D 54 1.00 #259 Right A 9 0.06 8 B 17 0.07 12
WB Left E 60 0.61 23 D 46 1.01 m88 Thru A 10 0.61 67 E 78 1.14 m#245
NB Left D 41 0.23 31 D 54 0.53 44
Right F 181 1.24 #182 D 48 0.13 21 Overall Intersection F 101 1.23 - E 66 1.10 -
Fourth Line/ Dundas Street West Signalized
EB Thru E 71 1.13 m#107 A 4 0.69 m13 Right A 3 0.01 m<1 A 0 0.01 m0
WB Left D 41 0.15 1 A 6 0.10 1 Thru A 3 0.52 57 F 113 1.22 #618
NB Left E 58 0.21 11 E 58 0.21 11
Right E 55 0.01 7 E 55 0.01 7 Overall Intersection D 49 1.08 - E 75 1.22 -
1 v/c equal to or greater than 0.85 and LOS E/F is highlighted (if any); 2 Delay in seconds; 3 95th percentile queue in metres # 95th percentile volume exceeds capacity, queue may be longer. Queue shown is maximum after two cycles. m Volume for 95th percentile queue is metered by upstream signal.
The results of the analysis for 2025 background traffic conditions are similar to those for 2020, but generally worse in terms of lower levels of service, higher volume to capacity ratios, and several movements in both the a.m. and p.m. peak hours reaching or exceeding theoretical capacity. The continuing deterioration in traffic operations is due to the effect of an aggressive growth rate (3% per annum compounded) and the limited availability and relatively low utilization of the HOV lane for passenger car traffic. For both 2020 and 2025 traffic conditions, the operation of the HOV lanes would be expected to operate at a much higher level of service than the general purpose through lanes.
Similar to existing conditions, these intersections can be considered to be “built out” for the future background traffic scenario. The type of mitigation that may assist in maintaining peak hour traffic conditions within the theoretical intersection roadway capacities would be related to traffic diverting from the Dundas Street West corridor to alternative east-west corridors (including William Halton Parkway) and to transportation demand management measures such as higher transit modal splits and higher vehicle occupancies (with the related higher utilization of the HOV lanes).

GRAYDON BANNING DEVELOPMENT, TRANSPORTATION IMPACT STUDY
Traffic Impact Assessment August 2015
cm \\cd1215-f01\work_group\01650\active\160622238 - mattamy graydon banning\18_reports\rpt_gb_20150805.docx 12
5.2 TOTAL FUTURE TRAFFIC OPERATIONS
The results of the analysis for the 2020 total future traffic conditions are shown in Table 6. The Synchro analysis output is provided for reference in Appendix F. For this horizon year, Phase 1 of the subject development adds additional traffic to the Study Area road network, which would now include the 4 lane William Halton Parkway. It has been assumed for the initial analysis that the new intersections along William Halton Parkway would operate with the minor street approaches under stop control with single lane approaches.
Table 6 2020 Total Future
Peak Hour Level of Service Analysis
Intersection Approach/Movement A.M. Peak Hour P.M. Peak Hour
LOS1 Delay2 v/c1 Q3 LOS1 Delay2 v/c1 Q3
Proudfoot Trail/ Dundas Street West Signalized
EB Left B 11 0.10 5 C 31 0.54 15
Thru F 144 1.25 #439 C 32 0.86 189 Right B 11 0.05 5 B 16 0.05 3
WB Left D 49 0.53 19 D 35 0.94 m86 Thru B 15 0.61 65 E 61 1.09 m#365 Right A 9 0.04 3 A 9 0.09 m5
NB Left D 39 0.27 29 E 58 0.61 41
Thru/Right F 97 1.02 #158 D 48 0.22 27
SB Left F 319 1.45 #62 E 67 0.66 #29
Thru/Right D 36 0.12 20 D 47 0.11 17 Overall Intersection F 100 1.27 - D 48 1.03 -
Fourth Line/ Dundas Street West Signalized
EB Thru E 58 1.10 m#102 A 2 0.63 10 Right A 2 0.01 m<1 A 0 0.01 m0
WB Left D 41 0.15 1 A 4 0.08 1 Thru A 3 0.47 47 D 54 1.09 #513
NB Left E 58 0.21 11 E 58 0.21 11
Right E 55 0.01 7 E 55 0.01 7 Overall Intersection D 41 1.05 - D 36 1.09 -
Proudfoot Trail/ William Halton Parkway Unsignalized
EB Thru/Right Unopposed Movement WB Left/Thru A <1 0.01 <1 A 1 0.02 1
NB Left/Right C 23 0.10 2 D 26 0.09 2

GRAYDON BANNING DEVELOPMENT, TRANSPORTATION IMPACT STUDY
Traffic Impact Assessment August 2015
cm \\cd1215-f01\work_group\01650\active\160622238 - mattamy graydon banning\18_reports\rpt_gb_20150805.docx 13
Table 6 2020 Total Future
Peak Hour Level of Service Analysis
Intersection Approach/Movement A.M. Peak Hour P.M. Peak Hour
LOS1 Delay2 v/c1 Q3 LOS1 Delay2 v/c1 Q3 New Access/ William Halton Parkway Unsignalized
EB Thru/Right Unopposed Movement WB Left/Thru A <1 0.01 <1 A 1 0.04 1
NB Left/Right D 25 0.17 5 D 30 0.12 3
1 v/c equal to or greater than 0.85 and LOS E/F is highlighted (if any); 2 Delay in seconds; 3 95th percentile queue in metres # 95th percentile volume exceeds capacity, queue may be longer. Queue shown is maximum after two cycles. m Volume for 95th percentile queue is metered by upstream signal.
The results of the analysis for 2020 total traffic conditions are similar to those for 2020 future background traffic with several traffic movements at the Dundas Street West intersections reaching or exceeding theoretical capacity during both the a.m. and p.m. peak hours. Both intersections are shown to have overall volume to capacity ratios (sum of critical movements) exceeding theoretical capacity. The combination of introducing a fourth leg (north leg) to the Dundas Street West/Proudfoot Trail intersection and additional traffic with Phase 1 of the subject development results in increases to the critical volume to capacity ratios.
The new, unsignalized intersections on William Halton Parkway would have very low turning movements (less than 25 per hour on any movement) and would operate as T-intersections since the Phase 1 development area is on the south side of William Halton Parkway. Consequently, the turning movements at these intersections would operate at a very good level of service and well within capacity.
As previously noted in the commentary on future background traffic conditions, the mitigation measures for the Study Area intersections along Dundas Street West would be a combination of traffic diverting from this corridor as well as traffic demand management (primarily increasing non-auto modal splits and higher vehicle occupancies).
The results of the analysis for the 2025 total traffic conditions are shown in Table 7. The Synchro analysis output is also provided for reference in Appendix F. For this horizon year, Phase 2 of the development adds additional traffic to the Study Area road network and also requires extending Proudfoot Trail and the “New Access” public roadway north of William Halton Parkway. As in the analysis of 2020 total traffic, it was initially assumed that the new intersections on William Halton Parkway would be unsignalized and would have single lane approaches. However, with higher traffic volumes on William Halton Parkway, and the new intersections having four leg configurations, they were also analyzed with signal control.

GRAYDON BANNING DEVELOPMENT, TRANSPORTATION IMPACT STUDY
Traffic Impact Assessment August 2015
cm \\cd1215-f01\work_group\01650\active\160622238 - mattamy graydon banning\18_reports\rpt_gb_20150805.docx 14
Table 7 2025 Total Future
Peak Hour Level of Service Analysis
Intersection Approach/Movement A.M. Peak Hour P.M. Peak Hour
LOS1 Delay2 v/c1 Q3 LOS1 Delay2 v/c1 Q3
Proudfoot Trail/ Dundas Street West Signalized
EB Left B 17 0.19 6 C 34 0.61 #24 Thru F 252 1.49 #502 D 55 1.01 #259 Right B 14 0.05 7 B 17 0.05 5
WB Left D 47 0.61 23 F 89 1.12 m62 Thru C 23 0.78 164 F 163 1.31 m205 Right B 13 0.04 6 B 11 0.14 m4
NB Left C 32 0.23 28 D 55 0.59 46
Thru/Right D 54 0.85 #148 D 50 0.48 49
SB Left F 341 1.57 #92 F 230 1.23 #58
Thru/Right C 31 0.17 26 D 45 0.17 23 Overall Intersection F 156 1.48 - F 112 1.30 -
Fourth Line / Dundas Street West Signalized
EB Thru F 99 1.18 m81 A 8 0.85 m67 Right A 1 0.01 m<1 A 1 0.01 m<1
WB Left D 41 0.15 1 B 15 0.15 1 Thru A 3 0.53 60 F 232 1.49 #821
NB Left E 58 0.21 11 E 58 0.21 11
Right E 55 0.01 7 E 55 0.01 7 Overall Intersection E 69 1.12 - F 154 1.49 -
Proudfoot Trail/ William Halton Parkway Unsignalized
EB Left/Thru/Right A <1 0.01 <1 A 2 0.05 1 WB Left/Thru/Right A 4 0.16 4 A 3 0.11 3 NB Left/Thru/Right F Err Err Err F Err 3.89 Err
SB Left/Thru/Right F 654.3 1.83 51 F Err Err Err
Mitigation Measures: Traffic Control Signals and Left Turn Lanes on all Approaches
Proudfoot Trail / William Halton Parkway Signalized
EB Left A 4 0.02 2 A 4 0.03 2
Thru/Right A 6 0.46 61 A 6 0.38 46
WB Left A 5 0.33 7 A 4 0.24 7
Thru/Right A 3 0.42 17 A 3 0.51 37
NB Left D 41 0.03 m5 D 42 0.03 m5
Thru/Right D 39 0.05 m5 D 39 0.05 m8
SB Left D 42 0.07 10 D 42 0.07 10
Thru/Right D 42 0.08 15 D 42 0.08 15 Overall Intersection A 6 0.39 - A 5 0.43 -

GRAYDON BANNING DEVELOPMENT, TRANSPORTATION IMPACT STUDY
Traffic Impact Assessment August 2015
cm \\cd1215-f01\work_group\01650\active\160622238 - mattamy graydon banning\18_reports\rpt_gb_20150805.docx 15
Table 7 2025 Total Future
Peak Hour Level of Service Analysis
Intersection Approach/Movement A.M. Peak Hour P.M. Peak Hour
LOS1 Delay2 v/c1 Q3 LOS1 Delay2 v/c1 Q3
New Access / William Halton Parkway Unsignalized
EB Left/Thru/Right A 2 0.06 2 A 10 0.32 10 WB Left/Thru/Right A <1 0.01 <1 A 1 0.04 1 NB Left/Thru/Right F 135 0.61 19 F 260 0.67 17 SB Left/Thru/Right F 94 0.91 54 F 369 1.43 60
Mitigation Measures: Traffic Control Signals and Left Turn Lanes on all Approaches
New Access / William Halton Parkway Signalized
EB Left A 7 0.13 m6 B 16 0.39 6
Thru/Right A 9 0.50 74 B 15 0.55 41
WB Left A 6 0.03 2 B 14 0.04 3
Thru/Right A 8 0.43 62 C 23 0.71 111
NB Left D 37 0.05 8 C 22 0.02 6
Thru/Right D 37 0.02 0 C 21 0.02 0
SB Left D 38 0.08 13 C 22 0.05 11
Thru/Right D 38 0.10 17 C 23 0.15 27 Overall Intersection B 11 0.40 - B 20 0.46 -
1 v/c equal to or greater than 0.85 and LOS E/F is highlighted (if any); 2 Delay in seconds; 3 95th percentile queue in metres # 95th percentile volume exceeds capacity, queue may be longer. Queue shown is maximum after two cycles. m Volume for 95th percentile queue is metered by upstream signal.
The results of the analysis for 2025 total traffic conditions are similar to those for 2025 future background traffic and to those for 2020 total traffic with the Dundas Street West intersections exceeding theoretical capacity during both the a.m. and p.m. peak hours. As noted previously, the subject intersections would be considered to be “built out” in terms of capacity improvements. It may be expected that the combination of increasing east-west road capacity with the addition of William Halton Parkway, and increasing non-auto modal splits and vehicle occupancies as noted in the Dundas Street ESR, will contribute to better traffic operations along the Dundas Street corridor than demonstrated in this study. It is noted that this Study’s forecasts did not include any reduction in the Dundas Street West growth rate (i.e. maintained the growth rate stated in the Dundas Street ESR), or any diversion of Dundas Street West traffic to the William Halton Parkway, or a higher utilization of the HOV lanes by passenger cars (i.e. the 20% HOV share identified by Regional transportation planning staff as a 2031 condition).
The initial analysis of the William Halton Parkway intersections with Proudfoot Trail and the New Access operating under minor street stop control showed that the turning movements from the minor streets would have excessive delays and traffic demands exceeding theoretical capacity. These deficiencies would be addressed by signalizing these intersections and incorporating auxiliary left turn lanes on all approaches. The spacing of these intersections at approximately 400m is appropriate for traffic signal control at both.

GRAYDON BANNING DEVELOPMENT, TRANSPORTATION IMPACT STUDY
Conclusions August 2015
cm \\cd1215-f01\work_group\01650\active\160622238 - mattamy graydon banning\18_reports\rpt_gb_20150805.docx 16
6.0 CONCLUSIONS
The conclusions of the Transportation Impact Study are as follows:
a) Under base year 2015 traffic conditions, and with the Dundas Street West road improvements that are currently under construction (widening from 4 to 6 lanes including HOV lanes), the Dundas Street West intersections with Proudfoot Trail and Fourth Line approach capacity during the weekday a.m. and p.m. peak hours. This finding is also based on 15% of the eastbound and westbound traffic utilizing the HOV lanes.
b) The analysis of the 2020 and 2025 horizon year background traffic forecasts (without the proposed development) indicates that the peak hour traffic demands at the subject Dundas Street West intersections would be at or above capacity.
c) The analysis of the 2020 (includes Phase 1 of the proposed development, south of William Halton Parkway) and 2025 (adds Phase 2 of the proposed development, north of William Halton Parkway) horizon year a.m. and p.m. peak hour total traffic forecasts also indicates that the traffic demands at the subject Dundas Street West intersections would be at or above capacity. However, the William Halton Parkway intersections serving the subject development (Proudfoot Trail and New Access road) would operate well within capacity as unsignalized intersections with only Phase 1 developed (2020 horizon) and as signalized intersections with auxiliary left turn lanes with Phase 2 developed (2025).
d) With the Study Area section of Dundas Street West being fully built out in terms of capacity with the improvements currently being constructed, and with base year 2015 traffic demands representing peak hour capacity conditions, the potential additional travel demand in this corridor would have to be accommodated by other east-west roadways (including William Halton Parkway), increased use of transit and active transportation modes, and higher passenger car vehicle occupancies.
The recommendations of the Transportation Impact Study are as follows:
a) For the 2020 horizon year with full build out of Phase 1 of the proposed development, extend Proudfoot Trail to William Halton Parkway (T-intersection), construct the New Access roadway including an intersection with William Halton Parkway (T-intersection), and optimize signal timing at the Dundas Street West intersections with Proudfoot Trail and Fourth Line.
b) With the introduction of Phase 2 of the proposed development, complete the construction of the William Halton Parkway intersections with Proudfoot Trail and the New Access road as four leg intersections. The latter intersections should be improved with signalization and auxiliary left turn lanes (all approaches) prior to or by 2025 depending on the pace of development.

APPENDIX A – TRAFFIC DATA AND SIGNAL TIMINGS


Dundas St @ Fourth Line
Morning Peak Diagram Specified Period
From:
To:
7:00:00
9:00:00
One Hour Peak
From:
To:
7:30:00
8:30:00
Municipality:
Site #:
Intersection:
TFR File #:
Count date:
Halton Region
0000002110
Dundas St & Fourth Line
2
3-Nov-2014
Weather conditions:Partly Cloudy/Dry
Person(s) who counted:Colette
Aaron
** Signalized Intersection ** Major Road: Dundas St runs W/E
Heavys Trucks Cars Totals
57 37 848 942
Heavys Trucks Cars Totals
54 37 2339 2430
0 1 12 13
54 38 2351
Peds Cross:
West Peds:
West Entering:
West Leg Total:
0
2443
3385
Dundas St
W
N
E
S
Dundas St
Fourth Line
East Leg Total:
East Entering:
East Peds:
Peds Cross:
3382
946
0
Cars Trucks Heavys Totals
843 37 57 937
9 0 0 9
852 37 57
Cars Trucks Heavys Totals
2344 38 54 2436
Cars
Trucks
Heavys
Totals
21
1
0
22
Cars
Trucks
Heavys
Totals
5
0
0
5
5
1
0
6
10
1
0
Peds Cross:
South Peds:
South Entering:
South Leg Total:
3
11
33
Comments

Dundas St @ Fourth Line
Mid-day Peak Diagram Specified Period
From:
To:
11:00:00
14:00:00
One Hour Peak
From:
To:
11:45:00
12:45:00
Municipality:
Site #:
Intersection:
TFR File #:
Count date:
Halton Region
0000002110
Dundas St & Fourth Line
2
3-Nov-2014
Weather conditions:Partly Cloudy/Dry
Person(s) who counted:Colette
Aaron
** Signalized Intersection ** Major Road: Dundas St runs W/E
Heavys Trucks Cars Totals
67 32 824 923
Heavys Trucks Cars Totals
51 39 692 782
1 1 7 9
52 40 699
Peds Cross:
West Peds:
West Entering:
West Leg Total:
0
791
1714
Dundas St
W
N
E
S
Dundas St
Fourth Line
East Leg Total:
East Entering:
East Peds:
Peds Cross:
1716
925
2
Cars Trucks Heavys Totals
819 32 66 917
8 0 0 8
827 32 66
Cars Trucks Heavys Totals
700 40 51 791
Cars
Trucks
Heavys
Totals
15
1
1
17
Cars
Trucks
Heavys
Totals
5
0
1
6
8
1
0
9
13
1
1
Peds Cross:
South Peds:
South Entering:
South Leg Total:
2
15
32
Comments

Dundas St @ Fourth Line
Afternoon Peak Diagram Specified Period
From:
To:
15:00:00
18:00:00
One Hour Peak
From:
To:
16:45:00
17:45:00
Municipality:
Site #:
Intersection:
TFR File #:
Count date:
Halton Region
0000002110
Dundas St & Fourth Line
2
3-Nov-2014
Weather conditions:Partly Cloudy/Dry
Person(s) who counted:Colette
Aaron
** Signalized Intersection ** Major Road: Dundas St runs W/E
Heavys Trucks Cars Totals
26 26 2772 2824
Heavys Trucks Cars Totals
38 23 1253 1314
0 0 7 7
38 23 1260
Peds Cross:
West Peds:
West Entering:
West Leg Total:
0
1321
4145
Dundas St
W
N
E
S
Dundas St
Fourth Line
East Leg Total:
East Entering:
East Peds:
Peds Cross:
4140
2819
0
Cars Trucks Heavys Totals
2759 26 26 2811
8 0 0 8
2767 26 26
Cars Trucks Heavys Totals
1260 23 38 1321
Cars
Trucks
Heavys
Totals
15
0
0
15
Cars
Trucks
Heavys
Totals
13
0
0
13
7
0
0
7
20
0
0
Peds Cross:
South Peds:
South Entering:
South Leg Total:
3
20
35
Comments

Dundas St @ Fourth Line
Total Count Diagram
Municipality:
Site #:
Intersection:
TFR File #:
Count date:
Halton Region
0000002110
Dundas St & Fourth Line
2
3-Nov-2014
Weather conditions:Partly Cloudy/Dry
Person(s) who counted:Colette
Aaron
** Signalized Intersection ** Major Road: Dundas St runs W/E
Heavys Trucks Cars Totals
450 218 10696 11364
Heavys Trucks Cars Totals
403 244 9611 10258
2 2 62 66
405 246 9673
Peds Cross:
West Peds:
West Entering:
West Leg Total:
0
10324
21688
Dundas St
W
N
E
S
Dundas St
Fourth Line
East Leg Total:
East Entering:
East Peds:
Peds Cross:
21670
11358
9
Cars Trucks Heavys Totals
10640 217 448 11305
50 3 0 53
10690 220 448
Cars Trucks Heavys Totals
9663 246 403 10312
Cars
Trucks
Heavys
Totals
112
5
2
119
Cars
Trucks
Heavys
Totals
56
1
2
59
52
2
0
54
108
3
2
Peds Cross:
South Peds:
South Entering:
South Leg Total:
34
113
232
Comments

Dundas St @ Proudfoot Trail
Morning Peak Diagram Specified Period
From:
To:
7:00:00
9:00:00
One Hour Peak
From:
To:
8:00:00
9:00:00
Municipality:
Site #:
Intersection:
TFR File #:
Count date:
Halton Region
0000002109
Dundas St & Proudfoot Tr
4
29-Oct-2014
Weather conditions:Partly Cloudy/Dry
Person(s) who counted:Colette
Aaron
** Signalized Intersection ** Major Road: Dundas St runs W/E
Heavys Trucks Cars Totals
80 45 982 1107
Heavys Trucks Cars Totals
71 35 1923 2029
4 0 43 47
75 35 1966
Peds Cross:
West Peds:
West Entering:
West Leg Total:
0
2076
3183
Dundas St
W
N
E
S
Dundas St
Proudfoot Tr
East Leg Total:
East Entering:
East Peds:
Peds Cross:
3498
1172
1
Cars Trucks Heavys Totals
956 45 79 1080
90 2 0 92
1046 47 79
Cars Trucks Heavys Totals
2219 35 72 2326
Cars
Trucks
Heavys
Totals
133
2
4
139
Cars
Trucks
Heavys
Totals
26
0
1
27
296
0
1
297
322
0
2
Peds Cross:
South Peds:
South Entering:
South Leg Total:
1
324
463
Comments

Dundas St @ Proudfoot Trail
Mid-day Peak Diagram Specified Period
From:
To:
11:00:00
14:00:00
One Hour Peak
From:
To:
12:15:00
13:15:00
Municipality:
Site #:
Intersection:
TFR File #:
Count date:
Halton Region
0000002109
Dundas St & Proudfoot Tr
4
29-Oct-2014
Weather conditions:Partly Cloudy/Dry
Person(s) who counted:Colette
Aaron
** Signalized Intersection ** Major Road: Dundas St runs W/E
Heavys Trucks Cars Totals
48 40 733 821
Heavys Trucks Cars Totals
60 38 659 757
2 0 28 30
62 38 687
Peds Cross:
West Peds:
West Entering:
West Leg Total:
2
787
1608
Dundas St
W
N
E
S
Dundas St
Proudfoot Tr
East Leg Total:
East Entering:
East Peds:
Peds Cross:
1740
892
0
Cars Trucks Heavys Totals
708 40 47 795
96 1 0 97
804 41 47
Cars Trucks Heavys Totals
750 38 60 848
Cars
Trucks
Heavys
Totals
124
1
2
127
Cars
Trucks
Heavys
Totals
25
0
1
26
91
0
0
91
116
0
1
Peds Cross:
South Peds:
South Entering:
South Leg Total:
0
117
244
Comments

Dundas St @ Proudfoot Trail
Afternoon Peak Diagram Specified Period
From:
To:
15:00:00
18:00:00
One Hour Peak
From:
To:
17:00:00
18:00:00
Municipality:
Site #:
Intersection:
TFR File #:
Count date:
Halton Region
0000002109
Dundas St & Proudfoot Tr
4
29-Oct-2014
Weather conditions:Partly Cloudy/Dry
Person(s) who counted:Colette
Aaron
** Signalized Intersection ** Major Road: Dundas St runs W/E
Heavys Trucks Cars Totals
20 18 2160 2198
Heavys Trucks Cars Totals
30 22 1084 1136
3 0 51 54
33 22 1135
Peds Cross:
West Peds:
West Entering:
West Leg Total:
0
1190
3388
Dundas St
W
N
E
S
Dundas St
Proudfoot Tr
East Leg Total:
East Entering:
East Peds:
Peds Cross:
3737
2462
0
Cars Trucks Heavys Totals
2123 18 20 2161
301 0 0 301
2424 18 20
Cars Trucks Heavys Totals
1223 22 30 1275
Cars
Trucks
Heavys
Totals
352
0
3
355
Cars
Trucks
Heavys
Totals
37
0
0
37
139
0
0
139
176
0
0
Peds Cross:
South Peds:
South Entering:
South Leg Total:
2
176
531
Comments

Dundas St @ Proudfoot Trail
Total Count Diagram
Municipality:
Site #:
Intersection:
TFR File #:
Count date:
Halton Region
0000002109
Dundas St & Proudfoot Tr
4
29-Oct-2014
Weather conditions:Partly Cloudy/Dry
Person(s) who counted:Colette
Aaron
** Signalized Intersection ** Major Road: Dundas St runs W/E
Heavys Trucks Cars Totals
447 282 9206 9935
Heavys Trucks Cars Totals
421 221 8697 9339
22 3 294 319
443 224 8991
Peds Cross:
West Peds:
West Entering:
West Leg Total:
4
9658
19593
Dundas St
W
N
E
S
Dundas St
Proudfoot Tr
East Leg Total:
East Entering:
East Peds:
Peds Cross:
21405
10840
5
Cars Trucks Heavys Totals
8953 275 439 9667
1148 18 7 1173
10101 293 446
Cars Trucks Heavys Totals
9903 231 431 10565
Cars
Trucks
Heavys
Totals
1442
21
29
1492
Cars
Trucks
Heavys
Totals
253
7
8
268
1206
10
10
1226
1459
17
18
Peds Cross:
South Peds:
South Entering:
South Leg Total:
12
1494
2986
Comments


1
Crockford, Mark
From: Monaghan, Patrick <[email protected]>Sent: Friday, July 10, 2015 11:16 AMTo: Crockford, MarkCc: Martire, Steve; Spoleti, Antonino; Martire, SteveSubject: RE: Transportation Impact Study and Transit Facilities Plan
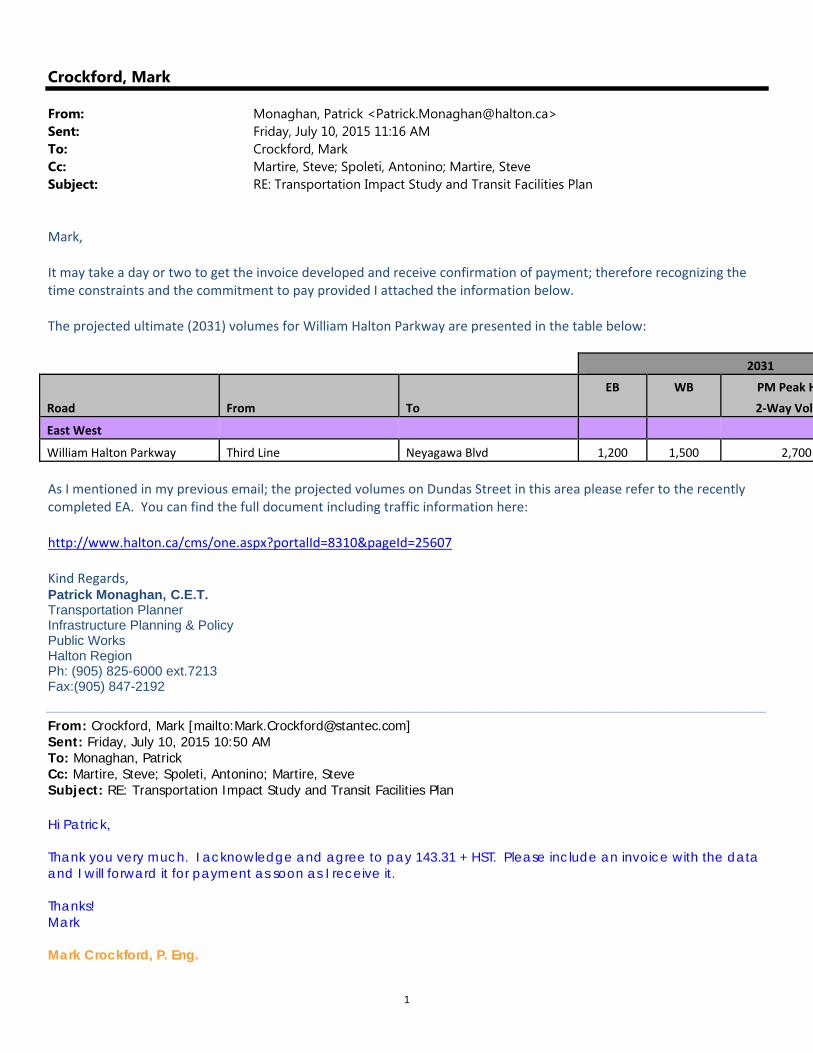
Mark, It may take a day or two to get the invoice developed and receive confirmation of payment; therefore recognizing the time constraints and the commitment to pay provided I attached the information below. The projected ultimate (2031) volumes for William Halton Parkway are presented in the table below:
2031
EB WB PM Peak H
Road From To 2‐Way Volu
East West
William Halton Parkway Third Line Neyagawa Blvd 1,200 1,500 2,700
As I mentioned in my previous email; the projected volumes on Dundas Street in this area please refer to the recently completed EA. You can find the full document including traffic information here: http://www.halton.ca/cms/one.aspx?portalId=8310&pageId=25607 Kind Regards, Patrick Monaghan, C.E.T. Transportation Planner Infrastructure Planning & Policy Public Works Halton Region Ph: (905) 825-6000 ext.7213 Fax:(905) 847-2192
From: Crockford, Mark [mailto:[email protected]] Sent: Friday, July 10, 2015 10:50 AM To: Monaghan, Patrick Cc: Martire, Steve; Spoleti, Antonino; Martire, Steve Subject: RE: Transportation Impact Study and Transit Facilities Plan Hi Patrick, Thank you very much. I acknowledge and agree to pay 143.31 + HST. Please include an invoice with the data and I will forward it for payment as soon as I receive it. Thanks! Mark Mark Crockford, P. Eng.

APPENDIX B – EXISTING CONDITIONS SYNCHRO WORKSHEETS

Lanes, Volumes, Timings 2015 AM Existing Conditions 1: Proudfoot Trail & Dundas Street Graydon Banning
Graydon Banning 7/28/2015 2015 AM Existing Conditions Synchro 9 ReportMC Page 1
Lane Group EBT EBR WBL WBT NBL NBRLane ConfigurationsTraffic Volume (vph) 2412 49 59 975 51 386Future Volume (vph) 2412 49 59 975 51 386Ideal Flow (vphpl) 1900 1900 1900 1900 1900 1900Storage Length (m) 70.0 120.0 0.0 0.0Storage Lanes 1 1 1 1Taper Length (m) 70.0 2.5Lane Util. Factor 0.95 1.00 1.00 0.95 1.00 1.00Ped Bike Factor 0.98 0.99Frt 0.850 0.850Flt Protected 0.950 0.950Satd. Flow (prot) 3444 1498 1789 3230 1755 1633Flt Permitted 0.054 0.950Satd. Flow (perm) 3444 1463 102 3230 1755 1610Right Turn on Red Yes YesSatd. Flow (RTOR) 31 124Link Speed (k/h) 60 60 50Link Distance (m) 373.6 424.7 186.0Travel Time (s) 22.4 25.5 13.4Confl. Peds. (#/hr) 1 1 1Peak Hour Factor 0.97 0.97 0.97 0.97 0.97 0.97Growth Factor 85% 100% 100% 85% 100% 100%Heavy Vehicles (%) 6% 9% 2% 13% 4% 0%Adj. Flow (vph) 2114 51 61 854 53 398Shared Lane Traffic (%)Lane Group Flow (vph) 2114 51 61 854 53 398Enter Blocked Intersection No No No No No NoLane Alignment Left Right Left Left Left RightMedian Width(m) 3.7 3.7 3.7Link Offset(m) 0.0 0.0 0.0Crosswalk Width(m) 1.6 1.6 1.6Two way Left Turn LaneHeadway Factor 0.99 0.99 0.99 0.99 0.99 0.99Turning Speed (k/h) 14 24 24 14Number of Detectors 2 1 1 2 1 1Detector Template Thru Right Left Thru Left RightLeading Detector (m) 30.5 6.1 6.1 30.5 6.1 6.1Trailing Detector (m) 0.0 0.0 0.0 0.0 0.0 0.0Detector 1 Position(m) 0.0 0.0 0.0 0.0 0.0 0.0Detector 1 Size(m) 1.8 6.1 6.1 1.8 6.1 6.1Detector 1 Type Cl+Ex Cl+Ex Cl+Ex Cl+Ex Cl+Ex Cl+ExDetector 1 ChannelDetector 1 Extend (s) 0.0 0.0 0.0 0.0 0.0 0.0Detector 1 Queue (s) 0.0 0.0 0.0 0.0 0.0 0.0Detector 1 Delay (s) 0.0 0.0 0.0 0.0 0.0 0.0Detector 2 Position(m) 28.7 28.7Detector 2 Size(m) 1.8 1.8Detector 2 Type Cl+Ex Cl+ExDetector 2 Channel

Lanes, Volumes, Timings 2015 AM Existing Conditions 1: Proudfoot Trail & Dundas Street Graydon Banning
Graydon Banning 7/28/2015 2015 AM Existing Conditions Synchro 9 ReportMC Page 2
Lane Group EBT EBR WBL WBT NBL NBRDetector 2 Extend (s) 0.0 0.0Turn Type NA Perm pm+pt NA Prot PermProtected Phases 2 1 6 8Permitted Phases 2 6 8Detector Phase 2 2 1 6 8 8Switch PhaseMinimum Initial (s) 5.0 5.0 5.0 5.0 5.0 5.0Minimum Split (s) 23.9 23.9 9.5 23.9 24.9 24.9Total Split (s) 70.8 70.8 12.0 82.8 37.2 37.2Total Split (%) 59.0% 59.0% 10.0% 69.0% 31.0% 31.0%Maximum Green (s) 64.9 64.9 8.0 76.9 30.3 30.3Yellow Time (s) 3.7 3.7 3.0 3.7 3.3 3.3All-Red Time (s) 2.2 2.2 1.0 2.2 3.6 3.6Lost Time Adjust (s) 0.0 0.0 0.0 0.0 0.0 0.0Total Lost Time (s) 5.9 5.9 4.0 5.9 6.9 6.9Lead/Lag Lag Lag LeadLead-Lag Optimize?Vehicle Extension (s) 5.5 5.5 3.0 5.5 5.0 5.0Recall Mode C-Max C-Max None C-Max None NoneWalk Time (s) 7.0 7.0 7.0 7.0 7.0Flash Dont Walk (s) 11.0 11.0 11.0 11.0 11.0Pedestrian Calls (#/hr) 0 0 0 0 0Act Effct Green (s) 71.5 71.5 82.3 80.4 26.8 26.8Actuated g/C Ratio 0.60 0.60 0.69 0.67 0.22 0.22v/c Ratio 1.03 0.06 0.37 0.39 0.14 0.87Control Delay 54.3 6.8 23.5 9.3 36.4 50.7Queue Delay 0.0 0.0 0.0 0.0 0.0 0.0Total Delay 54.3 6.8 23.5 9.3 36.4 50.7LOS D A C A D DApproach Delay 53.2 10.2 49.0Approach LOS D B DQueue Length 50th (m) ~298.0 2.0 4.5 40.5 9.8 62.8Queue Length 95th (m) #346.5 8.0 16.7 48.7 20.2 #109.2Internal Link Dist (m) 349.6 400.7 162.0Turn Bay Length (m) 70.0 120.0Base Capacity (vph) 2050 883 182 2164 443 499Starvation Cap Reductn 0 0 0 0 0 0Spillback Cap Reductn 0 0 0 0 0 0Storage Cap Reductn 0 0 0 0 0 0Reduced v/c Ratio 1.03 0.06 0.34 0.39 0.12 0.80
Intersection SummaryArea Type: OtherCycle Length: 120Actuated Cycle Length: 120Offset: 80.4 (67%), Referenced to phase 2:EBT and 6:WBTL, Start of GreenNatural Cycle: 130Control Type: Actuated-CoordinatedMaximum v/c Ratio: 1.03

Lanes, Volumes, Timings 2015 AM Existing Conditions 1: Proudfoot Trail & Dundas Street Graydon Banning
Graydon Banning 7/28/2015 2015 AM Existing Conditions Synchro 9 ReportMC Page 3
Intersection Signal Delay: 41.5 Intersection LOS: DIntersection Capacity Utilization 91.4% ICU Level of Service FAnalysis Period (min) 15~ Volume exceeds capacity, queue is theoretically infinite. Queue shown is maximum after two cycles.# 95th percentile volume exceeds capacity, queue may be longer. Queue shown is maximum after two cycles.
Splits and Phases: 1: Proudfoot Trail & Dundas Street
HCM Signalized Intersection Capacity Analysis 2015 AM Existing Conditions 1: Proudfoot Trail & Dundas Street Graydon Banning
Graydon Banning 7/28/2015 2015 AM Existing Conditions Synchro 9 ReportMC Page 4
Movement EBT EBR WBL WBT NBL NBRLane ConfigurationsTraffic Volume (vph) 2412 49 59 975 51 386Future Volume (vph) 2412 49 59 975 51 386Ideal Flow (vphpl) 1900 1900 1900 1900 1900 1900Total Lost time (s) 5.9 5.9 4.0 5.9 6.9 6.9Lane Util. Factor 0.95 1.00 1.00 0.95 1.00 1.00Frpb, ped/bikes 1.00 0.98 1.00 1.00 1.00 0.99Flpb, ped/bikes 1.00 1.00 1.00 1.00 1.00 1.00Frt 1.00 0.85 1.00 1.00 1.00 0.85Flt Protected 1.00 1.00 0.95 1.00 0.95 1.00Satd. Flow (prot) 3444 1463 1789 3230 1755 1610Flt Permitted 1.00 1.00 0.05 1.00 0.95 1.00Satd. Flow (perm) 3444 1463 101 3230 1755 1610Peak-hour factor, PHF 0.97 0.97 0.97 0.97 0.97 0.97Growth Factor (vph) 85% 100% 100% 85% 100% 100%Adj. Flow (vph) 2114 51 61 854 53 398RTOR Reduction (vph) 0 13 0 0 0 96Lane Group Flow (vph) 2114 38 61 854 53 302Confl. Peds. (#/hr) 1 1 1Heavy Vehicles (%) 6% 9% 2% 13% 4% 0%Turn Type NA Perm pm+pt NA Prot PermProtected Phases 2 1 6 8Permitted Phases 2 6 8Actuated Green, G (s) 70.7 70.7 80.4 80.4 26.8 26.8Effective Green, g (s) 70.7 70.7 80.4 80.4 26.8 26.8Actuated g/C Ratio 0.59 0.59 0.67 0.67 0.22 0.22Clearance Time (s) 5.9 5.9 4.0 5.9 6.9 6.9Vehicle Extension (s) 5.5 5.5 3.0 5.5 5.0 5.0Lane Grp Cap (vph) 2029 861 147 2164 391 359v/s Ratio Prot c0.61 0.02 c0.26 0.03v/s Ratio Perm 0.03 0.26 c0.19v/c Ratio 1.04 0.04 0.41 0.39 0.14 0.84Uniform Delay, d1 24.6 10.4 28.3 8.9 37.3 44.6Progression Factor 1.00 1.00 1.89 0.92 1.00 1.00Incremental Delay, d2 31.9 0.1 1.8 0.5 0.3 17.6Delay (s) 56.5 10.5 55.3 8.7 37.7 62.1Level of Service E B E A D EApproach Delay (s) 55.5 11.8 59.2Approach LOS E B E
Intersection SummaryHCM 2000 Control Delay 44.6 HCM 2000 Level of Service DHCM 2000 Volume to Capacity ratio 0.96Actuated Cycle Length (s) 120.0 Sum of lost time (s) 16.8Intersection Capacity Utilization 91.4% ICU Level of Service FAnalysis Period (min) 15c Critical Lane Group

Lanes, Volumes, Timings 2015 AM Existing Conditions 2: Fourth Line & Dundas Street Graydon Banning
Graydon Banning 7/28/2015 2015 AM Existing Conditions Synchro 9 ReportMC Page 5
Lane Group EBT EBR WBL WBT NBL NBRLane ConfigurationsTraffic Volume (vph) 2793 15 15 1020 15 15Future Volume (vph) 2793 15 15 1020 15 15Ideal Flow (vphpl) 1900 1900 1900 1900 1900 1900Storage Length (m) 70.0 120.0 0.0 0.0Storage Lanes 1 1 1 1Taper Length (m) 70.0 2.5Lane Util. Factor 0.95 1.00 1.00 0.95 1.00 1.00Ped Bike Factor 0.97Frt 0.850 0.850Flt Protected 0.950 0.950Satd. Flow (prot) 3510 1512 1825 3288 1825 1361Flt Permitted 0.040 0.950Satd. Flow (perm) 3510 1472 77 3288 1825 1361Right Turn on Red Yes YesSatd. Flow (RTOR) 7 16Link Speed (k/h) 60 60 50Link Distance (m) 424.7 312.9 64.1Travel Time (s) 25.5 18.8 4.6Confl. Peds. (#/hr) 3 3Peak Hour Factor 0.94 0.94 0.94 0.94 0.94 0.94Growth Factor 85% 100% 100% 85% 100% 100%Heavy Vehicles (%) 4% 8% 0% 11% 0% 20%Adj. Flow (vph) 2526 16 16 922 16 16Shared Lane Traffic (%)Lane Group Flow (vph) 2526 16 16 922 16 16Enter Blocked Intersection No No No No No NoLane Alignment Left Right Left Left Left RightMedian Width(m) 3.7 3.7 3.7Link Offset(m) 0.0 0.0 0.0Crosswalk Width(m) 1.6 1.6 1.6Two way Left Turn LaneHeadway Factor 0.99 0.99 0.99 0.99 0.99 0.99Turning Speed (k/h) 14 24 24 14Number of Detectors 2 1 1 2 1 1Detector Template Thru Right Left Thru Left RightLeading Detector (m) 30.5 6.1 6.1 30.5 6.1 6.1Trailing Detector (m) 0.0 0.0 0.0 0.0 0.0 0.0Detector 1 Position(m) 0.0 0.0 0.0 0.0 0.0 0.0Detector 1 Size(m) 1.8 6.1 6.1 1.8 6.1 6.1Detector 1 Type Cl+Ex Cl+Ex Cl+Ex Cl+Ex Cl+Ex Cl+ExDetector 1 ChannelDetector 1 Extend (s) 0.0 0.0 0.0 0.0 0.0 0.0Detector 1 Queue (s) 0.0 0.0 0.0 0.0 0.0 0.0Detector 1 Delay (s) 0.0 0.0 0.0 0.0 0.0 0.0Detector 2 Position(m) 28.7 28.7Detector 2 Size(m) 1.8 1.8Detector 2 Type Cl+Ex Cl+ExDetector 2 Channel

Lanes, Volumes, Timings 2015 AM Existing Conditions 2: Fourth Line & Dundas Street Graydon Banning
Graydon Banning 7/28/2015 2015 AM Existing Conditions Synchro 9 ReportMC Page 6
Lane Group EBT EBR WBL WBT NBL NBRDetector 2 Extend (s) 0.0 0.0Turn Type NA Perm pm+pt NA Prot PermProtected Phases 2 1 6 8Permitted Phases 2 6 8Detector Phase 2 2 1 6 8 8Switch PhaseMinimum Initial (s) 5.0 5.0 5.0 5.0 5.0 5.0Minimum Split (s) 33.0 33.0 9.5 24.0 40.6 40.6Total Split (s) 66.0 66.0 12.0 78.0 42.0 42.0Total Split (%) 55.0% 55.0% 10.0% 65.0% 35.0% 35.0%Maximum Green (s) 60.0 60.0 8.0 72.0 35.4 35.4Yellow Time (s) 3.7 3.7 3.0 3.7 3.7 3.7All-Red Time (s) 2.3 2.3 1.0 2.3 2.9 2.9Lost Time Adjust (s) 0.0 0.0 0.0 0.0 0.0 0.0Total Lost Time (s) 6.0 6.0 4.0 6.0 6.6 6.6Lead/Lag Lag Lag LeadLead-Lag Optimize? Yes Yes YesVehicle Extension (s) 5.0 5.0 4.0 5.0 4.0 4.0Recall Mode C-Max C-Max None C-Max None NoneWalk Time (s) 7.0 7.0 7.0 7.0 7.0Flash Dont Walk (s) 20.0 20.0 7.0 27.0 27.0Pedestrian Calls (#/hr) 0 0 0 0 0Act Effct Green (s) 103.1 103.1 107.0 107.4 7.6 7.6Actuated g/C Ratio 0.86 0.86 0.89 0.90 0.06 0.06v/c Ratio 0.84 0.01 0.10 0.31 0.14 0.16Control Delay 10.8 2.5 2.7 2.1 55.1 26.0Queue Delay 0.0 0.0 0.0 0.0 0.0 0.0Total Delay 10.8 2.5 2.7 2.1 55.1 26.0LOS B A A A E CApproach Delay 10.8 2.1 40.6Approach LOS B A DQueue Length 50th (m) 101.8 0.3 0.4 20.1 3.6 0.0Queue Length 95th (m) m107.4 m0.2 1.4 28.2 10.7 7.0Internal Link Dist (m) 400.7 288.9 40.1Turn Bay Length (m) 70.0 120.0Base Capacity (vph) 3016 1266 184 2944 538 412Starvation Cap Reductn 0 0 0 0 0 0Spillback Cap Reductn 0 0 0 0 0 0Storage Cap Reductn 0 0 0 0 0 0Reduced v/c Ratio 0.84 0.01 0.09 0.31 0.03 0.04
Intersection SummaryArea Type: OtherCycle Length: 120Actuated Cycle Length: 120Offset: 103.2 (86%), Referenced to phase 2:EBT and 6:WBTL, Start of GreenNatural Cycle: 145Control Type: Actuated-CoordinatedMaximum v/c Ratio: 0.84

Lanes, Volumes, Timings 2015 AM Existing Conditions 2: Fourth Line & Dundas Street Graydon Banning
Graydon Banning 7/28/2015 2015 AM Existing Conditions Synchro 9 ReportMC Page 7
Intersection Signal Delay: 8.7 Intersection LOS: AIntersection Capacity Utilization 80.3% ICU Level of Service DAnalysis Period (min) 15m Volume for 95th percentile queue is metered by upstream signal.
Splits and Phases: 2: Fourth Line & Dundas Street

HCM Signalized Intersection Capacity Analysis 2015 AM Existing Conditions 2: Fourth Line & Dundas Street Graydon Banning
Graydon Banning 7/28/2015 2015 AM Existing Conditions Synchro 9 ReportMC Page 8
Movement EBT EBR WBL WBT NBL NBRLane ConfigurationsTraffic Volume (vph) 2793 15 15 1020 15 15Future Volume (vph) 2793 15 15 1020 15 15Ideal Flow (vphpl) 1900 1900 1900 1900 1900 1900Total Lost time (s) 6.0 6.0 4.0 6.0 6.6 6.6Lane Util. Factor 0.95 1.00 1.00 0.95 1.00 1.00Frpb, ped/bikes 1.00 0.97 1.00 1.00 1.00 1.00Flpb, ped/bikes 1.00 1.00 1.00 1.00 1.00 1.00Frt 1.00 0.85 1.00 1.00 1.00 0.85Flt Protected 1.00 1.00 0.95 1.00 0.95 1.00Satd. Flow (prot) 3510 1472 1825 3288 1825 1361Flt Permitted 1.00 1.00 0.04 1.00 0.95 1.00Satd. Flow (perm) 3510 1472 77 3288 1825 1361Peak-hour factor, PHF 0.94 0.94 0.94 0.94 0.94 0.94Growth Factor (vph) 85% 100% 100% 85% 100% 100%Adj. Flow (vph) 2526 16 16 922 16 16RTOR Reduction (vph) 0 1 0 0 0 15Lane Group Flow (vph) 2526 15 16 922 16 1Confl. Peds. (#/hr) 3 3Heavy Vehicles (%) 4% 8% 0% 11% 0% 20%Turn Type NA Perm pm+pt NA Prot PermProtected Phases 2 1 6 8Permitted Phases 2 6 8Actuated Green, G (s) 95.7 95.7 102.4 102.4 5.0 5.0Effective Green, g (s) 95.7 95.7 102.4 102.4 5.0 5.0Actuated g/C Ratio 0.80 0.80 0.85 0.85 0.04 0.04Clearance Time (s) 6.0 6.0 4.0 6.0 6.6 6.6Vehicle Extension (s) 5.0 5.0 4.0 5.0 4.0 4.0Lane Grp Cap (vph) 2799 1173 105 2805 76 56v/s Ratio Prot c0.72 0.00 c0.28 c0.01v/s Ratio Perm 0.01 0.13 0.00v/c Ratio 0.90 0.01 0.15 0.33 0.21 0.01Uniform Delay, d1 8.8 2.5 21.2 1.8 55.6 55.1Progression Factor 1.05 0.85 1.00 1.00 1.00 1.00Incremental Delay, d2 1.5 0.0 0.9 0.3 1.9 0.1Delay (s) 10.7 2.1 22.1 2.1 57.5 55.2Level of Service B A C A E EApproach Delay (s) 10.6 2.4 56.4Approach LOS B A E
Intersection SummaryHCM 2000 Control Delay 8.9 HCM 2000 Level of Service AHCM 2000 Volume to Capacity ratio 0.86Actuated Cycle Length (s) 120.0 Sum of lost time (s) 16.6Intersection Capacity Utilization 80.3% ICU Level of Service DAnalysis Period (min) 15c Critical Lane Group

Lanes, Volumes, Timings 2015 PM Existing Conditions 1: Proudfoot Trail & Dundas Street Graydon Banning
Graydon Banning 7/28/2015 2015 PM Existing Conditions Synchro 9 ReportMC Page 1
Lane Group EBT EBR WBL WBT NBL NBRLane ConfigurationsTraffic Volume (vph) 1250 46 413 2611 84 166Future Volume (vph) 1250 46 413 2611 84 166Ideal Flow (vphpl) 1900 1900 1900 1900 1900 1900Storage Length (m) 70.0 120.0 0.0 0.0Storage Lanes 1 1 1 1Taper Length (m) 70.0 2.5Lane Util. Factor 0.95 1.00 1.00 0.95 1.00 1.00Ped Bike Factor 0.97Frt 0.850 0.850Flt Protected 0.950 0.950Satd. Flow (prot) 3476 1541 1825 3579 1825 1633Flt Permitted 0.149 0.950Satd. Flow (perm) 3476 1500 286 3579 1825 1633Right Turn on Red Yes YesSatd. Flow (RTOR) 47 169Link Speed (k/h) 60 60 50Link Distance (m) 373.6 424.7 186.0Travel Time (s) 22.4 25.5 13.4Confl. Peds. (#/hr) 2 2Peak Hour Factor 0.98 0.98 0.98 0.98 0.98 0.98Growth Factor 85% 100% 100% 85% 100% 100%Heavy Vehicles (%) 5% 6% 0% 2% 0% 0%Adj. Flow (vph) 1084 47 421 2265 86 169Shared Lane Traffic (%)Lane Group Flow (vph) 1084 47 421 2265 86 169Enter Blocked Intersection No No No No No NoLane Alignment Left Right Left Left Left RightMedian Width(m) 3.7 3.7 3.7Link Offset(m) 0.0 0.0 0.0Crosswalk Width(m) 1.6 1.6 1.6Two way Left Turn LaneHeadway Factor 0.99 0.99 0.99 0.99 0.99 0.99Turning Speed (k/h) 14 24 24 14Number of Detectors 2 1 1 2 1 1Detector Template Thru Right Left Thru Left RightLeading Detector (m) 30.5 6.1 6.1 30.5 6.1 6.1Trailing Detector (m) 0.0 0.0 0.0 0.0 0.0 0.0Detector 1 Position(m) 0.0 0.0 0.0 0.0 0.0 0.0Detector 1 Size(m) 1.8 6.1 6.1 1.8 6.1 6.1Detector 1 Type Cl+Ex Cl+Ex Cl+Ex Cl+Ex Cl+Ex Cl+ExDetector 1 ChannelDetector 1 Extend (s) 0.0 0.0 0.0 0.0 0.0 0.0Detector 1 Queue (s) 0.0 0.0 0.0 0.0 0.0 0.0Detector 1 Delay (s) 0.0 0.0 0.0 0.0 0.0 0.0Detector 2 Position(m) 28.7 28.7Detector 2 Size(m) 1.8 1.8Detector 2 Type Cl+Ex Cl+ExDetector 2 Channel

Lanes, Volumes, Timings 2015 PM Existing Conditions 1: Proudfoot Trail & Dundas Street Graydon Banning
Graydon Banning 7/28/2015 2015 PM Existing Conditions Synchro 9 ReportMC Page 2
Lane Group EBT EBR WBL WBT NBL NBRDetector 2 Extend (s) 0.0 0.0Turn Type NA Perm pm+pt NA Prot PermProtected Phases 2 1 6 8Permitted Phases 2 6 8Detector Phase 2 2 1 6 8 8Switch PhaseMinimum Initial (s) 5.0 5.0 5.0 5.0 5.0 5.0Minimum Split (s) 23.9 23.9 9.5 23.9 24.9 24.9Total Split (s) 63.6 63.6 12.0 75.6 44.4 44.4Total Split (%) 53.0% 53.0% 10.0% 63.0% 37.0% 37.0%Maximum Green (s) 57.7 57.7 8.0 69.7 37.5 37.5Yellow Time (s) 3.7 3.7 3.0 3.7 3.3 3.3All-Red Time (s) 2.2 2.2 1.0 2.2 3.6 3.6Lost Time Adjust (s) 0.0 0.0 0.0 0.0 0.0 0.0Total Lost Time (s) 5.9 5.9 4.0 5.9 6.9 6.9Lead/Lag Lag Lag LeadLead-Lag Optimize?Vehicle Extension (s) 5.5 5.5 3.0 5.5 5.0 5.0Recall Mode C-Max C-Max None C-Max None NoneWalk Time (s) 7.0 7.0 7.0 7.0 7.0Flash Dont Walk (s) 11.0 11.0 11.0 11.0 11.0Pedestrian Calls (#/hr) 0 0 0 0 0Act Effct Green (s) 57.8 57.8 96.2 94.3 12.9 12.9Actuated g/C Ratio 0.48 0.48 0.80 0.79 0.11 0.11v/c Ratio 0.65 0.06 0.65 0.81 0.44 0.52Control Delay 25.7 4.9 16.0 12.9 56.3 12.9Queue Delay 0.0 0.0 0.0 0.0 0.0 0.0Total Delay 25.7 4.9 16.0 12.9 56.3 12.9LOS C A B B E BApproach Delay 24.9 13.4 27.6Approach LOS C B CQueue Length 50th (m) 98.5 0.0 55.9 198.6 19.3 0.0Queue Length 95th (m) 121.0 6.3 m73.4 226.1 34.2 19.1Internal Link Dist (m) 349.6 400.7 162.0Turn Bay Length (m) 70.0 120.0Base Capacity (vph) 1673 746 646 2811 570 626Starvation Cap Reductn 0 0 0 0 0 0Spillback Cap Reductn 0 0 0 0 0 0Storage Cap Reductn 0 0 0 0 0 0Reduced v/c Ratio 0.65 0.06 0.65 0.81 0.15 0.27
Intersection SummaryArea Type: OtherCycle Length: 120Actuated Cycle Length: 120Offset: 62.4 (52%), Referenced to phase 2:EBT and 6:WBTL, Start of GreenNatural Cycle: 90Control Type: Actuated-CoordinatedMaximum v/c Ratio: 0.81

Lanes, Volumes, Timings 2015 PM Existing Conditions 1: Proudfoot Trail & Dundas Street Graydon Banning
Graydon Banning 7/28/2015 2015 PM Existing Conditions Synchro 9 ReportMC Page 3
Intersection Signal Delay: 17.5 Intersection LOS: BIntersection Capacity Utilization 76.7% ICU Level of Service DAnalysis Period (min) 15m Volume for 95th percentile queue is metered by upstream signal.
Splits and Phases: 1: Proudfoot Trail & Dundas Street

HCM Signalized Intersection Capacity Analysis 2015 PM Existing Conditions 1: Proudfoot Trail & Dundas Street Graydon Banning
Graydon Banning 7/28/2015 2015 PM Existing Conditions Synchro 9 ReportMC Page 4
Movement EBT EBR WBL WBT NBL NBRLane ConfigurationsTraffic Volume (vph) 1250 46 413 2611 84 166Future Volume (vph) 1250 46 413 2611 84 166Ideal Flow (vphpl) 1900 1900 1900 1900 1900 1900Total Lost time (s) 5.9 5.9 4.0 5.9 6.9 6.9Lane Util. Factor 0.95 1.00 1.00 0.95 1.00 1.00Frpb, ped/bikes 1.00 0.97 1.00 1.00 1.00 1.00Flpb, ped/bikes 1.00 1.00 1.00 1.00 1.00 1.00Frt 1.00 0.85 1.00 1.00 1.00 0.85Flt Protected 1.00 1.00 0.95 1.00 0.95 1.00Satd. Flow (prot) 3476 1500 1825 3579 1825 1633Flt Permitted 1.00 1.00 0.15 1.00 0.95 1.00Satd. Flow (perm) 3476 1500 285 3579 1825 1633Peak-hour factor, PHF 0.98 0.98 0.98 0.98 0.98 0.98Growth Factor (vph) 85% 100% 100% 85% 100% 100%Adj. Flow (vph) 1084 47 421 2265 86 169RTOR Reduction (vph) 0 24 0 0 0 151Lane Group Flow (vph) 1084 23 421 2265 86 18Confl. Peds. (#/hr) 2 2Heavy Vehicles (%) 5% 6% 0% 2% 0% 0%Turn Type NA Perm pm+pt NA Prot PermProtected Phases 2 1 6 8Permitted Phases 2 6 8Actuated Green, G (s) 57.8 57.8 94.3 94.3 12.9 12.9Effective Green, g (s) 57.8 57.8 94.3 94.3 12.9 12.9Actuated g/C Ratio 0.48 0.48 0.79 0.79 0.11 0.11Clearance Time (s) 5.9 5.9 4.0 5.9 6.9 6.9Vehicle Extension (s) 5.5 5.5 3.0 5.5 5.0 5.0Lane Grp Cap (vph) 1674 722 641 2812 196 175v/s Ratio Prot 0.31 0.18 c0.63 c0.05v/s Ratio Perm 0.02 0.34 0.01v/c Ratio 0.65 0.03 0.66 0.81 0.44 0.10Uniform Delay, d1 23.4 16.4 19.4 7.5 50.2 48.3Progression Factor 1.00 1.00 0.85 1.37 1.00 1.00Incremental Delay, d2 2.0 0.1 1.2 1.3 3.3 0.5Delay (s) 25.4 16.4 17.7 11.6 53.4 48.9Level of Service C B B B D DApproach Delay (s) 25.0 12.5 50.4Approach LOS C B D
Intersection SummaryHCM 2000 Control Delay 18.4 HCM 2000 Level of Service BHCM 2000 Volume to Capacity ratio 0.79Actuated Cycle Length (s) 120.0 Sum of lost time (s) 16.8Intersection Capacity Utilization 76.7% ICU Level of Service DAnalysis Period (min) 15c Critical Lane Group

Lanes, Volumes, Timings 2015 PM Existing Conditions 2: Fourth Line & Dundas Street Graydon Banning
Graydon Banning 7/28/2015 2015 PM Existing Conditions Synchro 9 ReportMC Page 5
Lane Group EBT EBR WBL WBT NBL NBRLane ConfigurationsTraffic Volume (vph) 1404 15 15 3019 15 15Future Volume (vph) 1404 15 15 3019 15 15Ideal Flow (vphpl) 1900 1900 1900 1900 1900 1900Storage Length (m) 70.0 120.0 0.0 0.0Storage Lanes 1 1 1 1Taper Length (m) 70.0 2.5Lane Util. Factor 0.95 1.00 1.00 0.95 1.00 1.00Ped Bike Factor 0.97Frt 0.850 0.850Flt Protected 0.950 0.950Satd. Flow (prot) 3476 1633 1825 3579 1825 1633Flt Permitted 0.192 0.950Satd. Flow (perm) 3476 1590 369 3579 1825 1633Right Turn on Red Yes YesSatd. Flow (RTOR) 15 16Link Speed (k/h) 60 60 50Link Distance (m) 424.7 312.9 64.1Travel Time (s) 25.5 18.8 4.6Confl. Peds. (#/hr) 3 3Peak Hour Factor 0.94 0.94 0.94 0.94 0.94 0.94Growth Factor 85% 100% 100% 85% 100% 100%Heavy Vehicles (%) 5% 0% 0% 2% 0% 0%Adj. Flow (vph) 1270 16 16 2730 16 16Shared Lane Traffic (%)Lane Group Flow (vph) 1270 16 16 2730 16 16Enter Blocked Intersection No No No No No NoLane Alignment Left Right Left Left Left RightMedian Width(m) 3.7 3.7 3.7Link Offset(m) 0.0 0.0 0.0Crosswalk Width(m) 1.6 1.6 1.6Two way Left Turn LaneHeadway Factor 0.99 0.99 0.99 0.99 0.99 0.99Turning Speed (k/h) 14 24 24 14Number of Detectors 2 1 1 2 1 1Detector Template Thru Right Left Thru Left RightLeading Detector (m) 30.5 6.1 6.1 30.5 6.1 6.1Trailing Detector (m) 0.0 0.0 0.0 0.0 0.0 0.0Detector 1 Position(m) 0.0 0.0 0.0 0.0 0.0 0.0Detector 1 Size(m) 1.8 6.1 6.1 1.8 6.1 6.1Detector 1 Type Cl+Ex Cl+Ex Cl+Ex Cl+Ex Cl+Ex Cl+ExDetector 1 ChannelDetector 1 Extend (s) 0.0 0.0 0.0 0.0 0.0 0.0Detector 1 Queue (s) 0.0 0.0 0.0 0.0 0.0 0.0Detector 1 Delay (s) 0.0 0.0 0.0 0.0 0.0 0.0Detector 2 Position(m) 28.7 28.7Detector 2 Size(m) 1.8 1.8Detector 2 Type Cl+Ex Cl+ExDetector 2 Channel

Lanes, Volumes, Timings 2015 PM Existing Conditions 2: Fourth Line & Dundas Street Graydon Banning
Graydon Banning 7/28/2015 2015 PM Existing Conditions Synchro 9 ReportMC Page 6
Lane Group EBT EBR WBL WBT NBL NBRDetector 2 Extend (s) 0.0 0.0Turn Type NA Perm pm+pt NA Prot PermProtected Phases 2 1 6 8Permitted Phases 2 6 8Detector Phase 2 2 1 6 8 8Switch PhaseMinimum Initial (s) 5.0 5.0 5.0 5.0 5.0 5.0Minimum Split (s) 33.0 33.0 9.5 24.0 40.6 40.6Total Split (s) 66.0 66.0 12.0 78.0 42.0 42.0Total Split (%) 55.0% 55.0% 10.0% 65.0% 35.0% 35.0%Maximum Green (s) 60.0 60.0 8.0 72.0 35.4 35.4Yellow Time (s) 3.7 3.7 3.0 3.7 3.7 3.7All-Red Time (s) 2.3 2.3 1.0 2.3 2.9 2.9Lost Time Adjust (s) 0.0 0.0 0.0 0.0 0.0 0.0Total Lost Time (s) 6.0 6.0 4.0 6.0 6.6 6.6Lead/Lag Lag Lag LeadLead-Lag Optimize? Yes Yes YesVehicle Extension (s) 5.0 5.0 4.0 5.0 4.0 4.0Recall Mode C-Max C-Max None C-Max None NoneWalk Time (s) 7.0 7.0 7.0 7.0 7.0Flash Dont Walk (s) 20.0 20.0 7.0 27.0 27.0Pedestrian Calls (#/hr) 0 0 0 0 0Act Effct Green (s) 103.1 103.1 107.0 107.4 7.6 7.6Actuated g/C Ratio 0.86 0.86 0.89 0.90 0.06 0.06v/c Ratio 0.43 0.01 0.04 0.85 0.14 0.13Control Delay 1.1 0.0 1.7 9.6 55.1 25.0Queue Delay 0.0 0.0 0.0 0.0 0.0 0.0Total Delay 1.1 0.0 1.7 9.6 55.1 25.0LOS A A A A E CApproach Delay 1.1 9.5 40.1Approach LOS A A DQueue Length 50th (m) 4.1 0.0 0.4 180.9 3.6 0.0Queue Length 95th (m) 5.4 m0.0 1.4 261.6 10.7 7.0Internal Link Dist (m) 400.7 288.9 40.1Turn Bay Length (m) 70.0 120.0Base Capacity (vph) 2987 1368 426 3204 538 493Starvation Cap Reductn 0 0 0 0 0 0Spillback Cap Reductn 0 0 0 0 0 0Storage Cap Reductn 0 0 0 0 0 0Reduced v/c Ratio 0.43 0.01 0.04 0.85 0.03 0.03
Intersection SummaryArea Type: OtherCycle Length: 120Actuated Cycle Length: 120Offset: 103.2 (86%), Referenced to phase 2:EBT and 6:WBTL, Start of GreenNatural Cycle: 145Control Type: Actuated-CoordinatedMaximum v/c Ratio: 0.85

Lanes, Volumes, Timings 2015 PM Existing Conditions 2: Fourth Line & Dundas Street Graydon Banning
Graydon Banning 7/28/2015 2015 PM Existing Conditions Synchro 9 ReportMC Page 7
Intersection Signal Delay: 7.1 Intersection LOS: AIntersection Capacity Utilization 85.6% ICU Level of Service EAnalysis Period (min) 15m Volume for 95th percentile queue is metered by upstream signal.
Splits and Phases: 2: Fourth Line & Dundas Street
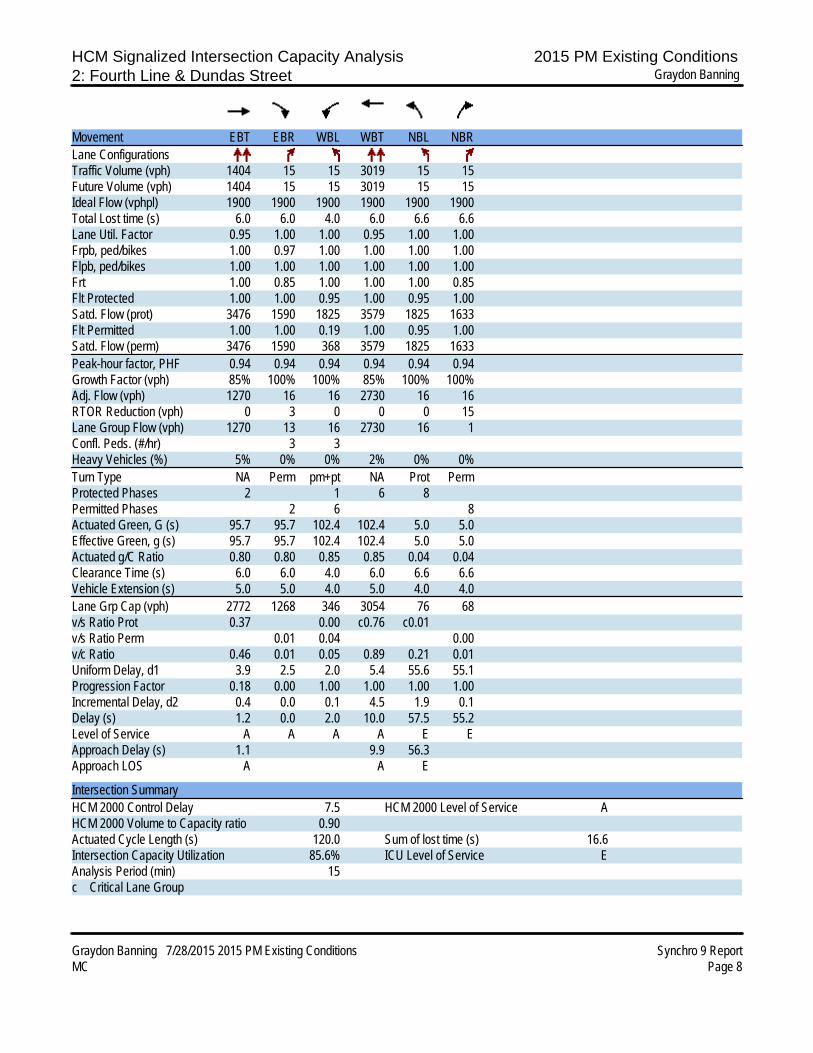
HCM Signalized Intersection Capacity Analysis 2015 PM Existing Conditions 2: Fourth Line & Dundas Street Graydon Banning
Graydon Banning 7/28/2015 2015 PM Existing Conditions Synchro 9 ReportMC Page 8
Movement EBT EBR WBL WBT NBL NBRLane ConfigurationsTraffic Volume (vph) 1404 15 15 3019 15 15Future Volume (vph) 1404 15 15 3019 15 15Ideal Flow (vphpl) 1900 1900 1900 1900 1900 1900Total Lost time (s) 6.0 6.0 4.0 6.0 6.6 6.6Lane Util. Factor 0.95 1.00 1.00 0.95 1.00 1.00Frpb, ped/bikes 1.00 0.97 1.00 1.00 1.00 1.00Flpb, ped/bikes 1.00 1.00 1.00 1.00 1.00 1.00Frt 1.00 0.85 1.00 1.00 1.00 0.85Flt Protected 1.00 1.00 0.95 1.00 0.95 1.00Satd. Flow (prot) 3476 1590 1825 3579 1825 1633Flt Permitted 1.00 1.00 0.19 1.00 0.95 1.00Satd. Flow (perm) 3476 1590 368 3579 1825 1633Peak-hour factor, PHF 0.94 0.94 0.94 0.94 0.94 0.94Growth Factor (vph) 85% 100% 100% 85% 100% 100%Adj. Flow (vph) 1270 16 16 2730 16 16RTOR Reduction (vph) 0 3 0 0 0 15Lane Group Flow (vph) 1270 13 16 2730 16 1Confl. Peds. (#/hr) 3 3Heavy Vehicles (%) 5% 0% 0% 2% 0% 0%Turn Type NA Perm pm+pt NA Prot PermProtected Phases 2 1 6 8Permitted Phases 2 6 8Actuated Green, G (s) 95.7 95.7 102.4 102.4 5.0 5.0Effective Green, g (s) 95.7 95.7 102.4 102.4 5.0 5.0Actuated g/C Ratio 0.80 0.80 0.85 0.85 0.04 0.04Clearance Time (s) 6.0 6.0 4.0 6.0 6.6 6.6Vehicle Extension (s) 5.0 5.0 4.0 5.0 4.0 4.0Lane Grp Cap (vph) 2772 1268 346 3054 76 68v/s Ratio Prot 0.37 0.00 c0.76 c0.01v/s Ratio Perm 0.01 0.04 0.00v/c Ratio 0.46 0.01 0.05 0.89 0.21 0.01Uniform Delay, d1 3.9 2.5 2.0 5.4 55.6 55.1Progression Factor 0.18 0.00 1.00 1.00 1.00 1.00Incremental Delay, d2 0.4 0.0 0.1 4.5 1.9 0.1Delay (s) 1.2 0.0 2.0 10.0 57.5 55.2Level of Service A A A A E EApproach Delay (s) 1.1 9.9 56.3Approach LOS A A E
Intersection SummaryHCM 2000 Control Delay 7.5 HCM 2000 Level of Service AHCM 2000 Volume to Capacity ratio 0.90Actuated Cycle Length (s) 120.0 Sum of lost time (s) 16.6Intersection Capacity Utilization 85.6% ICU Level of Service EAnalysis Period (min) 15c Critical Lane Group

APPENDIX C – BACKGROUND TRAFFIC REPORT EXCERPTS


EOK Traffic Impact Study | November 2012 | 121610
Paradigm Transportation Solutions Limited Page 24
Figure 4.5A: Site Generated AM Peak Hour Traffic Volumes
Thir
d Li
ne 6
21
00
0 21 0
44 44 12
Dundas Street 012 0 44
109
12 6 12 44
Thir
d Li
ne29
109
29
11 00
33 76 0
11 11 11 11 4
3 0 47 47 0 13
47 Burnhamthorpe Road 130
3 0 29 4
Dri
vew
ay A
3 32
47 86
Thir
d Li
ne32
86
32
86 0
Driveway B86
32 0
0
0
0 0
EOKTraffic Impact Study
Figure 4.5ASite Generated AM Peak Hour
Traffic VolumesParadigmwww.ptsl.com
ProjectNorth

EOK Traffic Impact Study | November 2012 | 121610
Paradigm Transportation Solutions Limited Page 25
Figure 4.5B: Site Generated PM Peak Hour Traffic Volumes
0 10 0
Thir
d Li
ne 28
10
00
21
21 21 57
21Dundas Street 0
57 0
141
52
57 28 57
16
36 0
Thir
d Li
ne14
1
52
5 00
5 5 5 5 17
14 0 22 22 0 6
22 Burnhamthorpe Road 6
0 141
17
014
Dri
vew
ay A
14 158
22
0
Thir
d Li
ne15
8
4242
0158
42
Driveway B42
158
0
0
0 0
EOKTraffic Impact Study
Figure 4.5BSite Generated PM Peak Hour
Traffic VolumesParadigmwww.ptsl.com
ProjectNorth

APPENDIX D – DETAILED SITE TRIP GENERATION
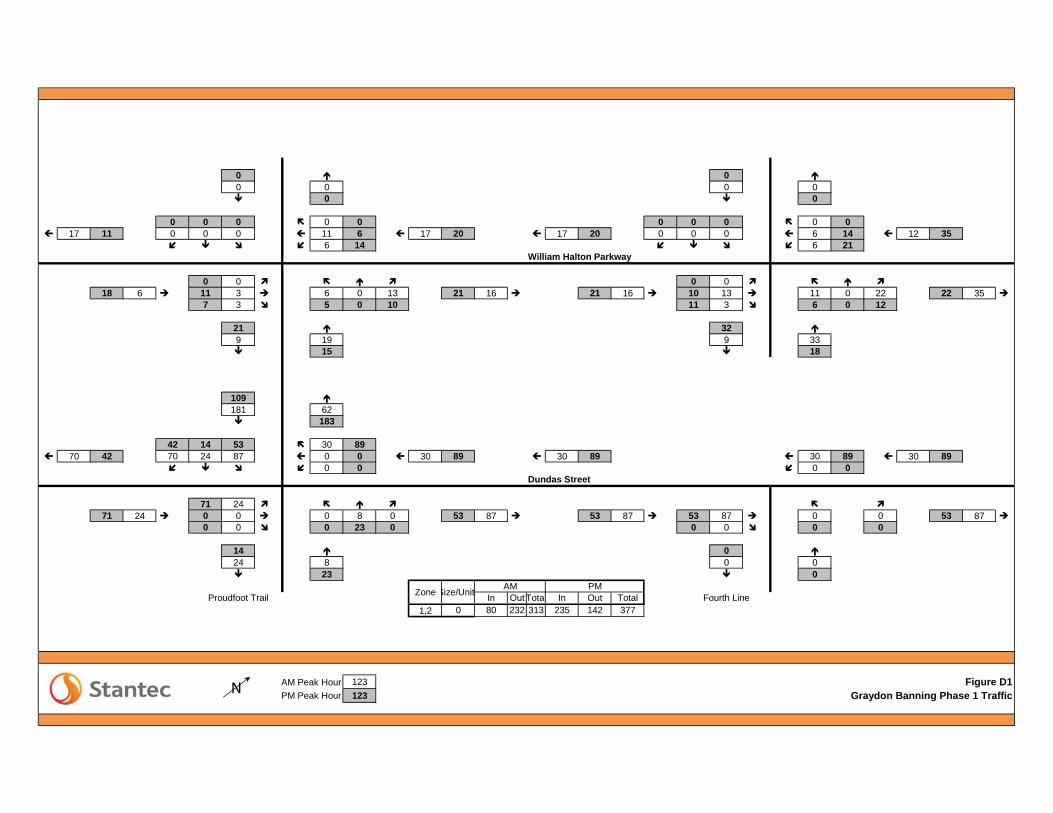
0 0 0 0 0 0 0 0
0 0 0 0 0 0 0 0 0 0 17 11 0 0 0 11 6 17 20 17 20 0 0 0 6 14 12 35
6 14 6 21William Halton Parkway
0 0 0 0 18 6 11 3 6 0 13 21 16 21 16 10 13 11 0 22 22 35
7 3 5 0 10 11 3 6 0 12
21 32 9 19 9 33 15 18
109 181 62 183
42 14 53 30 89 70 42 70 24 87 0 0 30 89 30 89 30 89 30 89
0 0 0 0Dundas Street
71 24 71 24 0 0 0 8 0 53 87 53 87 53 87 0 0 53 87
0 0 0 23 0 0 0 0 0
14 0 24 8 0 0 23 0
Proudfoot Trail In OutTota In Out Total Fourth Line
1,2 0 80 232 313 235 142 377
AM Peak Hour 123 Figure D1PM Peak Hour 123 Graydon Banning Phase 1 Traffic
Zone Size/UnitAM PM
N

32 86 55 16 161 42 58 158
12 11 9 4 16 73 0 13 6 24 81 44 21 19 15 60 32 140 89 141 89 137 0 24 4 16 10 40
76 41 0 0William Halton Parkway
22 6 134 36 81 22 59 16 0 6 20 143 51 143 51 9 15 0 0 0 22 39
0 0 0 20 75 0 0 0 0 0
52 0 95 26 0 0 95 0
52 96 26 96
8 12 32 16 59 14 8 14 22 60 0 0 16 59 16 59 16 59 16 59
0 0 0 0Dundas Street
15 4 15 4 0 0 0 6 0 32 60 32 60 32 60 0 0 32 60
0 0 0 22 0 0 0 0 0
12 0 22 6 0 0 22 0
Proudfoot Trail In OutTota In Out Total Fourth Line
3,4 0 58 216 275 216 118 334
AM Peak Hour 123 Figure D2PM Peak Hour 123 Graydon Banning Phase 2 Traffic
Zone Size/UnitAM PM
N

APPENDIX E – FUTURE BACKGROUND CONDITIONS SYNCHRO WORKSHEETS

Lanes, Volumes, Timings 2015 AM Future Background Conditions 1: Proudfoot Trail & Dundas Street Graydon Banning
Graydon Banning 7/28/2015 2015 AM Future Background Conditions Synchro 9 ReportMC Page 1
Lane Group EBT EBR WBL WBT NBL NBRLane ConfigurationsTraffic Volume (vph) 2905 64 66 1372 77 426Future Volume (vph) 2905 64 66 1372 77 426Ideal Flow (vphpl) 1900 1900 1900 1900 1900 1900Storage Length (m) 70.0 120.0 0.0 0.0Storage Lanes 1 1 1 1Taper Length (m) 70.0 2.5Lane Util. Factor 0.95 1.00 1.00 0.95 1.00 1.00Ped Bike Factor 0.98 0.99Frt 0.850 0.850Flt Protected 0.950 0.950Satd. Flow (prot) 3444 1498 1789 3230 1755 1633Flt Permitted 0.050 0.950Satd. Flow (perm) 3444 1463 94 3230 1755 1610Right Turn on Red Yes YesSatd. Flow (RTOR) 40 78Link Speed (k/h) 60 60 50Link Distance (m) 373.6 424.7 186.0Travel Time (s) 22.4 25.5 13.4Confl. Peds. (#/hr) 1 1 1Peak Hour Factor 0.97 0.97 0.97 0.97 0.97 0.97Growth Factor 85% 100% 100% 85% 100% 100%Heavy Vehicles (%) 6% 9% 2% 13% 4% 0%Adj. Flow (vph) 2546 66 68 1202 79 439Shared Lane Traffic (%)Lane Group Flow (vph) 2546 66 68 1202 79 439Enter Blocked Intersection No No No No No NoLane Alignment Left Right Left Left Left RightMedian Width(m) 3.7 3.7 3.7Link Offset(m) 0.0 0.0 0.0Crosswalk Width(m) 1.6 1.6 1.6Two way Left Turn LaneHeadway Factor 0.99 0.99 0.99 0.99 0.99 0.99Turning Speed (k/h) 14 24 24 14Number of Detectors 2 1 1 2 1 1Detector Template Thru Right Left Thru Left RightLeading Detector (m) 30.5 6.1 6.1 30.5 6.1 6.1Trailing Detector (m) 0.0 0.0 0.0 0.0 0.0 0.0Detector 1 Position(m) 0.0 0.0 0.0 0.0 0.0 0.0Detector 1 Size(m) 1.8 6.1 6.1 1.8 6.1 6.1Detector 1 Type Cl+Ex Cl+Ex Cl+Ex Cl+Ex Cl+Ex Cl+ExDetector 1 ChannelDetector 1 Extend (s) 0.0 0.0 0.0 0.0 0.0 0.0Detector 1 Queue (s) 0.0 0.0 0.0 0.0 0.0 0.0Detector 1 Delay (s) 0.0 0.0 0.0 0.0 0.0 0.0Detector 2 Position(m) 28.7 28.7Detector 2 Size(m) 1.8 1.8Detector 2 Type Cl+Ex Cl+ExDetector 2 Channel

Lanes, Volumes, Timings 2015 AM Future Background Conditions 1: Proudfoot Trail & Dundas Street Graydon Banning
Graydon Banning 7/28/2015 2015 AM Future Background Conditions Synchro 9 ReportMC Page 2
Lane Group EBT EBR WBL WBT NBL NBRDetector 2 Extend (s) 0.0 0.0Turn Type NA Perm pm+pt NA Prot PermProtected Phases 2 1 6 8Permitted Phases 2 6 8Detector Phase 2 2 1 6 8 8Switch PhaseMinimum Initial (s) 5.0 5.0 5.0 5.0 5.0 5.0Minimum Split (s) 23.9 23.9 9.5 23.9 24.9 24.9Total Split (s) 80.5 80.5 9.5 90.0 30.0 30.0Total Split (%) 67.1% 67.1% 7.9% 75.0% 25.0% 25.0%Maximum Green (s) 74.6 74.6 5.5 84.1 23.1 23.1Yellow Time (s) 3.7 3.7 3.0 3.7 3.3 3.3All-Red Time (s) 2.2 2.2 1.0 2.2 3.6 3.6Lost Time Adjust (s) 0.0 0.0 0.0 0.0 0.0 0.0Total Lost Time (s) 5.9 5.9 4.0 5.9 6.9 6.9Lead/Lag Lag Lag LeadLead-Lag Optimize?Vehicle Extension (s) 5.5 5.5 3.0 5.5 5.0 5.0Recall Mode C-Max C-Max None C-Max None NoneWalk Time (s) 7.0 7.0 7.0 7.0 7.0Flash Dont Walk (s) 11.0 11.0 11.0 11.0 11.0Pedestrian Calls (#/hr) 0 0 0 0 0Act Effct Green (s) 76.5 76.5 86.0 84.1 23.1 23.1Actuated g/C Ratio 0.64 0.64 0.72 0.70 0.19 0.19v/c Ratio 1.16 0.07 0.47 0.53 0.23 1.18Control Delay 100.8 4.5 28.6 8.6 43.2 140.8Queue Delay 0.0 0.0 0.0 0.0 0.0 0.0Total Delay 100.8 4.5 28.6 8.6 43.2 140.8LOS F A C A D FApproach Delay 98.3 9.7 125.9Approach LOS F A FQueue Length 50th (m) ~380.5 2.2 4.1 50.1 15.9 ~108.3Queue Length 95th (m) #420.4 7.5 19.0 58.3 29.9 #171.1Internal Link Dist (m) 349.6 400.7 162.0Turn Bay Length (m) 70.0 120.0Base Capacity (vph) 2195 947 145 2263 337 372Starvation Cap Reductn 0 0 0 0 0 0Spillback Cap Reductn 0 0 0 0 0 0Storage Cap Reductn 0 0 0 0 0 0Reduced v/c Ratio 1.16 0.07 0.47 0.53 0.23 1.18
Intersection SummaryArea Type: OtherCycle Length: 120Actuated Cycle Length: 120Offset: 80.4 (67%), Referenced to phase 2:EBT and 6:WBTL, Start of GreenNatural Cycle: 150Control Type: Actuated-CoordinatedMaximum v/c Ratio: 1.18

Lanes, Volumes, Timings 2015 AM Future Background Conditions 1: Proudfoot Trail & Dundas Street Graydon Banning
Graydon Banning 7/28/2015 2015 AM Future Background Conditions Synchro 9 ReportMC Page 3
Intersection Signal Delay: 76.0 Intersection LOS: EIntersection Capacity Utilization 105.4% ICU Level of Service GAnalysis Period (min) 15~ Volume exceeds capacity, queue is theoretically infinite. Queue shown is maximum after two cycles.# 95th percentile volume exceeds capacity, queue may be longer. Queue shown is maximum after two cycles.
Splits and Phases: 1: Proudfoot Trail & Dundas Street

HCM Signalized Intersection Capacity Analysis 2015 AM Future Background Conditions 1: Proudfoot Trail & Dundas Street Graydon Banning
Graydon Banning 7/28/2015 2015 AM Future Background Conditions Synchro 9 ReportMC Page 4
Movement EBT EBR WBL WBT NBL NBRLane ConfigurationsTraffic Volume (vph) 2905 64 66 1372 77 426Future Volume (vph) 2905 64 66 1372 77 426Ideal Flow (vphpl) 1900 1900 1900 1900 1900 1900Total Lost time (s) 5.9 5.9 4.0 5.9 6.9 6.9Lane Util. Factor 0.95 1.00 1.00 0.95 1.00 1.00Frpb, ped/bikes 1.00 0.98 1.00 1.00 1.00 0.99Flpb, ped/bikes 1.00 1.00 1.00 1.00 1.00 1.00Frt 1.00 0.85 1.00 1.00 1.00 0.85Flt Protected 1.00 1.00 0.95 1.00 0.95 1.00Satd. Flow (prot) 3444 1463 1789 3230 1755 1610Flt Permitted 1.00 1.00 0.05 1.00 0.95 1.00Satd. Flow (perm) 3444 1463 95 3230 1755 1610Peak-hour factor, PHF 0.97 0.97 0.97 0.97 0.97 0.97Growth Factor (vph) 85% 100% 100% 85% 100% 100%Adj. Flow (vph) 2546 66 68 1202 79 439RTOR Reduction (vph) 0 15 0 0 0 63Lane Group Flow (vph) 2546 51 68 1202 79 376Confl. Peds. (#/hr) 1 1 1Heavy Vehicles (%) 6% 9% 2% 13% 4% 0%Turn Type NA Perm pm+pt NA Prot PermProtected Phases 2 1 6 8Permitted Phases 2 6 8Actuated Green, G (s) 75.7 75.7 84.1 84.1 23.1 23.1Effective Green, g (s) 75.7 75.7 84.1 84.1 23.1 23.1Actuated g/C Ratio 0.63 0.63 0.70 0.70 0.19 0.19Clearance Time (s) 5.9 5.9 4.0 5.9 6.9 6.9Vehicle Extension (s) 5.5 5.5 3.0 5.5 5.0 5.0Lane Grp Cap (vph) 2172 922 128 2263 337 309v/s Ratio Prot c0.74 0.02 c0.37 0.05v/s Ratio Perm 0.04 0.35 c0.23v/c Ratio 1.17 0.06 0.53 0.53 0.23 1.22Uniform Delay, d1 22.1 8.5 30.4 8.6 41.0 48.5Progression Factor 1.00 1.00 1.90 0.90 1.00 1.00Incremental Delay, d2 82.8 0.1 3.9 0.8 0.8 123.4Delay (s) 104.9 8.6 61.6 8.5 41.7 171.9Level of Service F A E A D FApproach Delay (s) 102.5 11.3 152.0Approach LOS F B F
Intersection SummaryHCM 2000 Control Delay 82.0 HCM 2000 Level of Service FHCM 2000 Volume to Capacity ratio 1.16Actuated Cycle Length (s) 120.0 Sum of lost time (s) 16.8Intersection Capacity Utilization 105.4% ICU Level of Service GAnalysis Period (min) 15c Critical Lane Group

Lanes, Volumes, Timings 2015 AM Future Background Conditions 2: Fourth Line & Dundas Street Graydon Banning
Graydon Banning 7/28/2015 2015 AM Future Background Conditions Synchro 9 ReportMC Page 5
Lane Group EBT EBR WBL WBT NBL NBRLane ConfigurationsTraffic Volume (vph) 3316 15 15 1423 15 15Future Volume (vph) 3316 15 15 1423 15 15Ideal Flow (vphpl) 1900 1900 1900 1900 1900 1900Storage Length (m) 70.0 120.0 0.0 0.0Storage Lanes 1 1 1 1Taper Length (m) 70.0 2.5Lane Util. Factor 0.95 1.00 1.00 0.95 1.00 1.00Ped Bike Factor 0.97Frt 0.850 0.850Flt Protected 0.950 0.950Satd. Flow (prot) 3510 1512 1825 3288 1825 1361Flt Permitted 0.040 0.950Satd. Flow (perm) 3510 1472 77 3288 1825 1361Right Turn on Red Yes YesSatd. Flow (RTOR) 7 16Link Speed (k/h) 60 60 50Link Distance (m) 424.7 312.9 64.1Travel Time (s) 25.5 18.8 4.6Confl. Peds. (#/hr) 3 3Peak Hour Factor 0.94 0.94 0.94 0.94 0.94 0.94Growth Factor 85% 100% 100% 85% 100% 100%Heavy Vehicles (%) 4% 8% 0% 11% 0% 20%Adj. Flow (vph) 2999 16 16 1287 16 16Shared Lane Traffic (%)Lane Group Flow (vph) 2999 16 16 1287 16 16Enter Blocked Intersection No No No No No NoLane Alignment Left Right Left Left Left RightMedian Width(m) 3.7 3.7 3.7Link Offset(m) 0.0 0.0 0.0Crosswalk Width(m) 1.6 1.6 1.6Two way Left Turn LaneHeadway Factor 0.99 0.99 0.99 0.99 0.99 0.99Turning Speed (k/h) 14 24 24 14Number of Detectors 2 1 1 2 1 1Detector Template Thru Right Left Thru Left RightLeading Detector (m) 30.5 6.1 6.1 30.5 6.1 6.1Trailing Detector (m) 0.0 0.0 0.0 0.0 0.0 0.0Detector 1 Position(m) 0.0 0.0 0.0 0.0 0.0 0.0Detector 1 Size(m) 1.8 6.1 6.1 1.8 6.1 6.1Detector 1 Type Cl+Ex Cl+Ex Cl+Ex Cl+Ex Cl+Ex Cl+ExDetector 1 ChannelDetector 1 Extend (s) 0.0 0.0 0.0 0.0 0.0 0.0Detector 1 Queue (s) 0.0 0.0 0.0 0.0 0.0 0.0Detector 1 Delay (s) 0.0 0.0 0.0 0.0 0.0 0.0Detector 2 Position(m) 28.7 28.7Detector 2 Size(m) 1.8 1.8Detector 2 Type Cl+Ex Cl+ExDetector 2 Channel

Lanes, Volumes, Timings 2015 AM Future Background Conditions 2: Fourth Line & Dundas Street Graydon Banning
Graydon Banning 7/28/2015 2015 AM Future Background Conditions Synchro 9 ReportMC Page 6
Lane Group EBT EBR WBL WBT NBL NBRDetector 2 Extend (s) 0.0 0.0Turn Type NA Perm pm+pt NA Prot PermProtected Phases 2 1 6 8Permitted Phases 2 6 8Detector Phase 2 2 1 6 8 8Switch PhaseMinimum Initial (s) 5.0 5.0 5.0 5.0 5.0 5.0Minimum Split (s) 33.0 33.0 9.5 24.0 40.6 40.6Total Split (s) 69.9 69.9 9.5 79.4 40.6 40.6Total Split (%) 58.3% 58.3% 7.9% 66.2% 33.8% 33.8%Maximum Green (s) 63.9 63.9 5.5 73.4 34.0 34.0Yellow Time (s) 3.7 3.7 3.0 3.7 3.7 3.7All-Red Time (s) 2.3 2.3 1.0 2.3 2.9 2.9Lost Time Adjust (s) 0.0 0.0 0.0 0.0 0.0 0.0Total Lost Time (s) 6.0 6.0 4.0 6.0 6.6 6.6Lead/Lag Lag Lag LeadLead-Lag Optimize? Yes Yes YesVehicle Extension (s) 5.0 5.0 4.0 5.0 4.0 4.0Recall Mode C-Max C-Max None C-Max None NoneWalk Time (s) 7.0 7.0 7.0 7.0 7.0Flash Dont Walk (s) 20.0 20.0 7.0 27.0 27.0Pedestrian Calls (#/hr) 0 0 0 0 0Act Effct Green (s) 103.1 103.1 107.0 107.4 7.6 7.6Actuated g/C Ratio 0.86 0.86 0.89 0.90 0.06 0.06v/c Ratio 0.99 0.01 0.10 0.44 0.14 0.16Control Delay 16.4 3.2 2.7 2.6 55.1 26.0Queue Delay 0.0 0.0 0.0 0.0 0.0 0.0Total Delay 16.4 3.2 2.7 2.6 55.1 26.0LOS B A A A E CApproach Delay 16.3 2.6 40.6Approach LOS B A DQueue Length 50th (m) ~171.5 0.3 0.4 33.2 3.6 0.0Queue Length 95th (m) m#103.2 m0.3 1.4 45.7 10.7 7.0Internal Link Dist (m) 400.7 288.9 40.1Turn Bay Length (m) 70.0 120.0Base Capacity (vph) 3016 1266 165 2944 517 397Starvation Cap Reductn 0 0 0 0 0 0Spillback Cap Reductn 0 0 0 0 0 0Storage Cap Reductn 0 0 0 0 0 0Reduced v/c Ratio 0.99 0.01 0.10 0.44 0.03 0.04
Intersection SummaryArea Type: OtherCycle Length: 120Actuated Cycle Length: 120Offset: 103.2 (86%), Referenced to phase 2:EBT and 6:WBTL, Start of GreenNatural Cycle: 145Control Type: Actuated-CoordinatedMaximum v/c Ratio: 0.99
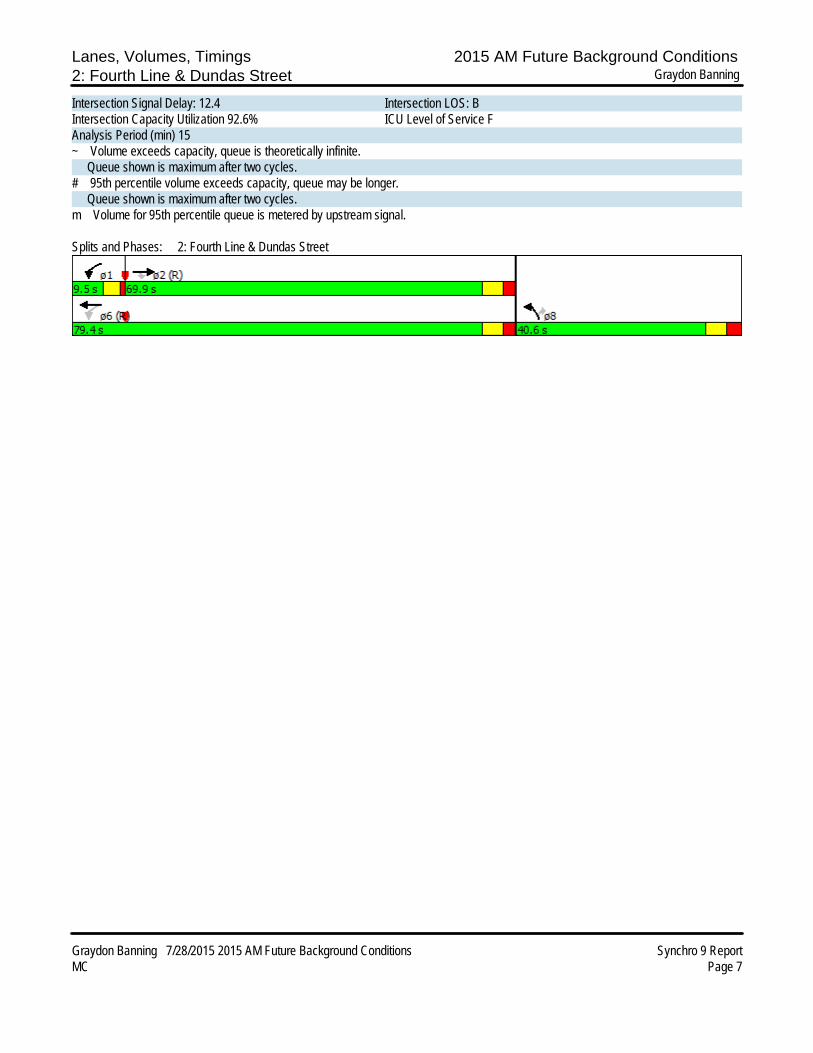
Lanes, Volumes, Timings 2015 AM Future Background Conditions 2: Fourth Line & Dundas Street Graydon Banning
Graydon Banning 7/28/2015 2015 AM Future Background Conditions Synchro 9 ReportMC Page 7
Intersection Signal Delay: 12.4 Intersection LOS: BIntersection Capacity Utilization 92.6% ICU Level of Service FAnalysis Period (min) 15~ Volume exceeds capacity, queue is theoretically infinite. Queue shown is maximum after two cycles.# 95th percentile volume exceeds capacity, queue may be longer. Queue shown is maximum after two cycles.m Volume for 95th percentile queue is metered by upstream signal.
Splits and Phases: 2: Fourth Line & Dundas Street

HCM Signalized Intersection Capacity Analysis 2015 AM Future Background Conditions 2: Fourth Line & Dundas Street Graydon Banning
Graydon Banning 7/28/2015 2015 AM Future Background Conditions Synchro 9 ReportMC Page 8
Movement EBT EBR WBL WBT NBL NBRLane ConfigurationsTraffic Volume (vph) 3316 15 15 1423 15 15Future Volume (vph) 3316 15 15 1423 15 15Ideal Flow (vphpl) 1900 1900 1900 1900 1900 1900Total Lost time (s) 6.0 6.0 4.0 6.0 6.6 6.6Lane Util. Factor 0.95 1.00 1.00 0.95 1.00 1.00Frpb, ped/bikes 1.00 0.97 1.00 1.00 1.00 1.00Flpb, ped/bikes 1.00 1.00 1.00 1.00 1.00 1.00Frt 1.00 0.85 1.00 1.00 1.00 0.85Flt Protected 1.00 1.00 0.95 1.00 0.95 1.00Satd. Flow (prot) 3510 1472 1825 3288 1825 1361Flt Permitted 1.00 1.00 0.04 1.00 0.95 1.00Satd. Flow (perm) 3510 1472 77 3288 1825 1361Peak-hour factor, PHF 0.94 0.94 0.94 0.94 0.94 0.94Growth Factor (vph) 85% 100% 100% 85% 100% 100%Adj. Flow (vph) 2999 16 16 1287 16 16RTOR Reduction (vph) 0 1 0 0 0 15Lane Group Flow (vph) 2999 15 16 1287 16 1Confl. Peds. (#/hr) 3 3Heavy Vehicles (%) 4% 8% 0% 11% 0% 20%Turn Type NA Perm pm+pt NA Prot PermProtected Phases 2 1 6 8Permitted Phases 2 6 8Actuated Green, G (s) 95.7 95.7 102.4 102.4 5.0 5.0Effective Green, g (s) 95.7 95.7 102.4 102.4 5.0 5.0Actuated g/C Ratio 0.80 0.80 0.85 0.85 0.04 0.04Clearance Time (s) 6.0 6.0 4.0 6.0 6.6 6.6Vehicle Extension (s) 5.0 5.0 4.0 5.0 4.0 4.0Lane Grp Cap (vph) 2799 1173 105 2805 76 56v/s Ratio Prot c0.85 0.00 c0.39 c0.01v/s Ratio Perm 0.01 0.13 0.00v/c Ratio 1.07 0.01 0.15 0.46 0.21 0.01Uniform Delay, d1 12.1 2.5 39.8 2.1 55.6 55.1Progression Factor 0.89 1.08 1.00 1.00 1.00 1.00Incremental Delay, d2 33.0 0.0 0.9 0.5 1.9 0.1Delay (s) 43.8 2.7 40.7 2.7 57.5 55.2Level of Service D A D A E EApproach Delay (s) 43.6 3.1 56.4Approach LOS D A E
Intersection SummaryHCM 2000 Control Delay 31.6 HCM 2000 Level of Service CHCM 2000 Volume to Capacity ratio 1.02Actuated Cycle Length (s) 120.0 Sum of lost time (s) 16.6Intersection Capacity Utilization 92.6% ICU Level of Service FAnalysis Period (min) 15c Critical Lane Group

Lanes, Volumes, Timings 2020 PM Future Background Conditions 1: Proudfoot Trail & Dundas Street Graydon Banning
Graydon Banning 7/28/2015 2020 PM Future Background Conditions Synchro 9 ReportMC Page 1
Lane Group EBT EBR WBL WBT NBL NBRLane ConfigurationsTraffic Volume (vph) 1699 70 456 3137 102 183Future Volume (vph) 1699 70 456 3137 102 183Ideal Flow (vphpl) 1900 1900 1900 1900 1900 1900Storage Length (m) 70.0 120.0 0.0 0.0Storage Lanes 1 1 1 1Taper Length (m) 70.0 2.5Lane Util. Factor 0.95 1.00 1.00 0.95 1.00 1.00Ped Bike Factor 0.97Frt 0.850 0.850Flt Protected 0.950 0.950Satd. Flow (prot) 3476 1541 1825 3579 1825 1633Flt Permitted 0.063 0.950Satd. Flow (perm) 3476 1500 121 3579 1825 1633Right Turn on Red Yes YesSatd. Flow (RTOR) 55 187Link Speed (k/h) 60 60 50Link Distance (m) 373.6 424.7 186.0Travel Time (s) 22.4 25.5 13.4Confl. Peds. (#/hr) 2 2Peak Hour Factor 0.98 0.98 0.98 0.98 0.98 0.98Growth Factor 85% 100% 100% 85% 100% 100%Heavy Vehicles (%) 5% 6% 0% 2% 0% 0%Adj. Flow (vph) 1474 71 465 2721 104 187Shared Lane Traffic (%)Lane Group Flow (vph) 1474 71 465 2721 104 187Enter Blocked Intersection No No No No No NoLane Alignment Left Right Left Left Left RightMedian Width(m) 3.7 3.7 3.7Link Offset(m) 0.0 0.0 0.0Crosswalk Width(m) 1.6 1.6 1.6Two way Left Turn LaneHeadway Factor 0.99 0.99 0.99 0.99 0.99 0.99Turning Speed (k/h) 14 24 24 14Number of Detectors 2 1 1 2 1 1Detector Template Thru Right Left Thru Left RightLeading Detector (m) 30.5 6.1 6.1 30.5 6.1 6.1Trailing Detector (m) 0.0 0.0 0.0 0.0 0.0 0.0Detector 1 Position(m) 0.0 0.0 0.0 0.0 0.0 0.0Detector 1 Size(m) 1.8 6.1 6.1 1.8 6.1 6.1Detector 1 Type Cl+Ex Cl+Ex Cl+Ex Cl+Ex Cl+Ex Cl+ExDetector 1 ChannelDetector 1 Extend (s) 0.0 0.0 0.0 0.0 0.0 0.0Detector 1 Queue (s) 0.0 0.0 0.0 0.0 0.0 0.0Detector 1 Delay (s) 0.0 0.0 0.0 0.0 0.0 0.0Detector 2 Position(m) 28.7 28.7Detector 2 Size(m) 1.8 1.8Detector 2 Type Cl+Ex Cl+ExDetector 2 Channel

Lanes, Volumes, Timings 2020 PM Future Background Conditions 1: Proudfoot Trail & Dundas Street Graydon Banning
Graydon Banning 7/28/2015 2020 PM Future Background Conditions Synchro 9 ReportMC Page 2
Lane Group EBT EBR WBL WBT NBL NBRDetector 2 Extend (s) 0.0 0.0Turn Type NA Perm pm+pt NA Prot PermProtected Phases 2 1 6 8Permitted Phases 2 6 8Detector Phase 2 2 1 6 8 8Switch PhaseMinimum Initial (s) 5.0 5.0 5.0 5.0 5.0 5.0Minimum Split (s) 23.9 23.9 9.5 23.9 24.9 24.9Total Split (s) 64.4 64.4 30.7 95.1 24.9 24.9Total Split (%) 53.7% 53.7% 25.6% 79.3% 20.8% 20.8%Maximum Green (s) 58.5 58.5 26.7 89.2 18.0 18.0Yellow Time (s) 3.7 3.7 3.0 3.7 3.3 3.3All-Red Time (s) 2.2 2.2 1.0 2.2 3.6 3.6Lost Time Adjust (s) 0.0 0.0 0.0 0.0 0.0 0.0Total Lost Time (s) 5.9 5.9 4.0 5.9 6.9 6.9Lead/Lag Lag Lag LeadLead-Lag Optimize?Vehicle Extension (s) 5.5 5.5 3.0 5.5 5.0 5.0Recall Mode C-Max C-Max None C-Max None NoneWalk Time (s) 7.0 7.0 7.0 7.0 7.0Flash Dont Walk (s) 11.0 11.0 11.0 11.0 11.0Pedestrian Calls (#/hr) 0 0 0 0 0Act Effct Green (s) 59.8 59.8 95.2 93.3 13.9 13.9Actuated g/C Ratio 0.50 0.50 0.79 0.78 0.12 0.12v/c Ratio 0.85 0.09 0.90 0.98 0.49 0.53Control Delay 32.6 6.3 31.9 17.8 57.1 12.3Queue Delay 0.0 0.0 0.0 0.0 0.0 0.0Total Delay 32.6 6.3 31.9 17.8 57.1 12.3LOS C A C B E BApproach Delay 31.4 19.9 28.3Approach LOS C B CQueue Length 50th (m) 157.7 1.9 83.7 237.5 23.3 0.0Queue Length 95th (m) 191.2 9.5 m88.8 m#244.3 39.5 19.8Internal Link Dist (m) 349.6 400.7 162.0Turn Bay Length (m) 70.0 120.0Base Capacity (vph) 1732 775 514 2782 273 403Starvation Cap Reductn 0 0 0 0 0 0Spillback Cap Reductn 0 0 0 0 0 0Storage Cap Reductn 0 0 0 0 0 0Reduced v/c Ratio 0.85 0.09 0.90 0.98 0.38 0.46
Intersection SummaryArea Type: OtherCycle Length: 120Actuated Cycle Length: 120Offset: 62.4 (52%), Referenced to phase 2:EBT and 6:WBTL, Start of GreenNatural Cycle: 130Control Type: Actuated-CoordinatedMaximum v/c Ratio: 0.98

Lanes, Volumes, Timings 2020 PM Future Background Conditions 1: Proudfoot Trail & Dundas Street Graydon Banning
Graydon Banning 7/28/2015 2020 PM Future Background Conditions Synchro 9 ReportMC Page 3
Intersection Signal Delay: 23.9 Intersection LOS: CIntersection Capacity Utilization 90.0% ICU Level of Service EAnalysis Period (min) 15# 95th percentile volume exceeds capacity, queue may be longer. Queue shown is maximum after two cycles.m Volume for 95th percentile queue is metered by upstream signal.
Splits and Phases: 1: Proudfoot Trail & Dundas Street

HCM Signalized Intersection Capacity Analysis 2020 PM Future Background Conditions 1: Proudfoot Trail & Dundas Street Graydon Banning
Graydon Banning 7/28/2015 2020 PM Future Background Conditions Synchro 9 ReportMC Page 4
Movement EBT EBR WBL WBT NBL NBRLane ConfigurationsTraffic Volume (vph) 1699 70 456 3137 102 183Future Volume (vph) 1699 70 456 3137 102 183Ideal Flow (vphpl) 1900 1900 1900 1900 1900 1900Total Lost time (s) 5.9 5.9 4.0 5.9 6.9 6.9Lane Util. Factor 0.95 1.00 1.00 0.95 1.00 1.00Frpb, ped/bikes 1.00 0.97 1.00 1.00 1.00 1.00Flpb, ped/bikes 1.00 1.00 1.00 1.00 1.00 1.00Frt 1.00 0.85 1.00 1.00 1.00 0.85Flt Protected 1.00 1.00 0.95 1.00 0.95 1.00Satd. Flow (prot) 3476 1500 1825 3579 1825 1633Flt Permitted 1.00 1.00 0.06 1.00 0.95 1.00Satd. Flow (perm) 3476 1500 120 3579 1825 1633Peak-hour factor, PHF 0.98 0.98 0.98 0.98 0.98 0.98Growth Factor (vph) 85% 100% 100% 85% 100% 100%Adj. Flow (vph) 1474 71 465 2721 104 187RTOR Reduction (vph) 0 28 0 0 0 165Lane Group Flow (vph) 1474 43 465 2721 104 22Confl. Peds. (#/hr) 2 2Heavy Vehicles (%) 5% 6% 0% 2% 0% 0%Turn Type NA Perm pm+pt NA Prot PermProtected Phases 2 1 6 8Permitted Phases 2 6 8Actuated Green, G (s) 59.8 59.8 93.3 93.3 13.9 13.9Effective Green, g (s) 59.8 59.8 93.3 93.3 13.9 13.9Actuated g/C Ratio 0.50 0.50 0.78 0.78 0.12 0.12Clearance Time (s) 5.9 5.9 4.0 5.9 6.9 6.9Vehicle Extension (s) 5.5 5.5 3.0 5.5 5.0 5.0Lane Grp Cap (vph) 1732 747 512 2782 211 189v/s Ratio Prot 0.42 0.22 c0.76 c0.06v/s Ratio Perm 0.03 0.48 0.01v/c Ratio 0.85 0.06 0.91 0.98 0.49 0.11Uniform Delay, d1 26.2 15.6 36.9 12.4 49.7 47.5Progression Factor 1.00 1.00 0.82 1.18 1.00 1.00Incremental Delay, d2 5.5 0.1 2.5 2.1 3.8 0.6Delay (s) 31.7 15.7 32.8 16.8 53.5 48.1Level of Service C B C B D DApproach Delay (s) 31.0 19.1 50.0Approach LOS C B D
Intersection SummaryHCM 2000 Control Delay 24.6 HCM 2000 Level of Service CHCM 2000 Volume to Capacity ratio 0.95Actuated Cycle Length (s) 120.0 Sum of lost time (s) 16.8Intersection Capacity Utilization 90.0% ICU Level of Service EAnalysis Period (min) 15c Critical Lane Group

Lanes, Volumes, Timings 2020 PM Future Background Conditions 2: Fourth Line & Dundas Street Graydon Banning
Graydon Banning 7/28/2015 2020 PM Future Background Conditions Synchro 9 ReportMC Page 5
Lane Group EBT EBR WBL WBT NBL NBRLane ConfigurationsTraffic Volume (vph) 1867 15 15 3578 15 15Future Volume (vph) 1867 15 15 3578 15 15Ideal Flow (vphpl) 1900 1900 1900 1900 1900 1900Storage Length (m) 70.0 120.0 0.0 0.0Storage Lanes 1 1 1 1Taper Length (m) 70.0 2.5Lane Util. Factor 0.95 1.00 1.00 0.95 1.00 1.00Ped Bike Factor 0.97Frt 0.850 0.850Flt Protected 0.950 0.950Satd. Flow (prot) 3476 1633 1825 3579 1825 1633Flt Permitted 0.112 0.950Satd. Flow (perm) 3476 1590 215 3579 1825 1633Right Turn on Red Yes YesSatd. Flow (RTOR) 11 16Link Speed (k/h) 60 60 50Link Distance (m) 424.7 312.9 64.1Travel Time (s) 25.5 18.8 4.6Confl. Peds. (#/hr) 3 3Peak Hour Factor 0.94 0.94 0.94 0.94 0.94 0.94Growth Factor 85% 100% 100% 85% 100% 100%Heavy Vehicles (%) 5% 0% 0% 2% 0% 0%Adj. Flow (vph) 1688 16 16 3235 16 16Shared Lane Traffic (%)Lane Group Flow (vph) 1688 16 16 3235 16 16Enter Blocked Intersection No No No No No NoLane Alignment Left Right Left Left Left RightMedian Width(m) 3.7 3.7 3.7Link Offset(m) 0.0 0.0 0.0Crosswalk Width(m) 1.6 1.6 1.6Two way Left Turn LaneHeadway Factor 0.99 0.99 0.99 0.99 0.99 0.99Turning Speed (k/h) 14 24 24 14Number of Detectors 2 1 1 2 1 1Detector Template Thru Right Left Thru Left RightLeading Detector (m) 30.5 6.1 6.1 30.5 6.1 6.1Trailing Detector (m) 0.0 0.0 0.0 0.0 0.0 0.0Detector 1 Position(m) 0.0 0.0 0.0 0.0 0.0 0.0Detector 1 Size(m) 1.8 6.1 6.1 1.8 6.1 6.1Detector 1 Type Cl+Ex Cl+Ex Cl+Ex Cl+Ex Cl+Ex Cl+ExDetector 1 ChannelDetector 1 Extend (s) 0.0 0.0 0.0 0.0 0.0 0.0Detector 1 Queue (s) 0.0 0.0 0.0 0.0 0.0 0.0Detector 1 Delay (s) 0.0 0.0 0.0 0.0 0.0 0.0Detector 2 Position(m) 28.7 28.7Detector 2 Size(m) 1.8 1.8Detector 2 Type Cl+Ex Cl+ExDetector 2 Channel

Lanes, Volumes, Timings 2020 PM Future Background Conditions 2: Fourth Line & Dundas Street Graydon Banning
Graydon Banning 7/28/2015 2020 PM Future Background Conditions Synchro 9 ReportMC Page 6
Lane Group EBT EBR WBL WBT NBL NBRDetector 2 Extend (s) 0.0 0.0Turn Type NA Perm pm+pt NA Prot PermProtected Phases 2 1 6 8Permitted Phases 2 6 8Detector Phase 2 2 1 6 8 8Switch PhaseMinimum Initial (s) 5.0 5.0 5.0 5.0 5.0 5.0Minimum Split (s) 33.0 33.0 9.5 24.0 40.6 40.6Total Split (s) 63.6 63.6 13.4 77.0 43.0 43.0Total Split (%) 53.0% 53.0% 11.2% 64.2% 35.8% 35.8%Maximum Green (s) 57.6 57.6 9.4 71.0 36.4 36.4Yellow Time (s) 3.7 3.7 3.0 3.7 3.7 3.7All-Red Time (s) 2.3 2.3 1.0 2.3 2.9 2.9Lost Time Adjust (s) 0.0 0.0 0.0 0.0 0.0 0.0Total Lost Time (s) 6.0 6.0 4.0 6.0 6.6 6.6Lead/Lag Lag Lag LeadLead-Lag Optimize? Yes Yes YesVehicle Extension (s) 5.0 5.0 4.0 5.0 4.0 4.0Recall Mode C-Max C-Max None C-Max None NoneWalk Time (s) 7.0 7.0 7.0 7.0 7.0Flash Dont Walk (s) 20.0 20.0 7.0 27.0 27.0Pedestrian Calls (#/hr) 0 0 0 0 0Act Effct Green (s) 103.1 103.1 107.0 107.4 7.6 7.6Actuated g/C Ratio 0.86 0.86 0.89 0.90 0.06 0.06v/c Ratio 0.57 0.01 0.06 1.01 0.14 0.13Control Delay 1.9 0.0 1.9 29.1 55.1 25.0Queue Delay 0.0 0.0 0.0 0.0 0.0 0.0Total Delay 1.9 0.0 1.9 29.1 55.1 25.0LOS A A A C E CApproach Delay 1.9 29.0 40.1Approach LOS A C DQueue Length 50th (m) 9.2 0.0 0.4 ~450.1 3.6 0.0Queue Length 95th (m) 6.5 m0.0 1.4 #492.3 10.7 7.0Internal Link Dist (m) 400.7 288.9 40.1Turn Bay Length (m) 70.0 120.0Base Capacity (vph) 2987 1368 317 3204 553 506Starvation Cap Reductn 0 0 0 0 0 0Spillback Cap Reductn 0 0 0 0 0 0Storage Cap Reductn 0 0 0 0 0 0Reduced v/c Ratio 0.57 0.01 0.05 1.01 0.03 0.03
Intersection SummaryArea Type: OtherCycle Length: 120Actuated Cycle Length: 120Offset: 103.2 (86%), Referenced to phase 2:EBT and 6:WBTL, Start of GreenNatural Cycle: 145Control Type: Actuated-CoordinatedMaximum v/c Ratio: 1.01

Lanes, Volumes, Timings 2020 PM Future Background Conditions 2: Fourth Line & Dundas Street Graydon Banning
Graydon Banning 7/28/2015 2020 PM Future Background Conditions Synchro 9 ReportMC Page 7
Intersection Signal Delay: 19.8 Intersection LOS: BIntersection Capacity Utilization 98.7% ICU Level of Service FAnalysis Period (min) 15~ Volume exceeds capacity, queue is theoretically infinite. Queue shown is maximum after two cycles.# 95th percentile volume exceeds capacity, queue may be longer. Queue shown is maximum after two cycles.m Volume for 95th percentile queue is metered by upstream signal.
Splits and Phases: 2: Fourth Line & Dundas Street

HCM Signalized Intersection Capacity Analysis 2020 PM Future Background Conditions 2: Fourth Line & Dundas Street Graydon Banning
Graydon Banning 7/28/2015 2020 PM Future Background Conditions Synchro 9 ReportMC Page 8
Movement EBT EBR WBL WBT NBL NBRLane ConfigurationsTraffic Volume (vph) 1867 15 15 3578 15 15Future Volume (vph) 1867 15 15 3578 15 15Ideal Flow (vphpl) 1900 1900 1900 1900 1900 1900Total Lost time (s) 6.0 6.0 4.0 6.0 6.6 6.6Lane Util. Factor 0.95 1.00 1.00 0.95 1.00 1.00Frpb, ped/bikes 1.00 0.97 1.00 1.00 1.00 1.00Flpb, ped/bikes 1.00 1.00 1.00 1.00 1.00 1.00Frt 1.00 0.85 1.00 1.00 1.00 0.85Flt Protected 1.00 1.00 0.95 1.00 0.95 1.00Satd. Flow (prot) 3476 1590 1825 3579 1825 1633Flt Permitted 1.00 1.00 0.11 1.00 0.95 1.00Satd. Flow (perm) 3476 1590 215 3579 1825 1633Peak-hour factor, PHF 0.94 0.94 0.94 0.94 0.94 0.94Growth Factor (vph) 85% 100% 100% 85% 100% 100%Adj. Flow (vph) 1688 16 16 3235 16 16RTOR Reduction (vph) 0 2 0 0 0 15Lane Group Flow (vph) 1688 14 16 3235 16 1Confl. Peds. (#/hr) 3 3Heavy Vehicles (%) 5% 0% 0% 2% 0% 0%Turn Type NA Perm pm+pt NA Prot PermProtected Phases 2 1 6 8Permitted Phases 2 6 8Actuated Green, G (s) 95.7 95.7 102.4 102.4 5.0 5.0Effective Green, g (s) 95.7 95.7 102.4 102.4 5.0 5.0Actuated g/C Ratio 0.80 0.80 0.85 0.85 0.04 0.04Clearance Time (s) 6.0 6.0 4.0 6.0 6.6 6.6Vehicle Extension (s) 5.0 5.0 4.0 5.0 4.0 4.0Lane Grp Cap (vph) 2772 1268 219 3054 76 68v/s Ratio Prot 0.49 0.00 c0.90 c0.01v/s Ratio Perm 0.01 0.06 0.00v/c Ratio 0.61 0.01 0.07 1.06 0.21 0.01Uniform Delay, d1 4.8 2.5 3.4 8.8 55.6 55.1Progression Factor 0.29 0.00 1.00 1.00 1.00 1.00Incremental Delay, d2 0.6 0.0 0.2 34.8 1.9 0.1Delay (s) 2.0 0.0 3.6 43.6 57.5 55.2Level of Service A A A D E EApproach Delay (s) 2.0 43.4 56.3Approach LOS A D E
Intersection SummaryHCM 2000 Control Delay 29.3 HCM 2000 Level of Service CHCM 2000 Volume to Capacity ratio 1.06Actuated Cycle Length (s) 120.0 Sum of lost time (s) 16.6Intersection Capacity Utilization 98.7% ICU Level of Service FAnalysis Period (min) 15c Critical Lane Group

Lanes, Volumes, Timings 2025 AM Future Background Conditions 1: Proudfoot Trail & Dundas Street Graydon Banning
Graydon Banning 7/28/2015 2025 AM Future Background Conditions Synchro 9 ReportMC Page 1
Lane Group EBT EBR WBL WBT NBL NBRLane ConfigurationsTraffic Volume (vph) 3059 67 76 1552 80 450Future Volume (vph) 3059 67 76 1552 80 450Ideal Flow (vphpl) 1900 1900 1900 1900 1900 1900Storage Length (m) 70.0 120.0 0.0 0.0Storage Lanes 1 1 1 1Taper Length (m) 70.0 2.5Lane Util. Factor 0.95 1.00 1.00 0.95 1.00 1.00Ped Bike Factor 0.98 0.99Frt 0.850 0.850Flt Protected 0.950 0.950Satd. Flow (prot) 3444 1498 1789 3230 1755 1633Flt Permitted 0.051 0.950Satd. Flow (perm) 3444 1463 96 3230 1755 1610Right Turn on Red Yes YesSatd. Flow (RTOR) 39 78Link Speed (k/h) 60 60 50Link Distance (m) 373.6 424.7 186.0Travel Time (s) 22.4 25.5 13.4Confl. Peds. (#/hr) 1 1 1Peak Hour Factor 0.97 0.97 0.97 0.97 0.97 0.97Growth Factor 85% 100% 100% 85% 100% 100%Heavy Vehicles (%) 6% 9% 2% 13% 4% 0%Adj. Flow (vph) 2681 69 78 1360 82 464Shared Lane Traffic (%)Lane Group Flow (vph) 2681 69 78 1360 82 464Enter Blocked Intersection No No No No No NoLane Alignment Left Right Left Left Left RightMedian Width(m) 3.7 3.7 3.7Link Offset(m) 0.0 0.0 0.0Crosswalk Width(m) 1.6 1.6 1.6Two way Left Turn LaneHeadway Factor 0.99 0.99 0.99 0.99 0.99 0.99Turning Speed (k/h) 14 24 24 14Number of Detectors 2 1 1 2 1 1Detector Template Thru Right Left Thru Left RightLeading Detector (m) 30.5 6.1 6.1 30.5 6.1 6.1Trailing Detector (m) 0.0 0.0 0.0 0.0 0.0 0.0Detector 1 Position(m) 0.0 0.0 0.0 0.0 0.0 0.0Detector 1 Size(m) 1.8 6.1 6.1 1.8 6.1 6.1Detector 1 Type Cl+Ex Cl+Ex Cl+Ex Cl+Ex Cl+Ex Cl+ExDetector 1 ChannelDetector 1 Extend (s) 0.0 0.0 0.0 0.0 0.0 0.0Detector 1 Queue (s) 0.0 0.0 0.0 0.0 0.0 0.0Detector 1 Delay (s) 0.0 0.0 0.0 0.0 0.0 0.0Detector 2 Position(m) 28.7 28.7Detector 2 Size(m) 1.8 1.8Detector 2 Type Cl+Ex Cl+ExDetector 2 Channel

Lanes, Volumes, Timings 2025 AM Future Background Conditions 1: Proudfoot Trail & Dundas Street Graydon Banning
Graydon Banning 7/28/2015 2025 AM Future Background Conditions Synchro 9 ReportMC Page 2
Lane Group EBT EBR WBL WBT NBL NBRDetector 2 Extend (s) 0.0 0.0Turn Type NA Perm pm+pt NA Prot PermProtected Phases 2 1 6 8Permitted Phases 2 6 8Detector Phase 2 2 1 6 8 8Switch PhaseMinimum Initial (s) 5.0 5.0 5.0 5.0 5.0 5.0Minimum Split (s) 23.9 23.9 9.5 23.9 24.9 24.9Total Split (s) 79.5 79.5 9.5 89.0 31.0 31.0Total Split (%) 66.3% 66.3% 7.9% 74.2% 25.8% 25.8%Maximum Green (s) 73.6 73.6 5.5 83.1 24.1 24.1Yellow Time (s) 3.7 3.7 3.0 3.7 3.3 3.3All-Red Time (s) 2.2 2.2 1.0 2.2 3.6 3.6Lost Time Adjust (s) 0.0 0.0 0.0 0.0 0.0 0.0Total Lost Time (s) 5.9 5.9 4.0 5.9 6.9 6.9Lead/Lag Lag Lag LeadLead-Lag Optimize?Vehicle Extension (s) 5.5 5.5 3.0 5.5 5.0 5.0Recall Mode C-Max C-Max None C-Max None NoneWalk Time (s) 7.0 7.0 7.0 7.0 7.0Flash Dont Walk (s) 11.0 11.0 11.0 11.0 11.0Pedestrian Calls (#/hr) 0 0 0 0 0Act Effct Green (s) 75.5 75.5 85.0 83.1 24.1 24.1Actuated g/C Ratio 0.63 0.63 0.71 0.69 0.20 0.20v/c Ratio 1.24 0.07 0.54 0.61 0.23 1.21Control Delay 134.8 5.0 33.3 9.8 42.3 149.3Queue Delay 0.0 0.0 0.0 0.0 0.0 0.0Total Delay 134.8 5.0 33.3 9.8 42.3 149.3LOS F A C A D FApproach Delay 131.6 11.0 133.3Approach LOS F B FQueue Length 50th (m) ~419.0 2.6 5.6 59.6 16.3 ~117.7Queue Length 95th (m) #458.2 8.3 22.8 66.7 30.7 #181.5Internal Link Dist (m) 349.6 400.7 162.0Turn Bay Length (m) 70.0 120.0Base Capacity (vph) 2166 935 145 2236 352 385Starvation Cap Reductn 0 0 0 0 0 0Spillback Cap Reductn 0 0 0 0 0 0Storage Cap Reductn 0 0 0 0 0 0Reduced v/c Ratio 1.24 0.07 0.54 0.61 0.23 1.21
Intersection SummaryArea Type: OtherCycle Length: 120Actuated Cycle Length: 120Offset: 80.4 (67%), Referenced to phase 2:EBT and 6:WBTL, Start of GreenNatural Cycle: 150Control Type: Actuated-CoordinatedMaximum v/c Ratio: 1.24

Lanes, Volumes, Timings 2025 AM Future Background Conditions 1: Proudfoot Trail & Dundas Street Graydon Banning
Graydon Banning 7/28/2015 2025 AM Future Background Conditions Synchro 9 ReportMC Page 3
Intersection Signal Delay: 95.2 Intersection LOS: FIntersection Capacity Utilization 110.5% ICU Level of Service HAnalysis Period (min) 15~ Volume exceeds capacity, queue is theoretically infinite. Queue shown is maximum after two cycles.# 95th percentile volume exceeds capacity, queue may be longer. Queue shown is maximum after two cycles.
Splits and Phases: 1: Proudfoot Trail & Dundas Street

HCM Signalized Intersection Capacity Analysis 2025 AM Future Background Conditions 1: Proudfoot Trail & Dundas Street Graydon Banning
Graydon Banning 7/28/2015 2025 AM Future Background Conditions Synchro 9 ReportMC Page 4
Movement EBT EBR WBL WBT NBL NBRLane ConfigurationsTraffic Volume (vph) 3059 67 76 1552 80 450Future Volume (vph) 3059 67 76 1552 80 450Ideal Flow (vphpl) 1900 1900 1900 1900 1900 1900Total Lost time (s) 5.9 5.9 4.0 5.9 6.9 6.9Lane Util. Factor 0.95 1.00 1.00 0.95 1.00 1.00Frpb, ped/bikes 1.00 0.98 1.00 1.00 1.00 0.99Flpb, ped/bikes 1.00 1.00 1.00 1.00 1.00 1.00Frt 1.00 0.85 1.00 1.00 1.00 0.85Flt Protected 1.00 1.00 0.95 1.00 0.95 1.00Satd. Flow (prot) 3444 1463 1789 3230 1755 1610Flt Permitted 1.00 1.00 0.05 1.00 0.95 1.00Satd. Flow (perm) 3444 1463 96 3230 1755 1610Peak-hour factor, PHF 0.97 0.97 0.97 0.97 0.97 0.97Growth Factor (vph) 85% 100% 100% 85% 100% 100%Adj. Flow (vph) 2681 69 78 1360 82 464RTOR Reduction (vph) 0 15 0 0 0 62Lane Group Flow (vph) 2681 54 78 1360 82 402Confl. Peds. (#/hr) 1 1 1Heavy Vehicles (%) 6% 9% 2% 13% 4% 0%Turn Type NA Perm pm+pt NA Prot PermProtected Phases 2 1 6 8Permitted Phases 2 6 8Actuated Green, G (s) 74.7 74.7 83.1 83.1 24.1 24.1Effective Green, g (s) 74.7 74.7 83.1 83.1 24.1 24.1Actuated g/C Ratio 0.62 0.62 0.69 0.69 0.20 0.20Clearance Time (s) 5.9 5.9 4.0 5.9 6.9 6.9Vehicle Extension (s) 5.5 5.5 3.0 5.5 5.0 5.0Lane Grp Cap (vph) 2143 910 128 2236 352 323v/s Ratio Prot c0.78 0.02 c0.42 0.05v/s Ratio Perm 0.04 0.40 c0.25v/c Ratio 1.25 0.06 0.61 0.61 0.23 1.24Uniform Delay, d1 22.6 8.9 30.2 9.8 40.2 48.0Progression Factor 1.00 1.00 1.74 0.87 1.00 1.00Incremental Delay, d2 117.0 0.1 7.1 1.1 0.7 133.0Delay (s) 139.7 9.0 59.6 9.6 40.9 181.0Level of Service F A E A D FApproach Delay (s) 136.4 12.3 159.9Approach LOS F B F
Intersection SummaryHCM 2000 Control Delay 101.4 HCM 2000 Level of Service FHCM 2000 Volume to Capacity ratio 1.23Actuated Cycle Length (s) 120.0 Sum of lost time (s) 16.8Intersection Capacity Utilization 110.5% ICU Level of Service HAnalysis Period (min) 15c Critical Lane Group

Lanes, Volumes, Timings 2025 AM Future Background Conditions 2: Fourth Line & Dundas Street Graydon Banning
Graydon Banning 7/28/2015 2025 AM Future Background Conditions Synchro 9 ReportMC Page 5
Lane Group EBT EBR WBL WBT NBL NBRLane ConfigurationsTraffic Volume (vph) 3494 15 15 1613 15 15Future Volume (vph) 3494 15 15 1613 15 15Ideal Flow (vphpl) 1900 1900 1900 1900 1900 1900Storage Length (m) 70.0 120.0 0.0 0.0Storage Lanes 1 1 1 1Taper Length (m) 70.0 2.5Lane Util. Factor 0.95 1.00 1.00 0.95 1.00 1.00Ped Bike Factor 0.97Frt 0.850 0.850Flt Protected 0.950 0.950Satd. Flow (prot) 3510 1512 1825 3288 1825 1361Flt Permitted 0.040 0.950Satd. Flow (perm) 3510 1472 77 3288 1825 1361Right Turn on Red Yes YesSatd. Flow (RTOR) 6 16Link Speed (k/h) 60 60 50Link Distance (m) 424.7 312.9 64.1Travel Time (s) 25.5 18.8 4.6Confl. Peds. (#/hr) 3 3Peak Hour Factor 0.94 0.94 0.94 0.94 0.94 0.94Growth Factor 85% 100% 100% 85% 100% 100%Heavy Vehicles (%) 4% 8% 0% 11% 0% 20%Adj. Flow (vph) 3159 16 16 1459 16 16Shared Lane Traffic (%)Lane Group Flow (vph) 3159 16 16 1459 16 16Enter Blocked Intersection No No No No No NoLane Alignment Left Right Left Left Left RightMedian Width(m) 3.7 3.7 3.7Link Offset(m) 0.0 0.0 0.0Crosswalk Width(m) 1.6 1.6 1.6Two way Left Turn LaneHeadway Factor 0.99 0.99 0.99 0.99 0.99 0.99Turning Speed (k/h) 14 24 24 14Number of Detectors 2 1 1 2 1 1Detector Template Thru Right Left Thru Left RightLeading Detector (m) 30.5 6.1 6.1 30.5 6.1 6.1Trailing Detector (m) 0.0 0.0 0.0 0.0 0.0 0.0Detector 1 Position(m) 0.0 0.0 0.0 0.0 0.0 0.0Detector 1 Size(m) 1.8 6.1 6.1 1.8 6.1 6.1Detector 1 Type Cl+Ex Cl+Ex Cl+Ex Cl+Ex Cl+Ex Cl+ExDetector 1 ChannelDetector 1 Extend (s) 0.0 0.0 0.0 0.0 0.0 0.0Detector 1 Queue (s) 0.0 0.0 0.0 0.0 0.0 0.0Detector 1 Delay (s) 0.0 0.0 0.0 0.0 0.0 0.0Detector 2 Position(m) 28.7 28.7Detector 2 Size(m) 1.8 1.8Detector 2 Type Cl+Ex Cl+ExDetector 2 Channel
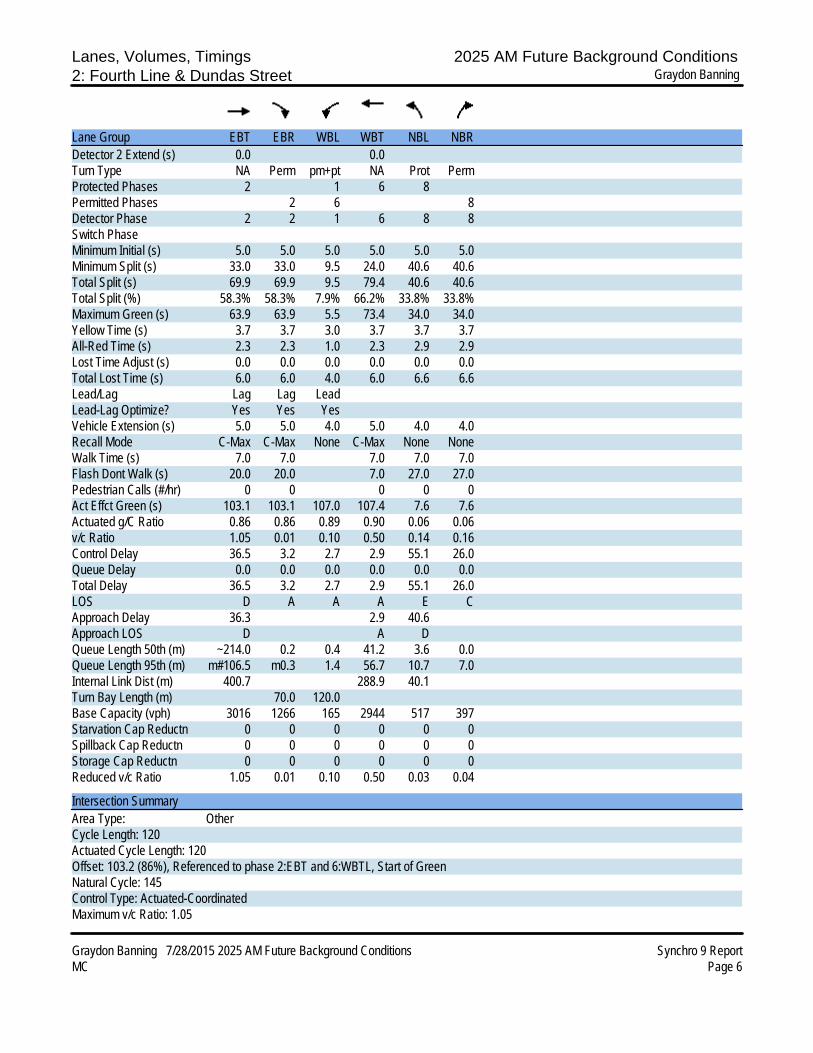
Lanes, Volumes, Timings 2025 AM Future Background Conditions 2: Fourth Line & Dundas Street Graydon Banning
Graydon Banning 7/28/2015 2025 AM Future Background Conditions Synchro 9 ReportMC Page 6
Lane Group EBT EBR WBL WBT NBL NBRDetector 2 Extend (s) 0.0 0.0Turn Type NA Perm pm+pt NA Prot PermProtected Phases 2 1 6 8Permitted Phases 2 6 8Detector Phase 2 2 1 6 8 8Switch PhaseMinimum Initial (s) 5.0 5.0 5.0 5.0 5.0 5.0Minimum Split (s) 33.0 33.0 9.5 24.0 40.6 40.6Total Split (s) 69.9 69.9 9.5 79.4 40.6 40.6Total Split (%) 58.3% 58.3% 7.9% 66.2% 33.8% 33.8%Maximum Green (s) 63.9 63.9 5.5 73.4 34.0 34.0Yellow Time (s) 3.7 3.7 3.0 3.7 3.7 3.7All-Red Time (s) 2.3 2.3 1.0 2.3 2.9 2.9Lost Time Adjust (s) 0.0 0.0 0.0 0.0 0.0 0.0Total Lost Time (s) 6.0 6.0 4.0 6.0 6.6 6.6Lead/Lag Lag Lag LeadLead-Lag Optimize? Yes Yes YesVehicle Extension (s) 5.0 5.0 4.0 5.0 4.0 4.0Recall Mode C-Max C-Max None C-Max None NoneWalk Time (s) 7.0 7.0 7.0 7.0 7.0Flash Dont Walk (s) 20.0 20.0 7.0 27.0 27.0Pedestrian Calls (#/hr) 0 0 0 0 0Act Effct Green (s) 103.1 103.1 107.0 107.4 7.6 7.6Actuated g/C Ratio 0.86 0.86 0.89 0.90 0.06 0.06v/c Ratio 1.05 0.01 0.10 0.50 0.14 0.16Control Delay 36.5 3.2 2.7 2.9 55.1 26.0Queue Delay 0.0 0.0 0.0 0.0 0.0 0.0Total Delay 36.5 3.2 2.7 2.9 55.1 26.0LOS D A A A E CApproach Delay 36.3 2.9 40.6Approach LOS D A DQueue Length 50th (m) ~214.0 0.2 0.4 41.2 3.6 0.0Queue Length 95th (m) m#106.5 m0.3 1.4 56.7 10.7 7.0Internal Link Dist (m) 400.7 288.9 40.1Turn Bay Length (m) 70.0 120.0Base Capacity (vph) 3016 1266 165 2944 517 397Starvation Cap Reductn 0 0 0 0 0 0Spillback Cap Reductn 0 0 0 0 0 0Storage Cap Reductn 0 0 0 0 0 0Reduced v/c Ratio 1.05 0.01 0.10 0.50 0.03 0.04
Intersection SummaryArea Type: OtherCycle Length: 120Actuated Cycle Length: 120Offset: 103.2 (86%), Referenced to phase 2:EBT and 6:WBTL, Start of GreenNatural Cycle: 145Control Type: Actuated-CoordinatedMaximum v/c Ratio: 1.05

Lanes, Volumes, Timings 2025 AM Future Background Conditions 2: Fourth Line & Dundas Street Graydon Banning
Graydon Banning 7/28/2015 2025 AM Future Background Conditions Synchro 9 ReportMC Page 7
Intersection Signal Delay: 25.8 Intersection LOS: CIntersection Capacity Utilization 96.8% ICU Level of Service FAnalysis Period (min) 15~ Volume exceeds capacity, queue is theoretically infinite. Queue shown is maximum after two cycles.# 95th percentile volume exceeds capacity, queue may be longer. Queue shown is maximum after two cycles.m Volume for 95th percentile queue is metered by upstream signal.
Splits and Phases: 2: Fourth Line & Dundas Street

HCM Signalized Intersection Capacity Analysis 2025 AM Future Background Conditions 2: Fourth Line & Dundas Street Graydon Banning
Graydon Banning 7/28/2015 2025 AM Future Background Conditions Synchro 9 ReportMC Page 8
Movement EBT EBR WBL WBT NBL NBRLane ConfigurationsTraffic Volume (vph) 3494 15 15 1613 15 15Future Volume (vph) 3494 15 15 1613 15 15Ideal Flow (vphpl) 1900 1900 1900 1900 1900 1900Total Lost time (s) 6.0 6.0 4.0 6.0 6.6 6.6Lane Util. Factor 0.95 1.00 1.00 0.95 1.00 1.00Frpb, ped/bikes 1.00 0.97 1.00 1.00 1.00 1.00Flpb, ped/bikes 1.00 1.00 1.00 1.00 1.00 1.00Frt 1.00 0.85 1.00 1.00 1.00 0.85Flt Protected 1.00 1.00 0.95 1.00 0.95 1.00Satd. Flow (prot) 3510 1472 1825 3288 1825 1361Flt Permitted 1.00 1.00 0.04 1.00 0.95 1.00Satd. Flow (perm) 3510 1472 77 3288 1825 1361Peak-hour factor, PHF 0.94 0.94 0.94 0.94 0.94 0.94Growth Factor (vph) 85% 100% 100% 85% 100% 100%Adj. Flow (vph) 3159 16 16 1459 16 16RTOR Reduction (vph) 0 1 0 0 0 15Lane Group Flow (vph) 3159 15 16 1459 16 1Confl. Peds. (#/hr) 3 3Heavy Vehicles (%) 4% 8% 0% 11% 0% 20%Turn Type NA Perm pm+pt NA Prot PermProtected Phases 2 1 6 8Permitted Phases 2 6 8Actuated Green, G (s) 95.7 95.7 102.4 102.4 5.0 5.0Effective Green, g (s) 95.7 95.7 102.4 102.4 5.0 5.0Actuated g/C Ratio 0.80 0.80 0.85 0.85 0.04 0.04Clearance Time (s) 6.0 6.0 4.0 6.0 6.6 6.6Vehicle Extension (s) 5.0 5.0 4.0 5.0 4.0 4.0Lane Grp Cap (vph) 2799 1173 105 2805 76 56v/s Ratio Prot c0.90 0.00 c0.44 c0.01v/s Ratio Perm 0.01 0.13 0.00v/c Ratio 1.13 0.01 0.15 0.52 0.21 0.01Uniform Delay, d1 12.1 2.5 39.8 2.3 55.6 55.1Progression Factor 1.01 1.03 1.00 1.00 1.00 1.00Incremental Delay, d2 58.4 0.0 0.9 0.7 1.9 0.1Delay (s) 70.7 2.6 40.7 3.0 57.5 55.2Level of Service E A D A E EApproach Delay (s) 70.3 3.4 56.4Approach LOS E A E
Intersection SummaryHCM 2000 Control Delay 49.2 HCM 2000 Level of Service DHCM 2000 Volume to Capacity ratio 1.08Actuated Cycle Length (s) 120.0 Sum of lost time (s) 16.6Intersection Capacity Utilization 96.8% ICU Level of Service FAnalysis Period (min) 15c Critical Lane Group

Lanes, Volumes, Timings 2025 PM Future Background Conditions 1: Proudfoot Trail & Dundas Street Graydon Banning
Graydon Banning 7/28/2015 2025 PM Future Background Conditions Synchro 9 ReportMC Page 1
Lane Group EBT EBR WBL WBT NBL NBRLane ConfigurationsTraffic Volume (vph) 1930 78 528 3619 116 212Future Volume (vph) 1930 78 528 3619 116 212Ideal Flow (vphpl) 1900 1900 1900 1900 1900 1900Storage Length (m) 70.0 120.0 0.0 0.0Storage Lanes 1 1 1 1Taper Length (m) 70.0 2.5Lane Util. Factor 0.95 1.00 1.00 0.95 1.00 1.00Ped Bike Factor 0.97Frt 0.850 0.850Flt Protected 0.950 0.950Satd. Flow (prot) 3476 1541 1825 3579 1825 1633Flt Permitted 0.065 0.950Satd. Flow (perm) 3476 1500 125 3579 1825 1633Right Turn on Red Yes YesSatd. Flow (RTOR) 53 216Link Speed (k/h) 60 60 50Link Distance (m) 373.6 424.7 186.0Travel Time (s) 22.4 25.5 13.4Confl. Peds. (#/hr) 2 2Peak Hour Factor 0.98 0.98 0.98 0.98 0.98 0.98Growth Factor 85% 100% 100% 85% 100% 100%Heavy Vehicles (%) 5% 6% 0% 2% 0% 0%Adj. Flow (vph) 1674 80 539 3139 118 216Shared Lane Traffic (%)Lane Group Flow (vph) 1674 80 539 3139 118 216Enter Blocked Intersection No No No No No NoLane Alignment Left Right Left Left Left RightMedian Width(m) 3.7 3.7 3.7Link Offset(m) 0.0 0.0 0.0Crosswalk Width(m) 1.6 1.6 1.6Two way Left Turn LaneHeadway Factor 0.99 0.99 0.99 0.99 0.99 0.99Turning Speed (k/h) 14 24 24 14Number of Detectors 2 1 1 2 1 1Detector Template Thru Right Left Thru Left RightLeading Detector (m) 30.5 6.1 6.1 30.5 6.1 6.1Trailing Detector (m) 0.0 0.0 0.0 0.0 0.0 0.0Detector 1 Position(m) 0.0 0.0 0.0 0.0 0.0 0.0Detector 1 Size(m) 1.8 6.1 6.1 1.8 6.1 6.1Detector 1 Type Cl+Ex Cl+Ex Cl+Ex Cl+Ex Cl+Ex Cl+ExDetector 1 ChannelDetector 1 Extend (s) 0.0 0.0 0.0 0.0 0.0 0.0Detector 1 Queue (s) 0.0 0.0 0.0 0.0 0.0 0.0Detector 1 Delay (s) 0.0 0.0 0.0 0.0 0.0 0.0Detector 2 Position(m) 28.7 28.7Detector 2 Size(m) 1.8 1.8Detector 2 Type Cl+Ex Cl+ExDetector 2 Channel

Lanes, Volumes, Timings 2025 PM Future Background Conditions 1: Proudfoot Trail & Dundas Street Graydon Banning
Graydon Banning 7/28/2015 2025 PM Future Background Conditions Synchro 9 ReportMC Page 2
Lane Group EBT EBR WBL WBT NBL NBRDetector 2 Extend (s) 0.0 0.0Turn Type NA Perm pm+pt NA Prot PermProtected Phases 2 1 6 8Permitted Phases 2 6 8Detector Phase 2 2 1 6 8 8Switch PhaseMinimum Initial (s) 5.0 5.0 5.0 5.0 5.0 5.0Minimum Split (s) 23.9 23.9 9.5 23.9 24.9 24.9Total Split (s) 63.5 63.5 31.6 95.1 24.9 24.9Total Split (%) 52.9% 52.9% 26.3% 79.3% 20.8% 20.8%Maximum Green (s) 57.6 57.6 27.6 89.2 18.0 18.0Yellow Time (s) 3.7 3.7 3.0 3.7 3.3 3.3All-Red Time (s) 2.2 2.2 1.0 2.2 3.6 3.6Lost Time Adjust (s) 0.0 0.0 0.0 0.0 0.0 0.0Total Lost Time (s) 5.9 5.9 4.0 5.9 6.9 6.9Lead/Lag Lag Lag LeadLead-Lag Optimize?Vehicle Extension (s) 5.5 5.5 3.0 5.5 5.0 5.0Recall Mode C-Max C-Max None C-Max None NoneWalk Time (s) 7.0 7.0 7.0 7.0 7.0Flash Dont Walk (s) 11.0 11.0 11.0 11.0 11.0Pedestrian Calls (#/hr) 0 0 0 0 0Act Effct Green (s) 57.6 57.6 94.5 92.6 14.6 14.6Actuated g/C Ratio 0.48 0.48 0.79 0.77 0.12 0.12v/c Ratio 1.00 0.11 1.00 1.14 0.53 0.56Control Delay 54.4 7.6 43.5 80.3 58.0 11.9Queue Delay 0.0 0.0 0.0 0.0 0.0 0.0Total Delay 54.4 7.6 43.5 80.3 58.0 11.9LOS D A D F E BApproach Delay 52.3 74.9 28.2Approach LOS D E CQueue Length 50th (m) ~203.6 3.3 ~110.3 ~453.4 26.4 0.0Queue Length 95th (m) #259.1 11.7 m87.6 m#245.3 44.0 20.9Internal Link Dist (m) 349.6 400.7 162.0Turn Bay Length (m) 70.0 120.0Base Capacity (vph) 1668 747 538 2763 273 428Starvation Cap Reductn 0 0 0 0 0 0Spillback Cap Reductn 0 0 0 0 0 0Storage Cap Reductn 0 0 0 0 0 0Reduced v/c Ratio 1.00 0.11 1.00 1.14 0.43 0.50
Intersection SummaryArea Type: OtherCycle Length: 120Actuated Cycle Length: 120Offset: 62.4 (52%), Referenced to phase 2:EBT and 6:WBTL, Start of GreenNatural Cycle: 150Control Type: Actuated-CoordinatedMaximum v/c Ratio: 1.14

Lanes, Volumes, Timings 2025 PM Future Background Conditions 1: Proudfoot Trail & Dundas Street Graydon Banning
Graydon Banning 7/28/2015 2025 PM Future Background Conditions Synchro 9 ReportMC Page 3
Intersection Signal Delay: 65.3 Intersection LOS: EIntersection Capacity Utilization 102.1% ICU Level of Service GAnalysis Period (min) 15~ Volume exceeds capacity, queue is theoretically infinite. Queue shown is maximum after two cycles.# 95th percentile volume exceeds capacity, queue may be longer. Queue shown is maximum after two cycles.m Volume for 95th percentile queue is metered by upstream signal.
Splits and Phases: 1: Proudfoot Trail & Dundas Street

HCM Signalized Intersection Capacity Analysis 2025 PM Future Background Conditions 1: Proudfoot Trail & Dundas Street Graydon Banning
Graydon Banning 7/28/2015 2025 PM Future Background Conditions Synchro 9 ReportMC Page 4
Movement EBT EBR WBL WBT NBL NBRLane ConfigurationsTraffic Volume (vph) 1930 78 528 3619 116 212Future Volume (vph) 1930 78 528 3619 116 212Ideal Flow (vphpl) 1900 1900 1900 1900 1900 1900Total Lost time (s) 5.9 5.9 4.0 5.9 6.9 6.9Lane Util. Factor 0.95 1.00 1.00 0.95 1.00 1.00Frpb, ped/bikes 1.00 0.97 1.00 1.00 1.00 1.00Flpb, ped/bikes 1.00 1.00 1.00 1.00 1.00 1.00Frt 1.00 0.85 1.00 1.00 1.00 0.85Flt Protected 1.00 1.00 0.95 1.00 0.95 1.00Satd. Flow (prot) 3476 1500 1825 3579 1825 1633Flt Permitted 1.00 1.00 0.06 1.00 0.95 1.00Satd. Flow (perm) 3476 1500 125 3579 1825 1633Peak-hour factor, PHF 0.98 0.98 0.98 0.98 0.98 0.98Growth Factor (vph) 85% 100% 100% 85% 100% 100%Adj. Flow (vph) 1674 80 539 3139 118 216RTOR Reduction (vph) 0 28 0 0 0 190Lane Group Flow (vph) 1674 52 539 3139 118 26Confl. Peds. (#/hr) 2 2Heavy Vehicles (%) 5% 6% 0% 2% 0% 0%Turn Type NA Perm pm+pt NA Prot PermProtected Phases 2 1 6 8Permitted Phases 2 6 8Actuated Green, G (s) 57.6 57.6 92.6 92.6 14.6 14.6Effective Green, g (s) 57.6 57.6 92.6 92.6 14.6 14.6Actuated g/C Ratio 0.48 0.48 0.77 0.77 0.12 0.12Clearance Time (s) 5.9 5.9 4.0 5.9 6.9 6.9Vehicle Extension (s) 5.5 5.5 3.0 5.5 5.0 5.0Lane Grp Cap (vph) 1668 720 535 2761 222 198v/s Ratio Prot 0.48 0.26 c0.88 c0.06v/s Ratio Perm 0.03 0.52 0.02v/c Ratio 1.00 0.07 1.01 1.14 0.53 0.13Uniform Delay, d1 31.2 16.8 39.1 13.7 49.5 47.0Progression Factor 1.00 1.00 0.83 1.15 1.00 1.00Incremental Delay, d2 22.9 0.2 13.5 62.1 4.4 0.6Delay (s) 54.1 17.0 46.0 77.9 53.9 47.7Level of Service D B D E D DApproach Delay (s) 52.4 73.2 49.9Approach LOS D E D
Intersection SummaryHCM 2000 Control Delay 65.5 HCM 2000 Level of Service EHCM 2000 Volume to Capacity ratio 1.10Actuated Cycle Length (s) 120.0 Sum of lost time (s) 16.8Intersection Capacity Utilization 102.1% ICU Level of Service GAnalysis Period (min) 15c Critical Lane Group
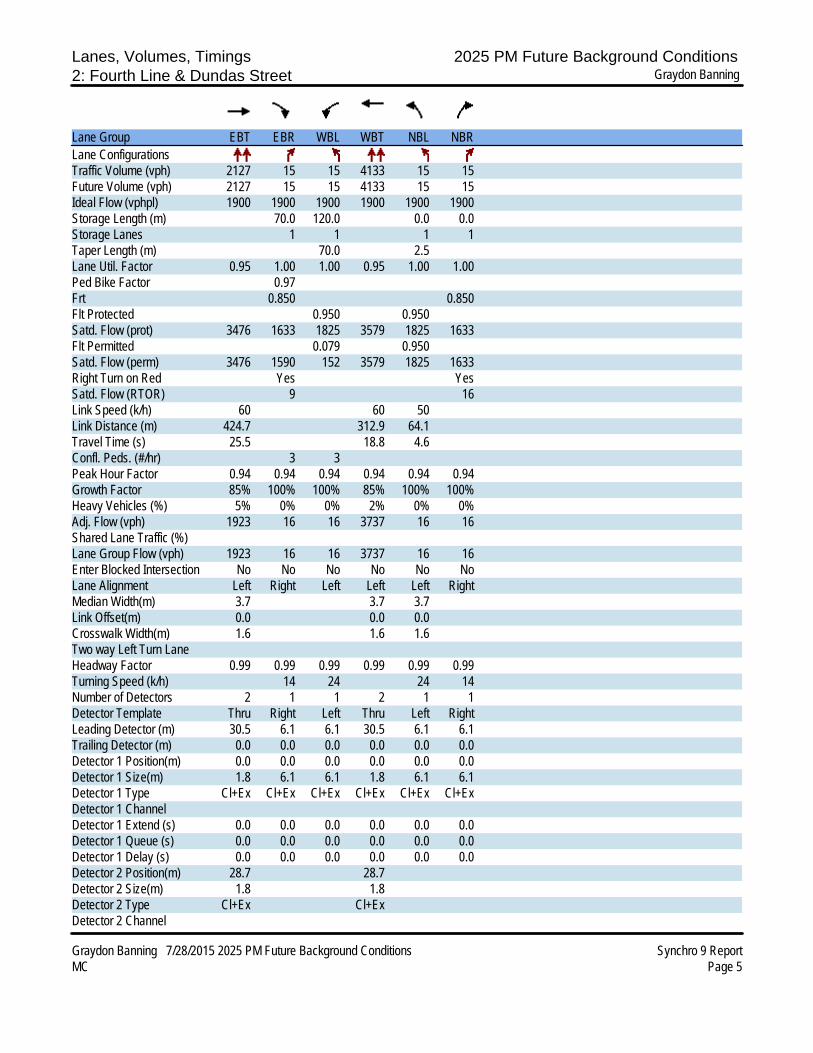
Lanes, Volumes, Timings 2025 PM Future Background Conditions 2: Fourth Line & Dundas Street Graydon Banning
Graydon Banning 7/28/2015 2025 PM Future Background Conditions Synchro 9 ReportMC Page 5
Lane Group EBT EBR WBL WBT NBL NBRLane ConfigurationsTraffic Volume (vph) 2127 15 15 4133 15 15Future Volume (vph) 2127 15 15 4133 15 15Ideal Flow (vphpl) 1900 1900 1900 1900 1900 1900Storage Length (m) 70.0 120.0 0.0 0.0Storage Lanes 1 1 1 1Taper Length (m) 70.0 2.5Lane Util. Factor 0.95 1.00 1.00 0.95 1.00 1.00Ped Bike Factor 0.97Frt 0.850 0.850Flt Protected 0.950 0.950Satd. Flow (prot) 3476 1633 1825 3579 1825 1633Flt Permitted 0.079 0.950Satd. Flow (perm) 3476 1590 152 3579 1825 1633Right Turn on Red Yes YesSatd. Flow (RTOR) 9 16Link Speed (k/h) 60 60 50Link Distance (m) 424.7 312.9 64.1Travel Time (s) 25.5 18.8 4.6Confl. Peds. (#/hr) 3 3Peak Hour Factor 0.94 0.94 0.94 0.94 0.94 0.94Growth Factor 85% 100% 100% 85% 100% 100%Heavy Vehicles (%) 5% 0% 0% 2% 0% 0%Adj. Flow (vph) 1923 16 16 3737 16 16Shared Lane Traffic (%)Lane Group Flow (vph) 1923 16 16 3737 16 16Enter Blocked Intersection No No No No No NoLane Alignment Left Right Left Left Left RightMedian Width(m) 3.7 3.7 3.7Link Offset(m) 0.0 0.0 0.0Crosswalk Width(m) 1.6 1.6 1.6Two way Left Turn LaneHeadway Factor 0.99 0.99 0.99 0.99 0.99 0.99Turning Speed (k/h) 14 24 24 14Number of Detectors 2 1 1 2 1 1Detector Template Thru Right Left Thru Left RightLeading Detector (m) 30.5 6.1 6.1 30.5 6.1 6.1Trailing Detector (m) 0.0 0.0 0.0 0.0 0.0 0.0Detector 1 Position(m) 0.0 0.0 0.0 0.0 0.0 0.0Detector 1 Size(m) 1.8 6.1 6.1 1.8 6.1 6.1Detector 1 Type Cl+Ex Cl+Ex Cl+Ex Cl+Ex Cl+Ex Cl+ExDetector 1 ChannelDetector 1 Extend (s) 0.0 0.0 0.0 0.0 0.0 0.0Detector 1 Queue (s) 0.0 0.0 0.0 0.0 0.0 0.0Detector 1 Delay (s) 0.0 0.0 0.0 0.0 0.0 0.0Detector 2 Position(m) 28.7 28.7Detector 2 Size(m) 1.8 1.8Detector 2 Type Cl+Ex Cl+ExDetector 2 Channel

Lanes, Volumes, Timings 2025 PM Future Background Conditions 2: Fourth Line & Dundas Street Graydon Banning
Graydon Banning 7/28/2015 2025 PM Future Background Conditions Synchro 9 ReportMC Page 6
Lane Group EBT EBR WBL WBT NBL NBRDetector 2 Extend (s) 0.0 0.0Turn Type NA Perm pm+pt NA Prot PermProtected Phases 2 1 6 8Permitted Phases 2 6 8Detector Phase 2 2 1 6 8 8Switch PhaseMinimum Initial (s) 5.0 5.0 5.0 5.0 5.0 5.0Minimum Split (s) 33.0 33.0 9.5 24.0 40.6 40.6Total Split (s) 63.0 63.0 13.0 76.0 44.0 44.0Total Split (%) 52.5% 52.5% 10.8% 63.3% 36.7% 36.7%Maximum Green (s) 57.0 57.0 9.0 70.0 37.4 37.4Yellow Time (s) 3.7 3.7 3.0 3.7 3.7 3.7All-Red Time (s) 2.3 2.3 1.0 2.3 2.9 2.9Lost Time Adjust (s) 0.0 0.0 0.0 0.0 0.0 0.0Total Lost Time (s) 6.0 6.0 4.0 6.0 6.6 6.6Lead/Lag Lag Lag LeadLead-Lag Optimize? Yes Yes YesVehicle Extension (s) 5.0 5.0 4.0 5.0 4.0 4.0Recall Mode C-Max C-Max None C-Max None NoneWalk Time (s) 7.0 7.0 7.0 7.0 7.0Flash Dont Walk (s) 20.0 20.0 7.0 27.0 27.0Pedestrian Calls (#/hr) 0 0 0 0 0Act Effct Green (s) 103.1 103.1 107.0 107.4 7.6 7.6Actuated g/C Ratio 0.86 0.86 0.89 0.90 0.06 0.06v/c Ratio 0.64 0.01 0.07 1.17 0.14 0.13Control Delay 3.9 0.0 2.1 91.0 55.1 25.0Queue Delay 0.0 0.0 0.0 0.0 0.0 0.0Total Delay 3.9 0.0 2.1 91.0 55.1 25.0LOS A A A F E CApproach Delay 3.9 90.6 40.1Approach LOS A F DQueue Length 50th (m) 15.5 0.0 0.4 ~579.5 3.6 0.0Queue Length 95th (m) m13.0 m0.0 1.4 #617.9 10.7 7.0Internal Link Dist (m) 400.7 288.9 40.1Turn Bay Length (m) 70.0 120.0Base Capacity (vph) 2987 1367 261 3204 568 519Starvation Cap Reductn 0 0 0 0 0 0Spillback Cap Reductn 0 0 0 0 0 0Storage Cap Reductn 0 0 0 0 0 0Reduced v/c Ratio 0.64 0.01 0.06 1.17 0.03 0.03
Intersection SummaryArea Type: OtherCycle Length: 120Actuated Cycle Length: 120Offset: 103.2 (86%), Referenced to phase 2:EBT and 6:WBTL, Start of GreenNatural Cycle: 145Control Type: Actuated-CoordinatedMaximum v/c Ratio: 1.17

Lanes, Volumes, Timings 2025 PM Future Background Conditions 2: Fourth Line & Dundas Street Graydon Banning
Graydon Banning 7/28/2015 2025 PM Future Background Conditions Synchro 9 ReportMC Page 7
Intersection Signal Delay: 60.9 Intersection LOS: EIntersection Capacity Utilization 111.8% ICU Level of Service HAnalysis Period (min) 15~ Volume exceeds capacity, queue is theoretically infinite. Queue shown is maximum after two cycles.# 95th percentile volume exceeds capacity, queue may be longer. Queue shown is maximum after two cycles.m Volume for 95th percentile queue is metered by upstream signal.
Splits and Phases: 2: Fourth Line & Dundas Street

HCM Signalized Intersection Capacity Analysis 2025 PM Future Background Conditions 2: Fourth Line & Dundas Street Graydon Banning
Graydon Banning 7/28/2015 2025 PM Future Background Conditions Synchro 9 ReportMC Page 8
Movement EBT EBR WBL WBT NBL NBRLane ConfigurationsTraffic Volume (vph) 2127 15 15 4133 15 15Future Volume (vph) 2127 15 15 4133 15 15Ideal Flow (vphpl) 1900 1900 1900 1900 1900 1900Total Lost time (s) 6.0 6.0 4.0 6.0 6.6 6.6Lane Util. Factor 0.95 1.00 1.00 0.95 1.00 1.00Frpb, ped/bikes 1.00 0.97 1.00 1.00 1.00 1.00Flpb, ped/bikes 1.00 1.00 1.00 1.00 1.00 1.00Frt 1.00 0.85 1.00 1.00 1.00 0.85Flt Protected 1.00 1.00 0.95 1.00 0.95 1.00Satd. Flow (prot) 3476 1590 1825 3579 1825 1633Flt Permitted 1.00 1.00 0.08 1.00 0.95 1.00Satd. Flow (perm) 3476 1590 153 3579 1825 1633Peak-hour factor, PHF 0.94 0.94 0.94 0.94 0.94 0.94Growth Factor (vph) 85% 100% 100% 85% 100% 100%Adj. Flow (vph) 1923 16 16 3737 16 16RTOR Reduction (vph) 0 2 0 0 0 15Lane Group Flow (vph) 1923 14 16 3737 16 1Confl. Peds. (#/hr) 3 3Heavy Vehicles (%) 5% 0% 0% 2% 0% 0%Turn Type NA Perm pm+pt NA Prot PermProtected Phases 2 1 6 8Permitted Phases 2 6 8Actuated Green, G (s) 95.7 95.7 102.4 102.4 5.0 5.0Effective Green, g (s) 95.7 95.7 102.4 102.4 5.0 5.0Actuated g/C Ratio 0.80 0.80 0.85 0.85 0.04 0.04Clearance Time (s) 6.0 6.0 4.0 6.0 6.6 6.6Vehicle Extension (s) 5.0 5.0 4.0 5.0 4.0 4.0Lane Grp Cap (vph) 2772 1268 168 3054 76 68v/s Ratio Prot 0.55 0.00 c1.04 c0.01v/s Ratio Perm 0.01 0.08 0.00v/c Ratio 0.69 0.01 0.10 1.22 0.21 0.01Uniform Delay, d1 5.5 2.5 5.1 8.8 55.6 55.1Progression Factor 0.60 0.00 1.00 1.00 1.00 1.00Incremental Delay, d2 0.5 0.0 0.3 103.8 1.9 0.1Delay (s) 3.9 0.0 5.5 112.6 57.5 55.2Level of Service A A A F E EApproach Delay (s) 3.8 112.1 56.3Approach LOS A F E
Intersection SummaryHCM 2000 Control Delay 75.1 HCM 2000 Level of Service EHCM 2000 Volume to Capacity ratio 1.22Actuated Cycle Length (s) 120.0 Sum of lost time (s) 16.6Intersection Capacity Utilization 111.8% ICU Level of Service HAnalysis Period (min) 15c Critical Lane Group
APPENDIX F – TOTAL FUTURE CONDITIONS SYNCHRO WORKSHEETS

Lanes, Volumes, Timings 2020 AM Total Future Conditions 1: Proudfoot Trail & Dundas Street Graydon Banning
Graydon Banning 7/28/2015 2020 AM Total Future Conditions Synchro 9 ReportMC Page 1
Lane Group EBL EBT EBR WBL WBT WBR NBL NBT NBR SBL SBT SBRLane ConfigurationsTraffic Volume (vph) 24 2905 64 66 1348 54 77 8 426 87 24 94Future Volume (vph) 24 2905 64 66 1348 54 77 8 426 87 24 94Ideal Flow (vphpl) 1900 1900 1900 1900 1900 1900 1900 1900 1900 1900 1900 1900Storage Length (m) 120.0 70.0 120.0 70.0 70.0 0.0 70.0 0.0Storage Lanes 1 1 1 1 1 0 1 0Taper Length (m) 70.0 70.0 70.0 70.0Lane Util. Factor 1.00 0.95 1.00 1.00 0.95 1.00 1.00 1.00 1.00 1.00 1.00 1.00Ped Bike Factor 0.98 0.99Frt 0.850 0.850 0.853 0.881Flt Protected 0.950 0.950 0.950 0.950Satd. Flow (prot) 1789 3444 1498 1789 3230 1601 1755 1616 0 1789 1659 0Flt Permitted 0.177 0.056 0.679 0.142Satd. Flow (perm) 333 3444 1463 105 3230 1601 1254 1616 0 267 1659 0Right Turn on Red Yes Yes Yes YesSatd. Flow (RTOR) 72 72 82 97Link Speed (k/h) 60 60 50 48Link Distance (m) 373.6 424.7 186.0 406.8Travel Time (s) 22.4 25.5 13.4 30.5Confl. Peds. (#/hr) 1 1 1Peak Hour Factor 0.97 0.97 0.97 0.97 0.97 0.97 0.97 0.97 0.97 0.97 0.97 0.97Growth Factor 100% 85% 100% 100% 85% 100% 100% 100% 100% 100% 100% 100%Heavy Vehicles (%) 2% 6% 9% 2% 13% 2% 4% 2% 0% 2% 2% 2%Adj. Flow (vph) 25 2546 66 68 1181 56 79 8 439 90 25 97Shared Lane Traffic (%)Lane Group Flow (vph) 25 2546 66 68 1181 56 79 447 0 90 122 0Enter Blocked Intersection No No No No No No No No No No No NoLane Alignment Left Left Right Left Left Right Left Left Right Left Left RightMedian Width(m) 3.7 3.7 3.7 3.7Link Offset(m) 0.0 0.0 0.0 0.0Crosswalk Width(m) 1.6 1.6 1.6 1.6Two way Left Turn LaneHeadway Factor 0.99 0.99 0.99 0.99 0.99 0.99 0.99 0.99 0.99 0.99 0.99 0.99Turning Speed (k/h) 24 14 24 14 24 14 24 14Number of Detectors 1 2 1 1 2 1 1 2 1 2Detector Template Left Thru Right Left Thru Right Left Thru Left ThruLeading Detector (m) 6.1 30.5 6.1 6.1 30.5 6.1 6.1 30.5 6.1 30.5Trailing Detector (m) 0.0 0.0 0.0 0.0 0.0 0.0 0.0 0.0 0.0 0.0Detector 1 Position(m) 0.0 0.0 0.0 0.0 0.0 0.0 0.0 0.0 0.0 0.0Detector 1 Size(m) 6.1 1.8 6.1 6.1 1.8 6.1 6.1 1.8 6.1 1.8Detector 1 Type Cl+Ex Cl+Ex Cl+Ex Cl+Ex Cl+Ex Cl+Ex Cl+Ex Cl+Ex Cl+Ex Cl+ExDetector 1 ChannelDetector 1 Extend (s) 0.0 0.0 0.0 0.0 0.0 0.0 0.0 0.0 0.0 0.0Detector 1 Queue (s) 0.0 0.0 0.0 0.0 0.0 0.0 0.0 0.0 0.0 0.0Detector 1 Delay (s) 0.0 0.0 0.0 0.0 0.0 0.0 0.0 0.0 0.0 0.0Detector 2 Position(m) 28.7 28.7 28.7 28.7Detector 2 Size(m) 1.8 1.8 1.8 1.8Detector 2 Type Cl+Ex Cl+Ex Cl+Ex Cl+ExDetector 2 Channel

Lanes, Volumes, Timings 2020 AM Total Future Conditions 1: Proudfoot Trail & Dundas Street Graydon Banning
Graydon Banning 7/28/2015 2020 AM Total Future Conditions Synchro 9 ReportMC Page 2
Lane Group EBL EBT EBR WBL WBT WBR NBL NBT NBR SBL SBT SBRDetector 2 Extend (s) 0.0 0.0 0.0 0.0Turn Type pm+pt NA Perm pm+pt NA Perm Perm NA Perm NAProtected Phases 5 2 1 6 8 4Permitted Phases 2 2 6 6 8 4Detector Phase 5 2 2 1 6 6 8 8 4 4Switch PhaseMinimum Initial (s) 5.0 5.0 5.0 5.0 5.0 5.0 5.0 5.0 5.0 5.0Minimum Split (s) 9.5 23.9 23.9 9.5 23.9 23.9 24.9 24.9 24.9 24.9Total Split (s) 9.5 75.5 75.5 9.5 75.5 75.5 35.0 35.0 35.0 35.0Total Split (%) 7.9% 62.9% 62.9% 7.9% 62.9% 62.9% 29.2% 29.2% 29.2% 29.2%Maximum Green (s) 5.5 69.6 69.6 5.5 69.6 69.6 28.1 28.1 28.1 28.1Yellow Time (s) 3.0 3.7 3.7 3.0 3.7 3.7 3.3 3.3 3.3 3.3All-Red Time (s) 1.0 2.2 2.2 1.0 2.2 2.2 3.6 3.6 3.6 3.6Lost Time Adjust (s) 0.0 0.0 0.0 0.0 0.0 0.0 0.0 0.0 0.0 0.0Total Lost Time (s) 4.0 5.9 5.9 4.0 5.9 5.9 6.9 6.9 6.9 6.9Lead/Lag Lead Lag Lag Lead Lag LagLead-Lag Optimize? Yes Yes YesVehicle Extension (s) 3.0 5.5 5.5 3.0 5.5 5.5 5.0 5.0 3.0 3.0Recall Mode None C-Max C-Max None C-Max C-Max None None None NoneWalk Time (s) 7.0 7.0 7.0 7.0 7.0 7.0 7.0 7.0Flash Dont Walk (s) 11.0 11.0 11.0 11.0 11.0 11.0 11.0 11.0Pedestrian Calls (#/hr) 0 0 0 0 0 0 0 0Act Effct Green (s) 77.8 71.5 71.5 78.6 73.4 73.4 28.1 28.1 28.1 28.1Actuated g/C Ratio 0.65 0.60 0.60 0.66 0.61 0.61 0.23 0.23 0.23 0.23v/c Ratio 0.09 1.24 0.07 0.47 0.60 0.06 0.27 1.01 1.45 0.26Control Delay 7.2 137.9 2.4 27.4 14.3 1.5 40.6 84.0 307.9 12.6Queue Delay 0.0 0.0 0.0 0.0 0.0 0.0 0.0 0.0 0.0 0.0Total Delay 7.2 137.9 2.4 27.4 14.3 1.5 40.6 84.0 307.9 12.6LOS A F A C B A D F F BApproach Delay 133.2 14.5 77.5 138.0Approach LOS F B E FQueue Length 50th (m) 1.8 ~399.0 0.0 4.9 57.3 0.0 15.3 ~92.1 ~28.8 4.6Queue Length 95th (m) 4.6 #439.0 5.2 18.7 65.0 3.0 29.3 #157.9 #62.1 19.9Internal Link Dist (m) 349.6 400.7 162.0 382.8Turn Bay Length (m) 120.0 70.0 120.0 70.0 70.0 70.0Base Capacity (vph) 282 2052 900 146 1975 1006 293 441 62 462Starvation Cap Reductn 0 0 0 0 0 0 0 0 0 0Spillback Cap Reductn 0 0 0 0 0 0 0 0 0 0Storage Cap Reductn 0 0 0 0 0 0 0 0 0 0Reduced v/c Ratio 0.09 1.24 0.07 0.47 0.60 0.06 0.27 1.01 1.45 0.26
Intersection SummaryArea Type: OtherCycle Length: 120Actuated Cycle Length: 120Offset: 80.4 (67%), Referenced to phase 2:EBTL and 6:WBTL, Start of GreenNatural Cycle: 110Control Type: Actuated-CoordinatedMaximum v/c Ratio: 1.45
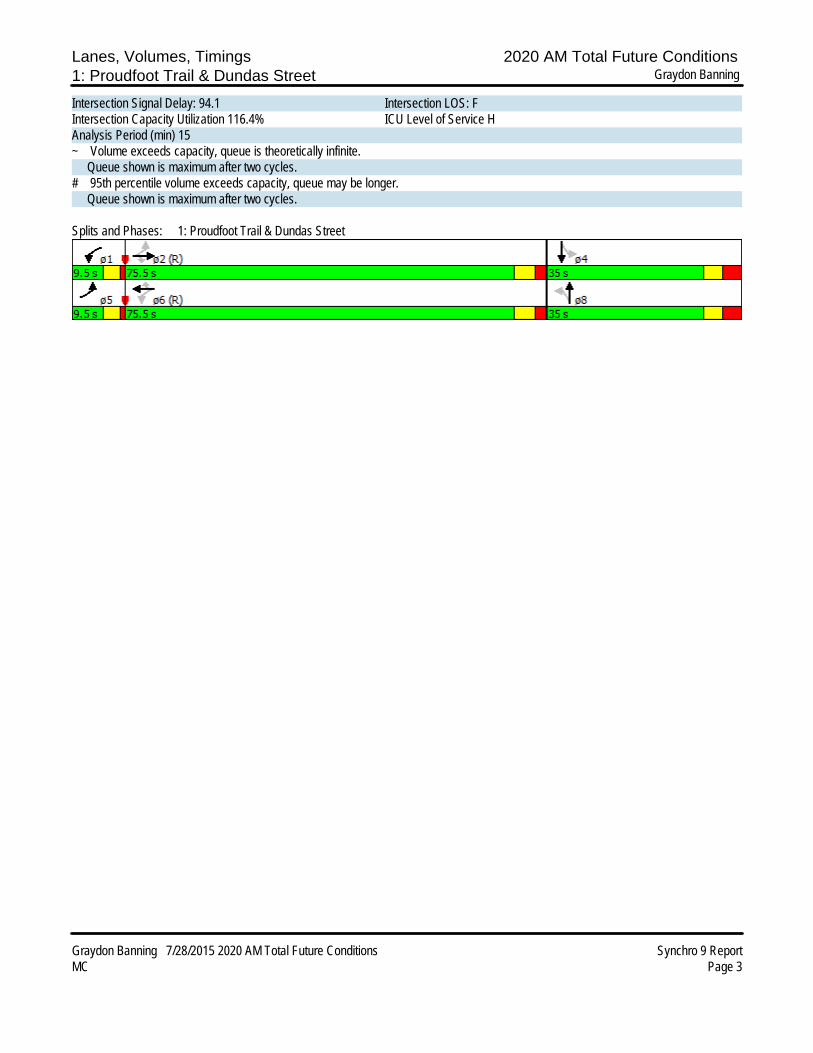
Lanes, Volumes, Timings 2020 AM Total Future Conditions 1: Proudfoot Trail & Dundas Street Graydon Banning
Graydon Banning 7/28/2015 2020 AM Total Future Conditions Synchro 9 ReportMC Page 3
Intersection Signal Delay: 94.1 Intersection LOS: FIntersection Capacity Utilization 116.4% ICU Level of Service HAnalysis Period (min) 15~ Volume exceeds capacity, queue is theoretically infinite. Queue shown is maximum after two cycles.# 95th percentile volume exceeds capacity, queue may be longer. Queue shown is maximum after two cycles.
Splits and Phases: 1: Proudfoot Trail & Dundas Street

HCM Signalized Intersection Capacity Analysis 2020 AM Total Future Conditions 1: Proudfoot Trail & Dundas Street Graydon Banning
Graydon Banning 7/28/2015 2020 AM Total Future Conditions Synchro 9 ReportMC Page 4
Movement EBL EBT EBR WBL WBT WBR NBL NBT NBR SBL SBT SBRLane ConfigurationsTraffic Volume (vph) 24 2905 64 66 1348 54 77 8 426 87 24 94Future Volume (vph) 24 2905 64 66 1348 54 77 8 426 87 24 94Ideal Flow (vphpl) 1900 1900 1900 1900 1900 1900 1900 1900 1900 1900 1900 1900Total Lost time (s) 4.0 5.9 5.9 4.0 5.9 5.9 6.9 6.9 6.9 6.9Lane Util. Factor 1.00 0.95 1.00 1.00 0.95 1.00 1.00 1.00 1.00 1.00Frpb, ped/bikes 1.00 1.00 0.98 1.00 1.00 1.00 1.00 0.99 1.00 1.00Flpb, ped/bikes 1.00 1.00 1.00 1.00 1.00 1.00 1.00 1.00 1.00 1.00Frt 1.00 1.00 0.85 1.00 1.00 0.85 1.00 0.85 1.00 0.88Flt Protected 0.95 1.00 1.00 0.95 1.00 1.00 0.95 1.00 0.95 1.00Satd. Flow (prot) 1789 3444 1463 1789 3230 1601 1755 1615 1789 1659Flt Permitted 0.18 1.00 1.00 0.06 1.00 1.00 0.68 1.00 0.14 1.00Satd. Flow (perm) 333 3444 1463 105 3230 1601 1254 1615 268 1659Peak-hour factor, PHF 0.97 0.97 0.97 0.97 0.97 0.97 0.97 0.97 0.97 0.97 0.97 0.97Growth Factor (vph) 100% 85% 100% 100% 85% 100% 100% 100% 100% 100% 100% 100%Adj. Flow (vph) 25 2546 66 68 1181 56 79 8 439 90 25 97RTOR Reduction (vph) 0 0 27 0 0 22 0 63 0 0 74 0Lane Group Flow (vph) 25 2546 39 68 1181 34 79 384 0 90 48 0Confl. Peds. (#/hr) 1 1 1Heavy Vehicles (%) 2% 6% 9% 2% 13% 2% 4% 2% 0% 2% 2% 2%Turn Type pm+pt NA Perm pm+pt NA Perm Perm NA Perm NAProtected Phases 5 2 1 6 8 4Permitted Phases 2 2 6 6 8 4Actuated Green, G (s) 74.0 70.7 70.7 76.2 71.8 71.8 28.1 28.1 28.1 28.1Effective Green, g (s) 74.0 70.7 70.7 76.2 71.8 71.8 28.1 28.1 28.1 28.1Actuated g/C Ratio 0.62 0.59 0.59 0.64 0.60 0.60 0.23 0.23 0.23 0.23Clearance Time (s) 4.0 5.9 5.9 4.0 5.9 5.9 6.9 6.9 6.9 6.9Vehicle Extension (s) 3.0 5.5 5.5 3.0 5.5 5.5 5.0 5.0 3.0 3.0Lane Grp Cap (vph) 245 2029 861 128 1932 957 293 378 62 388v/s Ratio Prot 0.00 c0.74 c0.02 0.37 0.24 0.03v/s Ratio Perm 0.06 0.03 0.32 0.02 0.06 c0.34v/c Ratio 0.10 1.25 0.05 0.53 0.61 0.04 0.27 1.02 1.45 0.12Uniform Delay, d1 10.4 24.6 10.4 28.2 15.3 9.9 37.6 46.0 46.0 36.2Progression Factor 1.00 1.00 1.00 1.60 0.86 0.86 1.00 1.00 1.00 1.00Incremental Delay, d2 0.2 118.9 0.1 3.8 1.3 0.1 1.0 50.5 272.8 0.1Delay (s) 10.6 143.5 10.5 49.0 14.5 8.6 38.6 96.5 318.7 36.4Level of Service B F B D B A D F F DApproach Delay (s) 138.9 16.0 87.8 156.2Approach LOS F B F F
Intersection SummaryHCM 2000 Control Delay 99.7 HCM 2000 Level of Service FHCM 2000 Volume to Capacity ratio 1.27Actuated Cycle Length (s) 120.0 Sum of lost time (s) 16.8Intersection Capacity Utilization 116.4% ICU Level of Service HAnalysis Period (min) 15c Critical Lane Group

Lanes, Volumes, Timings 2020 AM Total Future Conditions 2: Fourth Line & Dundas Street Graydon Banning
Graydon Banning 7/28/2015 2020 AM Total Future Conditions Synchro 9 ReportMC Page 5
Lane Group EBT EBR WBL WBT NBL NBRLane ConfigurationsTraffic Volume (vph) 3403 15 15 1453 15 15Future Volume (vph) 3403 15 15 1453 15 15Ideal Flow (vphpl) 1900 1900 1900 1900 1900 1900Storage Length (m) 70.0 120.0 0.0 0.0Storage Lanes 1 1 1 1Taper Length (m) 70.0 2.5Lane Util. Factor 0.95 1.00 1.00 0.95 1.00 1.00Ped Bike Factor 0.97Frt 0.850 0.850Flt Protected 0.950 0.950Satd. Flow (prot) 3510 1512 1825 3288 1825 1361Flt Permitted 0.040 0.950Satd. Flow (perm) 3510 1472 77 3288 1825 1361Right Turn on Red Yes YesSatd. Flow (RTOR) 6 16Link Speed (k/h) 60 60 50Link Distance (m) 424.7 312.9 64.1Travel Time (s) 25.5 18.8 4.6Confl. Peds. (#/hr) 3 3Peak Hour Factor 0.94 0.94 0.94 0.94 0.94 0.94Growth Factor 85% 100% 100% 85% 100% 100%Heavy Vehicles (%) 4% 8% 0% 11% 0% 20%Adj. Flow (vph) 3077 16 16 1314 16 16Shared Lane Traffic (%)Lane Group Flow (vph) 3077 16 16 1314 16 16Enter Blocked Intersection No No No No No NoLane Alignment Left Right Left Left Left RightMedian Width(m) 3.7 3.7 3.7Link Offset(m) 0.0 0.0 0.0Crosswalk Width(m) 1.6 1.6 1.6Two way Left Turn LaneHeadway Factor 0.99 0.99 0.99 0.99 0.99 0.99Turning Speed (k/h) 14 24 24 14Number of Detectors 2 1 1 2 1 1Detector Template Thru Right Left Thru Left RightLeading Detector (m) 30.5 6.1 6.1 30.5 6.1 6.1Trailing Detector (m) 0.0 0.0 0.0 0.0 0.0 0.0Detector 1 Position(m) 0.0 0.0 0.0 0.0 0.0 0.0Detector 1 Size(m) 1.8 6.1 6.1 1.8 6.1 6.1Detector 1 Type Cl+Ex Cl+Ex Cl+Ex Cl+Ex Cl+Ex Cl+ExDetector 1 ChannelDetector 1 Extend (s) 0.0 0.0 0.0 0.0 0.0 0.0Detector 1 Queue (s) 0.0 0.0 0.0 0.0 0.0 0.0Detector 1 Delay (s) 0.0 0.0 0.0 0.0 0.0 0.0Detector 2 Position(m) 28.7 28.7Detector 2 Size(m) 1.8 1.8Detector 2 Type Cl+Ex Cl+ExDetector 2 Channel

Lanes, Volumes, Timings 2020 AM Total Future Conditions 2: Fourth Line & Dundas Street Graydon Banning
Graydon Banning 7/28/2015 2020 AM Total Future Conditions Synchro 9 ReportMC Page 6
Lane Group EBT EBR WBL WBT NBL NBRDetector 2 Extend (s) 0.0 0.0Turn Type NA Perm pm+pt NA Prot PermProtected Phases 2 1 6 8Permitted Phases 2 6 8Detector Phase 2 2 1 6 8 8Switch PhaseMinimum Initial (s) 5.0 5.0 5.0 5.0 5.0 5.0Minimum Split (s) 33.0 33.0 9.5 24.0 40.6 40.6Total Split (s) 69.9 69.9 9.5 79.4 40.6 40.6Total Split (%) 58.3% 58.3% 7.9% 66.2% 33.8% 33.8%Maximum Green (s) 63.9 63.9 5.5 73.4 34.0 34.0Yellow Time (s) 3.7 3.7 3.0 3.7 3.7 3.7All-Red Time (s) 2.3 2.3 1.0 2.3 2.9 2.9Lost Time Adjust (s) 0.0 0.0 0.0 0.0 0.0 0.0Total Lost Time (s) 6.0 6.0 4.0 6.0 6.6 6.6Lead/Lag Lag Lag LeadLead-Lag Optimize? Yes Yes YesVehicle Extension (s) 5.0 5.0 4.0 5.0 4.0 4.0Recall Mode C-Max C-Max None C-Max None NoneWalk Time (s) 7.0 7.0 7.0 7.0 7.0Flash Dont Walk (s) 20.0 20.0 7.0 27.0 27.0Pedestrian Calls (#/hr) 0 0 0 0 0Act Effct Green (s) 103.1 103.1 107.0 107.4 7.6 7.6Actuated g/C Ratio 0.86 0.86 0.89 0.90 0.06 0.06v/c Ratio 1.02 0.01 0.10 0.45 0.14 0.16Control Delay 25.2 2.7 2.7 2.6 55.1 26.0Queue Delay 0.0 0.0 0.0 0.0 0.0 0.0Total Delay 25.2 2.7 2.7 2.6 55.1 26.0LOS C A A A E CApproach Delay 25.1 2.6 40.6Approach LOS C A DQueue Length 50th (m) ~192.2 0.3 0.4 34.3 3.6 0.0Queue Length 95th (m) m#102.4 m0.3 1.4 47.3 10.7 7.0Internal Link Dist (m) 400.7 288.9 40.1Turn Bay Length (m) 70.0 120.0Base Capacity (vph) 3016 1266 165 2944 517 397Starvation Cap Reductn 0 0 0 0 0 0Spillback Cap Reductn 0 0 0 0 0 0Storage Cap Reductn 0 0 0 0 0 0Reduced v/c Ratio 1.02 0.01 0.10 0.45 0.03 0.04
Intersection SummaryArea Type: OtherCycle Length: 120Actuated Cycle Length: 120Offset: 103.2 (86%), Referenced to phase 2:EBT and 6:WBTL, Start of GreenNatural Cycle: 145Control Type: Actuated-CoordinatedMaximum v/c Ratio: 1.02

Lanes, Volumes, Timings 2020 AM Total Future Conditions 2: Fourth Line & Dundas Street Graydon Banning
Graydon Banning 7/28/2015 2020 AM Total Future Conditions Synchro 9 ReportMC Page 7
Intersection Signal Delay: 18.5 Intersection LOS: BIntersection Capacity Utilization 94.6% ICU Level of Service FAnalysis Period (min) 15~ Volume exceeds capacity, queue is theoretically infinite. Queue shown is maximum after two cycles.# 95th percentile volume exceeds capacity, queue may be longer. Queue shown is maximum after two cycles.m Volume for 95th percentile queue is metered by upstream signal.
Splits and Phases: 2: Fourth Line & Dundas Street

HCM Signalized Intersection Capacity Analysis 2020 AM Total Future Conditions 2: Fourth Line & Dundas Street Graydon Banning
Graydon Banning 7/28/2015 2020 AM Total Future Conditions Synchro 9 ReportMC Page 8
Movement EBT EBR WBL WBT NBL NBRLane ConfigurationsTraffic Volume (vph) 3403 15 15 1453 15 15Future Volume (vph) 3403 15 15 1453 15 15Ideal Flow (vphpl) 1900 1900 1900 1900 1900 1900Total Lost time (s) 6.0 6.0 4.0 6.0 6.6 6.6Lane Util. Factor 0.95 1.00 1.00 0.95 1.00 1.00Frpb, ped/bikes 1.00 0.97 1.00 1.00 1.00 1.00Flpb, ped/bikes 1.00 1.00 1.00 1.00 1.00 1.00Frt 1.00 0.85 1.00 1.00 1.00 0.85Flt Protected 1.00 1.00 0.95 1.00 0.95 1.00Satd. Flow (prot) 3510 1472 1825 3288 1825 1361Flt Permitted 1.00 1.00 0.04 1.00 0.95 1.00Satd. Flow (perm) 3510 1472 77 3288 1825 1361Peak-hour factor, PHF 0.94 0.94 0.94 0.94 0.94 0.94Growth Factor (vph) 85% 100% 100% 85% 100% 100%Adj. Flow (vph) 3077 16 16 1314 16 16RTOR Reduction (vph) 0 1 0 0 0 15Lane Group Flow (vph) 3077 15 16 1314 16 1Confl. Peds. (#/hr) 3 3Heavy Vehicles (%) 4% 8% 0% 11% 0% 20%Turn Type NA Perm pm+pt NA Prot PermProtected Phases 2 1 6 8Permitted Phases 2 6 8Actuated Green, G (s) 95.7 95.7 102.4 102.4 5.0 5.0Effective Green, g (s) 95.7 95.7 102.4 102.4 5.0 5.0Actuated g/C Ratio 0.80 0.80 0.85 0.85 0.04 0.04Clearance Time (s) 6.0 6.0 4.0 6.0 6.6 6.6Vehicle Extension (s) 5.0 5.0 4.0 5.0 4.0 4.0Lane Grp Cap (vph) 2799 1173 105 2805 76 56v/s Ratio Prot c0.88 0.00 c0.40 c0.01v/s Ratio Perm 0.01 0.13 0.00v/c Ratio 1.10 0.01 0.15 0.47 0.21 0.01Uniform Delay, d1 12.1 2.5 39.8 2.2 55.6 55.1Progression Factor 1.03 0.87 1.00 1.00 1.00 1.00Incremental Delay, d2 45.3 0.0 0.9 0.6 1.9 0.1Delay (s) 57.9 2.2 40.7 2.7 57.5 55.2Level of Service E A D A E EApproach Delay (s) 57.6 3.2 56.4Approach LOS E A E
Intersection SummaryHCM 2000 Control Delay 41.3 HCM 2000 Level of Service DHCM 2000 Volume to Capacity ratio 1.05Actuated Cycle Length (s) 120.0 Sum of lost time (s) 16.6Intersection Capacity Utilization 94.6% ICU Level of Service FAnalysis Period (min) 15c Critical Lane Group

Lanes, Volumes, Timings 2020 AM Total Future Conditions 3: Proudfoot Trail & William Halton Parkway Graydon Banning
Graydon Banning 7/28/2015 2020 AM Total Future Conditions Synchro 9 ReportMC Page 9
Lane Group EBT EBR WBL WBT NBL NBRLane ConfigurationsTraffic Volume (vph) 980 3 6 868 6 13Future Volume (vph) 980 3 6 868 6 13Ideal Flow (vphpl) 1900 1900 1900 1900 1900 1900Lane Util. Factor 0.95 0.95 0.95 0.95 1.00 1.00Frt 0.910Flt Protected 0.984Satd. Flow (prot) 3579 0 0 3579 1687 0Flt Permitted 0.984Satd. Flow (perm) 3579 0 0 3579 1687 0Link Speed (k/h) 60 60 50Link Distance (m) 153.4 363.2 406.8Travel Time (s) 9.2 21.8 29.3Peak Hour Factor 0.92 0.92 0.92 0.92 0.92 0.92Adj. Flow (vph) 1065 3 7 943 7 14Shared Lane Traffic (%)Lane Group Flow (vph) 1068 0 0 950 21 0Enter Blocked Intersection No No No No No NoLane Alignment Left Right Left Left Left RightMedian Width(m) 3.7 3.7 3.7Link Offset(m) 0.0 0.0 0.0Crosswalk Width(m) 1.6 1.6 1.6Two way Left Turn LaneHeadway Factor 0.99 0.99 0.99 0.99 0.99 0.99Turning Speed (k/h) 14 24 24 14Sign Control Free Free Stop
Intersection SummaryArea Type: OtherControl Type: UnsignalizedIntersection Capacity Utilization 38.2% ICU Level of Service AAnalysis Period (min) 15
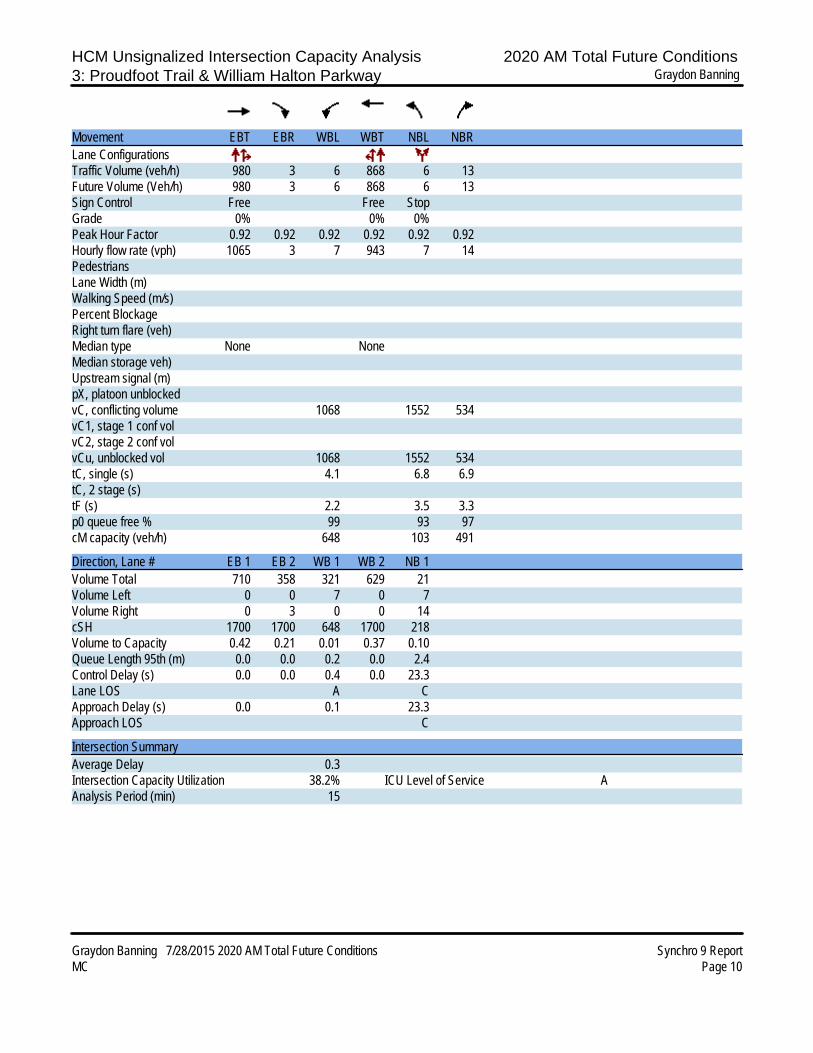
HCM Unsignalized Intersection Capacity Analysis 2020 AM Total Future Conditions 3: Proudfoot Trail & William Halton Parkway Graydon Banning
Graydon Banning 7/28/2015 2020 AM Total Future Conditions Synchro 9 ReportMC Page 10
Movement EBT EBR WBL WBT NBL NBRLane ConfigurationsTraffic Volume (veh/h) 980 3 6 868 6 13Future Volume (Veh/h) 980 3 6 868 6 13Sign Control Free Free StopGrade 0% 0% 0%Peak Hour Factor 0.92 0.92 0.92 0.92 0.92 0.92Hourly flow rate (vph) 1065 3 7 943 7 14PedestriansLane Width (m)Walking Speed (m/s)Percent BlockageRight turn flare (veh)Median type None NoneMedian storage veh)Upstream signal (m)pX, platoon unblockedvC, conflicting volume 1068 1552 534vC1, stage 1 conf volvC2, stage 2 conf volvCu, unblocked vol 1068 1552 534tC, single (s) 4.1 6.8 6.9tC, 2 stage (s)tF (s) 2.2 3.5 3.3p0 queue free % 99 93 97cM capacity (veh/h) 648 103 491
Direction, Lane # EB 1 EB 2 WB 1 WB 2 NB 1Volume Total 710 358 321 629 21Volume Left 0 0 7 0 7Volume Right 0 3 0 0 14cSH 1700 1700 648 1700 218Volume to Capacity 0.42 0.21 0.01 0.37 0.10Queue Length 95th (m) 0.0 0.0 0.2 0.0 2.4Control Delay (s) 0.0 0.0 0.4 0.0 23.3Lane LOS A CApproach Delay (s) 0.0 0.1 23.3Approach LOS C
Intersection SummaryAverage Delay 0.3Intersection Capacity Utilization 38.2% ICU Level of Service AAnalysis Period (min) 15

Lanes, Volumes, Timings 2020 AM Total Future Conditions 4: New Access & William Halton Parkway Graydon Banning
Graydon Banning 7/28/2015 2020 AM Total Future Conditions Synchro 9 ReportMC Page 11
Lane Group EBT EBR WBL WBT NBL NBRLane ConfigurationsTraffic Volume (vph) 990 3 6 863 11 22Future Volume (vph) 990 3 6 863 11 22Ideal Flow (vphpl) 1900 1900 1900 1900 1900 1900Lane Util. Factor 0.95 0.95 0.95 0.95 1.00 1.00Frt 0.910Flt Protected 0.984Satd. Flow (prot) 3579 0 0 3579 1687 0Flt Permitted 0.984Satd. Flow (perm) 3579 0 0 3579 1687 0Link Speed (k/h) 60 60 48Link Distance (m) 363.2 219.4 79.0Travel Time (s) 21.8 13.2 5.9Peak Hour Factor 0.92 0.92 0.92 0.92 0.92 0.92Adj. Flow (vph) 1076 3 7 938 12 24Shared Lane Traffic (%)Lane Group Flow (vph) 1079 0 0 945 36 0Enter Blocked Intersection No No No No No NoLane Alignment Left Right Left Left Left RightMedian Width(m) 3.7 3.7 3.7Link Offset(m) 0.0 0.0 0.0Crosswalk Width(m) 1.6 1.6 1.6Two way Left Turn LaneHeadway Factor 0.99 0.99 0.99 0.99 0.99 0.99Turning Speed (k/h) 14 24 24 14Sign Control Free Free Stop
Intersection SummaryArea Type: OtherControl Type: UnsignalizedIntersection Capacity Utilization 38.1% ICU Level of Service AAnalysis Period (min) 15

HCM Unsignalized Intersection Capacity Analysis 2020 AM Total Future Conditions 4: New Access & William Halton Parkway Graydon Banning
Graydon Banning 7/28/2015 2020 AM Total Future Conditions Synchro 9 ReportMC Page 12
Movement EBT EBR WBL WBT NBL NBRLane ConfigurationsTraffic Volume (veh/h) 990 3 6 863 11 22Future Volume (Veh/h) 990 3 6 863 11 22Sign Control Free Free StopGrade 0% 0% 0%Peak Hour Factor 0.92 0.92 0.92 0.92 0.92 0.92Hourly flow rate (vph) 1076 3 7 938 12 24PedestriansLane Width (m)Walking Speed (m/s)Percent BlockageRight turn flare (veh)Median type None NoneMedian storage veh)Upstream signal (m)pX, platoon unblockedvC, conflicting volume 1079 1560 540vC1, stage 1 conf volvC2, stage 2 conf volvCu, unblocked vol 1079 1560 540tC, single (s) 4.1 6.8 6.9tC, 2 stage (s)tF (s) 2.2 3.5 3.3p0 queue free % 99 88 95cM capacity (veh/h) 642 102 486
Direction, Lane # EB 1 EB 2 WB 1 WB 2 NB 1Volume Total 717 362 320 625 36Volume Left 0 0 7 0 12Volume Right 0 3 0 0 24cSH 1700 1700 642 1700 215Volume to Capacity 0.42 0.21 0.01 0.37 0.17Queue Length 95th (m) 0.0 0.0 0.3 0.0 4.5Control Delay (s) 0.0 0.0 0.4 0.0 25.1Lane LOS A DApproach Delay (s) 0.0 0.1 25.1Approach LOS D
Intersection SummaryAverage Delay 0.5Intersection Capacity Utilization 38.1% ICU Level of Service AAnalysis Period (min) 15

Lanes, Volumes, Timings 2020 PM Total Future Conditions 1: Proudfoot Trail & Dundas Street Graydon Banning
Graydon Banning 7/28/2015 2020 PM Total Future Conditions Synchro 9 ReportMC Page 1
Lane Group EBL EBT EBR WBL WBT WBR NBL NBT NBR SBL SBT SBRLane ConfigurationsTraffic Volume (vph) 71 1699 70 456 3109 117 102 23 183 53 14 70Future Volume (vph) 71 1699 70 456 3109 117 102 23 183 53 14 70Ideal Flow (vphpl) 1900 1900 1900 1900 1900 1900 1900 1900 1900 1900 1900 1900Storage Length (m) 120.0 70.0 120.0 70.0 70.0 0.0 70.0 70.0Storage Lanes 1 1 1 1 1 0 1 0Taper Length (m) 70.0 70.0 70.0 70.0Lane Util. Factor 1.00 0.95 1.00 1.00 0.95 1.00 1.00 1.00 1.00 1.00 1.00 1.00Ped Bike Factor 0.97Frt 0.850 0.850 0.866 0.875Flt Protected 0.950 0.950 0.950 0.950Satd. Flow (prot) 1789 3476 1541 1825 3579 1601 1825 1660 0 1789 1648 0Flt Permitted 0.067 0.063 0.702 0.343Satd. Flow (perm) 126 3476 1500 121 3579 1601 1349 1660 0 646 1648 0Right Turn on Red Yes Yes Yes YesSatd. Flow (RTOR) 108 76 187 71Link Speed (k/h) 60 60 50 48Link Distance (m) 373.6 424.7 186.0 376.7Travel Time (s) 22.4 25.5 13.4 28.3Confl. Peds. (#/hr) 2 2Peak Hour Factor 0.98 0.98 0.98 0.98 0.98 0.98 0.98 0.98 0.98 0.98 0.98 0.98Growth Factor 100% 85% 100% 100% 85% 100% 100% 100% 100% 100% 100% 100%Heavy Vehicles (%) 2% 5% 6% 0% 2% 2% 0% 2% 0% 2% 2% 2%Adj. Flow (vph) 72 1474 71 465 2697 119 104 23 187 54 14 71Shared Lane Traffic (%)Lane Group Flow (vph) 72 1474 71 465 2697 119 104 210 0 54 85 0Enter Blocked Intersection No No No No No No No No No No No NoLane Alignment Left Left Right Left Left Right Left Left Right Left Left RightMedian Width(m) 3.7 3.7 3.7 3.7Link Offset(m) 0.0 0.0 0.0 0.0Crosswalk Width(m) 1.6 1.6 1.6 1.6Two way Left Turn LaneHeadway Factor 0.99 0.99 0.99 0.99 0.99 0.99 0.99 0.99 0.99 0.99 0.99 0.99Turning Speed (k/h) 24 14 24 14 24 14 24 14Number of Detectors 1 2 1 1 2 1 1 2 1 2Detector Template Left Thru Right Left Thru Right Left Thru Left ThruLeading Detector (m) 6.1 30.5 6.1 6.1 30.5 6.1 6.1 30.5 6.1 30.5Trailing Detector (m) 0.0 0.0 0.0 0.0 0.0 0.0 0.0 0.0 0.0 0.0Detector 1 Position(m) 0.0 0.0 0.0 0.0 0.0 0.0 0.0 0.0 0.0 0.0Detector 1 Size(m) 6.1 1.8 6.1 6.1 1.8 6.1 6.1 1.8 6.1 1.8Detector 1 Type Cl+Ex Cl+Ex Cl+Ex Cl+Ex Cl+Ex Cl+Ex Cl+Ex Cl+Ex Cl+Ex Cl+ExDetector 1 ChannelDetector 1 Extend (s) 0.0 0.0 0.0 0.0 0.0 0.0 0.0 0.0 0.0 0.0Detector 1 Queue (s) 0.0 0.0 0.0 0.0 0.0 0.0 0.0 0.0 0.0 0.0Detector 1 Delay (s) 0.0 0.0 0.0 0.0 0.0 0.0 0.0 0.0 0.0 0.0Detector 2 Position(m) 28.7 28.7 28.7 28.7Detector 2 Size(m) 1.8 1.8 1.8 1.8Detector 2 Type Cl+Ex Cl+Ex Cl+Ex Cl+ExDetector 2 Channel

Lanes, Volumes, Timings 2020 PM Total Future Conditions 1: Proudfoot Trail & Dundas Street Graydon Banning
Graydon Banning 7/28/2015 2020 PM Total Future Conditions Synchro 9 ReportMC Page 2
Lane Group EBL EBT EBR WBL WBT WBR NBL NBT NBR SBL SBT SBRDetector 2 Extend (s) 0.0 0.0 0.0 0.0Turn Type pm+pt NA Perm pm+pt NA Perm Perm NA Perm NAProtected Phases 5 2 1 6 8 4Permitted Phases 2 2 6 6 8 4Detector Phase 5 2 2 1 6 6 8 8 4 4Switch PhaseMinimum Initial (s) 5.0 5.0 5.0 5.0 5.0 5.0 5.0 5.0 5.0 5.0Minimum Split (s) 9.5 23.9 23.9 9.5 23.9 23.9 24.9 24.9 24.9 24.9Total Split (s) 9.5 64.9 64.9 30.2 85.6 85.6 24.9 24.9 24.9 24.9Total Split (%) 7.9% 54.1% 54.1% 25.2% 71.3% 71.3% 20.8% 20.8% 20.8% 20.8%Maximum Green (s) 5.5 59.0 59.0 26.2 79.7 79.7 18.0 18.0 18.0 18.0Yellow Time (s) 3.0 3.7 3.7 3.0 3.7 3.7 3.3 3.3 3.3 3.3All-Red Time (s) 1.0 2.2 2.2 1.0 2.2 2.2 3.6 3.6 3.6 3.6Lost Time Adjust (s) 0.0 0.0 0.0 0.0 0.0 0.0 0.0 0.0 0.0 0.0Total Lost Time (s) 4.0 5.9 5.9 4.0 5.9 5.9 6.9 6.9 6.9 6.9Lead/Lag Lead Lag Lag Lead Lag LagLead-Lag Optimize? Yes Yes YesVehicle Extension (s) 3.0 5.5 5.5 3.0 5.5 5.5 5.0 5.0 3.0 3.0Recall Mode None C-Max C-Max None C-Max C-Max None None None NoneWalk Time (s) 7.0 7.0 7.0 7.0 7.0 7.0 7.0 7.0Flash Dont Walk (s) 11.0 11.0 11.0 11.0 11.0 11.0 11.0 11.0Pedestrian Calls (#/hr) 0 0 0 0 0 0 0 0Act Effct Green (s) 67.3 59.5 59.5 93.8 84.0 84.0 15.3 15.3 15.3 15.3Actuated g/C Ratio 0.56 0.50 0.50 0.78 0.70 0.70 0.13 0.13 0.13 0.13v/c Ratio 0.48 0.85 0.09 0.94 1.08 0.10 0.61 0.56 0.67 0.31Control Delay 27.5 32.8 1.2 34.7 57.6 4.3 64.1 15.4 85.5 17.3Queue Delay 0.0 0.0 0.0 0.0 0.0 0.0 0.0 0.0 0.0 0.0Total Delay 27.5 32.8 1.2 34.7 57.6 4.3 64.1 15.4 85.5 17.3LOS C C A C E A E B F BApproach Delay 31.1 52.4 31.6 43.8Approach LOS C D C DQueue Length 50th (m) 3.4 156.4 0.0 88.3 ~385.8 5.0 23.2 4.8 12.2 2.9Queue Length 95th (m) 15.4 189.3 2.8 m86.0 m#364.6 m4.9 41.0 27.0 #29.2 17.1Internal Link Dist (m) 349.6 400.7 162.0 352.7Turn Bay Length (m) 120.0 70.0 120.0 70.0 70.0 70.0Base Capacity (vph) 151 1725 798 497 2504 1143 202 407 96 307Starvation Cap Reductn 0 0 0 0 0 0 0 0 0 0Spillback Cap Reductn 0 0 0 0 0 0 0 0 0 0Storage Cap Reductn 0 0 0 0 0 0 0 0 0 0Reduced v/c Ratio 0.48 0.85 0.09 0.94 1.08 0.10 0.51 0.52 0.56 0.28
Intersection SummaryArea Type: OtherCycle Length: 120Actuated Cycle Length: 120Offset: 62.4 (52%), Referenced to phase 2:EBTL and 6:WBTL, Start of GreenNatural Cycle: 150Control Type: Actuated-CoordinatedMaximum v/c Ratio: 1.08

Lanes, Volumes, Timings 2020 PM Total Future Conditions 1: Proudfoot Trail & Dundas Street Graydon Banning
Graydon Banning 7/28/2015 2020 PM Total Future Conditions Synchro 9 ReportMC Page 3
Intersection Signal Delay: 44.5 Intersection LOS: DIntersection Capacity Utilization 113.6% ICU Level of Service HAnalysis Period (min) 15~ Volume exceeds capacity, queue is theoretically infinite. Queue shown is maximum after two cycles.# 95th percentile volume exceeds capacity, queue may be longer. Queue shown is maximum after two cycles.m Volume for 95th percentile queue is metered by upstream signal.
Splits and Phases: 1: Proudfoot Trail & Dundas Street

HCM Signalized Intersection Capacity Analysis 2020 PM Total Future Conditions 1: Proudfoot Trail & Dundas Street Graydon Banning
Graydon Banning 7/28/2015 2020 PM Total Future Conditions Synchro 9 ReportMC Page 4
Movement EBL EBT EBR WBL WBT WBR NBL NBT NBR SBL SBT SBRLane ConfigurationsTraffic Volume (vph) 71 1699 70 456 3109 117 102 23 183 53 14 70Future Volume (vph) 71 1699 70 456 3109 117 102 23 183 53 14 70Ideal Flow (vphpl) 1900 1900 1900 1900 1900 1900 1900 1900 1900 1900 1900 1900Total Lost time (s) 4.0 5.9 5.9 4.0 5.9 5.9 6.9 6.9 6.9 6.9Lane Util. Factor 1.00 0.95 1.00 1.00 0.95 1.00 1.00 1.00 1.00 1.00Frpb, ped/bikes 1.00 1.00 0.97 1.00 1.00 1.00 1.00 1.00 1.00 1.00Flpb, ped/bikes 1.00 1.00 1.00 1.00 1.00 1.00 1.00 1.00 1.00 1.00Frt 1.00 1.00 0.85 1.00 1.00 0.85 1.00 0.87 1.00 0.87Flt Protected 0.95 1.00 1.00 0.95 1.00 1.00 0.95 1.00 0.95 1.00Satd. Flow (prot) 1789 3476 1500 1825 3579 1601 1825 1661 1789 1647Flt Permitted 0.07 1.00 1.00 0.06 1.00 1.00 0.70 1.00 0.34 1.00Satd. Flow (perm) 127 3476 1500 121 3579 1601 1348 1661 646 1647Peak-hour factor, PHF 0.98 0.98 0.98 0.98 0.98 0.98 0.98 0.98 0.98 0.98 0.98 0.98Growth Factor (vph) 100% 85% 100% 100% 85% 100% 100% 100% 100% 100% 100% 100%Adj. Flow (vph) 72 1474 71 465 2697 119 104 23 187 54 14 71RTOR Reduction (vph) 0 0 36 0 0 23 0 163 0 0 62 0Lane Group Flow (vph) 72 1474 35 465 2697 96 104 47 0 54 23 0Confl. Peds. (#/hr) 2 2Heavy Vehicles (%) 2% 5% 6% 0% 2% 2% 0% 2% 0% 2% 2% 2%Turn Type pm+pt NA Perm pm+pt NA Perm Perm NA Perm NAProtected Phases 5 2 1 6 8 4Permitted Phases 2 2 6 6 8 4Actuated Green, G (s) 64.2 59.5 59.5 91.9 83.2 83.2 15.3 15.3 15.3 15.3Effective Green, g (s) 64.2 59.5 59.5 91.9 83.2 83.2 15.3 15.3 15.3 15.3Actuated g/C Ratio 0.54 0.50 0.50 0.77 0.69 0.69 0.13 0.13 0.13 0.13Clearance Time (s) 4.0 5.9 5.9 4.0 5.9 5.9 6.9 6.9 6.9 6.9Vehicle Extension (s) 3.0 5.5 5.5 3.0 5.5 5.5 5.0 5.0 3.0 3.0Lane Grp Cap (vph) 133 1723 743 495 2481 1110 171 211 82 209v/s Ratio Prot 0.02 0.42 c0.22 c0.75 0.03 0.01v/s Ratio Perm 0.27 0.02 0.50 0.06 0.08 c0.08v/c Ratio 0.54 0.86 0.05 0.94 1.09 0.09 0.61 0.22 0.66 0.11Uniform Delay, d1 26.9 26.5 15.6 37.8 18.4 6.0 49.5 47.0 49.9 46.3Progression Factor 1.00 1.00 1.00 0.83 1.12 1.44 1.00 1.00 1.00 1.00Incremental Delay, d2 4.4 5.7 0.1 3.9 40.0 0.0 8.7 1.1 17.5 0.2Delay (s) 31.3 32.2 15.7 35.4 60.7 8.7 58.2 48.1 67.3 46.6Level of Service C C B D E A E D E DApproach Delay (s) 31.4 55.2 51.5 54.6Approach LOS C E D D
Intersection SummaryHCM 2000 Control Delay 47.8 HCM 2000 Level of Service DHCM 2000 Volume to Capacity ratio 1.03Actuated Cycle Length (s) 120.0 Sum of lost time (s) 16.8Intersection Capacity Utilization 113.6% ICU Level of Service HAnalysis Period (min) 15c Critical Lane Group

Lanes, Volumes, Timings 2020 PM Total Future Conditions 2: Fourth Line & Dundas Street Graydon Banning
Graydon Banning 7/28/2015 2020 PM Total Future Conditions Synchro 9 ReportMC Page 5
Lane Group EBT EBR WBL WBT NBL NBRLane ConfigurationsTraffic Volume (vph) 1920 15 15 3667 15 15Future Volume (vph) 1920 15 15 3667 15 15Ideal Flow (vphpl) 1900 1900 1900 1900 1900 1900Storage Length (m) 70.0 120.0 0.0 0.0Storage Lanes 1 1 1 1Taper Length (m) 70.0 2.5Lane Util. Factor 0.95 1.00 1.00 0.95 1.00 1.00Ped Bike Factor 0.97Frt 0.850 0.850Flt Protected 0.950 0.950Satd. Flow (prot) 3476 1633 1825 3579 1825 1633Flt Permitted 0.105 0.950Satd. Flow (perm) 3476 1590 202 3579 1825 1633Right Turn on Red Yes YesSatd. Flow (RTOR) 11 16Link Speed (k/h) 60 60 50Link Distance (m) 424.7 312.9 64.1Travel Time (s) 25.5 18.8 4.6Confl. Peds. (#/hr) 3 3Peak Hour Factor 0.94 0.94 0.94 0.94 0.94 0.94Growth Factor 85% 100% 100% 85% 100% 100%Heavy Vehicles (%) 5% 0% 0% 2% 0% 0%Adj. Flow (vph) 1736 16 16 3316 16 16Shared Lane Traffic (%)Lane Group Flow (vph) 1736 16 16 3316 16 16Enter Blocked Intersection No No No No No NoLane Alignment Left Right Left Left Left RightMedian Width(m) 3.7 3.7 3.7Link Offset(m) 0.0 0.0 0.0Crosswalk Width(m) 1.6 1.6 1.6Two way Left Turn LaneHeadway Factor 0.99 0.99 0.99 0.99 0.99 0.99Turning Speed (k/h) 14 24 24 14Number of Detectors 2 1 1 2 1 1Detector Template Thru Right Left Thru Left RightLeading Detector (m) 30.5 6.1 6.1 30.5 6.1 6.1Trailing Detector (m) 0.0 0.0 0.0 0.0 0.0 0.0Detector 1 Position(m) 0.0 0.0 0.0 0.0 0.0 0.0Detector 1 Size(m) 1.8 6.1 6.1 1.8 6.1 6.1Detector 1 Type Cl+Ex Cl+Ex Cl+Ex Cl+Ex Cl+Ex Cl+ExDetector 1 ChannelDetector 1 Extend (s) 0.0 0.0 0.0 0.0 0.0 0.0Detector 1 Queue (s) 0.0 0.0 0.0 0.0 0.0 0.0Detector 1 Delay (s) 0.0 0.0 0.0 0.0 0.0 0.0Detector 2 Position(m) 28.7 28.7Detector 2 Size(m) 1.8 1.8Detector 2 Type Cl+Ex Cl+ExDetector 2 Channel

Lanes, Volumes, Timings 2020 PM Total Future Conditions 2: Fourth Line & Dundas Street Graydon Banning
Graydon Banning 7/28/2015 2020 PM Total Future Conditions Synchro 9 ReportMC Page 6
Lane Group EBT EBR WBL WBT NBL NBRDetector 2 Extend (s) 0.0 0.0Turn Type NA Perm pm+pt NA Prot PermProtected Phases 2 1 6 8Permitted Phases 2 6 8Detector Phase 2 2 1 6 8 8Switch PhaseMinimum Initial (s) 5.0 5.0 5.0 5.0 5.0 5.0Minimum Split (s) 33.0 33.0 9.5 24.0 40.6 40.6Total Split (s) 65.0 65.0 12.0 77.0 43.0 43.0Total Split (%) 54.2% 54.2% 10.0% 64.2% 35.8% 35.8%Maximum Green (s) 59.0 59.0 8.0 71.0 36.4 36.4Yellow Time (s) 3.7 3.7 3.0 3.7 3.7 3.7All-Red Time (s) 2.3 2.3 1.0 2.3 2.9 2.9Lost Time Adjust (s) 0.0 0.0 0.0 0.0 0.0 0.0Total Lost Time (s) 6.0 6.0 4.0 6.0 6.6 6.6Lead/Lag Lag Lag LeadLead-Lag Optimize? Yes Yes YesVehicle Extension (s) 5.0 5.0 4.0 5.0 4.0 4.0Recall Mode C-Max C-Max None C-Max None NoneWalk Time (s) 7.0 7.0 7.0 7.0 7.0Flash Dont Walk (s) 20.0 20.0 7.0 27.0 27.0Pedestrian Calls (#/hr) 0 0 0 0 0Act Effct Green (s) 103.1 103.1 107.0 107.4 7.6 7.6Actuated g/C Ratio 0.86 0.86 0.89 0.90 0.06 0.06v/c Ratio 0.58 0.01 0.06 1.03 0.14 0.13Control Delay 1.9 0.0 1.9 37.0 55.1 25.0Queue Delay 0.0 0.0 0.0 0.0 0.0 0.0Total Delay 1.9 0.0 1.9 37.0 55.1 25.0LOS A A A D E CApproach Delay 1.9 36.9 40.1Approach LOS A D DQueue Length 50th (m) 7.8 0.0 0.4 ~471.0 3.6 0.0Queue Length 95th (m) 9.8 m0.0 1.4 #512.9 10.7 7.0Internal Link Dist (m) 400.7 288.9 40.1Turn Bay Length (m) 70.0 120.0Base Capacity (vph) 2987 1368 288 3204 553 506Starvation Cap Reductn 0 0 0 0 0 0Spillback Cap Reductn 0 0 0 0 0 0Storage Cap Reductn 0 0 0 0 0 0Reduced v/c Ratio 0.58 0.01 0.06 1.03 0.03 0.03
Intersection SummaryArea Type: OtherCycle Length: 120Actuated Cycle Length: 120Offset: 103.2 (86%), Referenced to phase 2:EBT and 6:WBTL, Start of GreenNatural Cycle: 145Control Type: Actuated-CoordinatedMaximum v/c Ratio: 1.03

Lanes, Volumes, Timings 2020 PM Total Future Conditions 2: Fourth Line & Dundas Street Graydon Banning
Graydon Banning 7/28/2015 2020 PM Total Future Conditions Synchro 9 ReportMC Page 7
Intersection Signal Delay: 24.9 Intersection LOS: CIntersection Capacity Utilization 100.8% ICU Level of Service GAnalysis Period (min) 15~ Volume exceeds capacity, queue is theoretically infinite. Queue shown is maximum after two cycles.# 95th percentile volume exceeds capacity, queue may be longer. Queue shown is maximum after two cycles.m Volume for 95th percentile queue is metered by upstream signal.
Splits and Phases: 2: Fourth Line & Dundas Street

HCM Signalized Intersection Capacity Analysis 2020 PM Total Future Conditions 2: Fourth Line & Dundas Street Graydon Banning
Graydon Banning 7/28/2015 2020 PM Total Future Conditions Synchro 9 ReportMC Page 8
Movement EBT EBR WBL WBT NBL NBRLane ConfigurationsTraffic Volume (vph) 1920 15 15 3667 15 15Future Volume (vph) 1920 15 15 3667 15 15Ideal Flow (vphpl) 1900 1900 1900 1900 1900 1900Total Lost time (s) 6.0 6.0 4.0 6.0 6.6 6.6Lane Util. Factor 0.95 1.00 1.00 0.95 1.00 1.00Frpb, ped/bikes 1.00 0.97 1.00 1.00 1.00 1.00Flpb, ped/bikes 1.00 1.00 1.00 1.00 1.00 1.00Frt 1.00 0.85 1.00 1.00 1.00 0.85Flt Protected 1.00 1.00 0.95 1.00 0.95 1.00Satd. Flow (prot) 3476 1590 1825 3579 1825 1633Flt Permitted 1.00 1.00 0.10 1.00 0.95 1.00Satd. Flow (perm) 3476 1590 201 3579 1825 1633Peak-hour factor, PHF 0.94 0.94 0.94 0.94 0.94 0.94Growth Factor (vph) 85% 100% 100% 85% 100% 100%Adj. Flow (vph) 1736 16 16 3316 16 16RTOR Reduction (vph) 0 2 0 0 0 15Lane Group Flow (vph) 1736 14 16 3316 16 1Confl. Peds. (#/hr) 3 3Heavy Vehicles (%) 5% 0% 0% 2% 0% 0%Turn Type NA Perm pm+pt NA Prot PermProtected Phases 2 1 6 8Permitted Phases 2 6 8Actuated Green, G (s) 95.7 95.7 102.4 102.4 5.0 5.0Effective Green, g (s) 95.7 95.7 102.4 102.4 5.0 5.0Actuated g/C Ratio 0.80 0.80 0.85 0.85 0.04 0.04Clearance Time (s) 6.0 6.0 4.0 6.0 6.6 6.6Vehicle Extension (s) 5.0 5.0 4.0 5.0 4.0 4.0Lane Grp Cap (vph) 2772 1268 208 3054 76 68v/s Ratio Prot 0.50 0.00 c0.93 c0.01v/s Ratio Perm 0.01 0.06 0.00v/c Ratio 0.63 0.01 0.08 1.09 0.21 0.01Uniform Delay, d1 4.9 2.5 3.7 8.8 55.6 55.1Progression Factor 0.28 0.01 1.00 1.00 1.00 1.00Incremental Delay, d2 0.6 0.0 0.2 45.0 1.9 0.1Delay (s) 2.0 0.0 3.9 53.8 57.5 55.2Level of Service A A A D E EApproach Delay (s) 2.0 53.6 56.3Approach LOS A D E
Intersection SummaryHCM 2000 Control Delay 35.9 HCM 2000 Level of Service DHCM 2000 Volume to Capacity ratio 1.09Actuated Cycle Length (s) 120.0 Sum of lost time (s) 16.6Intersection Capacity Utilization 100.8% ICU Level of Service GAnalysis Period (min) 15c Critical Lane Group

Lanes, Volumes, Timings 2020 PM Total Future Conditions 3: Proudfoot Trail & William Halton Parkway Graydon Banning
Graydon Banning 7/28/2015 2020 PM Total Future Conditions Synchro 9 ReportMC Page 9
Lane Group EBT EBR WBL WBT NBL NBRLane ConfigurationsTraffic Volume (vph) 986 7 14 1133 5 10Future Volume (vph) 986 7 14 1133 5 10Ideal Flow (vphpl) 1900 1900 1900 1900 1900 1900Lane Util. Factor 0.95 0.95 0.95 0.95 1.00 1.00Frt 0.999 0.907Flt Protected 0.999 0.985Satd. Flow (prot) 3575 0 0 3575 1683 0Flt Permitted 0.999 0.985Satd. Flow (perm) 3575 0 0 3575 1683 0Link Speed (k/h) 60 60 50Link Distance (m) 148.9 398.7 376.7Travel Time (s) 8.9 23.9 27.1Peak Hour Factor 0.92 0.92 0.92 0.92 0.92 0.92Adj. Flow (vph) 1072 8 15 1232 5 11Shared Lane Traffic (%)Lane Group Flow (vph) 1080 0 0 1247 16 0Enter Blocked Intersection No No No No No NoLane Alignment Left Right Left Left Left RightMedian Width(m) 3.7 3.7 3.7Link Offset(m) 0.0 0.0 0.0Crosswalk Width(m) 1.6 1.6 1.6Two way Left Turn LaneHeadway Factor 0.99 0.99 0.99 0.99 0.99 0.99Turning Speed (k/h) 14 24 24 14Sign Control Free Free Stop
Intersection SummaryArea Type: OtherControl Type: UnsignalizedIntersection Capacity Utilization 51.2% ICU Level of Service AAnalysis Period (min) 15

HCM Unsignalized Intersection Capacity Analysis 2020 PM Total Future Conditions 3: Proudfoot Trail & William Halton Parkway Graydon Banning
Graydon Banning 7/28/2015 2020 PM Total Future Conditions Synchro 9 ReportMC Page 10
Movement EBT EBR WBL WBT NBL NBRLane ConfigurationsTraffic Volume (veh/h) 986 7 14 1133 5 10Future Volume (Veh/h) 986 7 14 1133 5 10Sign Control Free Free StopGrade 0% 0% 0%Peak Hour Factor 0.92 0.92 0.92 0.92 0.92 0.92Hourly flow rate (vph) 1072 8 15 1232 5 11PedestriansLane Width (m)Walking Speed (m/s)Percent BlockageRight turn flare (veh)Median type None NoneMedian storage veh)Upstream signal (m)pX, platoon unblockedvC, conflicting volume 1080 1722 540vC1, stage 1 conf volvC2, stage 2 conf volvCu, unblocked vol 1080 1722 540tC, single (s) 4.1 6.8 6.9tC, 2 stage (s)tF (s) 2.2 3.5 3.3p0 queue free % 98 94 98cM capacity (veh/h) 641 78 486
Direction, Lane # EB 1 EB 2 WB 1 WB 2 NB 1Volume Total 715 365 426 821 16Volume Left 0 0 15 0 5Volume Right 0 8 0 0 11cSH 1700 1700 641 1700 185Volume to Capacity 0.42 0.21 0.02 0.48 0.09Queue Length 95th (m) 0.0 0.0 0.5 0.0 2.1Control Delay (s) 0.0 0.0 0.7 0.0 26.3Lane LOS A DApproach Delay (s) 0.0 0.2 26.3Approach LOS D
Intersection SummaryAverage Delay 0.3Intersection Capacity Utilization 51.2% ICU Level of Service AAnalysis Period (min) 15

Lanes, Volumes, Timings 2020 PM Total Future Conditions 4: New Access & William Halton Parkway Graydon Banning
Graydon Banning 7/28/2015 2020 PM Total Future Conditions Synchro 9 ReportMC Page 11
Lane Group EBT EBR WBL WBT NBL NBRLane ConfigurationsTraffic Volume (vph) 985 11 21 1141 6 12Future Volume (vph) 985 11 21 1141 6 12Ideal Flow (vphpl) 1900 1900 1900 1900 1900 1900Lane Util. Factor 0.95 0.95 0.95 0.95 1.00 1.00Frt 0.998 0.912Flt Protected 0.999 0.983Satd. Flow (prot) 3571 0 0 3575 1688 0Flt Permitted 0.999 0.983Satd. Flow (perm) 3571 0 0 3575 1688 0Link Speed (k/h) 60 60 50Link Distance (m) 398.7 121.4 110.4Travel Time (s) 23.9 7.3 7.9Peak Hour Factor 0.92 0.92 0.92 0.92 0.92 0.92Adj. Flow (vph) 1071 12 23 1240 7 13Shared Lane Traffic (%)Lane Group Flow (vph) 1083 0 0 1263 20 0Enter Blocked Intersection No No No No No NoLane Alignment Left Right Left Left Left RightMedian Width(m) 3.7 3.7 3.7Link Offset(m) 0.0 0.0 0.0Crosswalk Width(m) 1.6 1.6 1.6Two way Left Turn LaneHeadway Factor 0.99 0.99 0.99 0.99 0.99 0.99Turning Speed (k/h) 14 24 24 14Sign Control Free Free Stop
Intersection SummaryArea Type: OtherControl Type: UnsignalizedIntersection Capacity Utilization 56.5% ICU Level of Service BAnalysis Period (min) 15

HCM Unsignalized Intersection Capacity Analysis 2020 PM Total Future Conditions 4: New Access & William Halton Parkway Graydon Banning
Graydon Banning 7/28/2015 2020 PM Total Future Conditions Synchro 9 ReportMC Page 12
Movement EBT EBR WBL WBT NBL NBRLane ConfigurationsTraffic Volume (veh/h) 985 11 21 1141 6 12Future Volume (Veh/h) 985 11 21 1141 6 12Sign Control Free Free StopGrade 0% 0% 0%Peak Hour Factor 0.92 0.92 0.92 0.92 0.92 0.92Hourly flow rate (vph) 1071 12 23 1240 7 13PedestriansLane Width (m)Walking Speed (m/s)Percent BlockageRight turn flare (veh)Median type None NoneMedian storage veh)Upstream signal (m)pX, platoon unblockedvC, conflicting volume 1083 1743 542vC1, stage 1 conf volvC2, stage 2 conf volvCu, unblocked vol 1083 1743 542tC, single (s) 4.1 6.8 6.9tC, 2 stage (s)tF (s) 2.2 3.5 3.3p0 queue free % 96 91 97cM capacity (veh/h) 640 75 485
Direction, Lane # EB 1 EB 2 WB 1 WB 2 NB 1Volume Total 714 369 436 827 20Volume Left 0 0 23 0 7Volume Right 0 12 0 0 13cSH 1700 1700 640 1700 166Volume to Capacity 0.42 0.22 0.04 0.49 0.12Queue Length 95th (m) 0.0 0.0 0.8 0.0 3.1Control Delay (s) 0.0 0.0 1.1 0.0 29.6Lane LOS A DApproach Delay (s) 0.0 0.4 29.6Approach LOS D
Intersection SummaryAverage Delay 0.4Intersection Capacity Utilization 56.5% ICU Level of Service BAnalysis Period (min) 15

Lanes, Volumes, Timings 2025 AM Total Future Conditions 1: Proudfoot Trail & Dundas Street Graydon Banning
Graydon Banning 7/28/2015 2025 AM Total Future Conditions Synchro 9 ReportMC Page 1
Lane Group EBL EBT EBR WBL WBT WBR NBL NBT NBR SBL SBT SBRLane ConfigurationsTraffic Volume (vph) 28 3059 67 76 1528 70 80 14 450 147 46 108Future Volume (vph) 28 3059 67 76 1528 70 80 14 450 147 46 108Ideal Flow (vphpl) 1900 1900 1900 1900 1900 1900 1900 1900 1900 1900 1900 1900Storage Length (m) 120.0 70.0 120.0 70.0 70.0 0.0 70.0 0.0Storage Lanes 1 1 1 1 1 0 1 0Taper Length (m) 70.0 70.0 70.0 70.0Lane Util. Factor 1.00 0.95 1.00 1.00 0.95 1.00 1.00 1.00 1.00 1.00 1.00 1.00Ped Bike Factor 0.98 0.99Frt 0.850 0.850 0.854 0.895Flt Protected 0.950 0.950 0.950 0.950Satd. Flow (prot) 1789 3444 1498 1789 3230 1601 1755 1617 0 1789 1686 0Flt Permitted 0.109 0.063 0.635 0.172Satd. Flow (perm) 205 3444 1463 119 3230 1601 1173 1617 0 324 1686 0Right Turn on Red Yes Yes Yes YesSatd. Flow (RTOR) 72 72 90 101Link Speed (k/h) 60 60 50 48Link Distance (m) 373.6 424.7 186.0 406.8Travel Time (s) 22.4 25.5 13.4 30.5Confl. Peds. (#/hr) 1 1 1Peak Hour Factor 0.97 0.97 0.97 0.97 0.97 0.97 0.97 0.97 0.97 0.97 0.97 0.97Growth Factor 100% 85% 100% 100% 85% 100% 100% 100% 100% 100% 100% 100%Heavy Vehicles (%) 2% 6% 9% 2% 13% 2% 4% 2% 0% 2% 2% 2%Adj. Flow (vph) 29 2681 69 78 1339 72 82 14 464 152 47 111Shared Lane Traffic (%)Lane Group Flow (vph) 29 2681 69 78 1339 72 82 478 0 152 158 0Enter Blocked Intersection No No No No No No No No No No No NoLane Alignment Left Left Right Left Left Right Left Left Right Left Left RightMedian Width(m) 3.7 3.7 3.7 3.7Link Offset(m) 0.0 0.0 0.0 0.0Crosswalk Width(m) 1.6 1.6 1.6 1.6Two way Left Turn LaneHeadway Factor 0.99 0.99 0.99 0.99 0.99 0.99 0.99 0.99 0.99 0.99 0.99 0.99Turning Speed (k/h) 24 14 24 14 24 14 24 14Number of Detectors 1 2 1 1 2 1 1 2 1 2Detector Template Left Thru Right Left Thru Right Left Thru Left ThruLeading Detector (m) 6.1 30.5 6.1 6.1 30.5 6.1 6.1 30.5 6.1 30.5Trailing Detector (m) 0.0 0.0 0.0 0.0 0.0 0.0 0.0 0.0 0.0 0.0Detector 1 Position(m) 0.0 0.0 0.0 0.0 0.0 0.0 0.0 0.0 0.0 0.0Detector 1 Size(m) 6.1 1.8 6.1 6.1 1.8 6.1 6.1 1.8 6.1 1.8Detector 1 Type Cl+Ex Cl+Ex Cl+Ex Cl+Ex Cl+Ex Cl+Ex Cl+Ex Cl+Ex Cl+Ex Cl+ExDetector 1 ChannelDetector 1 Extend (s) 0.0 0.0 0.0 0.0 0.0 0.0 0.0 0.0 0.0 0.0Detector 1 Queue (s) 0.0 0.0 0.0 0.0 0.0 0.0 0.0 0.0 0.0 0.0Detector 1 Delay (s) 0.0 0.0 0.0 0.0 0.0 0.0 0.0 0.0 0.0 0.0Detector 2 Position(m) 28.7 28.7 28.7 28.7Detector 2 Size(m) 1.8 1.8 1.8 1.8Detector 2 Type Cl+Ex Cl+Ex Cl+Ex Cl+ExDetector 2 Channel

Lanes, Volumes, Timings 2025 AM Total Future Conditions 1: Proudfoot Trail & Dundas Street Graydon Banning
Graydon Banning 7/28/2015 2025 AM Total Future Conditions Synchro 9 ReportMC Page 2
Lane Group EBL EBT EBR WBL WBT WBR NBL NBT NBR SBL SBT SBRDetector 2 Extend (s) 0.0 0.0 0.0 0.0Turn Type pm+pt NA Perm pm+pt NA Perm Perm NA Perm NAProtected Phases 5 2 1 6 8 4Permitted Phases 2 2 6 6 8 4Detector Phase 5 2 2 1 6 6 8 8 4 4Switch PhaseMinimum Initial (s) 5.0 5.0 5.0 5.0 5.0 5.0 5.0 5.0 5.0 5.0Minimum Split (s) 9.5 23.9 23.9 9.5 23.9 23.9 24.9 24.9 24.9 24.9Total Split (s) 9.5 67.5 67.5 9.5 67.5 67.5 43.0 43.0 43.0 43.0Total Split (%) 7.9% 56.3% 56.3% 7.9% 56.3% 56.3% 35.8% 35.8% 35.8% 35.8%Maximum Green (s) 5.5 61.6 61.6 5.5 61.6 61.6 36.1 36.1 36.1 36.1Yellow Time (s) 3.0 3.7 3.7 3.0 3.7 3.7 3.3 3.3 3.3 3.3All-Red Time (s) 1.0 2.2 2.2 1.0 2.2 2.2 3.6 3.6 3.6 3.6Lost Time Adjust (s) 0.0 0.0 0.0 0.0 0.0 0.0 0.0 0.0 0.0 0.0Total Lost Time (s) 4.0 5.9 5.9 4.0 5.9 5.9 6.9 6.9 6.9 6.9Lead/Lag Lead Lag Lag Lead Lag LagLead-Lag Optimize? Yes Yes YesVehicle Extension (s) 3.0 5.5 5.5 3.0 5.5 5.5 5.0 5.0 3.0 3.0Recall Mode None C-Max C-Max None C-Max C-Max None None None NoneWalk Time (s) 7.0 7.0 7.0 7.0 7.0 7.0 7.0 7.0Flash Dont Walk (s) 11.0 11.0 11.0 11.0 11.0 11.0 11.0 11.0Pedestrian Calls (#/hr) 0 0 0 0 0 0 0 0Act Effct Green (s) 69.8 63.5 63.5 70.6 65.4 65.4 36.1 36.1 36.1 36.1Actuated g/C Ratio 0.58 0.53 0.53 0.59 0.54 0.54 0.30 0.30 0.30 0.30v/c Ratio 0.15 1.47 0.09 0.53 0.76 0.08 0.23 0.87 1.57 0.27Control Delay 11.2 241.4 3.4 32.1 22.9 3.3 33.8 49.9 330.0 13.7Queue Delay 0.0 0.0 0.0 0.0 0.0 0.0 0.0 0.0 0.0 0.0Total Delay 11.2 241.4 3.4 32.1 22.9 3.3 33.8 49.9 330.0 13.7LOS B F A C C A C D F BApproach Delay 233.1 22.4 47.5 168.8Approach LOS F C D FQueue Length 50th (m) 2.6 ~463.4 0.0 7.0 134.2 0.1 14.5 89.0 ~50.6 9.7Queue Length 95th (m) 6.3 #502.6 6.7 22.8 164.4 5.9 27.9 #147.9 #92.3 26.0Internal Link Dist (m) 349.6 400.7 162.0 382.8Turn Bay Length (m) 120.0 70.0 120.0 70.0 70.0 70.0Base Capacity (vph) 191 1822 808 146 1760 904 352 549 97 577Starvation Cap Reductn 0 0 0 0 0 0 0 0 0 0Spillback Cap Reductn 0 0 0 0 0 0 0 0 0 0Storage Cap Reductn 0 0 0 0 0 0 0 0 0 0Reduced v/c Ratio 0.15 1.47 0.09 0.53 0.76 0.08 0.23 0.87 1.57 0.27
Intersection SummaryArea Type: OtherCycle Length: 120Actuated Cycle Length: 120Offset: 80.4 (67%), Referenced to phase 2:EBTL and 6:WBTL, Start of GreenNatural Cycle: 150Control Type: Actuated-CoordinatedMaximum v/c Ratio: 1.57

Lanes, Volumes, Timings 2025 AM Total Future Conditions 1: Proudfoot Trail & Dundas Street Graydon Banning
Graydon Banning 7/28/2015 2025 AM Total Future Conditions Synchro 9 ReportMC Page 3
Intersection Signal Delay: 147.9 Intersection LOS: FIntersection Capacity Utilization 125.1% ICU Level of Service HAnalysis Period (min) 15~ Volume exceeds capacity, queue is theoretically infinite. Queue shown is maximum after two cycles.# 95th percentile volume exceeds capacity, queue may be longer. Queue shown is maximum after two cycles.
Splits and Phases: 1: Proudfoot Trail & Dundas Street

HCM Signalized Intersection Capacity Analysis 2025 AM Total Future Conditions 1: Proudfoot Trail & Dundas Street Graydon Banning
Graydon Banning 7/28/2015 2025 AM Total Future Conditions Synchro 9 ReportMC Page 4
Movement EBL EBT EBR WBL WBT WBR NBL NBT NBR SBL SBT SBRLane ConfigurationsTraffic Volume (vph) 28 3059 67 76 1528 70 80 14 450 147 46 108Future Volume (vph) 28 3059 67 76 1528 70 80 14 450 147 46 108Ideal Flow (vphpl) 1900 1900 1900 1900 1900 1900 1900 1900 1900 1900 1900 1900Total Lost time (s) 4.0 5.9 5.9 4.0 5.9 5.9 6.9 6.9 6.9 6.9Lane Util. Factor 1.00 0.95 1.00 1.00 0.95 1.00 1.00 1.00 1.00 1.00Frpb, ped/bikes 1.00 1.00 0.98 1.00 1.00 1.00 1.00 0.99 1.00 1.00Flpb, ped/bikes 1.00 1.00 1.00 1.00 1.00 1.00 1.00 1.00 1.00 1.00Frt 1.00 1.00 0.85 1.00 1.00 0.85 1.00 0.85 1.00 0.89Flt Protected 0.95 1.00 1.00 0.95 1.00 1.00 0.95 1.00 0.95 1.00Satd. Flow (prot) 1789 3444 1463 1789 3230 1601 1755 1618 1789 1685Flt Permitted 0.11 1.00 1.00 0.06 1.00 1.00 0.64 1.00 0.17 1.00Satd. Flow (perm) 206 3444 1463 118 3230 1601 1174 1618 324 1685Peak-hour factor, PHF 0.97 0.97 0.97 0.97 0.97 0.97 0.97 0.97 0.97 0.97 0.97 0.97Growth Factor (vph) 100% 85% 100% 100% 85% 100% 100% 100% 100% 100% 100% 100%Adj. Flow (vph) 29 2681 69 78 1339 72 82 14 464 152 47 111RTOR Reduction (vph) 0 0 33 0 0 34 0 63 0 0 71 0Lane Group Flow (vph) 29 2681 36 78 1339 38 82 415 0 152 87 0Confl. Peds. (#/hr) 1 1 1Heavy Vehicles (%) 2% 6% 9% 2% 13% 2% 4% 2% 0% 2% 2% 2%Turn Type pm+pt NA Perm pm+pt NA Perm Perm NA Perm NAProtected Phases 5 2 1 6 8 4Permitted Phases 2 2 6 6 8 4Actuated Green, G (s) 66.0 62.7 62.7 68.2 63.8 63.8 36.1 36.1 36.1 36.1Effective Green, g (s) 66.0 62.7 62.7 68.2 63.8 63.8 36.1 36.1 36.1 36.1Actuated g/C Ratio 0.55 0.52 0.52 0.57 0.53 0.53 0.30 0.30 0.30 0.30Clearance Time (s) 4.0 5.9 5.9 4.0 5.9 5.9 6.9 6.9 6.9 6.9Vehicle Extension (s) 3.0 5.5 5.5 3.0 5.5 5.5 5.0 5.0 3.0 3.0Lane Grp Cap (vph) 156 1799 764 128 1717 851 353 486 97 506v/s Ratio Prot 0.01 c0.78 c0.02 0.41 0.26 0.05v/s Ratio Perm 0.10 0.02 0.32 0.02 0.07 c0.47v/c Ratio 0.19 1.49 0.05 0.61 0.78 0.04 0.23 0.85 1.57 0.17Uniform Delay, d1 16.2 28.6 14.0 27.2 22.5 13.5 31.5 39.5 42.0 30.9Progression Factor 1.00 1.00 1.00 1.48 0.90 0.92 1.00 1.00 1.00 1.00Incremental Delay, d2 0.6 223.6 0.1 7.0 3.2 0.1 0.7 14.8 298.9 0.2Delay (s) 16.8 252.3 14.1 47.4 23.3 12.5 32.2 54.3 340.9 31.1Level of Service B F B D C B C D F CApproach Delay (s) 243.9 24.0 51.1 183.0Approach LOS F C D F
Intersection SummaryHCM 2000 Control Delay 155.5 HCM 2000 Level of Service FHCM 2000 Volume to Capacity ratio 1.48Actuated Cycle Length (s) 120.0 Sum of lost time (s) 16.8Intersection Capacity Utilization 125.1% ICU Level of Service HAnalysis Period (min) 15c Critical Lane Group

Lanes, Volumes, Timings 2025 AM Total Future Conditions 2: Fourth Line & Dundas Street Graydon Banning
Graydon Banning 7/28/2015 2025 AM Total Future Conditions Synchro 9 ReportMC Page 5
Lane Group EBT EBR WBL WBT NBL NBRLane ConfigurationsTraffic Volume (vph) 3641 15 15 1659 15 15Future Volume (vph) 3641 15 15 1659 15 15Ideal Flow (vphpl) 1900 1900 1900 1900 1900 1900Storage Length (m) 70.0 120.0 0.0 0.0Storage Lanes 1 1 1 1Taper Length (m) 70.0 2.5Lane Util. Factor 0.95 1.00 1.00 0.95 1.00 1.00Ped Bike Factor 0.97Frt 0.850 0.850Flt Protected 0.950 0.950Satd. Flow (prot) 3510 1512 1825 3288 1825 1361Flt Permitted 0.040 0.950Satd. Flow (perm) 3510 1472 77 3288 1825 1361Right Turn on Red Yes YesSatd. Flow (RTOR) 6 16Link Speed (k/h) 60 60 50Link Distance (m) 424.7 312.9 64.1Travel Time (s) 25.5 18.8 4.6Confl. Peds. (#/hr) 3 3Peak Hour Factor 0.94 0.94 0.94 0.94 0.94 0.94Growth Factor 85% 100% 100% 85% 100% 100%Heavy Vehicles (%) 4% 8% 0% 11% 0% 20%Adj. Flow (vph) 3292 16 16 1500 16 16Shared Lane Traffic (%)Lane Group Flow (vph) 3292 16 16 1500 16 16Enter Blocked Intersection No No No No No NoLane Alignment Left Right Left Left Left RightMedian Width(m) 3.7 3.7 3.7Link Offset(m) 0.0 0.0 0.0Crosswalk Width(m) 1.6 1.6 1.6Two way Left Turn LaneHeadway Factor 0.99 0.99 0.99 0.99 0.99 0.99Turning Speed (k/h) 14 24 24 14Number of Detectors 2 1 1 2 1 1Detector Template Thru Right Left Thru Left RightLeading Detector (m) 30.5 6.1 6.1 30.5 6.1 6.1Trailing Detector (m) 0.0 0.0 0.0 0.0 0.0 0.0Detector 1 Position(m) 0.0 0.0 0.0 0.0 0.0 0.0Detector 1 Size(m) 1.8 6.1 6.1 1.8 6.1 6.1Detector 1 Type Cl+Ex Cl+Ex Cl+Ex Cl+Ex Cl+Ex Cl+ExDetector 1 ChannelDetector 1 Extend (s) 0.0 0.0 0.0 0.0 0.0 0.0Detector 1 Queue (s) 0.0 0.0 0.0 0.0 0.0 0.0Detector 1 Delay (s) 0.0 0.0 0.0 0.0 0.0 0.0Detector 2 Position(m) 28.7 28.7Detector 2 Size(m) 1.8 1.8Detector 2 Type Cl+Ex Cl+ExDetector 2 Channel

Lanes, Volumes, Timings 2025 AM Total Future Conditions 2: Fourth Line & Dundas Street Graydon Banning
Graydon Banning 7/28/2015 2025 AM Total Future Conditions Synchro 9 ReportMC Page 6
Lane Group EBT EBR WBL WBT NBL NBRDetector 2 Extend (s) 0.0 0.0Turn Type NA Perm pm+pt NA Prot PermProtected Phases 2 1 6 8Permitted Phases 2 6 8Detector Phase 2 2 1 6 8 8Switch PhaseMinimum Initial (s) 5.0 5.0 5.0 5.0 5.0 5.0Minimum Split (s) 33.0 33.0 9.5 24.0 40.6 40.6Total Split (s) 69.9 69.9 9.5 79.4 40.6 40.6Total Split (%) 58.3% 58.3% 7.9% 66.2% 33.8% 33.8%Maximum Green (s) 63.9 63.9 5.5 73.4 34.0 34.0Yellow Time (s) 3.7 3.7 3.0 3.7 3.7 3.7All-Red Time (s) 2.3 2.3 1.0 2.3 2.9 2.9Lost Time Adjust (s) 0.0 0.0 0.0 0.0 0.0 0.0Total Lost Time (s) 6.0 6.0 4.0 6.0 6.6 6.6Lead/Lag Lag Lag LeadLead-Lag Optimize? Yes Yes YesVehicle Extension (s) 5.0 5.0 4.0 5.0 4.0 4.0Recall Mode C-Max C-Max None C-Max None NoneWalk Time (s) 7.0 7.0 7.0 7.0 7.0Flash Dont Walk (s) 20.0 20.0 7.0 27.0 27.0Pedestrian Calls (#/hr) 0 0 0 0 0Act Effct Green (s) 103.1 103.1 107.0 107.4 7.6 7.6Actuated g/C Ratio 0.86 0.86 0.89 0.90 0.06 0.06v/c Ratio 1.09 0.01 0.10 0.51 0.14 0.16Control Delay 59.7 1.0 2.7 3.0 55.1 26.0Queue Delay 0.0 0.0 0.0 0.0 0.0 0.0Total Delay 59.7 1.0 2.7 3.0 55.1 26.0LOS E A A A E CApproach Delay 59.4 3.0 40.6Approach LOS E A DQueue Length 50th (m) ~250.0 0.1 0.4 43.2 3.6 0.0Queue Length 95th (m) m81.0 m0.1 1.4 59.6 10.7 7.0Internal Link Dist (m) 400.7 288.9 40.1Turn Bay Length (m) 70.0 120.0Base Capacity (vph) 3016 1266 165 2944 517 397Starvation Cap Reductn 0 0 0 0 0 0Spillback Cap Reductn 0 0 0 0 0 0Storage Cap Reductn 0 0 0 0 0 0Reduced v/c Ratio 1.09 0.01 0.10 0.51 0.03 0.04
Intersection SummaryArea Type: OtherCycle Length: 120Actuated Cycle Length: 120Offset: 103.2 (86%), Referenced to phase 2:EBT and 6:WBTL, Start of GreenNatural Cycle: 145Control Type: Actuated-CoordinatedMaximum v/c Ratio: 1.09

Lanes, Volumes, Timings 2025 AM Total Future Conditions 2: Fourth Line & Dundas Street Graydon Banning
Graydon Banning 7/28/2015 2025 AM Total Future Conditions Synchro 9 ReportMC Page 7
Intersection Signal Delay: 41.7 Intersection LOS: DIntersection Capacity Utilization 100.2% ICU Level of Service GAnalysis Period (min) 15~ Volume exceeds capacity, queue is theoretically infinite. Queue shown is maximum after two cycles.m Volume for 95th percentile queue is metered by upstream signal.
Splits and Phases: 2: Fourth Line & Dundas Street

HCM Signalized Intersection Capacity Analysis 2025 AM Total Future Conditions 2: Fourth Line & Dundas Street Graydon Banning
Graydon Banning 7/28/2015 2025 AM Total Future Conditions Synchro 9 ReportMC Page 8
Movement EBT EBR WBL WBT NBL NBRLane ConfigurationsTraffic Volume (vph) 3641 15 15 1659 15 15Future Volume (vph) 3641 15 15 1659 15 15Ideal Flow (vphpl) 1900 1900 1900 1900 1900 1900Total Lost time (s) 6.0 6.0 4.0 6.0 6.6 6.6Lane Util. Factor 0.95 1.00 1.00 0.95 1.00 1.00Frpb, ped/bikes 1.00 0.97 1.00 1.00 1.00 1.00Flpb, ped/bikes 1.00 1.00 1.00 1.00 1.00 1.00Frt 1.00 0.85 1.00 1.00 1.00 0.85Flt Protected 1.00 1.00 0.95 1.00 0.95 1.00Satd. Flow (prot) 3510 1472 1825 3288 1825 1361Flt Permitted 1.00 1.00 0.04 1.00 0.95 1.00Satd. Flow (perm) 3510 1472 77 3288 1825 1361Peak-hour factor, PHF 0.94 0.94 0.94 0.94 0.94 0.94Growth Factor (vph) 85% 100% 100% 85% 100% 100%Adj. Flow (vph) 3292 16 16 1500 16 16RTOR Reduction (vph) 0 1 0 0 0 15Lane Group Flow (vph) 3292 15 16 1500 16 1Confl. Peds. (#/hr) 3 3Heavy Vehicles (%) 4% 8% 0% 11% 0% 20%Turn Type NA Perm pm+pt NA Prot PermProtected Phases 2 1 6 8Permitted Phases 2 6 8Actuated Green, G (s) 95.7 95.7 102.4 102.4 5.0 5.0Effective Green, g (s) 95.7 95.7 102.4 102.4 5.0 5.0Actuated g/C Ratio 0.80 0.80 0.85 0.85 0.04 0.04Clearance Time (s) 6.0 6.0 4.0 6.0 6.6 6.6Vehicle Extension (s) 5.0 5.0 4.0 5.0 4.0 4.0Lane Grp Cap (vph) 2799 1173 105 2805 76 56v/s Ratio Prot c0.94 0.00 c0.46 c0.01v/s Ratio Perm 0.01 0.13 0.00v/c Ratio 1.18 0.01 0.15 0.53 0.21 0.01Uniform Delay, d1 12.1 2.5 39.8 2.4 55.6 55.1Progression Factor 1.59 0.31 1.00 1.00 1.00 1.00Incremental Delay, d2 79.6 0.0 0.9 0.7 1.9 0.1Delay (s) 98.9 0.8 40.7 3.1 57.5 55.2Level of Service F A D A E EApproach Delay (s) 98.4 3.5 56.4Approach LOS F A E
Intersection SummaryHCM 2000 Control Delay 68.5 HCM 2000 Level of Service EHCM 2000 Volume to Capacity ratio 1.12Actuated Cycle Length (s) 120.0 Sum of lost time (s) 16.6Intersection Capacity Utilization 100.2% ICU Level of Service GAnalysis Period (min) 15c Critical Lane Group

Lanes, Volumes, Timings 2025 AM Total Future Conditions 3: Proudfoot Trail & William Halton Parkway Graydon Banning
Graydon Banning 7/28/2015 2025 AM Total Future Conditions Synchro 9 ReportMC Page 9
Lane Group EBL EBT EBR WBL WBT WBR NBL NBT NBR SBL SBT SBRLane ConfigurationsTraffic Volume (vph) 6 1148 3 82 1050 4 6 6 33 15 19 21Future Volume (vph) 6 1148 3 82 1050 4 6 6 33 15 19 21Ideal Flow (vphpl) 1900 1900 1900 1900 1900 1900 1900 1900 1900 1900 1900 1900Lane Util. Factor 0.95 0.95 0.95 0.95 0.95 0.95 1.00 1.00 1.00 1.00 1.00 1.00Frt 0.903 0.948Flt Protected 0.996 0.993 0.987Satd. Flow (prot) 0 3579 0 0 3564 0 0 1689 0 0 1762 0Flt Permitted 0.996 0.993 0.987Satd. Flow (perm) 0 3579 0 0 3564 0 0 1689 0 0 1762 0Link Speed (k/h) 60 60 50 50Link Distance (m) 153.4 363.2 406.8 89.2Travel Time (s) 9.2 21.8 29.3 6.4Peak Hour Factor 0.92 0.92 0.92 0.92 0.92 0.92 0.92 0.92 0.92 0.92 0.92 0.92Adj. Flow (vph) 7 1248 3 89 1141 4 7 7 36 16 21 23Shared Lane Traffic (%)Lane Group Flow (vph) 0 1258 0 0 1234 0 0 50 0 0 60 0Enter Blocked Intersection No No No No No No No No No No No NoLane Alignment Left Left Right Left Left Right Left Left Right Left Left RightMedian Width(m) 3.7 3.7 0.0 0.0Link Offset(m) 0.0 0.0 0.0 0.0Crosswalk Width(m) 1.6 1.6 1.6 1.6Two way Left Turn LaneHeadway Factor 0.99 0.99 0.99 0.99 0.99 0.99 0.99 0.99 0.99 0.99 0.99 0.99Turning Speed (k/h) 24 14 24 14 24 14 24 14Sign Control Free Free Stop Stop
Intersection SummaryArea Type: OtherControl Type: UnsignalizedIntersection Capacity Utilization 79.2% ICU Level of Service DAnalysis Period (min) 15

HCM Unsignalized Intersection Capacity Analysis 2025 AM Total Future Conditions 3: Proudfoot Trail & William Halton Parkway Graydon Banning
Graydon Banning 7/28/2015 2025 AM Total Future Conditions Synchro 9 ReportMC Page 10
Movement EBL EBT EBR WBL WBT WBR NBL NBT NBR SBL SBT SBRLane ConfigurationsTraffic Volume (veh/h) 6 1148 3 82 1050 4 6 6 33 15 19 21Future Volume (Veh/h) 6 1148 3 82 1050 4 6 6 33 15 19 21Sign Control Free Free Stop StopGrade 0% 0% 0% 0%Peak Hour Factor 0.92 0.92 0.92 0.92 0.92 0.92 0.92 0.92 0.92 0.92 0.92 0.92Hourly flow rate (vph) 7 1248 3 89 1141 4 7 7 36 16 21 23PedestriansLane Width (m)Walking Speed (m/s)Percent BlockageRight turn flare (veh)Median type None NoneMedian storage veh)Upstream signal (m)pX, platoon unblockedvC, conflicting volume 1145 1251 2046 2586 626 1998 2586 572vC1, stage 1 conf volvC2, stage 2 conf volvCu, unblocked vol 1145 1251 2046 2586 626 1998 2586 572tC, single (s) 4.1 4.1 7.5 6.5 6.9 7.5 6.5 6.9tC, 2 stage (s)tF (s) 2.2 2.2 3.5 4.0 3.3 3.5 4.0 3.3p0 queue free % 99 84 0 66 92 24 0 95cM capacity (veh/h) 606 552 0 21 427 21 21 463
Direction, Lane # EB 1 EB 2 WB 1 WB 2 NB 1 SB 1Volume Total 631 627 660 574 50 60Volume Left 7 0 89 0 7 16Volume Right 0 3 0 4 36 23cSH 606 1700 552 1700 0 33Volume to Capacity 0.01 0.37 0.16 0.34 Err 1.83Queue Length 95th (m) 0.3 0.0 4.3 0.0 Err 51.2Control Delay (s) 0.3 0.0 4.4 0.0 Err 654.3Lane LOS A A F FApproach Delay (s) 0.2 2.4 Err 654.3Approach LOS F F
Intersection SummaryAverage Delay ErrIntersection Capacity Utilization 79.2% ICU Level of Service DAnalysis Period (min) 15

Lanes, Volumes, Timings 2025 AM Total Future Conditions 4: New Access & William Halton Parkway Graydon Banning
Graydon Banning 7/28/2015 2025 AM Total Future Conditions Synchro 9 ReportMC Page 11
Lane Group EBL EBT EBR WBL WBT WBR NBL NBT NBR SBL SBT SBRLane ConfigurationsTraffic Volume (vph) 36 1157 3 6 989 6 11 0 22 24 0 137Future Volume (vph) 36 1157 3 6 989 6 11 0 22 24 0 137Ideal Flow (vphpl) 1900 1900 1900 1900 1900 1900 1900 1900 1900 1900 1900 1900Lane Util. Factor 0.95 0.95 0.95 0.95 0.95 0.95 1.00 1.00 1.00 1.00 1.00 1.00Frt 0.999 0.910 0.885Flt Protected 0.999 0.984 0.993Satd. Flow (prot) 0 3575 0 0 3575 0 0 1687 0 0 1655 0Flt Permitted 0.999 0.984 0.993Satd. Flow (perm) 0 3575 0 0 3575 0 0 1687 0 0 1655 0Link Speed (k/h) 60 60 48 48Link Distance (m) 363.2 219.4 79.0 79.4Travel Time (s) 21.8 13.2 5.9 6.0Peak Hour Factor 0.92 0.92 0.92 0.92 0.92 0.92 0.92 0.92 0.92 0.92 0.92 0.92Adj. Flow (vph) 39 1258 3 7 1075 7 12 0 24 26 0 149Shared Lane Traffic (%)Lane Group Flow (vph) 0 1300 0 0 1089 0 0 36 0 0 175 0Enter Blocked Intersection No No No No No No No No No No No NoLane Alignment Left Left Right Left Left Right Left Left Right Left Left RightMedian Width(m) 3.7 3.7 0.0 0.0Link Offset(m) 0.0 0.0 0.0 0.0Crosswalk Width(m) 1.6 1.6 1.6 1.6Two way Left Turn LaneHeadway Factor 0.99 0.99 0.99 0.99 0.99 0.99 0.99 0.99 0.99 0.99 0.99 0.99Turning Speed (k/h) 24 14 24 14 24 14 24 14Sign Control Free Free Stop Stop
Intersection SummaryArea Type: OtherControl Type: UnsignalizedIntersection Capacity Utilization 75.5% ICU Level of Service DAnalysis Period (min) 15

HCM Unsignalized Intersection Capacity Analysis 2025 AM Total Future Conditions 4: New Access & William Halton Parkway Graydon Banning
Graydon Banning 7/28/2015 2025 AM Total Future Conditions Synchro 9 ReportMC Page 12
Movement EBL EBT EBR WBL WBT WBR NBL NBT NBR SBL SBT SBRLane ConfigurationsTraffic Volume (veh/h) 36 1157 3 6 989 6 11 0 22 24 0 137Future Volume (Veh/h) 36 1157 3 6 989 6 11 0 22 24 0 137Sign Control Free Free Stop StopGrade 0% 0% 0% 0%Peak Hour Factor 0.92 0.92 0.92 0.92 0.92 0.92 0.92 0.92 0.92 0.92 0.92 0.92Hourly flow rate (vph) 39 1258 3 7 1075 7 12 0 24 26 0 149PedestriansLane Width (m)Walking Speed (m/s)Percent BlockageRight turn flare (veh)Median type None NoneMedian storage veh)Upstream signal (m)pX, platoon unblockedvC, conflicting volume 1082 1261 2038 2434 630 1824 2432 541vC1, stage 1 conf volvC2, stage 2 conf volvCu, unblocked vol 1082 1261 2038 2434 630 1824 2432 541tC, single (s) 4.1 4.1 7.5 6.5 6.9 7.5 6.5 6.9tC, 2 stage (s)tF (s) 2.2 2.2 3.5 4.0 3.3 3.5 4.0 3.3p0 queue free % 94 99 45 100 94 39 100 69cM capacity (veh/h) 640 547 22 29 424 43 29 485
Direction, Lane # EB 1 EB 2 WB 1 WB 2 NB 1 SB 1Volume Total 668 632 544 544 36 175Volume Left 39 0 7 0 12 26Volume Right 0 3 0 7 24 149cSH 640 1700 547 1700 59 192Volume to Capacity 0.06 0.37 0.01 0.32 0.61 0.91Queue Length 95th (m) 1.5 0.0 0.3 0.0 19.1 54.2Control Delay (s) 1.6 0.0 0.4 0.0 135.2 94.4Lane LOS A A F FApproach Delay (s) 0.8 0.2 135.2 94.4Approach LOS F F
Intersection SummaryAverage Delay 8.7Intersection Capacity Utilization 75.5% ICU Level of Service DAnalysis Period (min) 15

Lanes, Volumes, Timings 2025 PM Total Future Conditions 1: Proudfoot Trail & Dundas Street Graydon Banning
Graydon Banning 7/28/2015 2025 PM Total Future Conditions Synchro 9 ReportMC Page 1
Lane Group EBL EBT EBR WBL WBT WBR NBL NBT NBR SBL SBT SBRLane ConfigurationsTraffic Volume (vph) 86 1930 78 528 3591 176 116 45 212 85 26 78Future Volume (vph) 86 1930 78 528 3591 176 116 45 212 85 26 78Ideal Flow (vphpl) 1900 1900 1900 1900 1900 1900 1900 1900 1900 1900 1900 1900Storage Length (m) 120.0 70.0 120.0 70.0 70.0 0.0 70.0 70.0Storage Lanes 1 1 1 1 1 0 1 0Taper Length (m) 70.0 70.0 70.0 70.0Lane Util. Factor 1.00 0.95 1.00 1.00 0.95 1.00 1.00 1.00 1.00 1.00 1.00 1.00Ped Bike Factor 0.97Frt 0.850 0.850 0.876 0.888Flt Protected 0.950 0.950 0.950 0.950Satd. Flow (prot) 1789 3476 1541 1825 3579 1601 1825 1677 0 1789 1672 0Flt Permitted 0.070 0.065 0.688 0.252Satd. Flow (perm) 132 3476 1500 125 3579 1601 1322 1677 0 475 1672 0Right Turn on Red Yes Yes Yes YesSatd. Flow (RTOR) 108 100 166 75Link Speed (k/h) 60 60 50 48Link Distance (m) 373.6 424.7 186.0 376.7Travel Time (s) 22.4 25.5 13.4 28.3Confl. Peds. (#/hr) 2 2Peak Hour Factor 0.98 0.98 0.98 0.98 0.98 0.98 0.98 0.98 0.98 0.98 0.98 0.98Growth Factor 100% 85% 100% 100% 85% 100% 100% 100% 100% 100% 100% 100%Heavy Vehicles (%) 2% 5% 6% 0% 2% 2% 0% 2% 0% 2% 2% 2%Adj. Flow (vph) 88 1674 80 539 3115 180 118 46 216 87 27 80Shared Lane Traffic (%)Lane Group Flow (vph) 88 1674 80 539 3115 180 118 262 0 87 107 0Enter Blocked Intersection No No No No No No No No No No No NoLane Alignment Left Left Right Left Left Right Left Left Right Left Left RightMedian Width(m) 3.7 3.7 3.7 3.7Link Offset(m) 0.0 0.0 0.0 0.0Crosswalk Width(m) 1.6 1.6 1.6 1.6Two way Left Turn LaneHeadway Factor 0.99 0.99 0.99 0.99 0.99 0.99 0.99 0.99 0.99 0.99 0.99 0.99Turning Speed (k/h) 24 14 24 14 24 14 24 14Number of Detectors 1 2 1 1 2 1 1 2 1 2Detector Template Left Thru Right Left Thru Right Left Thru Left ThruLeading Detector (m) 6.1 30.5 6.1 6.1 30.5 6.1 6.1 30.5 6.1 30.5Trailing Detector (m) 0.0 0.0 0.0 0.0 0.0 0.0 0.0 0.0 0.0 0.0Detector 1 Position(m) 0.0 0.0 0.0 0.0 0.0 0.0 0.0 0.0 0.0 0.0Detector 1 Size(m) 6.1 1.8 6.1 6.1 1.8 6.1 6.1 1.8 6.1 1.8Detector 1 Type Cl+Ex Cl+Ex Cl+Ex Cl+Ex Cl+Ex Cl+Ex Cl+Ex Cl+Ex Cl+Ex Cl+ExDetector 1 ChannelDetector 1 Extend (s) 0.0 0.0 0.0 0.0 0.0 0.0 0.0 0.0 0.0 0.0Detector 1 Queue (s) 0.0 0.0 0.0 0.0 0.0 0.0 0.0 0.0 0.0 0.0Detector 1 Delay (s) 0.0 0.0 0.0 0.0 0.0 0.0 0.0 0.0 0.0 0.0Detector 2 Position(m) 28.7 28.7 28.7 28.7Detector 2 Size(m) 1.8 1.8 1.8 1.8Detector 2 Type Cl+Ex Cl+Ex Cl+Ex Cl+ExDetector 2 Channel

Lanes, Volumes, Timings 2025 PM Total Future Conditions 1: Proudfoot Trail & Dundas Street Graydon Banning
Graydon Banning 7/28/2015 2025 PM Total Future Conditions Synchro 9 ReportMC Page 2
Lane Group EBL EBT EBR WBL WBT WBR NBL NBT NBR SBL SBT SBRDetector 2 Extend (s) 0.0 0.0 0.0 0.0Turn Type pm+pt NA Perm pm+pt NA Perm Perm NA Perm NAProtected Phases 5 2 1 6 8 4Permitted Phases 2 2 6 6 8 4Detector Phase 5 2 2 1 6 6 8 8 4 4Switch PhaseMinimum Initial (s) 5.0 5.0 5.0 5.0 5.0 5.0 5.0 5.0 5.0 5.0Minimum Split (s) 9.5 23.9 23.9 9.5 23.9 23.9 24.9 24.9 24.9 24.9Total Split (s) 9.5 63.4 63.4 31.6 85.5 85.5 25.0 25.0 25.0 25.0Total Split (%) 7.9% 52.8% 52.8% 26.3% 71.3% 71.3% 20.8% 20.8% 20.8% 20.8%Maximum Green (s) 5.5 57.5 57.5 27.6 79.6 79.6 18.1 18.1 18.1 18.1Yellow Time (s) 3.0 3.7 3.7 3.0 3.7 3.7 3.3 3.3 3.3 3.3All-Red Time (s) 1.0 2.2 2.2 1.0 2.2 2.2 3.6 3.6 3.6 3.6Lost Time Adjust (s) 0.0 0.0 0.0 0.0 0.0 0.0 0.0 0.0 0.0 0.0Total Lost Time (s) 4.0 5.9 5.9 4.0 5.9 5.9 6.9 6.9 6.9 6.9Lead/Lag Lead Lag Lag Lead Lag LagLead-Lag Optimize? Yes Yes YesVehicle Extension (s) 3.0 5.5 5.5 3.0 5.5 5.5 5.0 5.0 3.0 3.0Recall Mode None C-Max C-Max None C-Max C-Max None None None NoneWalk Time (s) 7.0 7.0 7.0 7.0 7.0 7.0 7.0 7.0Flash Dont Walk (s) 11.0 11.0 11.0 11.0 11.0 11.0 11.0 11.0Pedestrian Calls (#/hr) 0 0 0 0 0 0 0 0Act Effct Green (s) 64.9 57.5 57.5 91.0 79.6 79.6 18.1 18.1 18.1 18.1Actuated g/C Ratio 0.54 0.48 0.48 0.76 0.66 0.66 0.15 0.15 0.15 0.15v/c Ratio 0.60 1.01 0.10 1.11 1.31 0.16 0.59 0.67 1.23 0.34Control Delay 37.4 54.9 1.7 84.0 164.8 4.8 60.8 27.0 222.9 20.0Queue Delay 0.0 0.0 0.0 0.0 0.0 0.0 0.0 0.0 0.0 0.0Total Delay 37.4 54.9 1.7 84.0 164.8 4.8 60.8 27.0 222.9 20.0LOS D D A F F A E C F CApproach Delay 51.7 145.9 37.5 111.0Approach LOS D F D FQueue Length 50th (m) 4.5 ~205.0 0.0 ~127.9 ~497.8 9.1 26.2 20.6 ~25.1 6.6Queue Length 95th (m) #23.9 #259.4 4.5 m62.4 m205.3 m4.1 46.1 49.4 #57.9 22.8Internal Link Dist (m) 349.6 400.7 162.0 352.7Turn Bay Length (m) 120.0 70.0 120.0 70.0 70.0 70.0Base Capacity (vph) 147 1665 775 485 2374 1095 199 393 71 315Starvation Cap Reductn 0 0 0 0 0 0 0 0 0 0Spillback Cap Reductn 0 0 0 0 0 0 0 0 0 0Storage Cap Reductn 0 0 0 0 0 0 0 0 0 0Reduced v/c Ratio 0.60 1.01 0.10 1.11 1.31 0.16 0.59 0.67 1.23 0.34
Intersection SummaryArea Type: OtherCycle Length: 120Actuated Cycle Length: 120Offset: 62.4 (52%), Referenced to phase 2:EBTL and 6:WBTL, Start of GreenNatural Cycle: 150Control Type: Actuated-CoordinatedMaximum v/c Ratio: 1.31

Lanes, Volumes, Timings 2025 PM Total Future Conditions 1: Proudfoot Trail & Dundas Street Graydon Banning
Graydon Banning 7/28/2015 2025 PM Total Future Conditions Synchro 9 ReportMC Page 3
Intersection Signal Delay: 110.5 Intersection LOS: FIntersection Capacity Utilization 129.0% ICU Level of Service HAnalysis Period (min) 15~ Volume exceeds capacity, queue is theoretically infinite. Queue shown is maximum after two cycles.# 95th percentile volume exceeds capacity, queue may be longer. Queue shown is maximum after two cycles.m Volume for 95th percentile queue is metered by upstream signal.
Splits and Phases: 1: Proudfoot Trail & Dundas Street

HCM Signalized Intersection Capacity Analysis 2025 PM Total Future Conditions 1: Proudfoot Trail & Dundas Street Graydon Banning
Graydon Banning 7/28/2015 2025 PM Total Future Conditions Synchro 9 ReportMC Page 4
Movement EBL EBT EBR WBL WBT WBR NBL NBT NBR SBL SBT SBRLane ConfigurationsTraffic Volume (vph) 86 1930 78 528 3591 176 116 45 212 85 26 78Future Volume (vph) 86 1930 78 528 3591 176 116 45 212 85 26 78Ideal Flow (vphpl) 1900 1900 1900 1900 1900 1900 1900 1900 1900 1900 1900 1900Total Lost time (s) 4.0 5.9 5.9 4.0 5.9 5.9 6.9 6.9 6.9 6.9Lane Util. Factor 1.00 0.95 1.00 1.00 0.95 1.00 1.00 1.00 1.00 1.00Frpb, ped/bikes 1.00 1.00 0.97 1.00 1.00 1.00 1.00 1.00 1.00 1.00Flpb, ped/bikes 1.00 1.00 1.00 1.00 1.00 1.00 1.00 1.00 1.00 1.00Frt 1.00 1.00 0.85 1.00 1.00 0.85 1.00 0.88 1.00 0.89Flt Protected 0.95 1.00 1.00 0.95 1.00 1.00 0.95 1.00 0.95 1.00Satd. Flow (prot) 1789 3476 1500 1825 3579 1601 1825 1678 1789 1672Flt Permitted 0.07 1.00 1.00 0.07 1.00 1.00 0.69 1.00 0.25 1.00Satd. Flow (perm) 131 3476 1500 125 3579 1601 1322 1678 475 1672Peak-hour factor, PHF 0.98 0.98 0.98 0.98 0.98 0.98 0.98 0.98 0.98 0.98 0.98 0.98Growth Factor (vph) 100% 85% 100% 100% 85% 100% 100% 100% 100% 100% 100% 100%Adj. Flow (vph) 88 1674 80 539 3115 180 118 46 216 87 27 80RTOR Reduction (vph) 0 0 42 0 0 34 0 141 0 0 64 0Lane Group Flow (vph) 88 1674 38 539 3115 146 118 121 0 87 43 0Confl. Peds. (#/hr) 2 2Heavy Vehicles (%) 2% 5% 6% 0% 2% 2% 0% 2% 0% 2% 2% 2%Turn Type pm+pt NA Perm pm+pt NA Perm Perm NA Perm NAProtected Phases 5 2 1 6 8 4Permitted Phases 2 2 6 6 8 4Actuated Green, G (s) 63.0 57.5 57.5 89.1 79.6 79.6 18.1 18.1 18.1 18.1Effective Green, g (s) 63.0 57.5 57.5 89.1 79.6 79.6 18.1 18.1 18.1 18.1Actuated g/C Ratio 0.52 0.48 0.48 0.74 0.66 0.66 0.15 0.15 0.15 0.15Clearance Time (s) 4.0 5.9 5.9 4.0 5.9 5.9 6.9 6.9 6.9 6.9Vehicle Extension (s) 3.0 5.5 5.5 3.0 5.5 5.5 5.0 5.0 3.0 3.0Lane Grp Cap (vph) 144 1665 718 483 2374 1061 199 253 71 252v/s Ratio Prot 0.03 0.48 c0.26 c0.87 0.07 0.03v/s Ratio Perm 0.29 0.03 0.57 0.09 0.09 c0.18v/c Ratio 0.61 1.01 0.05 1.12 1.31 0.14 0.59 0.48 1.23 0.17Uniform Delay, d1 26.7 31.2 16.7 40.0 20.2 7.5 47.5 46.6 51.0 44.4Progression Factor 1.00 1.00 1.00 0.85 1.12 1.40 1.00 1.00 1.00 1.00Incremental Delay, d2 7.5 23.4 0.1 55.2 140.7 0.0 7.0 3.0 179.4 0.3Delay (s) 34.2 54.6 16.8 89.3 163.4 10.5 54.5 49.6 230.3 44.7Level of Service C D B F F B D D F DApproach Delay (s) 52.0 145.8 51.1 128.0Approach LOS D F D F
Intersection SummaryHCM 2000 Control Delay 111.8 HCM 2000 Level of Service FHCM 2000 Volume to Capacity ratio 1.30Actuated Cycle Length (s) 120.0 Sum of lost time (s) 16.8Intersection Capacity Utilization 129.0% ICU Level of Service HAnalysis Period (min) 15c Critical Lane Group

Lanes, Volumes, Timings 2025 PM Total Future Conditions 2: Fourth Line & Dundas Street Graydon Banning
Graydon Banning 7/28/2015 2025 PM Total Future Conditions Synchro 9 ReportMC Page 5
Lane Group EBT EBR WBL WBT NBL NBRLane ConfigurationsTraffic Volume (vph) 2212 15 15 4281 15 15Future Volume (vph) 2212 15 15 4281 15 15Ideal Flow (vphpl) 1900 1900 1900 1900 1900 1900Storage Length (m) 70.0 120.0 0.0 0.0Storage Lanes 1 1 1 1Taper Length (m) 70.0 2.5Lane Util. Factor 0.95 1.00 1.00 0.95 1.00 1.00Ped Bike Factor 0.97Frt 0.850 0.850Flt Protected 0.950 0.950Satd. Flow (prot) 3476 1633 1825 3579 1825 1633Flt Permitted 0.040 0.950Satd. Flow (perm) 3476 1590 77 3579 1825 1633Right Turn on Red Yes YesSatd. Flow (RTOR) 8 16Link Speed (k/h) 60 60 50Link Distance (m) 424.7 312.9 64.1Travel Time (s) 25.5 18.8 4.6Confl. Peds. (#/hr) 3 3Peak Hour Factor 0.94 0.94 0.94 0.94 0.94 0.94Heavy Vehicles (%) 5% 0% 0% 2% 0% 0%Adj. Flow (vph) 2353 16 16 4554 16 16Shared Lane Traffic (%)Lane Group Flow (vph) 2353 16 16 4554 16 16Enter Blocked Intersection No No No No No NoLane Alignment Left Right Left Left Left RightMedian Width(m) 3.7 3.7 3.7Link Offset(m) 0.0 0.0 0.0Crosswalk Width(m) 1.6 1.6 1.6Two way Left Turn LaneHeadway Factor 0.99 0.99 0.99 0.99 0.99 0.99Turning Speed (k/h) 14 24 24 14Number of Detectors 2 1 1 2 1 1Detector Template Thru Right Left Thru Left RightLeading Detector (m) 30.5 6.1 6.1 30.5 6.1 6.1Trailing Detector (m) 0.0 0.0 0.0 0.0 0.0 0.0Detector 1 Position(m) 0.0 0.0 0.0 0.0 0.0 0.0Detector 1 Size(m) 1.8 6.1 6.1 1.8 6.1 6.1Detector 1 Type Cl+Ex Cl+Ex Cl+Ex Cl+Ex Cl+Ex Cl+ExDetector 1 ChannelDetector 1 Extend (s) 0.0 0.0 0.0 0.0 0.0 0.0Detector 1 Queue (s) 0.0 0.0 0.0 0.0 0.0 0.0Detector 1 Delay (s) 0.0 0.0 0.0 0.0 0.0 0.0Detector 2 Position(m) 28.7 28.7Detector 2 Size(m) 1.8 1.8Detector 2 Type Cl+Ex Cl+ExDetector 2 ChannelDetector 2 Extend (s) 0.0 0.0

Lanes, Volumes, Timings 2025 PM Total Future Conditions 2: Fourth Line & Dundas Street Graydon Banning
Graydon Banning 7/28/2015 2025 PM Total Future Conditions Synchro 9 ReportMC Page 6
Lane Group EBT EBR WBL WBT NBL NBRTurn Type NA Perm pm+pt NA Prot PermProtected Phases 2 1 6 8Permitted Phases 2 6 8Detector Phase 2 2 1 6 8 8Switch PhaseMinimum Initial (s) 5.0 5.0 5.0 5.0 5.0 5.0Minimum Split (s) 33.0 33.0 9.5 24.0 40.6 40.6Total Split (s) 66.0 66.0 12.0 78.0 42.0 42.0Total Split (%) 55.0% 55.0% 10.0% 65.0% 35.0% 35.0%Maximum Green (s) 60.0 60.0 8.0 72.0 35.4 35.4Yellow Time (s) 3.7 3.7 3.0 3.7 3.7 3.7All-Red Time (s) 2.3 2.3 1.0 2.3 2.9 2.9Lost Time Adjust (s) 0.0 0.0 0.0 0.0 0.0 0.0Total Lost Time (s) 6.0 6.0 4.0 6.0 6.6 6.6Lead/Lag Lag Lag LeadLead-Lag Optimize? Yes Yes YesVehicle Extension (s) 5.0 5.0 4.0 5.0 4.0 4.0Recall Mode C-Max C-Max None C-Max None NoneWalk Time (s) 7.0 7.0 7.0 7.0 7.0Flash Dont Walk (s) 20.0 20.0 7.0 27.0 27.0Pedestrian Calls (#/hr) 0 0 0 0 0Act Effct Green (s) 103.1 103.1 107.0 107.4 7.6 7.6Actuated g/C Ratio 0.86 0.86 0.89 0.90 0.06 0.06v/c Ratio 0.79 0.01 0.10 1.42 0.14 0.13Control Delay 7.8 0.5 2.7 206.9 55.1 25.0Queue Delay 0.0 0.0 0.0 0.0 0.0 0.0Total Delay 7.8 0.5 2.7 206.9 55.1 25.0LOS A A A F E CApproach Delay 7.8 206.1 40.1Approach LOS A F DQueue Length 50th (m) 35.0 0.0 0.4 ~790.2 3.6 0.0Queue Length 95th (m) m34.1 m0.1 1.4 #820.8 10.7 7.0Internal Link Dist (m) 400.7 288.9 40.1Turn Bay Length (m) 70.0 120.0Base Capacity (vph) 2987 1367 184 3204 538 493Starvation Cap Reductn 0 0 0 0 0 0Spillback Cap Reductn 0 0 0 0 0 0Storage Cap Reductn 0 0 0 0 0 0Reduced v/c Ratio 0.79 0.01 0.09 1.42 0.03 0.03
Intersection SummaryArea Type: OtherCycle Length: 120Actuated Cycle Length: 120Offset: 103.2 (86%), Referenced to phase 2:EBT and 6:WBTL, Start of GreenNatural Cycle: 145Control Type: Actuated-CoordinatedMaximum v/c Ratio: 1.42Intersection Signal Delay: 138.0 Intersection LOS: F

Lanes, Volumes, Timings 2025 PM Total Future Conditions 2: Fourth Line & Dundas Street Graydon Banning
Graydon Banning 7/28/2015 2025 PM Total Future Conditions Synchro 9 ReportMC Page 7
Intersection Capacity Utilization 133.0% ICU Level of Service HAnalysis Period (min) 15~ Volume exceeds capacity, queue is theoretically infinite. Queue shown is maximum after two cycles.# 95th percentile volume exceeds capacity, queue may be longer. Queue shown is maximum after two cycles.m Volume for 95th percentile queue is metered by upstream signal.
Splits and Phases: 2: Fourth Line & Dundas Street

HCM Signalized Intersection Capacity Analysis 2025 PM Total Future Conditions 2: Fourth Line & Dundas Street Graydon Banning
Graydon Banning 7/28/2015 2025 PM Total Future Conditions Synchro 9 ReportMC Page 8
Movement EBT EBR WBL WBT NBL NBRLane ConfigurationsTraffic Volume (vph) 2212 15 15 4281 15 15Future Volume (vph) 2212 15 15 4281 15 15Ideal Flow (vphpl) 1900 1900 1900 1900 1900 1900Total Lost time (s) 6.0 6.0 4.0 6.0 6.6 6.6Lane Util. Factor 0.95 1.00 1.00 0.95 1.00 1.00Frpb, ped/bikes 1.00 0.97 1.00 1.00 1.00 1.00Flpb, ped/bikes 1.00 1.00 1.00 1.00 1.00 1.00Frt 1.00 0.85 1.00 1.00 1.00 0.85Flt Protected 1.00 1.00 0.95 1.00 0.95 1.00Satd. Flow (prot) 3476 1590 1825 3579 1825 1633Flt Permitted 1.00 1.00 0.04 1.00 0.95 1.00Satd. Flow (perm) 3476 1590 77 3579 1825 1633Peak-hour factor, PHF 0.94 0.94 0.94 0.94 0.94 0.94Adj. Flow (vph) 2353 16 16 4554 16 16RTOR Reduction (vph) 0 2 0 0 0 15Lane Group Flow (vph) 2353 14 16 4554 16 1Confl. Peds. (#/hr) 3 3Heavy Vehicles (%) 5% 0% 0% 2% 0% 0%Turn Type NA Perm pm+pt NA Prot PermProtected Phases 2 1 6 8Permitted Phases 2 6 8Actuated Green, G (s) 95.7 95.7 102.4 102.4 5.0 5.0Effective Green, g (s) 95.7 95.7 102.4 102.4 5.0 5.0Actuated g/C Ratio 0.80 0.80 0.85 0.85 0.04 0.04Clearance Time (s) 6.0 6.0 4.0 6.0 6.6 6.6Vehicle Extension (s) 5.0 5.0 4.0 5.0 4.0 4.0Lane Grp Cap (vph) 2772 1268 105 3054 76 68v/s Ratio Prot 0.68 0.00 c1.27 c0.01v/s Ratio Perm 0.01 0.13 0.00v/c Ratio 0.85 0.01 0.15 1.49 0.21 0.01Uniform Delay, d1 7.6 2.5 13.6 8.8 55.6 55.1Progression Factor 0.75 0.18 1.00 1.00 1.00 1.00Incremental Delay, d2 2.0 0.0 0.9 222.8 1.9 0.1Delay (s) 7.7 0.5 14.5 231.6 57.5 55.2Level of Service A A B F E EApproach Delay (s) 7.6 230.8 56.3Approach LOS A F E
Intersection SummaryHCM 2000 Control Delay 154.2 HCM 2000 Level of Service FHCM 2000 Volume to Capacity ratio 1.49Actuated Cycle Length (s) 120.0 Sum of lost time (s) 16.6Intersection Capacity Utilization 133.0% ICU Level of Service HAnalysis Period (min) 15c Critical Lane Group

Lanes, Volumes, Timings 2025 PM Total Future Conditions 3: Proudfoot Trail & William Halton Parkway Graydon Banning
Graydon Banning 7/28/2015 2025 PM Total Future Conditions Synchro 9 ReportMC Page 9
Lane Group EBL EBT EBR WBL WBT WBR NBL NBT NBR SBL SBT SBRLane ConfigurationsTraffic Volume (vph) 22 1187 7 55 1341 16 5 20 85 9 11 12Future Volume (vph) 22 1187 7 55 1341 16 5 20 85 9 11 12Ideal Flow (vphpl) 1900 1900 1900 1900 1900 1900 1900 1900 1900 1900 1900 1900Lane Util. Factor 0.95 0.95 0.95 0.95 0.95 0.95 1.00 1.00 1.00 1.00 1.00 1.00Frt 0.999 0.998 0.896 0.950Flt Protected 0.999 0.998 0.998 0.986Satd. Flow (prot) 0 3571 0 0 3564 0 0 1684 0 0 1764 0Flt Permitted 0.999 0.998 0.998 0.986Satd. Flow (perm) 0 3571 0 0 3564 0 0 1684 0 0 1764 0Link Speed (k/h) 60 60 50 50Link Distance (m) 148.9 398.7 376.7 180.8Travel Time (s) 8.9 23.9 27.1 13.0Peak Hour Factor 0.92 0.92 0.92 0.92 0.92 0.92 0.92 0.92 0.92 0.92 0.92 0.92Adj. Flow (vph) 24 1290 8 60 1458 17 5 22 92 10 12 13Shared Lane Traffic (%)Lane Group Flow (vph) 0 1322 0 0 1535 0 0 119 0 0 35 0Enter Blocked Intersection No No No No No No No No No No No NoLane Alignment Left Left Right Left Left Right Left Left Right Left Left RightMedian Width(m) 3.7 3.7 0.0 0.0Link Offset(m) 0.0 0.0 0.0 0.0Crosswalk Width(m) 1.6 1.6 1.6 1.6Two way Left Turn LaneHeadway Factor 0.99 0.99 0.99 0.99 0.99 0.99 0.99 0.99 0.99 0.99 0.99 0.99Turning Speed (k/h) 24 14 24 14 24 14 24 14Sign Control Free Free Stop Stop
Intersection SummaryArea Type: OtherControl Type: UnsignalizedIntersection Capacity Utilization 89.6% ICU Level of Service EAnalysis Period (min) 15

HCM Unsignalized Intersection Capacity Analysis 2025 PM Total Future Conditions 3: Proudfoot Trail & William Halton Parkway Graydon Banning
Graydon Banning 7/28/2015 2025 PM Total Future Conditions Synchro 9 ReportMC Page 10
Movement EBL EBT EBR WBL WBT WBR NBL NBT NBR SBL SBT SBRLane ConfigurationsTraffic Volume (veh/h) 22 1187 7 55 1341 16 5 20 85 9 11 12Future Volume (Veh/h) 22 1187 7 55 1341 16 5 20 85 9 11 12Sign Control Free Free Stop StopGrade 0% 0% 0% 0%Peak Hour Factor 0.92 0.92 0.92 0.92 0.92 0.92 0.92 0.92 0.92 0.92 0.92 0.92Hourly flow rate (vph) 24 1290 8 60 1458 17 5 22 92 10 12 13PedestriansLane Width (m)Walking Speed (m/s)Percent BlockageRight turn flare (veh)Median type None NoneMedian storage veh)Upstream signal (m)pX, platoon unblockedvC, conflicting volume 1475 1298 2210 2937 649 2382 2932 738vC1, stage 1 conf volvC2, stage 2 conf volvCu, unblocked vol 1475 1298 2210 2937 649 2382 2932 738tC, single (s) 4.1 4.1 7.5 6.5 6.9 7.5 6.5 6.9tC, 2 stage (s)tF (s) 2.2 2.2 3.5 4.0 3.3 3.5 4.0 3.3p0 queue free % 95 89 0 0 78 0 3 96cM capacity (veh/h) 453 530 3 12 412 0 12 361
Direction, Lane # EB 1 EB 2 WB 1 WB 2 NB 1 SB 1Volume Total 669 653 789 746 119 35Volume Left 24 0 60 0 5 10Volume Right 0 8 0 17 92 13cSH 453 1700 530 1700 30 0Volume to Capacity 0.05 0.38 0.11 0.44 3.91 ErrQueue Length 95th (m) 1.3 0.0 2.9 0.0 Err ErrControl Delay (s) 1.6 0.0 3.3 0.0 Err ErrLane LOS A A F FApproach Delay (s) 0.8 1.7 Err ErrApproach LOS F F
Intersection SummaryAverage Delay ErrIntersection Capacity Utilization 89.6% ICU Level of Service EAnalysis Period (min) 15

Lanes, Volumes, Timings 2025 PM Total Future Conditions 4: New Access & William Halton Parkway Graydon Banning
Graydon Banning 7/28/2015 2025 PM Total Future Conditions Synchro 9 ReportMC Page 11
Lane Group EBL EBT EBR WBL WBT WBR NBL NBT NBR SBL SBT SBRLane ConfigurationsTraffic Volume (vph) 134 1136 11 21 1333 24 6 0 12 13 0 73Future Volume (vph) 134 1136 11 21 1333 24 6 0 12 13 0 73Ideal Flow (vphpl) 1900 1900 1900 1900 1900 1900 1900 1900 1900 1900 1900 1900Lane Util. Factor 0.95 0.95 0.95 0.95 0.95 0.95 1.00 1.00 1.00 1.00 1.00 1.00Frt 0.999 0.997 0.912 0.885Flt Protected 0.995 0.999 0.983 0.993Satd. Flow (prot) 0 3557 0 0 3564 0 0 1688 0 0 1655 0Flt Permitted 0.995 0.999 0.983 0.993Satd. Flow (perm) 0 3557 0 0 3564 0 0 1688 0 0 1655 0Link Speed (k/h) 60 60 50 50Link Distance (m) 398.7 121.4 110.4 181.6Travel Time (s) 23.9 7.3 7.9 13.1Peak Hour Factor 0.92 0.92 0.92 0.92 0.92 0.92 0.92 0.92 0.92 0.92 0.92 0.92Adj. Flow (vph) 146 1235 12 23 1449 26 7 0 13 14 0 79Shared Lane Traffic (%)Lane Group Flow (vph) 0 1393 0 0 1498 0 0 20 0 0 93 0Enter Blocked Intersection No No No No No No No No No No No NoLane Alignment Left Left Right Left Left Right Left Left Right Left Left RightMedian Width(m) 3.7 3.7 0.0 0.0Link Offset(m) 0.0 0.0 0.0 0.0Crosswalk Width(m) 1.6 1.6 1.6 1.6Two way Left Turn LaneHeadway Factor 0.99 0.99 0.99 0.99 0.99 0.99 0.99 0.99 0.99 0.99 0.99 0.99Turning Speed (k/h) 24 14 24 14 24 14 24 14Sign Control Free Free Stop Stop
Intersection SummaryArea Type: OtherControl Type: UnsignalizedIntersection Capacity Utilization 89.6% ICU Level of Service EAnalysis Period (min) 15

HCM Unsignalized Intersection Capacity Analysis 2025 PM Total Future Conditions 4: New Access & William Halton Parkway Graydon Banning
Graydon Banning 7/28/2015 2025 PM Total Future Conditions Synchro 9 ReportMC Page 12
Movement EBL EBT EBR WBL WBT WBR NBL NBT NBR SBL SBT SBRLane ConfigurationsTraffic Volume (veh/h) 134 1136 11 21 1333 24 6 0 12 13 0 73Future Volume (Veh/h) 134 1136 11 21 1333 24 6 0 12 13 0 73Sign Control Free Free Stop StopGrade 0% 0% 0% 0%Peak Hour Factor 0.92 0.92 0.92 0.92 0.92 0.92 0.92 0.92 0.92 0.92 0.92 0.92Hourly flow rate (vph) 146 1235 12 23 1449 26 7 0 13 14 0 79PedestriansLane Width (m)Walking Speed (m/s)Percent BlockageRight turn flare (veh)Median type None NoneMedian storage veh)Upstream signal (m)pX, platoon unblockedvC, conflicting volume 1475 1247 2382 3054 624 2430 3047 738vC1, stage 1 conf volvC2, stage 2 conf volvCu, unblocked vol 1475 1247 2382 3054 624 2430 3047 738tC, single (s) 4.1 4.1 7.5 6.5 6.9 7.5 6.5 6.9tC, 2 stage (s)tF (s) 2.2 2.2 3.5 4.0 3.3 3.5 4.0 3.3p0 queue free % 68 96 31 100 97 0 100 78cM capacity (veh/h) 453 554 10 8 429 12 8 361
Direction, Lane # EB 1 EB 2 WB 1 WB 2 NB 1 SB 1Volume Total 764 630 748 750 20 93Volume Left 146 0 23 0 7 14Volume Right 0 12 0 26 13 79cSH 453 1700 554 1700 28 65Volume to Capacity 0.32 0.37 0.04 0.44 0.72 1.42Queue Length 95th (m) 10.5 0.0 1.0 0.0 17.4 59.9Control Delay (s) 10.0 0.0 1.2 0.0 283.6 365.4Lane LOS B A F FApproach Delay (s) 5.5 0.6 283.6 365.4Approach LOS F F
Intersection SummaryAverage Delay 16.0Intersection Capacity Utilization 89.6% ICU Level of Service EAnalysis Period (min) 15

Lanes, Volumes, Timings 2025 AM Total Future Conditions - Upgrades1: Proudfoot Trail & Dundas Street Graydon Banning
Graydon Banning 7/28/2015 2025 AM Total Future Conditions - Upgrades Synchro 9 ReportMC Page 1
Lane Group EBL EBT EBR WBL WBT WBR NBL NBT NBR SBL SBT SBRLane ConfigurationsTraffic Volume (vph) 28 3059 67 76 1528 70 80 14 450 147 46 108Future Volume (vph) 28 3059 67 76 1528 70 80 14 450 147 46 108Ideal Flow (vphpl) 1900 1900 1900 1900 1900 1900 1900 1900 1900 1900 1900 1900Storage Length (m) 120.0 70.0 120.0 70.0 70.0 0.0 70.0 0.0Storage Lanes 1 1 1 1 1 0 1 0Taper Length (m) 70.0 70.0 70.0 70.0Lane Util. Factor 1.00 0.95 1.00 1.00 0.95 1.00 1.00 1.00 1.00 1.00 1.00 1.00Ped Bike Factor 0.98 0.99Frt 0.850 0.850 0.854 0.895Flt Protected 0.950 0.950 0.950 0.950Satd. Flow (prot) 1789 3444 1498 1789 3230 1601 1755 1617 0 1789 1686 0Flt Permitted 0.109 0.063 0.635 0.172Satd. Flow (perm) 205 3444 1463 119 3230 1601 1173 1617 0 324 1686 0Right Turn on Red Yes Yes Yes YesSatd. Flow (RTOR) 72 72 90 101Link Speed (k/h) 60 60 50 48Link Distance (m) 373.6 424.7 186.0 406.8Travel Time (s) 22.4 25.5 13.4 30.5Confl. Peds. (#/hr) 1 1 1Peak Hour Factor 0.97 0.97 0.97 0.97 0.97 0.97 0.97 0.97 0.97 0.97 0.97 0.97Growth Factor 100% 85% 100% 100% 85% 100% 100% 100% 100% 100% 100% 100%Heavy Vehicles (%) 2% 6% 9% 2% 13% 2% 4% 2% 0% 2% 2% 2%Adj. Flow (vph) 29 2681 69 78 1339 72 82 14 464 152 47 111Shared Lane Traffic (%)Lane Group Flow (vph) 29 2681 69 78 1339 72 82 478 0 152 158 0Enter Blocked Intersection No No No No No No No No No No No NoLane Alignment Left Left Right Left Left Right Left Left Right Left Left RightMedian Width(m) 3.7 3.7 3.7 3.7Link Offset(m) 0.0 0.0 0.0 0.0Crosswalk Width(m) 1.6 1.6 1.6 1.6Two way Left Turn LaneHeadway Factor 0.99 0.99 0.99 0.99 0.99 0.99 0.99 0.99 0.99 0.99 0.99 0.99Turning Speed (k/h) 24 14 24 14 24 14 24 14Number of Detectors 1 2 1 1 2 1 1 2 1 2Detector Template Left Thru Right Left Thru Right Left Thru Left ThruLeading Detector (m) 6.1 30.5 6.1 6.1 30.5 6.1 6.1 30.5 6.1 30.5Trailing Detector (m) 0.0 0.0 0.0 0.0 0.0 0.0 0.0 0.0 0.0 0.0Detector 1 Position(m) 0.0 0.0 0.0 0.0 0.0 0.0 0.0 0.0 0.0 0.0Detector 1 Size(m) 6.1 1.8 6.1 6.1 1.8 6.1 6.1 1.8 6.1 1.8Detector 1 Type Cl+Ex Cl+Ex Cl+Ex Cl+Ex Cl+Ex Cl+Ex Cl+Ex Cl+Ex Cl+Ex Cl+ExDetector 1 ChannelDetector 1 Extend (s) 0.0 0.0 0.0 0.0 0.0 0.0 0.0 0.0 0.0 0.0Detector 1 Queue (s) 0.0 0.0 0.0 0.0 0.0 0.0 0.0 0.0 0.0 0.0Detector 1 Delay (s) 0.0 0.0 0.0 0.0 0.0 0.0 0.0 0.0 0.0 0.0Detector 2 Position(m) 28.7 28.7 28.7 28.7Detector 2 Size(m) 1.8 1.8 1.8 1.8Detector 2 Type Cl+Ex Cl+Ex Cl+Ex Cl+ExDetector 2 Channel
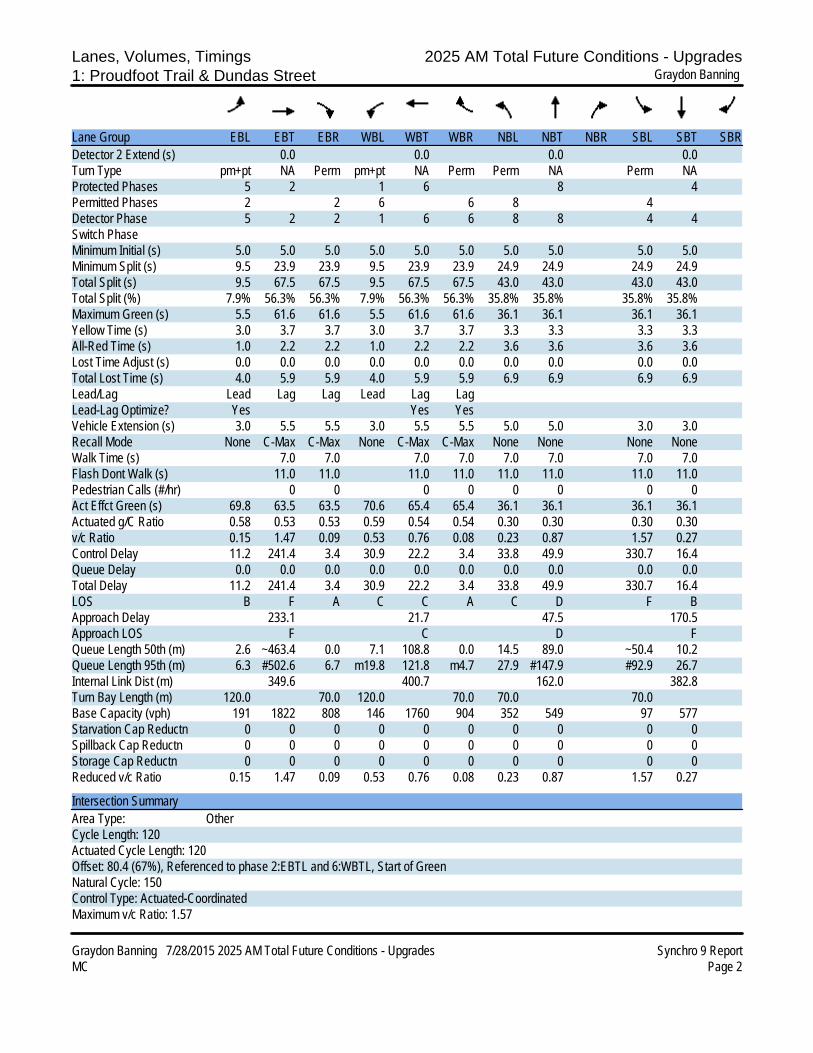
Lanes, Volumes, Timings 2025 AM Total Future Conditions - Upgrades1: Proudfoot Trail & Dundas Street Graydon Banning
Graydon Banning 7/28/2015 2025 AM Total Future Conditions - Upgrades Synchro 9 ReportMC Page 2
Lane Group EBL EBT EBR WBL WBT WBR NBL NBT NBR SBL SBT SBRDetector 2 Extend (s) 0.0 0.0 0.0 0.0Turn Type pm+pt NA Perm pm+pt NA Perm Perm NA Perm NAProtected Phases 5 2 1 6 8 4Permitted Phases 2 2 6 6 8 4Detector Phase 5 2 2 1 6 6 8 8 4 4Switch PhaseMinimum Initial (s) 5.0 5.0 5.0 5.0 5.0 5.0 5.0 5.0 5.0 5.0Minimum Split (s) 9.5 23.9 23.9 9.5 23.9 23.9 24.9 24.9 24.9 24.9Total Split (s) 9.5 67.5 67.5 9.5 67.5 67.5 43.0 43.0 43.0 43.0Total Split (%) 7.9% 56.3% 56.3% 7.9% 56.3% 56.3% 35.8% 35.8% 35.8% 35.8%Maximum Green (s) 5.5 61.6 61.6 5.5 61.6 61.6 36.1 36.1 36.1 36.1Yellow Time (s) 3.0 3.7 3.7 3.0 3.7 3.7 3.3 3.3 3.3 3.3All-Red Time (s) 1.0 2.2 2.2 1.0 2.2 2.2 3.6 3.6 3.6 3.6Lost Time Adjust (s) 0.0 0.0 0.0 0.0 0.0 0.0 0.0 0.0 0.0 0.0Total Lost Time (s) 4.0 5.9 5.9 4.0 5.9 5.9 6.9 6.9 6.9 6.9Lead/Lag Lead Lag Lag Lead Lag LagLead-Lag Optimize? Yes Yes YesVehicle Extension (s) 3.0 5.5 5.5 3.0 5.5 5.5 5.0 5.0 3.0 3.0Recall Mode None C-Max C-Max None C-Max C-Max None None None NoneWalk Time (s) 7.0 7.0 7.0 7.0 7.0 7.0 7.0 7.0Flash Dont Walk (s) 11.0 11.0 11.0 11.0 11.0 11.0 11.0 11.0Pedestrian Calls (#/hr) 0 0 0 0 0 0 0 0Act Effct Green (s) 69.8 63.5 63.5 70.6 65.4 65.4 36.1 36.1 36.1 36.1Actuated g/C Ratio 0.58 0.53 0.53 0.59 0.54 0.54 0.30 0.30 0.30 0.30v/c Ratio 0.15 1.47 0.09 0.53 0.76 0.08 0.23 0.87 1.57 0.27Control Delay 11.2 241.4 3.4 30.9 22.2 3.4 33.8 49.9 330.7 16.4Queue Delay 0.0 0.0 0.0 0.0 0.0 0.0 0.0 0.0 0.0 0.0Total Delay 11.2 241.4 3.4 30.9 22.2 3.4 33.8 49.9 330.7 16.4LOS B F A C C A C D F BApproach Delay 233.1 21.7 47.5 170.5Approach LOS F C D FQueue Length 50th (m) 2.6 ~463.4 0.0 7.1 108.8 0.0 14.5 89.0 ~50.4 10.2Queue Length 95th (m) 6.3 #502.6 6.7 m19.8 121.8 m4.7 27.9 #147.9 #92.9 26.7Internal Link Dist (m) 349.6 400.7 162.0 382.8Turn Bay Length (m) 120.0 70.0 120.0 70.0 70.0 70.0Base Capacity (vph) 191 1822 808 146 1760 904 352 549 97 577Starvation Cap Reductn 0 0 0 0 0 0 0 0 0 0Spillback Cap Reductn 0 0 0 0 0 0 0 0 0 0Storage Cap Reductn 0 0 0 0 0 0 0 0 0 0Reduced v/c Ratio 0.15 1.47 0.09 0.53 0.76 0.08 0.23 0.87 1.57 0.27
Intersection SummaryArea Type: OtherCycle Length: 120Actuated Cycle Length: 120Offset: 80.4 (67%), Referenced to phase 2:EBTL and 6:WBTL, Start of GreenNatural Cycle: 150Control Type: Actuated-CoordinatedMaximum v/c Ratio: 1.57

Lanes, Volumes, Timings 2025 AM Total Future Conditions - Upgrades1: Proudfoot Trail & Dundas Street Graydon Banning
Graydon Banning 7/28/2015 2025 AM Total Future Conditions - Upgrades Synchro 9 ReportMC Page 3
Intersection Signal Delay: 147.8 Intersection LOS: FIntersection Capacity Utilization 125.1% ICU Level of Service HAnalysis Period (min) 15~ Volume exceeds capacity, queue is theoretically infinite. Queue shown is maximum after two cycles.# 95th percentile volume exceeds capacity, queue may be longer. Queue shown is maximum after two cycles.m Volume for 95th percentile queue is metered by upstream signal.
Splits and Phases: 1: Proudfoot Trail & Dundas Street

HCM Signalized Intersection Capacity Analysis 2025 AM Total Future Conditions - Upgrades1: Proudfoot Trail & Dundas Street Graydon Banning
Graydon Banning 7/28/2015 2025 AM Total Future Conditions - Upgrades Synchro 9 ReportMC Page 4
Movement EBL EBT EBR WBL WBT WBR NBL NBT NBR SBL SBT SBRLane ConfigurationsTraffic Volume (vph) 28 3059 67 76 1528 70 80 14 450 147 46 108Future Volume (vph) 28 3059 67 76 1528 70 80 14 450 147 46 108Ideal Flow (vphpl) 1900 1900 1900 1900 1900 1900 1900 1900 1900 1900 1900 1900Total Lost time (s) 4.0 5.9 5.9 4.0 5.9 5.9 6.9 6.9 6.9 6.9Lane Util. Factor 1.00 0.95 1.00 1.00 0.95 1.00 1.00 1.00 1.00 1.00Frpb, ped/bikes 1.00 1.00 0.98 1.00 1.00 1.00 1.00 0.99 1.00 1.00Flpb, ped/bikes 1.00 1.00 1.00 1.00 1.00 1.00 1.00 1.00 1.00 1.00Frt 1.00 1.00 0.85 1.00 1.00 0.85 1.00 0.85 1.00 0.89Flt Protected 0.95 1.00 1.00 0.95 1.00 1.00 0.95 1.00 0.95 1.00Satd. Flow (prot) 1789 3444 1463 1789 3230 1601 1755 1618 1789 1685Flt Permitted 0.11 1.00 1.00 0.06 1.00 1.00 0.64 1.00 0.17 1.00Satd. Flow (perm) 206 3444 1463 118 3230 1601 1174 1618 324 1685Peak-hour factor, PHF 0.97 0.97 0.97 0.97 0.97 0.97 0.97 0.97 0.97 0.97 0.97 0.97Growth Factor (vph) 100% 85% 100% 100% 85% 100% 100% 100% 100% 100% 100% 100%Adj. Flow (vph) 29 2681 69 78 1339 72 82 14 464 152 47 111RTOR Reduction (vph) 0 0 33 0 0 34 0 63 0 0 71 0Lane Group Flow (vph) 29 2681 36 78 1339 38 82 415 0 152 87 0Confl. Peds. (#/hr) 1 1 1Heavy Vehicles (%) 2% 6% 9% 2% 13% 2% 4% 2% 0% 2% 2% 2%Turn Type pm+pt NA Perm pm+pt NA Perm Perm NA Perm NAProtected Phases 5 2 1 6 8 4Permitted Phases 2 2 6 6 8 4Actuated Green, G (s) 66.0 62.7 62.7 68.2 63.8 63.8 36.1 36.1 36.1 36.1Effective Green, g (s) 66.0 62.7 62.7 68.2 63.8 63.8 36.1 36.1 36.1 36.1Actuated g/C Ratio 0.55 0.52 0.52 0.57 0.53 0.53 0.30 0.30 0.30 0.30Clearance Time (s) 4.0 5.9 5.9 4.0 5.9 5.9 6.9 6.9 6.9 6.9Vehicle Extension (s) 3.0 5.5 5.5 3.0 5.5 5.5 5.0 5.0 3.0 3.0Lane Grp Cap (vph) 156 1799 764 128 1717 851 353 486 97 506v/s Ratio Prot 0.01 c0.78 c0.02 0.41 0.26 0.05v/s Ratio Perm 0.10 0.02 0.32 0.02 0.07 c0.47v/c Ratio 0.19 1.49 0.05 0.61 0.78 0.04 0.23 0.85 1.57 0.17Uniform Delay, d1 16.2 28.6 14.0 27.2 22.5 13.5 31.5 39.5 42.0 30.9Progression Factor 1.00 1.00 1.00 1.46 0.87 0.94 1.00 1.00 1.04 1.21Incremental Delay, d2 0.6 223.6 0.1 6.5 2.9 0.1 0.7 14.8 298.9 0.2Delay (s) 16.8 252.3 14.1 46.2 22.5 12.7 32.2 54.3 342.7 37.7Level of Service B F B D C B C D F DApproach Delay (s) 243.9 23.3 51.1 187.2Approach LOS F C D F
Intersection SummaryHCM 2000 Control Delay 155.5 HCM 2000 Level of Service FHCM 2000 Volume to Capacity ratio 1.48Actuated Cycle Length (s) 120.0 Sum of lost time (s) 16.8Intersection Capacity Utilization 125.1% ICU Level of Service HAnalysis Period (min) 15c Critical Lane Group

Lanes, Volumes, Timings 2025 AM Total Future Conditions - Upgrades2: Fourth Line & Dundas Street Graydon Banning
Graydon Banning 7/28/2015 2025 AM Total Future Conditions - Upgrades Synchro 9 ReportMC Page 5
Lane Group EBT EBR WBL WBT NBL NBRLane ConfigurationsTraffic Volume (vph) 3641 15 15 1659 15 15Future Volume (vph) 3641 15 15 1659 15 15Ideal Flow (vphpl) 1900 1900 1900 1900 1900 1900Storage Length (m) 70.0 120.0 0.0 0.0Storage Lanes 1 1 1 1Taper Length (m) 70.0 2.5Lane Util. Factor 0.95 1.00 1.00 0.95 1.00 1.00Ped Bike Factor 0.97Frt 0.850 0.850Flt Protected 0.950 0.950Satd. Flow (prot) 3510 1512 1825 3288 1825 1361Flt Permitted 0.040 0.950Satd. Flow (perm) 3510 1472 77 3288 1825 1361Right Turn on Red Yes YesSatd. Flow (RTOR) 6 16Link Speed (k/h) 60 60 50Link Distance (m) 424.7 312.9 64.1Travel Time (s) 25.5 18.8 4.6Confl. Peds. (#/hr) 3 3Peak Hour Factor 0.94 0.94 0.94 0.94 0.94 0.94Growth Factor 85% 100% 85% 100% 100% 100%Heavy Vehicles (%) 4% 8% 0% 11% 0% 20%Adj. Flow (vph) 3292 16 14 1765 16 16Shared Lane Traffic (%)Lane Group Flow (vph) 3292 16 14 1765 16 16Enter Blocked Intersection No No No No No NoLane Alignment Left Right Left Left Left RightMedian Width(m) 3.7 3.7 3.7Link Offset(m) 0.0 0.0 0.0Crosswalk Width(m) 1.6 1.6 1.6Two way Left Turn LaneHeadway Factor 0.99 0.99 0.99 0.99 0.99 0.99Turning Speed (k/h) 14 24 24 14Number of Detectors 2 1 1 2 1 1Detector Template Thru Right Left Thru Left RightLeading Detector (m) 30.5 6.1 6.1 30.5 6.1 6.1Trailing Detector (m) 0.0 0.0 0.0 0.0 0.0 0.0Detector 1 Position(m) 0.0 0.0 0.0 0.0 0.0 0.0Detector 1 Size(m) 1.8 6.1 6.1 1.8 6.1 6.1Detector 1 Type Cl+Ex Cl+Ex Cl+Ex Cl+Ex Cl+Ex Cl+ExDetector 1 ChannelDetector 1 Extend (s) 0.0 0.0 0.0 0.0 0.0 0.0Detector 1 Queue (s) 0.0 0.0 0.0 0.0 0.0 0.0Detector 1 Delay (s) 0.0 0.0 0.0 0.0 0.0 0.0Detector 2 Position(m) 28.7 28.7Detector 2 Size(m) 1.8 1.8Detector 2 Type Cl+Ex Cl+ExDetector 2 Channel

Lanes, Volumes, Timings 2025 AM Total Future Conditions - Upgrades2: Fourth Line & Dundas Street Graydon Banning
Graydon Banning 7/28/2015 2025 AM Total Future Conditions - Upgrades Synchro 9 ReportMC Page 6
Lane Group EBT EBR WBL WBT NBL NBRDetector 2 Extend (s) 0.0 0.0Turn Type NA Perm pm+pt NA Prot PermProtected Phases 2 1 6 8Permitted Phases 2 6 8Detector Phase 2 2 1 6 8 8Switch PhaseMinimum Initial (s) 5.0 5.0 5.0 5.0 5.0 5.0Minimum Split (s) 33.0 33.0 9.5 24.0 40.6 40.6Total Split (s) 69.9 69.9 9.5 79.4 40.6 40.6Total Split (%) 58.3% 58.3% 7.9% 66.2% 33.8% 33.8%Maximum Green (s) 63.9 63.9 5.5 73.4 34.0 34.0Yellow Time (s) 3.7 3.7 3.0 3.7 3.7 3.7All-Red Time (s) 2.3 2.3 1.0 2.3 2.9 2.9Lost Time Adjust (s) 0.0 0.0 0.0 0.0 0.0 0.0Total Lost Time (s) 6.0 6.0 4.0 6.0 6.6 6.6Lead/Lag Lag Lag LeadLead-Lag Optimize? Yes Yes YesVehicle Extension (s) 5.0 5.0 4.0 5.0 4.0 4.0Recall Mode C-Max C-Max None C-Max None NoneWalk Time (s) 7.0 7.0 7.0 7.0 7.0Flash Dont Walk (s) 20.0 20.0 7.0 27.0 27.0Pedestrian Calls (#/hr) 0 0 0 0 0Act Effct Green (s) 103.1 103.1 107.0 107.4 7.6 7.6Actuated g/C Ratio 0.86 0.86 0.89 0.90 0.06 0.06v/c Ratio 1.09 0.01 0.08 0.60 0.14 0.16Control Delay 59.7 1.0 2.5 3.8 55.1 26.0Queue Delay 0.0 0.0 0.0 0.0 0.0 0.0Total Delay 59.7 1.0 2.5 3.8 55.1 26.0LOS E A A A E CApproach Delay 59.4 3.8 40.6Approach LOS E A DQueue Length 50th (m) ~249.7 0.1 0.4 59.7 3.6 0.0Queue Length 95th (m) m81.0 m0.1 1.3 82.6 10.7 7.0Internal Link Dist (m) 400.7 288.9 40.1Turn Bay Length (m) 70.0 120.0Base Capacity (vph) 3016 1266 165 2944 517 397Starvation Cap Reductn 0 0 0 0 0 0Spillback Cap Reductn 0 0 0 0 0 0Storage Cap Reductn 0 0 0 0 0 0Reduced v/c Ratio 1.09 0.01 0.08 0.60 0.03 0.04
Intersection SummaryArea Type: OtherCycle Length: 120Actuated Cycle Length: 120Offset: 103.2 (86%), Referenced to phase 2:EBT and 6:WBTL, Start of GreenNatural Cycle: 145Control Type: Actuated-CoordinatedMaximum v/c Ratio: 1.09

Lanes, Volumes, Timings 2025 AM Total Future Conditions - Upgrades2: Fourth Line & Dundas Street Graydon Banning
Graydon Banning 7/28/2015 2025 AM Total Future Conditions - Upgrades Synchro 9 ReportMC Page 7
Intersection Signal Delay: 39.9 Intersection LOS: DIntersection Capacity Utilization 100.2% ICU Level of Service GAnalysis Period (min) 15~ Volume exceeds capacity, queue is theoretically infinite. Queue shown is maximum after two cycles.m Volume for 95th percentile queue is metered by upstream signal.
Splits and Phases: 2: Fourth Line & Dundas Street

HCM Signalized Intersection Capacity Analysis 2025 AM Total Future Conditions - Upgrades2: Fourth Line & Dundas Street Graydon Banning
Graydon Banning 7/28/2015 2025 AM Total Future Conditions - Upgrades Synchro 9 ReportMC Page 8
Movement EBT EBR WBL WBT NBL NBRLane ConfigurationsTraffic Volume (vph) 3641 15 15 1659 15 15Future Volume (vph) 3641 15 15 1659 15 15Ideal Flow (vphpl) 1900 1900 1900 1900 1900 1900Total Lost time (s) 6.0 6.0 4.0 6.0 6.6 6.6Lane Util. Factor 0.95 1.00 1.00 0.95 1.00 1.00Frpb, ped/bikes 1.00 0.97 1.00 1.00 1.00 1.00Flpb, ped/bikes 1.00 1.00 1.00 1.00 1.00 1.00Frt 1.00 0.85 1.00 1.00 1.00 0.85Flt Protected 1.00 1.00 0.95 1.00 0.95 1.00Satd. Flow (prot) 3510 1472 1825 3288 1825 1361Flt Permitted 1.00 1.00 0.04 1.00 0.95 1.00Satd. Flow (perm) 3510 1472 77 3288 1825 1361Peak-hour factor, PHF 0.94 0.94 0.94 0.94 0.94 0.94Growth Factor (vph) 85% 100% 85% 100% 100% 100%Adj. Flow (vph) 3292 16 14 1765 16 16RTOR Reduction (vph) 0 1 0 0 0 15Lane Group Flow (vph) 3292 15 14 1765 16 1Confl. Peds. (#/hr) 3 3Heavy Vehicles (%) 4% 8% 0% 11% 0% 20%Turn Type NA Perm pm+pt NA Prot PermProtected Phases 2 1 6 8Permitted Phases 2 6 8Actuated Green, G (s) 95.7 95.7 102.4 102.4 5.0 5.0Effective Green, g (s) 95.7 95.7 102.4 102.4 5.0 5.0Actuated g/C Ratio 0.80 0.80 0.85 0.85 0.04 0.04Clearance Time (s) 6.0 6.0 4.0 6.0 6.6 6.6Vehicle Extension (s) 5.0 5.0 4.0 5.0 4.0 4.0Lane Grp Cap (vph) 2799 1173 105 2805 76 56v/s Ratio Prot c0.94 0.00 c0.54 c0.01v/s Ratio Perm 0.01 0.11 0.00v/c Ratio 1.18 0.01 0.13 0.63 0.21 0.01Uniform Delay, d1 12.1 2.5 39.7 2.8 55.6 55.1Progression Factor 1.59 0.31 1.00 1.00 1.00 1.00Incremental Delay, d2 79.6 0.0 0.8 1.1 1.9 0.1Delay (s) 98.9 0.8 40.5 3.9 57.5 55.2Level of Service F A D A E EApproach Delay (s) 98.4 4.2 56.4Approach LOS F A E
Intersection SummaryHCM 2000 Control Delay 65.4 HCM 2000 Level of Service EHCM 2000 Volume to Capacity ratio 1.12Actuated Cycle Length (s) 120.0 Sum of lost time (s) 16.6Intersection Capacity Utilization 100.2% ICU Level of Service GAnalysis Period (min) 15c Critical Lane Group

Lanes, Volumes, Timings 2025 AM Total Future Conditions - Upgrades3: Proudfoot Trail & William Halton Parkway Graydon Banning
Graydon Banning 7/28/2015 2025 AM Total Future Conditions - Upgrades Synchro 9 ReportMC Page 9
Lane Group EBL EBT EBR WBL WBT WBR NBL NBT NBR SBL SBT SBRLane ConfigurationsTraffic Volume (vph) 6 1148 3 82 1050 4 6 6 33 15 19 21Future Volume (vph) 6 1148 3 82 1050 4 6 6 33 15 19 21Ideal Flow (vphpl) 1900 1900 1900 1900 1900 1900 1900 1900 1900 1900 1900 1900Storage Length (m) 120.0 0.0 120.0 0.0 70.0 0.0 70.0 0.0Storage Lanes 1 0 1 0 1 0 1 0Taper Length (m) 70.0 70.0 70.0 70.0Lane Util. Factor 1.00 0.95 0.95 1.00 0.95 0.95 1.00 1.00 1.00 1.00 1.00 1.00Frt 0.999 0.874 0.922Flt Protected 0.950 0.950 0.950 0.950Satd. Flow (prot) 1789 3579 0 1789 3575 0 1789 1646 0 1789 1737 0Flt Permitted 0.220 0.192 0.728 0.729Satd. Flow (perm) 414 3579 0 362 3575 0 1371 1646 0 1373 1737 0Right Turn on Red Yes Yes Yes YesSatd. Flow (RTOR) 1 1 36 23Link Speed (k/h) 60 60 50 50Link Distance (m) 153.4 363.2 406.8 89.2Travel Time (s) 9.2 21.8 29.3 6.4Peak Hour Factor 0.92 0.92 0.92 0.92 0.92 0.92 0.92 0.92 0.92 0.92 0.92 0.92Adj. Flow (vph) 7 1248 3 89 1141 4 7 7 36 16 21 23Shared Lane Traffic (%)Lane Group Flow (vph) 7 1251 0 89 1145 0 7 43 0 16 44 0Enter Blocked Intersection No No No No No No No No No No No NoLane Alignment Left Left Right Left Left Right Left Left Right Left Left RightMedian Width(m) 3.7 3.7 3.7 3.7Link Offset(m) 0.0 0.0 0.0 0.0Crosswalk Width(m) 1.6 1.6 1.6 1.6Two way Left Turn LaneHeadway Factor 0.99 0.99 0.99 0.99 0.99 0.99 0.99 0.99 0.99 0.99 0.99 0.99Turning Speed (k/h) 24 14 24 14 24 14 24 14Number of Detectors 1 2 1 2 1 2 1 2Detector Template Left Thru Left Thru Left Thru Left ThruLeading Detector (m) 6.1 30.5 6.1 30.5 6.1 30.5 6.1 30.5Trailing Detector (m) 0.0 0.0 0.0 0.0 0.0 0.0 0.0 0.0Detector 1 Position(m) 0.0 0.0 0.0 0.0 0.0 0.0 0.0 0.0Detector 1 Size(m) 6.1 1.8 6.1 1.8 6.1 1.8 6.1 1.8Detector 1 Type Cl+Ex Cl+Ex Cl+Ex Cl+Ex Cl+Ex Cl+Ex Cl+Ex Cl+ExDetector 1 ChannelDetector 1 Extend (s) 0.0 0.0 0.0 0.0 0.0 0.0 0.0 0.0Detector 1 Queue (s) 0.0 0.0 0.0 0.0 0.0 0.0 0.0 0.0Detector 1 Delay (s) 0.0 0.0 0.0 0.0 0.0 0.0 0.0 0.0Detector 2 Position(m) 28.7 28.7 28.7 28.7Detector 2 Size(m) 1.8 1.8 1.8 1.8Detector 2 Type Cl+Ex Cl+Ex Cl+Ex Cl+ExDetector 2 ChannelDetector 2 Extend (s) 0.0 0.0 0.0 0.0Turn Type Perm NA Perm NA Perm NA Perm NAProtected Phases 2 6 8 4Permitted Phases 2 6 8 4

Lanes, Volumes, Timings 2025 AM Total Future Conditions - Upgrades3: Proudfoot Trail & William Halton Parkway Graydon Banning
Graydon Banning 7/28/2015 2025 AM Total Future Conditions - Upgrades Synchro 9 ReportMC Page 10
Lane Group EBL EBT EBR WBL WBT WBR NBL NBT NBR SBL SBT SBRDetector Phase 2 2 6 6 8 8 4 4Switch PhaseMinimum Initial (s) 5.0 5.0 5.0 5.0 5.0 5.0 5.0 5.0Minimum Split (s) 22.5 22.5 22.5 22.5 22.5 22.5 22.5 22.5Total Split (s) 95.0 95.0 95.0 95.0 25.0 25.0 25.0 25.0Total Split (%) 79.2% 79.2% 79.2% 79.2% 20.8% 20.8% 20.8% 20.8%Maximum Green (s) 90.5 90.5 90.5 90.5 20.5 20.5 20.5 20.5Yellow Time (s) 3.5 3.5 3.5 3.5 3.5 3.5 3.5 3.5All-Red Time (s) 1.0 1.0 1.0 1.0 1.0 1.0 1.0 1.0Lost Time Adjust (s) 0.0 0.0 0.0 0.0 0.0 0.0 0.0 0.0Total Lost Time (s) 4.5 4.5 4.5 4.5 4.5 4.5 4.5 4.5Lead/LagLead-Lag Optimize?Vehicle Extension (s) 3.0 3.0 3.0 3.0 3.0 3.0 3.0 3.0Recall Mode C-Max C-Max C-Max C-Max Max Max Max MaxWalk Time (s) 7.0 7.0 7.0 7.0 7.0 7.0 7.0 7.0Flash Dont Walk (s) 11.0 11.0 11.0 11.0 11.0 11.0 11.0 11.0Pedestrian Calls (#/hr) 0 0 0 0 0 0 0 0Act Effct Green (s) 90.5 90.5 90.5 90.5 20.5 20.5 20.5 20.5Actuated g/C Ratio 0.75 0.75 0.75 0.75 0.17 0.17 0.17 0.17v/c Ratio 0.02 0.46 0.33 0.42 0.03 0.14 0.07 0.14Control Delay 4.0 6.2 5.6 3.4 41.8 16.4 42.8 25.9Queue Delay 0.0 0.0 0.0 0.0 0.0 0.0 0.0 0.0Total Delay 4.0 6.2 5.6 3.4 41.8 16.4 42.8 25.9LOS A A A A D B D CApproach Delay 6.2 3.5 20.0 30.4Approach LOS A A C CQueue Length 50th (m) 0.4 50.2 0.8 35.6 1.3 0.7 3.2 4.2Queue Length 95th (m) 1.5 60.9 7.3 17.0 m5.3 m5.1 9.6 14.6Internal Link Dist (m) 129.4 339.2 382.8 65.2Turn Bay Length (m) 120.0 120.0 70.0 70.0Base Capacity (vph) 312 2699 273 2696 234 311 234 315Starvation Cap Reductn 0 0 0 0 0 0 0 0Spillback Cap Reductn 0 0 0 0 0 0 0 0Storage Cap Reductn 0 0 0 0 0 0 0 0Reduced v/c Ratio 0.02 0.46 0.33 0.42 0.03 0.14 0.07 0.14
Intersection SummaryArea Type: OtherCycle Length: 120Actuated Cycle Length: 120Offset: 27 (23%), Referenced to phase 2:EBTL and 6:WBTL, Start of GreenNatural Cycle: 60Control Type: Actuated-CoordinatedMaximum v/c Ratio: 0.46Intersection Signal Delay: 5.8 Intersection LOS: AIntersection Capacity Utilization 55.1% ICU Level of Service BAnalysis Period (min) 15m Volume for 95th percentile queue is metered by upstream signal.

Lanes, Volumes, Timings 2025 AM Total Future Conditions - Upgrades3: Proudfoot Trail & William Halton Parkway Graydon Banning
Graydon Banning 7/28/2015 2025 AM Total Future Conditions - Upgrades Synchro 9 ReportMC Page 11
Splits and Phases: 3: Proudfoot Trail & William Halton Parkway

HCM Signalized Intersection Capacity Analysis 2025 AM Total Future Conditions - Upgrades3: Proudfoot Trail & William Halton Parkway Graydon Banning
Graydon Banning 7/28/2015 2025 AM Total Future Conditions - Upgrades Synchro 9 ReportMC Page 12
Movement EBL EBT EBR WBL WBT WBR NBL NBT NBR SBL SBT SBRLane ConfigurationsTraffic Volume (vph) 6 1148 3 82 1050 4 6 6 33 15 19 21Future Volume (vph) 6 1148 3 82 1050 4 6 6 33 15 19 21Ideal Flow (vphpl) 1900 1900 1900 1900 1900 1900 1900 1900 1900 1900 1900 1900Total Lost time (s) 4.5 4.5 4.5 4.5 4.5 4.5 4.5 4.5Lane Util. Factor 1.00 0.95 1.00 0.95 1.00 1.00 1.00 1.00Frt 1.00 1.00 1.00 1.00 1.00 0.87 1.00 0.92Flt Protected 0.95 1.00 0.95 1.00 0.95 1.00 0.95 1.00Satd. Flow (prot) 1789 3577 1789 3577 1789 1647 1789 1736Flt Permitted 0.22 1.00 0.19 1.00 0.73 1.00 0.73 1.00Satd. Flow (perm) 414 3577 362 3577 1372 1647 1373 1736Peak-hour factor, PHF 0.92 0.92 0.92 0.92 0.92 0.92 0.92 0.92 0.92 0.92 0.92 0.92Adj. Flow (vph) 7 1248 3 89 1141 4 7 7 36 16 21 23RTOR Reduction (vph) 0 0 0 0 0 0 0 30 0 0 19 0Lane Group Flow (vph) 7 1251 0 89 1145 0 7 13 0 16 25 0Turn Type Perm NA Perm NA Perm NA Perm NAProtected Phases 2 6 8 4Permitted Phases 2 6 8 4Actuated Green, G (s) 90.5 90.5 90.5 90.5 20.5 20.5 20.5 20.5Effective Green, g (s) 90.5 90.5 90.5 90.5 20.5 20.5 20.5 20.5Actuated g/C Ratio 0.75 0.75 0.75 0.75 0.17 0.17 0.17 0.17Clearance Time (s) 4.5 4.5 4.5 4.5 4.5 4.5 4.5 4.5Vehicle Extension (s) 3.0 3.0 3.0 3.0 3.0 3.0 3.0 3.0Lane Grp Cap (vph) 312 2697 273 2697 234 281 234 296v/s Ratio Prot c0.35 0.32 0.01 c0.01v/s Ratio Perm 0.02 0.25 0.01 0.01v/c Ratio 0.02 0.46 0.33 0.42 0.03 0.05 0.07 0.08Uniform Delay, d1 3.7 5.6 4.8 5.3 41.5 41.6 41.7 41.9Progression Factor 1.00 1.00 0.51 0.54 0.99 0.93 1.00 1.00Incremental Delay, d2 0.1 0.6 2.9 0.5 0.2 0.3 0.6 0.6Delay (s) 3.8 6.2 5.4 3.3 41.4 39.0 42.3 42.4Level of Service A A A A D D D DApproach Delay (s) 6.1 3.5 39.3 42.4Approach LOS A A D D
Intersection SummaryHCM 2000 Control Delay 6.4 HCM 2000 Level of Service AHCM 2000 Volume to Capacity ratio 0.39Actuated Cycle Length (s) 120.0 Sum of lost time (s) 9.0Intersection Capacity Utilization 55.1% ICU Level of Service BAnalysis Period (min) 15c Critical Lane Group

Lanes, Volumes, Timings 2025 AM Total Future Conditions - Upgrades4: New Access & William Halton Parkway Graydon Banning
Graydon Banning 7/28/2015 2025 AM Total Future Conditions - Upgrades Synchro 9 ReportMC Page 13
Lane Group EBL EBT EBR WBL WBT WBR NBL NBT NBR SBL SBT SBRLane ConfigurationsTraffic Volume (vph) 36 1157 3 6 989 6 11 0 22 24 0 137Future Volume (vph) 36 1157 3 6 989 6 11 0 22 24 0 137Ideal Flow (vphpl) 1900 1900 1900 1900 1900 1900 1900 1900 1900 1900 1900 1900Storage Length (m) 120.0 0.0 120.0 0.0 70.0 0.0 70.0 0.0Storage Lanes 1 0 1 0 1 0 1 0Taper Length (m) 70.0 70.0 70.0 70.0Lane Util. Factor 1.00 0.95 0.95 1.00 0.95 0.95 1.00 1.00 1.00 1.00 1.00 1.00Frt 0.999 0.850 0.850Flt Protected 0.950 0.950 0.950 0.950Satd. Flow (prot) 1789 3579 0 1789 3575 0 1789 1601 0 1789 1601 0Flt Permitted 0.227 0.178 0.564 0.742Satd. Flow (perm) 428 3579 0 335 3575 0 1062 1601 0 1398 1601 0Right Turn on Red Yes Yes Yes YesSatd. Flow (RTOR) 1 102 146Link Speed (k/h) 60 60 48 48Link Distance (m) 363.2 219.4 79.0 79.4Travel Time (s) 21.8 13.2 5.9 6.0Peak Hour Factor 0.92 0.92 0.92 0.92 0.92 0.92 0.92 0.92 0.92 0.92 0.92 0.92Adj. Flow (vph) 39 1258 3 7 1075 7 12 0 24 26 0 149Shared Lane Traffic (%)Lane Group Flow (vph) 39 1261 0 7 1082 0 12 24 0 26 149 0Enter Blocked Intersection No No No No No No No No No No No NoLane Alignment Left Left Right Left Left Right Left Left Right Left Left RightMedian Width(m) 3.7 3.7 3.7 3.7Link Offset(m) 0.0 0.0 0.0 0.0Crosswalk Width(m) 1.6 1.6 1.6 1.6Two way Left Turn LaneHeadway Factor 0.99 0.99 0.99 0.99 0.99 0.99 0.99 0.99 0.99 0.99 0.99 0.99Turning Speed (k/h) 24 14 24 14 24 14 24 14Number of Detectors 1 2 1 2 1 2 1 2Detector Template Left Thru Left Thru Left Thru Left ThruLeading Detector (m) 6.1 30.5 6.1 30.5 6.1 30.5 6.1 30.5Trailing Detector (m) 0.0 0.0 0.0 0.0 0.0 0.0 0.0 0.0Detector 1 Position(m) 0.0 0.0 0.0 0.0 0.0 0.0 0.0 0.0Detector 1 Size(m) 6.1 1.8 6.1 1.8 6.1 1.8 6.1 1.8Detector 1 Type Cl+Ex Cl+Ex Cl+Ex Cl+Ex Cl+Ex Cl+Ex Cl+Ex Cl+ExDetector 1 ChannelDetector 1 Extend (s) 0.0 0.0 0.0 0.0 0.0 0.0 0.0 0.0Detector 1 Queue (s) 0.0 0.0 0.0 0.0 0.0 0.0 0.0 0.0Detector 1 Delay (s) 0.0 0.0 0.0 0.0 0.0 0.0 0.0 0.0Detector 2 Position(m) 28.7 28.7 28.7 28.7Detector 2 Size(m) 1.8 1.8 1.8 1.8Detector 2 Type Cl+Ex Cl+Ex Cl+Ex Cl+ExDetector 2 ChannelDetector 2 Extend (s) 0.0 0.0 0.0 0.0Turn Type Perm NA Perm NA Perm NA Perm NAProtected Phases 2 6 8 4Permitted Phases 2 6 8 4

Lanes, Volumes, Timings 2025 AM Total Future Conditions - Upgrades4: New Access & William Halton Parkway Graydon Banning
Graydon Banning 7/28/2015 2025 AM Total Future Conditions - Upgrades Synchro 9 ReportMC Page 14
Lane Group EBL EBT EBR WBL WBT WBR NBL NBT NBR SBL SBT SBRDetector Phase 2 2 6 6 8 8 4 4Switch PhaseMinimum Initial (s) 5.0 5.0 5.0 5.0 5.0 5.0 5.0 5.0Minimum Split (s) 22.5 22.5 22.5 22.5 22.5 22.5 22.5 22.5Total Split (s) 89.0 89.0 89.0 89.0 31.0 31.0 31.0 31.0Total Split (%) 74.2% 74.2% 74.2% 74.2% 25.8% 25.8% 25.8% 25.8%Maximum Green (s) 84.5 84.5 84.5 84.5 26.5 26.5 26.5 26.5Yellow Time (s) 3.5 3.5 3.5 3.5 3.5 3.5 3.5 3.5All-Red Time (s) 1.0 1.0 1.0 1.0 1.0 1.0 1.0 1.0Lost Time Adjust (s) 0.0 0.0 0.0 0.0 0.0 0.0 0.0 0.0Total Lost Time (s) 4.5 4.5 4.5 4.5 4.5 4.5 4.5 4.5Lead/LagLead-Lag Optimize?Vehicle Extension (s) 3.0 3.0 3.0 3.0 3.0 3.0 3.0 3.0Recall Mode C-Max C-Max C-Max C-Max Max Max Max MaxWalk Time (s) 7.0 7.0 7.0 7.0 7.0 7.0 7.0 7.0Flash Dont Walk (s) 11.0 11.0 11.0 11.0 11.0 11.0 11.0 11.0Pedestrian Calls (#/hr) 0 0 0 0 0 0 0 0Act Effct Green (s) 84.5 84.5 84.5 84.5 26.5 26.5 26.5 26.5Actuated g/C Ratio 0.70 0.70 0.70 0.70 0.22 0.22 0.22 0.22v/c Ratio 0.13 0.50 0.03 0.43 0.05 0.06 0.08 0.32Control Delay 6.8 8.6 5.8 8.2 37.7 0.2 38.2 8.5Queue Delay 0.0 0.0 0.0 0.0 0.0 0.0 0.0 0.0Total Delay 6.8 8.6 5.8 8.2 37.7 0.2 38.2 8.5LOS A A A A D A D AApproach Delay 8.6 8.1 12.7 12.9Approach LOS A A B BQueue Length 50th (m) 2.6 62.3 0.4 50.7 2.2 0.0 4.9 0.6Queue Length 95th (m) m6.3 73.8 1.9 62.3 7.5 0.0 12.6 17.0Internal Link Dist (m) 339.2 195.4 55.0 55.4Turn Bay Length (m) 120.0 120.0 70.0 70.0Base Capacity (vph) 301 2520 235 2517 234 433 308 467Starvation Cap Reductn 0 0 0 0 0 0 0 0Spillback Cap Reductn 0 0 0 0 0 0 0 0Storage Cap Reductn 0 0 0 0 0 0 0 0Reduced v/c Ratio 0.13 0.50 0.03 0.43 0.05 0.06 0.08 0.32
Intersection SummaryArea Type: OtherCycle Length: 120Actuated Cycle Length: 120Offset: 0 (0%), Referenced to phase 2:EBTL and 6:WBTL, Start of GreenNatural Cycle: 50Control Type: Actuated-CoordinatedMaximum v/c Ratio: 0.50Intersection Signal Delay: 8.7 Intersection LOS: AIntersection Capacity Utilization 48.7% ICU Level of Service AAnalysis Period (min) 15m Volume for 95th percentile queue is metered by upstream signal.

Lanes, Volumes, Timings 2025 AM Total Future Conditions - Upgrades4: New Access & William Halton Parkway Graydon Banning
Graydon Banning 7/28/2015 2025 AM Total Future Conditions - Upgrades Synchro 9 ReportMC Page 15
Splits and Phases: 4: New Access & William Halton Parkway

HCM Signalized Intersection Capacity Analysis 2025 AM Total Future Conditions - Upgrades4: New Access & William Halton Parkway Graydon Banning
Graydon Banning 7/28/2015 2025 AM Total Future Conditions - Upgrades Synchro 9 ReportMC Page 16
Movement EBL EBT EBR WBL WBT WBR NBL NBT NBR SBL SBT SBRLane ConfigurationsTraffic Volume (vph) 36 1157 3 6 989 6 11 0 22 24 0 137Future Volume (vph) 36 1157 3 6 989 6 11 0 22 24 0 137Ideal Flow (vphpl) 1900 1900 1900 1900 1900 1900 1900 1900 1900 1900 1900 1900Total Lost time (s) 4.5 4.5 4.5 4.5 4.5 4.5 4.5 4.5Lane Util. Factor 1.00 0.95 1.00 0.95 1.00 1.00 1.00 1.00Frt 1.00 1.00 1.00 1.00 1.00 0.85 1.00 0.85Flt Protected 0.95 1.00 0.95 1.00 0.95 1.00 0.95 1.00Satd. Flow (prot) 1789 3577 1789 3575 1789 1601 1789 1601Flt Permitted 0.23 1.00 0.18 1.00 0.56 1.00 0.74 1.00Satd. Flow (perm) 427 3577 336 3575 1062 1601 1397 1601Peak-hour factor, PHF 0.92 0.92 0.92 0.92 0.92 0.92 0.92 0.92 0.92 0.92 0.92 0.92Adj. Flow (vph) 39 1258 3 7 1075 7 12 0 24 26 0 149RTOR Reduction (vph) 0 0 0 0 0 0 0 19 0 0 114 0Lane Group Flow (vph) 39 1261 0 7 1082 0 12 5 0 26 35 0Turn Type Perm NA Perm NA Perm NA Perm NAProtected Phases 2 6 8 4Permitted Phases 2 6 8 4Actuated Green, G (s) 84.5 84.5 84.5 84.5 26.5 26.5 26.5 26.5Effective Green, g (s) 84.5 84.5 84.5 84.5 26.5 26.5 26.5 26.5Actuated g/C Ratio 0.70 0.70 0.70 0.70 0.22 0.22 0.22 0.22Clearance Time (s) 4.5 4.5 4.5 4.5 4.5 4.5 4.5 4.5Vehicle Extension (s) 3.0 3.0 3.0 3.0 3.0 3.0 3.0 3.0Lane Grp Cap (vph) 300 2518 236 2517 234 353 308 353v/s Ratio Prot c0.35 0.30 0.00 c0.02v/s Ratio Perm 0.09 0.02 0.01 0.02v/c Ratio 0.13 0.50 0.03 0.43 0.05 0.02 0.08 0.10Uniform Delay, d1 5.8 8.1 5.4 7.5 36.8 36.5 37.1 37.2Progression Factor 0.98 0.97 1.00 1.00 1.00 1.00 1.00 1.00Incremental Delay, d2 0.8 0.6 0.2 0.5 0.4 0.1 0.5 0.6Delay (s) 6.5 8.5 5.6 8.1 37.3 36.6 37.7 37.8Level of Service A A A A D D D DApproach Delay (s) 8.4 8.1 36.8 37.8Approach LOS A A D D
Intersection SummaryHCM 2000 Control Delay 10.6 HCM 2000 Level of Service BHCM 2000 Volume to Capacity ratio 0.40Actuated Cycle Length (s) 120.0 Sum of lost time (s) 9.0Intersection Capacity Utilization 48.7% ICU Level of Service AAnalysis Period (min) 15c Critical Lane Group

Lanes, Volumes, Timings 2025 AM Total Future Conditions - Upgrades1: Proudfoot Trail & Dundas Street Graydon Banning
Graydon Banning 7/28/2015 2025 AM Total Future Conditions - Upgrades Synchro 9 ReportMC Page 1
Lane Group EBL EBT EBR WBL WBT WBR NBL NBT NBR SBL SBT SBRLane ConfigurationsTraffic Volume (vph) 28 3059 67 76 1528 70 80 14 450 147 46 108Future Volume (vph) 28 3059 67 76 1528 70 80 14 450 147 46 108Ideal Flow (vphpl) 1900 1900 1900 1900 1900 1900 1900 1900 1900 1900 1900 1900Storage Length (m) 120.0 70.0 120.0 70.0 70.0 0.0 70.0 0.0Storage Lanes 1 1 1 1 1 0 1 0Taper Length (m) 70.0 70.0 70.0 70.0Lane Util. Factor 1.00 0.95 1.00 1.00 0.95 1.00 1.00 1.00 1.00 1.00 1.00 1.00Ped Bike Factor 0.98 0.99Frt 0.850 0.850 0.854 0.895Flt Protected 0.950 0.950 0.950 0.950Satd. Flow (prot) 1789 3444 1498 1789 3230 1601 1755 1617 0 1789 1686 0Flt Permitted 0.109 0.063 0.635 0.172Satd. Flow (perm) 205 3444 1463 119 3230 1601 1173 1617 0 324 1686 0Right Turn on Red Yes Yes Yes YesSatd. Flow (RTOR) 72 72 90 101Link Speed (k/h) 60 60 50 48Link Distance (m) 373.6 424.7 186.0 406.8Travel Time (s) 22.4 25.5 13.4 30.5Confl. Peds. (#/hr) 1 1 1Peak Hour Factor 0.97 0.97 0.97 0.97 0.97 0.97 0.97 0.97 0.97 0.97 0.97 0.97Growth Factor 100% 85% 100% 100% 85% 100% 100% 100% 100% 100% 100% 100%Heavy Vehicles (%) 2% 6% 9% 2% 13% 2% 4% 2% 0% 2% 2% 2%Adj. Flow (vph) 29 2681 69 78 1339 72 82 14 464 152 47 111Shared Lane Traffic (%)Lane Group Flow (vph) 29 2681 69 78 1339 72 82 478 0 152 158 0Enter Blocked Intersection No No No No No No No No No No No NoLane Alignment Left Left Right Left Left Right Left Left Right Left Left RightMedian Width(m) 3.7 3.7 3.7 3.7Link Offset(m) 0.0 0.0 0.0 0.0Crosswalk Width(m) 1.6 1.6 1.6 1.6Two way Left Turn LaneHeadway Factor 0.99 0.99 0.99 0.99 0.99 0.99 0.99 0.99 0.99 0.99 0.99 0.99Turning Speed (k/h) 24 14 24 14 24 14 24 14Number of Detectors 1 2 1 1 2 1 1 2 1 2Detector Template Left Thru Right Left Thru Right Left Thru Left ThruLeading Detector (m) 6.1 30.5 6.1 6.1 30.5 6.1 6.1 30.5 6.1 30.5Trailing Detector (m) 0.0 0.0 0.0 0.0 0.0 0.0 0.0 0.0 0.0 0.0Detector 1 Position(m) 0.0 0.0 0.0 0.0 0.0 0.0 0.0 0.0 0.0 0.0Detector 1 Size(m) 6.1 1.8 6.1 6.1 1.8 6.1 6.1 1.8 6.1 1.8Detector 1 Type Cl+Ex Cl+Ex Cl+Ex Cl+Ex Cl+Ex Cl+Ex Cl+Ex Cl+Ex Cl+Ex Cl+ExDetector 1 ChannelDetector 1 Extend (s) 0.0 0.0 0.0 0.0 0.0 0.0 0.0 0.0 0.0 0.0Detector 1 Queue (s) 0.0 0.0 0.0 0.0 0.0 0.0 0.0 0.0 0.0 0.0Detector 1 Delay (s) 0.0 0.0 0.0 0.0 0.0 0.0 0.0 0.0 0.0 0.0Detector 2 Position(m) 28.7 28.7 28.7 28.7Detector 2 Size(m) 1.8 1.8 1.8 1.8Detector 2 Type Cl+Ex Cl+Ex Cl+Ex Cl+ExDetector 2 Channel

Lanes, Volumes, Timings 2025 AM Total Future Conditions - Upgrades1: Proudfoot Trail & Dundas Street Graydon Banning
Graydon Banning 7/28/2015 2025 AM Total Future Conditions - Upgrades Synchro 9 ReportMC Page 2
Lane Group EBL EBT EBR WBL WBT WBR NBL NBT NBR SBL SBT SBRDetector 2 Extend (s) 0.0 0.0 0.0 0.0Turn Type pm+pt NA Perm pm+pt NA Perm Perm NA Perm NAProtected Phases 5 2 1 6 8 4Permitted Phases 2 2 6 6 8 4Detector Phase 5 2 2 1 6 6 8 8 4 4Switch PhaseMinimum Initial (s) 5.0 5.0 5.0 5.0 5.0 5.0 5.0 5.0 5.0 5.0Minimum Split (s) 9.5 23.9 23.9 9.5 23.9 23.9 24.9 24.9 24.9 24.9Total Split (s) 9.5 67.5 67.5 9.5 67.5 67.5 43.0 43.0 43.0 43.0Total Split (%) 7.9% 56.3% 56.3% 7.9% 56.3% 56.3% 35.8% 35.8% 35.8% 35.8%Maximum Green (s) 5.5 61.6 61.6 5.5 61.6 61.6 36.1 36.1 36.1 36.1Yellow Time (s) 3.0 3.7 3.7 3.0 3.7 3.7 3.3 3.3 3.3 3.3All-Red Time (s) 1.0 2.2 2.2 1.0 2.2 2.2 3.6 3.6 3.6 3.6Lost Time Adjust (s) 0.0 0.0 0.0 0.0 0.0 0.0 0.0 0.0 0.0 0.0Total Lost Time (s) 4.0 5.9 5.9 4.0 5.9 5.9 6.9 6.9 6.9 6.9Lead/Lag Lead Lag Lag Lead Lag LagLead-Lag Optimize? Yes Yes YesVehicle Extension (s) 3.0 5.5 5.5 3.0 5.5 5.5 5.0 5.0 3.0 3.0Recall Mode None C-Max C-Max None C-Max C-Max None None None NoneWalk Time (s) 7.0 7.0 7.0 7.0 7.0 7.0 7.0 7.0Flash Dont Walk (s) 11.0 11.0 11.0 11.0 11.0 11.0 11.0 11.0Pedestrian Calls (#/hr) 0 0 0 0 0 0 0 0Act Effct Green (s) 69.8 63.5 63.5 70.6 65.4 65.4 36.1 36.1 36.1 36.1Actuated g/C Ratio 0.58 0.53 0.53 0.59 0.54 0.54 0.30 0.30 0.30 0.30v/c Ratio 0.15 1.47 0.09 0.53 0.76 0.08 0.23 0.87 1.57 0.27Control Delay 11.2 241.4 3.4 32.1 22.9 3.3 33.8 49.9 330.6 14.2Queue Delay 0.0 0.0 0.0 0.0 0.0 0.0 0.0 0.0 0.0 0.0Total Delay 11.2 241.4 3.4 32.1 22.9 3.3 33.8 49.9 330.6 14.2LOS B F A C C A C D F BApproach Delay 233.1 22.4 47.5 169.3Approach LOS F C D FQueue Length 50th (m) 2.6 ~463.4 0.0 7.0 134.2 0.1 14.5 89.0 ~51.7 11.6Queue Length 95th (m) 6.3 #502.6 6.7 22.8 164.4 5.9 27.9 #147.9 #93.3 25.6Internal Link Dist (m) 349.6 400.7 162.0 382.8Turn Bay Length (m) 120.0 70.0 120.0 70.0 70.0 70.0Base Capacity (vph) 191 1822 808 146 1760 904 352 549 97 577Starvation Cap Reductn 0 0 0 0 0 0 0 0 0 0Spillback Cap Reductn 0 0 0 0 0 0 0 0 0 0Storage Cap Reductn 0 0 0 0 0 0 0 0 0 0Reduced v/c Ratio 0.15 1.47 0.09 0.53 0.76 0.08 0.23 0.87 1.57 0.27
Intersection SummaryArea Type: OtherCycle Length: 120Actuated Cycle Length: 120Offset: 80.4 (67%), Referenced to phase 2:EBTL and 6:WBTL, Start of GreenNatural Cycle: 150Control Type: Actuated-CoordinatedMaximum v/c Ratio: 1.57

Lanes, Volumes, Timings 2025 AM Total Future Conditions - Upgrades1: Proudfoot Trail & Dundas Street Graydon Banning
Graydon Banning 7/28/2015 2025 AM Total Future Conditions - Upgrades Synchro 9 ReportMC Page 3
Intersection Signal Delay: 148.0 Intersection LOS: FIntersection Capacity Utilization 125.1% ICU Level of Service HAnalysis Period (min) 15~ Volume exceeds capacity, queue is theoretically infinite. Queue shown is maximum after two cycles.# 95th percentile volume exceeds capacity, queue may be longer. Queue shown is maximum after two cycles.
Splits and Phases: 1: Proudfoot Trail & Dundas Street

HCM Signalized Intersection Capacity Analysis 2025 AM Total Future Conditions - Upgrades1: Proudfoot Trail & Dundas Street Graydon Banning
Graydon Banning 7/28/2015 2025 AM Total Future Conditions - Upgrades Synchro 9 ReportMC Page 4
Movement EBL EBT EBR WBL WBT WBR NBL NBT NBR SBL SBT SBRLane ConfigurationsTraffic Volume (vph) 28 3059 67 76 1528 70 80 14 450 147 46 108Future Volume (vph) 28 3059 67 76 1528 70 80 14 450 147 46 108Ideal Flow (vphpl) 1900 1900 1900 1900 1900 1900 1900 1900 1900 1900 1900 1900Total Lost time (s) 4.0 5.9 5.9 4.0 5.9 5.9 6.9 6.9 6.9 6.9Lane Util. Factor 1.00 0.95 1.00 1.00 0.95 1.00 1.00 1.00 1.00 1.00Frpb, ped/bikes 1.00 1.00 0.98 1.00 1.00 1.00 1.00 0.99 1.00 1.00Flpb, ped/bikes 1.00 1.00 1.00 1.00 1.00 1.00 1.00 1.00 1.00 1.00Frt 1.00 1.00 0.85 1.00 1.00 0.85 1.00 0.85 1.00 0.89Flt Protected 0.95 1.00 1.00 0.95 1.00 1.00 0.95 1.00 0.95 1.00Satd. Flow (prot) 1789 3444 1463 1789 3230 1601 1755 1618 1789 1685Flt Permitted 0.11 1.00 1.00 0.06 1.00 1.00 0.64 1.00 0.17 1.00Satd. Flow (perm) 206 3444 1463 118 3230 1601 1174 1618 324 1685Peak-hour factor, PHF 0.97 0.97 0.97 0.97 0.97 0.97 0.97 0.97 0.97 0.97 0.97 0.97Growth Factor (vph) 100% 85% 100% 100% 85% 100% 100% 100% 100% 100% 100% 100%Adj. Flow (vph) 29 2681 69 78 1339 72 82 14 464 152 47 111RTOR Reduction (vph) 0 0 33 0 0 34 0 63 0 0 71 0Lane Group Flow (vph) 29 2681 36 78 1339 38 82 415 0 152 87 0Confl. Peds. (#/hr) 1 1 1Heavy Vehicles (%) 2% 6% 9% 2% 13% 2% 4% 2% 0% 2% 2% 2%Turn Type pm+pt NA Perm pm+pt NA Perm Perm NA Perm NAProtected Phases 5 2 1 6 8 4Permitted Phases 2 2 6 6 8 4Actuated Green, G (s) 66.0 62.7 62.7 68.2 63.8 63.8 36.1 36.1 36.1 36.1Effective Green, g (s) 66.0 62.7 62.7 68.2 63.8 63.8 36.1 36.1 36.1 36.1Actuated g/C Ratio 0.55 0.52 0.52 0.57 0.53 0.53 0.30 0.30 0.30 0.30Clearance Time (s) 4.0 5.9 5.9 4.0 5.9 5.9 6.9 6.9 6.9 6.9Vehicle Extension (s) 3.0 5.5 5.5 3.0 5.5 5.5 5.0 5.0 3.0 3.0Lane Grp Cap (vph) 156 1799 764 128 1717 851 353 486 97 506v/s Ratio Prot 0.01 c0.78 c0.02 0.41 0.26 0.05v/s Ratio Perm 0.10 0.02 0.32 0.02 0.07 c0.47v/c Ratio 0.19 1.49 0.05 0.61 0.78 0.04 0.23 0.85 1.57 0.17Uniform Delay, d1 16.2 28.6 14.0 27.2 22.5 13.5 31.5 39.5 42.0 30.9Progression Factor 1.00 1.00 1.00 1.48 0.90 0.92 1.00 1.00 1.04 1.03Incremental Delay, d2 0.6 223.6 0.1 7.0 3.2 0.1 0.7 14.8 298.9 0.2Delay (s) 16.8 252.3 14.1 47.4 23.3 12.5 32.2 54.3 342.5 32.2Level of Service B F B D C B C D F CApproach Delay (s) 243.9 24.0 51.1 184.3Approach LOS F C D F
Intersection SummaryHCM 2000 Control Delay 155.6 HCM 2000 Level of Service FHCM 2000 Volume to Capacity ratio 1.48Actuated Cycle Length (s) 120.0 Sum of lost time (s) 16.8Intersection Capacity Utilization 125.1% ICU Level of Service HAnalysis Period (min) 15c Critical Lane Group

Lanes, Volumes, Timings 2025 AM Total Future Conditions - Upgrades2: Fourth Line & Dundas Street Graydon Banning
Graydon Banning 7/28/2015 2025 AM Total Future Conditions - Upgrades Synchro 9 ReportMC Page 5
Lane Group EBT EBR WBL WBT NBL NBRLane ConfigurationsTraffic Volume (vph) 3641 15 15 1659 15 15Future Volume (vph) 3641 15 15 1659 15 15Ideal Flow (vphpl) 1900 1900 1900 1900 1900 1900Storage Length (m) 70.0 120.0 0.0 0.0Storage Lanes 1 1 1 1Taper Length (m) 70.0 2.5Lane Util. Factor 0.95 1.00 1.00 0.95 1.00 1.00Ped Bike Factor 0.97Frt 0.850 0.850Flt Protected 0.950 0.950Satd. Flow (prot) 3510 1512 1825 3288 1825 1361Flt Permitted 0.040 0.950Satd. Flow (perm) 3510 1472 77 3288 1825 1361Right Turn on Red Yes YesSatd. Flow (RTOR) 6 16Link Speed (k/h) 60 60 50Link Distance (m) 424.7 312.9 64.1Travel Time (s) 25.5 18.8 4.6Confl. Peds. (#/hr) 3 3Peak Hour Factor 0.94 0.94 0.94 0.94 0.94 0.94Growth Factor 85% 100% 100% 85% 100% 100%Heavy Vehicles (%) 4% 8% 0% 11% 0% 20%Adj. Flow (vph) 3292 16 16 1500 16 16Shared Lane Traffic (%)Lane Group Flow (vph) 3292 16 16 1500 16 16Enter Blocked Intersection No No No No No NoLane Alignment Left Right Left Left Left RightMedian Width(m) 3.7 3.7 3.7Link Offset(m) 0.0 0.0 0.0Crosswalk Width(m) 1.6 1.6 1.6Two way Left Turn LaneHeadway Factor 0.99 0.99 0.99 0.99 0.99 0.99Turning Speed (k/h) 14 24 24 14Number of Detectors 2 1 1 2 1 1Detector Template Thru Right Left Thru Left RightLeading Detector (m) 30.5 6.1 6.1 30.5 6.1 6.1Trailing Detector (m) 0.0 0.0 0.0 0.0 0.0 0.0Detector 1 Position(m) 0.0 0.0 0.0 0.0 0.0 0.0Detector 1 Size(m) 1.8 6.1 6.1 1.8 6.1 6.1Detector 1 Type Cl+Ex Cl+Ex Cl+Ex Cl+Ex Cl+Ex Cl+ExDetector 1 ChannelDetector 1 Extend (s) 0.0 0.0 0.0 0.0 0.0 0.0Detector 1 Queue (s) 0.0 0.0 0.0 0.0 0.0 0.0Detector 1 Delay (s) 0.0 0.0 0.0 0.0 0.0 0.0Detector 2 Position(m) 28.7 28.7Detector 2 Size(m) 1.8 1.8Detector 2 Type Cl+Ex Cl+ExDetector 2 Channel

Lanes, Volumes, Timings 2025 AM Total Future Conditions - Upgrades2: Fourth Line & Dundas Street Graydon Banning
Graydon Banning 7/28/2015 2025 AM Total Future Conditions - Upgrades Synchro 9 ReportMC Page 6
Lane Group EBT EBR WBL WBT NBL NBRDetector 2 Extend (s) 0.0 0.0Turn Type NA Perm pm+pt NA Prot PermProtected Phases 2 1 6 8Permitted Phases 2 6 8Detector Phase 2 2 1 6 8 8Switch PhaseMinimum Initial (s) 5.0 5.0 5.0 5.0 5.0 5.0Minimum Split (s) 33.0 33.0 9.5 24.0 40.6 40.6Total Split (s) 69.9 69.9 9.5 79.4 40.6 40.6Total Split (%) 58.3% 58.3% 7.9% 66.2% 33.8% 33.8%Maximum Green (s) 63.9 63.9 5.5 73.4 34.0 34.0Yellow Time (s) 3.7 3.7 3.0 3.7 3.7 3.7All-Red Time (s) 2.3 2.3 1.0 2.3 2.9 2.9Lost Time Adjust (s) 0.0 0.0 0.0 0.0 0.0 0.0Total Lost Time (s) 6.0 6.0 4.0 6.0 6.6 6.6Lead/Lag Lag Lag LeadLead-Lag Optimize? Yes Yes YesVehicle Extension (s) 5.0 5.0 4.0 5.0 4.0 4.0Recall Mode C-Max C-Max None C-Max None NoneWalk Time (s) 7.0 7.0 7.0 7.0 7.0Flash Dont Walk (s) 20.0 20.0 7.0 27.0 27.0Pedestrian Calls (#/hr) 0 0 0 0 0Act Effct Green (s) 103.1 103.1 107.0 107.4 7.6 7.6Actuated g/C Ratio 0.86 0.86 0.89 0.90 0.06 0.06v/c Ratio 1.09 0.01 0.10 0.51 0.14 0.16Control Delay 59.7 1.0 2.7 3.0 55.1 26.0Queue Delay 0.0 0.0 0.0 0.0 0.0 0.0Total Delay 59.7 1.0 2.7 3.0 55.1 26.0LOS E A A A E CApproach Delay 59.4 3.0 40.6Approach LOS E A DQueue Length 50th (m) ~249.7 0.1 0.4 43.2 3.6 0.0Queue Length 95th (m) m81.0 m0.1 1.4 59.6 10.7 7.0Internal Link Dist (m) 400.7 288.9 40.1Turn Bay Length (m) 70.0 120.0Base Capacity (vph) 3016 1266 165 2944 517 397Starvation Cap Reductn 0 0 0 0 0 0Spillback Cap Reductn 0 0 0 0 0 0Storage Cap Reductn 0 0 0 0 0 0Reduced v/c Ratio 1.09 0.01 0.10 0.51 0.03 0.04
Intersection SummaryArea Type: OtherCycle Length: 120Actuated Cycle Length: 120Offset: 103.2 (86%), Referenced to phase 2:EBT and 6:WBTL, Start of GreenNatural Cycle: 145Control Type: Actuated-CoordinatedMaximum v/c Ratio: 1.09

Lanes, Volumes, Timings 2025 AM Total Future Conditions - Upgrades2: Fourth Line & Dundas Street Graydon Banning
Graydon Banning 7/28/2015 2025 AM Total Future Conditions - Upgrades Synchro 9 ReportMC Page 7
Intersection Signal Delay: 41.7 Intersection LOS: DIntersection Capacity Utilization 100.2% ICU Level of Service GAnalysis Period (min) 15~ Volume exceeds capacity, queue is theoretically infinite. Queue shown is maximum after two cycles.m Volume for 95th percentile queue is metered by upstream signal.
Splits and Phases: 2: Fourth Line & Dundas Street

HCM Signalized Intersection Capacity Analysis 2025 AM Total Future Conditions - Upgrades2: Fourth Line & Dundas Street Graydon Banning
Graydon Banning 7/28/2015 2025 AM Total Future Conditions - Upgrades Synchro 9 ReportMC Page 8
Movement EBT EBR WBL WBT NBL NBRLane ConfigurationsTraffic Volume (vph) 3641 15 15 1659 15 15Future Volume (vph) 3641 15 15 1659 15 15Ideal Flow (vphpl) 1900 1900 1900 1900 1900 1900Total Lost time (s) 6.0 6.0 4.0 6.0 6.6 6.6Lane Util. Factor 0.95 1.00 1.00 0.95 1.00 1.00Frpb, ped/bikes 1.00 0.97 1.00 1.00 1.00 1.00Flpb, ped/bikes 1.00 1.00 1.00 1.00 1.00 1.00Frt 1.00 0.85 1.00 1.00 1.00 0.85Flt Protected 1.00 1.00 0.95 1.00 0.95 1.00Satd. Flow (prot) 3510 1472 1825 3288 1825 1361Flt Permitted 1.00 1.00 0.04 1.00 0.95 1.00Satd. Flow (perm) 3510 1472 77 3288 1825 1361Peak-hour factor, PHF 0.94 0.94 0.94 0.94 0.94 0.94Growth Factor (vph) 85% 100% 100% 85% 100% 100%Adj. Flow (vph) 3292 16 16 1500 16 16RTOR Reduction (vph) 0 1 0 0 0 15Lane Group Flow (vph) 3292 15 16 1500 16 1Confl. Peds. (#/hr) 3 3Heavy Vehicles (%) 4% 8% 0% 11% 0% 20%Turn Type NA Perm pm+pt NA Prot PermProtected Phases 2 1 6 8Permitted Phases 2 6 8Actuated Green, G (s) 95.7 95.7 102.4 102.4 5.0 5.0Effective Green, g (s) 95.7 95.7 102.4 102.4 5.0 5.0Actuated g/C Ratio 0.80 0.80 0.85 0.85 0.04 0.04Clearance Time (s) 6.0 6.0 4.0 6.0 6.6 6.6Vehicle Extension (s) 5.0 5.0 4.0 5.0 4.0 4.0Lane Grp Cap (vph) 2799 1173 105 2805 76 56v/s Ratio Prot c0.94 0.00 c0.46 c0.01v/s Ratio Perm 0.01 0.13 0.00v/c Ratio 1.18 0.01 0.15 0.53 0.21 0.01Uniform Delay, d1 12.1 2.5 39.8 2.4 55.6 55.1Progression Factor 1.59 0.31 1.00 1.00 1.00 1.00Incremental Delay, d2 79.6 0.0 0.9 0.7 1.9 0.1Delay (s) 98.9 0.8 40.7 3.1 57.5 55.2Level of Service F A D A E EApproach Delay (s) 98.4 3.5 56.4Approach LOS F A E
Intersection SummaryHCM 2000 Control Delay 68.5 HCM 2000 Level of Service EHCM 2000 Volume to Capacity ratio 1.12Actuated Cycle Length (s) 120.0 Sum of lost time (s) 16.6Intersection Capacity Utilization 100.2% ICU Level of Service GAnalysis Period (min) 15c Critical Lane Group

Lanes, Volumes, Timings 2025 AM Total Future Conditions - Upgrades3: Proudfoot Trail & William Halton Parkway Graydon Banning
Graydon Banning 7/28/2015 2025 AM Total Future Conditions - Upgrades Synchro 9 ReportMC Page 9
Lane Group EBL EBT EBR WBL WBT WBR NBL NBT NBR SBL SBT SBRLane ConfigurationsTraffic Volume (vph) 6 933 3 82 1265 4 6 6 33 15 19 21Future Volume (vph) 6 933 3 82 1265 4 6 6 33 15 19 21Ideal Flow (vphpl) 1900 1900 1900 1900 1900 1900 1900 1900 1900 1900 1900 1900Storage Length (m) 120.0 0.0 120.0 0.0 70.0 0.0 70.0 0.0Storage Lanes 1 0 1 0 1 0 1 0Taper Length (m) 70.0 70.0 70.0 70.0Lane Util. Factor 1.00 0.95 0.95 1.00 0.95 0.95 1.00 1.00 1.00 1.00 1.00 1.00Frt 0.874 0.922Flt Protected 0.950 0.950 0.950 0.950Satd. Flow (prot) 1789 3579 0 1789 3579 0 1789 1646 0 1789 1737 0Flt Permitted 0.163 0.257 0.728 0.729Satd. Flow (perm) 307 3579 0 484 3579 0 1371 1646 0 1373 1737 0Right Turn on Red Yes Yes Yes YesSatd. Flow (RTOR) 1 1 36 23Link Speed (k/h) 60 60 50 50Link Distance (m) 153.4 363.2 406.8 89.2Travel Time (s) 9.2 21.8 29.3 6.4Peak Hour Factor 0.92 0.92 0.92 0.92 0.92 0.92 0.92 0.92 0.92 0.92 0.92 0.92Adj. Flow (vph) 7 1014 3 89 1375 4 7 7 36 16 21 23Shared Lane Traffic (%)Lane Group Flow (vph) 7 1017 0 89 1379 0 7 43 0 16 44 0Enter Blocked Intersection No No No No No No No No No No No NoLane Alignment Left Left Right Left Left Right Left Left Right Left Left RightMedian Width(m) 3.7 3.7 3.7 3.7Link Offset(m) 0.0 0.0 0.0 0.0Crosswalk Width(m) 1.6 1.6 1.6 1.6Two way Left Turn LaneHeadway Factor 0.99 0.99 0.99 0.99 0.99 0.99 0.99 0.99 0.99 0.99 0.99 0.99Turning Speed (k/h) 24 14 24 14 24 14 24 14Number of Detectors 1 2 1 2 1 2 1 2Detector Template Left Thru Left Thru Left Thru Left ThruLeading Detector (m) 6.1 30.5 6.1 30.5 6.1 30.5 6.1 30.5Trailing Detector (m) 0.0 0.0 0.0 0.0 0.0 0.0 0.0 0.0Detector 1 Position(m) 0.0 0.0 0.0 0.0 0.0 0.0 0.0 0.0Detector 1 Size(m) 6.1 1.8 6.1 1.8 6.1 1.8 6.1 1.8Detector 1 Type Cl+Ex Cl+Ex Cl+Ex Cl+Ex Cl+Ex Cl+Ex Cl+Ex Cl+ExDetector 1 ChannelDetector 1 Extend (s) 0.0 0.0 0.0 0.0 0.0 0.0 0.0 0.0Detector 1 Queue (s) 0.0 0.0 0.0 0.0 0.0 0.0 0.0 0.0Detector 1 Delay (s) 0.0 0.0 0.0 0.0 0.0 0.0 0.0 0.0Detector 2 Position(m) 28.7 28.7 28.7 28.7Detector 2 Size(m) 1.8 1.8 1.8 1.8Detector 2 Type Cl+Ex Cl+Ex Cl+Ex Cl+ExDetector 2 ChannelDetector 2 Extend (s) 0.0 0.0 0.0 0.0Turn Type Perm NA Perm NA Perm NA Perm NAProtected Phases 2 6 8 4Permitted Phases 2 6 8 4

Lanes, Volumes, Timings 2025 AM Total Future Conditions - Upgrades3: Proudfoot Trail & William Halton Parkway Graydon Banning
Graydon Banning 7/28/2015 2025 AM Total Future Conditions - Upgrades Synchro 9 ReportMC Page 10
Lane Group EBL EBT EBR WBL WBT WBR NBL NBT NBR SBL SBT SBRDetector Phase 2 2 6 6 8 8 4 4Switch PhaseMinimum Initial (s) 5.0 5.0 5.0 5.0 5.0 5.0 5.0 5.0Minimum Split (s) 22.5 22.5 22.5 22.5 22.5 22.5 22.5 22.5Total Split (s) 95.0 95.0 95.0 95.0 25.0 25.0 25.0 25.0Total Split (%) 79.2% 79.2% 79.2% 79.2% 20.8% 20.8% 20.8% 20.8%Maximum Green (s) 90.5 90.5 90.5 90.5 20.5 20.5 20.5 20.5Yellow Time (s) 3.5 3.5 3.5 3.5 3.5 3.5 3.5 3.5All-Red Time (s) 1.0 1.0 1.0 1.0 1.0 1.0 1.0 1.0Lost Time Adjust (s) 0.0 0.0 0.0 0.0 0.0 0.0 0.0 0.0Total Lost Time (s) 4.5 4.5 4.5 4.5 4.5 4.5 4.5 4.5Lead/LagLead-Lag Optimize?Vehicle Extension (s) 3.0 3.0 3.0 3.0 3.0 3.0 3.0 3.0Recall Mode C-Max C-Max C-Max C-Max Max Max Max MaxWalk Time (s) 7.0 7.0 7.0 7.0 7.0 7.0 7.0 7.0Flash Dont Walk (s) 11.0 11.0 11.0 11.0 11.0 11.0 11.0 11.0Pedestrian Calls (#/hr) 0 0 0 0 0 0 0 0Act Effct Green (s) 90.5 90.5 90.5 90.5 20.5 20.5 20.5 20.5Actuated g/C Ratio 0.75 0.75 0.75 0.75 0.17 0.17 0.17 0.17v/c Ratio 0.03 0.38 0.24 0.51 0.03 0.14 0.07 0.14Control Delay 4.2 5.5 3.8 2.7 40.0 15.0 42.8 25.9Queue Delay 0.0 0.0 0.0 0.0 0.0 0.0 0.0 0.0Total Delay 4.2 5.5 3.8 2.7 40.0 15.0 42.8 25.9LOS A A A A D B D CApproach Delay 5.5 2.7 18.5 30.4Approach LOS A A B CQueue Length 50th (m) 0.4 37.1 1.7 14.2 1.3 0.6 3.2 4.2Queue Length 95th (m) 1.5 45.5 7.1 37.1 m5.3 m4.8 9.6 14.6Internal Link Dist (m) 129.4 339.2 382.8 65.2Turn Bay Length (m) 120.0 120.0 70.0 70.0Base Capacity (vph) 231 2699 365 2699 234 311 234 315Starvation Cap Reductn 0 0 0 0 0 0 0 0Spillback Cap Reductn 0 0 0 0 0 0 0 0Storage Cap Reductn 0 0 0 0 0 0 0 0Reduced v/c Ratio 0.03 0.38 0.24 0.51 0.03 0.14 0.07 0.14
Intersection SummaryArea Type: OtherCycle Length: 120Actuated Cycle Length: 120Offset: 25 (21%), Referenced to phase 2:EBTL and 6:WBTL, Start of GreenNatural Cycle: 55Control Type: Actuated-CoordinatedMaximum v/c Ratio: 0.51Intersection Signal Delay: 4.8 Intersection LOS: AIntersection Capacity Utilization 58.0% ICU Level of Service BAnalysis Period (min) 15m Volume for 95th percentile queue is metered by upstream signal.

Lanes, Volumes, Timings 2025 AM Total Future Conditions - Upgrades3: Proudfoot Trail & William Halton Parkway Graydon Banning
Graydon Banning 7/28/2015 2025 AM Total Future Conditions - Upgrades Synchro 9 ReportMC Page 11
Splits and Phases: 3: Proudfoot Trail & William Halton Parkway

HCM Signalized Intersection Capacity Analysis 2025 AM Total Future Conditions - Upgrades3: Proudfoot Trail & William Halton Parkway Graydon Banning
Graydon Banning 7/28/2015 2025 AM Total Future Conditions - Upgrades Synchro 9 ReportMC Page 12
Movement EBL EBT EBR WBL WBT WBR NBL NBT NBR SBL SBT SBRLane ConfigurationsTraffic Volume (vph) 6 933 3 82 1265 4 6 6 33 15 19 21Future Volume (vph) 6 933 3 82 1265 4 6 6 33 15 19 21Ideal Flow (vphpl) 1900 1900 1900 1900 1900 1900 1900 1900 1900 1900 1900 1900Total Lost time (s) 4.5 4.5 4.5 4.5 4.5 4.5 4.5 4.5Lane Util. Factor 1.00 0.95 1.00 0.95 1.00 1.00 1.00 1.00Frt 1.00 1.00 1.00 1.00 1.00 0.87 1.00 0.92Flt Protected 0.95 1.00 0.95 1.00 0.95 1.00 0.95 1.00Satd. Flow (prot) 1789 3577 1789 3577 1789 1647 1789 1736Flt Permitted 0.16 1.00 0.26 1.00 0.73 1.00 0.73 1.00Satd. Flow (perm) 306 3577 484 3577 1372 1647 1373 1736Peak-hour factor, PHF 0.92 0.92 0.92 0.92 0.92 0.92 0.92 0.92 0.92 0.92 0.92 0.92Adj. Flow (vph) 7 1014 3 89 1375 4 7 7 36 16 21 23RTOR Reduction (vph) 0 0 0 0 0 0 0 30 0 0 19 0Lane Group Flow (vph) 7 1017 0 89 1379 0 7 13 0 16 25 0Turn Type Perm NA Perm NA Perm NA Perm NAProtected Phases 2 6 8 4Permitted Phases 2 6 8 4Actuated Green, G (s) 90.5 90.5 90.5 90.5 20.5 20.5 20.5 20.5Effective Green, g (s) 90.5 90.5 90.5 90.5 20.5 20.5 20.5 20.5Actuated g/C Ratio 0.75 0.75 0.75 0.75 0.17 0.17 0.17 0.17Clearance Time (s) 4.5 4.5 4.5 4.5 4.5 4.5 4.5 4.5Vehicle Extension (s) 3.0 3.0 3.0 3.0 3.0 3.0 3.0 3.0Lane Grp Cap (vph) 230 2697 365 2697 234 281 234 296v/s Ratio Prot 0.28 c0.39 0.01 c0.01v/s Ratio Perm 0.02 0.18 0.01 0.01v/c Ratio 0.03 0.38 0.24 0.51 0.03 0.05 0.07 0.08Uniform Delay, d1 3.7 5.1 4.4 5.9 41.5 41.6 41.7 41.9Progression Factor 1.00 1.00 0.50 0.35 0.95 0.84 1.00 1.00Incremental Delay, d2 0.2 0.4 1.4 0.6 0.2 0.3 0.6 0.6Delay (s) 4.0 5.5 3.6 2.6 39.7 35.4 42.3 42.4Level of Service A A A A D D D DApproach Delay (s) 5.5 2.7 36.0 42.4Approach LOS A A D D
Intersection SummaryHCM 2000 Control Delay 5.3 HCM 2000 Level of Service AHCM 2000 Volume to Capacity ratio 0.43Actuated Cycle Length (s) 120.0 Sum of lost time (s) 9.0Intersection Capacity Utilization 58.0% ICU Level of Service BAnalysis Period (min) 15c Critical Lane Group

Lanes, Volumes, Timings 2025 AM Total Future Conditions - Upgrades4: New Access & William Halton Parkway Graydon Banning
Graydon Banning 7/28/2015 2025 AM Total Future Conditions - Upgrades Synchro 9 ReportMC Page 13
Lane Group EBL EBT EBR WBL WBT WBR NBL NBT NBR SBL SBT SBRLane ConfigurationsTraffic Volume (vph) 36 942 3 6 1204 6 11 0 22 24 0 137Future Volume (vph) 36 942 3 6 1204 6 11 0 22 24 0 137Ideal Flow (vphpl) 1900 1900 1900 1900 1900 1900 1900 1900 1900 1900 1900 1900Storage Length (m) 120.0 0.0 120.0 0.0 70.0 0.0 70.0 0.0Storage Lanes 1 0 1 0 1 0 1 0Taper Length (m) 70.0 70.0 70.0 70.0Lane Util. Factor 1.00 0.95 0.95 1.00 0.95 0.95 1.00 1.00 1.00 1.00 1.00 1.00Frt 0.999 0.850 0.850Flt Protected 0.950 0.950 0.950 0.950Satd. Flow (prot) 1789 3579 0 1789 3575 0 1789 1601 0 1789 1601 0Flt Permitted 0.103 0.189 0.636 0.742Satd. Flow (perm) 194 3579 0 356 3575 0 1198 1601 0 1398 1601 0Right Turn on Red Yes Yes Yes YesSatd. Flow (RTOR) 1 1 150 84Link Speed (k/h) 60 60 48 48Link Distance (m) 363.2 219.4 79.0 79.4Travel Time (s) 21.8 13.2 5.9 6.0Peak Hour Factor 0.92 0.92 0.92 0.92 0.92 0.92 0.92 0.92 0.92 0.92 0.92 0.92Adj. Flow (vph) 39 1024 3 7 1309 7 12 0 24 26 0 149Shared Lane Traffic (%)Lane Group Flow (vph) 39 1027 0 7 1316 0 12 24 0 26 149 0Enter Blocked Intersection No No No No No No No No No No No NoLane Alignment Left Left Right Left Left Right Left Left Right Left Left RightMedian Width(m) 3.7 3.7 3.7 3.7Link Offset(m) 0.0 0.0 0.0 0.0Crosswalk Width(m) 1.6 1.6 1.6 1.6Two way Left Turn LaneHeadway Factor 0.99 0.99 0.99 0.99 0.99 0.99 0.99 0.99 0.99 0.99 0.99 0.99Turning Speed (k/h) 24 14 24 14 24 14 24 14Number of Detectors 1 2 1 2 1 2 1 2Detector Template Left Thru Left Thru Left Thru Left ThruLeading Detector (m) 6.1 30.5 6.1 30.5 6.1 30.5 6.1 30.5Trailing Detector (m) 0.0 0.0 0.0 0.0 0.0 0.0 0.0 0.0Detector 1 Position(m) 0.0 0.0 0.0 0.0 0.0 0.0 0.0 0.0Detector 1 Size(m) 6.1 1.8 6.1 1.8 6.1 1.8 6.1 1.8Detector 1 Type Cl+Ex Cl+Ex Cl+Ex Cl+Ex Cl+Ex Cl+Ex Cl+Ex Cl+ExDetector 1 ChannelDetector 1 Extend (s) 0.0 0.0 0.0 0.0 0.0 0.0 0.0 0.0Detector 1 Queue (s) 0.0 0.0 0.0 0.0 0.0 0.0 0.0 0.0Detector 1 Delay (s) 0.0 0.0 0.0 0.0 0.0 0.0 0.0 0.0Detector 2 Position(m) 28.7 28.7 28.7 28.7Detector 2 Size(m) 1.8 1.8 1.8 1.8Detector 2 Type Cl+Ex Cl+Ex Cl+Ex Cl+ExDetector 2 ChannelDetector 2 Extend (s) 0.0 0.0 0.0 0.0Turn Type Perm NA Perm NA Perm NA Perm NAProtected Phases 4 8 2 6Permitted Phases 4 8 2 6

Lanes, Volumes, Timings 2025 AM Total Future Conditions - Upgrades4: New Access & William Halton Parkway Graydon Banning
Graydon Banning 7/28/2015 2025 AM Total Future Conditions - Upgrades Synchro 9 ReportMC Page 14
Lane Group EBL EBT EBR WBL WBT WBR NBL NBT NBR SBL SBT SBRDetector Phase 4 4 8 8 2 2 6 6Switch PhaseMinimum Initial (s) 5.0 5.0 5.0 5.0 5.0 5.0 5.0 5.0Minimum Split (s) 22.5 22.5 22.5 22.5 22.5 22.5 22.5 22.5Total Split (s) 86.0 86.0 86.0 86.0 34.0 34.0 34.0 34.0Total Split (%) 71.7% 71.7% 71.7% 71.7% 28.3% 28.3% 28.3% 28.3%Maximum Green (s) 81.5 81.5 81.5 81.5 29.5 29.5 29.5 29.5Yellow Time (s) 3.5 3.5 3.5 3.5 3.5 3.5 3.5 3.5All-Red Time (s) 1.0 1.0 1.0 1.0 1.0 1.0 1.0 1.0Lost Time Adjust (s) 0.0 0.0 0.0 0.0 0.0 0.0 0.0 0.0Total Lost Time (s) 4.5 4.5 4.5 4.5 4.5 4.5 4.5 4.5Lead/LagLead-Lag Optimize?Vehicle Extension (s) 3.0 3.0 3.0 3.0 3.0 3.0 3.0 3.0Recall Mode None None None None C-Max C-Max C-Max C-MaxWalk Time (s) 7.0 7.0 7.0 7.0 7.0 7.0 7.0 7.0Flash Dont Walk (s) 11.0 11.0 11.0 11.0 11.0 11.0 11.0 11.0Pedestrian Calls (#/hr) 0 0 0 0 0 0 0 0Act Effct Green (s) 62.4 62.4 62.4 62.4 48.6 48.6 48.6 48.6Actuated g/C Ratio 0.52 0.52 0.52 0.52 0.40 0.40 0.40 0.40v/c Ratio 0.39 0.55 0.04 0.71 0.02 0.03 0.05 0.21Control Delay 22.7 15.5 11.3 23.7 26.6 0.1 26.4 13.4Queue Delay 0.0 0.0 0.0 0.0 0.0 0.0 0.0 0.0Total Delay 22.7 15.5 11.3 23.7 26.6 0.1 26.4 13.4LOS C B B C C A C BApproach Delay 15.8 23.6 8.9 15.3Approach LOS B C A BQueue Length 50th (m) 3.4 48.0 0.8 118.8 1.7 0.0 3.7 9.4Queue Length 95th (m) 5.7 41.4 2.5 111.2 6.6 0.0 11.1 27.2Internal Link Dist (m) 339.2 195.4 55.0 55.4Turn Bay Length (m) 120.0 120.0 70.0 70.0Base Capacity (vph) 131 2431 241 2428 485 738 566 698Starvation Cap Reductn 0 0 0 0 0 0 0 0Spillback Cap Reductn 0 0 0 0 0 0 0 0Storage Cap Reductn 0 0 0 0 0 0 0 0Reduced v/c Ratio 0.30 0.42 0.03 0.54 0.02 0.03 0.05 0.21
Intersection SummaryArea Type: OtherCycle Length: 120Actuated Cycle Length: 120Offset: 1 (1%), Referenced to phase 2:NBTL and 6:SBTL, Start of GreenNatural Cycle: 60Control Type: Actuated-CoordinatedMaximum v/c Ratio: 0.71Intersection Signal Delay: 19.6 Intersection LOS: BIntersection Capacity Utilization 50.1% ICU Level of Service AAnalysis Period (min) 15

Lanes, Volumes, Timings 2025 AM Total Future Conditions - Upgrades4: New Access & William Halton Parkway Graydon Banning
Graydon Banning 7/28/2015 2025 AM Total Future Conditions - Upgrades Synchro 9 ReportMC Page 15
Splits and Phases: 4: New Access & William Halton Parkway
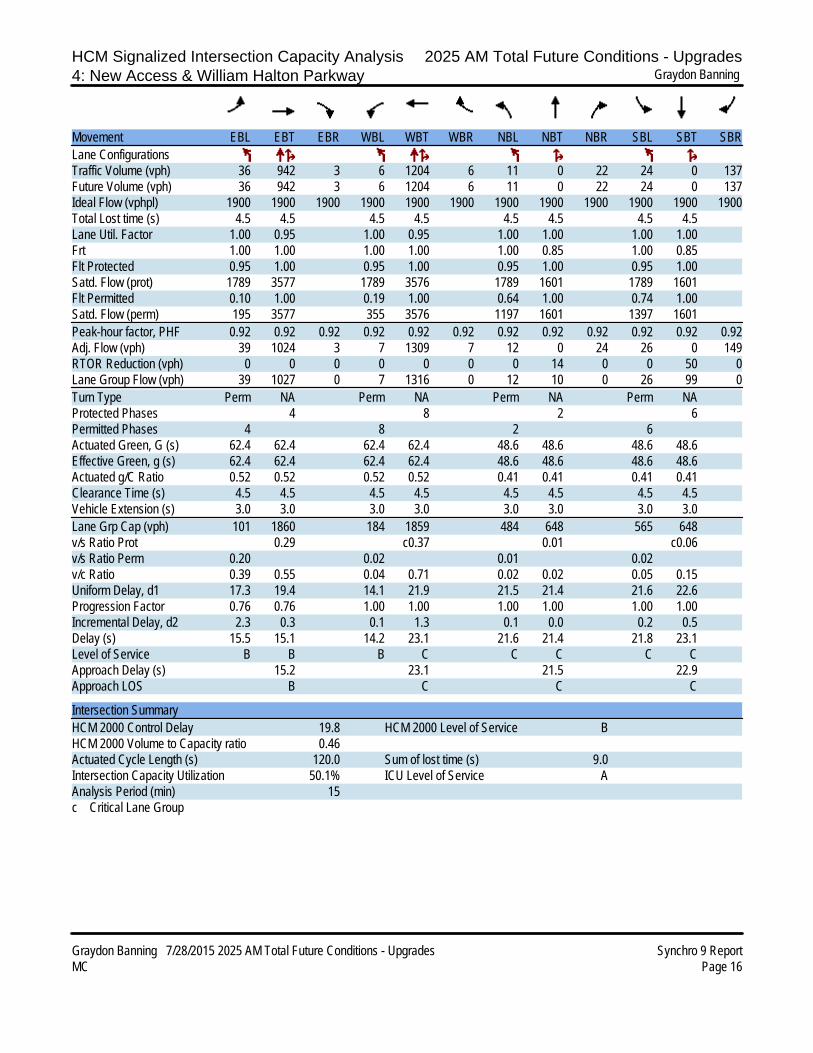
HCM Signalized Intersection Capacity Analysis 2025 AM Total Future Conditions - Upgrades4: New Access & William Halton Parkway Graydon Banning
Graydon Banning 7/28/2015 2025 AM Total Future Conditions - Upgrades Synchro 9 ReportMC Page 16
Movement EBL EBT EBR WBL WBT WBR NBL NBT NBR SBL SBT SBRLane ConfigurationsTraffic Volume (vph) 36 942 3 6 1204 6 11 0 22 24 0 137Future Volume (vph) 36 942 3 6 1204 6 11 0 22 24 0 137Ideal Flow (vphpl) 1900 1900 1900 1900 1900 1900 1900 1900 1900 1900 1900 1900Total Lost time (s) 4.5 4.5 4.5 4.5 4.5 4.5 4.5 4.5Lane Util. Factor 1.00 0.95 1.00 0.95 1.00 1.00 1.00 1.00Frt 1.00 1.00 1.00 1.00 1.00 0.85 1.00 0.85Flt Protected 0.95 1.00 0.95 1.00 0.95 1.00 0.95 1.00Satd. Flow (prot) 1789 3577 1789 3576 1789 1601 1789 1601Flt Permitted 0.10 1.00 0.19 1.00 0.64 1.00 0.74 1.00Satd. Flow (perm) 195 3577 355 3576 1197 1601 1397 1601Peak-hour factor, PHF 0.92 0.92 0.92 0.92 0.92 0.92 0.92 0.92 0.92 0.92 0.92 0.92Adj. Flow (vph) 39 1024 3 7 1309 7 12 0 24 26 0 149RTOR Reduction (vph) 0 0 0 0 0 0 0 14 0 0 50 0Lane Group Flow (vph) 39 1027 0 7 1316 0 12 10 0 26 99 0Turn Type Perm NA Perm NA Perm NA Perm NAProtected Phases 4 8 2 6Permitted Phases 4 8 2 6Actuated Green, G (s) 62.4 62.4 62.4 62.4 48.6 48.6 48.6 48.6Effective Green, g (s) 62.4 62.4 62.4 62.4 48.6 48.6 48.6 48.6Actuated g/C Ratio 0.52 0.52 0.52 0.52 0.41 0.41 0.41 0.41Clearance Time (s) 4.5 4.5 4.5 4.5 4.5 4.5 4.5 4.5Vehicle Extension (s) 3.0 3.0 3.0 3.0 3.0 3.0 3.0 3.0Lane Grp Cap (vph) 101 1860 184 1859 484 648 565 648v/s Ratio Prot 0.29 c0.37 0.01 c0.06v/s Ratio Perm 0.20 0.02 0.01 0.02v/c Ratio 0.39 0.55 0.04 0.71 0.02 0.02 0.05 0.15Uniform Delay, d1 17.3 19.4 14.1 21.9 21.5 21.4 21.6 22.6Progression Factor 0.76 0.76 1.00 1.00 1.00 1.00 1.00 1.00Incremental Delay, d2 2.3 0.3 0.1 1.3 0.1 0.0 0.2 0.5Delay (s) 15.5 15.1 14.2 23.1 21.6 21.4 21.8 23.1Level of Service B B B C C C C CApproach Delay (s) 15.2 23.1 21.5 22.9Approach LOS B C C C
Intersection SummaryHCM 2000 Control Delay 19.8 HCM 2000 Level of Service BHCM 2000 Volume to Capacity ratio 0.46Actuated Cycle Length (s) 120.0 Sum of lost time (s) 9.0Intersection Capacity Utilization 50.1% ICU Level of Service AAnalysis Period (min) 15c Critical Lane Group