great portland estates plc unol ckni g potential
TRANSCRIPT

Unlocking potential
Great Portland Estates plc Annual Report 2013
3. Financials68 Group income statement68 Group statement of comprehensive income69 Group balance sheet70 Group statement of cash flows71 Group statement of changes in equity72 Notes forming part of the Group financial statements93 Independent auditor’s report94 Company balance sheet – UK GAAP95 Notes forming part of the Company financial statements97 Company independent auditor’s report
4. Governance100 Corporate governance113 Directors’ remuneration report128 Report of the directors132 Directors’ responsibilities statement133 Analysis of ordinary shareholdings134 Notice of meeting
5. Other information136 Glossary137 Five year record138 Financial calendar139 Shareholders’ information
1. Overview1 Who we are2 What we do4 How we deliver shareholder value
95 Wigmore Street, W1 See more on pages 16 and 17
www.gpe.co.uk
What’s in this report
Great Portland Estates Annual Report 2013
2. Annual review24 Chairman’s statement25 Our market28 Valuation30 Investment management32 Development management34 Asset management36 Financial management38 Joint ventures39 Our financial results42 Portfolio statistics43 Our properties46 Board of Directors48 Our people52 Risk management56 Our approach to sustainability
Our focused business model
and the disciplined execution
of our strategic priorities has
again delivered property and
shareholder returns well
ahead of our benchmarks.Martin Scicluna Chairman
“
”

Section 1 Overview
Great Portland Estates is a central London property investment and development company owning over £2.3 billion of real estate.
We have a simple strategy – to generate superior portfolio and shareholder returns from investing in and improving central London real estate. We aim to achieve this through our intense, customer focused approach to managing our properties combined with an effective reading of the property cycle, across a market that we know inside out.
Who we are
Annual Report 2013 Great Portland Estates 1
Margaret St
Mortimer St
Wells S
t
Savile Row
Gloucester Place
Piccadilly
Green Park
Bayswater Road
Wigmore Street
Baker S
treet
New Cavendish St
Great Portland S
treet
Portland Place
Regent St
New
Bond St
Hyde Park
Marylebone Road
Edgware Road
Park Lane
Knightsbridge Grosvenor Place
Oxford Street
Cavendish
Sq
We aim to deliver superior returns by unlocking the often hidden potential in commercial real estate in central London.
What we do
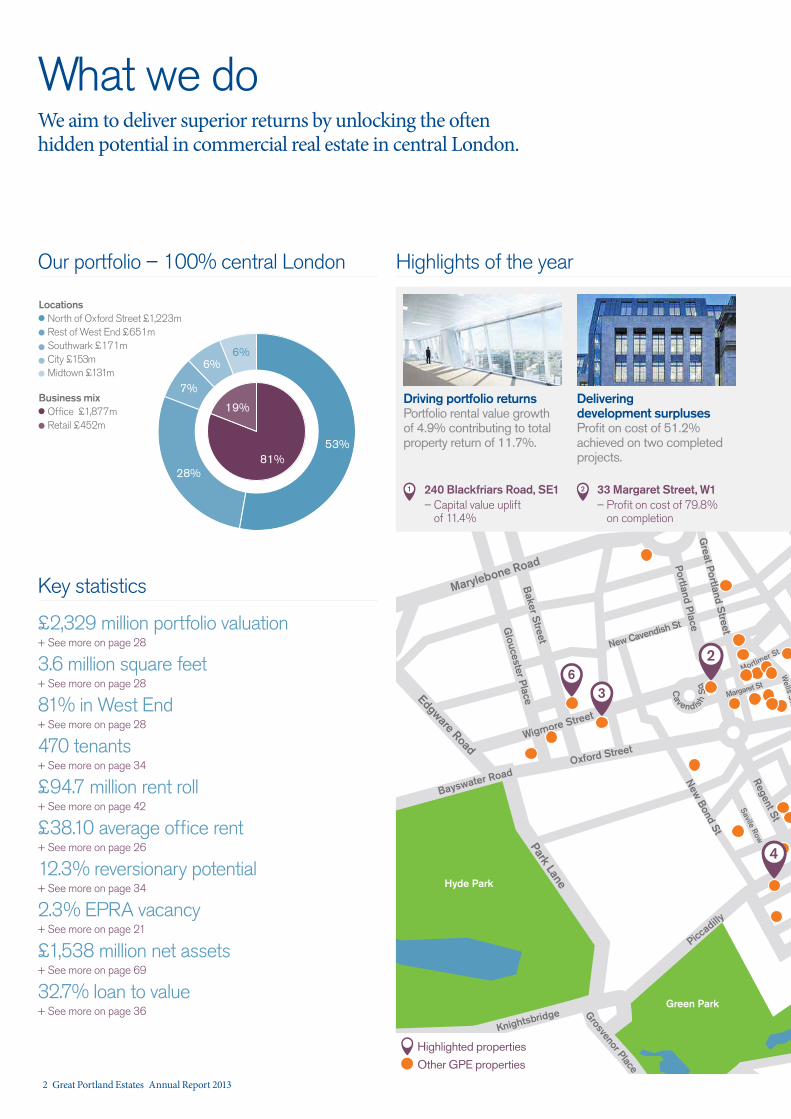
Our portfolio – 100% central London Highlights of the year
Key statistics
£2,329 million portfolio valuation+ See more on page 28
3.6 million square feet+ See more on page 28
81% in West End+ See more on page 28
470 tenants+ See more on page 34
£94.7 million rent roll+ See more on page 42
£38.10 average office rent+ See more on page 26
12.3% reversionary potential+ See more on page 34
2.3% EPRA vacancy + See more on page 21
£1,538 million net assets+ See more on page 69
32.7% loan to value+ See more on page 36
Driving portfolio returnsPortfolio rental value growth of 4.9% contributing to total property return of 11.7%.
Delivering development surplusesProfit on cost of 51.2% achieved on two completed projects.
1 2240 Blackfriars Road, SE1– Capital value uplift
of 11.4%
33 Margaret Street, W1– Profit on cost of 79.8%
on completion
53%
28%
6%
7%
6%
19%
81%
North of Oxford Street £1,223mLocations
Rest of West End £651mSouthwark £171m
Midtown £131m
Office £1,877mBusiness mix
Retail £452m
City £153m
2
3
4
6
Other GPE properties
Highlighted properties
2 Great Portland Estates Annual Report 2013

Gr Q
ueen
St
St
Clerkenwell Road
Charing C
ross Road
Tottenham Court Road
Pall Mall
Strand Upper Thames Street
Vict
oria
Em
bank
men
t
High Holborn London Wall
St James’s Park
Cannon Street
Westminster Bridge
Blackfriars B
ridge
Waterloo
Bloomsbury
Waterloo Bridge
Southw
ark Bridge
London Bridge
Chancery Lane
Farringdon Road
Kingsway
Bis
hops
gate
Cornhill
Blackfriars R
oad
Waterloo Road
Goodge St
Russell
Square
Aldwych Fleet Street
Cheapside
Fetter Lane
Oxford Street
Strong letting activity£13.4 million of lettings, with 63% of the income already secured on our committed developments.
Capitalising on acquisition opportunities£271 million of acquisitions, 4.7% net initial yield, all below replacement cost.
Profitable recycling activityDisposals of £184 million at 4.0% surplus to book value.
Replenishing financial firepower for acquisitions£138 million equity raising in November 2012. More than 80% invested within four months.
3 4 5 695 Wigmore Street, W1– 85% pre-let
Jermyn Street Estate, SW1– Purchased off-market for
£120 million
100 Bishopsgate, EC2– Sale of 37.5% interest
Orchard Court, W1– Purchased for £37 million
1
5
Annual Report 2013 Great Portland Estates 3
OverviewAnnual review
FinancialsGovernance
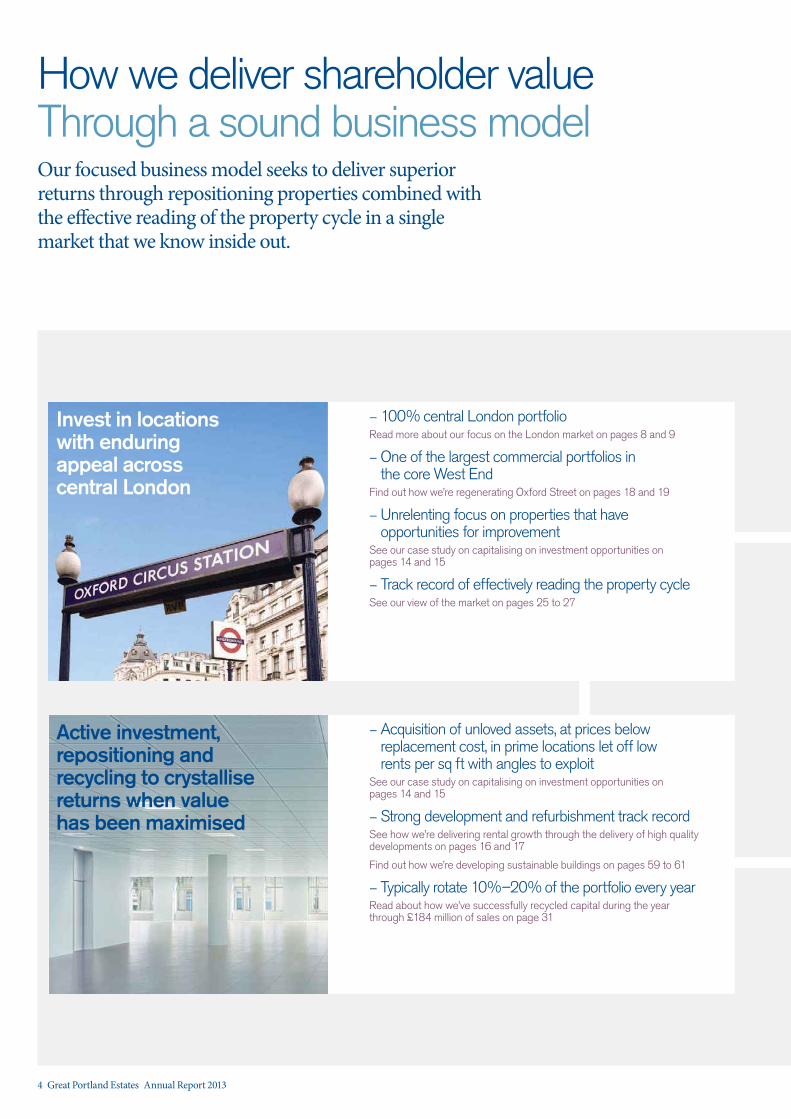
How we deliver shareholder valueThrough a sound business modelOur focused business model seeks to deliver superior returns through repositioning properties combined with the effective reading of the property cycle in a single market that we know inside out.
– Acquisition of unloved assets, at prices below replacement cost, in prime locations let off low rents per sq ft with angles to exploit
See our case study on capitalising on investment opportunities on pages 14 and 15
– Strong development and refurbishment track record See how we’re delivering rental growth through the delivery of high quality developments on pages 16 and 17
Find out how we’re developing sustainable buildings on pages 59 to 61
– Typically rotate 10%–20% of the portfolio every year Read about how we’ve successfully recycled capital during the year through £184 million of sales on page 31
Active investment, repositioning and recycling to crystallise returns when value has been maximised
– 100% central London portfolio Read more about our focus on the London market on pages 8 and 9
– One of the largest commercial portfolios in the core West End
Find out how we’re regenerating Oxford Street on pages 18 and 19
– Unrelenting focus on properties that have opportunities for improvement
See our case study on capitalising on investment opportunities on pages 14 and 15
– Track record of effectively reading the property cycleSee our view of the market on pages 25 to 27
Invest in locations with enduring appeal across central London
4 Great Portland Estates Annual Report 2013

– Flex development and investment activity See our approach to investment and development management on pages 30 to 33
– Analytical, risk-adjusted IRR driven decision makingSee how we have performed against our KPIs and operational measures on pages 20 and 21
– Consistently strong balance sheet and conservative financial leverage
See our financial results on pages 39 to 41
– Low-cost diversified debt book Read about our financial management on pages 36 and 37
– Use of joint ventures Read about our joint ventures on page 38
– Tax efficient structureRead about our REIT status on page 77
– Intense customer focused approach See our approach to asset management on pages 34 and 35
– Proactive management to drive rents and maximise value Read our case study on consistently driving rental growth on pages 16 and 17
– High tenant retention, low vacancy rates, diverse tenant base
Find out how we’ve kept our EPRA vacancy rate low at 2.3% on pages 34 and 35
– Specialist in-house asset management, development and investment teams
See how we’re delivering superior returns as one integrated team on pages 12 and 13
– Entrepreneurial and pragmatic culture helps us to attract, motivate and retain our talented employees
Read more about our people and culture on pages 48 to 51
Flex the mix of our portfolio and financing activities to take advantage of the property cycle
Work closely with our tenants to understand their needs
Annual Report 2013 Great Portland Estates 5
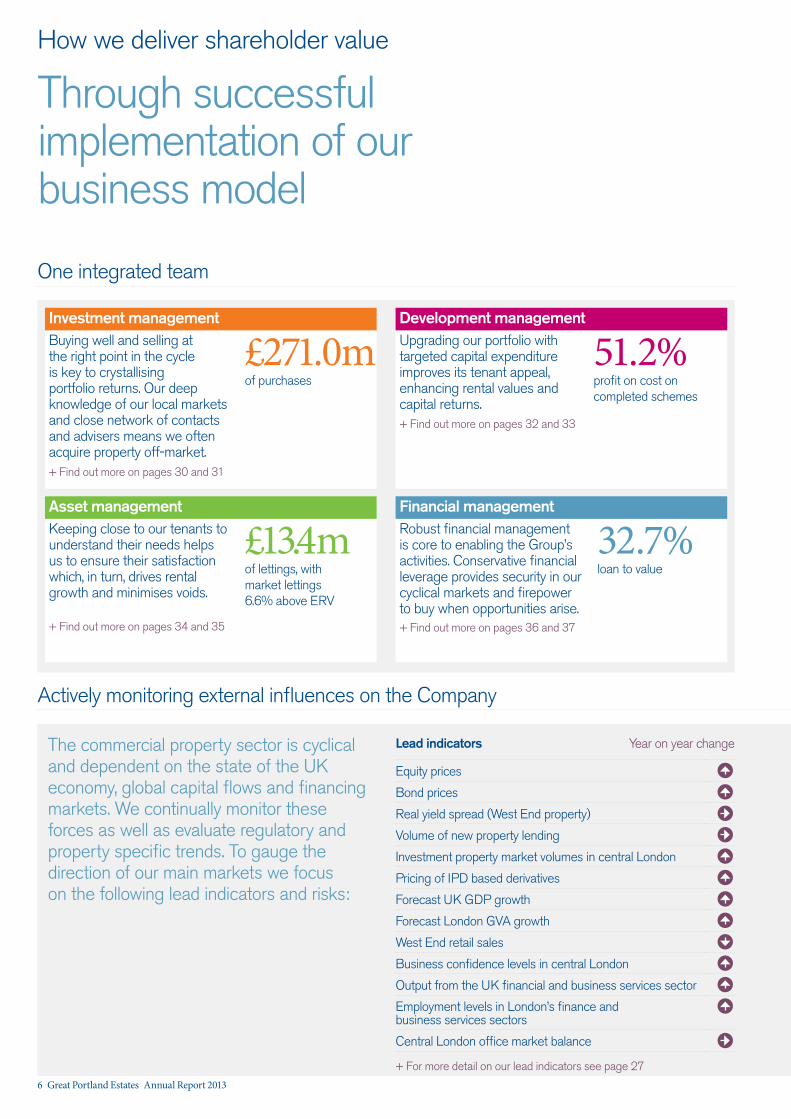
The commercial property sector is cyclical and dependent on the state of the UK economy, global capital flows and financing markets. We continually monitor these forces as well as evaluate regulatory and property specific trends. To gauge the direction of our main markets we focus on the following lead indicators and risks:
How we deliver shareholder value
Through successful implementation of our business model
One integrated team
Investment managementBuying well and selling at the right point in the cycle is key to crystallising portfolio returns. Our deep knowledge of our local markets and close network of contacts and advisers means we often acquire property off-market.+ Find out more on pages 30 and 31
£271.0mof purchases
Development managementUpgrading our portfolio with targeted capital expenditure improves its tenant appeal, enhancing rental values and capital returns.+ Find out more on pages 32 and 33
51.2%profit on cost on completed schemes
Asset managementKeeping close to our tenants to understand their needs helps us to ensure their satisfaction which, in turn, drives rental growth and minimises voids.
+ Find out more on pages 34 and 35
£13.4mof lettings, with market lettings 6.6% above ERV
Financial managementRobust financial management is core to enabling the Group’s activities. Conservative financial leverage provides security in our cyclical markets and firepower to buy when opportunities arise.+ Find out more on pages 36 and 37
32.7%loan to value
Actively monitoring external influences on the Company
Lead indicators Year on year change
Equity prices
Bond prices
Real yield spread (West End property)
Volume of new property lending
Investment property market volumes in central London
Pricing of IPD based derivatives
Forecast UK GDP growth
Forecast London GVA growth
West End retail sales
Business confidence levels in central London
Output from the UK financial and business services sector
Employment levels in London’s finance and business services sectors
Central London office market balance
+ For more detail on our lead indicators see page 27
6 Great Portland Estates Annual Report 2013
Group KPI 2013 summary
Summary of key risks Year on year change
Market
Investment management
Asset management
Development management
Financial
People
Regulatory
+ For more detail on our key risks and how we manage them see pages 52 to 55
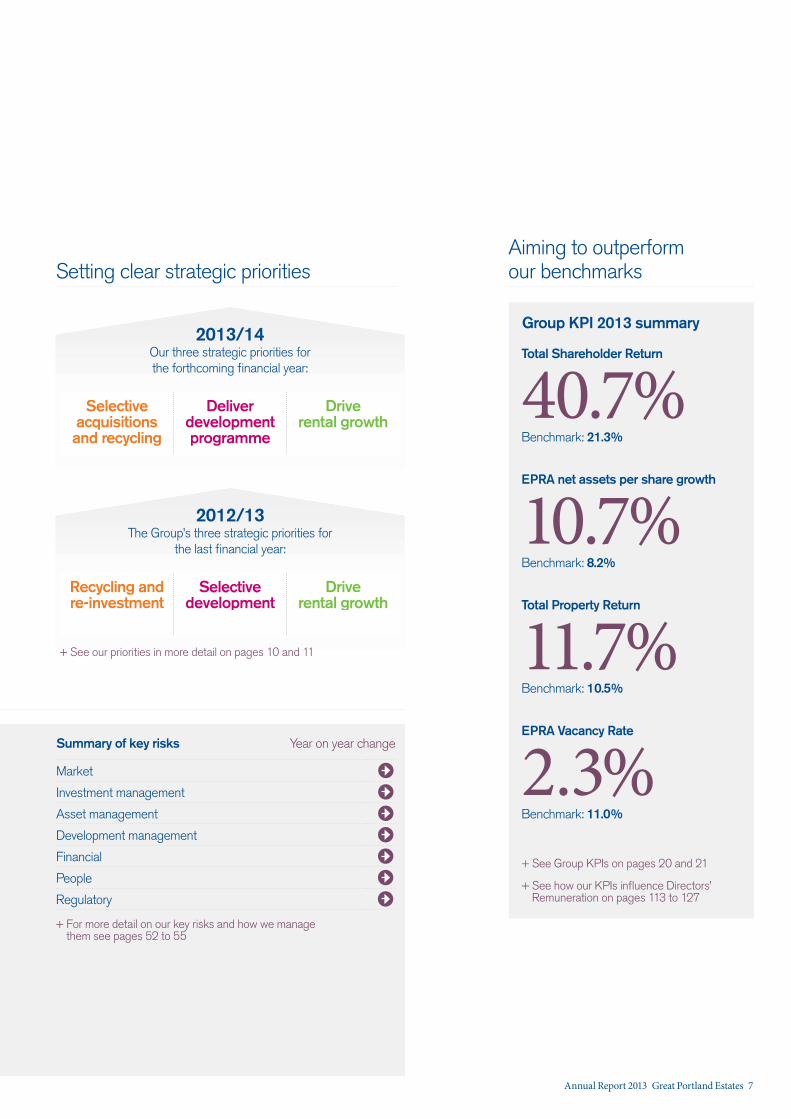
Setting clear strategic prioritiesAiming to outperform our benchmarks
Total Shareholder Return
40.7%Benchmark: 21.3%
EPRA net assets per share growth
10.7%Benchmark: 8.2%
Total Property Return
11.7%Benchmark: 10.5%
EPRA Vacancy Rate
2.3%Benchmark: 11.0%
+ See Group KPIs on pages 20 and 21
+ See how our KPIs influence Directors’ Remuneration on pages 113 to 127
Selective acquisitions and recycling
Deliver development programme
Drive rental growth
Selective acquisitions and recycling
Deliver developmentprogramme
Drive rental growth
2013/14Our three strategic priorities for the forthcoming financial year:
Recycling and re-investment
Selective development
Drive rental growth
Recycling andre-investment
Selective development
Drive rental growth
2012/13The Group’s three strategic priorities for
the last financial year:
+ See our priorities in more detail on pages 10 and 11
Annual Report 2013 Great Portland Estates 7

Through focusing on one market that we know inside out
How we deliver shareholder value
The London investment market is as competitive as ever... Investment activity in central London increased to £14 billion in 2012, the highest since 2007 and 56% higher than 2011. More than 68% of purchases were by international investors and much of this capital continues to focus on large lot size, long-let ‘trophy’ properties.
+ See Our market section on pages 25 to 27
...but competition is limited for GPE style purchases Our focus is typically liquid lot size, complex properties let off low rents in attractive locations, where investor demand is less deep and debt funding scarce for non-institutional buyers. During the year, we identified an increasing supply of these acquisition opportunities and raised £138 million through a share placing in November 2012 to exploit this market opportunity. Since then, more than 80% of the proceeds have been invested.
+ See our case study on pages 14 and 15
8 Great Portland Estates Annual Report 2013

The supply of new space remains constrained... Available space is in short supply, particularly in the West End with the Grade A vacancy rate at historic lows. The outlook for development completions remains muted, in large part reflecting the scarcity of development capital available to operators without both strong balance sheets and proven track records. Our access to relatively low cost and diversified capital provides a significant competitive advantage.
+ See our case study on pages 16 and 17 and Our market section on pages 25 to 27
...and occupational demand for well specified space in good locations is healthy Levels of active demand increased in 2012, particularly from TMT firms and professional occupiers seeking to access London’s high calibre labour pool and global connectivity. Delivering efficient and sustainable properties in attractive locations that meet occupiers’ changing needs has under-pinned our continued pre-letting successes.
+ See our case study on pages 60 and 61 and Our approach to sustainability on pages 56 to 65
The West End is the historic heartland of London...We own one of the largest commercial property portfolios in the core West End, a market which for generations has uniquely combined commercial, retail, residential, cultural and tourist attractions. This mix attracts businesses from all over the world and from a diverse spectrum of industries to locate here.
+ See Our tenant mix on page 34
...and transport infrastructure investment is driving further regeneration This market already has good provision of a wide choice of public transport. However, the current investment into substantially enhanced transport infrastructure, including upgrades to several tube stations and the delivery of Crossrail, is already engendering significant regeneration and raising rental values, particularly around the east end of Oxford Street.
+ See our case study on pages 18 and 19
Annual Report 2013 Great Portland Estates 9
How we deliver shareholder value
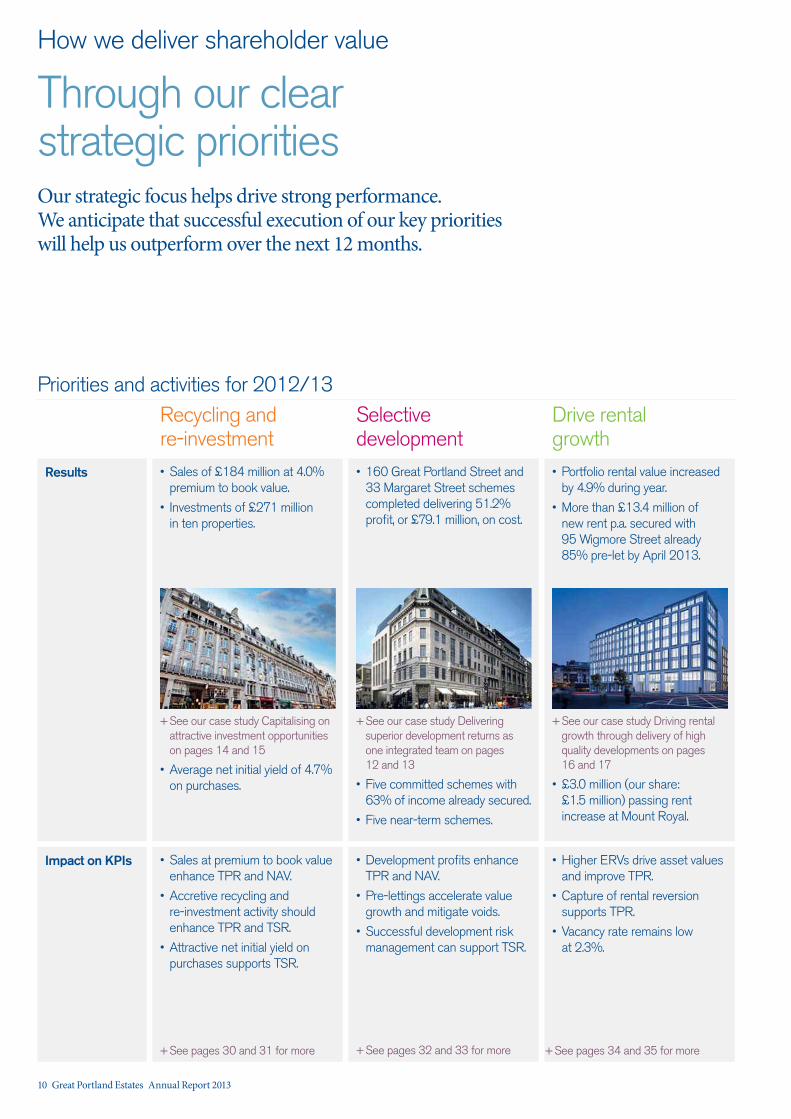
Through our clear strategic prioritiesOur strategic focus helps drive strong performance. We anticipate that successful execution of our key priorities will help us outperform over the next 12 months.
Priorities and activities for 2012/13
Sales of £184 million at 4.0% premium to book value.
Investments of £271 million in ten properties.
Results
Sales at premium to book value enhance TPR and NAV.
Accretive recycling and re-investment activity should enhance TPR and TSR.
Attractive net initial yield on purchases supports TSR.
Impact on KPIs Development profits enhance TPR and NAV.
Pre-lettings accelerate value growth and mitigate voids.
Successful development risk management can support TSR.
160 Great Portland Street and 33 Margaret Street schemes completed delivering 51.2% profit, or £79.1 million, on cost.
Higher ERVs drive asset values and improve TPR.
Capture of rental reversion supports TPR.
Vacancy rate remains low at 2.3%.
Recycling and re-investment
Selective development
Drive rental growth
+See our case study Capitalising on attractive investment opportunities on pages 14 and 15
Average net initial yield of 4.7% on purchases.
+See our case study Delivering superior development returns as one integrated team on pages 12 and 13
Five committed schemes with 63% of income already secured.
Five near-term schemes.
+See our case study Driving rental growth through delivery of high quality developments on pages 16 and 17
£3.0 million (our share: £1.5 million) passing rent increase at Mount Royal.
Portfolio rental value increased by 4.9% during year.
More than £13.4 million of new rent p.a. secured with 95 Wigmore Street already 85% pre-let by April 2013.
+See pages 30 and 31 for more +See pages 32 and 33 for more +See pages 34 and 35 for more
10 Great Portland Estates Annual Report 2013

Priorities for 2013/14
Invest balance of equity placing proceeds (£26 million).
Maintain robust acquisition criteria.
Crystallise profits through recycling.
Key initiatives Complete on-site committed schemes.
Commence construction at 12/14 New Fetter Lane.
Secure planning permissions for Rathbone Place and 73/89 Oxford Street.
Lease remaining space at committed developments.
Crystallise rental reversion, including at Wells & More and 200 Gray’s Inn Road.
Well judged acquisitions enhance TPR.
Investment ahead of expectations at equity placing should support TSR.
Sales above book value enhance TPR and NAV.
NAV and TPR enhanced by profitable development projects.
Occupancy rate boosted when schemes leased.
Improves TPR through income uplifts.
NAV growth underpinned by higher ERVs.
Occupancy rate rises through effective leasing.
Impact on KPIs
Lack of available properties meeting acquisition criteria.
Pricing of potential acquisitions becomes too high.
Insufficient market liquidity.
Market declines are amplified by development schemes.
Poor project management.
Contractor/supplier failure.
Tenants needs not met by poorly conceived building design.
Occupational market falters.
Wrong rental levels sought for local market conditions.
Poor marketing of GPE space.
Weak tenant retention.
Execution risks
Selective acquisitions and recycling
Deliver development programme
Drive rental growth
How our priorities changedDuring 2012/13, we identified an increasing number of interesting acquisition opportunities and accordingly flexed our recycling and re-investment priority to increase our purchasing activity. In November 2012, we raised £138 million to fund new purchases and more than 80% has already been invested in three transactions within four months.
+See pages 53 to 55 for more
+See our case study Regenerating Oxford Street on pages 18 and 19
Focus on tenant relationships to support rental retention.
Annual Report 2013 Great Portland Estates 11
How we deliver shareholder value
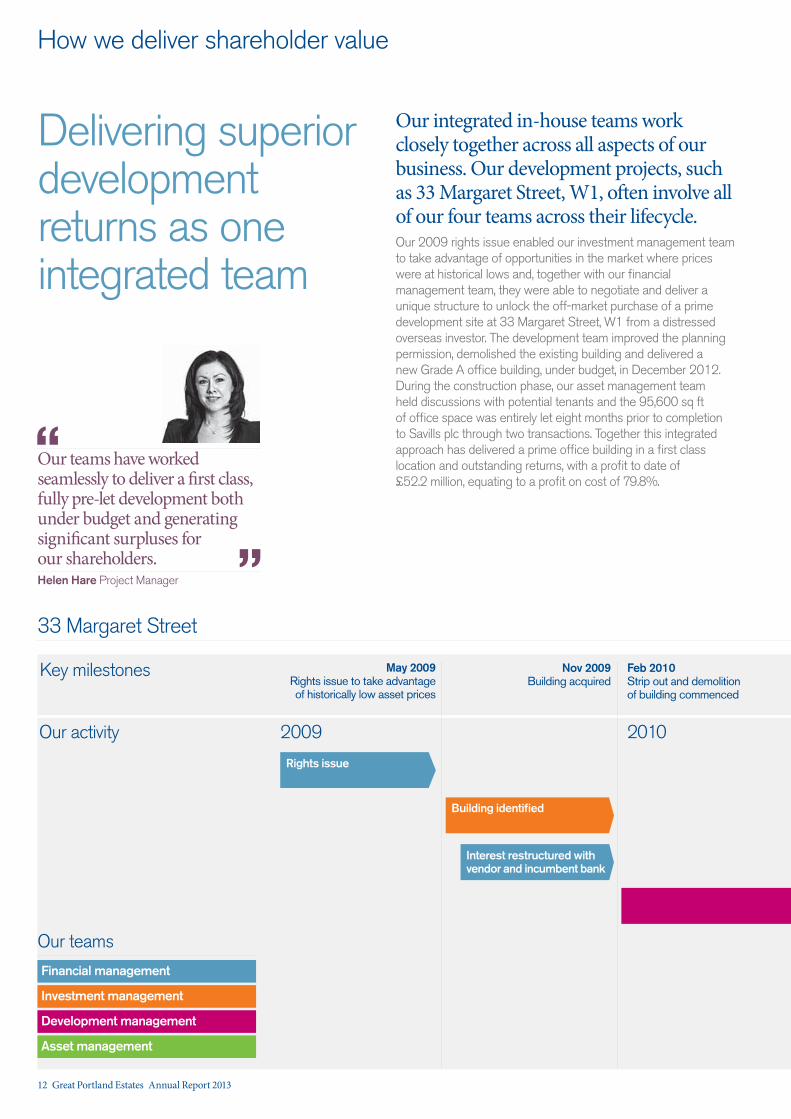
Our integrated in-house teams work closely together across all aspects of our business. Our development projects, such as 33 Margaret Street, W1, often involve all of our four teams across their lifecycle. Our 2009 rights issue enabled our investment management team to take advantage of opportunities in the market where prices were at historical lows and, together with our financial management team, they were able to negotiate and deliver a unique structure to unlock the off-market purchase of a prime development site at 33 Margaret Street, W1 from a distressed overseas investor. The development team improved the planning permission, demolished the existing building and delivered a new Grade A office building, under budget, in December 2012. During the construction phase, our asset management team held discussions with potential tenants and the 95,600 sq ft of office space was entirely let eight months prior to completion to Savills plc through two transactions. Together this integrated approach has delivered a prime office building in a first class location and outstanding returns, with a profit to date of £52.2 million, equating to a profit on cost of 79.8%.
Delivering superior development returns as one integrated team
33 Margaret Street
2009 2010Our activity
Key milestones
Rights issue
May 2009 Rights issue to take advantage of historically low asset prices
Nov 2009 Building acquired
Feb 2010 Strip out and demolition of building commenced
Interest restructured with vendor and incumbent bank
Building identified
Investment management
Development management
Asset management
Financial management
Our teams
Our teams have worked seamlessly to deliver a first class, fully pre-let development both under budget and generating significant surpluses for our shareholders.Helen Hare Project Manager
“
”
12 Great Portland Estates Annual Report 2013
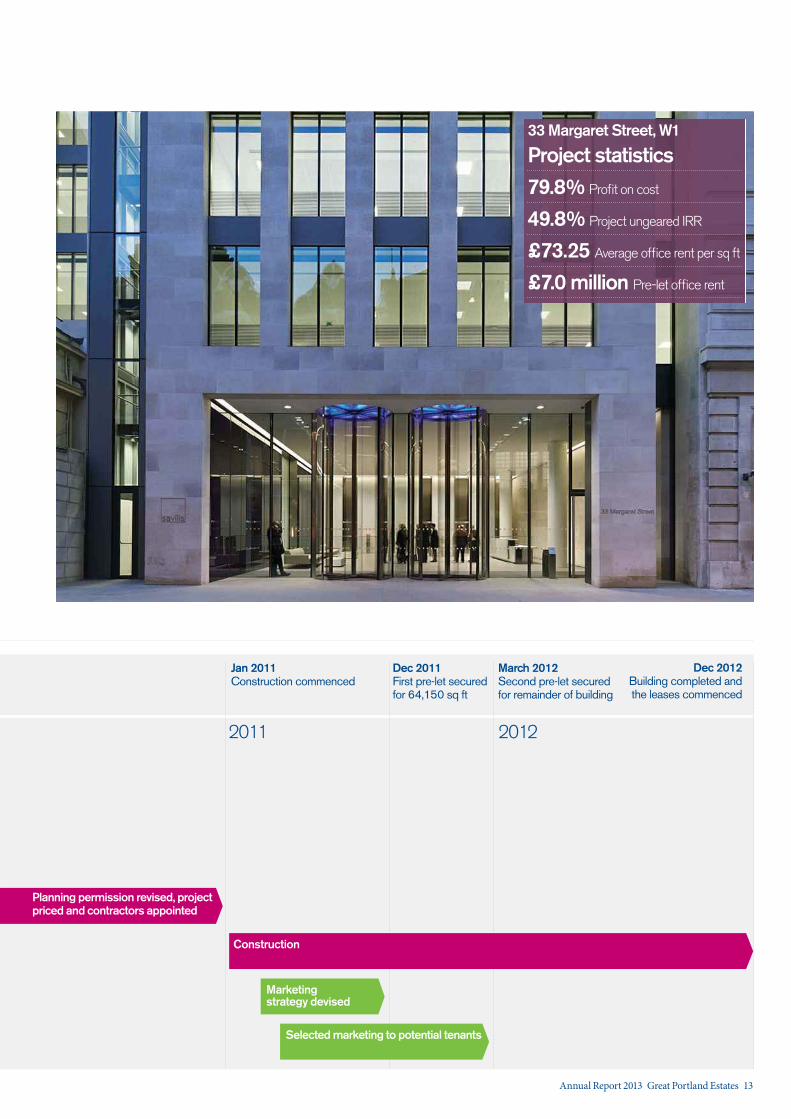
2011 2012
Jan 2011 Construction commenced
Dec 2011 First pre-let secured for 64,150 sq ft
Dec 2012 Building completed and the leases commenced
March 2012 Second pre-let secured for remainder of building
Planning permission revised, project priced and contractors appointed
Marketing strategy devised
Construction
Selected marketing to potential tenants
33 Margaret Street, W1
Project statistics79.8% Profit on cost
49.8% Project ungeared IRR
£73.25 Average office rent per sq ft
£7.0 million Pre-let office rent
Annual Report 2013 Great Portland Estates 13
How we deliver shareholder value
Buying well at the right point in the cycle is core to our business model.
Between our £166 million rights issue in May 2009 and September 2012, we invested more than £644 million in new acquisitions (including our two off-market transactions on Jermyn Street, SW1 in June and July 2012) delivering an estimated ungeared IRR of nearly 18%. Since the summer, we identified an increasing number of interesting acquisition opportunities across central London and subsequently raised £138 million in a share placing in November 2012 to take advantage of this. More than 80% of these placing proceeds have already been committed in three new acquisitions, all meeting our clearly defined acquisition criteria.
Maintaining our disciplined approach.
Our accretive acquisition activity is underpinned by focusing on opportunities with the following characteristics:
— Unloved properties in attractive locations
— Let off low rents
— Short to medium-term income
— Pricing beneath replacement cost
— Typically off-market
— Angles to exploit including major refurbishment/development
— Liquid lot size
Raising equity in November 2012 to take advantage of an increase in attractive opportunities – more than 80% already invested
Our teams
Financial management
Investment management
Capitalising on attractive investment opportunities
Accretive acquisition activity has been a key contributor to our continued outperformance. Ben Chambers Investment Director
“”
14 Great Portland Estates Annual Report 2013
May 11 Nov 11 May 12 Feb 13
1,000
250
500
750
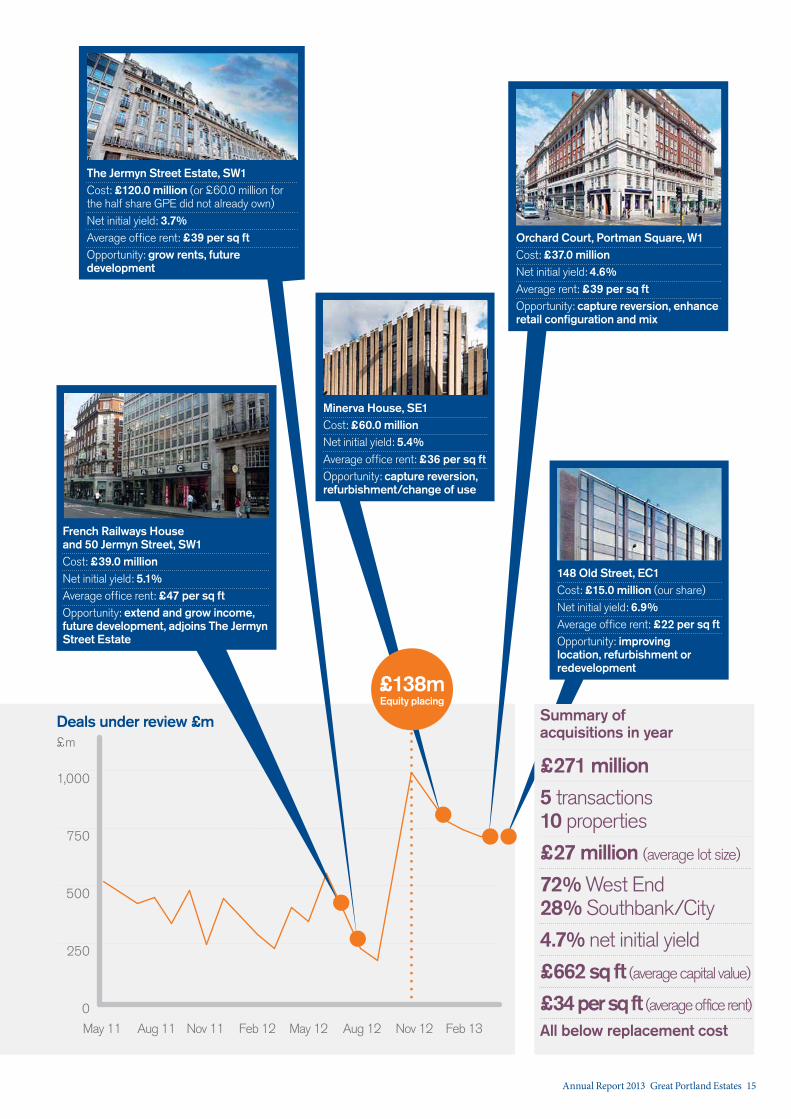
Deals under review £m
0
£m
Aug 11 Feb 12 Aug 12 Nov 12
Minerva House, SE1Cost: £60.0 millionNet initial yield: 5.4%Average office rent: £36 per sq ftOpportunity: capture reversion, refurbishment/change of use
Orchard Court, Portman Square, W1Cost: £37.0 millionNet initial yield: 4.6%Average rent: £39 per sq ftOpportunity: capture reversion, enhance retail configuration and mix
£138m Equity placing
The Jermyn Street Estate, SW1 Cost: £120.0 million (or £60.0 million for the half share GPE did not already own)Net initial yield: 3.7%Average office rent: £39 per sq ftOpportunity: grow rents, future development
French Railways House and 50 Jermyn Street, SW1Cost: £39.0 millionNet initial yield: 5.1%Average office rent: £47 per sq ftOpportunity: extend and grow income, future development, adjoins The Jermyn Street Estate
148 Old Street, EC1Cost: £15.0 million (our share)Net initial yield: 6.9%Average office rent: £22 per sq ftOpportunity: improving location, refurbishment or redevelopment
Summary of acquisitions in year
£271 million 5 transactions 10 properties
£27 million (average lot size)
72% West End 28% Southbank/City
4.7% net initial yield
£662 sq ft (average capital value)
£34 per sq ft (average office rent)
All below replacement cost
Annual Report 2013 Great Portland Estates 15
How we deliver shareholder value
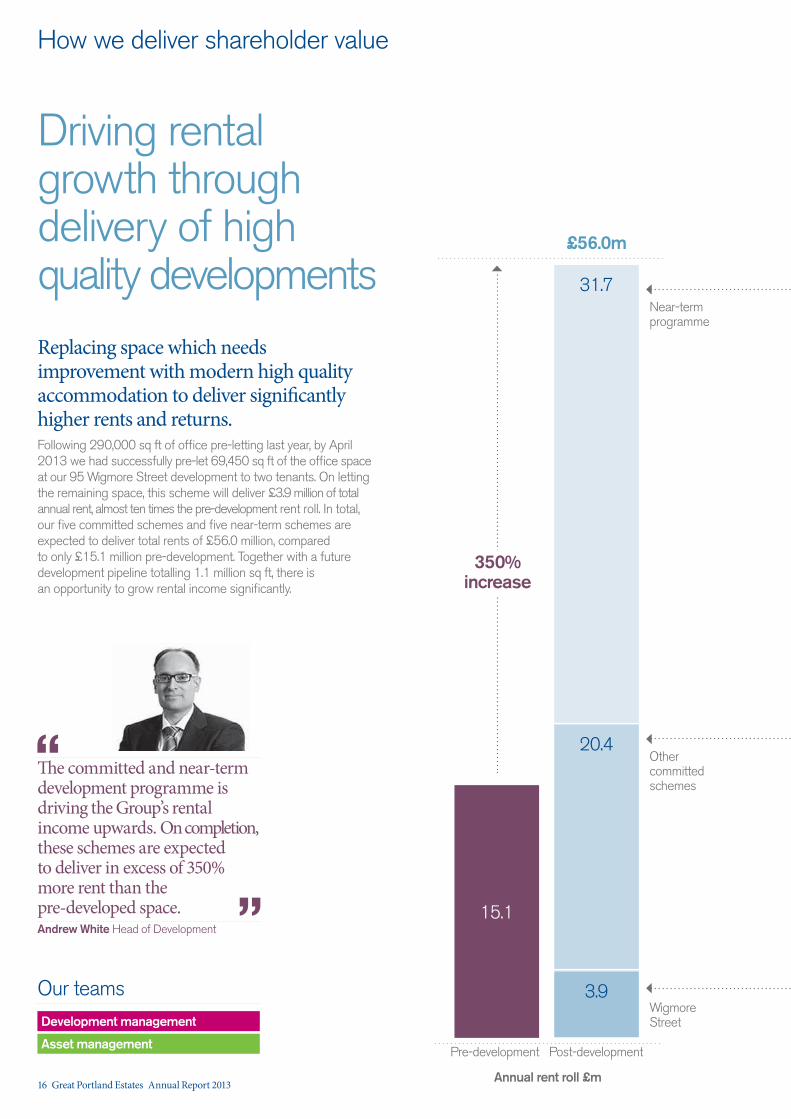
Driving rental growth through delivery of high quality developmentsReplacing space which needs improvement with modern high quality accommodation to deliver significantly higher rents and returns.Following 290,000 sq ft of office pre-letting last year, by April 2013 we had successfully pre-let 69,450 sq ft of the office space at our 95 Wigmore Street development to two tenants. On letting the remaining space, this scheme will deliver £3.9 million of total annual rent, almost ten times the pre-development rent roll. In total, our five committed schemes and five near-term schemes are expected to deliver total rents of £56.0 million, compared to only £15.1 million pre-development. Together with a future development pipeline totalling 1.1 million sq ft, there is an opportunity to grow rental income significantly.
15.1
31.7
20.4
3.9
£56.0m
350% increase
Pre-development Post-development
Wigmore Street
Our teams Development management
Asset management
The committed and near-term development programme is driving the Group’s rental income upwards. On completion, these schemes are expected to deliver in excess of 350% more rent than the pre-developed space. Andrew White Head of Development
“
Annual rent roll £m
Other committed schemes
Near-term programme
”
16 Great Portland Estates Annual Report 2013
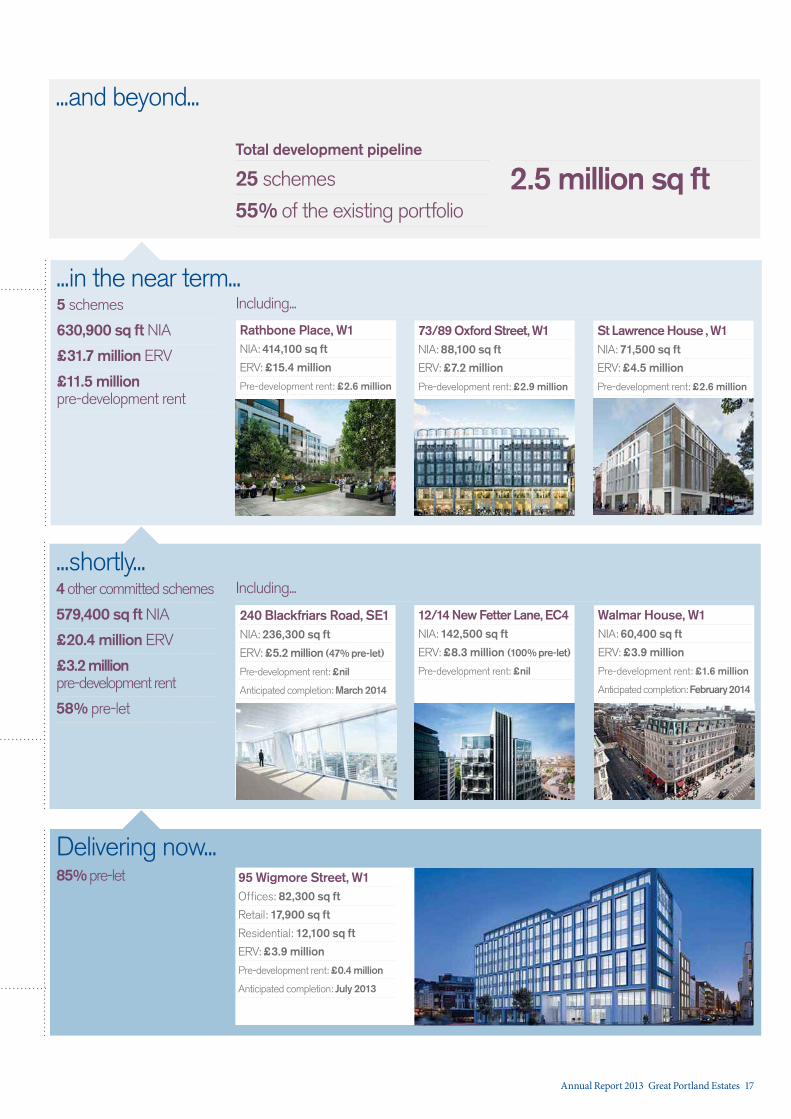
Delivering now...95 Wigmore Street, W1Offices: 82,300 sq ft
Retail: 17,900 sq ft
Residential: 12,100 sq ft
ERV: £3.9 million
Pre-development rent: £0.4 million
Anticipated completion: July 2013
Total development pipeline
25 schemes
55% of the existing portfolio
...and beyond...
2.5 million sq ft
4 other committed schemes
579,400 sq ft NIA
£20.4 million ERV
£3.2 million pre-development rent
58% pre-let
...shortly...
12/14 New Fetter Lane, EC4NIA: 142,500 sq ft
ERV: £8.3 million (100% pre-let)
Pre-development rent: £nil
240 Blackfriars Road, SE1NIA: 236,300 sq ft
ERV: £5.2 million (47% pre-let)
Pre-development rent: £nil
Anticipated completion: March 2014
Walmar House, W1NIA: 60,400 sq ft
ERV: £3.9 million
Pre-development rent: £1.6 million
Anticipated completion: February 2014
Rathbone Place, W1NIA: 414,100 sq ft
ERV: £15.4 million
Pre-development rent: £2.6 million
85% pre-let
St Lawrence House , W1NIA: 71,500 sq ft
ERV: £4.5 million
Pre-development rent: £2.6 million
73/89 Oxford Street, W1NIA: 88,100 sq ft
ERV: £7.2 million
Pre-development rent: £2.9 million
...in the near term...5 schemes
630,900 sq ft NIA
£31.7 million ERV
£11.5 million pre-development rent
Including...
Including...
Annual Report 2013 Great Portland Estates 17
Portm
an Street
How we deliver shareholder value
Marble Arch
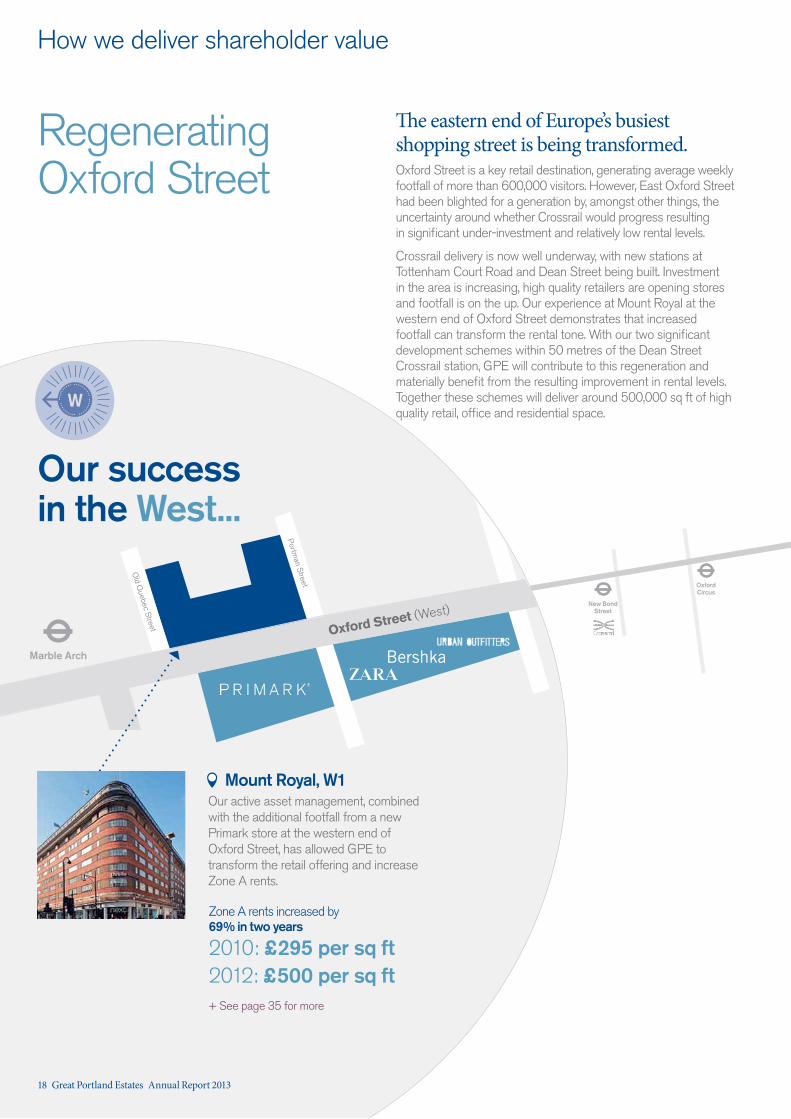
Regenerating Oxford Street
The eastern end of Europe’s busiest shopping street is being transformed.Oxford Street is a key retail destination, generating average weekly footfall of more than 600,000 visitors. However, East Oxford Street had been blighted for a generation by, amongst other things, the uncertainty around whether Crossrail would progress resulting in significant under-investment and relatively low rental levels.
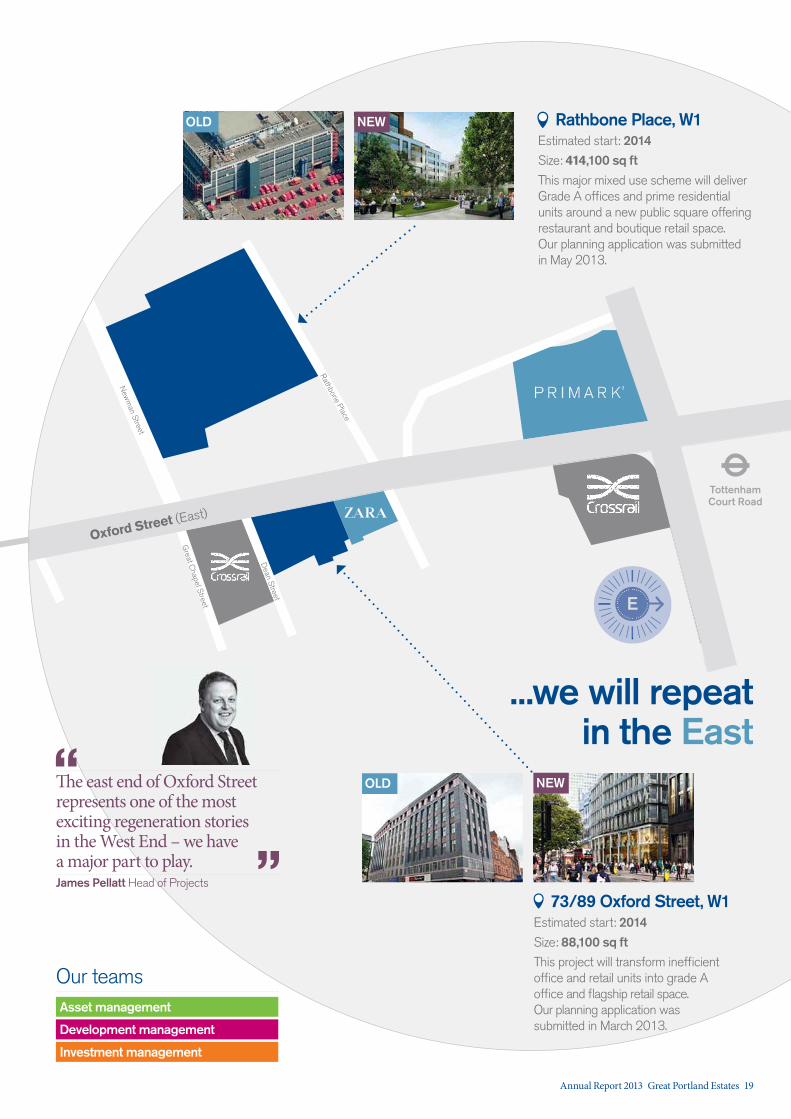
Crossrail delivery is now well underway, with new stations at Tottenham Court Road and Dean Street being built. Investment in the area is increasing, high quality retailers are opening stores and footfall is on the up. Our experience at Mount Royal at the western end of Oxford Street demonstrates that increased footfall can transform the rental tone. With our two significant development schemes within 50 metres of the Dean Street Crossrail station, GPE will contribute to this regeneration and materially benefit from the resulting improvement in rental levels. Together these schemes will deliver around 500,000 sq ft of high quality retail, office and residential space.
Oxford Street (West)
Old Q
uebec Street
Our success in the West...
Oxford Circus
New Bond Street
W
Mount Royal, W1Our active asset management, combined with the additional footfall from a new Primark store at the western end of Oxford Street, has allowed GPE to transform the retail offering and increase Zone A rents.
Zone A rents increased by 69% in two years
2010: £295 per sq ft 2012: £500 per sq ft+ See page 35 for more
18 Great Portland Estates Annual Report 2013
Rathbone Place
Tottenham Court Road
Rathbone Place, W1Estimated start: 2014Size: 414,100 sq ftThis major mixed use scheme will deliver Grade A offices and prime residential units around a new public square offering restaurant and boutique retail space. Our planning application was submitted in May 2013.
Oxford Street (East)
73/89 Oxford Street, W1Estimated start: 2014Size: 88,100 sq ftThis project will transform inefficient office and retail units into grade A office and flagship retail space. Our planning application was submitted in March 2013.
New
man Street
Great C
hapel Street
Dean Street EE
...we will repeat in the East
OLD NEW
NEW
Asset management
Our teams
Investment management
Development management
The east end of Oxford Street represents one of the most exciting regeneration stories in the West End – we have a major part to play. James Pellatt Head of Projects
“ OLD
”
Annual Report 2013 Great Portland Estates 19
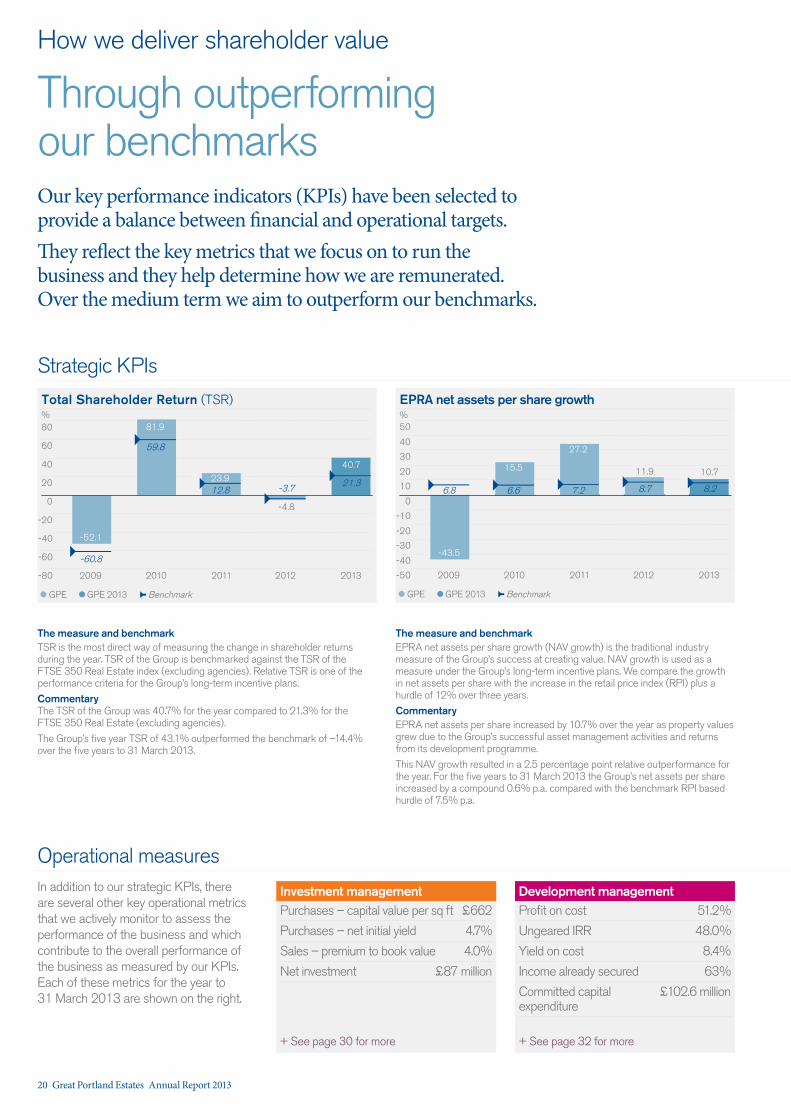
The measure and benchmarkTSR is the most direct way of measuring the change in shareholder returns during the year. TSR of the Group is benchmarked against the TSR of the FTSE 350 Real Estate index (excluding agencies). Relative TSR is one of the performance criteria for the Group’s long-term incentive plans.
CommentaryThe TSR of the Group was 40.7% for the year compared to 21.3% for the FTSE 350 Real Estate (excluding agencies).
The Group’s five year TSR of 43.1% outperformed the benchmark of –14.4% over the five years to 31 March 2013.
The measure and benchmarkEPRA net assets per share growth (NAV growth) is the traditional industry measure of the Group’s success at creating value. NAV growth is used as a measure under the Group’s long-term incentive plans. We compare the growth in net assets per share with the increase in the retail price index (RPI) plus a hurdle of 12% over three years.
CommentaryEPRA net assets per share increased by 10.7% over the year as property values grew due to the Group’s successful asset management activities and returns from its development programme.
This NAV growth resulted in a 2.5 percentage point relative outperformance for the year. For the five years to 31 March 2013 the Group’s net assets per share increased by a compound 0.6% p.a. compared with the benchmark RPI based hurdle of 7.5% p.a.
Strategic KPIs
Purchases – capital value per sq ft £662
Purchases – net initial yield 4.7%
Sales – premium to book value 4.0%
Net investment £87 million
In addition to our strategic KPIs, there are several other key operational metrics that we actively monitor to assess the performance of the business and which contribute to the overall performance of the business as measured by our KPIs. Each of these metrics for the year to 31 March 2013 are shown on the right.
Operational measures
Profit on cost 51.2%
Ungeared IRR 48.0%
Yield on cost 8.4%
Income already secured 63%
Committed capital £102.6 million expenditure
Investment management Development management
Through outperforming our benchmarks
How we deliver shareholder value
Our key performance indicators (KPIs) have been selected to provide a balance between financial and operational targets.
They reflect the key metrics that we focus on to run the business and they help determine how we are remunerated. Over the medium term we aim to outperform our benchmarks.
2009 2010 2011 2012 2013
50
40
30
20
10
0
-10
-20
-30
-40
-50
6.8
15.5
8.7 8.27.2
GPE GPE 2013 Benchmark
EPRA net assets per share growth
-43.5
6.6
10.711.9
27.2
%
2009 2010 2011 2012 2013
80
60
40
20
0
-20
-40
-80
-60.8
81.9
-4.8
21.312.8
GPE GPE 2013 Benchmark
Total Shareholder Return (TSR)
-52.1
59.8
40.7
-3.723.9
-60
%
+ See page 30 for more + See page 32 for more
20 Great Portland Estates Annual Report 2013
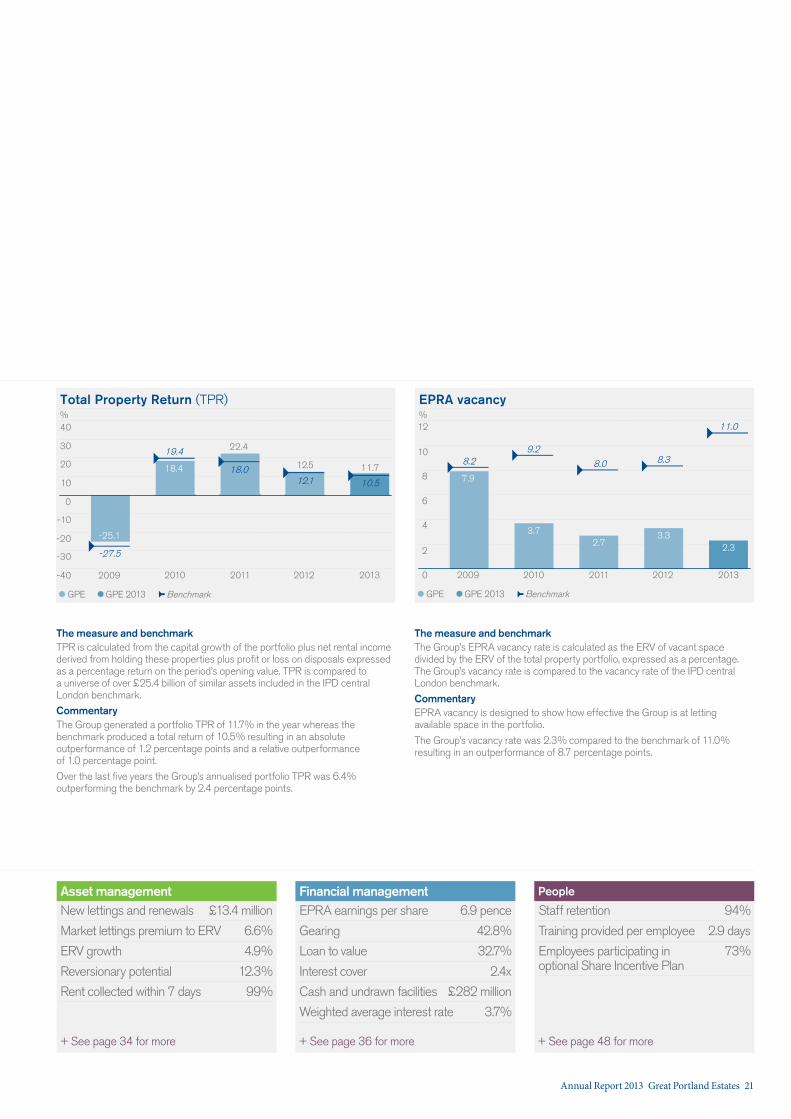
The measure and benchmarkTPR is calculated from the capital growth of the portfolio plus net rental income derived from holding these properties plus profit or loss on disposals expressed as a percentage return on the period’s opening value. TPR is compared to a universe of over £25.4 billion of similar assets included in the IPD central London benchmark.
CommentaryThe Group generated a portfolio TPR of 11.7% in the year whereas the benchmark produced a total return of 10.5% resulting in an absolute outperformance of 1.2 percentage points and a relative outperformance of 1.0 percentage point.
Over the last five years the Group’s annualised portfolio TPR was 6.4% outperforming the benchmark by 2.4 percentage points.
The measure and benchmarkThe Group’s EPRA vacancy rate is calculated as the ERV of vacant space divided by the ERV of the total property portfolio, expressed as a percentage. The Group’s vacancy rate is compared to the vacancy rate of the IPD central London benchmark.
CommentaryEPRA vacancy is designed to show how effective the Group is at letting available space in the portfolio.
The Group’s vacancy rate was 2.3% compared to the benchmark of 11.0% resulting in an outperformance of 8.7 percentage points.
EPRA earnings per share 6.9 pence
Gearing 42.8%
Loan to value 32.7%
Interest cover 2.4x
Cash and undrawn facilities £282 million
Weighted average interest rate 3.7%
Staff retention 94%
Training provided per employee 2.9 days
Employees participating in 73% optional Share Incentive Plan
New lettings and renewals £13.4 million
Market lettings premium to ERV 6.6%
ERV growth 4.9%
Reversionary potential 12.3%
Rent collected within 7 days 99%
Asset management Financial management People
2009 2010 2011 2012 2013
12
10
8
6
4
2
0
8.29.2
3.3
11.0
2.7
GPE GPE 2013 Benchmark
EPRA vacancy
7.9
3.7
2.3
8.38.0
%
2009 2010 2011 2012 2013
40
30
0
-20
-30
-40
-27.5
19.4
12.1 10.518.0
GPE GPE 2013 Benchmark
Total Property Return (TPR)
-25.1
18.4 11.712.5
22.4
20
%
10
-10
+ See page 34 for more + See page 36 for more + See page 48 for more
Annual Report 2013 Great Portland Estates 21
Section 2 Annual review
In this section we describe the trends in our marketplace, present our progress across the business and set out our approaches to risk management and sustainability.
24 Chairman’s statement25 Our market28 Valuation30 Investment management32 Development management34 Asset management36 Financial management38 Joint ventures39 Our financial results42 Portfolio statistics43 Our properties46 Board of Directors48 Our people52 Risk management56 Our approach to sustainability
22 Great Portland Estates Annual Report 2013

Annual Report 2013 Great Portland Estates 23
Chairman’s statement
Great Portland Estates has had another year of strong performance, generating property and shareholder returns well ahead of our benchmarks. Our focused business model concentrating exclusively on high quality central London property, combined with effective capital management and the disciplined execution of our strategic priorities, have again delivered healthy valuation surpluses, particularly from our developments.EPRA NAV per share increased by 10.7% over the year and the property portfolio delivered underlying capital growth of 8.0%. The total shareholder return for the year was 40.7% and significantly ahead of our FTSE 350 Real Estate benchmark of 21.3%. Dividends of 8.6 pence per share for the year are up 2.4% on 2012.
Whilst we can expect further turbulence in the UK and Eurozone economies, conditions across central London’s property markets, particularly in the West End, remain favourable. Tenant demand for new space is trending at the long-run average, with some pockets of strong interest from the likes of the TMT sector. The supply of new space remains noticeably lower than trend level. Over the next few years, absent a material economic set back, we expect this balance to move further in landlords’ favour, supporting our expectations for rental growth. In the investment market, London continues to attract a significant flow of investment capital from around the world and its position as a truly global city was enhanced further by the events of this past year, including the Olympic Games.
Despite the strength of the investment market, we have again been successful in unlocking accretive acquisitions, often through off-market deals. Our purchases in the first half of the year totalled £159 million, all in the West End, and having identified a marked increase in interesting investment opportunities,
we raised £138 million through a share placing in November to fund further acquisitions. More than 80% of these placing proceeds have already been committed, bringing our total acquisitions for the year to £271 million, all in attractive locations, with angles to exploit and at entry prices below replacement cost. We have also continued to recycle capital, crystallising gains on mature properties through sales of £184 million at an average surplus to book value of 4%.
The significant development programme that we commenced two and a half years ago has now delivered 299,300 sq ft of high quality space across five completed projects and an aggregate surplus for shareholders of 55% over total costs. The two projects completed this year at 160 Great Portland Street and 33 Margaret Street, both fully pre-let prior to completion, delivered a combined profit of £79.1 million and an average profit on cost of 51.2%. Our 112,300 sq ft scheme at 95 Wigmore Street is due for completion this July and 85% of the income has already been secured. We have four further committed schemes (579,400 sq ft), which are 58% pre-let, and a total pipeline of around 2.5 million sq ft, including our enviable development sites at Rathbone Place and Hanover Square.
Following record levels of leasing last year, our asset management team has again performed strongly, delivering lettings and lease renewals of more than £13.4 million in annual rent, with market lettings at an average of 6.6% above our valuers’ ERV, or 8.7% if pre-lettings are excluded. Our investment portfolio void rate remains encouragingly low at only 2.3% and we continue to see good tenant demand for our well-specified space in excellent locations.
All of these successes have been delivered whilst maintaining a robust balance sheet and a low loan to value ratio at March 2013 of less than 33%. Our debt remains amongst the lowest cost in the sector and we have significant levels of liquidity, with cash and undrawn debt facilities in excess of £280 million and no debt maturities until summer 2015.
To help support our ambitious growth plans, we have selectively recruited to add to our experienced and talented team and we were pleased to welcome Elizabeth Holden to the Board as a Non-Executive Director in September 2012. Phillip Rose retired from the Board in July 2012 after six years of valuable contribution. I am also sad to report that Roger Payton, who acted as independent counsel to the Board in his roles as a Non-Executive Director from 1985 to 2000, and from 1990 as Deputy Chairman, passed away in February this year.
Looking ahead, I am confident that we are well positioned to continue to outperform and generate attractive total returns for shareholders. Our high quality portfolio is rich with potential, our exceptional development programme will continue to drive capital and rental income growth and we have plentiful financial resources to deliver our existing growth plans and exploit new opportunities as we find them.
Martin Scicluna Chairman
24 Great Portland Estates Annual Report 2013
Our market
Conditions in central London’s commercial property markets continue to be attractive with good tenant and investor demand for well specified properties in attractive locations.The backdrop to our markets over the past 12 months has continued to be dominated by the Eurozone debt crisis and the prospects for near-term UK economic growth. Whilst challenges remain, the possibility of a currency union break-up has receded somewhat as central bank policy has provided a significant stimulus to capital markets. Equity markets have reacted strongly as the alleviation of uncertainty has bolstered confidence; however the economic recovery continues to stutter with the UK economy barely growing and growth forecasts remain anaemic.
Against this backdrop, whilst London is not immune from these broader challenges, its economy continues to outperform that of the UK. Since 2007, London’s output has increased, more than a quarter of a million jobs have been created and the average income of its residents has increased. London’s resilience has continued to attract international capital for real estate investment through both the positive outlook for its property markets and its consolidated status as a leading world capital.
Our occupational markets – overviewBusiness activity across London’s diversified economy continues to grow, and whilst tenant demand is running no faster than the long-term average, a lack of speculative development finance is constraining development activity meaning that vacancy levels for Grade A space remain low. Taken together, this reinforces our view that occupational markets will continue to favour landlords delivering good quality office space over the medium term, particularly in the West End.
Across the central London office market as a whole, development completions in the year to 31 December 2012 of 2.5 million sq ft were 48% higher than the prior year, albeit well below the long-term average of 4.3 million sq ft. Focusing on the West End only, completions totalled only 1.0 million sq ft, which, coming after two years of limited supply, has confirmed the period post-Lehman Brothers collapse as one of the lowest on record.
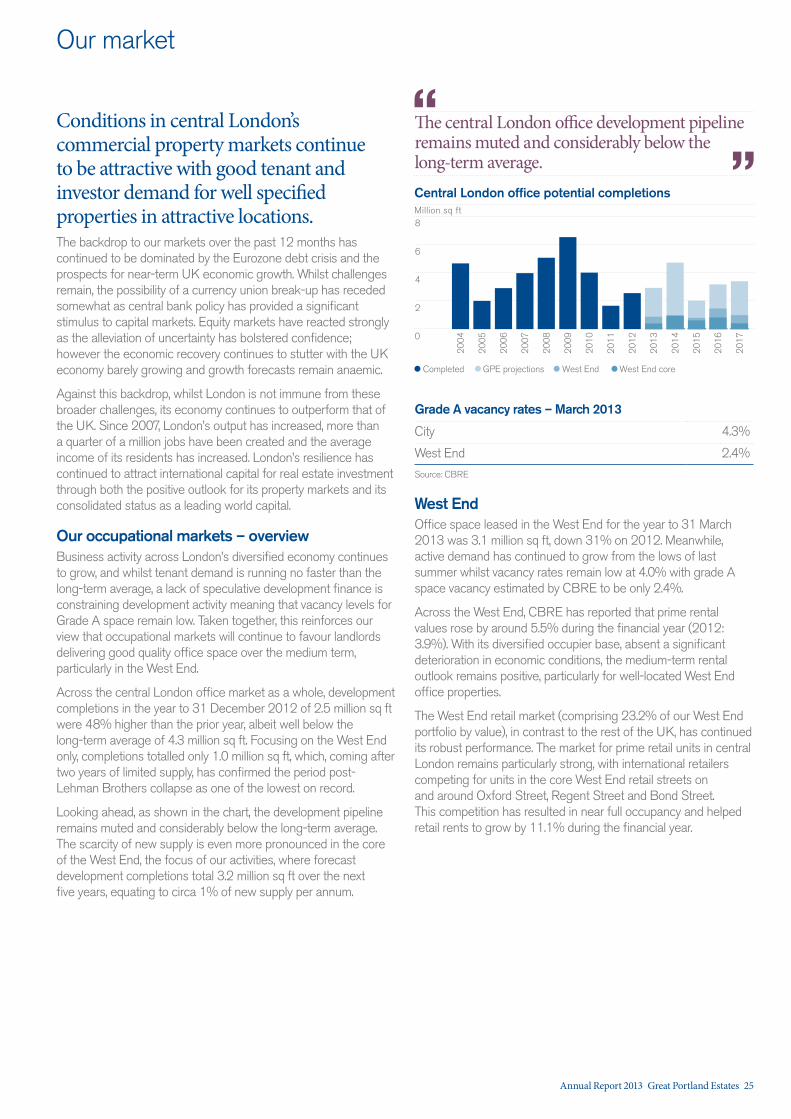
Looking ahead, as shown in the chart, the development pipeline remains muted and considerably below the long-term average. The scarcity of new supply is even more pronounced in the core of the West End, the focus of our activities, where forecast development completions total 3.2 million sq ft over the next five years, equating to circa 1% of new supply per annum.
0
8
4
6
2
Central London office potential completions
2004
2005
2006
2007
2008
2009
2010
2011
2012
2013
2014
2015
2016
2017
Million sq ft
Completed GPE projections West End West End core
Grade A vacancy rates – March 2013
City 4.3%
West End 2.4%
Source: CBRE
West EndOffice space leased in the West End for the year to 31 March 2013 was 3.1 million sq ft, down 31% on 2012. Meanwhile, active demand has continued to grow from the lows of last summer whilst vacancy rates remain low at 4.0% with grade A space vacancy estimated by CBRE to be only 2.4%.
Across the West End, CBRE has reported that prime rental values rose by around 5.5% during the financial year (2012: 3.9%). With its diversified occupier base, absent a significant deterioration in economic conditions, the medium-term rental outlook remains positive, particularly for well-located West End office properties.
The West End retail market (comprising 23.2% of our West End portfolio by value), in contrast to the rest of the UK, has continued its robust performance. The market for prime retail units in central London remains particularly strong, with international retailers competing for units in the core West End retail streets on and around Oxford Street, Regent Street and Bond Street. This competition has resulted in near full occupancy and helped retail rents to grow by 11.1% during the financial year.
The central London office development pipeline remains muted and considerably below the long-term average.
“”
Annual Report 2013 Great Portland Estates 25
Our market
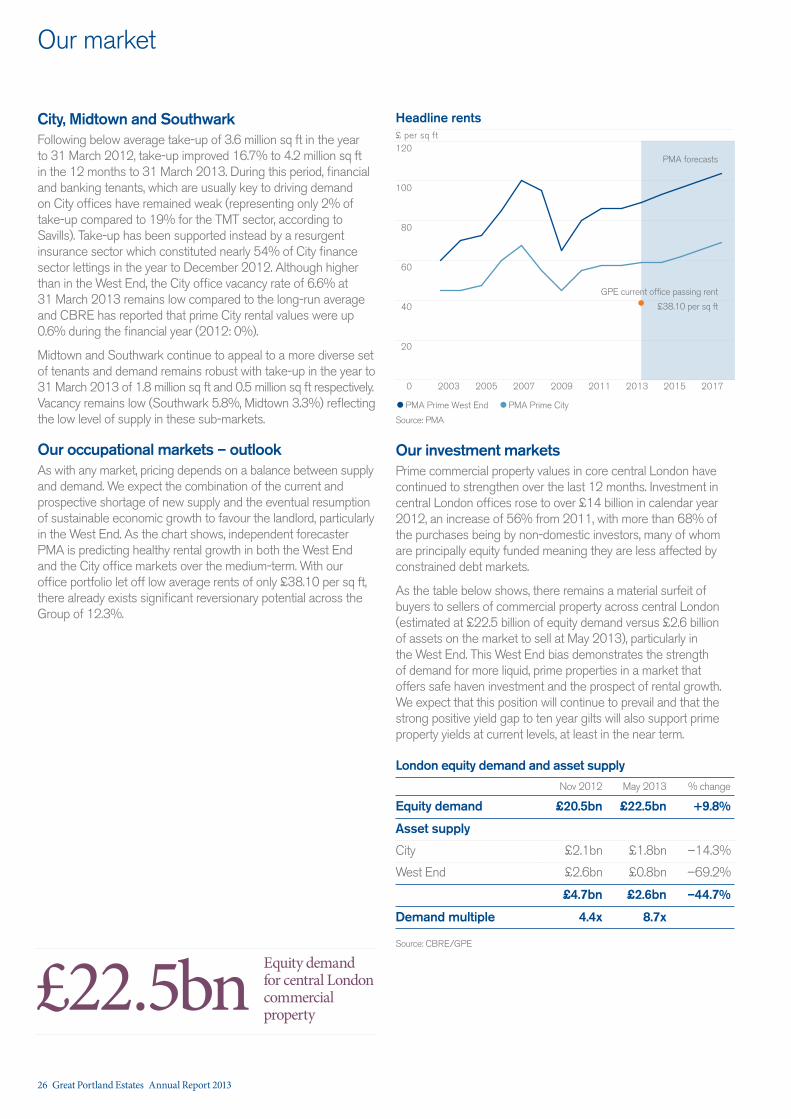
City, Midtown and SouthwarkFollowing below average take-up of 3.6 million sq ft in the year to 31 March 2012, take-up improved 16.7% to 4.2 million sq ft in the 12 months to 31 March 2013. During this period, financial and banking tenants, which are usually key to driving demand on City offices have remained weak (representing only 2% of take-up compared to 19% for the TMT sector, according to Savills). Take-up has been supported instead by a resurgent insurance sector which constituted nearly 54% of City finance sector lettings in the year to December 2012. Although higher than in the West End, the City office vacancy rate of 6.6% at 31 March 2013 remains low compared to the long-run average and CBRE has reported that prime City rental values were up 0.6% during the financial year (2012: 0%).
Midtown and Southwark continue to appeal to a more diverse set of tenants and demand remains robust with take-up in the year to 31 March 2013 of 1.8 million sq ft and 0.5 million sq ft respectively. Vacancy remains low (Southwark 5.8%, Midtown 3.3%) reflecting the low level of supply in these sub-markets.
Our occupational markets – outlookAs with any market, pricing depends on a balance between supply and demand. We expect the combination of the current and prospective shortage of new supply and the eventual resumption of sustainable economic growth to favour the landlord, particularly in the West End. As the chart shows, independent forecaster PMA is predicting healthy rental growth in both the West End and the City office markets over the medium-term. With our office portfolio let off low average rents of only £38.10 per sq ft, there already exists significant reversionary potential across the Group of 12.3%.
Our investment marketsPrime commercial property values in core central London have continued to strengthen over the last 12 months. Investment in central London offices rose to over £14 billion in calendar year 2012, an increase of 56% from 2011, with more than 68% of the purchases being by non-domestic investors, many of whom are principally equity funded meaning they are less affected by constrained debt markets.
As the table below shows, there remains a material surfeit of buyers to sellers of commercial property across central London (estimated at £22.5 billion of equity demand versus £2.6 billion of assets on the market to sell at May 2013), particularly in the West End. This West End bias demonstrates the strength of demand for more liquid, prime properties in a market that offers safe haven investment and the prospect of rental growth. We expect that this position will continue to prevail and that the strong positive yield gap to ten year gilts will also support prime property yields at current levels, at least in the near term.
London equity demand and asset supplyNov 2012 May 2013 % change
Equity demand £20.5bn £22.5bn +9.8%
Asset supply
City £2.1bn £1.8bn –14.3%
West End £2.6bn £0.8bn –69.2%
£4.7bn £2.6bn –44.7%
Demand multiple 4.4x 8.7x
Source: CBRE/GPE
0
120
40
60
80
20
Headline rents£ per sq ft
2003 2005 2007 2009 2011 2013 2015 2017
100
PMA Prime West End PMA Prime City
GPE current office passing rent
£38.10 per sq ft
PMA forecasts
Source: PMA
£22.5bnEquity demand for central London commercial property
26 Great Portland Estates Annual Report 2013
Whilst headline turnover figures are healthy, investors continue to be discerning; well-let properties in prime locations in the West End, in particular trophy retail properties, are attracting strong interest from a variety of sources (including owner occupiers and UK institutions); meanwhile, poorer quality or overpriced assets are often failing to sell. Since last summer, we identified an increase in attractively priced central London commercial investments for sale, typically of more complex, smaller lot size properties, and which are unlikely to appeal to the overseas or institutional buyer. Given that debt remains scarce for the non-institutional buyer, we have been able to exploit this market opportunity through acquiring such assets for us to reposition.
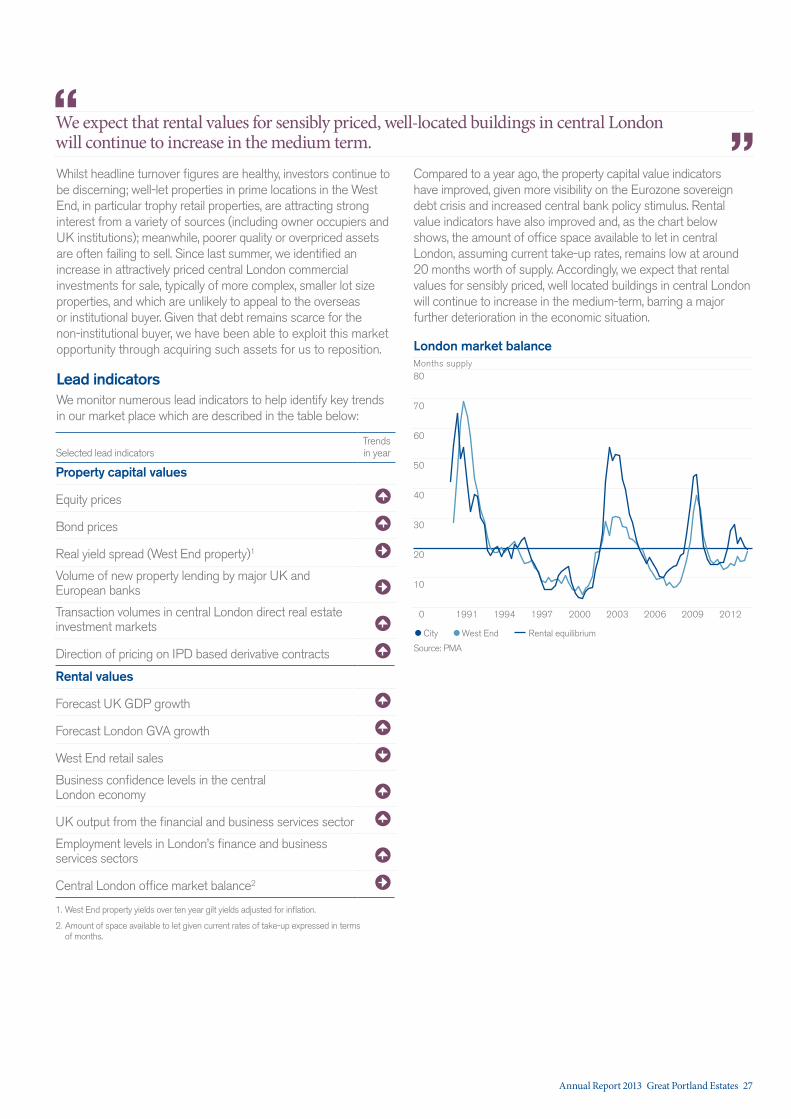
Lead indicatorsWe monitor numerous lead indicators to help identify key trends in our market place which are described in the table below:
Selected lead indicatorsTrends in year
Property capital values
Equity prices
Bond prices
Real yield spread (West End property)1
Volume of new property lending by major UK and European banks
Transaction volumes in central London direct real estate investment markets
Direction of pricing on IPD based derivative contracts
Rental values
Forecast UK GDP growth
Forecast London GVA growth
West End retail sales
Business confidence levels in the central London economy
UK output from the financial and business services sector
Employment levels in London’s finance and business services sectors
Central London office market balance2
1. West End property yields over ten year gilt yields adjusted for inflation.
2. Amount of space available to let given current rates of take-up expressed in terms of months.
We expect that rental values for sensibly priced, well-located buildings in central London will continue to increase in the medium term.“
”Compared to a year ago, the property capital value indicators have improved, given more visibility on the Eurozone sovereign debt crisis and increased central bank policy stimulus. Rental value indicators have also improved and, as the chart below shows, the amount of office space available to let in central London, assuming current take-up rates, remains low at around 20 months worth of supply. Accordingly, we expect that rental values for sensibly priced, well located buildings in central London will continue to increase in the medium-term, barring a major further deterioration in the economic situation.
0
80
30
40
50
60
20
London market balanceMonths supply
1991
10
1994 1997 2000 2003 2006 2009 2012
70
City West End Rental equilibrium
Source: PMA
Annual Report 2013 Great Portland Estates 27
Valuation
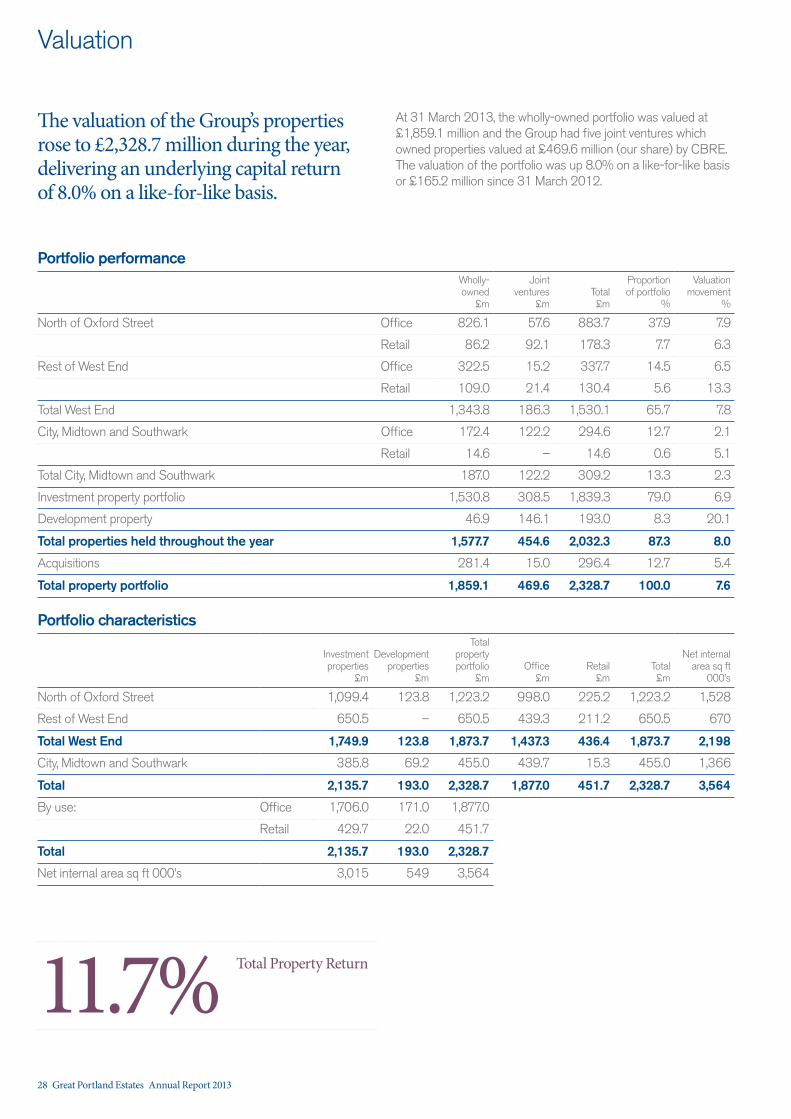
The valuation of the Group’s properties rose to £2,328.7 million during the year, delivering an underlying capital return of 8.0% on a like-for-like basis.
At 31 March 2013, the wholly-owned portfolio was valued at £1,859.1 million and the Group had five joint ventures which owned properties valued at £469.6 million (our share) by CBRE. The valuation of the portfolio was up 8.0% on a like-for-like basis or £165.2 million since 31 March 2012.
Portfolio performanceWholly-owned
£m
Joint ventures
£mTotal £m
Proportion of portfolio
%
Valuation movement
%
North of Oxford Street Office 826.1 57.6 883.7 37.9 7.9
Retail 86.2 92.1 178.3 7.7 6.3
Rest of West End Office 322.5 15.2 337.7 14.5 6.5
Retail 109.0 21.4 130.4 5.6 13.3
Total West End 1,343.8 186.3 1,530.1 65.7 7.8
City, Midtown and Southwark Office 172.4 122.2 294.6 12.7 2.1
Retail 14.6 – 14.6 0.6 5.1
Total City, Midtown and Southwark 187.0 122.2 309.2 13.3 2.3
Investment property portfolio 1,530.8 308.5 1,839.3 79.0 6.9
Development property 46.9 146.1 193.0 8.3 20.1
Total properties held throughout the year 1,577.7 454.6 2,032.3 87.3 8.0
Acquisitions 281.4 15.0 296.4 12.7 5.4
Total property portfolio 1,859.1 469.6 2,328.7 100.0 7.6
Portfolio characteristics
Investment properties
£m
Development properties
£m
Total property portfolio
£mOffice
£mRetail
£mTotal £m
Net internal area sq ft
000’s
North of Oxford Street 1,099.4 123.8 1,223.2 998.0 225.2 1,223.2 1,528
Rest of West End 650.5 – 650.5 439.3 211.2 650.5 670
Total West End 1,749.9 123.8 1,873.7 1,437.3 436.4 1,873.7 2,198
City, Midtown and Southwark 385.8 69.2 455.0 439.7 15.3 455.0 1,366
Total 2,135.7 193.0 2,328.7 1,877.0 451.7 2,328.7 3,564
By use: Office 1,706.0 171.0 1,877.0
Retail 429.7 22.0 451.7
Total 2,135.7 193.0 2,328.7
Net internal area sq ft 000’s 3,015 549 3,564
11.7%Total Property Return
28 Great Portland Estates Annual Report 2013
The key drivers behind the Group’s valuation movement for the year were:
— Rental value growth – since the start of the financial year, rental values have grown by 4.9%. Office rental values have increased by 4.3%, with retail rental values rising by 7.4%, in large part driven by our asset management successes and the lack of grade A supply putting upward pressure on rents. At 31 March 2013, the portfolio was 12.3% reversionary;
— Intensive asset management – during the year, 93 new leases, rent reviews and renewals were completed, securing £13.2 million (our share) of annual income and reducing voids which supported valuation growth over the period;
— Development properties – growth of 20.1% increased the valuation of current development properties to £193.0 million. The successful completion of our pre-let development schemes at 33 Margaret Street, W1 and 160 Great Portland Street, W1 contributed to the strong valuation performance of our North of Oxford Street office portfolio; and
— Lower investment yields – equivalent yields reduced by 16 basis points over the year due to the strength of demand for properties in our market (2012: 1 basis point expansion). At 31 March 2013, the portfolio equivalent yield was 5.1%.
Including rent from pre-lets and leases currently in rent free periods, the adjusted initial yield of the investment portfolio at 31 March 2013 was 4.0%, 10 basis points lower than at the start of the financial year.
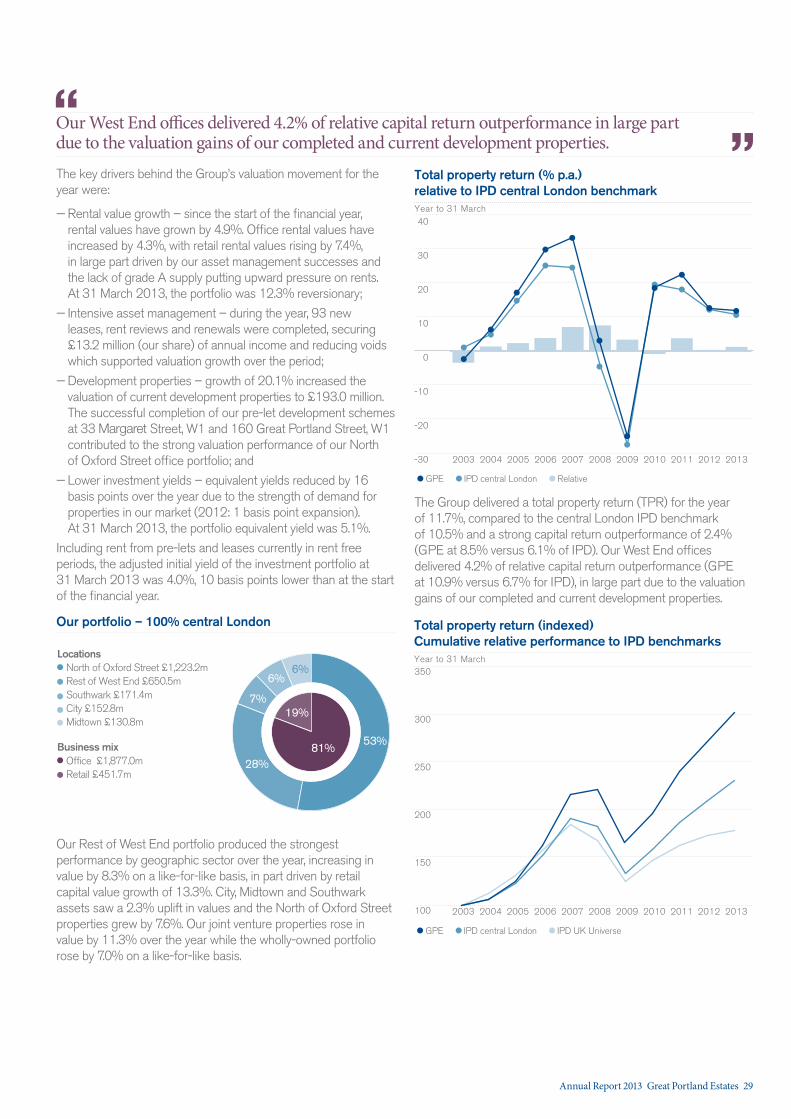
Our Rest of West End portfolio produced the strongest performance by geographic sector over the year, increasing in value by 8.3% on a like-for-like basis, in part driven by retail capital value growth of 13.3%. City, Midtown and Southwark assets saw a 2.3% uplift in values and the North of Oxford Street properties grew by 7.6%. Our joint venture properties rose in value by 11.3% over the year while the wholly-owned portfolio rose by 7.0% on a like-for-like basis.
The Group delivered a total property return (TPR) for the year of 11.7%, compared to the central London IPD benchmark of 10.5% and a strong capital return outperformance of 2.4% (GPE at 8.5% versus 6.1% of IPD). Our West End offices delivered 4.2% of relative capital return outperformance (GPE at 10.9% versus 6.7% for IPD), in large part due to the valuation gains of our completed and current development properties.
Our portfolio – 100% central London
North of Oxford Street £1,223.2mLocations
Rest of West End £650.5mSouthwark £171.4m
Midtown £130.8m
Office £1,877.0mBusiness mix
Retail £451.7m
City £152.8m
53%
28%
6%
7%
6%
19%
81%
GPE IPD central London Relative
-30
40
0
10
20
30
-10
Year to 31 March
2003
-20
2005 2006 2007 2008 2009 2010 2011 2012 2013
Total property return (% p.a.)relative to IPD central London benchmark
2004
100
150
200
250
300
350
GPE IPD central London IPD UK Universe
2003 2005 2006 2007 2008 2009 2010 2011 2012 20132004
Year to 31 March
Total property return (indexed) Cumulative relative performance to IPD benchmarks
Our West End offices delivered 4.2% of relative capital return outperformance in large part due to the valuation gains of our completed and current development properties.“
”
Annual Report 2013 Great Portland Estates 29
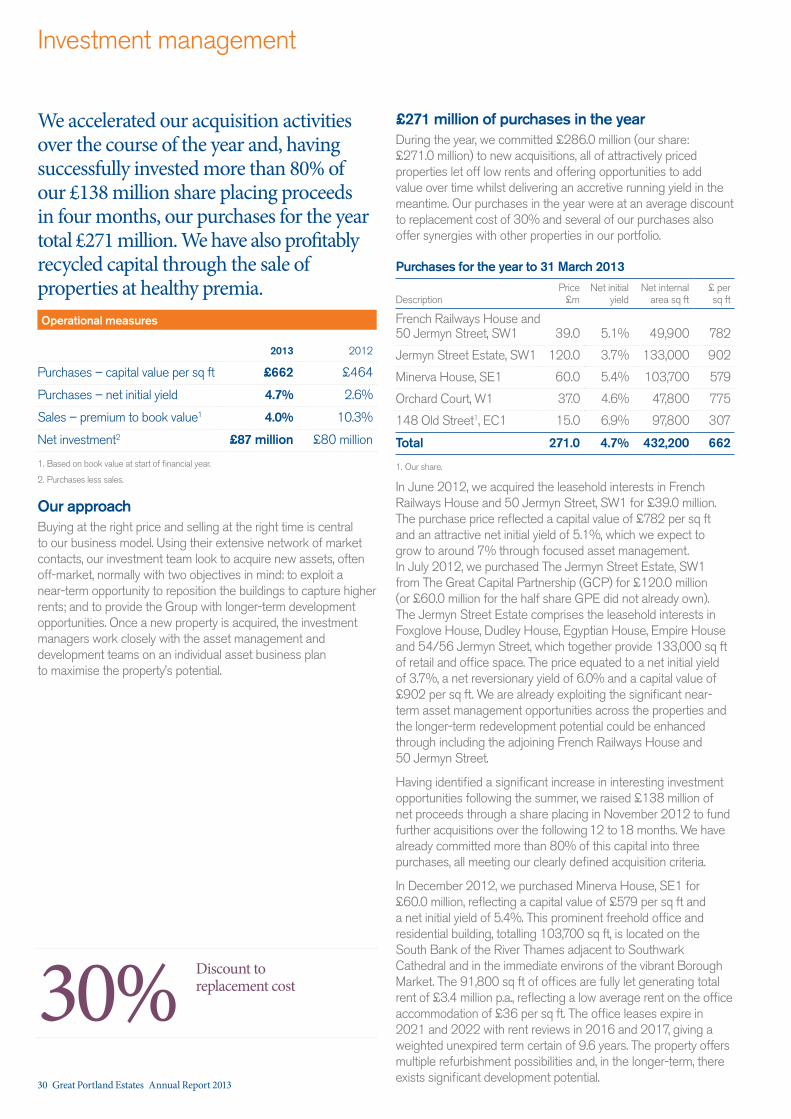
We accelerated our acquisition activities over the course of the year and, having successfully invested more than 80% of our £138 million share placing proceeds in four months, our purchases for the year total £271 million. We have also profitably recycled capital through the sale of properties at healthy premia.
Operational measures
2013 2012
Purchases – capital value per sq ft £662 £464
Purchases – net initial yield 4.7% 2.6%
Sales – premium to book value1 4.0% 10.3%
Net investment2 £87 million £80 million
1. Based on book value at start of financial year.
2. Purchases less sales.
Our approachBuying at the right price and selling at the right time is central to our business model. Using their extensive network of market contacts, our investment team look to acquire new assets, often off-market, normally with two objectives in mind: to exploit a near-term opportunity to reposition the buildings to capture higher rents; and to provide the Group with longer-term development opportunities. Once a new property is acquired, the investment managers work closely with the asset management and development teams on an individual asset business plan to maximise the property’s potential.
£271 million of purchases in the yearDuring the year, we committed £286.0 million (our share: £271.0 million) to new acquisitions, all of attractively priced properties let off low rents and offering opportunities to add value over time whilst delivering an accretive running yield in the meantime. Our purchases in the year were at an average discount to replacement cost of 30% and several of our purchases also offer synergies with other properties in our portfolio.
Purchases for the year to 31 March 2013
DescriptionPrice
£mNet initial
yieldNet internal
area sq ft£ per sq ft
French Railways House and 50 Jermyn Street, SW1 39.0 5.1% 49,900 782
Jermyn Street Estate, SW1 120.0 3.7% 133,000 902
Minerva House, SE1 60.0 5.4% 103,700 579
Orchard Court, W1 37.0 4.6% 47,800 775
148 Old Street1, EC1 15.0 6.9% 97,800 307
Total 271.0 4.7% 432,200 662
1. Our share.
In June 2012, we acquired the leasehold interests in French Railways House and 50 Jermyn Street, SW1 for £39.0 million. The purchase price reflected a capital value of £782 per sq ft and an attractive net initial yield of 5.1%, which we expect to grow to around 7% through focused asset management. In July 2012, we purchased The Jermyn Street Estate, SW1 from The Great Capital Partnership (GCP) for £120.0 million (or £60.0 million for the half share GPE did not already own). The Jermyn Street Estate comprises the leasehold interests in Foxglove House, Dudley House, Egyptian House, Empire House and 54/56 Jermyn Street, which together provide 133,000 sq ft of retail and office space. The price equated to a net initial yield of 3.7%, a net reversionary yield of 6.0% and a capital value of £902 per sq ft. We are already exploiting the significant near-term asset management opportunities across the properties and the longer-term redevelopment potential could be enhanced through including the adjoining French Railways House and 50 Jermyn Street.
Having identified a significant increase in interesting investment opportunities following the summer, we raised £138 million of net proceeds through a share placing in November 2012 to fund further acquisitions over the following 12 to 18 months. We have already committed more than 80% of this capital into three purchases, all meeting our clearly defined acquisition criteria.
In December 2012, we purchased Minerva House, SE1 for £60.0 million, reflecting a capital value of £579 per sq ft and a net initial yield of 5.4%. This prominent freehold office and residential building, totalling 103,700 sq ft, is located on the South Bank of the River Thames adjacent to Southwark Cathedral and in the immediate environs of the vibrant Borough Market. The 91,800 sq ft of offices are fully let generating total rent of £3.4 million p.a., reflecting a low average rent on the office accommodation of £36 per sq ft. The office leases expire in 2021 and 2022 with rent reviews in 2016 and 2017, giving a weighted unexpired term certain of 9.6 years. The property offers multiple refurbishment possibilities and, in the longer-term, there exists significant development potential.
Investment management
30%Discount to replacement cost
30 Great Portland Estates Annual Report 2013
In early March 2013, we exchanged contracts to acquire Orchard Court, W1 for £37.0 million reflecting a net initial yield of 4.6% and a capital value of £775 per sq ft. The 47,800 sq ft retail and office leasehold property is arranged over basement, ground and the first floor of a significant island site comprising the entire eastern side of Portman Square in the heart of the West End. It is let to 14 tenants paying a total rent of £1.81 million p.a. (£39 per sq ft on average) with a weighted average unexpired lease term of five years. On exchange, there were five rent reviews and one lease renewal outstanding which, once settled, will increase the yield to approximately 5%. The purchase will complete in July 2013 and, looking ahead, there is an opportunity to enhance the retail configuration and tenant mix.
Finally, in late March 2013, The Great Ropemaker Partnership (GRP) acquired 148 Old Street, EC1 from The BP Pension Fund for £30.0 million, reflecting a capital value of £307 per sq ft and an initial yield to GRP of 6.9%. This 97,800 sq ft freehold office building is let to Royal Mail Group Limited at a rent of £2.17 million p.a. (£22.19 per sq ft) until 2020, with a rent review and tenant break option in May 2015. The property sits on a site of 0.83 acres in a rapidly changing part of central London and with a net to gross ratio of only 66%, provides an exciting opportunity for refurbishment or redevelopment from 2015.
+See Capitalising on attractive investment opportunities case study on pages 14 and 15
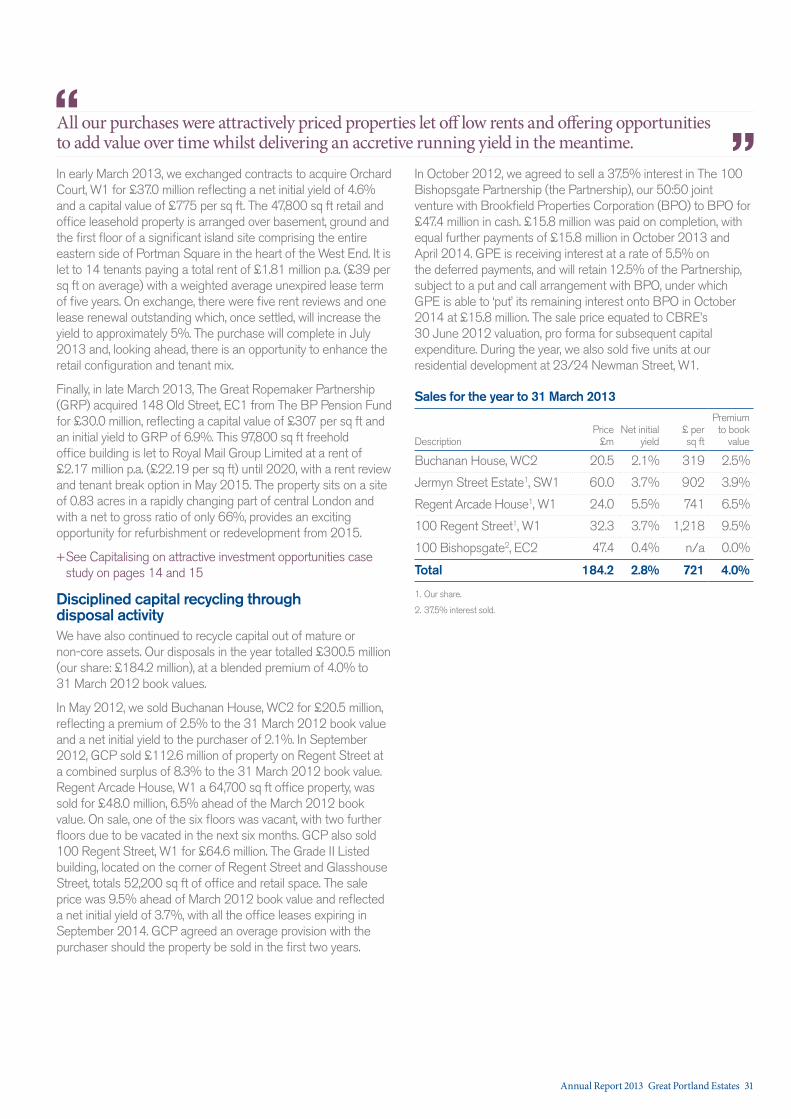
Disciplined capital recycling through disposal activityWe have also continued to recycle capital out of mature or non-core assets. Our disposals in the year totalled £300.5 million (our share: £184.2 million), at a blended premium of 4.0% to 31 March 2012 book values.
In May 2012, we sold Buchanan House, WC2 for £20.5 million, reflecting a premium of 2.5% to the 31 March 2012 book value and a net initial yield to the purchaser of 2.1%. In September 2012, GCP sold £112.6 million of property on Regent Street at a combined surplus of 8.3% to the 31 March 2012 book value. Regent Arcade House, W1 a 64,700 sq ft office property, was sold for £48.0 million, 6.5% ahead of the March 2012 book value. On sale, one of the six floors was vacant, with two further floors due to be vacated in the next six months. GCP also sold 100 Regent Street, W1 for £64.6 million. The Grade II Listed building, located on the corner of Regent Street and Glasshouse Street, totals 52,200 sq ft of office and retail space. The sale price was 9.5% ahead of March 2012 book value and reflected a net initial yield of 3.7%, with all the office leases expiring in September 2014. GCP agreed an overage provision with the purchaser should the property be sold in the first two years.
In October 2012, we agreed to sell a 37.5% interest in The 100 Bishopsgate Partnership (the Partnership), our 50:50 joint venture with Brookfield Properties Corporation (BPO) to BPO for £47.4 million in cash. £15.8 million was paid on completion, with equal further payments of £15.8 million in October 2013 and April 2014. GPE is receiving interest at a rate of 5.5% on the deferred payments, and will retain 12.5% of the Partnership, subject to a put and call arrangement with BPO, under which GPE is able to ‘put’ its remaining interest onto BPO in October 2014 at £15.8 million. The sale price equated to CBRE’s 30 June 2012 valuation, pro forma for subsequent capital expenditure. During the year, we also sold five units at our residential development at 23/24 Newman Street, W1.
Sales for the year to 31 March 2013
DescriptionPrice
£mNet initial
yield£ per sq ft
Premium to book
value
Buchanan House, WC2 20.5 2.1% 319 2.5%
Jermyn Street Estate1, SW1 60.0 3.7% 902 3.9%
Regent Arcade House1, W1 24.0 5.5% 741 6.5%
100 Regent Street1, W1 32.3 3.7% 1,218 9.5%
100 Bishopsgate2, EC2 47.4 0.4% n/a 0.0%
Total 184.2 2.8% 721 4.0%
1. Our share.
2. 37.5% interest sold.
All our purchases were attractively priced properties let off low rents and offering opportunities to add value over time whilst delivering an accretive running yield in the meantime.“
”
Annual Report 2013 Great Portland Estates 31
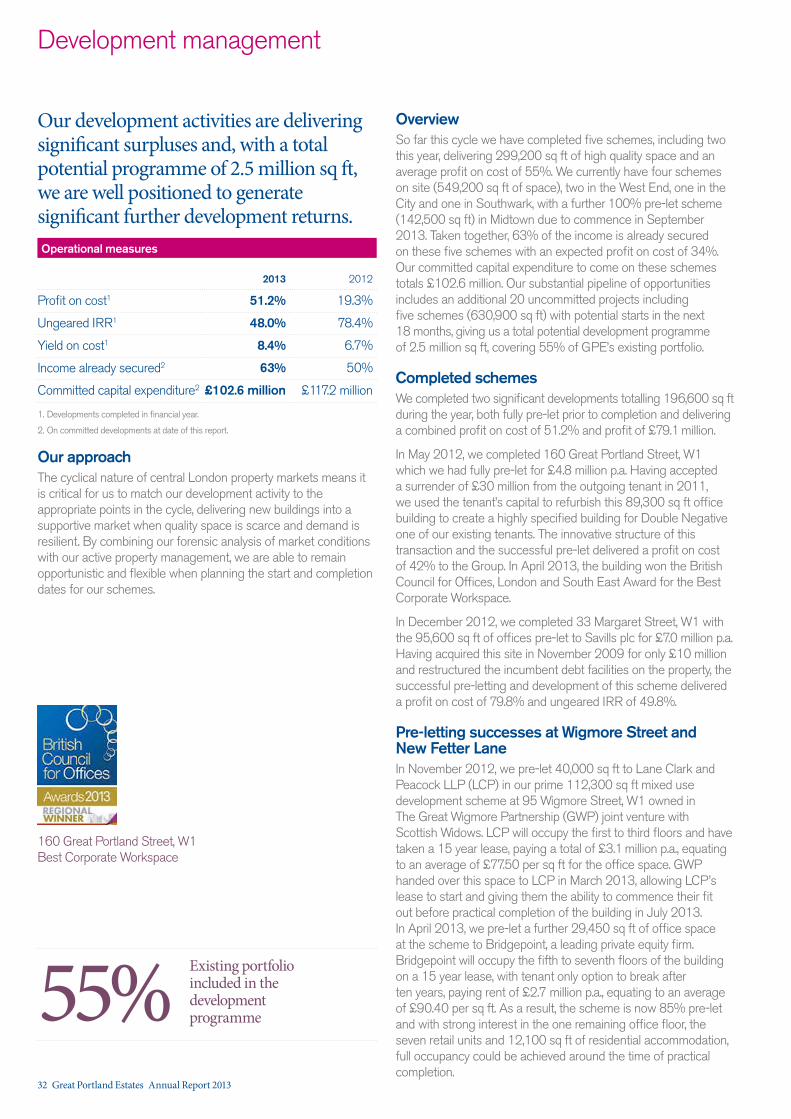
Our development activities are delivering significant surpluses and, with a total potential programme of 2.5 million sq ft, we are well positioned to generate significant further development returns.
Operational measures
2013 2012
Profit on cost1 51.2% 19.3%
Ungeared IRR1 48.0% 78.4%
Yield on cost1 8.4% 6.7%
Income already secured2 63% 50%
Committed capital expenditure2 £102.6 million £117.2 million
1. Developments completed in financial year.
2. On committed developments at date of this report.
Our approachThe cyclical nature of central London property markets means it is critical for us to match our development activity to the appropriate points in the cycle, delivering new buildings into a supportive market when quality space is scarce and demand is resilient. By combining our forensic analysis of market conditions with our active property management, we are able to remain opportunistic and flexible when planning the start and completion dates for our schemes.
OverviewSo far this cycle we have completed five schemes, including two this year, delivering 299,200 sq ft of high quality space and an average profit on cost of 55%. We currently have four schemes on site (549,200 sq ft of space), two in the West End, one in the City and one in Southwark, with a further 100% pre-let scheme (142,500 sq ft) in Midtown due to commence in September 2013. Taken together, 63% of the income is already secured on these five schemes with an expected profit on cost of 34%. Our committed capital expenditure to come on these schemes totals £102.6 million. Our substantial pipeline of opportunities includes an additional 20 uncommitted projects including five schemes (630,900 sq ft) with potential starts in the next 18 months, giving us a total potential development programme of 2.5 million sq ft, covering 55% of GPE’s existing portfolio.
Completed schemesWe completed two significant developments totalling 196,600 sq ft during the year, both fully pre-let prior to completion and delivering a combined profit on cost of 51.2% and profit of £79.1 million.
In May 2012, we completed 160 Great Portland Street, W1 which we had fully pre-let for £4.8 million p.a. Having accepted a surrender of £30 million from the outgoing tenant in 2011, we used the tenant’s capital to refurbish this 89,300 sq ft office building to create a highly specified building for Double Negative one of our existing tenants. The innovative structure of this transaction and the successful pre-let delivered a profit on cost of 42% to the Group. In April 2013, the building won the British Council for Offices, London and South East Award for the Best Corporate Workspace.
In December 2012, we completed 33 Margaret Street, W1 with the 95,600 sq ft of offices pre-let to Savills plc for £7.0 million p.a. Having acquired this site in November 2009 for only £10 million and restructured the incumbent debt facilities on the property, the successful pre-letting and development of this scheme delivered a profit on cost of 79.8% and ungeared IRR of 49.8%.
Pre-letting successes at Wigmore Street and New Fetter LaneIn November 2012, we pre-let 40,000 sq ft to Lane Clark and Peacock LLP (LCP) in our prime 112,300 sq ft mixed use development scheme at 95 Wigmore Street, W1 owned in The Great Wigmore Partnership (GWP) joint venture with Scottish Widows. LCP will occupy the first to third floors and have taken a 15 year lease, paying a total of £3.1 million p.a., equating to an average of £77.50 per sq ft for the office space. GWP handed over this space to LCP in March 2013, allowing LCP’s lease to start and giving them the ability to commence their fit out before practical completion of the building in July 2013. In April 2013, we pre-let a further 29,450 sq ft of office space at the scheme to Bridgepoint, a leading private equity firm. Bridgepoint will occupy the fifth to seventh floors of the building on a 15 year lease, with tenant only option to break after ten years, paying rent of £2.7 million p.a., equating to an average of £90.40 per sq ft. As a result, the scheme is now 85% pre-let and with strong interest in the one remaining office floor, the seven retail units and 12,100 sq ft of residential accommodation, full occupancy could be achieved around the time of practical completion.
Development management
Existing portfolio included in the development programme55%
160 Great Portland Street, W1 Best Corporate Workspace
32 Great Portland Estates Annual Report 2013
In May 2013, we pre-let the entirety of our 142,500 sq ft, 12 storey office development scheme at 12/14 New Fetter Lane, EC4. Bird & Bird, a leading international law firm, will occupy the whole building on 20.25 year leases (with no breaks) paying a total initial annual rent of £8.3 million, equating to an average of £58.80 per sq ft for the office space. The building has already been stripped out with demolition works due to commence this summer and practical completion scheduled for November 2015.
Other committed schemesIn addition to 95 Wigmore Street, W1 and 12/14 New Fetter Lane, EC4, we currently have three other committed schemes, all due to complete in the next 12 months.
At Walmar House, W1, our refurbishment is progressing well and we are mid-way through the project to deliver 60,400 sq ft of mixed use space. As part of this refurbishment, we are reconfiguring the retail units and in March 2013 we let 2,390 sq ft to Pret A Manger to enable them to enlarge their footprint in the building and create a more efficient trading format. This building is due to complete in February 2014.
Construction work is also progressing well at our 47% pre-let office development at 240 Blackfriars Road, SE1 with completion expected by March 2014. At City Tower, EC2 our Grade A office refurbishment scheme owned in The Great Star Partnership (GSP) joint venture, works are on track for completion this summer.
+See Driving rental growth case study on pages 16 and 17
Project preparation and pipelineIn March 2013, we held a public exhibition and submitted our planning application for our redevelopment of 73/89 Oxford Street, W1. Our proposed scheme will deliver 54,600 sq ft of Grade A offices and 33,500 sq ft of flagship retail space into the resurgent eastern end of Oxford Street and will be completed in advance of the opening of Crossrail in 2017.
At Rathbone Place, W1 we have continued to work up our plans for this major 2.3 acre freehold West End site. We submitted a planning application in May 2013 for a 414,100 sq ft mixed-use scheme and will take vacant possession of the site this summer ahead of a potential start on site in early 2014.
+See Regenerating Oxford Street case study on pages 18 and 19
We also continue to prepare 20 St James’s Street, SW1, 48/50 Broadwick Street, W1 and St Lawrence House, 26/34 Broadwick Street, W1 for potential starts over the next 18 months.
At Hanover Square, W1, work is underway by Crossrail to construct the Eastern ticket hall of the new Bond Street Crossrail station. Once the main station works are complete, scheduled for late 2015, we will commence development of our masterplan proposals.
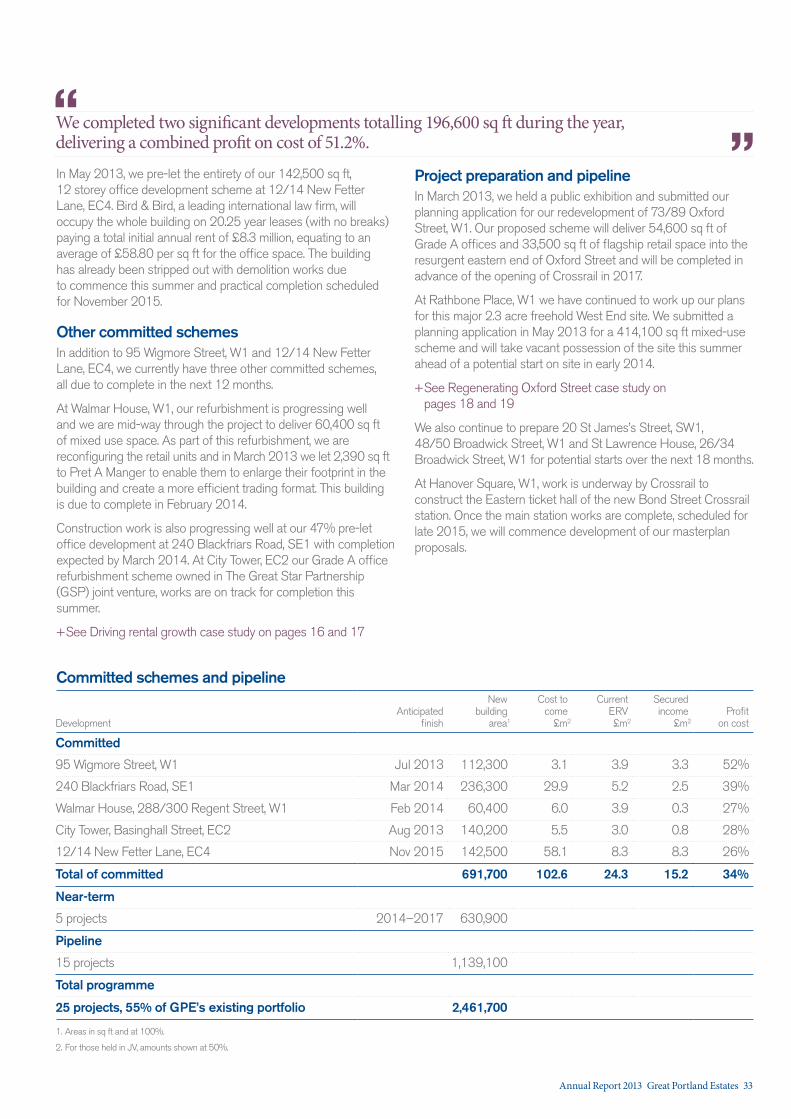
Committed schemes and pipeline
DevelopmentAnticipated
finish
New building
area1
Cost to come
£m2
Current ERV £m2
Secured income
£m2Profit
on cost
Committed
95 Wigmore Street, W1 Jul 2013 112,300 3.1 3.9 3.3 52%
240 Blackfriars Road, SE1 Mar 2014 236,300 29.9 5.2 2.5 39%
Walmar House, 288/300 Regent Street, W1 Feb 2014 60,400 6.0 3.9 0.3 27%
City Tower, Basinghall Street, EC2 Aug 2013 140,200 5.5 3.0 0.8 28%
12/14 New Fetter Lane, EC4 Nov 2015 142,500 58.1 8.3 8.3 26%
Total of committed 691,700 102.6 24.3 15.2 34%
Near-term
5 projects 2014–2017 630,900
Pipeline
15 projects 1,139,100
Total programme
25 projects, 55% of GPE’s existing portfolio 2,461,700
1. Areas in sq ft and at 100%.
2. For those held in JV, amounts shown at 50%.
We completed two significant developments totalling 196,600 sq ft during the year, delivering a combined profit on cost of 51.2%.“
”
Annual Report 2013 Great Portland Estates 33
Asset management
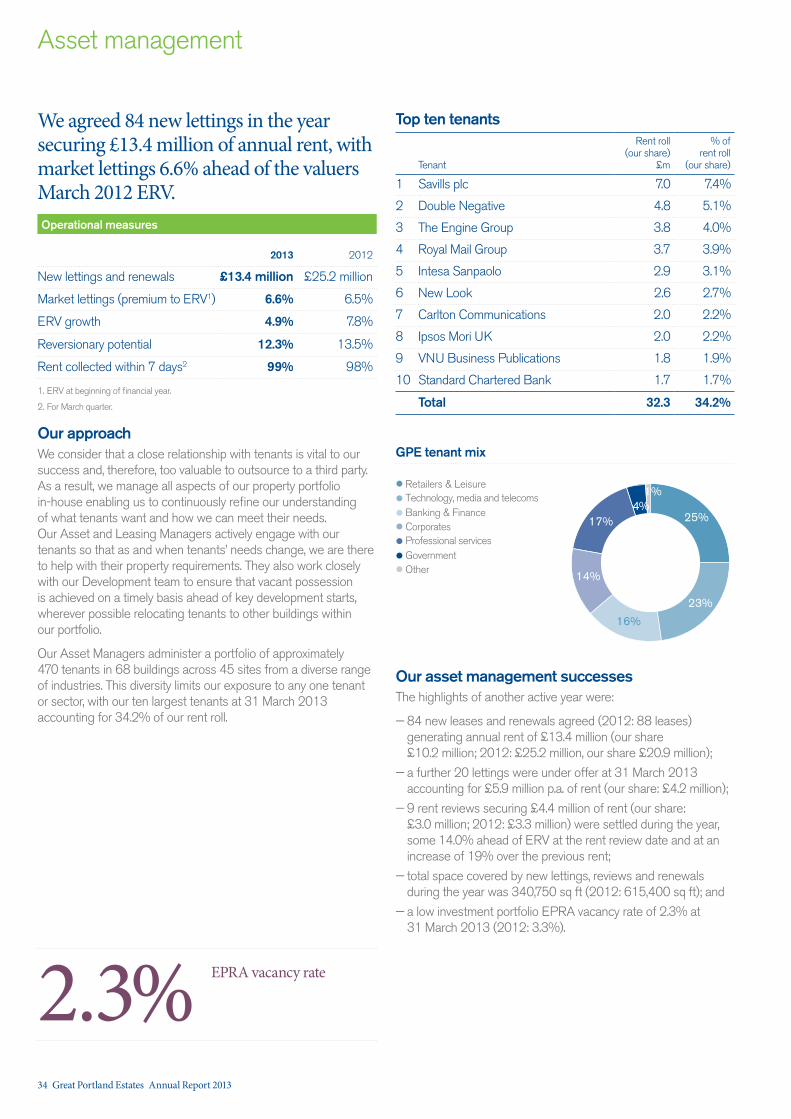
We agreed 84 new lettings in the year securing £13.4 million of annual rent, with market lettings 6.6% ahead of the valuers March 2012 ERV.
Operational measures
2013 2012
New lettings and renewals £13.4 million £25.2 million
Market lettings (premium to ERV1) 6.6% 6.5%
ERV growth 4.9% 7.8%
Reversionary potential 12.3% 13.5%
Rent collected within 7 days2 99% 98%
1. ERV at beginning of financial year.
2. For March quarter.
Our approachWe consider that a close relationship with tenants is vital to our success and, therefore, too valuable to outsource to a third party. As a result, we manage all aspects of our property portfolio in-house enabling us to continuously refine our understanding of what tenants want and how we can meet their needs. Our Asset and Leasing Managers actively engage with our tenants so that as and when tenants’ needs change, we are there to help with their property requirements. They also work closely with our Development team to ensure that vacant possession is achieved on a timely basis ahead of key development starts, wherever possible relocating tenants to other buildings within our portfolio.
Our Asset Managers administer a portfolio of approximately 470 tenants in 68 buildings across 45 sites from a diverse range of industries. This diversity limits our exposure to any one tenant or sector, with our ten largest tenants at 31 March 2013 accounting for 34.2% of our rent roll.
Top ten tenants
Tenant
Rent roll (our share)
£m
% of rent roll
(our share)
1 Savills plc 7.0 7.4%
2 Double Negative 4.8 5.1%
3 The Engine Group 3.8 4.0%
4 Royal Mail Group 3.7 3.9%
5 Intesa Sanpaolo 2.9 3.1%
6 New Look 2.6 2.7%
7 Carlton Communications 2.0 2.2%
8 Ipsos Mori UK 2.0 2.2%
9 VNU Business Publications 1.8 1.9%
10 Standard Chartered Bank 1.7 1.7%
Total 32.3 34.2%
Our asset management successes The highlights of another active year were:
— 84 new leases and renewals agreed (2012: 88 leases) generating annual rent of £13.4 million (our share £10.2 million; 2012: £25.2 million, our share £20.9 million);
— a further 20 lettings were under offer at 31 March 2013 accounting for £5.9 million p.a. of rent (our share: £4.2 million);
— 9 rent reviews securing £4.4 million of rent (our share: £3.0 million; 2012: £3.3 million) were settled during the year, some 14.0% ahead of ERV at the rent review date and at an increase of 19% over the previous rent;
— total space covered by new lettings, reviews and renewals during the year was 340,750 sq ft (2012: 615,400 sq ft); and
— a low investment portfolio EPRA vacancy rate of 2.3% at 31 March 2013 (2012: 3.3%).
GPE tenant mix
Retailers & LeisureTechnology, media and telecomsBanking & FinanceCorporates
25%
16%
17%4%
Professional servicesGovernmentOther
14%
23%
1%
2.3%EPRA vacancy rate
34 Great Portland Estates Annual Report 2013
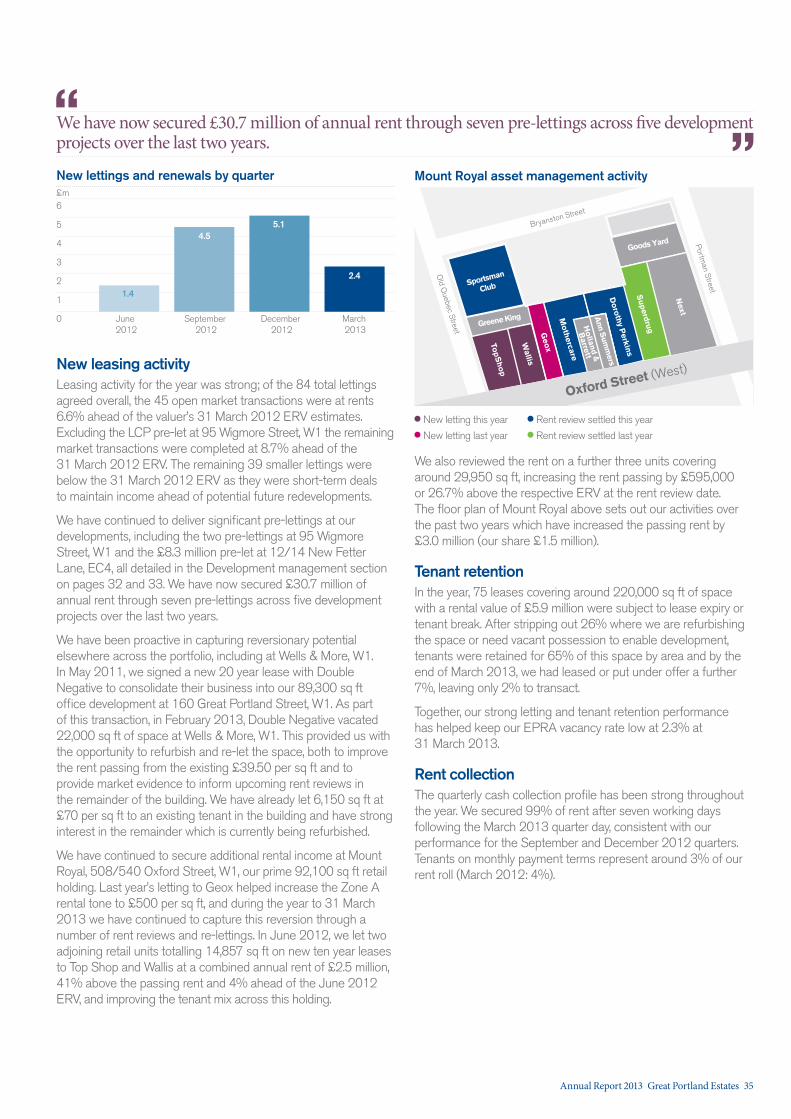
New leasing activity Leasing activity for the year was strong; of the 84 total lettings agreed overall, the 45 open market transactions were at rents 6.6% ahead of the valuer’s 31 March 2012 ERV estimates. Excluding the LCP pre-let at 95 Wigmore Street, W1 the remaining market transactions were completed at 8.7% ahead of the 31 March 2012 ERV. The remaining 39 smaller lettings were below the 31 March 2012 ERV as they were short-term deals to maintain income ahead of potential future redevelopments.
We have continued to deliver significant pre-lettings at our developments, including the two pre-lettings at 95 Wigmore Street, W1 and the £8.3 million pre-let at 12/14 New Fetter Lane, EC4, all detailed in the Development management section on pages 32 and 33. We have now secured £30.7 million of annual rent through seven pre-lettings across five development projects over the last two years.
We have been proactive in capturing reversionary potential elsewhere across the portfolio, including at Wells & More, W1. In May 2011, we signed a new 20 year lease with Double Negative to consolidate their business into our 89,300 sq ft office development at 160 Great Portland Street, W1. As part of this transaction, in February 2013, Double Negative vacated 22,000 sq ft of space at Wells & More, W1. This provided us with the opportunity to refurbish and re-let the space, both to improve the rent passing from the existing £39.50 per sq ft and to provide market evidence to inform upcoming rent reviews in the remainder of the building. We have already let 6,150 sq ft at £70 per sq ft to an existing tenant in the building and have strong interest in the remainder which is currently being refurbished.
We have continued to secure additional rental income at Mount Royal, 508/540 Oxford Street, W1, our prime 92,100 sq ft retail holding. Last year’s letting to Geox helped increase the Zone A rental tone to £500 per sq ft, and during the year to 31 March 2013 we have continued to capture this reversion through a number of rent reviews and re-lettings. In June 2012, we let two adjoining retail units totalling 14,857 sq ft on new ten year leases to Top Shop and Wallis at a combined annual rent of £2.5 million, 41% above the passing rent and 4% ahead of the June 2012 ERV, and improving the tenant mix across this holding.
We also reviewed the rent on a further three units covering around 29,950 sq ft, increasing the rent passing by £595,000 or 26.7% above the respective ERV at the rent review date. The floor plan of Mount Royal above sets out our activities over the past two years which have increased the passing rent by £3.0 million (our share £1.5 million).
Tenant retention In the year, 75 leases covering around 220,000 sq ft of space with a rental value of £5.9 million were subject to lease expiry or tenant break. After stripping out 26% where we are refurbishing the space or need vacant possession to enable development, tenants were retained for 65% of this space by area and by the end of March 2013, we had leased or put under offer a further 7%, leaving only 2% to transact.
Together, our strong letting and tenant retention performance has helped keep our EPRA vacancy rate low at 2.3% at 31 March 2013.
Rent collectionThe quarterly cash collection profile has been strong throughout the year. We secured 99% of rent after seven working days following the March 2013 quarter day, consistent with our performance for the September and December 2012 quarters. Tenants on monthly payment terms represent around 3% of our rent roll (March 2012: 4%).
0
6
2
3
4
1
New lettings and renewals by quarter
June 2012
September 2012
December 2012
March 2013
5
1.4
4.55.1
2.4
£m
Bryanston Street
Old Q
uebec Street
TopS
hop
Greene King
Sportsman
Club
Goods Yard
Wallis
Geox
Mo
thercare
Ho
lland &
Barrett
Ann S
umm
ersD
oro
thy Perkins
Superdrug
Next
Portm
an Street
Oxford Street (West)
New letting this year Rent review settled this year
New letting last year Rent review settled last year
Mount Royal asset management activity
We have now secured £30.7 million of annual rent through seven pre-lettings across five development projects over the last two years.“
”
Annual Report 2013 Great Portland Estates 35
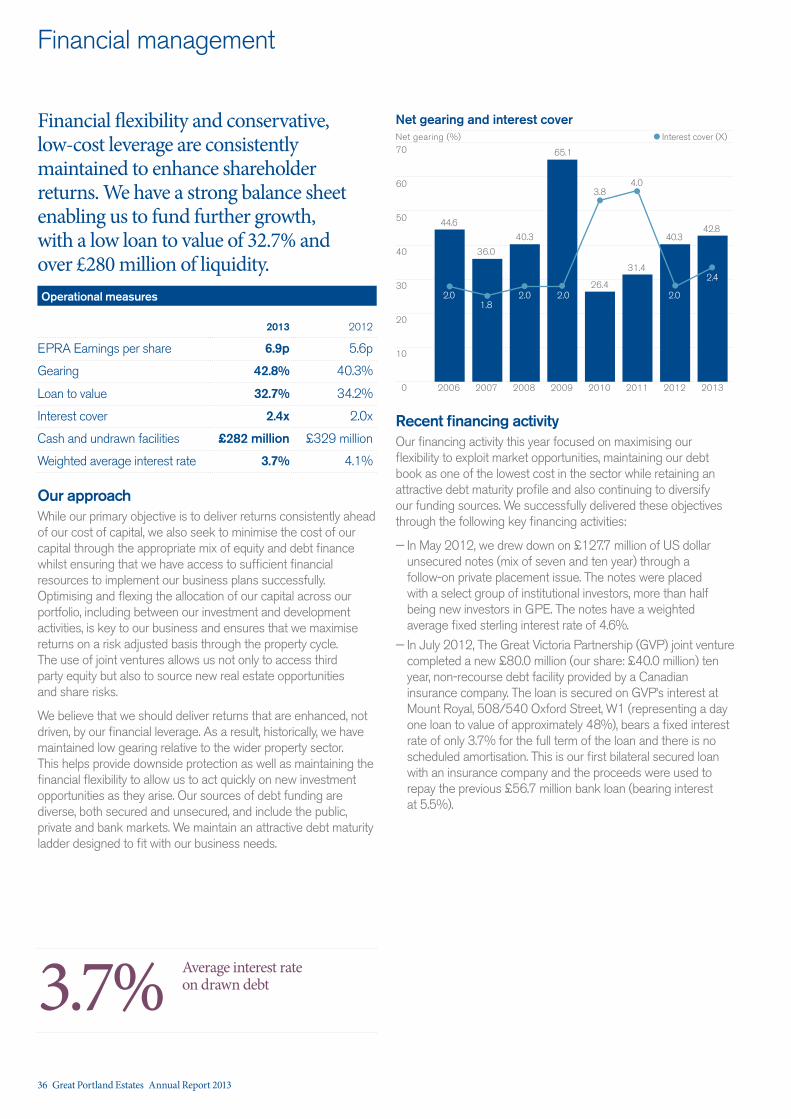
Financial management
Financial flexibility and conservative, low-cost leverage are consistently maintained to enhance shareholder returns. We have a strong balance sheet enabling us to fund further growth, with a low loan to value of 32.7% and over £280 million of liquidity.
Operational measures
2013 2012
EPRA Earnings per share 6.9p 5.6p
Gearing 42.8% 40.3%
Loan to value 32.7% 34.2%
Interest cover 2.4x 2.0x
Cash and undrawn facilities £282 million £329 million
Weighted average interest rate 3.7% 4.1%
Our approachWhile our primary objective is to deliver returns consistently ahead of our cost of capital, we also seek to minimise the cost of our capital through the appropriate mix of equity and debt finance whilst ensuring that we have access to sufficient financial resources to implement our business plans successfully. Optimising and flexing the allocation of our capital across our portfolio, including between our investment and development activities, is key to our business and ensures that we maximise returns on a risk adjusted basis through the property cycle. The use of joint ventures allows us not only to access third party equity but also to source new real estate opportunities and share risks.
We believe that we should deliver returns that are enhanced, not driven, by our financial leverage. As a result, historically, we have maintained low gearing relative to the wider property sector. This helps provide downside protection as well as maintaining the financial flexibility to allow us to act quickly on new investment opportunities as they arise. Our sources of debt funding are diverse, both secured and unsecured, and include the public, private and bank markets. We maintain an attractive debt maturity ladder designed to fit with our business needs.
Recent financing activityOur financing activity this year focused on maximising our flexibility to exploit market opportunities, maintaining our debt book as one of the lowest cost in the sector while retaining an attractive debt maturity profile and also continuing to diversify our funding sources. We successfully delivered these objectives through the following key financing activities:
— In May 2012, we drew down on £127.7 million of US dollar unsecured notes (mix of seven and ten year) through a follow-on private placement issue. The notes were placed with a select group of institutional investors, more than half being new investors in GPE. The notes have a weighted average fixed sterling interest rate of 4.6%.
— In July 2012, The Great Victoria Partnership (GVP) joint venture completed a new £80.0 million (our share: £40.0 million) ten year, non-recourse debt facility provided by a Canadian insurance company. The loan is secured on GVP’s interest at Mount Royal, 508/540 Oxford Street, W1 (representing a day one loan to value of approximately 48%), bears a fixed interest rate of only 3.7% for the full term of the loan and there is no scheduled amortisation. This is our first bilateral secured loan with an insurance company and the proceeds were used to repay the previous £56.7 million bank loan (bearing interest at 5.5%).
3.7%Average interest rate on drawn debt
Interest cover (X)
0
70
30
40
50
60
20
Net gearing and interest coverNet gearing (%)
2006
10
2007 2008 2009 2010 2011 2012 2013
44.6
36.0
40.3
65.1
26.4
31.4
42.840.3
2.01.8
2.0 2.0
3.84.0
2.4
2.0
36 Great Portland Estates Annual Report 2013
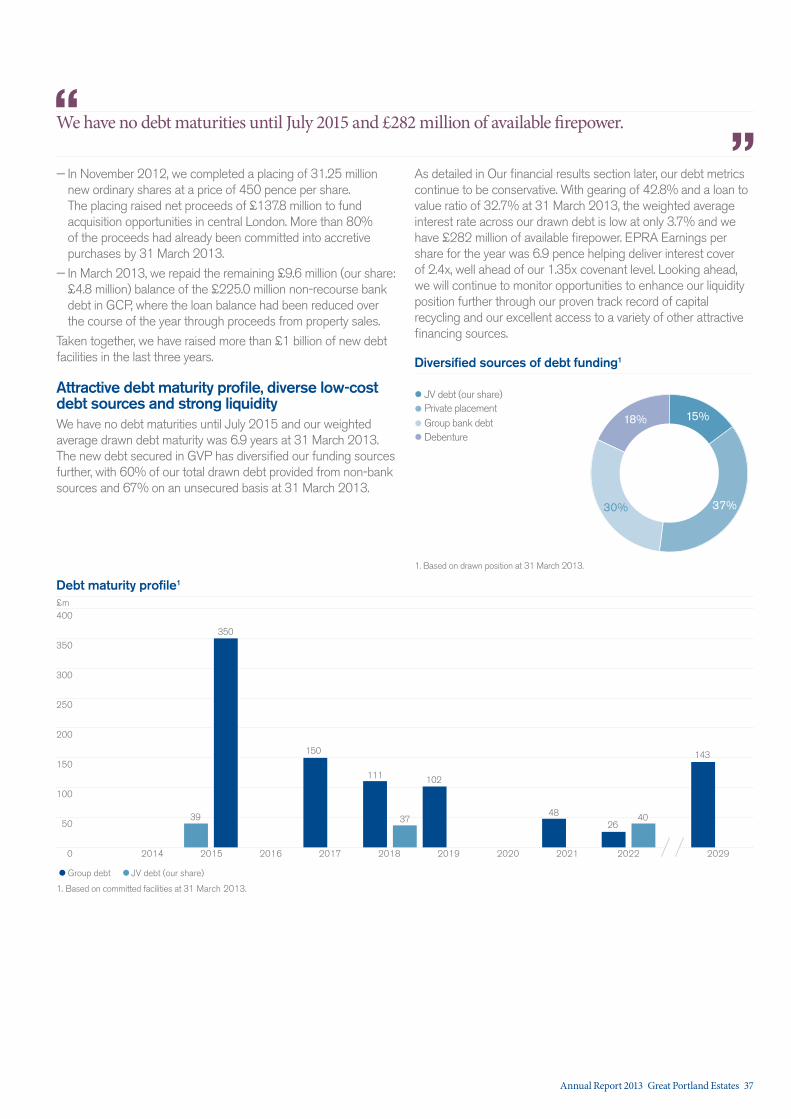
— In November 2012, we completed a placing of 31.25 million new ordinary shares at a price of 450 pence per share. The placing raised net proceeds of £137.8 million to fund acquisition opportunities in central London. More than 80% of the proceeds had already been committed into accretive purchases by 31 March 2013.
— In March 2013, we repaid the remaining £9.6 million (our share: £4.8 million) balance of the £225.0 million non-recourse bank debt in GCP, where the loan balance had been reduced over the course of the year through proceeds from property sales.
Taken together, we have raised more than £1 billion of new debt facilities in the last three years.
Attractive debt maturity profile, diverse low-cost debt sources and strong liquidityWe have no debt maturities until July 2015 and our weighted average drawn debt maturity was 6.9 years at 31 March 2013. The new debt secured in GVP has diversified our funding sources further, with 60% of our total drawn debt provided from non-bank sources and 67% on an unsecured basis at 31 March 2013.
As detailed in Our financial results section later, our debt metrics continue to be conservative. With gearing of 42.8% and a loan to value ratio of 32.7% at 31 March 2013, the weighted average interest rate across our drawn debt is low at only 3.7% and we have £282 million of available firepower. EPRA Earnings per share for the year was 6.9 pence helping deliver interest cover of 2.4x, well ahead of our 1.35x covenant level. Looking ahead, we will continue to monitor opportunities to enhance our liquidity position further through our proven track record of capital recycling and our excellent access to a variety of other attractive financing sources.
Diversified sources of debt funding1
JV debt (our share)Private placement Group bank debtDebenture
15%
30% 37%
18%
1. Based on drawn position at 31 March 2013.
0
400
200
250
300
350
Debt maturity profile1
£m
50
2015 2016 2017 2018 2019 2020 2021 202920222014
39
350
150
111
37
102
4826
40
143150
100
Group debt JV debt (our share)
1. Based on committed facilities at 31 March 2013.
We have no debt maturities until July 2015 and £282 million of available firepower.“”
Annual Report 2013 Great Portland Estates 37
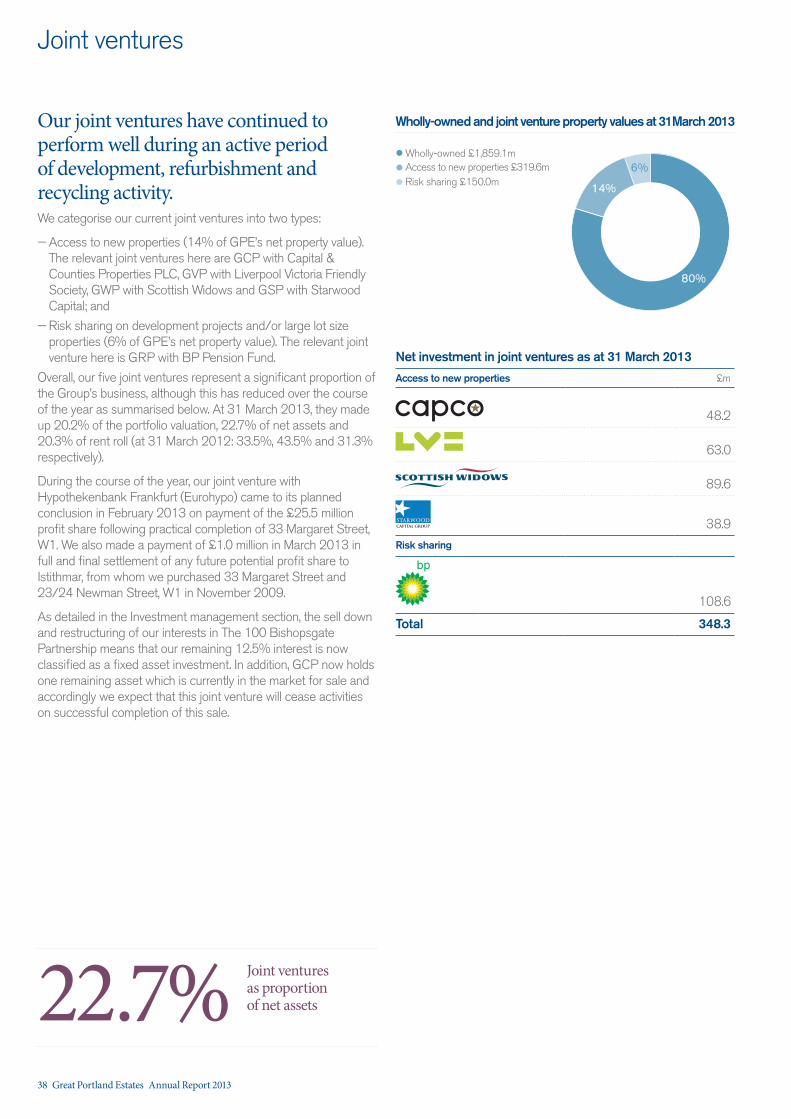
Joint ventures
Our joint ventures have continued to perform well during an active period of development, refurbishment and recycling activity.We categorise our current joint ventures into two types:
— Access to new properties (14% of GPE’s net property value). The relevant joint ventures here are GCP with Capital & Counties Properties PLC, GVP with Liverpool Victoria Friendly Society, GWP with Scottish Widows and GSP with Starwood Capital; and
— Risk sharing on development projects and/or large lot size properties (6% of GPE’s net property value). The relevant joint venture here is GRP with BP Pension Fund.
Overall, our five joint ventures represent a significant proportion of the Group’s business, although this has reduced over the course of the year as summarised below. At 31 March 2013, they made up 20.2% of the portfolio valuation, 22.7% of net assets and 20.3% of rent roll (at 31 March 2012: 33.5%, 43.5% and 31.3% respectively).
During the course of the year, our joint venture with Hypothekenbank Frankfurt (Eurohypo) came to its planned conclusion in February 2013 on payment of the £25.5 million profit share following practical completion of 33 Margaret Street, W1. We also made a payment of £1.0 million in March 2013 in full and final settlement of any future potential profit share to Istithmar, from whom we purchased 33 Margaret Street and 23/24 Newman Street, W1 in November 2009.
As detailed in the Investment management section, the sell down and restructuring of our interests in The 100 Bishopsgate Partnership means that our remaining 12.5% interest is now classified as a fixed asset investment. In addition, GCP now holds one remaining asset which is currently in the market for sale and accordingly we expect that this joint venture will cease activities on successful completion of this sale.
Wholly-owned and joint venture property values at 31 March 2013
Wholly-owned £1,859.1mAccess to new properties £319.6mRisk sharing £150.0m
80%
14%
6%
Net investment in joint ventures as at 31 March 2013
Access to new properties £m
48.2
63.0
89.6
38.9
Risk sharing
108.6
Total 348.3
22.7%Joint ventures as proportion of net assets
38 Great Portland Estates Annual Report 2013
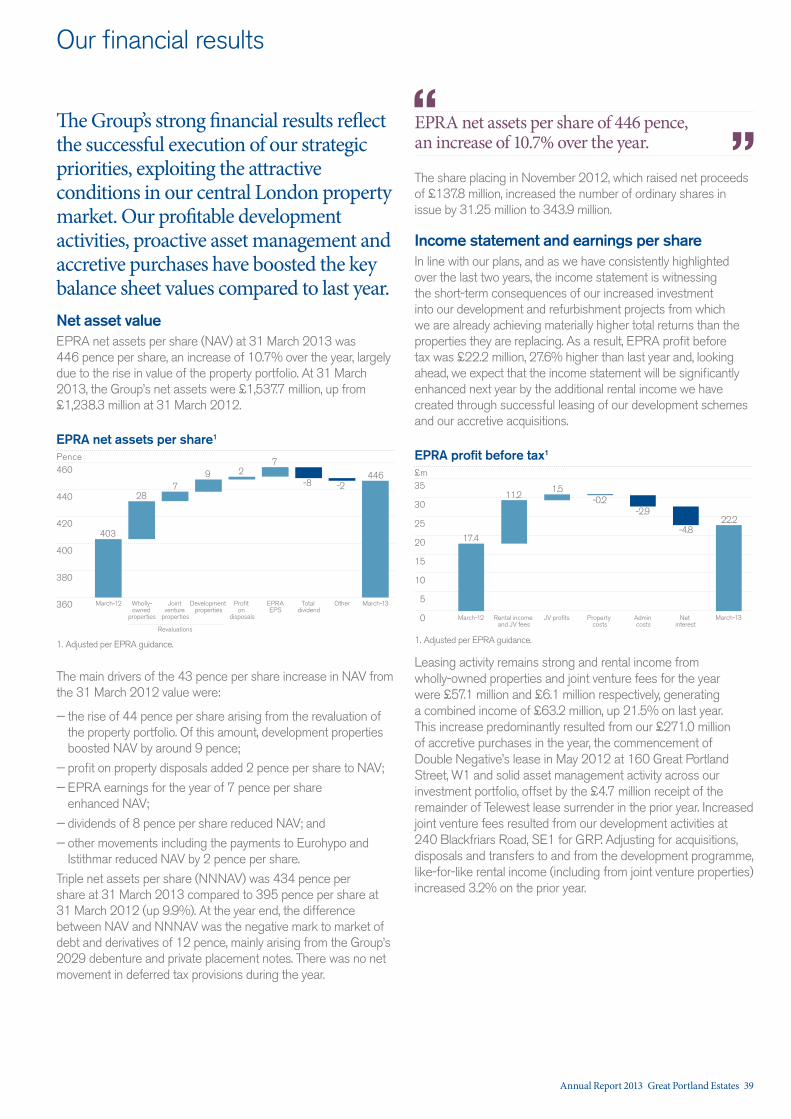
The Group’s strong financial results reflect the successful execution of our strategic priorities, exploiting the attractive conditions in our central London property market. Our profitable development activities, proactive asset management and accretive purchases have boosted the key balance sheet values compared to last year.
Net asset valueEPRA net assets per share (NAV) at 31 March 2013 was 446 pence per share, an increase of 10.7% over the year, largely due to the rise in value of the property portfolio. At 31 March 2013, the Group’s net assets were £1,537.7 million, up from £1,238.3 million at 31 March 2012.
360
460
400
420
440
380
EPRA net assets per share1
Pence
403
287
9 27
-8 -2446
March-12 Wholly-owned
properties
Revaluations
Joint venture
properties
Development properties
Profit on
disposals
EPRAEPS
Total dividend
Other March-13
1. Adjusted per EPRA guidance.
The main drivers of the 43 pence per share increase in NAV from the 31 March 2012 value were:
— the rise of 44 pence per share arising from the revaluation of the property portfolio. Of this amount, development properties boosted NAV by around 9 pence;
— profit on property disposals added 2 pence per share to NAV;
— EPRA earnings for the year of 7 pence per share enhanced NAV;
— dividends of 8 pence per share reduced NAV; and
— other movements including the payments to Eurohypo and Istithmar reduced NAV by 2 pence per share.
Triple net assets per share (NNNAV) was 434 pence per share at 31 March 2013 compared to 395 pence per share at 31 March 2012 (up 9.9%). At the year end, the difference between NAV and NNNAV was the negative mark to market of debt and derivatives of 12 pence, mainly arising from the Group’s 2029 debenture and private placement notes. There was no net movement in deferred tax provisions during the year.
The share placing in November 2012, which raised net proceeds of £137.8 million, increased the number of ordinary shares in issue by 31.25 million to 343.9 million.
Income statement and earnings per shareIn line with our plans, and as we have consistently highlighted over the last two years, the income statement is witnessing the short-term consequences of our increased investment into our development and refurbishment projects from which we are already achieving materially higher total returns than the properties they are replacing. As a result, EPRA profit before tax was £22.2 million, 27.6% higher than last year and, looking ahead, we expect that the income statement will be significantly enhanced next year by the additional rental income we have created through successful leasing of our development schemes and our accretive acquisitions.
0
35
10
20
30
5
EPRA profit before tax1
£m
March-12 Rental income and JV fees
JV profits Property costs
Admin costs
Net interest
March-13
1. Adjusted per EPRA guidance.
17.4
11.21.5
-0.2-2.9
-4.822.2
15
25
Leasing activity remains strong and rental income from wholly-owned properties and joint venture fees for the year were £57.1 million and £6.1 million respectively, generating a combined income of £63.2 million, up 21.5% on last year. This increase predominantly resulted from our £271.0 million of accretive purchases in the year, the commencement of Double Negative’s lease in May 2012 at 160 Great Portland Street, W1 and solid asset management activity across our investment portfolio, offset by the £4.7 million receipt of the remainder of Telewest lease surrender in the prior year. Increased joint venture fees resulted from our development activities at 240 Blackfriars Road, SE1 for GRP. Adjusting for acquisitions, disposals and transfers to and from the development programme, like-for-like rental income (including from joint venture properties) increased 3.2% on the prior year.
Our financial results
EPRA net assets per share of 446 pence, an increase of 10.7% over the year.“
”
Annual Report 2013 Great Portland Estates 39
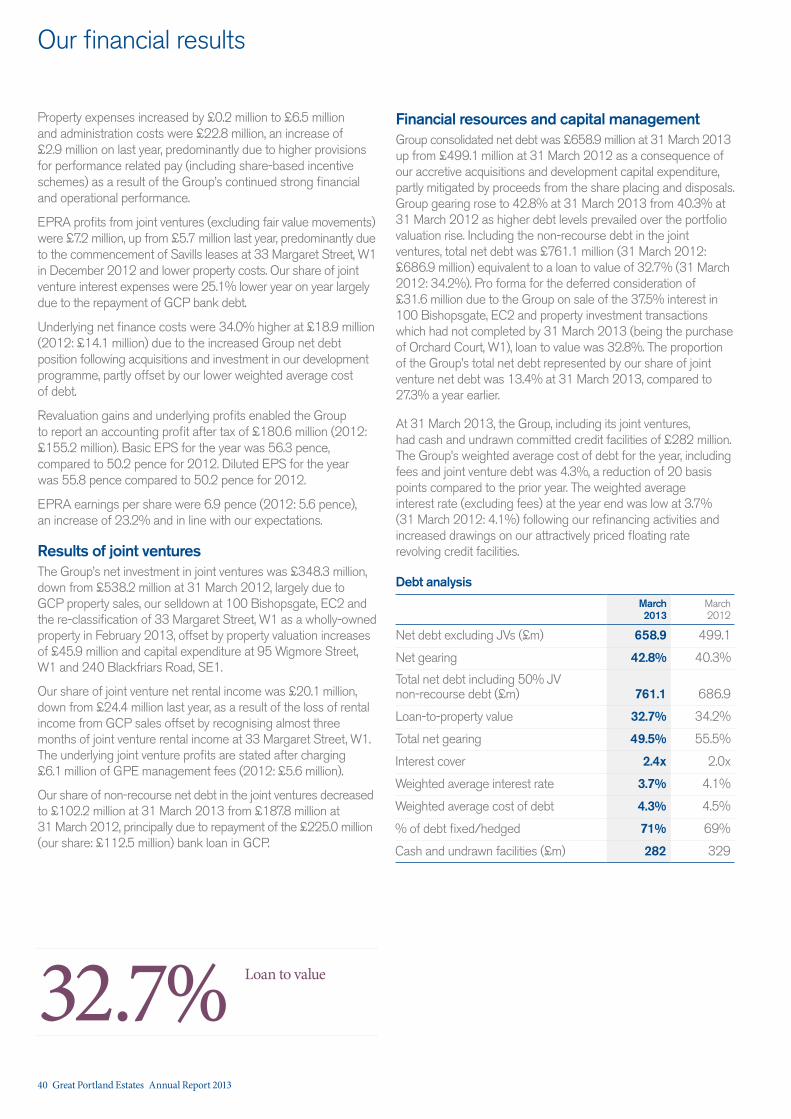
Our financial results
Property expenses increased by £0.2 million to £6.5 million and administration costs were £22.8 million, an increase of £2.9 million on last year, predominantly due to higher provisions for performance related pay (including share-based incentive schemes) as a result of the Group’s continued strong financial and operational performance.
EPRA profits from joint ventures (excluding fair value movements) were £7.2 million, up from £5.7 million last year, predominantly due to the commencement of Savills leases at 33 Margaret Street, W1 in December 2012 and lower property costs. Our share of joint venture interest expenses were 25.1% lower year on year largely due to the repayment of GCP bank debt.
Underlying net finance costs were 34.0% higher at £18.9 million (2012: £14.1 million) due to the increased Group net debt position following acquisitions and investment in our development programme, partly offset by our lower weighted average cost of debt.
Revaluation gains and underlying profits enabled the Group to report an accounting profit after tax of £180.6 million (2012: £155.2 million). Basic EPS for the year was 56.3 pence, compared to 50.2 pence for 2012. Diluted EPS for the year was 55.8 pence compared to 50.2 pence for 2012.
EPRA earnings per share were 6.9 pence (2012: 5.6 pence), an increase of 23.2% and in line with our expectations.
Results of joint venturesThe Group’s net investment in joint ventures was £348.3 million, down from £538.2 million at 31 March 2012, largely due to GCP property sales, our selldown at 100 Bishopsgate, EC2 and the re-classification of 33 Margaret Street, W1 as a wholly-owned property in February 2013, offset by property valuation increases of £45.9 million and capital expenditure at 95 Wigmore Street, W1 and 240 Blackfriars Road, SE1.
Our share of joint venture net rental income was £20.1 million, down from £24.4 million last year, as a result of the loss of rental income from GCP sales offset by recognising almost three months of joint venture rental income at 33 Margaret Street, W1. The underlying joint venture profits are stated after charging £6.1 million of GPE management fees (2012: £5.6 million).
Our share of non-recourse net debt in the joint ventures decreased to £102.2 million at 31 March 2013 from £187.8 million at 31 March 2012, principally due to repayment of the £225.0 million (our share: £112.5 million) bank loan in GCP.
Financial resources and capital managementGroup consolidated net debt was £658.9 million at 31 March 2013 up from £499.1 million at 31 March 2012 as a consequence of our accretive acquisitions and development capital expenditure, partly mitigated by proceeds from the share placing and disposals. Group gearing rose to 42.8% at 31 March 2013 from 40.3% at 31 March 2012 as higher debt levels prevailed over the portfolio valuation rise. Including the non-recourse debt in the joint ventures, total net debt was £761.1 million (31 March 2012: £686.9 million) equivalent to a loan to value of 32.7% (31 March 2012: 34.2%). Pro forma for the deferred consideration of £31.6 million due to the Group on sale of the 37.5% interest in 100 Bishopsgate, EC2 and property investment transactions which had not completed by 31 March 2013 (being the purchase of Orchard Court, W1), loan to value was 32.8%. The proportion of the Group’s total net debt represented by our share of joint venture net debt was 13.4% at 31 March 2013, compared to 27.3% a year earlier.
At 31 March 2013, the Group, including its joint ventures, had cash and undrawn committed credit facilities of £282 million. The Group’s weighted average cost of debt for the year, including fees and joint venture debt was 4.3%, a reduction of 20 basis points compared to the prior year. The weighted average interest rate (excluding fees) at the year end was low at 3.7% (31 March 2012: 4.1%) following our refinancing activities and increased drawings on our attractively priced floating rate revolving credit facilities.
Debt analysis
March 2013
March 2012
Net debt excluding JVs (£m) 658.9 499.1
Net gearing 42.8% 40.3%
Total net debt including 50% JV non-recourse debt (£m) 761.1 686.9
Loan-to-property value 32.7% 34.2%
Total net gearing 49.5% 55.5%
Interest cover 2.4x 2.0x
Weighted average interest rate 3.7% 4.1%
Weighted average cost of debt 4.3% 4.5%
% of debt fixed/hedged 71% 69%
Cash and undrawn facilities (£m) 282 329
32.7% Loan to value
40 Great Portland Estates Annual Report 2013
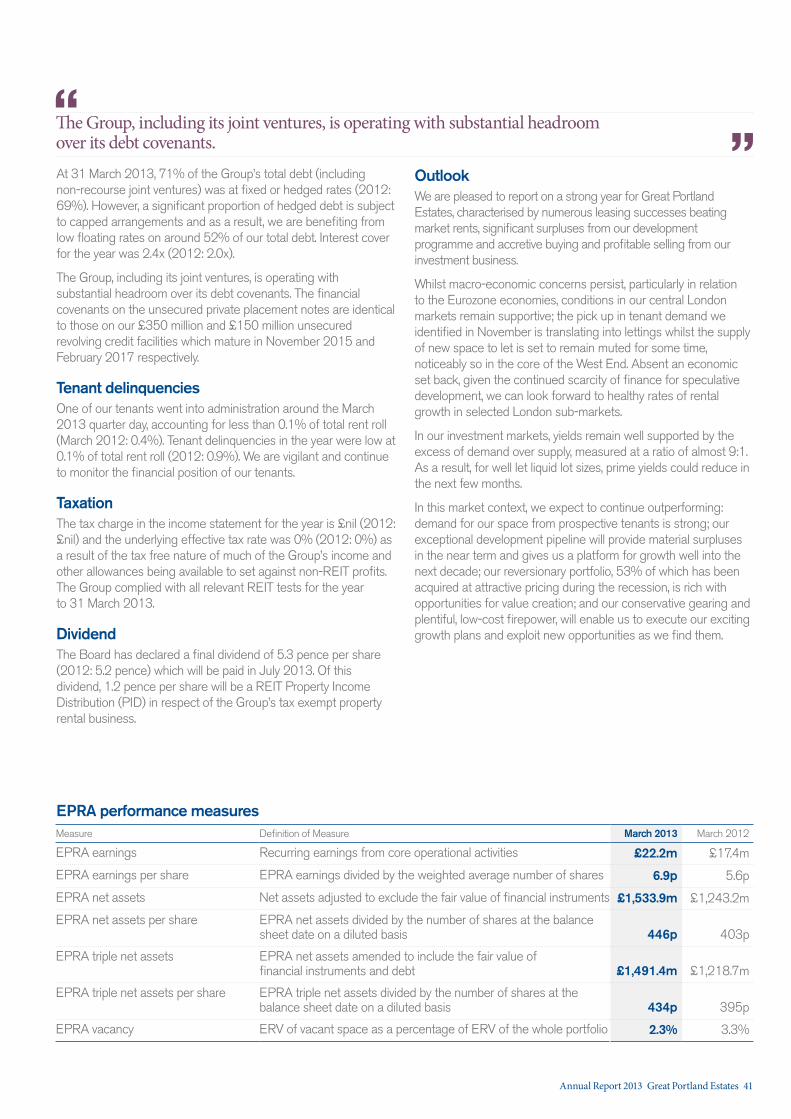
At 31 March 2013, 71% of the Group’s total debt (including non-recourse joint ventures) was at fixed or hedged rates (2012: 69%). However, a significant proportion of hedged debt is subject to capped arrangements and as a result, we are benefiting from low floating rates on around 52% of our total debt. Interest cover for the year was 2.4x (2012: 2.0x).
The Group, including its joint ventures, is operating with substantial headroom over its debt covenants. The financial covenants on the unsecured private placement notes are identical to those on our £350 million and £150 million unsecured revolving credit facilities which mature in November 2015 and February 2017 respectively.
Tenant delinquenciesOne of our tenants went into administration around the March 2013 quarter day, accounting for less than 0.1% of total rent roll (March 2012: 0.4%). Tenant delinquencies in the year were low at 0.1% of total rent roll (2012: 0.9%). We are vigilant and continue to monitor the financial position of our tenants.
TaxationThe tax charge in the income statement for the year is £nil (2012: £nil) and the underlying effective tax rate was 0% (2012: 0%) as a result of the tax free nature of much of the Group’s income and other allowances being available to set against non-REIT profits. The Group complied with all relevant REIT tests for the year to 31 March 2013.
DividendThe Board has declared a final dividend of 5.3 pence per share (2012: 5.2 pence) which will be paid in July 2013. Of this dividend, 1.2 pence per share will be a REIT Property Income Distribution (PID) in respect of the Group’s tax exempt property rental business.
Outlook We are pleased to report on a strong year for Great Portland Estates, characterised by numerous leasing successes beating market rents, significant surpluses from our development programme and accretive buying and profitable selling from our investment business.
Whilst macro-economic concerns persist, particularly in relation to the Eurozone economies, conditions in our central London markets remain supportive; the pick up in tenant demand we identified in November is translating into lettings whilst the supply of new space to let is set to remain muted for some time, noticeably so in the core of the West End. Absent an economic set back, given the continued scarcity of finance for speculative development, we can look forward to healthy rates of rental growth in selected London sub-markets.
In our investment markets, yields remain well supported by the excess of demand over supply, measured at a ratio of almost 9:1. As a result, for well let liquid lot sizes, prime yields could reduce in the next few months.
In this market context, we expect to continue outperforming: demand for our space from prospective tenants is strong; our exceptional development pipeline will provide material surpluses in the near term and gives us a platform for growth well into the next decade; our reversionary portfolio, 53% of which has been acquired at attractive pricing during the recession, is rich with opportunities for value creation; and our conservative gearing and plentiful, low-cost firepower, will enable us to execute our exciting growth plans and exploit new opportunities as we find them.
EPRA performance measuresMeasure Definition of Measure March 2013 March 2012
EPRA earnings Recurring earnings from core operational activities £22.2m £17.4m
EPRA earnings per share EPRA earnings divided by the weighted average number of shares 6.9p 5.6p
EPRA net assets Net assets adjusted to exclude the fair value of financial instruments £1,533.9m £1,243.2m
EPRA net assets per share EPRA net assets divided by the number of shares at the balance sheet date on a diluted basis 446p 403p
EPRA triple net assets EPRA net assets amended to include the fair value of financial instruments and debt £1,491.4m £1,218.7m
EPRA triple net assets per share EPRA triple net assets divided by the number of shares at the balance sheet date on a diluted basis 434p 395p
EPRA vacancy ERV of vacant space as a percentage of ERV of the whole portfolio 2.3% 3.3%
The Group, including its joint ventures, is operating with substantial headroom over its debt covenants. “
”
Annual Report 2013 Great Portland Estates 41
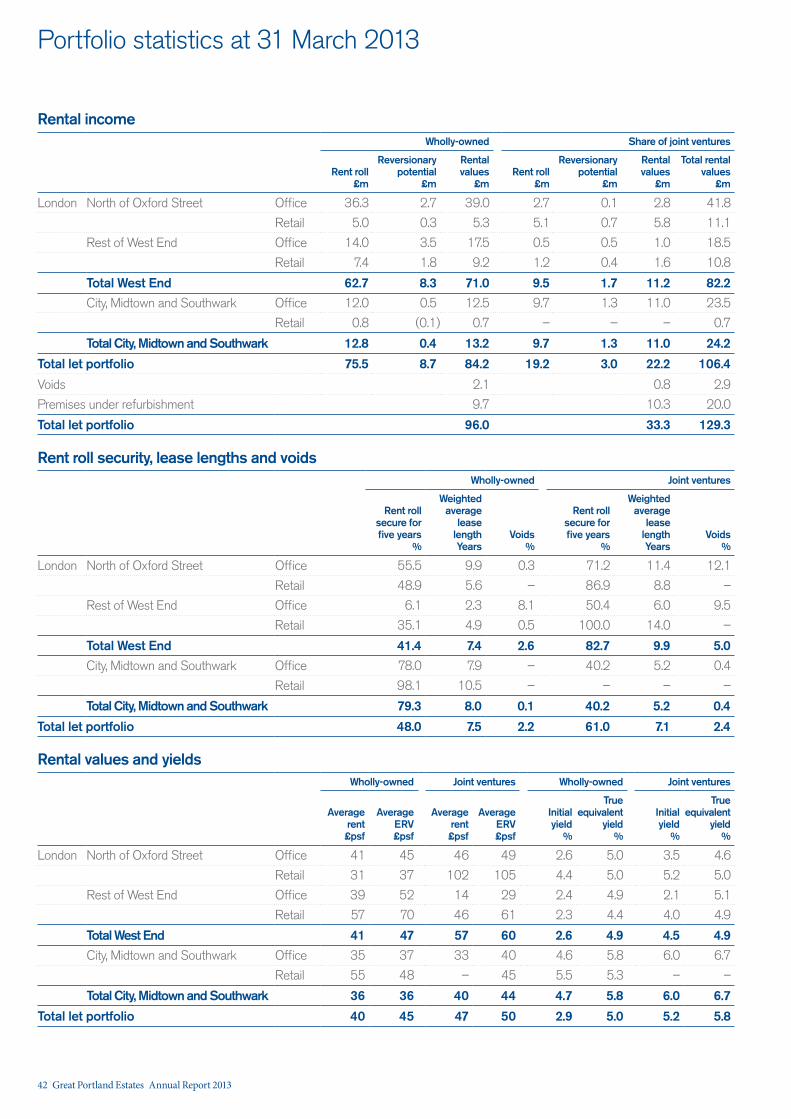
Portfolio statistics at 31 March 2013
Rental incomeWholly-owned Share of joint ventures
Rent roll £m
Reversionary potential
£m
Rental values
£mRent roll
£m
Reversionary potential
£m
Rental values
£m
Total rental values
£m
London North of Oxford Street Office 36.3 2.7 39.0 2.7 0.1 2.8 41.8
Retail 5.0 0.3 5.3 5.1 0.7 5.8 11.1
Rest of West End Office 14.0 3.5 17.5 0.5 0.5 1.0 18.5
Retail 7.4 1.8 9.2 1.2 0.4 1.6 10.8
Total West End 62.7 8.3 71.0 9.5 1.7 11.2 82.2 City, Midtown and Southwark Office 12.0 0.5 12.5 9.7 1.3 11.0 23.5
Retail 0.8 (0.1) 0.7 – – – 0.7
Total City, Midtown and Southwark 12.8 0.4 13.2 9.7 1.3 11.0 24.2
Total let portfolio 75.5 8.7 84.2 19.2 3.0 22.2 106.4
Voids 2.1 0.8 2.9
Premises under refurbishment 9.7 10.3 20.0
Total let portfolio 96.0 33.3 129.3
Rent roll security, lease lengths and voidsWholly-owned Joint ventures
Rent roll secure for five years
%
Weighted average
lease length Years
Voids %
Rent roll secure for five years
%
Weighted average
lease length Years
Voids %
London North of Oxford Street Office 55.5 9.9 0.3 71.2 11.4 12.1
Retail 48.9 5.6 – 86.9 8.8 –
Rest of West End Office 6.1 2.3 8.1 50.4 6.0 9.5
Retail 35.1 4.9 0.5 100.0 14.0 –
Total West End 41.4 7.4 2.6 82.7 9.9 5.0 City, Midtown and Southwark Office 78.0 7.9 – 40.2 5.2 0.4
Retail 98.1 10.5 – – – –
Total City, Midtown and Southwark 79.3 8.0 0.1 40.2 5.2 0.4
Total let portfolio 48.0 7.5 2.2 61.0 7.1 2.4
Rental values and yieldsWholly-owned Joint ventures Wholly-owned Joint ventures
Average rent £psf
Average ERV £psf
Average rent £psf
Average ERV £psf
Initial yield
%
True equivalent
yield %
Initial yield
%
True equivalent
yield %
London North of Oxford Street Office 41 45 46 49 2.6 5.0 3.5 4.6
Retail 31 37 102 105 4.4 5.0 5.2 5.0
Rest of West End Office 39 52 14 29 2.4 4.9 2.1 5.1
Retail 57 70 46 61 2.3 4.4 4.0 4.9
Total West End 41 47 57 60 2.6 4.9 4.5 4.9City, Midtown and Southwark Office 35 37 33 40 4.6 5.8 6.0 6.7
Retail 55 48 – 45 5.5 5.3 – –
Total City, Midtown and Southwark 36 36 40 44 4.7 5.8 6.0 6.7
Total let portfolio 40 45 47 50 2.9 5.0 5.2 5.8
42 Great Portland Estates Annual Report 2013
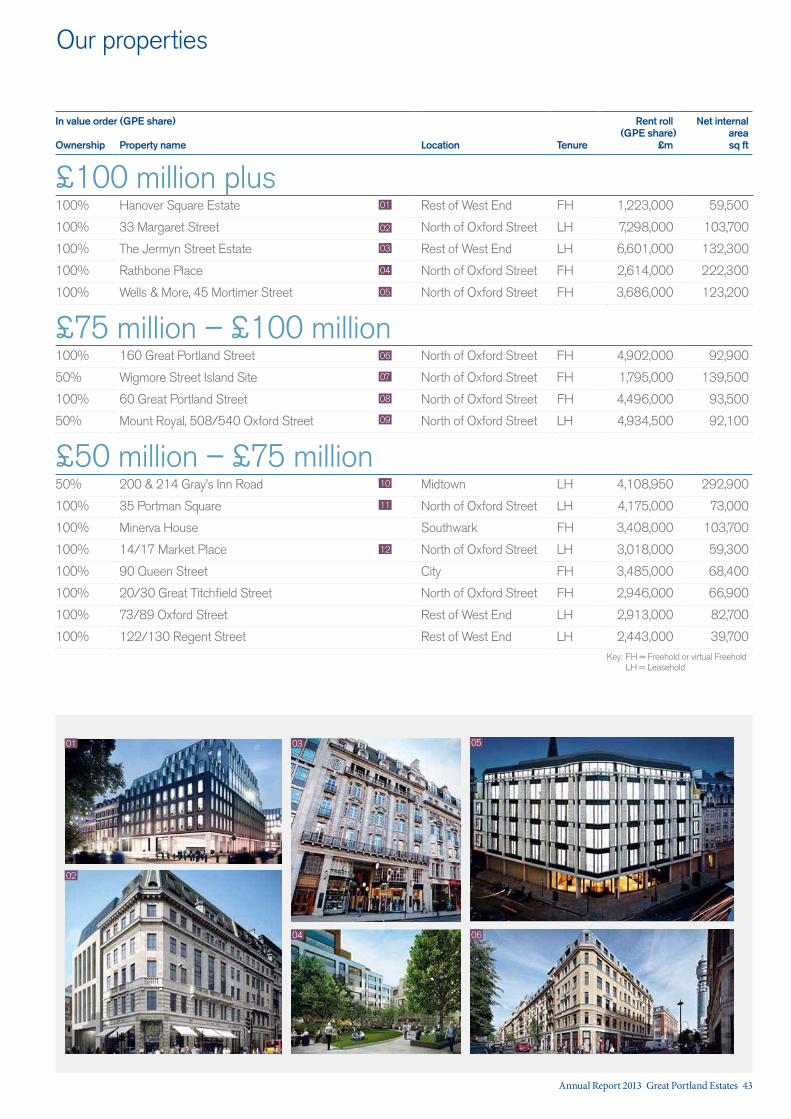
Our properties
In value order (GPE share)
Location Tenure
Rent roll (GPE share)
£m
Net internal area sq ftOwnership Property name
£100 million plus100% Hanover Square Estate Rest of West End FH 1,223,000 59,500
100% 33 Margaret Street North of Oxford Street LH 7,298,000 103,700
100% The Jermyn Street Estate Rest of West End LH 6,601,000 132,300
100% Rathbone Place North of Oxford Street FH 2,614,000 222,300
100% Wells & More, 45 Mortimer Street North of Oxford Street FH 3,686,000 123,200
£75 million – £100 million100% 160 Great Portland Street North of Oxford Street FH 4,902,000 92,900
50% Wigmore Street Island Site North of Oxford Street FH 1,795,000 139,500
100% 60 Great Portland Street North of Oxford Street FH 4,496,000 93,500
50% Mount Royal, 508/540 Oxford Street North of Oxford Street LH 4,934,500 92,100
£50 million – £75 million50% 200 & 214 Gray’s Inn Road Midtown LH 4,108,950 292,900
100% 35 Portman Square North of Oxford Street LH 4,175,000 73,000
100% Minerva House Southwark FH 3,408,000 103,700
100% 14/17 Market Place North of Oxford Street LH 3,018,000 59,300
100% 90 Queen Street City FH 3,485,000 68,400
100% 20/30 Great Titchfield Street North of Oxford Street FH 2,946,000 66,900
100% 73/89 Oxford Street Rest of West End LH 2,913,000 82,700
100% 122/130 Regent Street Rest of West End LH 2,443,000 39,700
01
01
05
11
06
10
04
09
12
02
03
07
08
02
05
04 06
Key: FH = Freehold or virtual Freehold LH = Leasehold
03
Annual Report 2013 Great Portland Estates 43
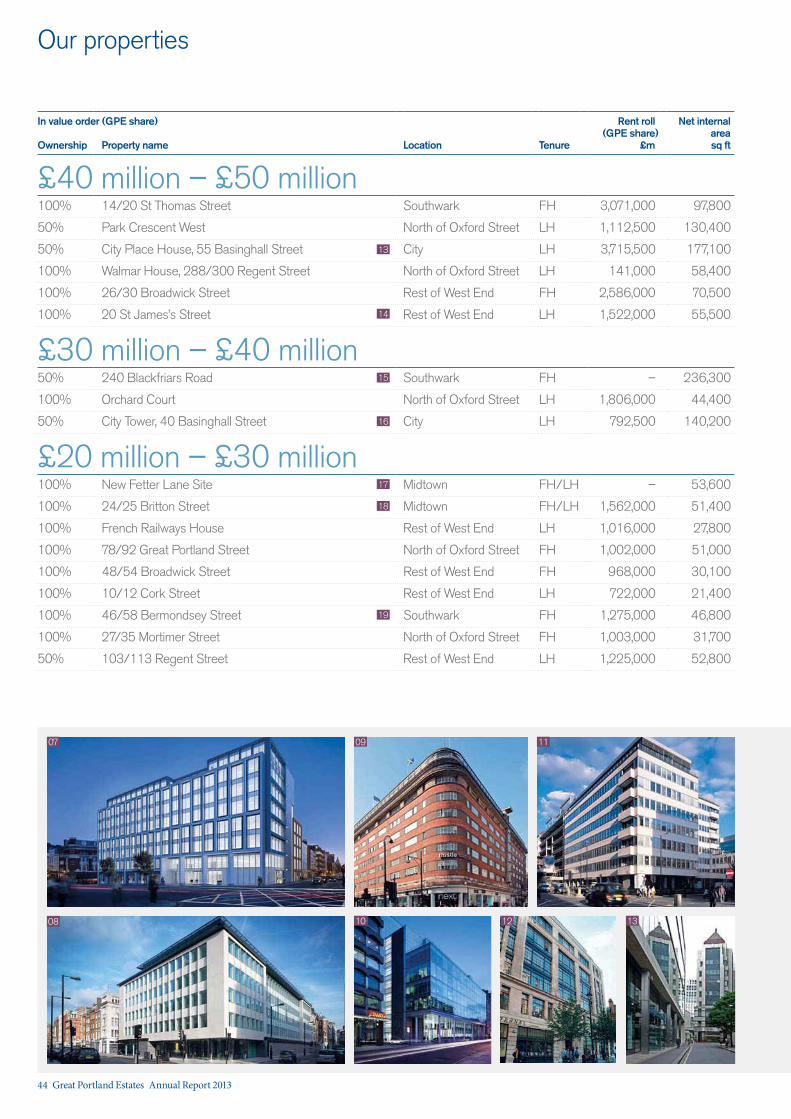
Our properties
In value order (GPE share)
Location Tenure
Rent roll (GPE share)
£m
Net internal area sq ftOwnership Property name
£40 million – £50 million100% 14/20 St Thomas Street Southwark FH 3,071,000 97,800
50% Park Crescent West North of Oxford Street LH 1,112,500 130,400
50% City Place House, 55 Basinghall Street City LH 3,715,500 177,100
100% Walmar House, 288/300 Regent Street North of Oxford Street LH 141,000 58,400
100% 26/30 Broadwick Street Rest of West End FH 2,586,000 70,500
100% 20 St James’s Street Rest of West End LH 1,522,000 55,500
£30 million – £40 million50% 240 Blackfriars Road Southwark FH – 236,300
100% Orchard Court North of Oxford Street LH 1,806,000 44,400
50% City Tower, 40 Basinghall Street City LH 792,500 140,200
£20 million – £30 million100% New Fetter Lane Site Midtown FH/LH – 53,600
100% 24/25 Britton Street Midtown FH/LH 1,562,000 51,400
100% French Railways House Rest of West End LH 1,016,000 27,800
100% 78/92 Great Portland Street North of Oxford Street FH 1,002,000 51,000
100% 48/54 Broadwick Street Rest of West End FH 968,000 30,100
100% 10/12 Cork Street Rest of West End LH 722,000 21,400
100% 46/58 Bermondsey Street Southwark FH 1,275,000 46,800
100% 27/35 Mortimer Street North of Oxford Street FH 1,003,000 31,700
50% 103/113 Regent Street Rest of West End LH 1,225,000 52,800
14
17
19
18
13
16
15
08
07 09
12 13
11
10
44 Great Portland Estates Annual Report 2013
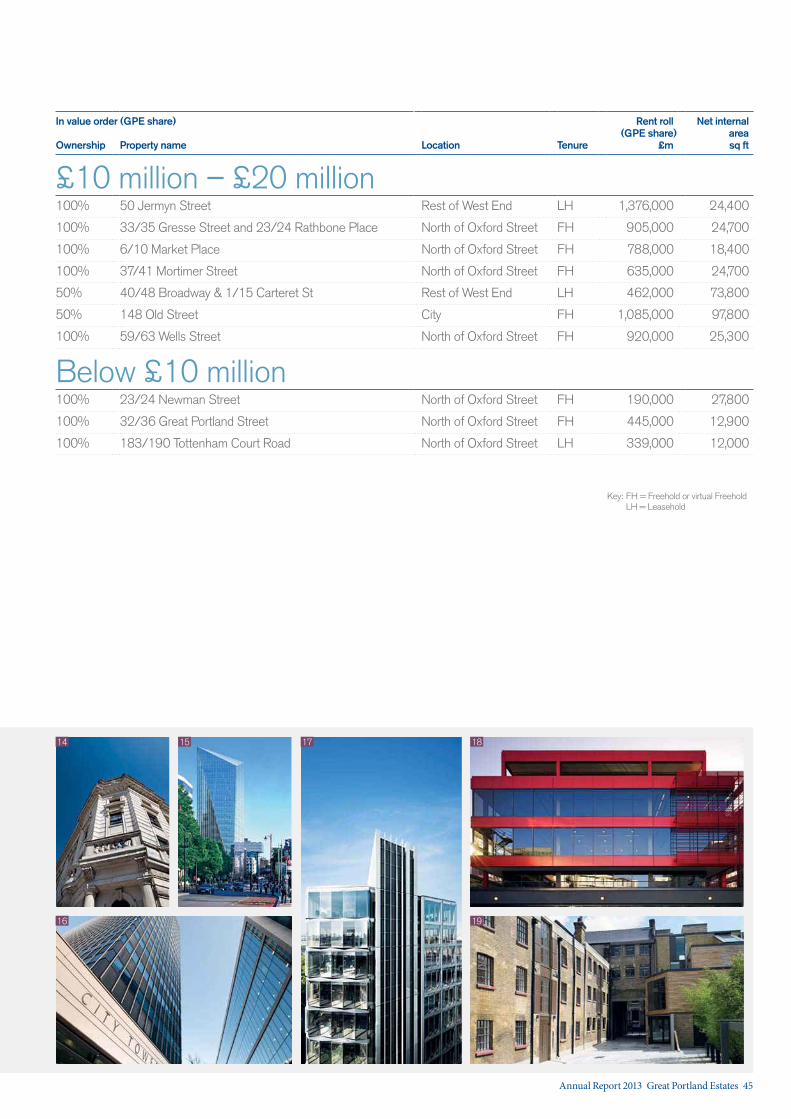
In value order (GPE share)
Location Tenure
Rent roll (GPE share)
£m
Net internal area sq ftOwnership Property name
£10 million – £20 million100% 50 Jermyn Street Rest of West End LH 1,376,000 24,400
100% 33/35 Gresse Street and 23/24 Rathbone Place North of Oxford Street FH 905,000 24,700
100% 6/10 Market Place North of Oxford Street FH 788,000 18,400
100% 37/41 Mortimer Street North of Oxford Street FH 635,000 24,700
50% 40/48 Broadway & 1/15 Carteret St Rest of West End LH 462,000 73,800
50% 148 Old Street City FH 1,085,000 97,800
100% 59/63 Wells Street North of Oxford Street FH 920,000 25,300
Below £10 million100% 23/24 Newman Street North of Oxford Street FH 190,000 27,800
100% 32/36 Great Portland Street North of Oxford Street FH 445,000 12,900
100% 183/190 Tottenham Court Road North of Oxford Street LH 339,000 12,000
14 17
16
1815
19
Key: FH = Freehold or virtual Freehold LH = Leasehold
Annual Report 2013 Great Portland Estates 45

Board of Directors
Charles Irby Non-Executive Director FCACommittee memberships: Senior Independent Director, Chairman of the Remuneration Committee, Member of the Audit Committee, Member of the Nomination CommitteeDate appointed to the Board: April 2004Independent: YesSkills and experience: Formerly Chairman of Aberdeen Asset Management and a Non-Executive Director of QBE following 27 years in corporate finance and investment banking at ING Barings. Age 67.Current external commitments: Non-Executive Director of North Atlantic Smaller Companies Investment Trust
Martin Scicluna ChairmanBComCommittee memberships: Chairman of the Nomination CommitteeDate appointed to the Board: October 2008Independent: YesSkills and experience: Chairman of RSA. Formerly Non-Executive Director and Chairman of the Audit Committee of Lloyds Banking Group following 34 years at Deloitte, including Chairman from 1995 to 2007. Age 62.Current external commitments: Chairman of RSA
Jonathan Nicholls Non-Executive Director BA (Hons), ACA, FCTCommittee memberships: Chairman of the Audit Committee, Member of the Remuneration Committee, Member of the Nomination CommitteeDate appointed to the Board: July 2009Independent: YesSkills and experience: Formerly Group Finance Director of Old Mutual plc and Hanson plc, and previously non-Executive Director of Man Group Plc. Age 55.Current external commitments: Non-Executive Director and Chairman of the Audit Committee of SIG Plc, Non-Executive Director and Chairman of the Audit Committee of DS Smith Plc
Toby Courtauld Chief Executive MA, MRICSCommittee memberships: Chairman of the Executive Committee, Chairman of the Environmental Policy CommitteeDate appointed to the Board: April 2002Independent: NoSkills and experience: Joined the Group in April 2002 as Chief Executive. Previously with the property company MEPC for 11 years, he gained broad experience ranging from portfolio management through to corporate transactions and general management as a member of the Group Executive Committee. Age 45.Current external commitments: Member of the British Property Federation Board and Policy Committee, Member of the Management Board of the Investment Property Forum, Director of The New West End Company, Non-Executive Director of Live-Ex Limited
46 Great Portland Estates Annual Report 2013

Jonathan Short Non-Executive Director BSc, ACIB, FRICSCommittee memberships: Member of the Audit Committee, Member of the Remuneration CommitteeDate appointed to the Board: March 2006
Independent: YesSkills and experience: Founding Partner of Internos Global Investors LLP, a pan-European real estate investment management business. Previously CEO of Pramerica’s real estate private equity business following 16 years in investment banking at Lazard, Barings and SG Warburg. Formerly a Non-Executive Director of Big Yellow Group plc. Age 51.
Current external commitments: Executive Chairman of Internos Global Investors LLP, Independent Director to the Grosvenor Shopping Centre Fund
Nick Sanderson Finance Director BA (Hons), ACACommittee memberships: Member of the Executive Committee
Date appointed to the Board: July 2011Independent: NoSkills and experience: Joined the Group in July 2011 as Finance Director. Formerly Partner, Head of Real Estate Corporate Finance Advisory at Deloitte, following ten years of real estate investment banking experience in Europe and Asia with Nomura, Lehman Brothers and UBS Investment Bank. Age 40.
Current external commitments: Member of the Finance Committee of the British Property Federation, Member of the Reporting & Accounting Committee of EPRA
Elizabeth Holden Non-Executive DirectorMA (Hons)Committee memberships: Member of the Audit Committee, Member of the Remuneration CommitteeDate appointed to the Board: September 2012
Independent: YesSkills and experience: Formerly a corporate partner at Slaughter and May specialising in mergers & acquisitions, corporate advisory and governance matters. Age 45.
Current external commitments: None
Neil Thompson Portfolio Director BSc (Hons), MRICSCommittee memberships: Member of the Executive Committee, Chairman of the Health and Safety, Environmental and Corporate Responsibility Working Group
Date appointed to the Board: August 2006Independent: NoSkills and experience: Joined the Group in December 2002 and was appointed to the Board as Development Director in August 2006, becoming Portfolio Director in September 2010. He has worked for more than 20 years in the central London commercial property market. Formerly with Derwent Valley and Legal and General Investment Management. Age 45.
Current external commitments: Senior Vice President and Member of the Management Board of the British Council of Offices, Member of the Operations Working Group of the Westminster Property Association
Annual Report 2013 Great Portland Estates 47

Our people
How we operateOur culture is entrepreneurial and pragmatic, with a high level of involvement from senior and executive management and an emphasis on cross discipline teamwork. We recognise the benefits of such a positive culture and work hard to maintain it through:
— a flat management structure;
— regular and effective communication with an ‘open door’ policy;
— a formal induction process for new joiners;
— regular meetings held weekly, monthly and quarterly across the various teams on different aspects of the business;
— encouraging our people to be innovative, to think outside the box and have a ‘can do’ attitude;
— a disciplined approach – providing clear policies and procedures and instilling a strong sense of responsibility for active risk management;
— a collegiate style, with recognition of a project’s success being based upon the contribution and smooth interaction of every member of the team;
— recruiting high quality individuals with a constructive mindset and valuable experience;
— matching the right people to the right roles and taking action where there are gaps;
— an effective performance management system;
— providing well constructed and fair reward systems designed to incentivise superior performance and align employees’ and shareholders’ interests;
— ensuring continual improvement of the skills and competency of our employees at all levels and across all disciplines through appropriate training and development courses; and
— fostering a friendly environment which engenders a strong camaraderie.
Our teamOur team brings together specialist skills used to manage our portfolio on an asset by asset basis to ensure the achievement of our strategic priorities across the lifecycle of our buildings.
For more on what our teams have done during the year see:
+Investment management page 30
+Development management page 32
+Asset management page 34
+Financial management page 36
Our team brings together specialist skills used to manage our portfolio on an asset by asset basis to deliver our strategic priorities.
Operational measures
2013 2012
Employee retention 94% 87%
Days training provided per employee 2.9 2.3
Employees participating in Share Incentive Plan 73% 78%
Our company culture lies at the heart of our ability to achieve our strategic priorities. It drives our operational success and helps us attract, develop, motivate and retain our talented employees. Toby Courtauld Chief Executive
“
”
48 Great Portland Estates Annual Report 2013
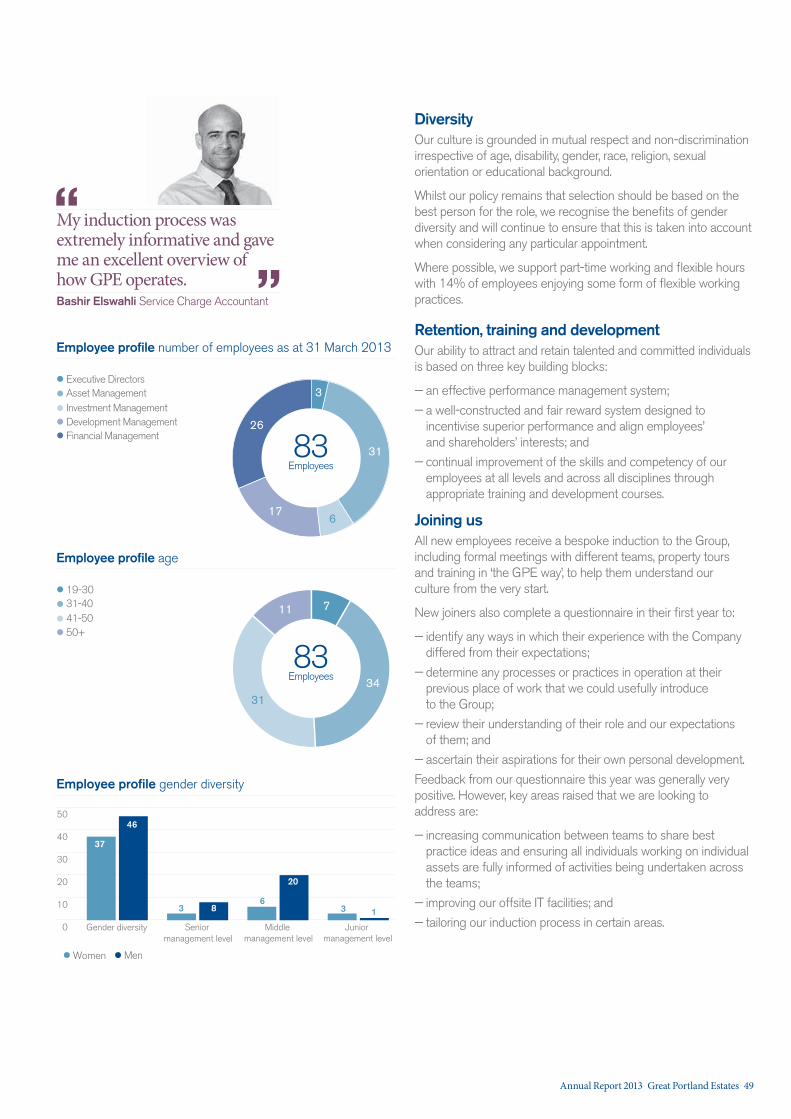
DiversityOur culture is grounded in mutual respect and non-discrimination irrespective of age, disability, gender, race, religion, sexual orientation or educational background.
Whilst our policy remains that selection should be based on the best person for the role, we recognise the benefits of gender diversity and will continue to ensure that this is taken into account when considering any particular appointment.
Where possible, we support part-time working and flexible hours with 14% of employees enjoying some form of flexible working practices.
Retention, training and developmentOur ability to attract and retain talented and committed individuals is based on three key building blocks:
— an effective performance management system;
— a well-constructed and fair reward system designed to incentivise superior performance and align employees’ and shareholders’ interests; and
— continual improvement of the skills and competency of our employees at all levels and across all disciplines through appropriate training and development courses.
Joining usAll new employees receive a bespoke induction to the Group, including formal meetings with different teams, property tours and training in ‘the GPE way’, to help them understand our culture from the very start.
New joiners also complete a questionnaire in their first year to:
— identify any ways in which their experience with the Company differed from their expectations;
— determine any processes or practices in operation at their previous place of work that we could usefully introduce to the Group;
— review their understanding of their role and our expectations of them; and
— ascertain their aspirations for their own personal development.
Feedback from our questionnaire this year was generally very positive. However, key areas raised that we are looking to address are:
— increasing communication between teams to share best practice ideas and ensuring all individuals working on individual assets are fully informed of activities being undertaken across the teams;
— improving our offsite IT facilities; and
— tailoring our induction process in certain areas.
83Employees
Employee profile age
19-3031-4041-5050+
7
31
11
34
0
50
30
20
Employee profile gender diversity
Gender diversity Senior management level
Middle management level
Junior management level
4037
46
86
3
20
3 1
Women Men
10
Employee profile number of employees as at 31 March 2013
Executive DirectorsAsset ManagementInvestment ManagementDevelopment Management
3
6
26
31Financial Management
17
83Employees
My induction process was extremely informative and gave me an excellent overview of how GPE operates.Bashir Elswahli Service Charge Accountant
“
”
Annual Report 2013 Great Portland Estates 49
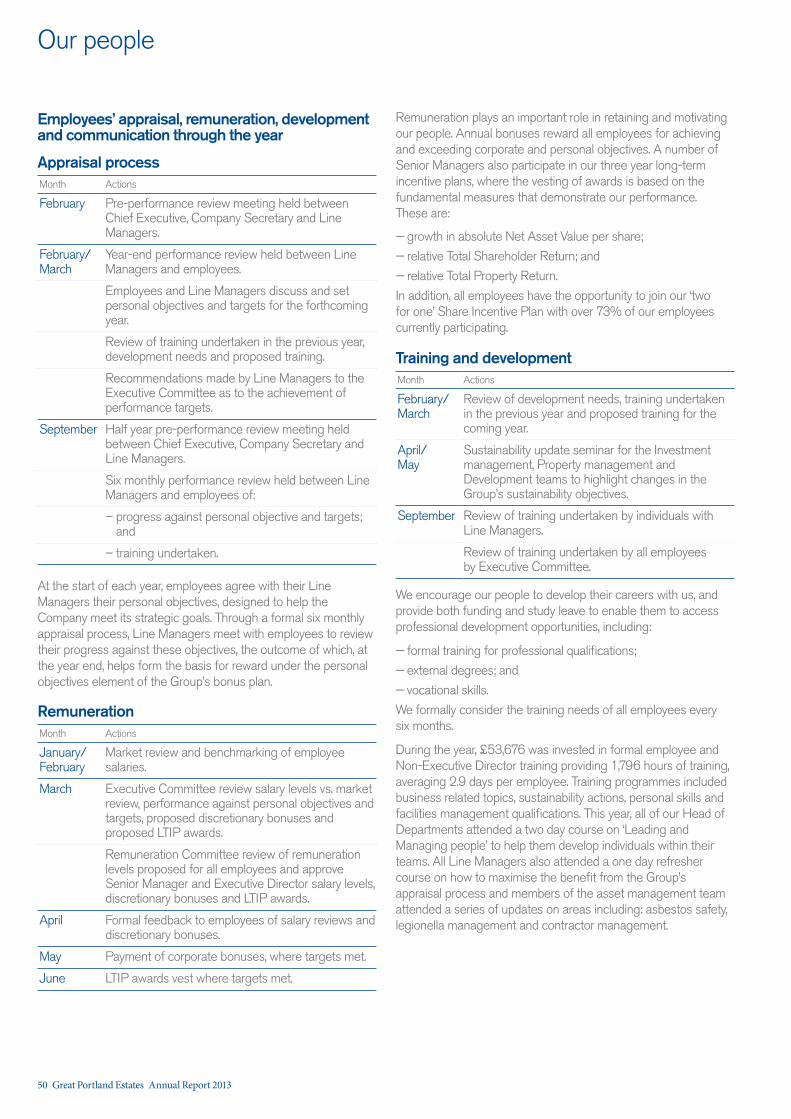
Our people
Employees’ appraisal, remuneration, development and communication through the year
Appraisal processMonth Actions
February Pre-performance review meeting held between Chief Executive, Company Secretary and Line Managers.
February/March
Year-end performance review held between Line Managers and employees.
Employees and Line Managers discuss and set personal objectives and targets for the forthcoming year.
Review of training undertaken in the previous year, development needs and proposed training.
Recommendations made by Line Managers to the Executive Committee as to the achievement of performance targets.
September Half year pre-performance review meeting held between Chief Executive, Company Secretary and Line Managers.
Six monthly performance review held between Line Managers and employees of:
– progress against personal objective and targets; and
– training undertaken.
At the start of each year, employees agree with their Line Managers their personal objectives, designed to help the Company meet its strategic goals. Through a formal six monthly appraisal process, Line Managers meet with employees to review their progress against these objectives, the outcome of which, at the year end, helps form the basis for reward under the personal objectives element of the Group’s bonus plan.
RemunerationMonth Actions
January/February
Market review and benchmarking of employee salaries.
March Executive Committee review salary levels vs. market review, performance against personal objectives and targets, proposed discretionary bonuses and proposed LTIP awards.
Remuneration Committee review of remuneration levels proposed for all employees and approve Senior Manager and Executive Director salary levels, discretionary bonuses and LTIP awards.
April Formal feedback to employees of salary reviews and discretionary bonuses.
May Payment of corporate bonuses, where targets met.
June LTIP awards vest where targets met.
Remuneration plays an important role in retaining and motivating our people. Annual bonuses reward all employees for achieving and exceeding corporate and personal objectives. A number of Senior Managers also participate in our three year long-term incentive plans, where the vesting of awards is based on the fundamental measures that demonstrate our performance. These are:
— growth in absolute Net Asset Value per share;
— relative Total Shareholder Return; and
— relative Total Property Return.
In addition, all employees have the opportunity to join our ‘two for one’ Share Incentive Plan with over 73% of our employees currently participating.
Training and developmentMonth Actions
February/ March
Review of development needs, training undertaken in the previous year and proposed training for the coming year.
April/ May
Sustainability update seminar for the Investment management, Property management and Development teams to highlight changes in the Group’s sustainability objectives.
September Review of training undertaken by individuals with Line Managers.
Review of training undertaken by all employees by Executive Committee.
We encourage our people to develop their careers with us, and provide both funding and study leave to enable them to access professional development opportunities, including:
— formal training for professional qualifications;
— external degrees; and
— vocational skills.
We formally consider the training needs of all employees every six months.
During the year, £53,676 was invested in formal employee and Non-Executive Director training providing 1,796 hours of training, averaging 2.9 days per employee. Training programmes included business related topics, sustainability actions, personal skills and facilities management qualifications. This year, all of our Head of Departments attended a two day course on ‘Leading and Managing people’ to help them develop individuals within their teams. All Line Managers also attended a one day refresher course on how to maximise the benefit from the Group’s appraisal process and members of the asset management team attended a series of updates on areas including: asbestos safety, legionella management and contractor management.
50 Great Portland Estates Annual Report 2013
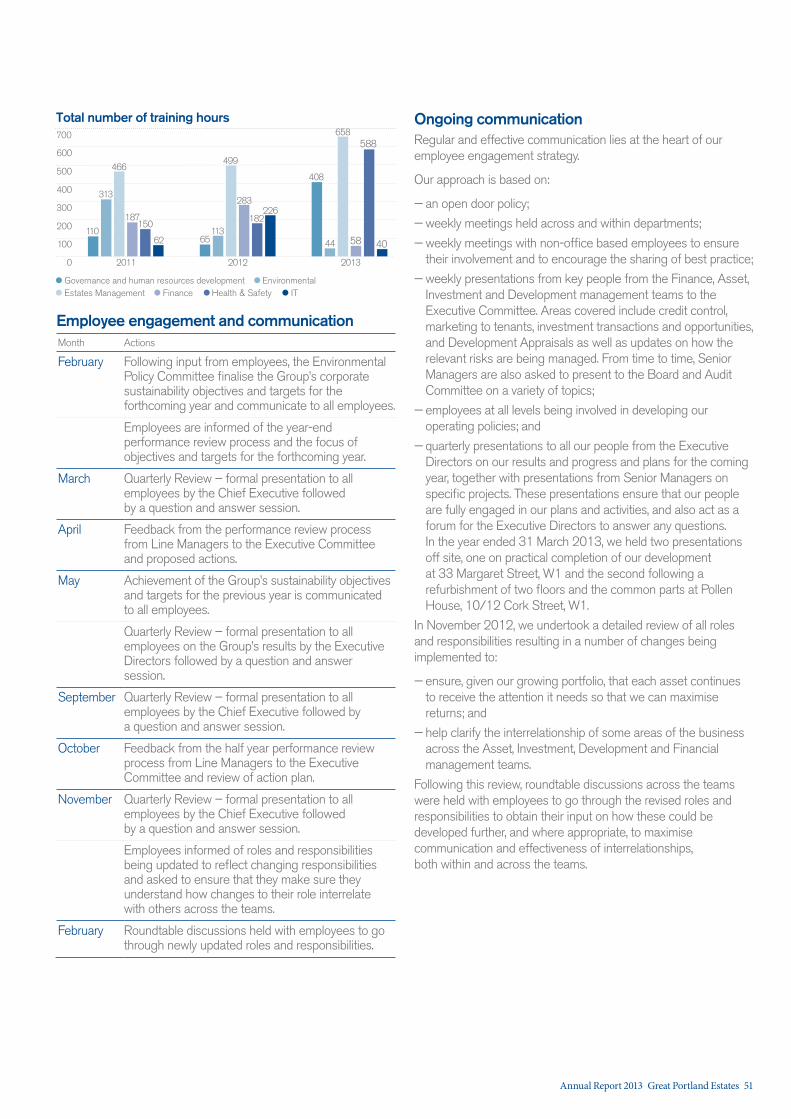
Employee engagement and communicationMonth Actions
February Following input from employees, the Environmental Policy Committee finalise the Group’s corporate sustainability objectives and targets for the forthcoming year and communicate to all employees.
Employees are informed of the year-end performance review process and the focus of objectives and targets for the forthcoming year.
March Quarterly Review – formal presentation to all employees by the Chief Executive followed by a question and answer session.
April Feedback from the performance review process from Line Managers to the Executive Committee and proposed actions.
May Achievement of the Group’s sustainability objectives and targets for the previous year is communicated to all employees.
Quarterly Review – formal presentation to all employees on the Group’s results by the Executive Directors followed by a question and answer session.
September Quarterly Review – formal presentation to all employees by the Chief Executive followed by a question and answer session.
October Feedback from the half year performance review process from Line Managers to the Executive Committee and review of action plan.
November Quarterly Review – formal presentation to all employees by the Chief Executive followed by a question and answer session.
Employees informed of roles and responsibilities being updated to reflect changing responsibilities and asked to ensure that they make sure they understand how changes to their role interrelate with others across the teams.
February Roundtable discussions held with employees to go through newly updated roles and responsibilities.
Ongoing communicationRegular and effective communication lies at the heart of our employee engagement strategy.
Our approach is based on:
— an open door policy;
— weekly meetings held across and within departments;
— weekly meetings with non-office based employees to ensure their involvement and to encourage the sharing of best practice;
— weekly presentations from key people from the Finance, Asset, Investment and Development management teams to the Executive Committee. Areas covered include credit control, marketing to tenants, investment transactions and opportunities, and Development Appraisals as well as updates on how the relevant risks are being managed. From time to time, Senior Managers are also asked to present to the Board and Audit Committee on a variety of topics;
— employees at all levels being involved in developing our operating policies; and
— quarterly presentations to all our people from the Executive Directors on our results and progress and plans for the coming year, together with presentations from Senior Managers on specific projects. These presentations ensure that our people are fully engaged in our plans and activities, and also act as a forum for the Executive Directors to answer any questions. In the year ended 31 March 2013, we held two presentations off site, one on practical completion of our development at 33 Margaret Street, W1 and the second following a refurbishment of two floors and the common parts at Pollen House, 10/12 Cork Street, W1.
In November 2012, we undertook a detailed review of all roles and responsibilities resulting in a number of changes being implemented to:
— ensure, given our growing portfolio, that each asset continues to receive the attention it needs so that we can maximise returns; and
— help clarify the interrelationship of some areas of the business across the Asset, Investment, Development and Financial management teams.
Following this review, roundtable discussions across the teams were held with employees to go through the revised roles and responsibilities to obtain their input on how these could be developed further, and where appropriate, to maximise communication and effectiveness of interrelationships, both within and across the teams.
Total number of training hours
2013
700
500
600
400
300
200
100
0
408
44
658
58
588
4065113
499
283
182226
110
313
466
187150
62
20122011
Governance and human resources development EnvironmentalEstates Management Finance Health & Safety IT
Annual Report 2013 Great Portland Estates 51
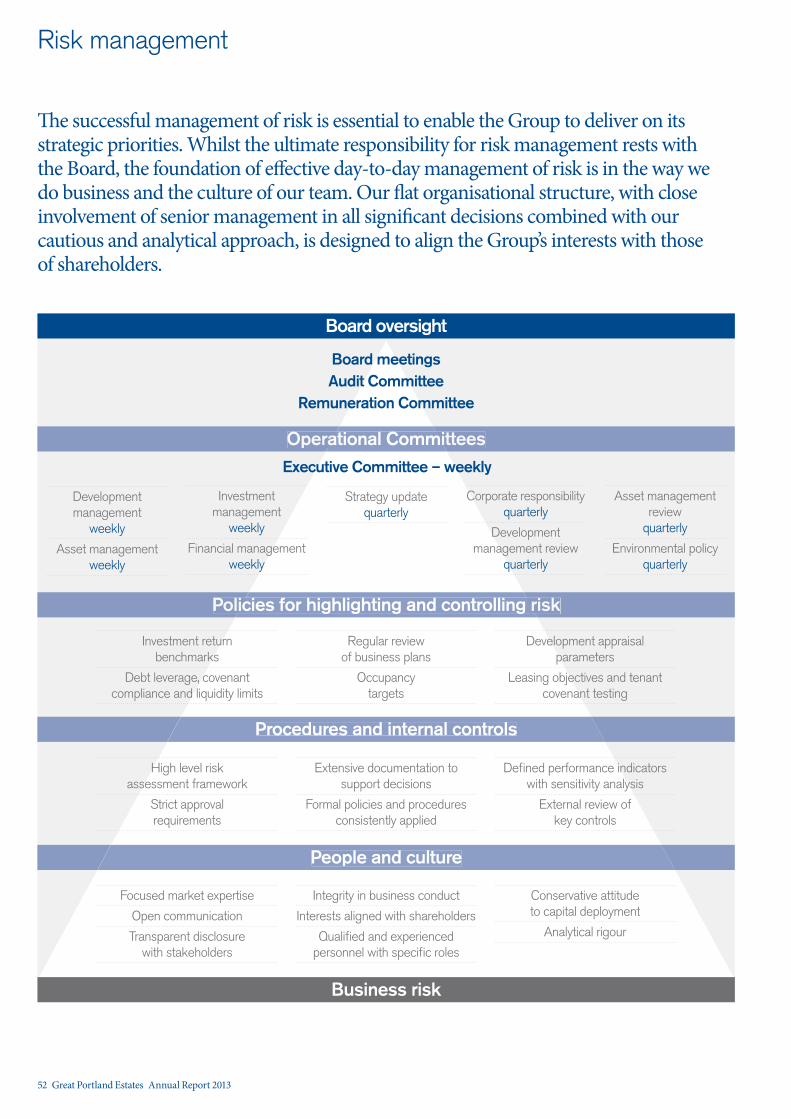
The successful management of risk is essential to enable the Group to deliver on its strategic priorities. Whilst the ultimate responsibility for risk management rests with the Board, the foundation of effective day-to-day management of risk is in the way we do business and the culture of our team. Our flat organisational structure, with close involvement of senior management in all significant decisions combined with our cautious and analytical approach, is designed to align the Group’s interests with those of shareholders.
Risk management
Board oversight
Operational Committeesational Commi
Policies for highlighting and controlling riskicies for highlighting and controlling r
Procedures and internal controls
People and culture
Business risk
Board meetingsAudit Committee
Remuneration Committee
Development management
weekly
Asset management weekly
Investment management
weekly
Financial management weekly
Strategy update quarterly
Corporate responsibility quarterly
Development management review
quarterly
Asset management review
quarterly
Environmental policy quarterly
Investment return benchmarks
Debt leverage, covenant compliance and liquidity limits
Regular review of business plans
Occupancy targets
Development appraisal parameters
Leasing objectives and tenant covenant testing
High level risk assessment framework
Strict approval requirements
Extensive documentation to support decisions
Formal policies and procedures consistently applied
Defined performance indicators with sensitivity analysis
External review of key controls
Focused market expertise
Open communication
Transparent disclosure with stakeholders
Integrity in business conduct
Interests aligned with shareholders
Qualified and experienced personnel with specific roles
Conservative attitude to capital deployment
Analytical rigour
Executive Committee – weekly
52 Great Portland Estates Annual Report 2013
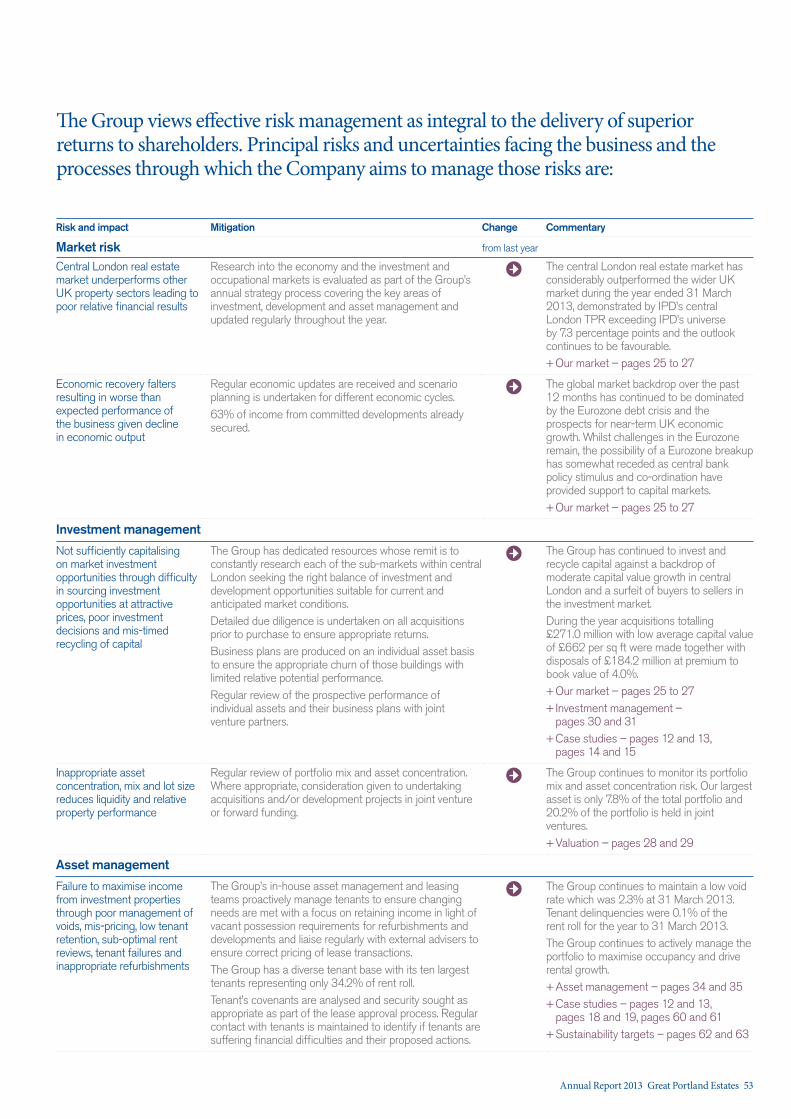
The Group views effective risk management as integral to the delivery of superior returns to shareholders. Principal risks and uncertainties facing the business and the processes through which the Company aims to manage those risks are:
Risk and impact Mitigation Change Commentary
Market risk from last year
Central London real estate market underperforms other UK property sectors leading to poor relative financial results
Research into the economy and the investment and occupational markets is evaluated as part of the Group’s annual strategy process covering the key areas of investment, development and asset management and updated regularly throughout the year.
The central London real estate market has considerably outperformed the wider UK market during the year ended 31 March 2013, demonstrated by IPD’s central London TPR exceeding IPD’s universe by 7.3 percentage points and the outlook continues to be favourable.
+Our market – pages 25 to 27
Economic recovery falters resulting in worse than expected performance of the business given decline in economic output
Regular economic updates are received and scenario planning is undertaken for different economic cycles.63% of income from committed developments already secured.
The global market backdrop over the past 12 months has continued to be dominated by the Eurozone debt crisis and the prospects for near-term UK economic growth. Whilst challenges in the Eurozone remain, the possibility of a Eurozone breakup has somewhat receded as central bank policy stimulus and co-ordination have provided support to capital markets.
+Our market – pages 25 to 27
Investment management
Not sufficiently capitalising on market investment opportunities through difficulty in sourcing investment opportunities at attractive prices, poor investment decisions and mis-timed recycling of capital
The Group has dedicated resources whose remit is to constantly research each of the sub-markets within central London seeking the right balance of investment and development opportunities suitable for current and anticipated market conditions.Detailed due diligence is undertaken on all acquisitions prior to purchase to ensure appropriate returns.Business plans are produced on an individual asset basis to ensure the appropriate churn of those buildings with limited relative potential performance.Regular review of the prospective performance of individual assets and their business plans with joint venture partners.
The Group has continued to invest and recycle capital against a backdrop of moderate capital value growth in central London and a surfeit of buyers to sellers in the investment market.During the year acquisitions totalling £271.0 million with low average capital value of £662 per sq ft were made together with disposals of £184.2 million at premium to book value of 4.0%.
+Our market – pages 25 to 27 + Investment management – pages 30 and 31 +Case studies – pages 12 and 13, pages 14 and 15
Inappropriate asset concentration, mix and lot size reduces liquidity and relative property performance
Regular review of portfolio mix and asset concentration. Where appropriate, consideration given to undertaking acquisitions and/or development projects in joint venture or forward funding.
The Group continues to monitor its portfolio mix and asset concentration risk. Our largest asset is only 7.8% of the total portfolio and 20.2% of the portfolio is held in joint ventures.
+Valuation – pages 28 and 29
Asset management
Failure to maximise income from investment properties through poor management of voids, mis-pricing, low tenant retention, sub-optimal rent reviews, tenant failures and inappropriate refurbishments
The Group’s in-house asset management and leasing teams proactively manage tenants to ensure changing needs are met with a focus on retaining income in light of vacant possession requirements for refurbishments and developments and liaise regularly with external advisers to ensure correct pricing of lease transactions.The Group has a diverse tenant base with its ten largest tenants representing only 34.2% of rent roll.Tenant’s covenants are analysed and security sought as appropriate as part of the lease approval process. Regular contact with tenants is maintained to identify if tenants are suffering financial difficulties and their proposed actions.
The Group continues to maintain a low void rate which was 2.3% at 31 March 2013. Tenant delinquencies were 0.1% of the rent roll for the year to 31 March 2013.The Group continues to actively manage the portfolio to maximise occupancy and drive rental growth.
+Asset management – pages 34 and 35 +Case studies – pages 12 and 13, pages 18 and 19, pages 60 and 61 +Sustainability targets – pages 62 and 63
Annual Report 2013 Great Portland Estates 53
Risk and impact Mitigation Change Commentary
Development management from last year
Poor development returns relating to:
— incorrect reading of the property cycle;
— inappropriate location; — failure to gain viable planning consents;
— level of speculative development;
— contractor availability and insolvency risk;
— a building being inappropriate to tenant demand;
— quality and benchmarks of the completed buildings;
— construction and procurement delays;
— ineffective marketing to prospective tenants; and
— poor development management.
See market risk above.Prior to committing to a development the Group conducts a detailed Financial and Operational appraisal process which evaluates the expected returns from a development in light of likely risks. During the course of a development, the actual costs and estimated returns are regularly monitored to signpost prompt decisions on project management, leasing and ownership.63% of income from committed developments already secured.Due diligence is undertaken of the financial stability of demolition and main contractors prior to awarding of contracts.Working with agents, potential occupiers’ needs and aspirations are identified during the planning application and design stages.All our major developments are subject to BREEAM ratings with a target to achieve a rating of ‘Very Good’ on major refurbishments and ‘Excellent’ on new build properties.Proactive liaison with existing tenants before and during the development process.Selection of contractors and suppliers based on track record of delivery and credit worthiness.In-house Leasing team liaise with external advisers on a regular basis and marketing timetables designed in accordance with leasing objectives.In-house Project Management team closely monitor construction and manage contractors to ensure adequate resourcing to meet programme.Regular review of the prospective performance of individual assets and their business plans with joint venture partners.Post completion reviews undertaken on all developments to identify best practice and areas for improvement.
The Group’s development programme of high quality core central London projects continues to attract quality tenants with £14.0 million of pre-lets secured since 1 April 2012.
+Development management – pages 32 and 33 +Case studies – pages 12 and 13, pages 16 and 17, pages 18 and 19, pages 60 and 61 +Our approach to sustainability – page 59 +Sustainability targets – pages 64 and 65
Level of development undertaken as a percentage of the portfolio leads to underperformance against KPIs
Regular review of the level of development undertaken as a percentage of portfolio, including the impact on the Group’s income profile and financial gearing, amongst other metrics.Developments only committed when pre-lets obtained and/or market supply considered to be sufficiently constrained.
With forecasted supply of central London office space expected to be scarce in the near to medium-term, the Group has continued its near-term development programme to capitalise on the expected resulting rental growth.
+Our market – pages 25 to 27 +Development management – pages 32 and 33 +Case studies – pages 16 and 17, pages 18 and 19
Financial risks
Limited availability of further capital constrains the growth of the business
Cash flow and funding needs are regularly monitored to ensure sufficient undrawn facilities are in place.Funding maturities are managed across the short, medium and long-term.The Group’s funding measures are diversified across a range of bank and bond markets. Strict counterparty limits are operated on deposits.
Since 31 March 2012, the Group has continued to diversify and enhance the maturity ladder of its debt financing.In November 2012, the Company raised £138 million through a share placing to finance acquisitions of properties with asset management angles to exploit.Cash and undrawn credit facilities are £282 million.
+Financial management – pages 36 and 37 +Our financial results – page 41 +Notes 16 and 17 forming part of the Group financial statements – pages 84 to 88
Risk management
54 Great Portland Estates Annual Report 2013
Risk and impact Mitigation Change Commentary
Financial risks continued from last year
Adverse market movements negatively impact on debt covenants through increased interest rates or a fall in capital values
Regular review of current and forecast debt levels and financing ratios.Formal policy to manage interest rate exposure by having a high proportion of debt with fixed or capped interest rates through derivatives.Significant headroom over all financial covenants at 31 March 2013.We estimate that values could fall by 38% from their 31 March 2013 levels before group debt covenants could be endangered.
The slow forecast recovery of the UK economy is expected to result in a continued low interest rate environment in the near term. Central London property values are expected to benefit from rental value growth and continued strong investment demand.
+Financial management – pages 36 and 37 +Our financial results – pages 40 and 41 +Notes 16 and 17 forming part of the Group financial statements – pages 84 to 88
Inappropriate capital structure results in sub-optimal NAV per share growth
Regular review of current and forecast debt and gearing levels and financing ratios.
The Group’s existing capital structure is well placed to take advantage of opportunities as they arise and to deliver our near-term development programme.
+Financial management – pages 36 and 37 +Our financial results – pages 40 and 41
People
Correct level, mix and retention of people to execute our Business Plan. Strategic priorities not achieved because of inability to attract, develop, motivate and retain talented employees
Regular review is undertaken of the Group’s resource requirements and succession planning.The Company has a remuneration system that is strongly linked to performance and a formal appraisal system to provide regular assessment of individual performance and identification of training needs.
New Head of Development role created in March 2013.Other senior managers remain unchanged.
+Our people – pages 48 to 51 +Remuneration report – pages 113 to 127
Regulatory
Adverse regulatory risk including tax, planning, environmental legislation and EU directives increases cost base, reduces flexibility and may influence potential investor and occupier interest in buildings
Senior Group representatives spend considerable time using experienced advisers as appropriate, to ensure compliance with current and potential future regulations.Lobbying property industry matters is undertaken by active participation of the Executive Directors through relevant industry bodies.Environmental Policy Committee meets at least quarterly to consider strategy in respect of environmental legislation.
During 2013 new Building Regulations will come into effect requiring further reductions on carbon emissions whilst the risk to the Group from increasing regulation having unforeseen consequences and the impact of certain EU directives including the AIFM directive continues to be uncertain.
+Property industry representation – page 57 +Sustainability targets – pages 62 to 65
Health and safety incidents Loss of or injury to employees, contractors or tenants and resultant reputational damage
The Group has dedicated health and safety personnel to oversee the Group’s management systems which include regular risk assessments and annual audits to proactively address key health and safety areas including employee, contractor and tenant safety.On developments, the Group operates a pre-qualification process to ensure selection of competent consultants and contractors which includes a health and safety assessment.Contractors’ responses to accidents and near misses are actively monitored and followed up by our Project Managers and Head of Sustainability.
The Group had two reportable accidents during the year each resulting in a contractor requiring three days off work.There were no other incidents across the Group’s investment or development portfolio.
+Sustainability targets – pages 64 and 65
Annual Report 2013 Great Portland Estates 55

Our approach to sustainability
Reviewed annually, the Group’s sustainability objectives and targets are designed to address our key sustainability risks and reflect the three stages of our property cycle: investment; asset; and development management. To ensure that these goals are incorporated in our day-to-day operations, our annual targets are also included within relevant individual employee’s objectives and targets. Progress is monitored through our sustainability tracker at each Royal Institute of British Architects (RIBA) stage on our developments, through quarterly reviews by our Health and Safety, Environment and Corporate Responsibility Working Group and annually by our external assurance consultants, Deloitte. Management systems are also in place to monitor compliance with day-to-day risks.
+For more information on our achievement against our 2013 objectives and targets and our 2014 objectives and targets see www.gpe.co.uk/responsibility/our-approach/our-approach-to-sustainability
Board oversightThe Board has responsibility for the approval of policy relating to social, environmental, ethical and health and safety matters and is determined to apply standards to all areas in which the Group operates including the management of the joint venture operations on behalf of the joint venture partners. The Board approves the Group’s sustainability strategy, objectives and targets annually in light of the Group’s material sustainability risks. Annual reports on sustainability and health and safety are provided by the Head of Sustainability as part of the Company’s annual strategy review and regular reports are received during the course of the year from Neil Thompson, as Portfolio Director and Executive Director responsible for health and safety.
We recognise that the long-term value of our business depends on our ability to manage environmental, social and economic issues. These are embedded within our core property activities of development, asset and investment management, supported by our people.
Our strategic sustainability objectives
Engage our people to support strategic sustainability priorities.
Enhance long-term value by considering sustainability risks in
investment cycles and by communicating our approach to investors.
Reduce the risk of obsolescence and enhance long-term value by developing sustainable buildings.
Meet changing tenant needs, minimise voids and manage efficient buildings.
Workplace
Development management
Investment management
Asset management
Sustainability strategy
With a high level of engagement from all our teams, we are well placed to continue to adapt to, and outperform, current and forthcoming legislation. Janine Cole Head of Sustainability
“
”
56 Great Portland Estates Annual Report 2013
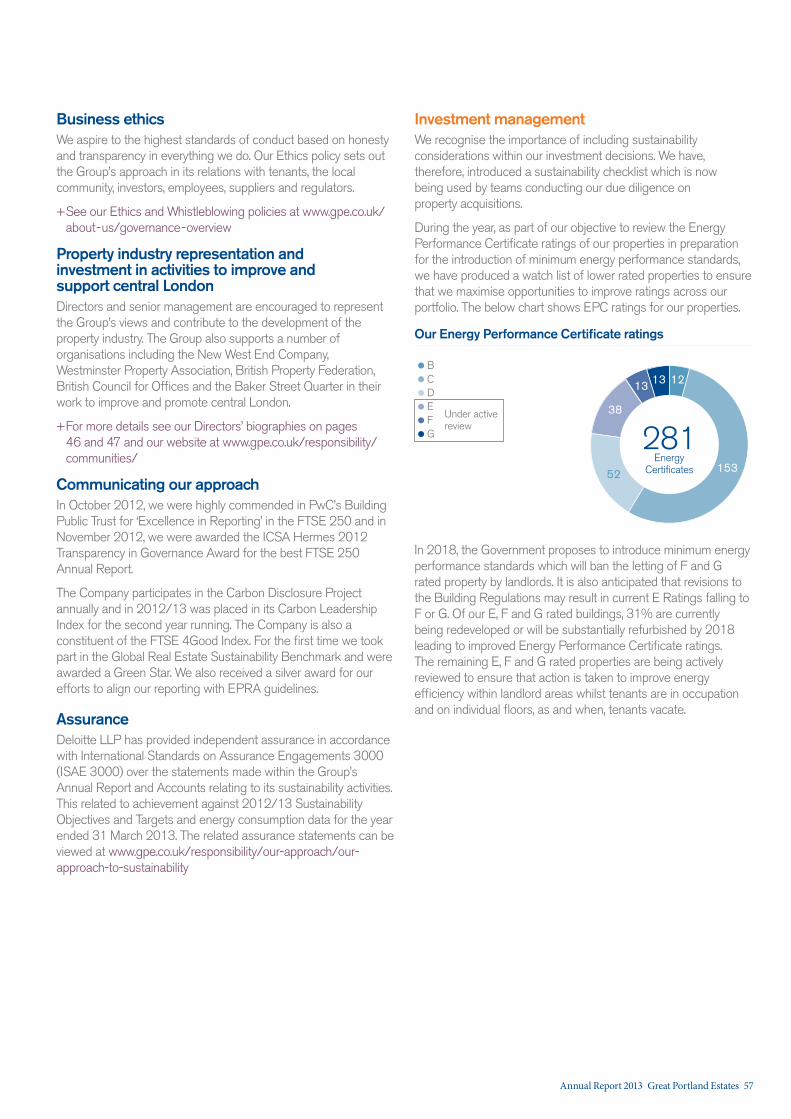
Business ethicsWe aspire to the highest standards of conduct based on honesty and transparency in everything we do. Our Ethics policy sets out the Group’s approach in its relations with tenants, the local community, investors, employees, suppliers and regulators.
+See our Ethics and Whistleblowing policies at www.gpe.co.uk/about-us/governance-overview
Property industry representation and investment in activities to improve and support central London Directors and senior management are encouraged to represent the Group’s views and contribute to the development of the property industry. The Group also supports a number of organisations including the New West End Company, Westminster Property Association, British Property Federation, British Council for Offices and the Baker Street Quarter in their work to improve and promote central London.
+For more details see our Directors’ biographies on pages 46 and 47 and our website at www.gpe.co.uk/responsibility/communities/
Communicating our approachIn October 2012, we were highly commended in PwC’s Building Public Trust for ‘Excellence in Reporting’ in the FTSE 250 and in November 2012, we were awarded the ICSA Hermes 2012 Transparency in Governance Award for the best FTSE 250 Annual Report.
The Company participates in the Carbon Disclosure Project annually and in 2012/13 was placed in its Carbon Leadership Index for the second year running. The Company is also a constituent of the FTSE 4Good Index. For the first time we took part in the Global Real Estate Sustainability Benchmark and were awarded a Green Star. We also received a silver award for our efforts to align our reporting with EPRA guidelines.
AssuranceDeloitte LLP has provided independent assurance in accordance with International Standards on Assurance Engagements 3000 (ISAE 3000) over the statements made within the Group’s Annual Report and Accounts relating to its sustainability activities. This related to achievement against 2012/13 Sustainability Objectives and Targets and energy consumption data for the year ended 31 March 2013. The related assurance statements can be viewed at www.gpe.co.uk/responsibility/our-approach/our-approach-to-sustainability
Investment managementWe recognise the importance of including sustainability considerations within our investment decisions. We have, therefore, introduced a sustainability checklist which is now being used by teams conducting our due diligence on property acquisitions.
During the year, as part of our objective to review the Energy Performance Certificate ratings of our properties in preparation for the introduction of minimum energy performance standards, we have produced a watch list of lower rated properties to ensure that we maximise opportunities to improve ratings across our portfolio. The below chart shows EPC ratings for our properties.
B C D
G F E
Our Energy Performance Certificate ratings
153
38
52
13 13 12
Under activereview
281Energy
Certificates
In 2018, the Government proposes to introduce minimum energy performance standards which will ban the letting of F and G rated property by landlords. It is also anticipated that revisions to the Building Regulations may result in current E Ratings falling to F or G. Of our E, F and G rated buildings, 31% are currently being redeveloped or will be substantially refurbished by 2018 leading to improved Energy Performance Certificate ratings. The remaining E, F and G rated properties are being actively reviewed to ensure that action is taken to improve energy efficiency within landlord areas whilst tenants are in occupation and on individual floors, as and when, tenants vacate.
Annual Report 2013 Great Portland Estates 57
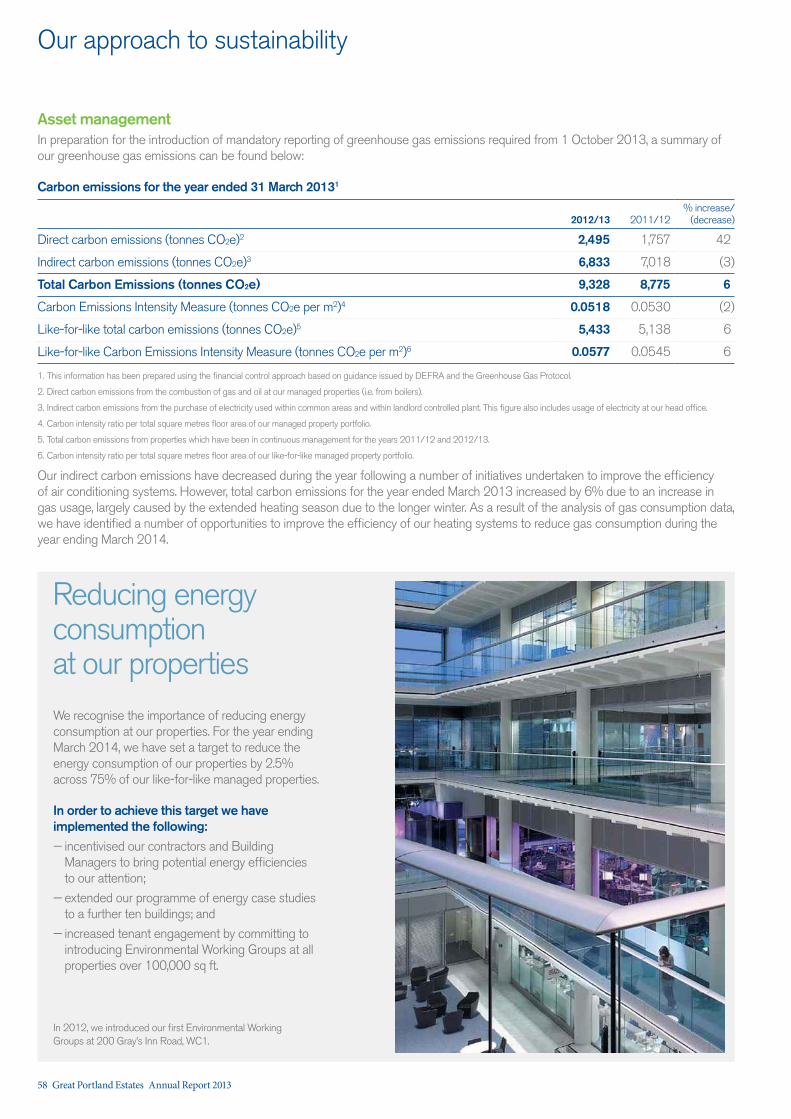
Asset managementIn preparation for the introduction of mandatory reporting of greenhouse gas emissions required from 1 October 2013, a summary of our greenhouse gas emissions can be found below:
Carbon emissions for the year ended 31 March 20131
2012/13 2011/12% increase/
(decrease)
Direct carbon emissions (tonnes CO2e)2 2,495 1,757 42
Indirect carbon emissions (tonnes CO2e)3 6,833 7,018 (3)
Total Carbon Emissions (tonnes CO2e) 9,328 8,775 6
Carbon Emissions Intensity Measure (tonnes CO2e per m2)4 0.0518 0.0530 (2)
Like-for-like total carbon emissions (tonnes CO2e)5 5,433 5,138 6
Like-for-like Carbon Emissions Intensity Measure (tonnes CO2e per m2)6 0.0577 0.0545 6
1. This information has been prepared using the financial control approach based on guidance issued by DEFRA and the Greenhouse Gas Protocol.
2. Direct carbon emissions from the combustion of gas and oil at our managed properties (i.e. from boilers).
3. Indirect carbon emissions from the purchase of electricity used within common areas and within landlord controlled plant. This figure also includes usage of electricity at our head office.
4. Carbon intensity ratio per total square metres floor area of our managed property portfolio.
5. Total carbon emissions from properties which have been in continuous management for the years 2011/12 and 2012/13.
6. Carbon intensity ratio per total square metres floor area of our like-for-like managed property portfolio.
Our indirect carbon emissions have decreased during the year following a number of initiatives undertaken to improve the efficiency of air conditioning systems. However, total carbon emissions for the year ended March 2013 increased by 6% due to an increase in gas usage, largely caused by the extended heating season due to the longer winter. As a result of the analysis of gas consumption data, we have identified a number of opportunities to improve the efficiency of our heating systems to reduce gas consumption during the year ending March 2014.
Our approach to sustainability
Reducing energy consumption at our propertiesWe recognise the importance of reducing energy consumption at our properties. For the year ending March 2014, we have set a target to reduce the energy consumption of our properties by 2.5% across 75% of our like-for-like managed properties.
In order to achieve this target we have implemented the following:
— incentivised our contractors and Building Managers to bring potential energy efficiencies to our attention;
— extended our programme of energy case studies to a further ten buildings; and
— increased tenant engagement by committing to introducing Environmental Working Groups at all properties over 100,000 sq ft.
In 2012, we introduced our first Environmental Working Groups at 200 Gray’s Inn Road, WC1.
58 Great Portland Estates Annual Report 2013
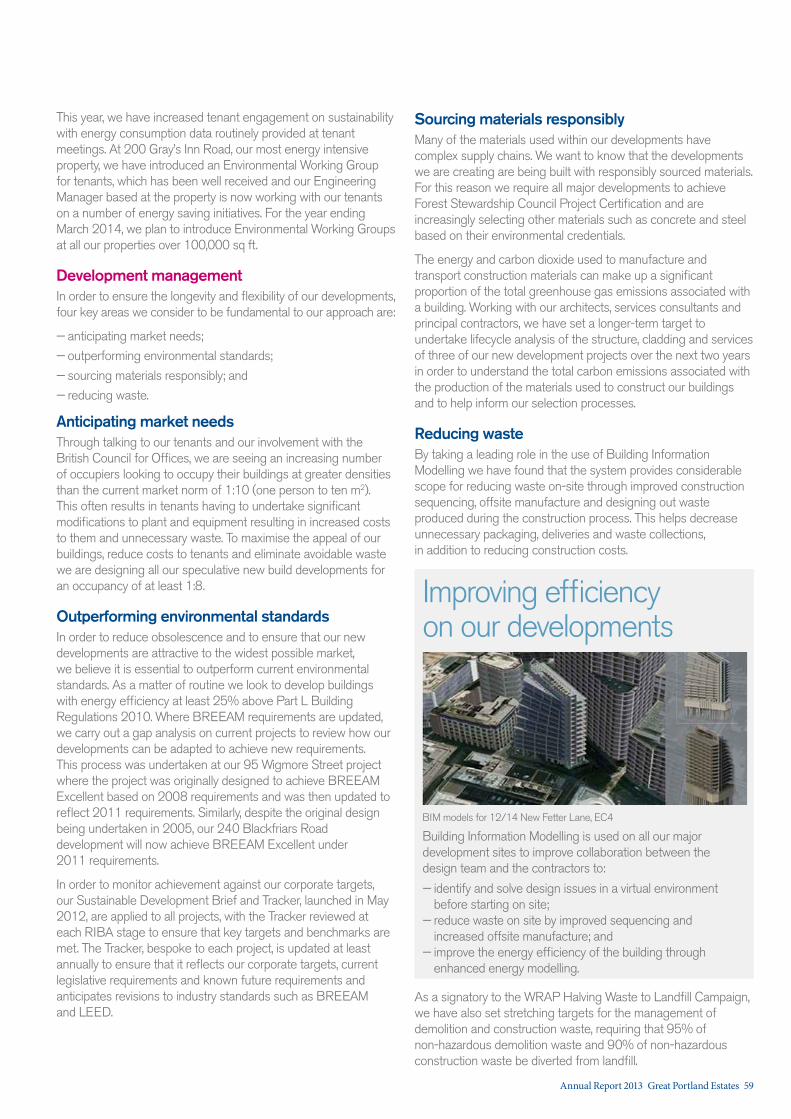
This year, we have increased tenant engagement on sustainability with energy consumption data routinely provided at tenant meetings. At 200 Gray’s Inn Road, our most energy intensive property, we have introduced an Environmental Working Group for tenants, which has been well received and our Engineering Manager based at the property is now working with our tenants on a number of energy saving initiatives. For the year ending March 2014, we plan to introduce Environmental Working Groups at all our properties over 100,000 sq ft.
Development managementIn order to ensure the longevity and flexibility of our developments, four key areas we consider to be fundamental to our approach are:
— anticipating market needs;
— outperforming environmental standards;
— sourcing materials responsibly; and
— reducing waste.
Anticipating market needsThrough talking to our tenants and our involvement with the British Council for Offices, we are seeing an increasing number of occupiers looking to occupy their buildings at greater densities than the current market norm of 1:10 (one person to ten m2). This often results in tenants having to undertake significant modifications to plant and equipment resulting in increased costs to them and unnecessary waste. To maximise the appeal of our buildings, reduce costs to tenants and eliminate avoidable waste we are designing all our speculative new build developments for an occupancy of at least 1:8.
Outperforming environmental standardsIn order to reduce obsolescence and to ensure that our new developments are attractive to the widest possible market, we believe it is essential to outperform current environmental standards. As a matter of routine we look to develop buildings with energy efficiency at least 25% above Part L Building Regulations 2010. Where BREEAM requirements are updated, we carry out a gap analysis on current projects to review how our developments can be adapted to achieve new requirements. This process was undertaken at our 95 Wigmore Street project where the project was originally designed to achieve BREEAM Excellent based on 2008 requirements and was then updated to reflect 2011 requirements. Similarly, despite the original design being undertaken in 2005, our 240 Blackfriars Road development will now achieve BREEAM Excellent under 2011 requirements.
In order to monitor achievement against our corporate targets, our Sustainable Development Brief and Tracker, launched in May 2012, are applied to all projects, with the Tracker reviewed at each RIBA stage to ensure that key targets and benchmarks are met. The Tracker, bespoke to each project, is updated at least annually to ensure that it reflects our corporate targets, current legislative requirements and known future requirements and anticipates revisions to industry standards such as BREEAM and LEED.
Sourcing materials responsiblyMany of the materials used within our developments have complex supply chains. We want to know that the developments we are creating are being built with responsibly sourced materials. For this reason we require all major developments to achieve Forest Stewardship Council Project Certification and are increasingly selecting other materials such as concrete and steel based on their environmental credentials.
The energy and carbon dioxide used to manufacture and transport construction materials can make up a significant proportion of the total greenhouse gas emissions associated with a building. Working with our architects, services consultants and principal contractors, we have set a longer-term target to undertake lifecycle analysis of the structure, cladding and services of three of our new development projects over the next two years in order to understand the total carbon emissions associated with the production of the materials used to construct our buildings and to help inform our selection processes.
Reducing wasteBy taking a leading role in the use of Building Information Modelling we have found that the system provides considerable scope for reducing waste on-site through improved construction sequencing, offsite manufacture and designing out waste produced during the construction process. This helps decrease unnecessary packaging, deliveries and waste collections, in addition to reducing construction costs.
As a signatory to the WRAP Halving Waste to Landfill Campaign, we have also set stretching targets for the management of demolition and construction waste, requiring that 95% of non-hazardous demolition waste and 90% of non-hazardous construction waste be diverted from landfill.
BIM models for 12/14 New Fetter Lane, EC4
Building Information Modelling is used on all our major development sites to improve collaboration between the design team and the contractors to:
— identify and solve design issues in a virtual environment before starting on site; — reduce waste on site by improved sequencing and increased offsite manufacture; and — improve the energy efficiency of the building through enhanced energy modelling.
Improving efficiency on our developments
Annual Report 2013 Great Portland Estates 59

Our approach to sustainability
— exceed Building Regulations energy efficiency requirements Part L 2010 by 28%.
— reduce energy consumption by 19% through introducing energy efficient systems such as:
High efficiency solar control glazing;
LED lighting in office areas;
Mechanical heat recovery;
High efficiency chillers;
PhotoVoltaic cells;
— exceed water saving baseline figures by 50% through:
The use of highly efficient sanitary fittings;
Using an innovative approach to commissioning and testing of the water services to reduce the quantity of water used from an estimated 1,460,000 to 146,000 litres; and
— enhance biodiversity by introducing ground landscaping.
Through the building design we will:
Delivering truly sustainable buildingsAt 240 Blackfriars Road, we have ensured a pragmatic approach to sustainability from design principles through to operation Despite the original design being undertaken in 2005, following changes in BREEAM requirements, we have undertaken a gap analysis to ensure the design of our 240 Blackfriars Road development has been updated to achieve BREEAM Excellent under 2011 requirements.
design
Development management
Asset management
Our teams
”
Through the use of innovative tools and construction techniques we have ensured that from design to operation we will deliver a highly efficient building. Martin Quinn Project Manager
“
240 Blackfriars Road, SE1
BREEAM 2011 ExcellentEPC rating: B with a score of 37
Occupancy at 1:8FSC Project certification
60 Great Portland Estates Annual Report 2013

— ensuring that concrete and cement products have been responsibly sourced from manufacturers who hold a current BES 6001 certificate;
— diverting an average of 95% of non-hazardous construction waste from landfill;
— designing out waste during procurement and construction, with a reduction of 6.5 tonnes per 100m2 of gross internal area against industry standards;
— registered with the Considerate Constructors scheme and have achieved a score of 36 out of 40 on our most recent audit;
— providing local employment and training through the provision of NVQ courses and Jobstart schemes; and
— ensuring our dedicated Neighbourhood liaison manager has regular interaction with local schools and colleges.
During construction we are:
construction — optimise the building management system’s performance through seasonal commissioning of all systems;
— complete a post occupancy evaluation one year after building occupation;
— ensure that building staff are fully trained on the ecological and energy efficiency features of the property;
— ensure that tenants are fully informed of the sustainable and energy efficient features of the property through the tenant fit out guide and tenant guide;
— monitor energy and water usage on a monthly basis in both tenant and landlord spaces in order to assess building operation against projected standards; and
— ensure energy and water usage is provided to occupiers through the Environmental Working Group.
Once the building is operational we will:
operation
Annual Report 2013 Great Portland Estates 61

Our approach to sustainability
Opportunity Risk Stakeholder Objective
Engagement with tenants improves performance on sustainability and reduces costs through the service charge.
By maintaining positive relationships with our tenants it enables us to manage our void rate in accordance with our wider strategy.
Adverse regulatory risk.
Failure to maximise income from investment properties through low tenant retention.
Tenants To meet changing tenant needs, minimise voids and manage buildings efficiently.
Asset management
Opportunity Risk Stakeholder Objective
By adapting in advance of regulatory changes we reduce obsolescence and increase the flexibility of our assets.
By participating in appropriate indices we ensure that our sustainability reporting is accessible to potential investors and analysts.
Adverse regulatory risk.
Communication with shareholders.
Tenants Investors
Employees Investors
Investors
Enhance long-term value by considering sustainability risks in investment cycles and communicating our approach to investors.
Investment management
62 Great Portland Estates Annual Report 2013
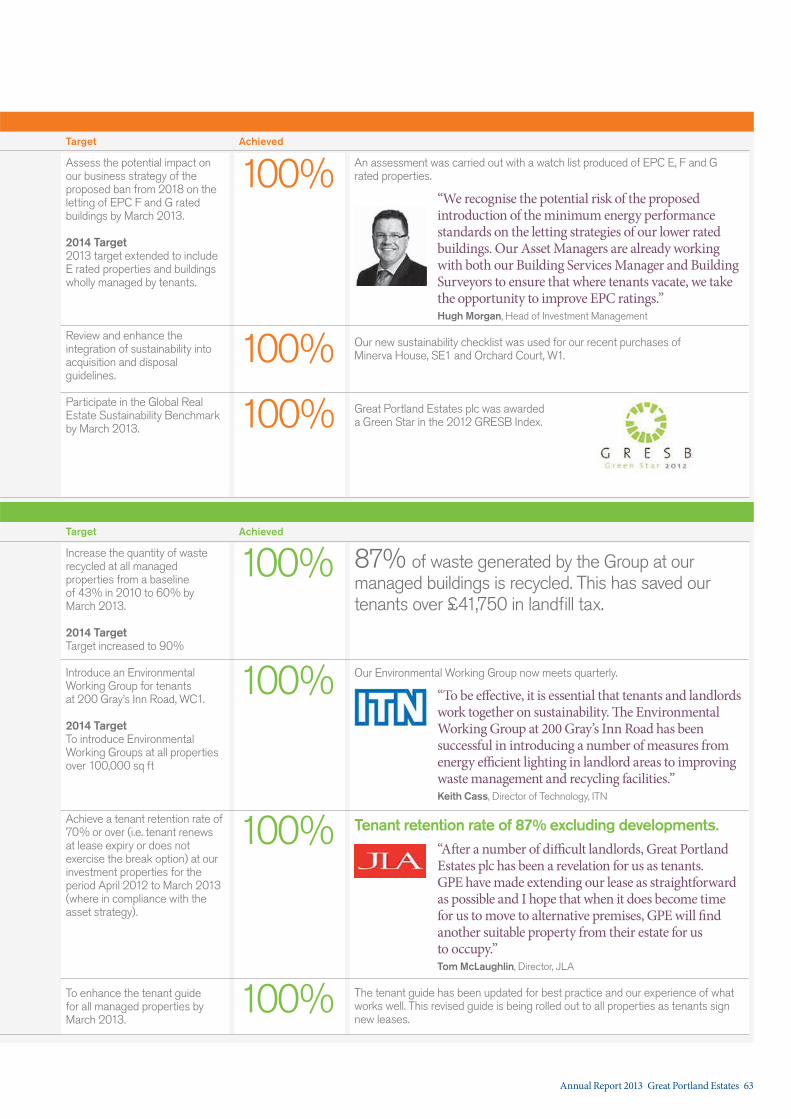
Target Achieved
Increase the quantity of waste recycled at all managed properties from a baseline of 43% in 2010 to 60% by March 2013.
2014 Target Target increased to 90%
Introduce an Environmental Working Group for tenants at 200 Gray’s Inn Road, WC1.
2014 Target To introduce Environmental Working Groups at all properties over 100,000 sq ft
Achieve a tenant retention rate of 70% or over (i.e. tenant renews at lease expiry or does not exercise the break option) at our investment properties for the period April 2012 to March 2013 (where in compliance with the asset strategy).
To enhance the tenant guide for all managed properties by March 2013.
87% of waste generated by the Group at our managed buildings is recycled. This has saved our tenants over £41,750 in landfill tax.
Our Environmental Working Group now meets quarterly.
“To be effective, it is essential that tenants and landlords work together on sustainability. The Environmental Working Group at 200 Gray’s Inn Road has been successful in introducing a number of measures from energy efficient lighting in landlord areas to improving waste management and recycling facilities.”Keith Cass, Director of Technology, ITN
Tenant retention rate of 87% excluding developments. “After a number of difficult landlords, Great Portland Estates plc has been a revelation for us as tenants. GPE have made extending our lease as straightforward as possible and I hope that when it does become time for us to move to alternative premises, GPE will find another suitable property from their estate for us to occupy.” Tom McLaughlin, Director, JLA
The tenant guide has been updated for best practice and our experience of what works well. This revised guide is being rolled out to all properties as tenants sign new leases.
100%
100%
100%
100%
Target Achieved
Assess the potential impact on our business strategy of the proposed ban from 2018 on the letting of EPC F and G rated buildings by March 2013.
2014 Target 2013 target extended to include E rated properties and buildings wholly managed by tenants.
Review and enhance the integration of sustainability into acquisition and disposal guidelines.
Participate in the Global Real Estate Sustainability Benchmark by March 2013.
An assessment was carried out with a watch list produced of EPC E, F and G rated properties.
“We recognise the potential risk of the proposed introduction of the minimum energy performance standards on the letting strategies of our lower rated buildings. Our Asset Managers are already working with both our Building Services Manager and Building Surveyors to ensure that where tenants vacate, we take the opportunity to improve EPC ratings.” Hugh Morgan, Head of Investment Management
Our new sustainability checklist was used for our recent purchases of Minerva House, SE1 and Orchard Court, W1.
Great Portland Estates plc was awarded a Green Star in the 2012 GRESB Index.
100%
100%
100%
Annual Report 2013 Great Portland Estates 63

Our approach to sustainability
Opportunity Risk Stakeholder Objective
Workplace
Opportunity Risk Stakeholder Objective
Development management
By diverting waste from landfill we reduce the impact on the environment and reduce costs associated with landfill tax.
Poor development returns relating to the quality and benchmark of the completed building.
Suppliers To reduce the risk of obsolescence and enhance long-term value by developing sustainable buildings.
By developing our people we seek to improve their personal job satisfaction whilst enhancing the effectiveness of our teams.
Failure to develop, motivate and retain our people.
Our people To ensure employee personal development through relevant training.
By using reputable suppliers who source materials from sustainable sources we develop properties with good sustainability credentials, enhancing their appeal to the widest variety of potential occupiers.
Poor development returns relating to the quality and benchmark of the completed building.
Suppliers
By engaging with the communities in which we develop we minimise the risk of planning objections and delays.
Reputational risk. Community
To build on our reputation as a company that people want to work with.
Loss or injury to employees, tenants, the public and contractors and resultant reputational damage.
Tenants and the community, suppliers and employees
To provide a safe and healthy working environment for all employees and contractors working on premises, visiting members of the public and all others affected by the activities of the Company.
64 Great Portland Estates Annual Report 2013
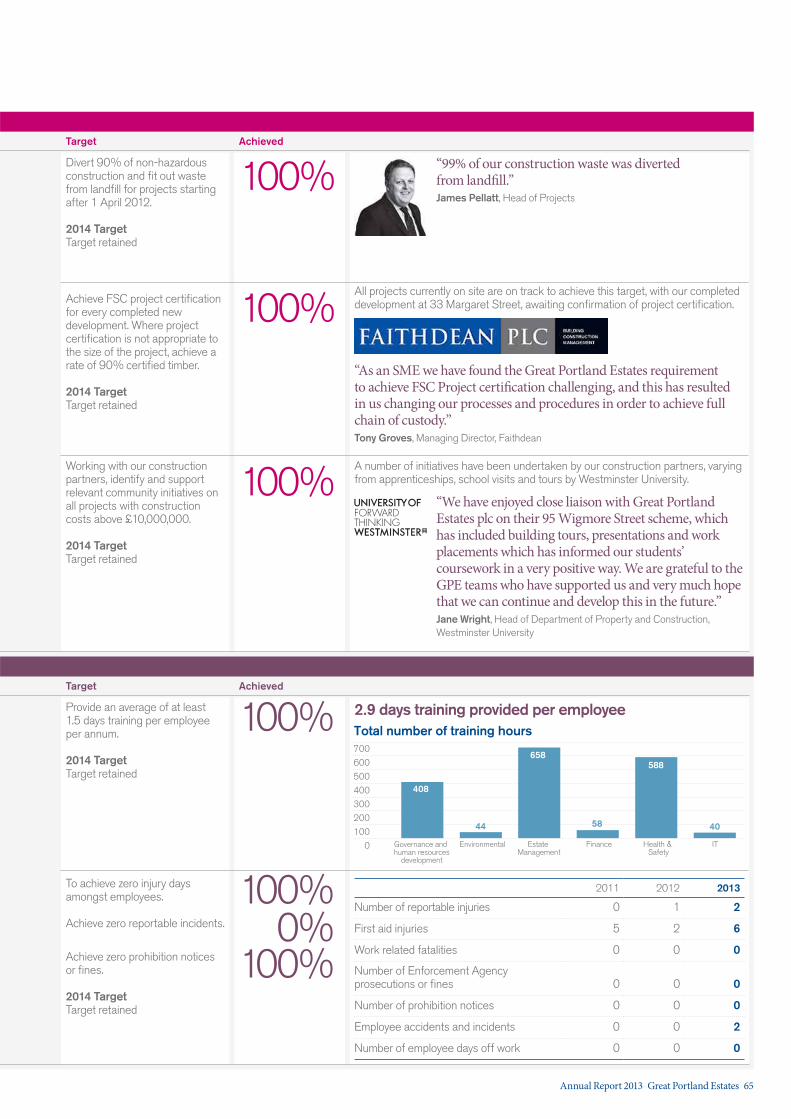
Target Achieved
Target Achieved
0
700
500
400
Total number of training hours
Environmental
600
408
44
658588
100
200
300
Governance and human resources
development
Estate Management
Finance Health & Safety
IT
58 40
Divert 90% of non-hazardous construction and fit out waste from landfill for projects starting after 1 April 2012.
2014 Target Target retained
“99% of our construction waste was diverted from landfill.” James Pellatt, Head of Projects
100%
100%
100%0%
100%
2.9 days training provided per employeeProvide an average of at least 1.5 days training per employee per annum.
2014 Target Target retained
100%
100%
Achieve FSC project certification for every completed new development. Where project certification is not appropriate to the size of the project, achieve a rate of 90% certified timber.
2014 Target Target retained
All projects currently on site are on track to achieve this target, with our completed development at 33 Margaret Street, awaiting confirmation of project certification.
“As an SME we have found the Great Portland Estates requirement to achieve FSC Project certification challenging, and this has resulted in us changing our processes and procedures in order to achieve full chain of custody.” Tony Groves, Managing Director, Faithdean
FORWARDTHINKING
Working with our construction partners, identify and support relevant community initiatives on all projects with construction costs above £10,000,000.
2014 Target Target retained
A number of initiatives have been undertaken by our construction partners, varying from apprenticeships, school visits and tours by Westminster University.
“We have enjoyed close liaison with Great Portland Estates plc on their 95 Wigmore Street scheme, which has included building tours, presentations and work placements which has informed our students’ coursework in a very positive way. We are grateful to the GPE teams who have supported us and very much hope that we can continue and develop this in the future.” Jane Wright, Head of Department of Property and Construction, Westminster University
To achieve zero injury days amongst employees.
Achieve zero reportable incidents.
Achieve zero prohibition notices or fines.
2014 Target Target retained
2011 2012 2013
Number of reportable injuries 0 1 2
First aid injuries 5 2 6
Work related fatalities 0 0 0
Number of Enforcement Agency prosecutions or fines 0 0 0
Number of prohibition notices 0 0 0
Employee accidents and incidents 0 0 2
Number of employee days off work 0 0 0
Annual Report 2013 Great Portland Estates 65
Section 3 Financials
In this section we present our financial statements for the year, prepared in accordance with International Financial Reporting Standards.
68 Group income statement68 Group statement of comprehensive income69 Group balance sheet70 Group statement of cash flows71 Group statement of changes in equity72 Notes forming part of the Group financial statements93 Independent auditor’s report94 Company balance sheet – UK GAAP95 Notes forming part of the Company financial statements97 Company independent auditor’s report
66 Great Portland Estates Annual Report 2013

Annual Report 2013 Great Portland Estates 67
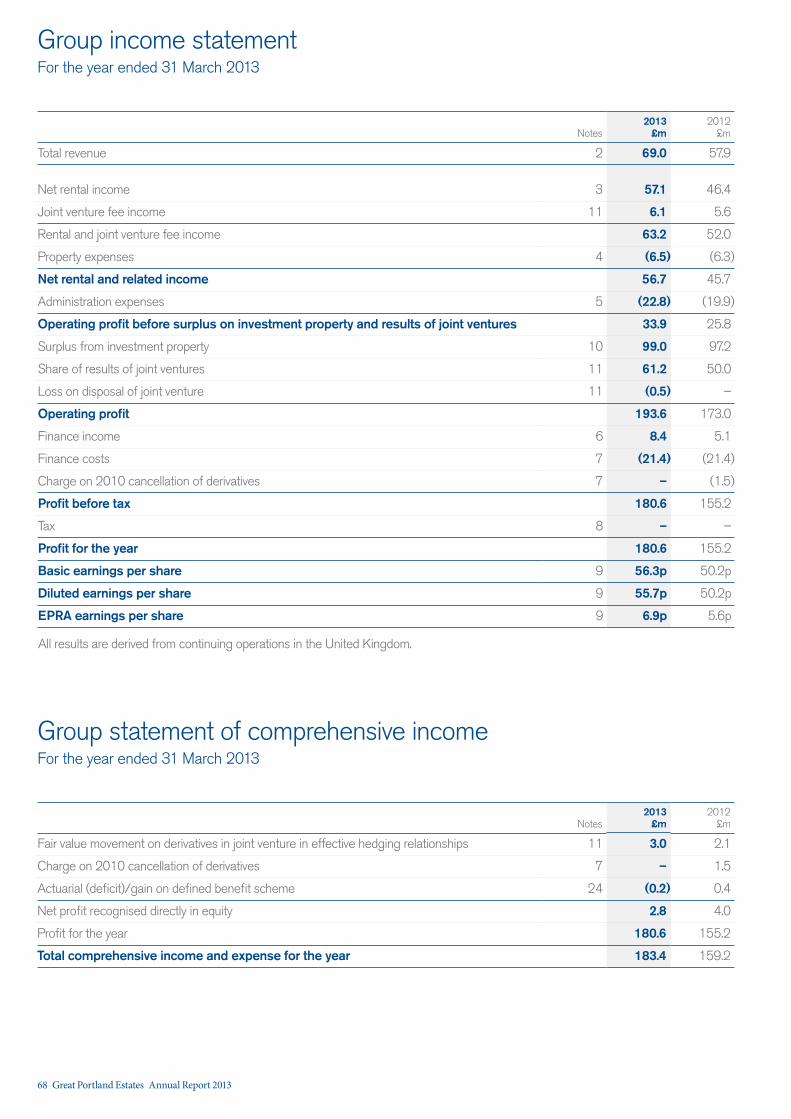
Notes2013
£m2012
£m
Total revenue 2 69.0 57.9
Net rental income 3 57.1 46.4
Joint venture fee income 11 6.1 5.6
Rental and joint venture fee income 63.2 52.0
Property expenses 4 (6.5) (6.3)
Net rental and related income 56.7 45.7
Administration expenses 5 (22.8) (19.9)
Operating profit before surplus on investment property and results of joint ventures 33.9 25.8
Surplus from investment property 10 99.0 97.2
Share of results of joint ventures 11 61.2 50.0
Loss on disposal of joint venture 11 (0.5) –
Operating profit 193.6 173.0
Finance income 6 8.4 5.1
Finance costs 7 (21.4) (21.4)
Charge on 2010 cancellation of derivatives 7 – (1.5)
Profit before tax 180.6 155.2
Tax 8 – –
Profit for the year 180.6 155.2
Basic earnings per share 9 56.3p 50.2p
Diluted earnings per share 9 55.7p 50.2p
EPRA earnings per share 9 6.9p 5.6p
All results are derived from continuing operations in the United Kingdom.
Group statement of comprehensive incomeFor the year ended 31 March 2013
Notes2013
£m2012
£m
Fair value movement on derivatives in joint venture in effective hedging relationships 11 3.0 2.1
Charge on 2010 cancellation of derivatives 7 – 1.5
Actuarial (deficit)/gain on defined benefit scheme 24 (0.2) 0.4
Net profit recognised directly in equity 2.8 4.0
Profit for the year 180.6 155.2
Total comprehensive income and expense for the year 183.4 159.2
Group income statementFor the year ended 31 March 2013
68 Great Portland Estates Annual Report 2013
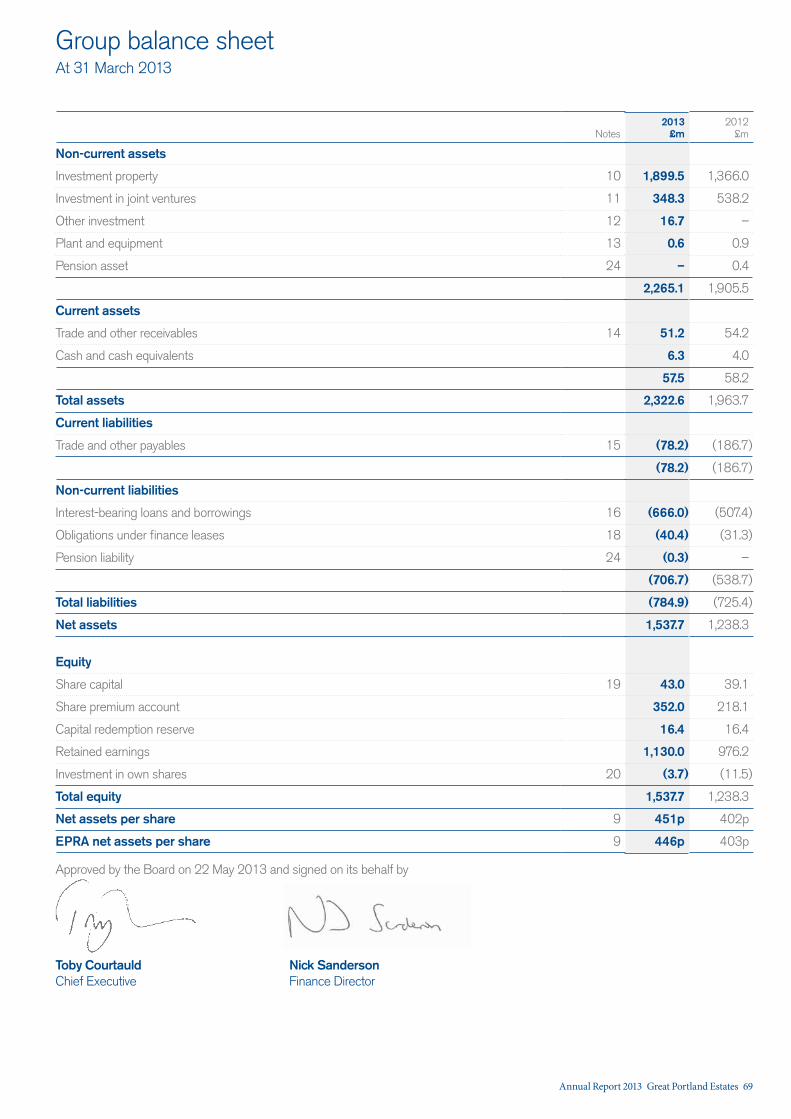
Notes2013
£m2012
£m
Non-current assets
Investment property 10 1,899.5 1,366.0
Investment in joint ventures 11 348.3 538.2
Other investment 12 16.7 –
Plant and equipment 13 0.6 0.9
Pension asset 24 – 0.4
2,265.1 1,905.5
Current assets
Trade and other receivables 14 51.2 54.2
Cash and cash equivalents 6.3 4.0
57.5 58.2
Total assets 2,322.6 1,963.7
Current liabilities
Trade and other payables 15 (78.2) (186.7)
(78.2) (186.7)
Non-current liabilities
Interest-bearing loans and borrowings 16 (666.0) (507.4)
Obligations under finance leases 18 (40.4) (31.3)
Pension liability 24 (0.3) –
(706.7) (538.7)
Total liabilities (784.9) (725.4)
Net assets 1,537.7 1,238.3
Equity
Share capital 19 43.0 39.1
Share premium account 352.0 218.1
Capital redemption reserve 16.4 16.4
Retained earnings 1,130.0 976.2
Investment in own shares 20 (3.7) (11.5)
Total equity 1,537.7 1,238.3
Net assets per share 9 451p 402p
EPRA net assets per share 9 446p 403p
Approved by the Board on 22 May 2013 and signed on its behalf by
Toby Courtauld Nick Sanderson Chief Executive Finance Director
Group balance sheetAt 31 March 2013
Annual Report 2013 Great Portland Estates 69
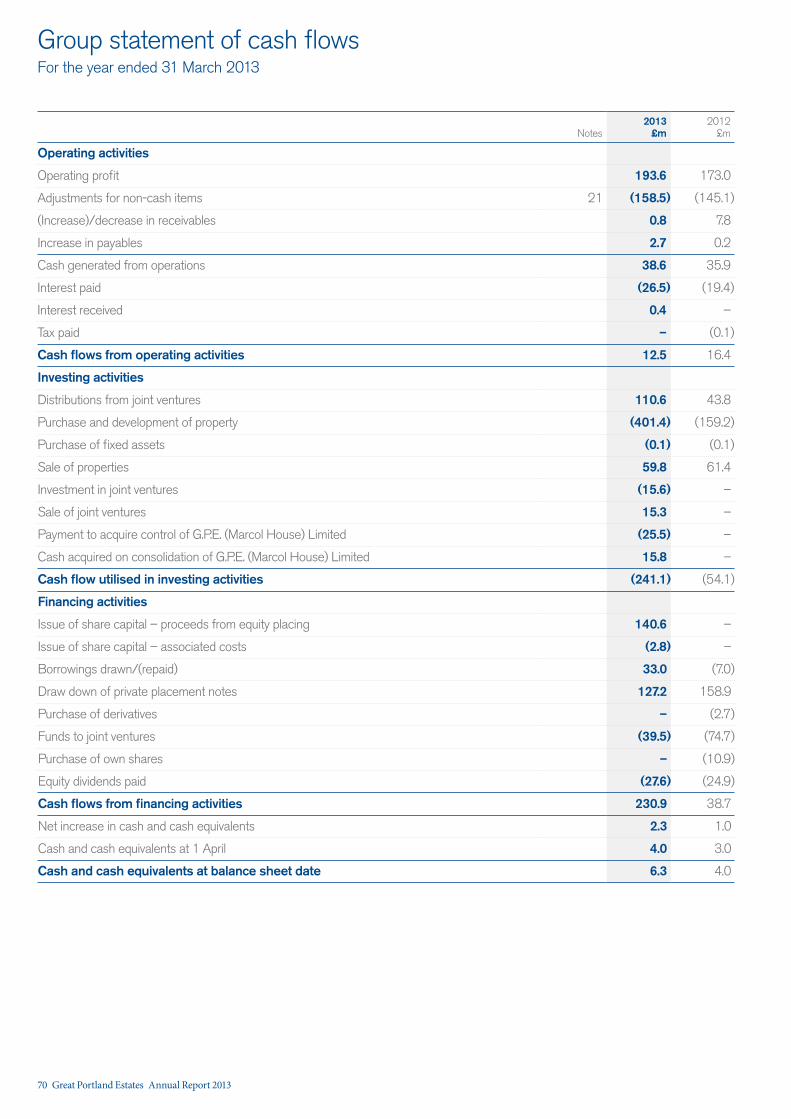
Notes2013
£m2012
£m
Operating activities
Operating profit 193.6 173.0
Adjustments for non-cash items 21 (158.5) (145.1)
(Increase)/decrease in receivables 0.8 7.8
Increase in payables 2.7 0.2
Cash generated from operations 38.6 35.9
Interest paid (26.5) (19.4)
Interest received 0.4 –
Tax paid – (0.1)
Cash flows from operating activities 12.5 16.4
Investing activities
Distributions from joint ventures 110.6 43.8
Purchase and development of property (401.4) (159.2)
Purchase of fixed assets (0.1) (0.1)
Sale of properties 59.8 61.4
Investment in joint ventures (15.6) –
Sale of joint ventures 15.3 –
Payment to acquire control of G.P.E. (Marcol House) Limited (25.5) –
Cash acquired on consolidation of G.P.E. (Marcol House) Limited 15.8 –
Cash flow utilised in investing activities (241.1) (54.1)
Financing activities
Issue of share capital – proceeds from equity placing 140.6 –
Issue of share capital – associated costs (2.8) –
Borrowings drawn/(repaid) 33.0 (7.0)
Draw down of private placement notes 127.2 158.9
Purchase of derivatives – (2.7)
Funds to joint ventures (39.5) (74.7)
Purchase of own shares – (10.9)
Equity dividends paid (27.6) (24.9)
Cash flows from financing activities 230.9 38.7
Net increase in cash and cash equivalents 2.3 1.0
Cash and cash equivalents at 1 April 4.0 3.0
Cash and cash equivalents at balance sheet date 6.3 4.0
Group statement of cash flowsFor the year ended 31 March 2013
70 Great Portland Estates Annual Report 2013
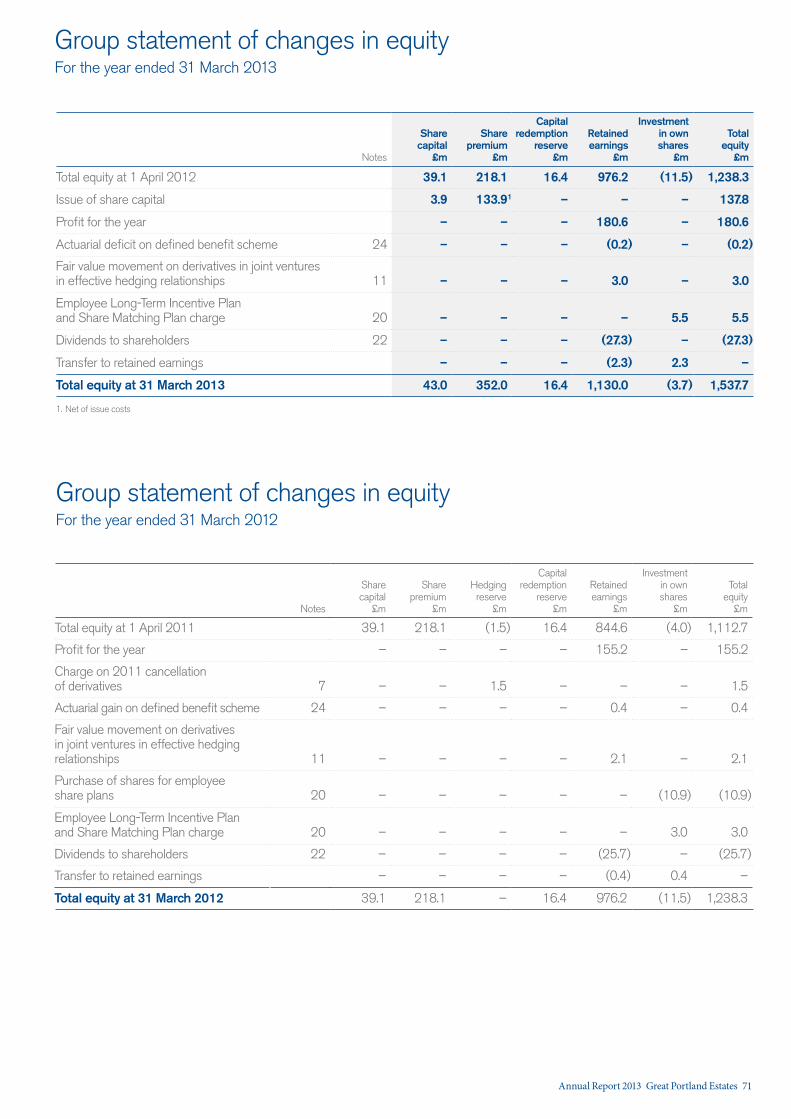
Notes
Share capital
£m
Share premium
£m
Capital redemption
reserve£m
Retained earnings
£m
Investment in own
shares £m
Total equity
£m
Total equity at 1 April 2012 39.1 218.1 16.4 976.2 (11.5) 1,238.3
Issue of share capital 3.9 133.91 – – – 137.8
Profit for the year – – – 180.6 – 180.6
Actuarial deficit on defined benefit scheme 24 – – – (0.2) – (0.2)
Fair value movement on derivatives in joint ventures in effective hedging relationships 11 – – – 3.0 – 3.0
Employee Long-Term Incentive Plan and Share Matching Plan charge 20 – – – – 5.5 5.5
Dividends to shareholders 22 – – – (27.3) – (27.3)
Transfer to retained earnings – – – (2.3) 2.3 –
Total equity at 31 March 2013 43.0 352.0 16.4 1,130.0 (3.7) 1,537.7
1. Net of issue costs
Group statement of changes in equityFor the year ended 31 March 2012
Notes
Share capital
£m
Share premium
£m
Hedging reserve
£m
Capital redemption
reserve£m
Retained earnings
£m
Investment in own
shares £m
Total equity
£m
Total equity at 1 April 2011 39.1 218.1 (1.5) 16.4 844.6 (4.0) 1,112.7
Profit for the year – – – – 155.2 – 155.2
Charge on 2011 cancellation of derivatives 7 – – 1.5 – – – 1.5
Actuarial gain on defined benefit scheme 24 – – – – 0.4 – 0.4
Fair value movement on derivatives in joint ventures in effective hedging relationships 11 – – – – 2.1 – 2.1
Purchase of shares for employee share plans 20 – – – – – (10.9) (10.9)
Employee Long-Term Incentive Plan and Share Matching Plan charge 20 – – – – – 3.0 3.0
Dividends to shareholders 22 – – – – (25.7) – (25.7)
Transfer to retained earnings – – – – (0.4) 0.4 –
Total equity at 31 March 2012 39.1 218.1 – 16.4 976.2 (11.5) 1,238.3
Group statement of changes in equityFor the year ended 31 March 2013
Annual Report 2013 Great Portland Estates 71
1 Accounting policies
Basis of preparationThe financial statements have been prepared in accordance with IFRSs adopted by the European Union and therefore the Group financial statements comply with Article 4 of the EU IAS Regulation.
The financial statements have been prepared on the historical cost basis, except for the revaluation of properties, other investment, financial instruments and pension liability. The financial statements are prepared on a going concern basis as explained in the Report of the directors on page 129.
In the process of applying the Group’s accounting policies, the directors are required to make judgements, estimates and assumptions that may affect the financial statements. The directors believe that the judgements made in the preparation of the financial statements are reasonable. However, actual outcomes may differ from those anticipated. Critical accounting judgements include the adoption of the external portfolio valuation without adjustment, the recognition of purchases and disposal of assets, the adoption of a single reporting segment and the level of control the Group has in respect of its joint ventures. The accounting policies for these areas of judgement are set out below.
During the year ended 31 March 2013, the following accounting standards and guidance were adopted by the Group, the pronouncements either had no impact on the financial statements or resulted in changes to presentation and disclosure only:
— IFRS 7 (amended Dec 2011) – Disclosures – Offsetting Financial Assets and Financial Liabilities
— IFRS 7 (amended Oct 2010) – Disclosures – Transfers of Assets
— The improvements to IFRSs (May 2010)
At the date of approval of these financial statements, the following Standards and Interpretations which have not been applied in these financial statements were in issue but not yet effective (and in some cases had not yet been adopted by the EU):
— IFRS 9 – Financial Instruments (will impact both the measurement and disclosures of financial instruments)
— IFRS 10 – Consolidated Financial Statements
— IFRS 11 – Joint Arrangements
— IFRS 12 – Disclosure of Interest in Other Entities (will impact the disclosure of interests the Group has in other entities)
— IFRS 13 – Fair Value Measurement (will impact both the disclosure and measurement of fair value for certain assets and liabilities)
— IAS 1 (amended June 2011) – Presentation of Items of Other Comprehensive Income
— IAS 12 – Deferred Tax: Recovery of Underlying Assets
— IAS 19 (revised June 2011) – Employee Benefits
— IAS 27 (revised May 2011) – Separate Financial Statements
— IAS 28 (revised May 2011) – Investments in Associates and Joint Ventures
— IAS 32 (amended) – Offsetting Financial Assets and Financial Liabilities (will impact the measurement of certain assets and liabilities)
The directors do not anticipate that the adoption of these Standards and Interpretations in future periods will have a material impact on the financial statements of the Group, except as set out above.
Basis of consolidation The Group financial statements consolidate the financial statements of the Company and all its subsidiary undertakings for the year ended 31 March 2013. Subsidiary undertakings are those entities controlled by the Group. Control is assumed when the Group directs the financial and operating policies of an entity to benefit from its activities.
Rental income This comprises rental income and premiums on lease surrenders on investment properties for the year, exclusive of service charges receivable.
Tenant leasesThe directors have considered the potential transfer of risks and rewards of ownership in accordance with IAS 17 – Leases for all properties leased to tenants and in their judgement have determined that all such leases are operating leases.
Lease incentives Lease incentives including rent-free periods and payments to tenants, are allocated to the income statement on a straight-line basis over the lease term or on another systematic basis, if applicable. The value of resulting accrued rental income is included within the respective property.
Notes forming part of the Group financial statements
72 Great Portland Estates Annual Report 2013
1 Accounting policies (continued)
Other property expenses Irrecoverable running costs directly attributable to specific properties within the Group’s portfolio are charged to the income statement as other property expenses. Costs incurred in the improvement of the portfolio which, in the opinion of the directors, are not of a capital nature are written off to the income statement as incurred.
Administration expenses Costs not directly attributable to individual properties are treated as administration expenses.
Share-based payment The cost of granting share-based payments to employees and directors is recognised within administration expenses in the income statement. The Group has used the Stochastic model to value the grants which is dependent upon factors including the share price, expected volatility and vesting period and the resulting fair value is amortised through the income statement over the vesting period.
The charge is reversed if it is likely that any non-market based criteria will not be met.
Investment property Investment properties and investment properties under development are professionally valued quarterly on a fair value basis by qualified external valuers and the directors must ensure that they are satisfied that the valuation of the Group’s properties is appropriate for inclusion in the accounts without adjustment.
The valuations of investment properties and investment properties under development have been prepared in accordance with the RICS Valuation – Professional Standards (2012) (the Red Book). For investment property this approach involves applying market-derived capitalisation yields to current and market-derived future income streams with appropriate adjustments for income voids arising from vacancies or rent-free periods. These capitalisation yields and future income streams are derived from comparable property and leasing transactions and are considered to be the key inputs in the valuation. Other factors that are taken into account in the valuations include the tenure of the property, tenancy details, planning, building and environmental factors that might affect the property.
In the case of investment property under development, the approach applied is the ‘residual method’ of valuation, which is the investment method of valuation as described above with a deduction for the costs necessary to complete the development, together with an allowance for the remaining risk.
Depreciation No depreciation is provided in respect of freehold investment properties and leasehold investment properties. Depreciation is provided on plant and equipment, at rates calculated to write off the cost, less estimated residual value, based on prices prevailing at the balance sheet date of each asset evenly over its expected useful life, as follows:
Fixtures and fittings – over three to five years.Leasehold improvements – over the term of the lease.
Joint ventures Joint ventures are accounted for under the equity method where, in the directors’ judgement, the Group has joint control of the entity. The Group’s level of control in its joint ventures is driven both by the individual agreements which set out how control is shared by the partners and how that control is exercised in practice. The Group balance sheet contains the Group’s share of the net assets of its joint ventures. Balances with partners owed to or from the Group by joint ventures are included within investments. The Group’s share of joint venture profits and losses are included in the Group income statement in a single line. All of the Group’s joint ventures adopt the accounting policies of the Group for inclusion in the Group financial statements.
Other investmentsOther investments are carried at fair value through profit and loss, with the loan element carried at cost less any recognised impairment loss.
Deferred tax Deferred tax is provided in full on temporary differences between the tax base of an asset or liability and its carrying amount in the balance sheet. Deferred tax is determined using tax rates that have been enacted or substantively enacted by the balance sheet date. Deferred tax assets are recognised when it is probable that taxable profits will be available against which the deferred tax asset can be utilised.
Pension benefits The Group contributes to a defined benefit pension plan which is funded with assets held separately from those of the Group. The full value of the net assets or liabilities of the pension fund is brought on to the balance sheet at each balance sheet date. Actuarial gains and losses are taken to reserves; all other movements are taken to the income statement.
Annual Report 2013 Great Portland Estates 73
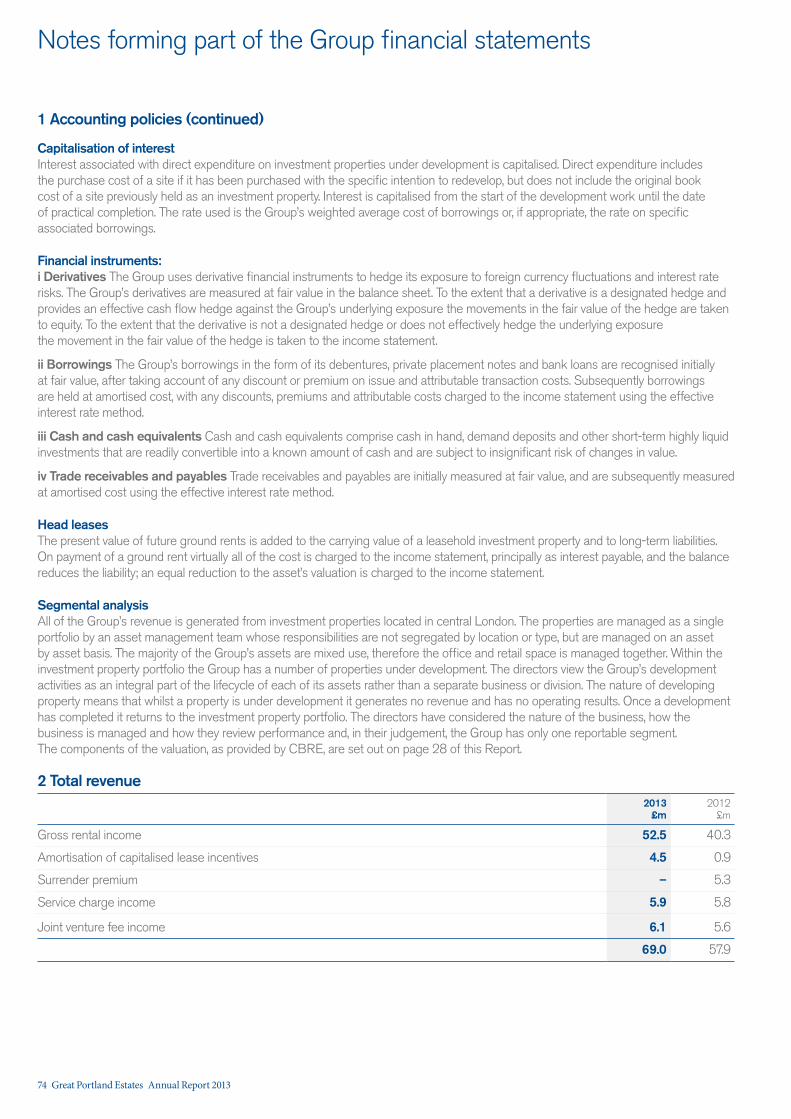
Notes forming part of the Group financial statements
1 Accounting policies (continued)
Capitalisation of interest Interest associated with direct expenditure on investment properties under development is capitalised. Direct expenditure includes the purchase cost of a site if it has been purchased with the specific intention to redevelop, but does not include the original book cost of a site previously held as an investment property. Interest is capitalised from the start of the development work until the date of practical completion. The rate used is the Group’s weighted average cost of borrowings or, if appropriate, the rate on specific associated borrowings.
Financial instruments:i Derivatives The Group uses derivative financial instruments to hedge its exposure to foreign currency fluctuations and interest rate risks. The Group’s derivatives are measured at fair value in the balance sheet. To the extent that a derivative is a designated hedge and provides an effective cash flow hedge against the Group’s underlying exposure the movements in the fair value of the hedge are taken to equity. To the extent that the derivative is not a designated hedge or does not effectively hedge the underlying exposure the movement in the fair value of the hedge is taken to the income statement.
ii Borrowings The Group’s borrowings in the form of its debentures, private placement notes and bank loans are recognised initially at fair value, after taking account of any discount or premium on issue and attributable transaction costs. Subsequently borrowings are held at amortised cost, with any discounts, premiums and attributable costs charged to the income statement using the effective interest rate method.
iii Cash and cash equivalents Cash and cash equivalents comprise cash in hand, demand deposits and other short-term highly liquid investments that are readily convertible into a known amount of cash and are subject to insignificant risk of changes in value.
iv Trade receivables and payables Trade receivables and payables are initially measured at fair value, and are subsequently measured at amortised cost using the effective interest rate method.
Head leases The present value of future ground rents is added to the carrying value of a leasehold investment property and to long-term liabilities. On payment of a ground rent virtually all of the cost is charged to the income statement, principally as interest payable, and the balance reduces the liability; an equal reduction to the asset’s valuation is charged to the income statement.
Segmental analysis All of the Group’s revenue is generated from investment properties located in central London. The properties are managed as a single portfolio by an asset management team whose responsibilities are not segregated by location or type, but are managed on an asset by asset basis. The majority of the Group’s assets are mixed use, therefore the office and retail space is managed together. Within the investment property portfolio the Group has a number of properties under development. The directors view the Group’s development activities as an integral part of the lifecycle of each of its assets rather than a separate business or division. The nature of developing property means that whilst a property is under development it generates no revenue and has no operating results. Once a development has completed it returns to the investment property portfolio. The directors have considered the nature of the business, how the business is managed and how they review performance and, in their judgement, the Group has only one reportable segment. The components of the valuation, as provided by CBRE, are set out on page 28 of this Report.
2 Total revenue 2013
£m2012
£m
Gross rental income 52.5 40.3
Amortisation of capitalised lease incentives 4.5 0.9
Surrender premium – 5.3
Service charge income 5.9 5.8
Joint venture fee income 6.1 5.6
69.0 57.9
74 Great Portland Estates Annual Report 2013
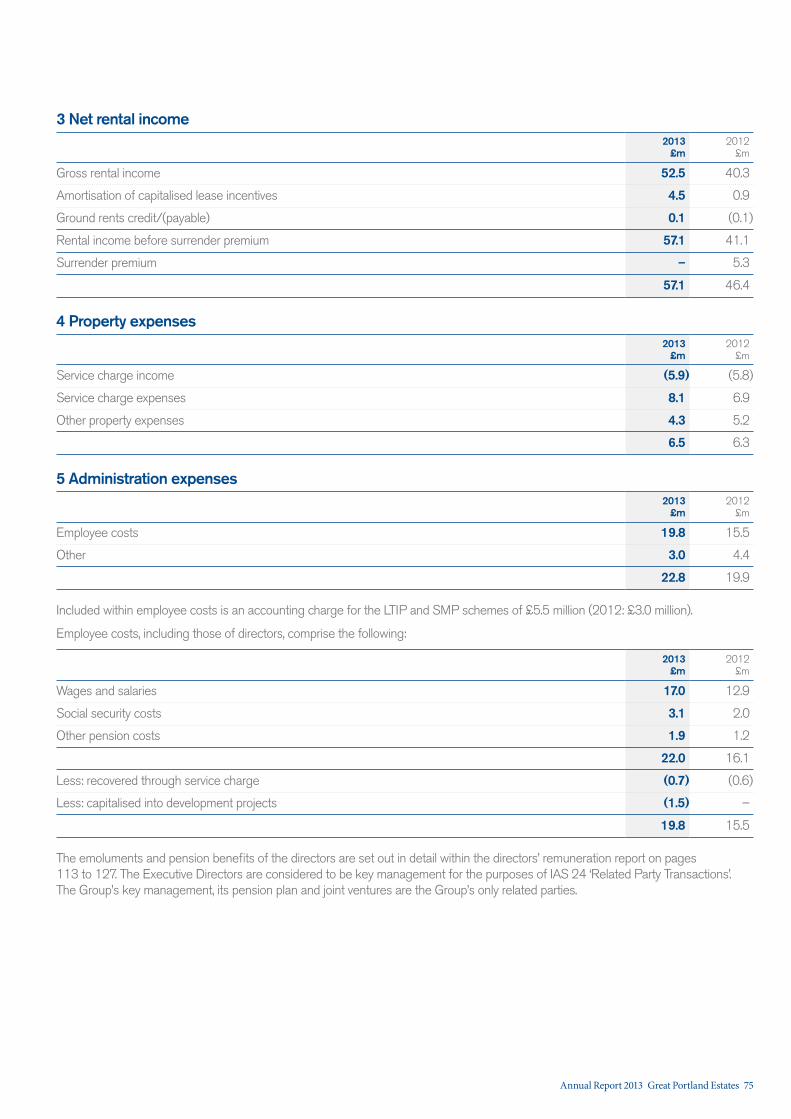
3 Net rental income2013
£m2012
£m
Gross rental income 52.5 40.3
Amortisation of capitalised lease incentives 4.5 0.9
Ground rents credit/(payable) 0.1 (0.1)
Rental income before surrender premium 57.1 41.1
Surrender premium – 5.3
57.1 46.4
4 Property expenses2013
£m2012
£m
Service charge income (5.9) (5.8)
Service charge expenses 8.1 6.9
Other property expenses 4.3 5.2
6.5 6.3
5 Administration expenses2013
£m2012
£m
Employee costs 19.8 15.5
Other 3.0 4.4
22.8 19.9
Included within employee costs is an accounting charge for the LTIP and SMP schemes of £5.5 million (2012: £3.0 million).
Employee costs, including those of directors, comprise the following:
2013£m
2012£m
Wages and salaries 17.0 12.9
Social security costs 3.1 2.0
Other pension costs 1.9 1.2
22.0 16.1
Less: recovered through service charge (0.7) (0.6)
Less: capitalised into development projects (1.5) –
19.8 15.5
The emoluments and pension benefits of the directors are set out in detail within the directors’ remuneration report on pages 113 to 127. The Executive Directors are considered to be key management for the purposes of IAS 24 ‘Related Party Transactions’. The Group’s key management, its pension plan and joint ventures are the Group’s only related parties.
Annual Report 2013 Great Portland Estates 75
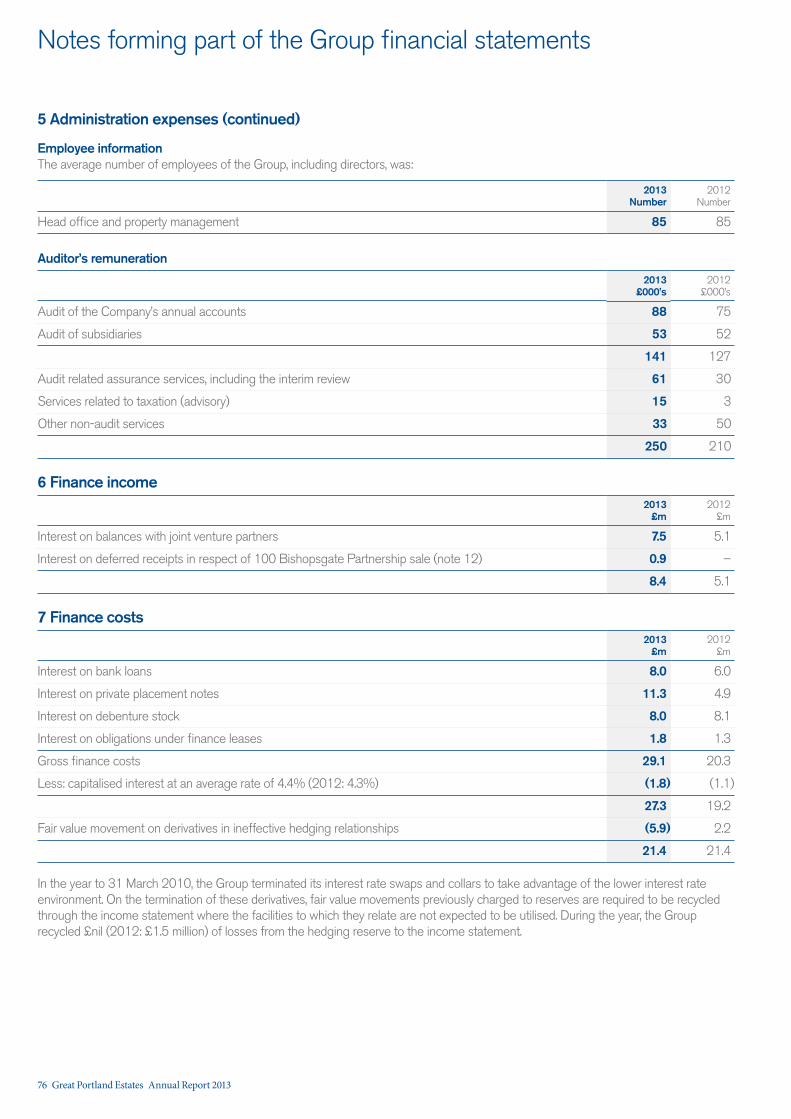
Notes forming part of the Group financial statements
5 Administration expenses (continued)
Employee informationThe average number of employees of the Group, including directors, was:
2013Number
2012Number
Head office and property management 85 85
Auditor’s remuneration
2013£000’s
2012£000’s
Audit of the Company’s annual accounts 88 75
Audit of subsidiaries 53 52
141 127
Audit related assurance services, including the interim review 61 30
Services related to taxation (advisory) 15 3
Other non-audit services 33 50
250 210
6 Finance income2013
£m2012
£m
Interest on balances with joint venture partners 7.5 5.1
Interest on deferred receipts in respect of 100 Bishopsgate Partnership sale (note 12) 0.9 –
8.4 5.1
7 Finance costs2013
£m2012
£m
Interest on bank loans 8.0 6.0
Interest on private placement notes 11.3 4.9
Interest on debenture stock 8.0 8.1
Interest on obligations under finance leases 1.8 1.3
Gross finance costs 29.1 20.3
Less: capitalised interest at an average rate of 4.4% (2012: 4.3%) (1.8) (1.1)
27.3 19.2
Fair value movement on derivatives in ineffective hedging relationships (5.9) 2.2
21.4 21.4
In the year to 31 March 2010, the Group terminated its interest rate swaps and collars to take advantage of the lower interest rate environment. On the termination of these derivatives, fair value movements previously charged to reserves are required to be recycled through the income statement where the facilities to which they relate are not expected to be utilised. During the year, the Group recycled £nil (2012: £1.5 million) of losses from the hedging reserve to the income statement.
76 Great Portland Estates Annual Report 2013
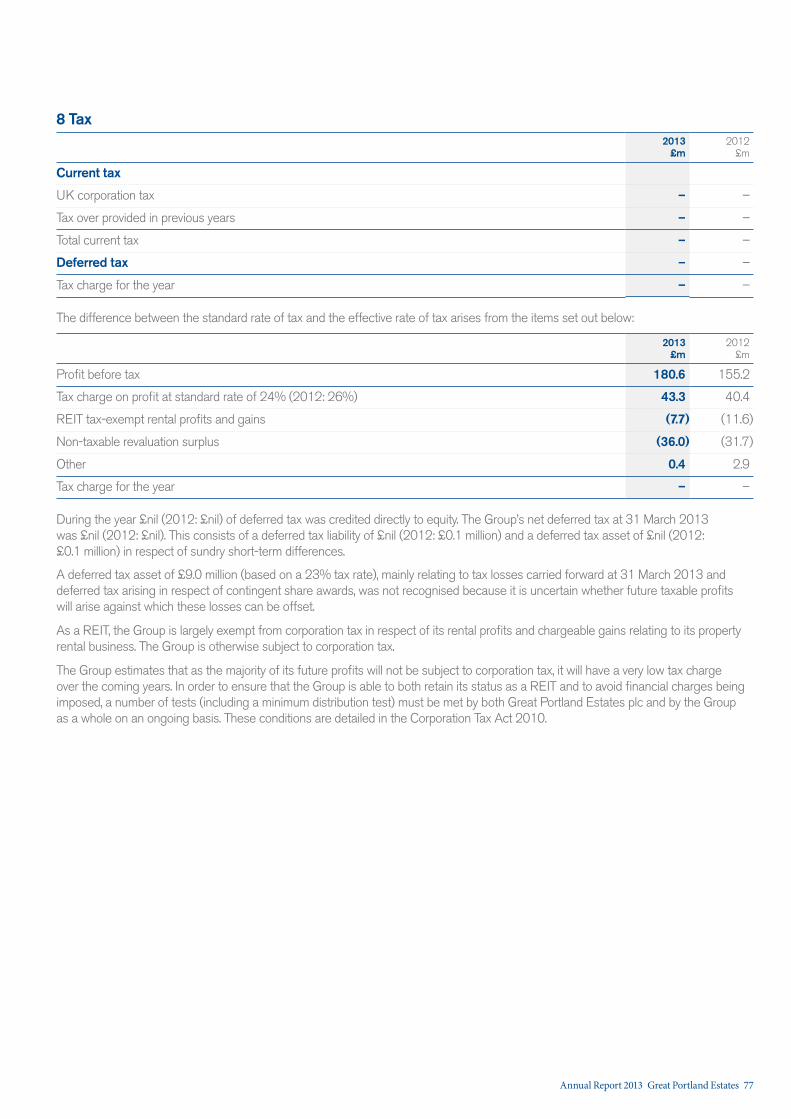
8 Tax2013
£m2012
£m
Current tax
UK corporation tax – –
Tax over provided in previous years – –
Total current tax – –
Deferred tax – –
Tax charge for the year – –
The difference between the standard rate of tax and the effective rate of tax arises from the items set out below:
2013£m
2012£m
Profit before tax 180.6 155.2
Tax charge on profit at standard rate of 24% (2012: 26%) 43.3 40.4
REIT tax-exempt rental profits and gains (7.7) (11.6)
Non-taxable revaluation surplus (36.0) (31.7)
Other 0.4 2.9
Tax charge for the year – –
During the year £nil (2012: £nil) of deferred tax was credited directly to equity. The Group’s net deferred tax at 31 March 2013 was £nil (2012: £nil). This consists of a deferred tax liability of £nil (2012: £0.1 million) and a deferred tax asset of £nil (2012: £0.1 million) in respect of sundry short-term differences.
A deferred tax asset of £9.0 million (based on a 23% tax rate), mainly relating to tax losses carried forward at 31 March 2013 and deferred tax arising in respect of contingent share awards, was not recognised because it is uncertain whether future taxable profits will arise against which these losses can be offset.
As a REIT, the Group is largely exempt from corporation tax in respect of its rental profits and chargeable gains relating to its property rental business. The Group is otherwise subject to corporation tax.
The Group estimates that as the majority of its future profits will not be subject to corporation tax, it will have a very low tax charge over the coming years. In order to ensure that the Group is able to both retain its status as a REIT and to avoid financial charges being imposed, a number of tests (including a minimum distribution test) must be met by both Great Portland Estates plc and by the Group as a whole on an ongoing basis. These conditions are detailed in the Corporation Tax Act 2010.
Annual Report 2013 Great Portland Estates 77
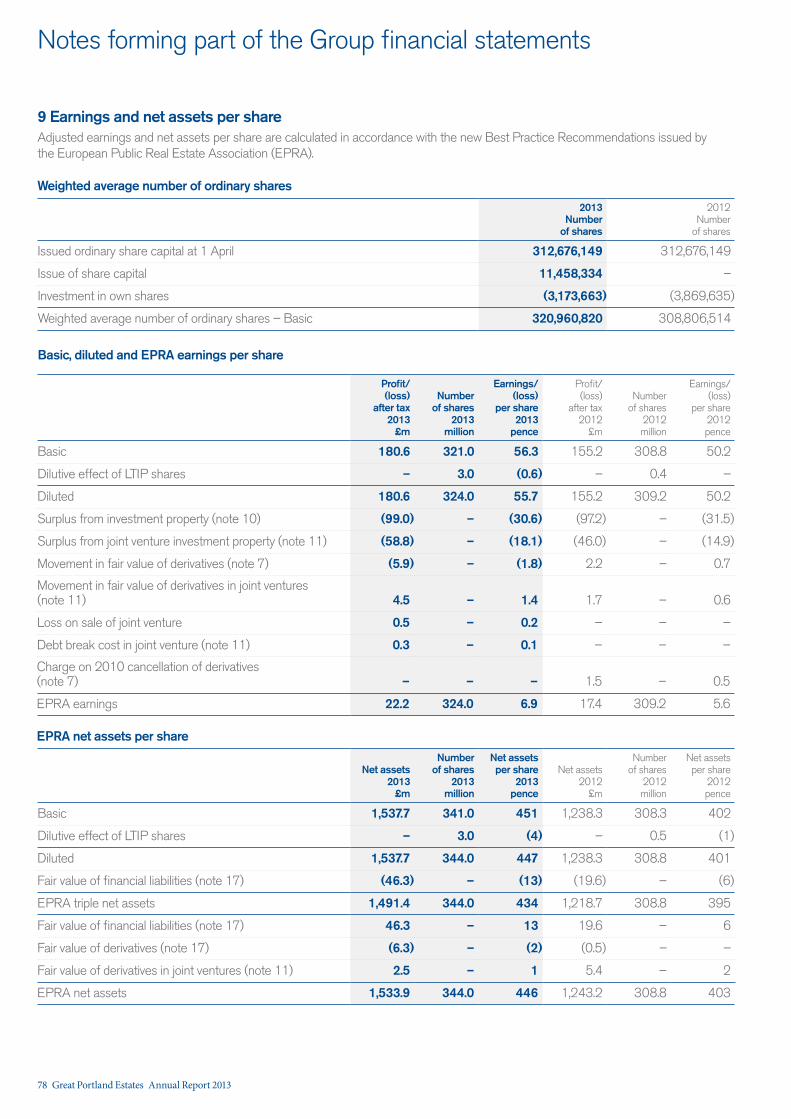
Notes forming part of the Group financial statements
9 Earnings and net assets per shareAdjusted earnings and net assets per share are calculated in accordance with the new Best Practice Recommendations issued by the European Public Real Estate Association (EPRA).
Weighted average number of ordinary shares
2013Number
of shares
2012Number
of shares
Issued ordinary share capital at 1 April 312,676,149 312,676,149
Issue of share capital 11,458,334 –
Investment in own shares (3,173,663) (3,869,635)
Weighted average number of ordinary shares – Basic 320,960,820 308,806,514
Basic, diluted and EPRA earnings per share
Profit/(loss)
after tax 2013
£m
Number of shares
2013 million
Earnings/(loss)
per share 2013
pence
Profit/(loss)
after tax 2012
£m
Number of shares
2012 million
Earnings/(loss)
per share 2012pence
Basic 180.6 321.0 56.3 155.2 308.8 50.2
Dilutive effect of LTIP shares – 3.0 (0.6) – 0.4 –
Diluted 180.6 324.0 55.7 155.2 309.2 50.2
Surplus from investment property (note 10) (99.0) – (30.6) (97.2) – (31.5)
Surplus from joint venture investment property (note 11) (58.8) – (18.1) (46.0) – (14.9)
Movement in fair value of derivatives (note 7) (5.9) – (1.8) 2.2 – 0.7
Movement in fair value of derivatives in joint ventures (note 11) 4.5 – 1.4 1.7 – 0.6
Loss on sale of joint venture 0.5 – 0.2 – – –
Debt break cost in joint venture (note 11) 0.3 – 0.1 – – –
Charge on 2010 cancellation of derivatives (note 7) – – – 1.5 – 0.5
EPRA earnings 22.2 324.0 6.9 17.4 309.2 5.6
EPRA net assets per share
Net assets 2013
£m
Number of shares
2013 million
Net assets per share
2013 pence
Net assets 2012
£m
Number of shares
2012million
Net assets per share
2012pence
Basic 1,537.7 341.0 451 1,238.3 308.3 402
Dilutive effect of LTIP shares – 3.0 (4) – 0.5 (1)
Diluted 1,537.7 344.0 447 1,238.3 308.8 401
Fair value of financial liabilities (note 17) (46.3) – (13) (19.6) – (6)
EPRA triple net assets 1,491.4 344.0 434 1,218.7 308.8 395
Fair value of financial liabilities (note 17) 46.3 – 13 19.6 – 6
Fair value of derivatives (note 17) (6.3) – (2) (0.5) – –
Fair value of derivatives in joint ventures (note 11) 2.5 – 1 5.4 – 2
EPRA net assets 1,533.9 344.0 446 1,243.2 308.8 403
78 Great Portland Estates Annual Report 2013
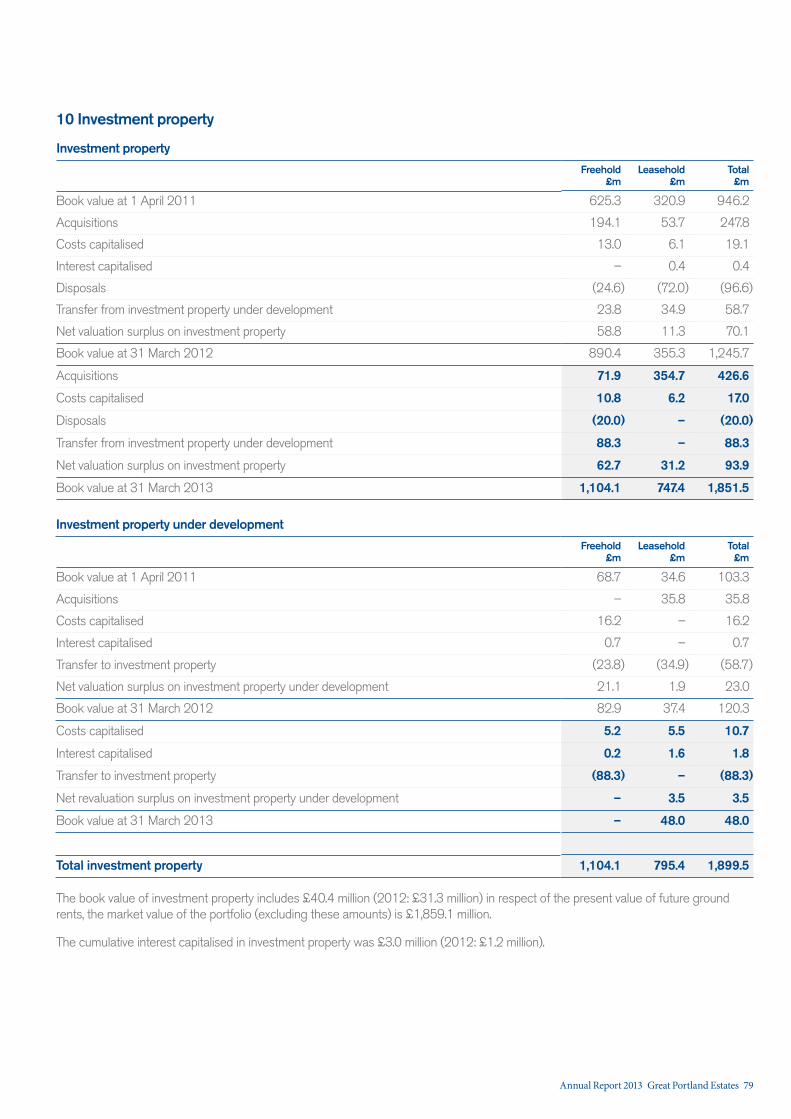
10 Investment property
Investment property
Freehold£m
Leasehold£m
Total£m
Book value at 1 April 2011 625.3 320.9 946.2
Acquisitions 194.1 53.7 247.8
Costs capitalised 13.0 6.1 19.1
Interest capitalised – 0.4 0.4
Disposals (24.6) (72.0) (96.6)
Transfer from investment property under development 23.8 34.9 58.7
Net valuation surplus on investment property 58.8 11.3 70.1
Book value at 31 March 2012 890.4 355.3 1,245.7
Acquisitions 71.9 354.7 426.6
Costs capitalised 10.8 6.2 17.0
Disposals (20.0) – (20.0)
Transfer from investment property under development 88.3 – 88.3
Net valuation surplus on investment property 62.7 31.2 93.9
Book value at 31 March 2013 1,104.1 747.4 1,851.5
Investment property under development
Freehold£m
Leasehold£m
Total£m
Book value at 1 April 2011 68.7 34.6 103.3
Acquisitions – 35.8 35.8
Costs capitalised 16.2 – 16.2
Interest capitalised 0.7 – 0.7
Transfer to investment property (23.8) (34.9) (58.7)
Net valuation surplus on investment property under development 21.1 1.9 23.0
Book value at 31 March 2012 82.9 37.4 120.3
Costs capitalised 5.2 5.5 10.7
Interest capitalised 0.2 1.6 1.8
Transfer to investment property (88.3) – (88.3)
Net revaluation surplus on investment property under development – 3.5 3.5
Book value at 31 March 2013 – 48.0 48.0
Total investment property 1,104.1 795.4 1,899.5
The book value of investment property includes £40.4 million (2012: £31.3 million) in respect of the present value of future ground rents, the market value of the portfolio (excluding these amounts) is £1,859.1 million.
The cumulative interest capitalised in investment property was £3.0 million (2012: £1.2 million).
Annual Report 2013 Great Portland Estates 79
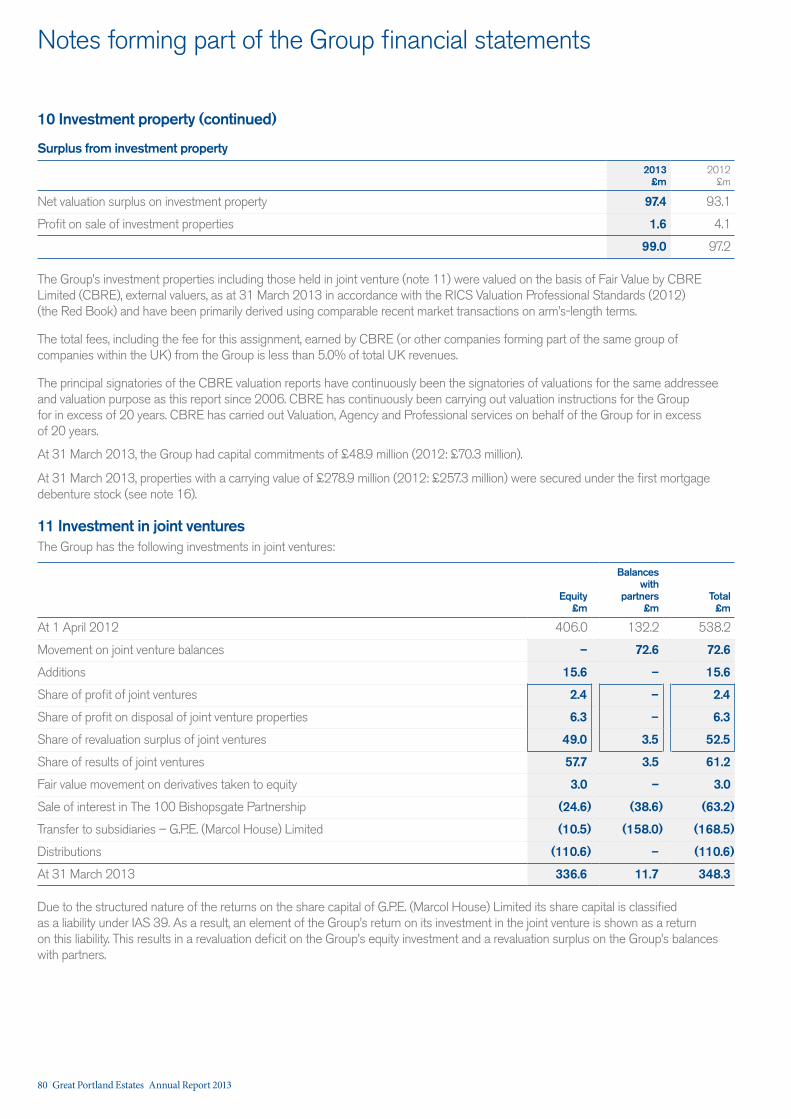
Notes forming part of the Group financial statements
10 Investment property (continued)
Surplus from investment property
2013£m
2012£m
Net valuation surplus on investment property 97.4 93.1
Profit on sale of investment properties 1.6 4.1
99.0 97.2
The Group’s investment properties including those held in joint venture (note 11) were valued on the basis of Fair Value by CBRE Limited (CBRE), external valuers, as at 31 March 2013 in accordance with the RICS Valuation Professional Standards (2012) (the Red Book) and have been primarily derived using comparable recent market transactions on arm’s-length terms.
The total fees, including the fee for this assignment, earned by CBRE (or other companies forming part of the same group of companies within the UK) from the Group is less than 5.0% of total UK revenues.
The principal signatories of the CBRE valuation reports have continuously been the signatories of valuations for the same addressee and valuation purpose as this report since 2006. CBRE has continuously been carrying out valuation instructions for the Group for in excess of 20 years. CBRE has carried out Valuation, Agency and Professional services on behalf of the Group for in excess of 20 years.
At 31 March 2013, the Group had capital commitments of £48.9 million (2012: £70.3 million).
At 31 March 2013, properties with a carrying value of £278.9 million (2012: £257.3 million) were secured under the first mortgage debenture stock (see note 16).
11 Investment in joint venturesThe Group has the following investments in joint ventures:
Equity£m
Balances with
partners£m
Total£m
At 1 April 2012 406.0 132.2 538.2
Movement on joint venture balances – 72.6 72.6
Additions 15.6 – 15.6
Share of profit of joint ventures 2.4 – 2.4
Share of profit on disposal of joint venture properties 6.3 – 6.3
Share of revaluation surplus of joint ventures 49.0 3.5 52.5
Share of results of joint ventures 57.7 3.5 61.2
Fair value movement on derivatives taken to equity 3.0 – 3.0
Sale of interest in The 100 Bishopsgate Partnership (24.6) (38.6) (63.2)
Transfer to subsidiaries – G.P.E. (Marcol House) Limited (10.5) (158.0) (168.5)
Distributions (110.6) – (110.6)
At 31 March 2013 336.6 11.7 348.3
Due to the structured nature of the returns on the share capital of G.P.E. (Marcol House) Limited its share capital is classified as a liability under IAS 39. As a result, an element of the Group’s return on its investment in the joint venture is shown as a return on this liability. This results in a revaluation deficit on the Group’s equity investment and a revaluation surplus on the Group’s balances with partners.
80 Great Portland Estates Annual Report 2013
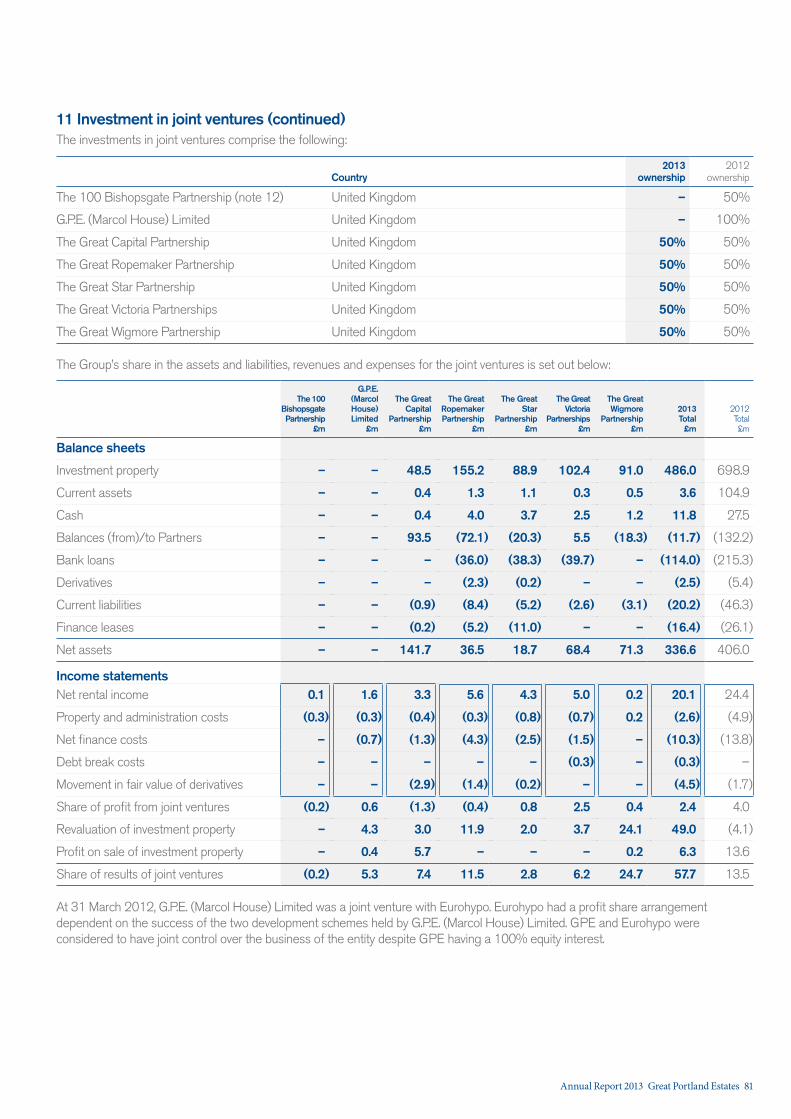
11 Investment in joint ventures (continued)The investments in joint ventures comprise the following:
Country2013
ownership2012
ownership
The 100 Bishopsgate Partnership (note 12) United Kingdom – 50%
G.P.E. (Marcol House) Limited United Kingdom – 100%
The Great Capital Partnership United Kingdom 50% 50%
The Great Ropemaker Partnership United Kingdom 50% 50%
The Great Star Partnership United Kingdom 50% 50%
The Great Victoria Partnerships United Kingdom 50% 50%
The Great Wigmore Partnership United Kingdom 50% 50%
The Group’s share in the assets and liabilities, revenues and expenses for the joint ventures is set out below:
The 100 Bishopsgate Partnership
£m
G.P.E. (Marcol House) Limited
£m
The Great Capital
Partnership £m
The Great Ropemaker Partnership
£m
The Great Star
Partnership £m
The Great Victoria
Partnerships £m
The Great Wigmore
Partnership £m
2013 Total
£m
2012 Total £m
Balance sheets
Investment property – – 48.5 155.2 88.9 102.4 91.0 486.0 698.9
Current assets – – 0.4 1.3 1.1 0.3 0.5 3.6 104.9
Cash – – 0.4 4.0 3.7 2.5 1.2 11.8 27.5
Balances (from)/to Partners – – 93.5 (72.1) (20.3) 5.5 (18.3) (11.7) (132.2)
Bank loans – – – (36.0) (38.3) (39.7) – (114.0) (215.3)
Derivatives – – – (2.3) (0.2) – – (2.5) (5.4)
Current liabilities – – (0.9) (8.4) (5.2) (2.6) (3.1) (20.2) (46.3)
Finance leases – – (0.2) (5.2) (11.0) – – (16.4) (26.1)
Net assets – – 141.7 36.5 18.7 68.4 71.3 336.6 406.0
Income statementsNet rental income 0.1 1.6 3.3 5.6 4.3 5.0 0.2 20.1 24.4
Property and administration costs (0.3) (0.3) (0.4) (0.3) (0.8) (0.7) 0.2 (2.6) (4.9)
Net finance costs – (0.7) (1.3) (4.3) (2.5) (1.5) – (10.3) (13.8)
Debt break costs – – – – – (0.3) – (0.3) –
Movement in fair value of derivatives – – (2.9) (1.4) (0.2) – – (4.5) (1.7)
Share of profit from joint ventures (0.2) 0.6 (1.3) (0.4) 0.8 2.5 0.4 2.4 4.0
Revaluation of investment property – 4.3 3.0 11.9 2.0 3.7 24.1 49.0 (4.1)
Profit on sale of investment property – 0.4 5.7 – – – 0.2 6.3 13.6
Share of results of joint ventures (0.2) 5.3 7.4 11.5 2.8 6.2 24.7 57.7 13.5
At 31 March 2012, G.P.E. (Marcol House) Limited was a joint venture with Eurohypo. Eurohypo had a profit share arrangement dependent on the success of the two development schemes held by G.P.E. (Marcol House) Limited. GPE and Eurohypo were considered to have joint control over the business of the entity despite GPE having a 100% equity interest.
Annual Report 2013 Great Portland Estates 81
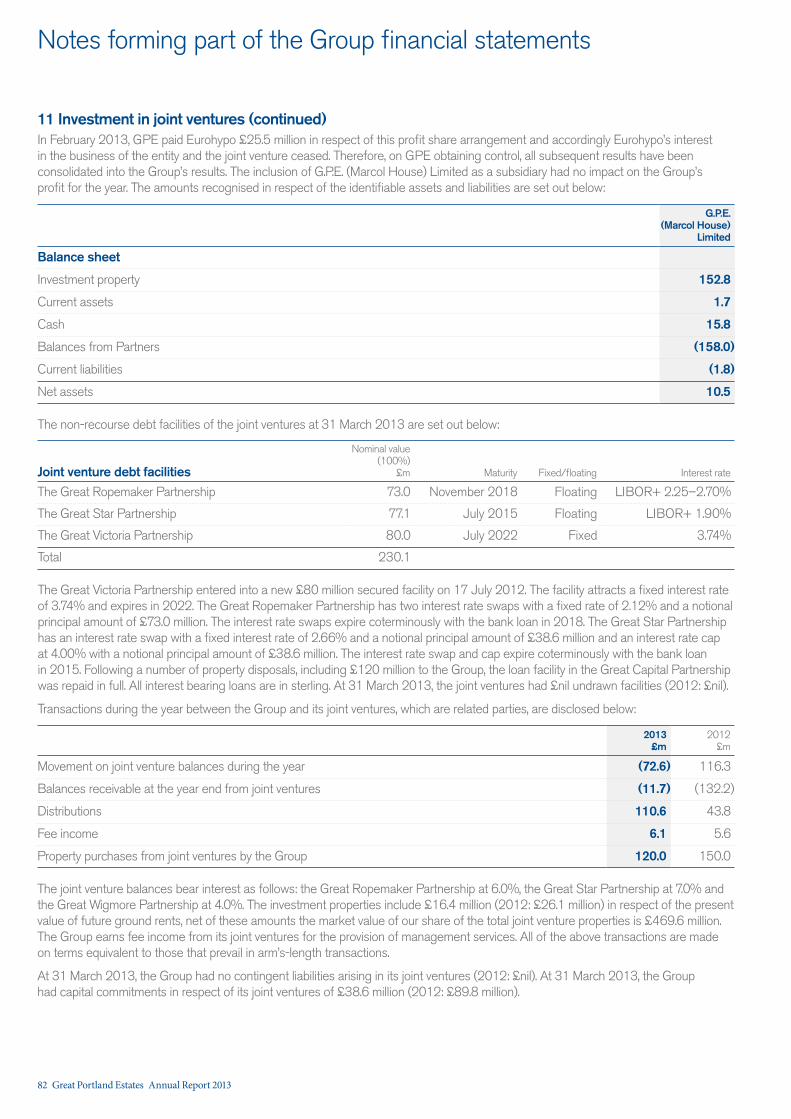
Notes forming part of the Group financial statements
11 Investment in joint ventures (continued)In February 2013, GPE paid Eurohypo £25.5 million in respect of this profit share arrangement and accordingly Eurohypo’s interest in the business of the entity and the joint venture ceased. Therefore, on GPE obtaining control, all subsequent results have been consolidated into the Group’s results. The inclusion of G.P.E. (Marcol House) Limited as a subsidiary had no impact on the Group’s profit for the year. The amounts recognised in respect of the identifiable assets and liabilities are set out below:
G.P.E. (Marcol House)
Limited
Balance sheet
Investment property 152.8
Current assets 1.7
Cash 15.8
Balances from Partners (158.0)
Current liabilities (1.8)
Net assets 10.5
The non-recourse debt facilities of the joint ventures at 31 March 2013 are set out below:
Joint venture debt facilities
Nominal value (100%)
£m Maturity Fixed/floating Interest rate
The Great Ropemaker Partnership 73.0 November 2018 Floating LIBOR+ 2.25–2.70%
The Great Star Partnership 77.1 July 2015 Floating LIBOR+ 1.90%
The Great Victoria Partnership 80.0 July 2022 Fixed 3.74%
Total 230.1
The Great Victoria Partnership entered into a new £80 million secured facility on 17 July 2012. The facility attracts a fixed interest rate of 3.74% and expires in 2022. The Great Ropemaker Partnership has two interest rate swaps with a fixed rate of 2.12% and a notional principal amount of £73.0 million. The interest rate swaps expire coterminously with the bank loan in 2018. The Great Star Partnership has an interest rate swap with a fixed interest rate of 2.66% and a notional principal amount of £38.6 million and an interest rate cap at 4.00% with a notional principal amount of £38.6 million. The interest rate swap and cap expire coterminously with the bank loan in 2015. Following a number of property disposals, including £120 million to the Group, the loan facility in the Great Capital Partnership was repaid in full. All interest bearing loans are in sterling. At 31 March 2013, the joint ventures had £nil undrawn facilities (2012: £nil).
Transactions during the year between the Group and its joint ventures, which are related parties, are disclosed below:
2013£m
2012£m
Movement on joint venture balances during the year (72.6) 116.3
Balances receivable at the year end from joint ventures (11.7) (132.2)
Distributions 110.6 43.8
Fee income 6.1 5.6
Property purchases from joint ventures by the Group 120.0 150.0
The joint venture balances bear interest as follows: the Great Ropemaker Partnership at 6.0%, the Great Star Partnership at 7.0% and the Great Wigmore Partnership at 4.0%. The investment properties include £16.4 million (2012: £26.1 million) in respect of the present value of future ground rents, net of these amounts the market value of our share of the total joint venture properties is £469.6 million. The Group earns fee income from its joint ventures for the provision of management services. All of the above transactions are made on terms equivalent to those that prevail in arm’s-length transactions.
At 31 March 2013, the Group had no contingent liabilities arising in its joint ventures (2012: £nil). At 31 March 2013, the Group had capital commitments in respect of its joint ventures of £38.6 million (2012: £89.8 million).
82 Great Portland Estates Annual Report 2013
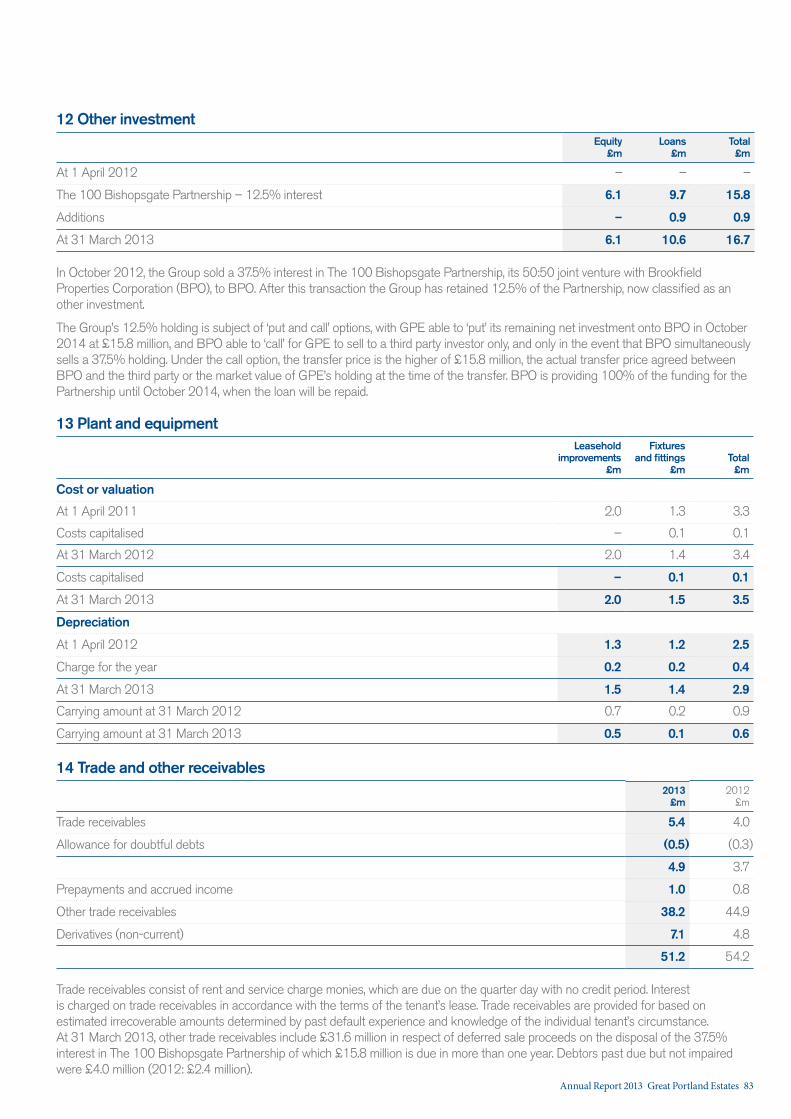
12 Other investment
Equity
£mLoans
£mTotal
£m
At 1 April 2012 – – –
The 100 Bishopsgate Partnership – 12.5% interest 6.1 9.7 15.8
Additions – 0.9 0.9
At 31 March 2013 6.1 10.6 16.7
In October 2012, the Group sold a 37.5% interest in The 100 Bishopsgate Partnership, its 50:50 joint venture with Brookfield Properties Corporation (BPO), to BPO. After this transaction the Group has retained 12.5% of the Partnership, now classified as an other investment.
The Group’s 12.5% holding is subject of ‘put and call’ options, with GPE able to ‘put’ its remaining net investment onto BPO in October 2014 at £15.8 million, and BPO able to ‘call’ for GPE to sell to a third party investor only, and only in the event that BPO simultaneously sells a 37.5% holding. Under the call option, the transfer price is the higher of £15.8 million, the actual transfer price agreed between BPO and the third party or the market value of GPE’s holding at the time of the transfer. BPO is providing 100% of the funding for the Partnership until October 2014, when the loan will be repaid.
13 Plant and equipmentLeasehold
improvements£m
Fixtures and fittings
£mTotal
£m
Cost or valuation
At 1 April 2011 2.0 1.3 3.3
Costs capitalised – 0.1 0.1
At 31 March 2012 2.0 1.4 3.4
Costs capitalised – 0.1 0.1
At 31 March 2013 2.0 1.5 3.5
Depreciation
At 1 April 2012 1.3 1.2 2.5
Charge for the year 0.2 0.2 0.4
At 31 March 2013 1.5 1.4 2.9
Carrying amount at 31 March 2012 0.7 0.2 0.9
Carrying amount at 31 March 2013 0.5 0.1 0.6
14 Trade and other receivables2013
£m2012
£m
Trade receivables 5.4 4.0
Allowance for doubtful debts (0.5) (0.3)
4.9 3.7
Prepayments and accrued income 1.0 0.8
Other trade receivables 38.2 44.9
Derivatives (non-current) 7.1 4.8
51.2 54.2
Trade receivables consist of rent and service charge monies, which are due on the quarter day with no credit period. Interest is charged on trade receivables in accordance with the terms of the tenant’s lease. Trade receivables are provided for based on estimated irrecoverable amounts determined by past default experience and knowledge of the individual tenant’s circumstance. At 31 March 2013, other trade receivables include £31.6 million in respect of deferred sale proceeds on the disposal of the 37.5% interest in The 100 Bishopsgate Partnership of which £15.8 million is due in more than one year. Debtors past due but not impaired were £4.0 million (2012: £2.4 million).
Annual Report 2013 Great Portland Estates 83
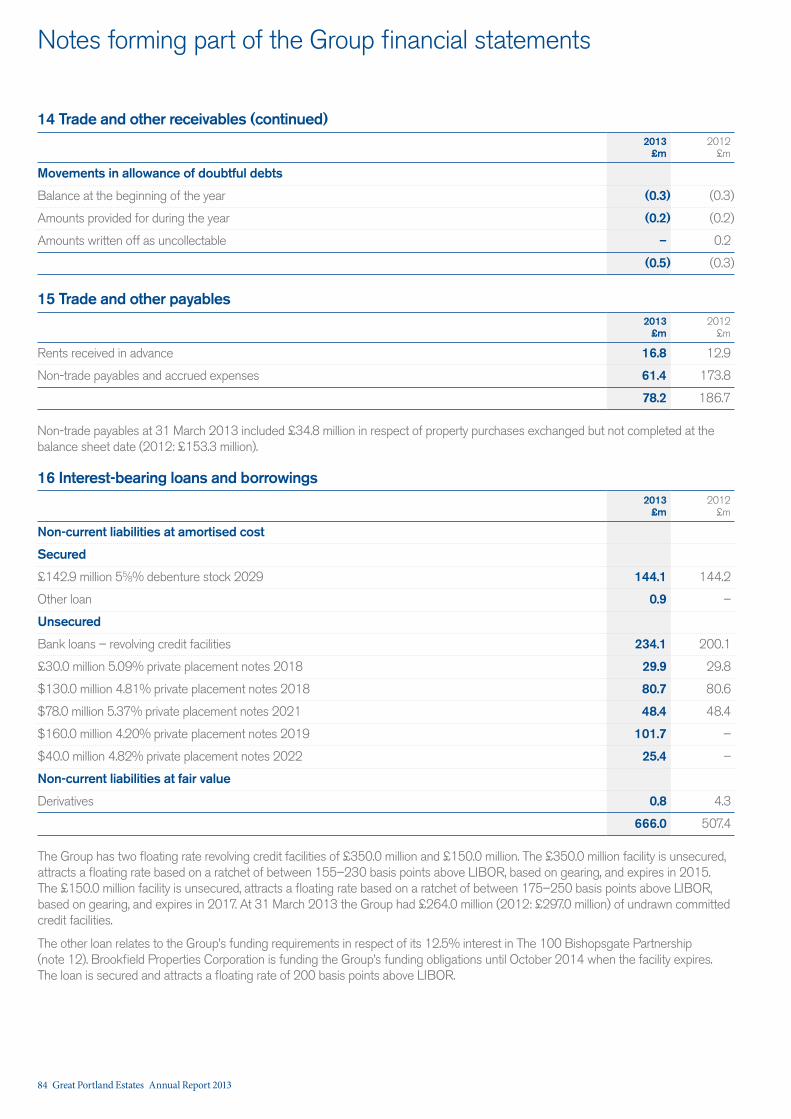
Notes forming part of the Group financial statements
14 Trade and other receivables (continued)2013
£m2012
£m
Movements in allowance of doubtful debts
Balance at the beginning of the year (0.3) (0.3)
Amounts provided for during the year (0.2) (0.2)
Amounts written off as uncollectable – 0.2
(0.5) (0.3)
15 Trade and other payables2013
£m2012
£m
Rents received in advance 16.8 12.9
Non-trade payables and accrued expenses 61.4 173.8
78.2 186.7
Non-trade payables at 31 March 2013 included £34.8 million in respect of property purchases exchanged but not completed at the balance sheet date (2012: £153.3 million).
16 Interest-bearing loans and borrowings2013
£m2012
£m
Non-current liabilities at amortised cost
Secured
£142.9 million 55⁄8% debenture stock 2029 144.1 144.2
Other loan 0.9 –
Unsecured
Bank loans – revolving credit facilities 234.1 200.1
£30.0 million 5.09% private placement notes 2018 29.9 29.8
$130.0 million 4.81% private placement notes 2018 80.7 80.6
$78.0 million 5.37% private placement notes 2021 48.4 48.4
$160.0 million 4.20% private placement notes 2019 101.7 –
$40.0 million 4.82% private placement notes 2022 25.4 –
Non-current liabilities at fair value
Derivatives 0.8 4.3
666.0 507.4
The Group has two floating rate revolving credit facilities of £350.0 million and £150.0 million. The £350.0 million facility is unsecured, attracts a floating rate based on a ratchet of between 155–230 basis points above LIBOR, based on gearing, and expires in 2015. The £150.0 million facility is unsecured, attracts a floating rate based on a ratchet of between 175–250 basis points above LIBOR, based on gearing, and expires in 2017. At 31 March 2013 the Group had £264.0 million (2012: £297.0 million) of undrawn committed credit facilities.
The other loan relates to the Group’s funding requirements in respect of its 12.5% interest in The 100 Bishopsgate Partnership (note 12). Brookfield Properties Corporation is funding the Group’s funding obligations until October 2014 when the facility expires. The loan is secured and attracts a floating rate of 200 basis points above LIBOR.
84 Great Portland Estates Annual Report 2013
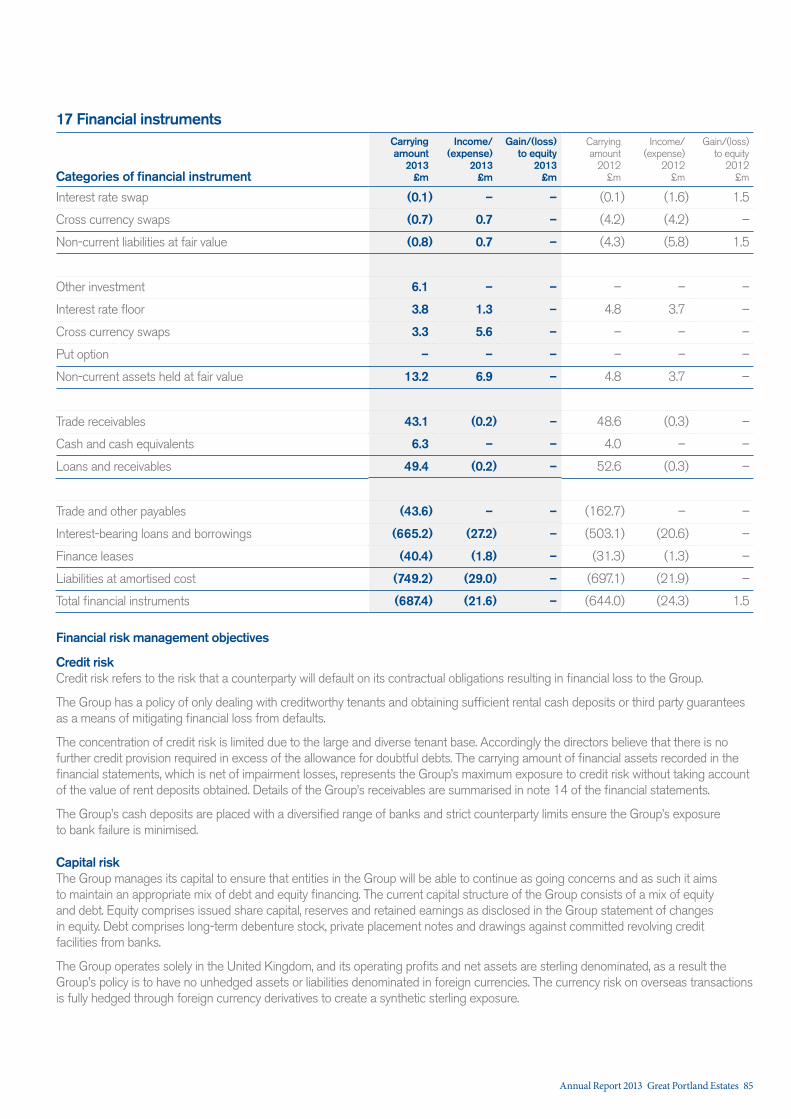
17 Financial instruments
Categories of financial instrument
Carrying amount
2013 £m
Income/ (expense)
2013 £m
Gain/(loss) to equity
2013£m
Carrying amount
2012£m
Income/ (expense)
2012 £m
Gain/(loss) to equity
2012£m
Interest rate swap (0.1) – – (0.1) (1.6) 1.5
Cross currency swaps (0.7) 0.7 – (4.2) (4.2) –
Non-current liabilities at fair value (0.8) 0.7 – (4.3) (5.8) 1.5
Other investment 6.1 – – – – –
Interest rate floor 3.8 1.3 – 4.8 3.7 –
Cross currency swaps 3.3 5.6 – – – –
Put option – – – – – –
Non-current assets held at fair value 13.2 6.9 – 4.8 3.7 –
Trade receivables 43.1 (0.2) – 48.6 (0.3) –
Cash and cash equivalents 6.3 – – 4.0 – –
Loans and receivables 49.4 (0.2) – 52.6 (0.3) –
Trade and other payables (43.6) – – (162.7) – –
Interest-bearing loans and borrowings (665.2) (27.2) – (503.1) (20.6) –
Finance leases (40.4) (1.8) – (31.3) (1.3) –
Liabilities at amortised cost (749.2) (29.0) – (697.1) (21.9) –
Total financial instruments (687.4) (21.6) – (644.0) (24.3) 1.5
Financial risk management objectives
Credit riskCredit risk refers to the risk that a counterparty will default on its contractual obligations resulting in financial loss to the Group.
The Group has a policy of only dealing with creditworthy tenants and obtaining sufficient rental cash deposits or third party guarantees as a means of mitigating financial loss from defaults.
The concentration of credit risk is limited due to the large and diverse tenant base. Accordingly the directors believe that there is no further credit provision required in excess of the allowance for doubtful debts. The carrying amount of financial assets recorded in the financial statements, which is net of impairment losses, represents the Group’s maximum exposure to credit risk without taking account of the value of rent deposits obtained. Details of the Group’s receivables are summarised in note 14 of the financial statements.
The Group’s cash deposits are placed with a diversified range of banks and strict counterparty limits ensure the Group’s exposure to bank failure is minimised.
Capital riskThe Group manages its capital to ensure that entities in the Group will be able to continue as going concerns and as such it aims to maintain an appropriate mix of debt and equity financing. The current capital structure of the Group consists of a mix of equity and debt. Equity comprises issued share capital, reserves and retained earnings as disclosed in the Group statement of changes in equity. Debt comprises long-term debenture stock, private placement notes and drawings against committed revolving credit facilities from banks.
The Group operates solely in the United Kingdom, and its operating profits and net assets are sterling denominated, as a result the Group’s policy is to have no unhedged assets or liabilities denominated in foreign currencies. The currency risk on overseas transactions is fully hedged through foreign currency derivatives to create a synthetic sterling exposure.
Annual Report 2013 Great Portland Estates 85
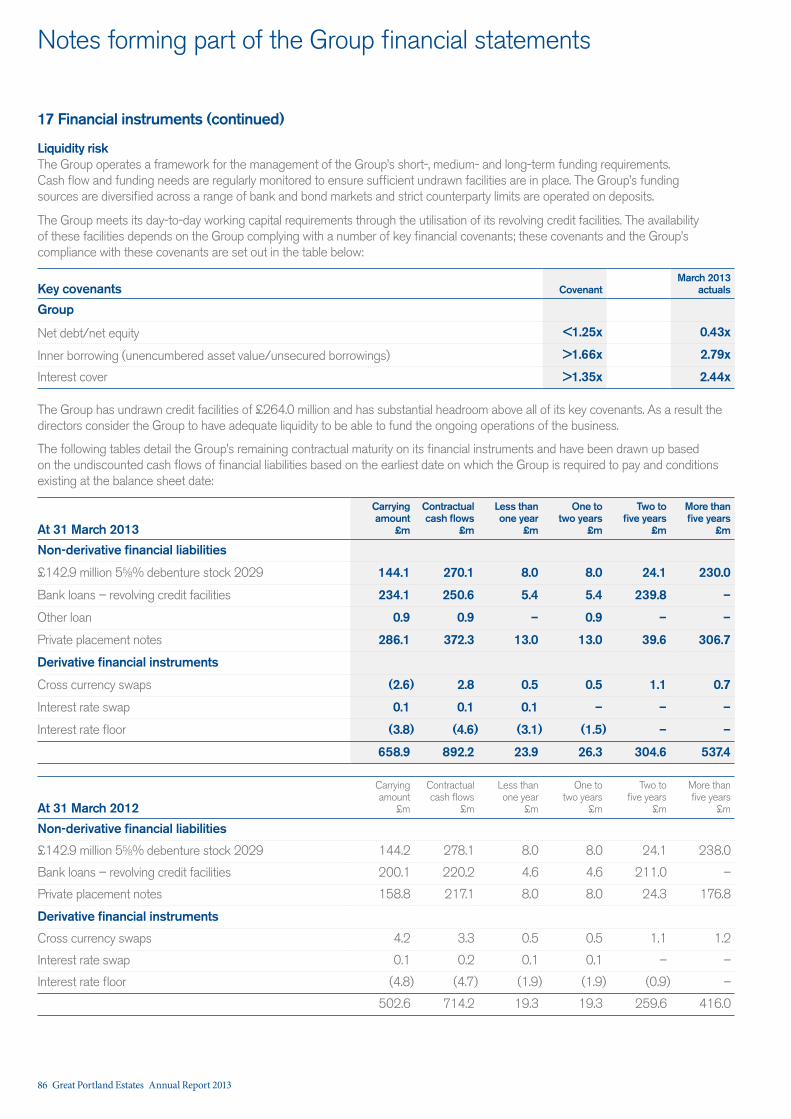
Notes forming part of the Group financial statements
17 Financial instruments (continued)
Liquidity riskThe Group operates a framework for the management of the Group’s short-, medium- and long-term funding requirements. Cash flow and funding needs are regularly monitored to ensure sufficient undrawn facilities are in place. The Group’s funding sources are diversified across a range of bank and bond markets and strict counterparty limits are operated on deposits.
The Group meets its day-to-day working capital requirements through the utilisation of its revolving credit facilities. The availability of these facilities depends on the Group complying with a number of key financial covenants; these covenants and the Group’s compliance with these covenants are set out in the table below:
Key covenants CovenantMarch 2013
actuals
Group
Net debt/net equity <1.25x 0.43x
Inner borrowing (unencumbered asset value/unsecured borrowings) >1.66x 2.79x
Interest cover >1.35x 2.44x
The Group has undrawn credit facilities of £264.0 million and has substantial headroom above all of its key covenants. As a result the directors consider the Group to have adequate liquidity to be able to fund the ongoing operations of the business.
The following tables detail the Group’s remaining contractual maturity on its financial instruments and have been drawn up based on the undiscounted cash flows of financial liabilities based on the earliest date on which the Group is required to pay and conditions existing at the balance sheet date:
At 31 March 2013
Carrying amount
£m
Contractual cash flows
£m
Less than one year
£m
One to two years
£m
Two to five years
£m
More than five years
£m
Non-derivative financial liabilities
£142.9 million 55⁄8% debenture stock 2029 144.1 270.1 8.0 8.0 24.1 230.0
Bank loans – revolving credit facilities 234.1 250.6 5.4 5.4 239.8 –
Other loan 0.9 0.9 – 0.9 – –
Private placement notes 286.1 372.3 13.0 13.0 39.6 306.7
Derivative financial instruments
Cross currency swaps (2.6) 2.8 0.5 0.5 1.1 0.7
Interest rate swap 0.1 0.1 0.1 – – –
Interest rate floor (3.8) (4.6) (3.1) (1.5) – –
658.9 892.2 23.9 26.3 304.6 537.4
At 31 March 2012
Carrying amount
£m
Contractual cash flows
£m
Less than one year
£m
One to two years
£m
Two to five years
£m
More than five years
£m
Non-derivative financial liabilities
£142.9 million 55⁄8% debenture stock 2029 144.2 278.1 8.0 8.0 24.1 238.0
Bank loans – revolving credit facilities 200.1 220.2 4.6 4.6 211.0 –
Private placement notes 158.8 217.1 8.0 8.0 24.3 176.8
Derivative financial instruments
Cross currency swaps 4.2 3.3 0.5 0.5 1.1 1.2
Interest rate swap 0.1 0.2 0.1 0.1 – –
Interest rate floor (4.8) (4.7) (1.9) (1.9) (0.9) –
502.6 714.2 19.3 19.3 259.6 416.0
86 Great Portland Estates Annual Report 2013
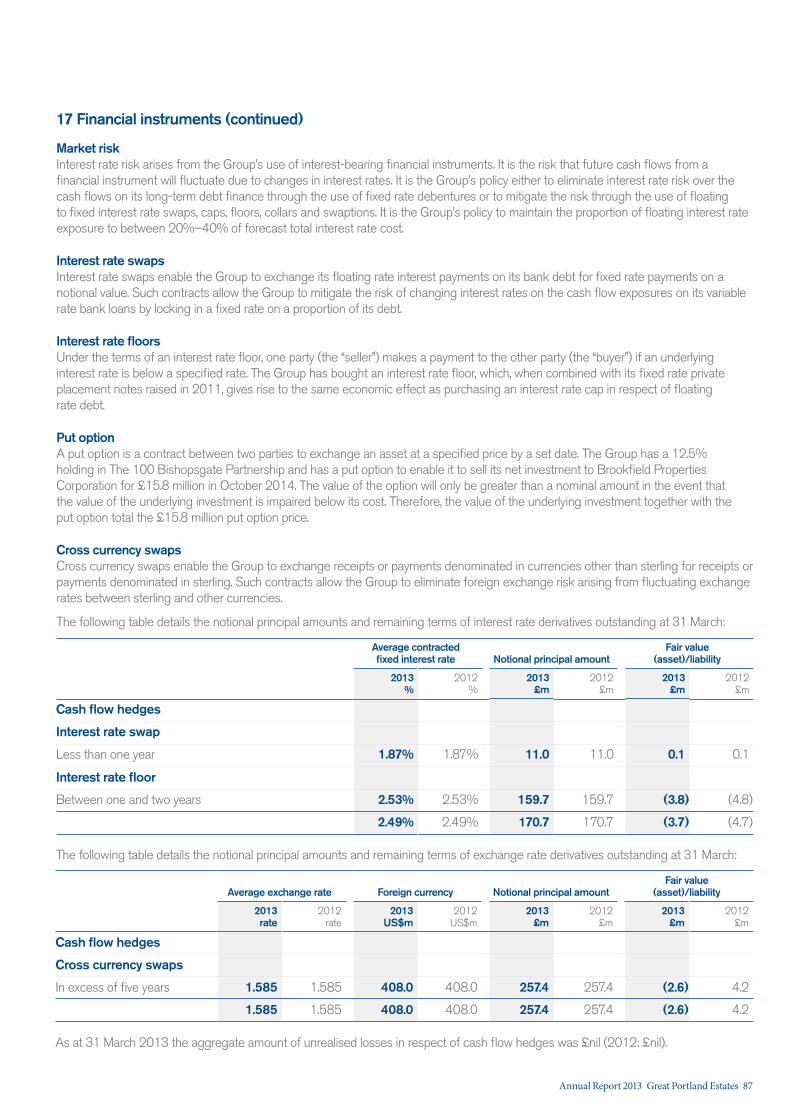
17 Financial instruments (continued)
Market riskInterest rate risk arises from the Group’s use of interest-bearing financial instruments. It is the risk that future cash flows from a financial instrument will fluctuate due to changes in interest rates. It is the Group’s policy either to eliminate interest rate risk over the cash flows on its long-term debt finance through the use of fixed rate debentures or to mitigate the risk through the use of floating to fixed interest rate swaps, caps, floors, collars and swaptions. It is the Group’s policy to maintain the proportion of floating interest rate exposure to between 20%–40% of forecast total interest rate cost.
Interest rate swaps Interest rate swaps enable the Group to exchange its floating rate interest payments on its bank debt for fixed rate payments on a notional value. Such contracts allow the Group to mitigate the risk of changing interest rates on the cash flow exposures on its variable rate bank loans by locking in a fixed rate on a proportion of its debt.
Interest rate floorsUnder the terms of an interest rate floor, one party (the “seller”) makes a payment to the other party (the “buyer”) if an underlying interest rate is below a specified rate. The Group has bought an interest rate floor, which, when combined with its fixed rate private placement notes raised in 2011, gives rise to the same economic effect as purchasing an interest rate cap in respect of floating rate debt.
Put option A put option is a contract between two parties to exchange an asset at a specified price by a set date. The Group has a 12.5% holding in The 100 Bishopsgate Partnership and has a put option to enable it to sell its net investment to Brookfield Properties Corporation for £15.8 million in October 2014. The value of the option will only be greater than a nominal amount in the event that the value of the underlying investment is impaired below its cost. Therefore, the value of the underlying investment together with the put option total the £15.8 million put option price.
Cross currency swapsCross currency swaps enable the Group to exchange receipts or payments denominated in currencies other than sterling for receipts or payments denominated in sterling. Such contracts allow the Group to eliminate foreign exchange risk arising from fluctuating exchange rates between sterling and other currencies.
The following table details the notional principal amounts and remaining terms of interest rate derivatives outstanding at 31 March:
Average contracted fixed interest rate Notional principal amount
Fair value (asset)/liability
2013%
2012%
2013£m
2012£m
2013£m
2012£m
Cash flow hedges
Interest rate swap
Less than one year 1.87% 1.87% 11.0 11.0 0.1 0.1
Interest rate floor
Between one and two years 2.53% 2.53% 159.7 159.7 (3.8) (4.8)
2.49% 2.49% 170.7 170.7 (3.7) (4.7)
The following table details the notional principal amounts and remaining terms of exchange rate derivatives outstanding at 31 March:
Average exchange rate Foreign currency Notional principal amountFair value
(asset)/liability
2013 rate
2012 rate
2013 US$m
2012 US$m
2013 £m
2012£m
2013£m
2012£m
Cash flow hedges
Cross currency swaps
In excess of five years 1.585 1.585 408.0 408.0 257.4 257.4 (2.6) 4.2
1.585 1.585 408.0 408.0 257.4 257.4 (2.6) 4.2
As at 31 March 2013 the aggregate amount of unrealised losses in respect of cash flow hedges was £nil (2012: £nil).
Annual Report 2013 Great Portland Estates 87
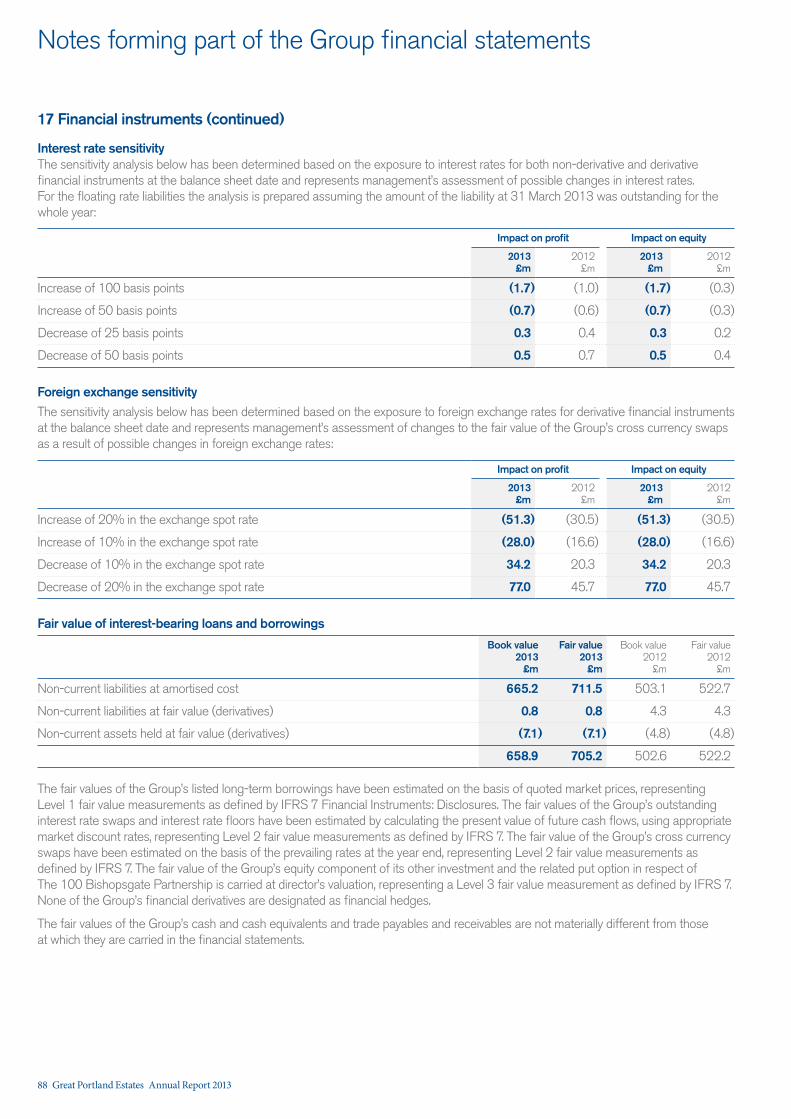
Notes forming part of the Group financial statements
17 Financial instruments (continued)
Interest rate sensitivityThe sensitivity analysis below has been determined based on the exposure to interest rates for both non-derivative and derivative financial instruments at the balance sheet date and represents management’s assessment of possible changes in interest rates. For the floating rate liabilities the analysis is prepared assuming the amount of the liability at 31 March 2013 was outstanding for the whole year:
Impact on profit Impact on equity
2013£m
2012£m
2013£m
2012£m
Increase of 100 basis points (1.7) (1.0) (1.7) (0.3)
Increase of 50 basis points (0.7) (0.6) (0.7) (0.3)
Decrease of 25 basis points 0.3 0.4 0.3 0.2
Decrease of 50 basis points 0.5 0.7 0.5 0.4
Foreign exchange sensitivityThe sensitivity analysis below has been determined based on the exposure to foreign exchange rates for derivative financial instruments at the balance sheet date and represents management’s assessment of changes to the fair value of the Group’s cross currency swaps as a result of possible changes in foreign exchange rates:
Impact on profit Impact on equity
2013£m
2012£m
2013£m
2012£m
Increase of 20% in the exchange spot rate (51.3) (30.5) (51.3) (30.5)
Increase of 10% in the exchange spot rate (28.0) (16.6) (28.0) (16.6)
Decrease of 10% in the exchange spot rate 34.2 20.3 34.2 20.3
Decrease of 20% in the exchange spot rate 77.0 45.7 77.0 45.7
Fair value of interest-bearing loans and borrowings
Book value 2013
£m
Fair value 2013
£m
Book value 2012
£m
Fair value 2012
£m
Non-current liabilities at amortised cost 665.2 711.5 503.1 522.7
Non-current liabilities at fair value (derivatives) 0.8 0.8 4.3 4.3
Non-current assets held at fair value (derivatives) (7.1) (7.1) (4.8) (4.8)
658.9 705.2 502.6 522.2
The fair values of the Group’s listed long-term borrowings have been estimated on the basis of quoted market prices, representing Level 1 fair value measurements as defined by IFRS 7 Financial Instruments: Disclosures. The fair values of the Group’s outstanding interest rate swaps and interest rate floors have been estimated by calculating the present value of future cash flows, using appropriate market discount rates, representing Level 2 fair value measurements as defined by IFRS 7. The fair value of the Group’s cross currency swaps have been estimated on the basis of the prevailing rates at the year end, representing Level 2 fair value measurements as defined by IFRS 7. The fair value of the Group’s equity component of its other investment and the related put option in respect of The 100 Bishopsgate Partnership is carried at director’s valuation, representing a Level 3 fair value measurement as defined by IFRS 7. None of the Group’s financial derivatives are designated as financial hedges.
The fair values of the Group’s cash and cash equivalents and trade payables and receivables are not materially different from those at which they are carried in the financial statements.
88 Great Portland Estates Annual Report 2013
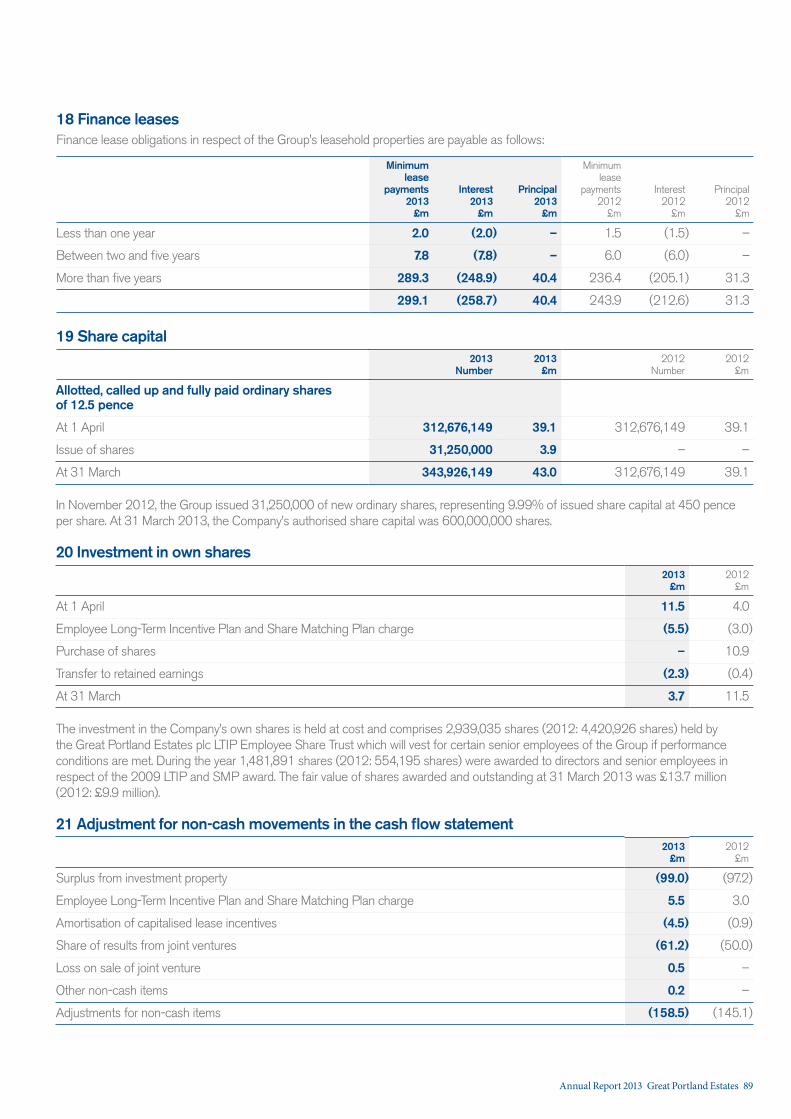
18 Finance leasesFinance lease obligations in respect of the Group’s leasehold properties are payable as follows:
Minimum lease
payments 2013
£m
Interest 2013
£m
Principal 2013
£m
Minimum lease
payments 2012
£m
Interest 2012
£m
Principal 2012
£m
Less than one year 2.0 (2.0) – 1.5 (1.5) –
Between two and five years 7.8 (7.8) – 6.0 (6.0) –
More than five years 289.3 (248.9) 40.4 236.4 (205.1) 31.3
299.1 (258.7) 40.4 243.9 (212.6) 31.3
19 Share capital2013
Number2013
£m2012
Number2012
£m
Allotted, called up and fully paid ordinary shares of 12.5 pence
At 1 April 312,676,149 39.1 312,676,149 39.1
Issue of shares 31,250,000 3.9 – –
At 31 March 343,926,149 43.0 312,676,149 39.1
In November 2012, the Group issued 31,250,000 of new ordinary shares, representing 9.99% of issued share capital at 450 pence per share. At 31 March 2013, the Company’s authorised share capital was 600,000,000 shares.
20 Investment in own shares2013
£m2012
£m
At 1 April 11.5 4.0
Employee Long-Term Incentive Plan and Share Matching Plan charge (5.5) (3.0)
Purchase of shares – 10.9
Transfer to retained earnings (2.3) (0.4)
At 31 March 3.7 11.5
The investment in the Company’s own shares is held at cost and comprises 2,939,035 shares (2012: 4,420,926 shares) held by the Great Portland Estates plc LTIP Employee Share Trust which will vest for certain senior employees of the Group if performance conditions are met. During the year 1,481,891 shares (2012: 554,195 shares) were awarded to directors and senior employees in respect of the 2009 LTIP and SMP award. The fair value of shares awarded and outstanding at 31 March 2013 was £13.7 million (2012: £9.9 million).
21 Adjustment for non-cash movements in the cash flow statement2013
£m2012
£m
Surplus from investment property (99.0) (97.2)
Employee Long-Term Incentive Plan and Share Matching Plan charge 5.5 3.0
Amortisation of capitalised lease incentives (4.5) (0.9)
Share of results from joint ventures (61.2) (50.0)
Loss on sale of joint venture 0.5 –
Other non-cash items 0.2 –
Adjustments for non-cash items (158.5) (145.1)
Annual Report 2013 Great Portland Estates 89
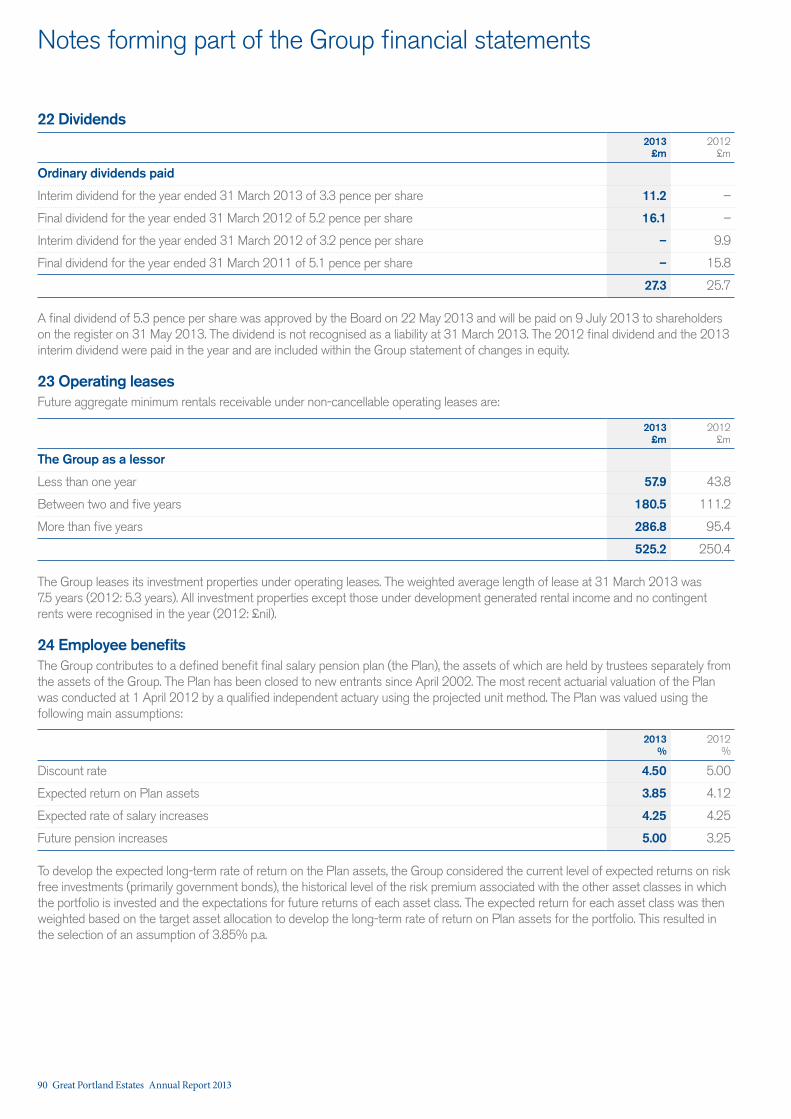
Notes forming part of the Group financial statements
22 Dividends2013
£m2012
£m
Ordinary dividends paid
Interim dividend for the year ended 31 March 2013 of 3.3 pence per share 11.2 –
Final dividend for the year ended 31 March 2012 of 5.2 pence per share 16.1 –
Interim dividend for the year ended 31 March 2012 of 3.2 pence per share – 9.9
Final dividend for the year ended 31 March 2011 of 5.1 pence per share – 15.8
27.3 25.7
A final dividend of 5.3 pence per share was approved by the Board on 22 May 2013 and will be paid on 9 July 2013 to shareholders on the register on 31 May 2013. The dividend is not recognised as a liability at 31 March 2013. The 2012 final dividend and the 2013 interim dividend were paid in the year and are included within the Group statement of changes in equity.
23 Operating leasesFuture aggregate minimum rentals receivable under non-cancellable operating leases are:
2013£m
2012£m
The Group as a lessor
Less than one year 57.9 43.8
Between two and five years 180.5 111.2
More than five years 286.8 95.4
525.2 250.4
The Group leases its investment properties under operating leases. The weighted average length of lease at 31 March 2013 was 7.5 years (2012: 5.3 years). All investment properties except those under development generated rental income and no contingent rents were recognised in the year (2012: £nil).
24 Employee benefitsThe Group contributes to a defined benefit final salary pension plan (the Plan), the assets of which are held by trustees separately from the assets of the Group. The Plan has been closed to new entrants since April 2002. The most recent actuarial valuation of the Plan was conducted at 1 April 2012 by a qualified independent actuary using the projected unit method. The Plan was valued using the following main assumptions:
2013%
2012%
Discount rate 4.50 5.00
Expected return on Plan assets 3.85 4.12
Expected rate of salary increases 4.25 4.25
Future pension increases 5.00 3.25
To develop the expected long-term rate of return on the Plan assets, the Group considered the current level of expected returns on risk free investments (primarily government bonds), the historical level of the risk premium associated with the other asset classes in which the portfolio is invested and the expectations for future returns of each asset class. The expected return for each asset class was then weighted based on the target asset allocation to develop the long-term rate of return on Plan assets for the portfolio. This resulted in the selection of an assumption of 3.85% p.a.
90 Great Portland Estates Annual Report 2013
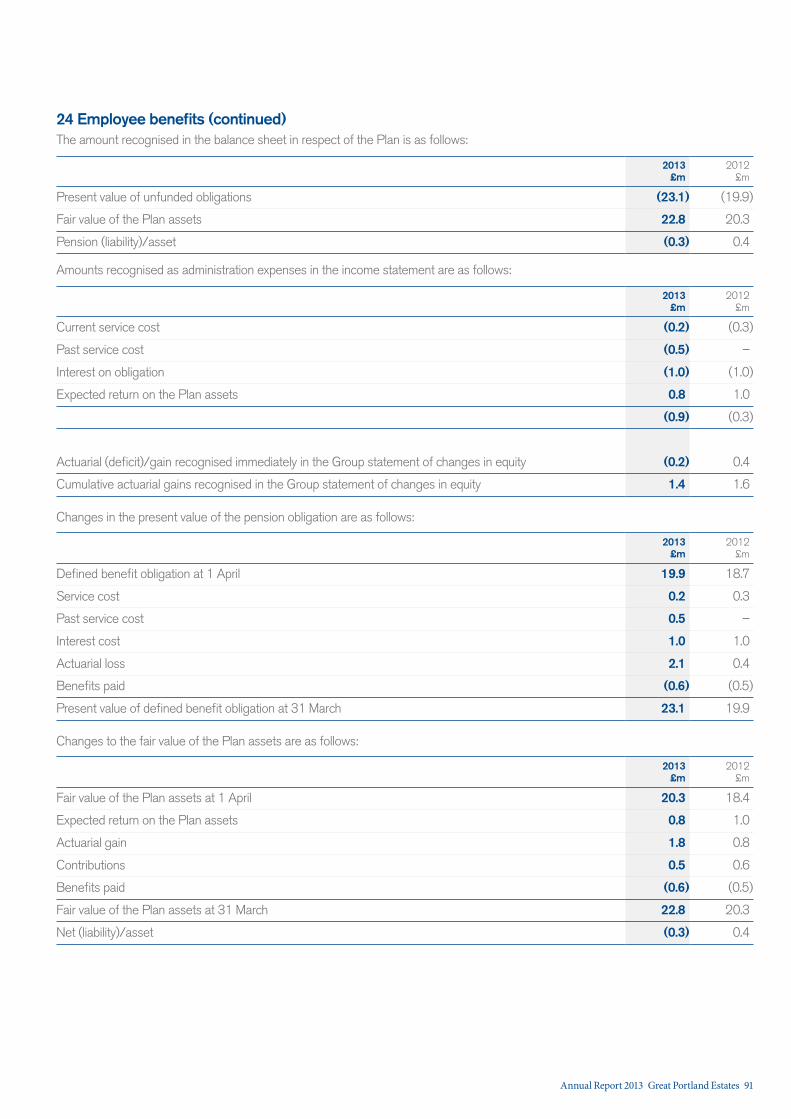
24 Employee benefits (continued) The amount recognised in the balance sheet in respect of the Plan is as follows:
2013£m
2012£m
Present value of unfunded obligations (23.1) (19.9)
Fair value of the Plan assets 22.8 20.3
Pension (liability)/asset (0.3) 0.4
Amounts recognised as administration expenses in the income statement are as follows:
2013£m
2012£m
Current service cost (0.2) (0.3)
Past service cost (0.5) –
Interest on obligation (1.0) (1.0)
Expected return on the Plan assets 0.8 1.0
(0.9) (0.3)
Actuarial (deficit)/gain recognised immediately in the Group statement of changes in equity (0.2) 0.4
Cumulative actuarial gains recognised in the Group statement of changes in equity 1.4 1.6
Changes in the present value of the pension obligation are as follows:
2013£m
2012£m
Defined benefit obligation at 1 April 19.9 18.7
Service cost 0.2 0.3
Past service cost 0.5 –
Interest cost 1.0 1.0
Actuarial loss 2.1 0.4
Benefits paid (0.6) (0.5)
Present value of defined benefit obligation at 31 March 23.1 19.9
Changes to the fair value of the Plan assets are as follows:
2013£m
2012£m
Fair value of the Plan assets at 1 April 20.3 18.4
Expected return on the Plan assets 0.8 1.0
Actuarial gain 1.8 0.8
Contributions 0.5 0.6
Benefits paid (0.6) (0.5)
Fair value of the Plan assets at 31 March 22.8 20.3
Net (liability)/asset (0.3) 0.4
Annual Report 2013 Great Portland Estates 91
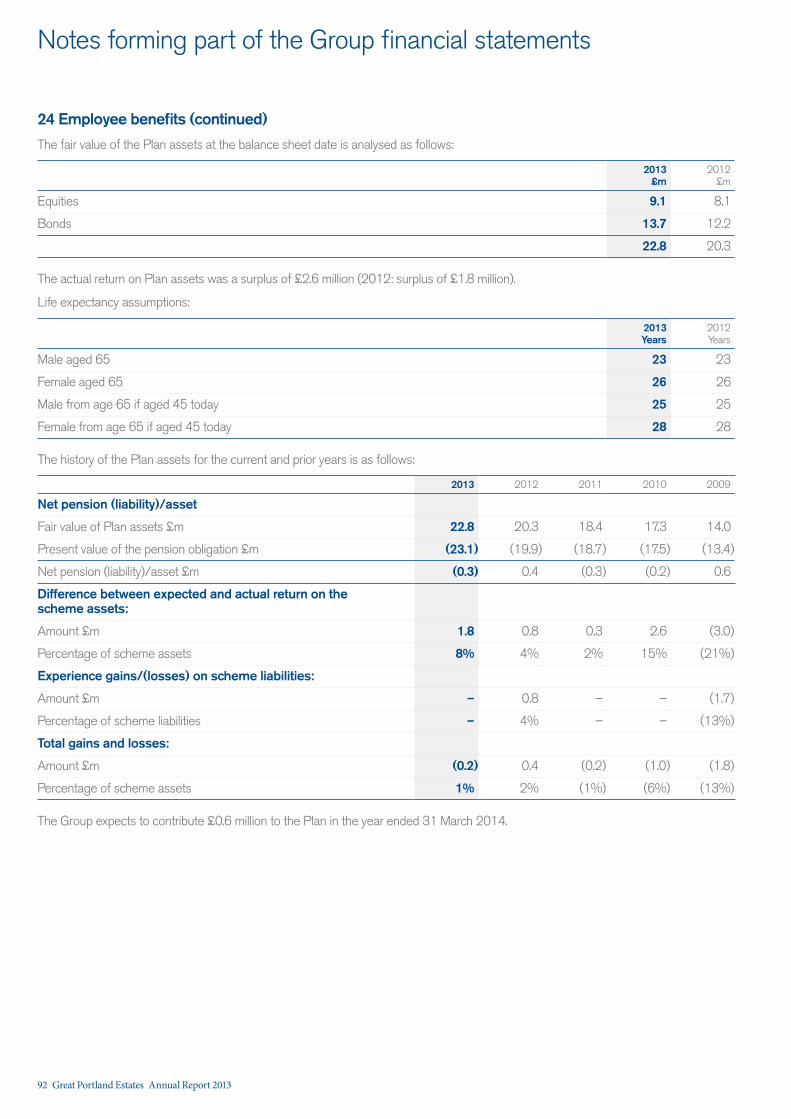
Notes forming part of the Group financial statements
24 Employee benefits (continued)
The fair value of the Plan assets at the balance sheet date is analysed as follows:
2013£m
2012£m
Equities 9.1 8.1
Bonds 13.7 12.2
22.8 20.3
The actual return on Plan assets was a surplus of £2.6 million (2012: surplus of £1.8 million).
Life expectancy assumptions:
2013 Years
2012 Years
Male aged 65 23 23
Female aged 65 26 26
Male from age 65 if aged 45 today 25 25
Female from age 65 if aged 45 today 28 28
The history of the Plan assets for the current and prior years is as follows:
2013 2012 2011 2010 2009
Net pension (liability)/asset
Fair value of Plan assets £m 22.8 20.3 18.4 17.3 14.0
Present value of the pension obligation £m (23.1) (19.9) (18.7) (17.5) (13.4)
Net pension (liability)/asset £m (0.3) 0.4 (0.3) (0.2) 0.6
Difference between expected and actual return on the scheme assets:
Amount £m 1.8 0.8 0.3 2.6 (3.0)
Percentage of scheme assets 8% 4% 2% 15% (21%)
Experience gains/(losses) on scheme liabilities:
Amount £m – 0.8 – – (1.7)
Percentage of scheme liabilities – 4% – – (13%)
Total gains and losses:
Amount £m (0.2) 0.4 (0.2) (1.0) (1.8)
Percentage of scheme assets 1% 2% (1%) (6%) (13%)
The Group expects to contribute £0.6 million to the Plan in the year ended 31 March 2014.
92 Great Portland Estates Annual Report 2013
Independent auditor’s report
Independent auditor’s report to the members of Great Portland Estates plcWe have audited the financial statements of Great Portland Estates for the year ended 31 March 2013 which comprise the Group Income Statement, the Group Statement of Comprehensive Income, the Group Balance Sheet, the Group Statement of Cash Flows, the Group Statements of Changes in Equity and the related notes 1 to 24. The financial reporting framework that has been applied in their preparation is applicable law and International Financial Reporting Standards (IFRSs) as adopted by the European Union and, as regards the parent company financial statements, as applied in accordance with the provisions of the Companies Act 2006.
This report is made solely to the Company’s members, as a body, in accordance with Chapter 3 of Part 16 of the Companies Act 2006. Our audit work has been undertaken so that we might state to the Company’s members those matters we are required to state to them in an auditor’s report and for no other purpose. To the fullest extent permitted by law, we do not accept or assume responsibility to anyone other than the Company and the Company’s members as a body, for our audit work, for this report, or for the opinions we have formed.
Respective responsibilities of directors and auditorAs explained more fully in the Directors’ Responsibilities Statement, the directors are responsible for the preparation of the financial statements and for being satisfied that they give a true and fair view. Our responsibility is to audit and express an opinion on the financial statements in accordance with applicable law and International Standards on Auditing (UK and Ireland). Those standards require us to comply with the Auditing Practices Board’s Ethical Standards for Auditors.
Scope of the audit of the financial statementsAn audit involves obtaining evidence about the amounts and disclosures in the financial statements sufficient to give reasonable assurance that the financial statements are free from material misstatement, whether caused by fraud or error. This includes an assessment of: whether the accounting policies are appropriate to the Group’s and the parent company’s circumstances and have been consistently applied and adequately disclosed; the reasonableness of significant accounting estimates made by the directors; and the overall presentation of the financial statements. In addition, we read all the financial and non-financial information in the annual report to identify material inconsistencies with the audited financial statements. If we become aware of any apparent material misstatements or inconsistencies we consider the implications for our report.
Opinion on financial statementsIn our opinion:
— the financial statements give a true and fair view of the state of the Group’s affairs as at 31 March 2013 and of the Group’s profit for the year then ended;
— the Group financial statements have been properly prepared in accordance with IFRSs as adopted by the European Union; and
— the financial statements have been prepared in accordance with the requirements of the Companies Act 2006 and, as regards the Group financial statements, Article 4 of the IAS Regulation.
Separate opinion in relation to IFRSs as issued by the IASBAs explained in note 1 to the Group financial statements, the Group in addition to complying with its legal obligation to apply IFRSs as adopted by the European Union, has also applied IFRSs as issued by the International Accounting Standards Board (IASB).
In our opinion the Group financial statements comply with IFRSs as issued by the IASB.
Opinion on other matters prescribed by the Companies Act 2006In our opinion the information given in the Directors’ Report for the financial year for which the financial statements are prepared is consistent with the financial statements.
Matters on which we are required to report by exceptionWe have nothing to report in respect of the following matters where the Companies Act 2006 requires us to report to you if, in our opinion:
— adequate accounting records have not been kept by the parent company, or returns adequate for our audit have not been received from branches not visited by us; or
— the parent company financial statements and the part of the Directors’ Remuneration Report to be audited are not in agreement with the accounting records and returns; or
— certain disclosures of directors’ remuneration specified by law are not made; or
— we have not received all the information and explanations we require for our audit.
Other MatterWe have reported separately on the parent company financial statements of Great Portland Estates plc for the year ended 31 March 2013 and on the information provided in the Directors Remuneration Report that is described as having been audited.
Claire Faulkner (Senior statutory auditor) for and on behalf of Deloitte LLP Chartered Accountants and Statutory Auditor London, United Kingdom
22 May 2013
Annual Report 2013 Great Portland Estates 93
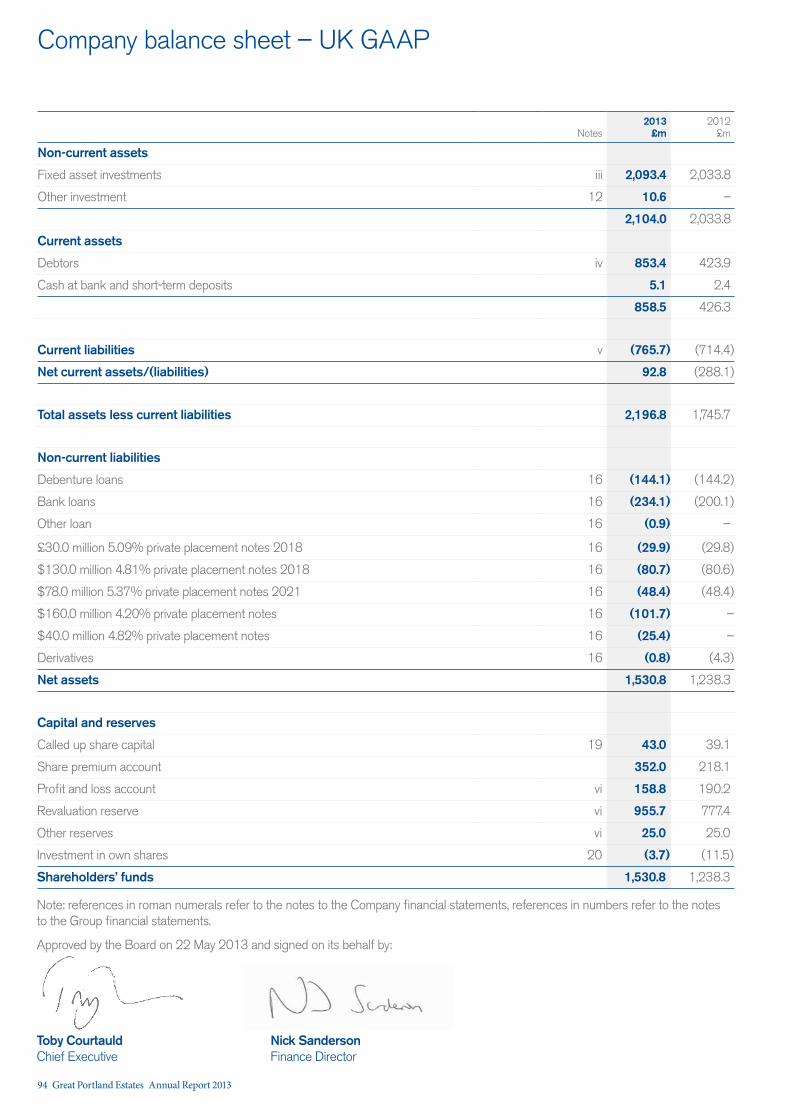
Notes2013
£m2012
£m
Non-current assets
Fixed asset investments iii 2,093.4 2,033.8
Other investment 12 10.6 –
2,104.0 2,033.8
Current assets
Debtors iv 853.4 423.9
Cash at bank and short-term deposits 5.1 2.4
858.5 426.3
Current liabilities v (765.7) (714.4)
Net current assets/(liabilities) 92.8 (288.1)
Total assets less current liabilities 2,196.8 1,745.7
Non-current liabilities
Debenture loans 16 (144.1) (144.2)
Bank loans 16 (234.1) (200.1)
Other loan 16 (0.9) –
£30.0 million 5.09% private placement notes 2018 16 (29.9) (29.8)
$130.0 million 4.81% private placement notes 2018 16 (80.7) (80.6)
$78.0 million 5.37% private placement notes 2021 16 (48.4) (48.4)
$160.0 million 4.20% private placement notes 16 (101.7) –
$40.0 million 4.82% private placement notes 16 (25.4) –
Derivatives 16 (0.8) (4.3)
Net assets 1,530.8 1,238.3
Capital and reserves
Called up share capital 19 43.0 39.1
Share premium account 352.0 218.1
Profit and loss account vi 158.8 190.2
Revaluation reserve vi 955.7 777.4
Other reserves vi 25.0 25.0
Investment in own shares 20 (3.7) (11.5)
Shareholders’ funds 1,530.8 1,238.3
Note: references in roman numerals refer to the notes to the Company financial statements, references in numbers refer to the notes to the Group financial statements.
Approved by the Board on 22 May 2013 and signed on its behalf by:
Toby Courtauld Nick Sanderson Chief Executive Finance Director
Company balance sheet – UK GAAP
94 Great Portland Estates Annual Report 2013
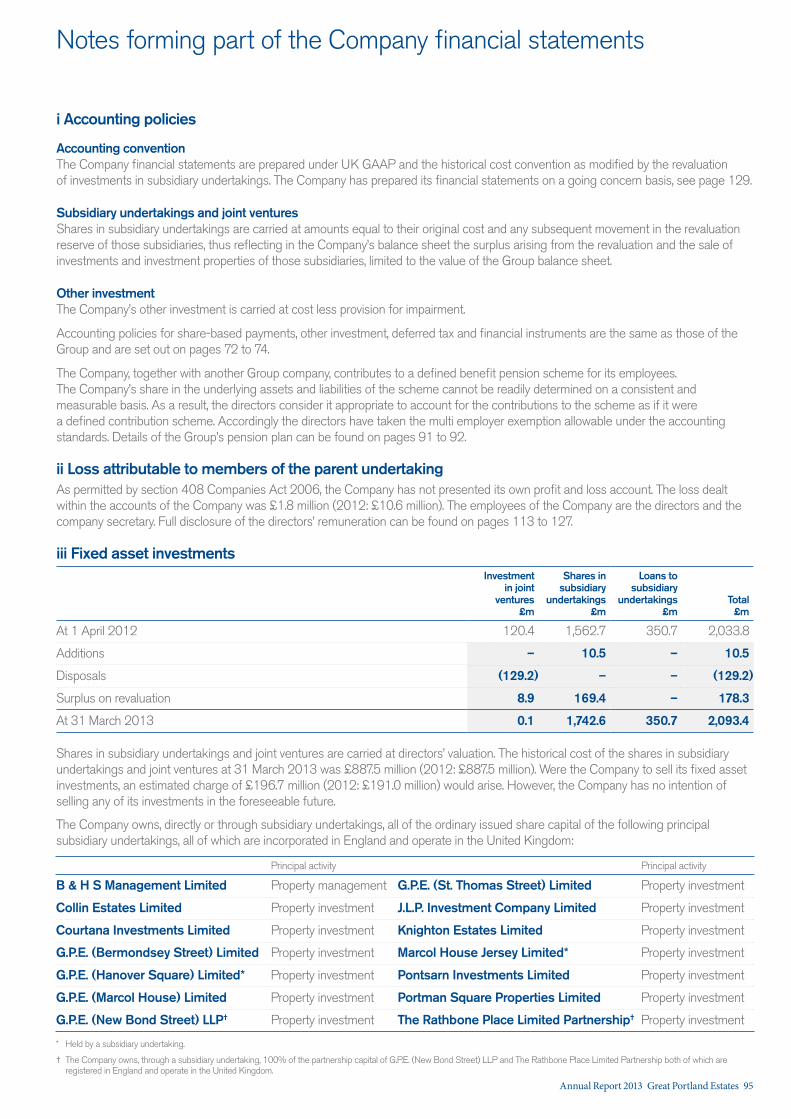
Notes forming part of the Company financial statements
i Accounting policies
Accounting conventionThe Company financial statements are prepared under UK GAAP and the historical cost convention as modified by the revaluation of investments in subsidiary undertakings. The Company has prepared its financial statements on a going concern basis, see page 129.
Subsidiary undertakings and joint venturesShares in subsidiary undertakings are carried at amounts equal to their original cost and any subsequent movement in the revaluation reserve of those subsidiaries, thus reflecting in the Company’s balance sheet the surplus arising from the revaluation and the sale of investments and investment properties of those subsidiaries, limited to the value of the Group balance sheet.
Other investmentThe Company’s other investment is carried at cost less provision for impairment.
Accounting policies for share-based payments, other investment, deferred tax and financial instruments are the same as those of the Group and are set out on pages 72 to 74.
The Company, together with another Group company, contributes to a defined benefit pension scheme for its employees. The Company’s share in the underlying assets and liabilities of the scheme cannot be readily determined on a consistent and measurable basis. As a result, the directors consider it appropriate to account for the contributions to the scheme as if it were a defined contribution scheme. Accordingly the directors have taken the multi employer exemption allowable under the accounting standards. Details of the Group’s pension plan can be found on pages 91 to 92.
ii Loss attributable to members of the parent undertakingAs permitted by section 408 Companies Act 2006, the Company has not presented its own profit and loss account. The loss dealt within the accounts of the Company was £1.8 million (2012: £10.6 million). The employees of the Company are the directors and the company secretary. Full disclosure of the directors’ remuneration can be found on pages 113 to 127.
iii Fixed asset investmentsInvestment
in joint ventures
£m
Shares in subsidiary
undertakings£m
Loans to subsidiary
undertakings£m
Total£m
At 1 April 2012 120.4 1,562.7 350.7 2,033.8
Additions – 10.5 – 10.5
Disposals (129.2) – – (129.2)
Surplus on revaluation 8.9 169.4 – 178.3
At 31 March 2013 0.1 1,742.6 350.7 2,093.4
Shares in subsidiary undertakings and joint ventures are carried at directors’ valuation. The historical cost of the shares in subsidiary undertakings and joint ventures at 31 March 2013 was £887.5 million (2012: £887.5 million). Were the Company to sell its fixed asset investments, an estimated charge of £196.7 million (2012: £191.0 million) would arise. However, the Company has no intention of selling any of its investments in the foreseeable future.
The Company owns, directly or through subsidiary undertakings, all of the ordinary issued share capital of the following principal subsidiary undertakings, all of which are incorporated in England and operate in the United Kingdom:
Principal activity Principal activity
B & H S Management Limited Property management G.P.E. (St. Thomas Street) Limited Property investment
Collin Estates Limited Property investment J.L.P. Investment Company Limited Property investment
Courtana Investments Limited Property investment Knighton Estates Limited Property investment
G.P.E. (Bermondsey Street) Limited Property investment Marcol House Jersey Limited* Property investment
G.P.E. (Hanover Square) Limited* Property investment Pontsarn Investments Limited Property investment
G.P.E. (Marcol House) Limited Property investment Portman Square Properties Limited Property investment
G.P.E. (New Bond Street) LLP† Property investment The Rathbone Place Limited Partnership† Property investment
* Held by a subsidiary undertaking.
† The Company owns, through a subsidiary undertaking, 100% of the partnership capital of G.P.E. (New Bond Street) LLP and The Rathbone Place Limited Partnership both of which are registered in England and operate in the United Kingdom.
Annual Report 2013 Great Portland Estates 95
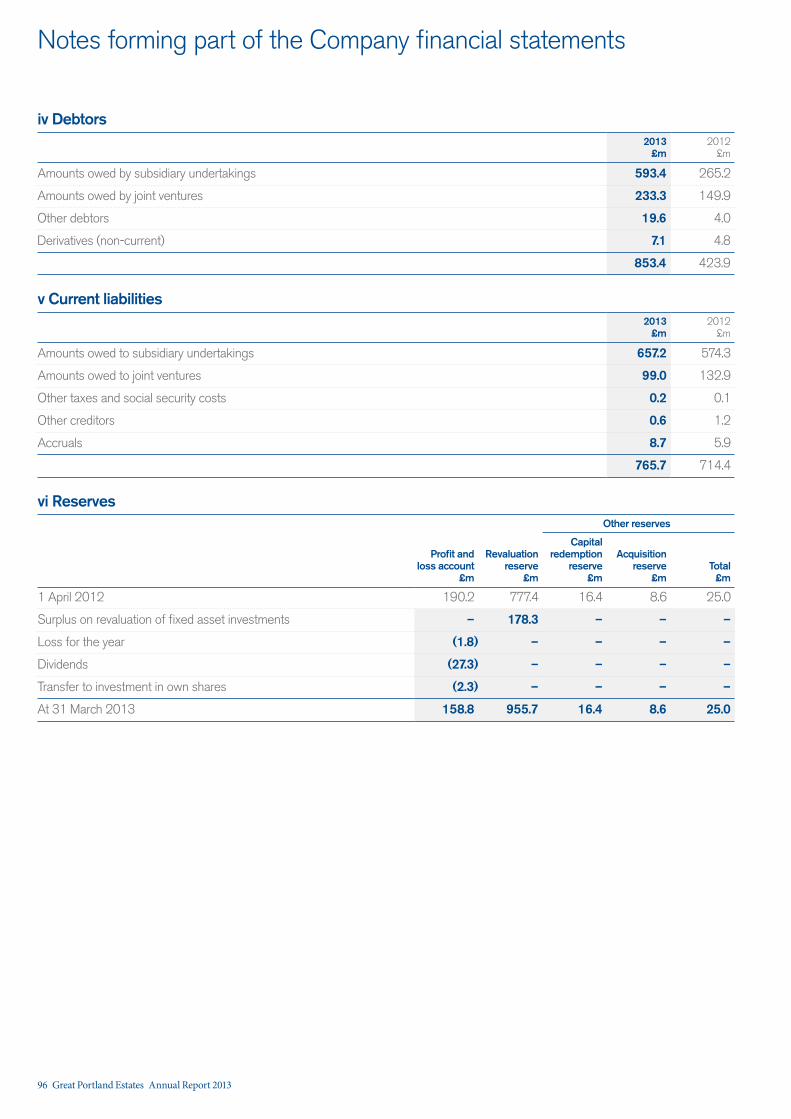
Notes forming part of the Company financial statements
iv Debtors2013
£m2012
£m
Amounts owed by subsidiary undertakings 593.4 265.2
Amounts owed by joint ventures 233.3 149.9
Other debtors 19.6 4.0
Derivatives (non-current) 7.1 4.8
853.4 423.9
v Current liabilities2013
£m2012
£m
Amounts owed to subsidiary undertakings 657.2 574.3
Amounts owed to joint ventures 99.0 132.9
Other taxes and social security costs 0.2 0.1
Other creditors 0.6 1.2
Accruals 8.7 5.9
765.7 714.4
vi ReservesOther reserves
Profit and loss account
£m
Revaluation reserve
£m
Capital redemption
reserve£m
Acquisition reserve
£mTotal
£m
1 April 2012 190.2 777.4 16.4 8.6 25.0
Surplus on revaluation of fixed asset investments – 178.3 – – –
Loss for the year (1.8) – – – –
Dividends (27.3) – – – –
Transfer to investment in own shares (2.3) – – – –
At 31 March 2013 158.8 955.7 16.4 8.6 25.0
96 Great Portland Estates Annual Report 2013
Company independent auditor’s report
Independent auditor’s report to the members of Great Portland Estates plcWe have audited the parent company financial statements of Great Portland Estates plc for the year ended 31 March 2013 which comprise the parent Company balance sheet and the related notes i to vi. The financial reporting framework that has been applied in their preparation is applicable law and United Kingdom Accounting Standards (United Kingdom Generally Accepted Accounting Practice).
This report is made solely to the company’s members, as a body, in accordance with Chapter 3 of Part 16 of the Companies Act 2006. Our audit work has been undertaken so that we might state to the Company’s members those matters we are required to state to them in an auditor’s report and for no other purpose. To the fullest extent permitted by law, we do not accept or assume responsibility to anyone other than the Company and the Company’s members as a body, for our audit work, for this report, or for the opinions we have formed.
Respective responsibilities of directors and auditorAs explained more fully in the Directors’ Responsibilities Statement, the directors are responsible for the preparation of the financial statements and for being satisfied that they give a true and fair view. Our responsibility is to audit and express an opinion on the financial statements in accordance with applicable law and International Standards on Auditing (UK and Ireland). Those standards require us to comply with the Auditing Practices Board’s Ethical Standards for Auditors.
Scope of the audit of the financial statementsAn audit involves obtaining evidence about the amounts and disclosures in the financial statements sufficient to give reasonable assurance that the financial statements are free from material misstatement, whether caused by fraud or error. This includes an assessment of: whether the accounting policies are appropriate to the Company’s circumstances and have been consistently applied and adequately disclosed; the reasonableness of significant accounting estimates made by the directors; and the overall presentation of the financial statements. In addition, we read all the financial and non-financial information in the annual report to identify material inconsistencies with the audited financial statements. If we become aware of any apparent material misstatements or inconsistencies we consider the implications for our report.
Opinion on financial statementsIn our opinion the parent Company financial statements:
— give a true and fair view of the state of the Company’s affairs as at 31 March 2013;
— have been properly prepared in accordance with United Kingdom Generally Accepted Accounting Practice; and
— have been prepared in accordance with the requirements of the Companies Act 2006.
Opinion on other matter prescribed by the Companies Act 2006In our opinion:
— the part of the Directors’ Remuneration Report to be audited has been properly prepared in accordance with the Companies Act 2006; and
— the information given in the Directors’ Report for the financial year for which the financial statements are prepared is consistent with the financial statements.
Matters on which we are required to report by exceptionWe have nothing to report in respect of the following matters where the Companies Act 2006 requires us to report to you if, in our opinion:
— adequate accounting records have not been kept by the parent company, or returns adequate for our audit have not been received from branches not visited by us; or
— the parent company financial statements are not in agreement with the accounting records and returns; or
— certain disclosures of directors’ remuneration specified by law are not made; or
— we have not received all the information and explanations we require for our audit.
Other matterWe have reported separately on the Group financial statements of Great Portland Estates plc for the year ended 31 March 2013.
Claire Faulkner (Senior statutory auditor) for and on behalf of Deloitte LLP Chartered Accountants and Statutory Auditor London, United Kingdom
22 May 2013
Annual Report 2013 Great Portland Estates 97

In this section we present the report of the directors, explain how we maintain a high standard of corporate governance and describe our remuneration policy and principles.
100 Corporate governance113 Directors’ remuneration report128 Report of the directors132 Directors’ responsibilities statement133 Analysis of ordinary shareholdings134 Notice of meeting
Section 4 Governance
98 Great Portland Estates Annual Report 2013

Annual Report 2013 Great Portland Estates 99

Corporate governance
Corporate governanceI believe the effectiveness of your Board in the achievement of good governance is based on the correct level of oversight, good communication, a focus on risks and a commitment to transparency. These, combined with our flat management structure and high level of involvement by executive and senior management in all our activities, as outlined on pages 48 to 52, ensures that this good governance extends beyond the Boardroom.
Board oversight and our strategic prioritiesEach year, the Board formally revisits the level of oversight it has over a variety of areas including strategy, transactions, finance, people and sustainability matters.
The Group’s business model and strategy are outlined on pages 4 to 11. In our Annual Report last year we identified that our strategic priorities for 2012/13 were to:
— recycle assets where value had been added to monetise returns in a strong investment market and make selective acquisitions which met robust acquisition criteria;
— continue with selective developments; and
— drive rental growth.
During the year ended 31 March 2013, we identified an increasing number of interesting acquisition opportunities and, as part of our oversight of strategy, flexed our recycling and re-investment priority to increase our purchase activity which we in part funded by a share placing in November 2012. In 2013/14 we expect to maintain our selective acquisition and recycling activity and deliver our development programme as we look to maximise shareholder value creation opportunities whilst at the same time still appropriately managing risk.
+See our strategic priorities on pages 10 to 11.
To ensure that risks associated with major transactions, and how such transactions fit in with the Group’s strategy for long-term success, are fully debated at Board level, Board approval is required for:
— all sales and acquisitions where the Group’s share is over £25 million;
— any development expenditure over £15 million;
— any leases of £1 million p.a. or above; and
— any new financing (equity or debt).
Each year, the Board formally revisits the level of oversight it has over a variety of areas including strategy, transactions, finance, people and sustainability matters.
Good governance is based on the correct level
of oversight, good communication, a focus on
risks and transparency in how we operate.Martin Scicluna Chairman
“”
100 Great Portland Estates Annual Report 2013
In the year ended 31 March 2013, the Board had nine unscheduled Board meetings, in addition to the six scheduled Board meetings, to approve a number of transactions. Significant transactions approved by the Board during the year included:
— the development of Walmar House, W1 to reposition the asset following its purchase from The Great Capital Partnership;
— the acquisition of French Railways House and 50 Jermyn Street, SW1 offering asset management opportunities in the short-term and a longer development opportunity;
— the entering into a new £80 million ten year secured debt facility for The Great Victoria Partnership;
— buying the half share not already owned by GPE of five properties from The Great Capital Partnership where we expect to grow the income in the short term and offering an attractive development opportunity in the longer term, potentially in combination with French Railways House and 50 Jermyn Street, SW1;
— the sales of Regent Arcade House, 48 Regent Street and 100 Regent Street, W1 by the Great Capital Partnership at an 8.3% surplus to the March 2012 valuation;
— the sale of a 37.5% interest in The 100 Bishopsgate Partnership;
— the placing of 31.25 million new ordinary shares to finance further acquisitions of properties with asset management angles to exploit and pricing beneath replacement cost;
— the pre-let of 40,000 sq ft of the office space at 95 Wigmore Street, W1 when the development is due to complete in July 2013, bringing forward income receipts;
— the acquisition of Minerva House, SE1 providing an accretive initial yield with attractive prospective returns due to its low rents and multiple refurbishment opportunities and offering a potential longer term river front redevelopment; and
— the acquisition of Orchard Court, W1 currently let off low passing rents with a significant growth opportunity in an improving West End location.
Executive reward linked to the Group’s performance for shareholdersUnder the Group’s long-term incentive plans, the level of reward to the Executive Directors and senior management depends on the performance of the Group over a three year period. I am pleased to be able to report that 100% of the Total Shareholder Return (TSR) and NAV elements of the Group’s 2009 LTIP and SMP awards vested based on the Group performing in the upper quartile against the constituents of the FTSE 350 Real Estate Sector, and reflecting the underlying strong financial performance of the Company as demonstrated through the trend of the Company’s annual KPIs of NAV growth, Total Property Return (TPR) and Return on Capital Employed. TSR for the three year period to 27 May 2012 (for the 2009 LTIP award) and 2 June 2012 (for the 2009 SMP award) was 98.3% and 96.6% respectively. The NAV uplift for the three years to 31 March 2012 was 64.5%. As at the date of this report, for the 2010 Award, we expect 100% of the TSR and NAV hurdles for both the annual and additional matching awards to be met and 96.2% and 75.2% of the TPR hurdle for the annual and additional matching awards respectively to be met.
Following a review by the Remuneration Committee of the effectiveness of the incentive plans that we updated in 2010, we are pleased with Group’s performance and believe that the incentives have provided a strong alignment between shareholders and the executive team. However, one change to the 2010 LTIP that we feel will be beneficial to enhance the measurement of our performance is to increase the number of funds we use to measure the TPR element of the LTIP from 182 funds to 190 funds. This will increase the total value of the index from £25 billion to £36 billion and ensure that key comparator organisations are included in the performance measure.
+More details of this proposal is included within the Directors Remuneration Report on pages 114 and 115.
We have consulted with major shareholders and shareholder representative bodies on this adjustment and believe them to be widely supportive of the proposed change.
Board appointments and succession planningIn September 2012, we were pleased to welcome Elizabeth Holden to the Board as Non-Executive Director, who brings with her a wealth of corporate advisory and governance experience.
In 2014, Charles Irby will have served ten years on the Board and will retire at our 2014 Annual General Meeting. Having currently served nine years on the Board, his continued independence has been the subject of particular internal scrutiny and we believe his strong stewardship as Senior Independent Director, Chairman of Remuneration Committee and member of the Nomination and Audit Committees, including his objectivity and constructive challenge, continues to demonstrate his independence. Following consultation with the whole Board of the qualities and skills sought in his successor, we will start the process of recruiting his replacement in the autumn. Whilst the Board recognises the benefits of gender diversity and will continue to ensure that this is taken into account when considering any particular appointment, the Company’s policy remains that selection should be based on the best person for the role. 27% of the Group’s senior managers are women with women making up 45% of all employees.
+See our people on page 49.
Annual Report 2013 Great Portland Estates 101
Corporate governance
As part of the annual Strategy Review, the Board reviews the succession planning and personal development requirements for key executives and senior managers across the team. During the course of the year ended 31 March 2013, recognising the importance of our development programme, we have created a new role of Head of Development with responsibility for the total return of the development portfolio including successful delivery of all development projects. Andrew White, who has significant development experience, joined the Group in March 2013 to take up this position and will report to Neil Thompson as Portfolio Director.
Board evaluationIn accordance with our policy to undertake the evaluation process in-house between external evaluations held every three years, this year’s evaluation was undertaken by Charles Irby as Senior Independent Director supported by our Company Secretary. The process involved completion of a questionnaire followed by one-on-one meetings between Charles Irby and each other director and a meeting between Charles Irby and me in respect of Charles’ performance. The process covered Board, Committee and personal performance and the output was reviewed initially with me, as Chairman, and then at the January 2013 Board meeting. As a result of the Board evaluation, pertinent points raised in respect of strategy were incorporated within the Group’s annual Strategy Review and wider corporate governance review in March 2013. Suggestions of the qualities and experience that should be sought in the succession planning for Charles Irby’s replacement will also be taken into account by the Nomination Committee when recruiting later in the year. Overall the process confirmed that the Board and its Committees continued to work effectively. As a result of the Board evaluation process in 2012, this year the Board received a presentation on both potential and impending legal and regulatory changes across all areas of the Group’s operations including reporting, environmental, health and safety and numerous European industry and financing directives to ensure the potential impacts on the Group are appropriately addressed on a timely basis to help ‘future proof’ the business. A sustainability and health and safety legislation risk management review is now also incorporated in the annual Sustainability and Health and Safety reports to the Board.
Communication with shareholders and other investorsCommunication with investors is given a high priority by the Board with 235 presentations being made in the year to shareholders and potential shareholders by a combination of the Executive Director team and senior management below the Board. Independent feedback on presentations by the Executive Directors to all major shareholders is provided to the Non-Executive Directors on a regular basis. This year, where we are seeking to make a change to the Executive long-term incentive arrangements, we have also consulted with our major shareholders and shareholder representative bodies.
I am pleased to be able to report that we again received external recognition for our efforts on our Annual Report by winning the ICSA Hermes 2012 Transparency in Governance Award for the best Annual Report in the FTSE 250 and were highly commended in the PwC Building Public Trust Awards for ‘Excellence in Reporting’. It is in this spirit that we have sought to adopt early a number of changes proposed by the UK Corporate Governance Code in respect of:
— providing a statement that our Annual Report has been prepared to ensure that, taken as a whole, the Report is fair, balanced and understandable and provides the information necessary for shareholders to assess the Company’s performance, business model and strategy
+See page 130.
— providing an explanation of how significant accounting issues are addressed, how we assess the effectiveness of the external audit process and the timing of the audit tender process
+See pages 109 and 110.
In addition, we have also included a number of changes proposed by the The Department for Business Innovation & Skills in respect of Directors’ pay reporting which will not come into effect until October 2013, including division of the report into two distinct sections; the first dealing with our remuneration policy; the latter with the implementation of that policy during 2013 (this section also includes information required to be reported under existing legislation and regulations);
— the policy section sets out the components of reward, how they are linked to the business strategy and reward opportunities for the Executive Directors
+See pages 115 to 118; and
— the implementation section reports on remuneration of the Executive Directors for the financial year ended 31 March 2013, and includes a table showing the breakdown of total pay for each Executive Director
+See pages 119 to 125.
Martin Scicluna Chairman
22 May 2013
102 Great Portland Estates Annual Report 2013
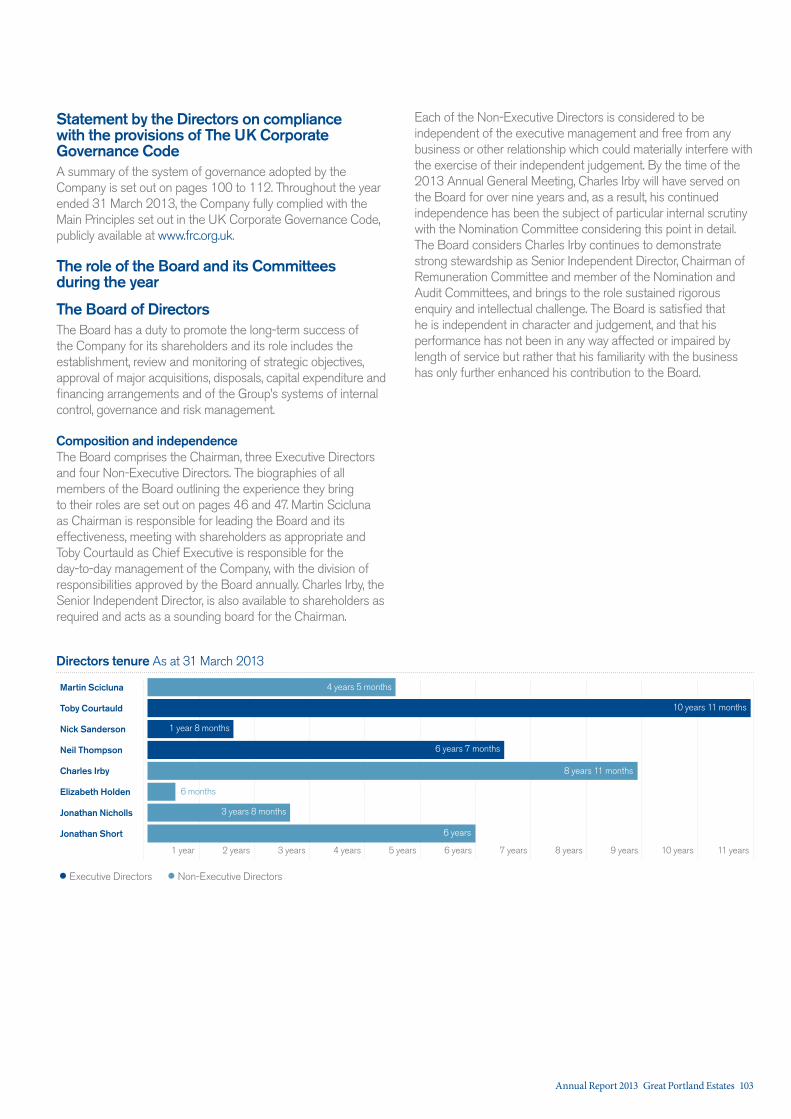
Statement by the Directors on compliance with the provisions of The UK Corporate Governance CodeA summary of the system of governance adopted by the Company is set out on pages 100 to 112. Throughout the year ended 31 March 2013, the Company fully complied with the Main Principles set out in the UK Corporate Governance Code, publicly available at www.frc.org.uk.
The role of the Board and its Committees during the year
The Board of DirectorsThe Board has a duty to promote the long-term success of the Company for its shareholders and its role includes the establishment, review and monitoring of strategic objectives, approval of major acquisitions, disposals, capital expenditure and financing arrangements and of the Group’s systems of internal control, governance and risk management.
Composition and independenceThe Board comprises the Chairman, three Executive Directors and four Non-Executive Directors. The biographies of all members of the Board outlining the experience they bring to their roles are set out on pages 46 and 47. Martin Scicluna as Chairman is responsible for leading the Board and its effectiveness, meeting with shareholders as appropriate and Toby Courtauld as Chief Executive is responsible for the day-to-day management of the Company, with the division of responsibilities approved by the Board annually. Charles Irby, the Senior Independent Director, is also available to shareholders as required and acts as a sounding board for the Chairman.
Each of the Non-Executive Directors is considered to be independent of the executive management and free from any business or other relationship which could materially interfere with the exercise of their independent judgement. By the time of the 2013 Annual General Meeting, Charles Irby will have served on the Board for over nine years and, as a result, his continued independence has been the subject of particular internal scrutiny with the Nomination Committee considering this point in detail. The Board considers Charles Irby continues to demonstrate strong stewardship as Senior Independent Director, Chairman of Remuneration Committee and member of the Nomination and Audit Committees, and brings to the role sustained rigorous enquiry and intellectual challenge. The Board is satisfied that he is independent in character and judgement, and that his performance has not been in any way affected or impaired by length of service but rather that his familiarity with the business has only further enhanced his contribution to the Board.
Directors tenure As at 31 March 2013
1 year 2 years 3 years 4 years 5 years 6 years 7 years 8 years 9 years 10 years 11 years
Martin Scicluna 4 years 5 months
10 years 11 months
1 year 8 months
6 years 7 months
8 years 11 months
3 years 8 months
6 years
6 months
Toby Courtauld
Nick Sanderson
Neil Thompson
Charles Irby
Elizabeth Holden
Jonathan Nicholls
Jonathan Short
Executive Directors Non-Executive Directors
Annual Report 2013 Great Portland Estates 103
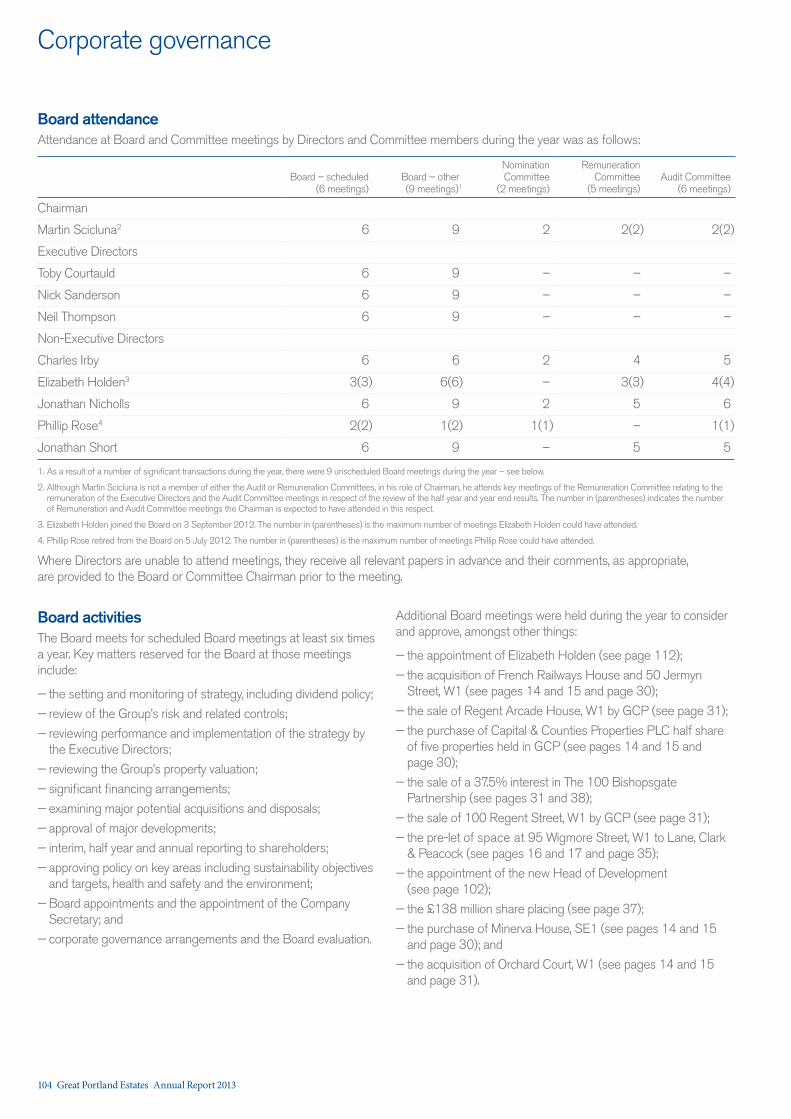
Corporate governance
Board activitiesThe Board meets for scheduled Board meetings at least six times a year. Key matters reserved for the Board at those meetings include:
— the setting and monitoring of strategy, including dividend policy;
— review of the Group’s risk and related controls;
— reviewing performance and implementation of the strategy by the Executive Directors;
— reviewing the Group’s property valuation;
— significant financing arrangements;
— examining major potential acquisitions and disposals;
— approval of major developments;
— interim, half year and annual reporting to shareholders;
— approving policy on key areas including sustainability objectives and targets, health and safety and the environment;
— Board appointments and the appointment of the Company Secretary; and
— corporate governance arrangements and the Board evaluation.
Additional Board meetings were held during the year to consider and approve, amongst other things:
— the appointment of Elizabeth Holden (see page 112);
— the acquisition of French Railways House and 50 Jermyn Street, W1 (see pages 14 and 15 and page 30);
— the sale of Regent Arcade House, W1 by GCP (see page 31);
— the purchase of Capital & Counties Properties PLC half share of five properties held in GCP (see pages 14 and 15 and page 30);
— the sale of a 37.5% interest in The 100 Bishopsgate Partnership (see pages 31 and 38);
— the sale of 100 Regent Street, W1 by GCP (see page 31);
— the pre-let of space at 95 Wigmore Street, W1 to Lane, Clark & Peacock (see pages 16 and 17 and page 35);
— the appointment of the new Head of Development (see page 102);
— the £138 million share placing (see page 37);
— the purchase of Minerva House, SE1 (see pages 14 and 15 and page 30); and
— the acquisition of Orchard Court, W1 (see pages 14 and 15 and page 31).
Board attendanceAttendance at Board and Committee meetings by Directors and Committee members during the year was as follows:
Board – scheduled (6 meetings)
Board – other (9 meetings)1
Nomination Committee
(2 meetings)
Remuneration Committee
(5 meetings)Audit Committee
(6 meetings)
Chairman
Martin Scicluna2 6 9 2 2(2) 2(2)
Executive Directors
Toby Courtauld 6 9 – – –
Nick Sanderson 6 9 – – –
Neil Thompson 6 9 – – –
Non-Executive Directors
Charles Irby 6 6 2 4 5
Elizabeth Holden3 3(3) 6(6) – 3(3) 4(4)
Jonathan Nicholls 6 9 2 5 6
Phillip Rose4 2(2) 1(2) 1(1) – 1(1)
Jonathan Short 6 9 – 5 5
1. As a result of a number of significant transactions during the year, there were 9 unscheduled Board meetings during the year – see below.
2. Although Martin Scicluna is not a member of either the Audit or Remuneration Committees, in his role of Chairman, he attends key meetings of the Remuneration Committee relating to the remuneration of the Executive Directors and the Audit Committee meetings in respect of the review of the half year and year end results. The number in (parentheses) indicates the number of Remuneration and Audit Committee meetings the Chairman is expected to have attended in this respect.
3. Elizabeth Holden joined the Board on 3 September 2012. The number in (parentheses) is the maximum number of meetings Elizabeth Holden could have attended.
4. Phillip Rose retired from the Board on 5 July 2012. The number in (parentheses) is the maximum number of meetings Phillip Rose could have attended.
Where Directors are unable to attend meetings, they receive all relevant papers in advance and their comments, as appropriate, are provided to the Board or Committee Chairman prior to the meeting.
104 Great Portland Estates Annual Report 2013
At least once a year the Board reviews the nature and scale of matters reserved for its decision. The only change for the current year was for the Board to have greater oversight of succession planning for both the Board and senior executives below Board level and no changes have been proposed for coming year. The Chairman and the other Non-Executives meet regularly without the Executive Directors, and at least once a year the Non-Executives meet without the Chairman.
In addition, individual Directors meet regularly outside the formal Board meetings as part of each Director’s contribution to the delivery of the Company’s strategy and review of operations. The Executive Directors meet weekly as the Executive Committee, chaired by the Chief Executive, to deal with the ongoing management of the Group with copies of the minutes of these meetings distributed to the Chairman and Non-Executive Directors.
To enable the Board to discharge its duties, all Directors receive appropriate and timely information, including briefing papers distributed in advance of Board meetings and regular property tours which, this year, included a tour of 160 Great Portland Street, 33 Margaret Street and 95 Wigmore Street. All Directors have access to the advice and services of the Company Secretary, who is responsible to the Chairman on matters of corporate governance.
The Company maintains directors’ and officers’ liability insurance and pension trustee liability insurance, both of which are reviewed annually.
Committees of the BoardThe Board has Audit, Remuneration and Nomination Committees which deal with specific aspects of the Group’s affairs, each of which has written terms of reference and which are reviewed annually by the Board. Copies of these terms of reference are available on written request and on the Company’s website at www.gpe.co.uk/investors/governance/
The Chairman of each Committee reports the outcome of the meetings to the Board. Details of Committee memberships are included in the directors’ biographies on pages 46 to 47.
Board induction and developmentOn appointment, Non-Executive Directors, who are expected to provide a time commitment to the Company of at least 24 days a year, are provided with a detailed induction programme. This covers the Company’s operations, including social, ethical and environmental matters, and meetings with senior management as part of a guided tour of the Group’s main properties.
As part of her induction, Elizabeth Holden:
— met with each of the Directors and the Company Secretary;
— met with the Heads of Investment Management, Asset Management, Leasing, Project Management, Financial Reporting and Investor Relations and Corporate Finance to better understand their roles and how their departments work;
— met with the auditors both before joining and, subsequent to joining, before the first Audit Committee meeting;
— met with valuers to understand CBRE’s valuation process;
— undertook property tours covering over 40 of the Group’s key buildings;
— went through the 2012 Strategy Review with Nick Sanderson and the 2013 Strategy Review, in advance of the April 2013 Board meeting, with all three Executive Directors; and
— attended seminars on the London real estate market, governance, financial reporting and remuneration.
The Directors may, at the Company’s expense, take independent professional advice and are encouraged to continually update their professional skills and knowledge of the business. Senior Managers and external advisers presented to the Board during the year on a range of subjects including acquisitions, developments, the outlook for the economy, the property market, the West End and City markets and potential and impending legal and regulatory changes. The Directors also individually attend seminars or conferences associated with their expertise or responsibility. The level and nature of training by the Directors is reviewed by the Chairman at least annually.
Conflicts of interestIn accordance with the Companies Act 2006, the Company’s Articles of Association allow the Board to authorise potential conflicts of interest that may arise and to impose such limits or conditions as it thinks fit. The decision to authorise a conflict of interest can only be made by non-conflicted Directors (those who have no interest in the matter being considered) and in making such a decision the Directors must act in a way they consider in good faith will be most likely to promote the Company’s success. The Company has established a procedure whereby actual and potential conflicts of interest of current and proposed roles to be undertaken by the Directors with other organisations are regularly reviewed in respect of both the nature of those roles, and their time commitment, and for proper authorisation to be sought prior to the appointment of any new Director. The Board consider these procedures to be working effectively.
Annual Report 2013 Great Portland Estates 105
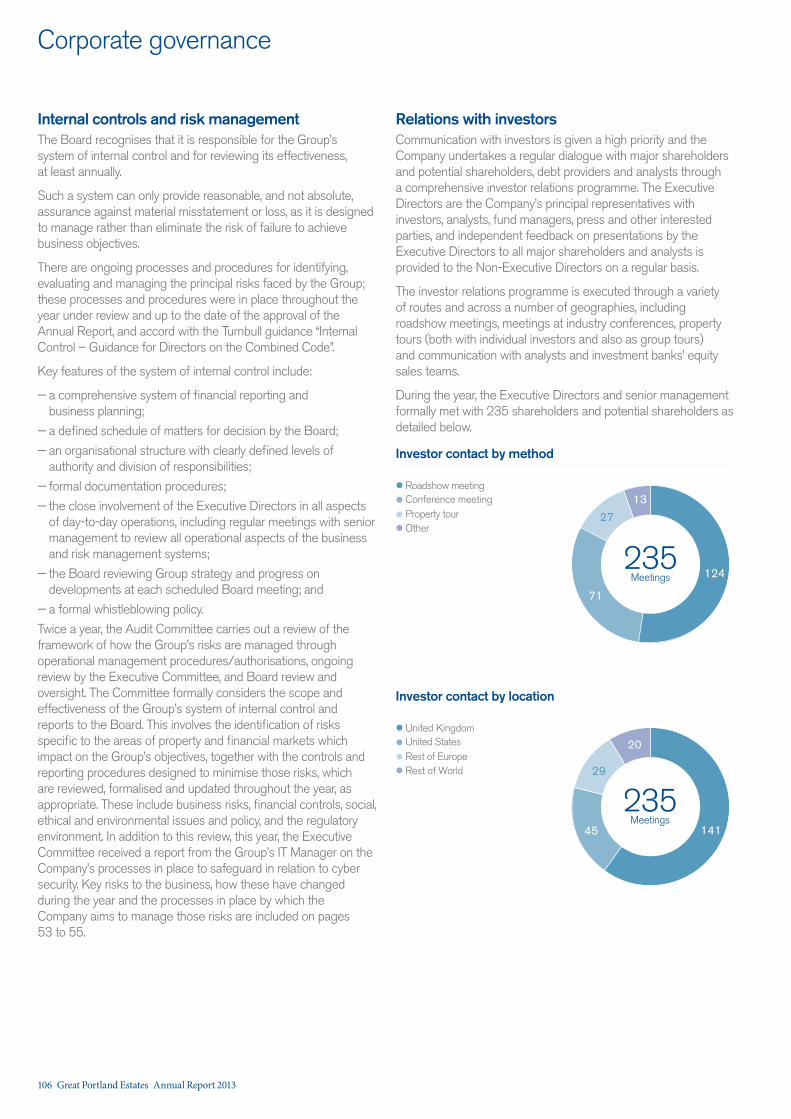
Corporate governance
Relations with investorsCommunication with investors is given a high priority and the Company undertakes a regular dialogue with major shareholders and potential shareholders, debt providers and analysts through a comprehensive investor relations programme. The Executive Directors are the Company’s principal representatives with investors, analysts, fund managers, press and other interested parties, and independent feedback on presentations by the Executive Directors to all major shareholders and analysts is provided to the Non-Executive Directors on a regular basis.
The investor relations programme is executed through a variety of routes and across a number of geographies, including roadshow meetings, meetings at industry conferences, property tours (both with individual investors and also as group tours) and communication with analysts and investment banks’ equity sales teams.
During the year, the Executive Directors and senior management formally met with 235 shareholders and potential shareholders as detailed below.
Investor contact by method
Roadshow meetingConference meeting
235Meetings
Property tourOther
124
71
1327
United KingdomUnited StatesRest of EuropeRest of World
Investor contact by location
14145
20
29
235Meetings
Internal controls and risk managementThe Board recognises that it is responsible for the Group’s system of internal control and for reviewing its effectiveness, at least annually.
Such a system can only provide reasonable, and not absolute, assurance against material misstatement or loss, as it is designed to manage rather than eliminate the risk of failure to achieve business objectives.
There are ongoing processes and procedures for identifying, evaluating and managing the principal risks faced by the Group; these processes and procedures were in place throughout the year under review and up to the date of the approval of the Annual Report, and accord with the Turnbull guidance “Internal Control – Guidance for Directors on the Combined Code”.
Key features of the system of internal control include:
— a comprehensive system of financial reporting and business planning;
— a defined schedule of matters for decision by the Board;
— an organisational structure with clearly defined levels of authority and division of responsibilities;
— formal documentation procedures;
— the close involvement of the Executive Directors in all aspects of day-to-day operations, including regular meetings with senior management to review all operational aspects of the business and risk management systems;
— the Board reviewing Group strategy and progress on developments at each scheduled Board meeting; and
— a formal whistleblowing policy.
Twice a year, the Audit Committee carries out a review of the framework of how the Group’s risks are managed through operational management procedures/authorisations, ongoing review by the Executive Committee, and Board review and oversight. The Committee formally considers the scope and effectiveness of the Group’s system of internal control and reports to the Board. This involves the identification of risks specific to the areas of property and financial markets which impact on the Group’s objectives, together with the controls and reporting procedures designed to minimise those risks, which are reviewed, formalised and updated throughout the year, as appropriate. These include business risks, financial controls, social, ethical and environmental issues and policy, and the regulatory environment. In addition to this review, this year, the Executive Committee received a report from the Group’s IT Manager on the Company’s processes in place to safeguard in relation to cyber security. Key risks to the business, how these have changed during the year and the processes in place by which the Company aims to manage those risks are included on pages 53 to 55.
106 Great Portland Estates Annual Report 2013
The Annual General Meeting provides the Board with an opportunity to communicate with, and answer questions from, private and institutional shareholders and the whole Board is available before the meeting, in particular, for shareholders to meet new Directors.
The Chairman of each of the Audit, Nomination and Remuneration Committees is available at the Annual General Meeting to answer questions. Details of the resolutions to be proposed at the Annual General Meeting on 4 July 2013 can be found in the Notice of Meeting on pages 134 and 135. After the Annual General Meeting, the Company’s Registrars will count and verify the poll votes. The results will be announced to the London Stock Exchange and will be published on our website.
The Executive Directors and corporate finance team also have regular dialogue with our debt providers, including relationship banks, private placement investors and debenture holders.
Martin Scicluna, as Chairman, also meets with major shareholders, as appropriate, during the course of the year. This year, Martin Scicluna and Charles Irby also offered to meet with major shareholders and shareholder representative bodies in respect of the proposed change to the TPR performance measure under the Long-Term Incentive Plan.
Presentations to analysts are posted on the Company’s website at www.gpe.co.uk/investors/presentations. As Chairman and Senior Independent Director, respectively, Martin Scicluna and Charles Irby are each available, as appropriate, as a contact for shareholders.
Investor relations programmeMonth Investor Roadshows Industry Conferences Other
2012
April
May London Equity sales force meetings (5)
June Edinburgh, US London (2) Equity sales force meeting (1)
July Netherlands Equity sales force meeting (1)
August
September Frankfurt, Paris Berlin, US, London Equity sales force meeting (1), sell side analyst property tour, investor group property tour
October London
November London, Zurich, US Equity sales force meetings (3)
December Dublin
2013
January London Crossrail presentation to investors
February Hong Kong/PRC Equity sales force meetings (3)
March US, London
Annual Report 2013 Great Portland Estates 107
Corporate governance
Jonathan Nicholls was previously Group Finance Director of Old Mutual plc and Hanson plc and is Chairman of the Audit Committee of SIG plc and D S Smith plc. The Audit Committee provides a forum for reporting by the Group’s external auditors and meetings are also attended by certain Executive Directors and Senior Managers by invitation. Martin Scicluna, as Chairman, also attends the Committee meetings in connection with the half year and year-end results.
The Committee is responsible for reviewing, and reporting to the Board on, a range of matters including:
— the interim management statements, the half year and annual financial statements and significant reporting judgements and key assumptions therein;
— meetings with the Group’s auditors and property valuers;
— developments in accounting and reporting requirements;
— the review of the Group’s internal control and risk management systems;
— the Group’s systems and controls for the prevention of bribery and reports on non-compliance;
— the Group’s whistleblowing policy;
— the scope, effectiveness, independence and objectivity of the external audit;
— the external auditors’ management letter;
— the level of fees paid to the external auditors for audit and non-audit services;
— the potential need for an internal audit function; and
— the recommendation for the reappointment of the auditors based on continued satisfactory performance.
Chairman: Jonathan Nicholls
Members: Elizabeth Holden Charles Irby Jonathan Short
Audit CommitteeThe Audit Committee reviews and reports to the Board on the Group’s financial reporting, internal control and risk management systems and the independence and effectiveness of the auditors. Each year, in advance of the half year and year end results, the Committee uses the Audit Planning meetings in September and February to consider proposed accounting treatments for major transactions and significant reporting judgements and key assumptions therein. The Audit Committee reviews formally the performance of the auditors annually, and in the opinion of the Audit Committee, the relationship with the auditors works well. The Committee remains satisfied with the auditors’ independence and effectiveness and has recommended to the Board that they be reappointed.
Month Principal activities
July 2012 Review of Interim Management Statement
– Meeting with the Valuers
– Review of Interim Management Statement Announcement
September 2012 Annual planning meeting
– Meeting with the Auditors
– Review of:
– effectiveness and independence of the auditors – see page 110
– 2012 management letter
– significant accounting, reporting and judgement matters – see page 109
– 2013 Audit Plan
– confirmation of new audit partner from 2013
November 2012 Review of half year results
– Meeting with the Valuers
– Meeting with the Auditors
– Review of:
– significant accounting, reporting and judgement matters – see page 109
– the Group’s tax matters with the Head of Corporate Finance
– internal controls and risk management process
– half year result announcement
January 2013 Review of Interim Management Statement
– Meeting with the Valuers
– Review of:
– Interim Management Statement Announcement
– the effectiveness of the Committee through the Board evaluation process
108 Great Portland Estates Annual Report 2013
Accounting and key areas of judgementThe Audit Committee uses the Audit Planning meetings in September and February each year to consider proposed accounting treatments for major transactions, significant reporting judgements and key assumptions therein in advance of the half year and year-end results.
As the valuation of the Group’s portfolio is fundamental to the Group’s balance sheet, the Audit Committee, together with Martin Scicluna, meets with the valuers along with the auditors to discuss the valuation included within the half year and year-end financial statements and changes in market conditions. The external auditors meet with the valuers separately from the Audit Committee and provide the Audit Committee with a summary of their review as part of their report on the half year and year-end results. The Audit Committee meets with the valuers to discuss the valuation included in the interim management statements.
For the year ended 31 March 2013, the accounting for the sell down of the 37.5% interest in The 100 Bishopsgate Partnership was specifically reviewed by the Audit Committee. The review included the treatment of the remaining 12.5% equity interest (Other investment note 12), Partnership loans (Other investment note 12), Loan payable to Brookfield (included in Loans and borrowings note 16), put option (fair value recognised through the profit and loss) and deferred consideration (included in Debtors note 14). In addition, due to the intricacies of the accounting, particularly during the 24 month option period, management’s treatment of the sell down has been reviewed in detail by Deloitte’s financial instruments specialists who have agreed with management’s approach. The Audit Committee has reviewed and concurred with the methodology supporting this matter.
Management confirmed to the Audit Committee that they were not aware of any misstatements, either material or immaterial, made to achieve a particular presentation. The Auditors reported to the Audit Committee that they had found no misstatements in the course of their work.
After reviewing the reports from management and consulting where necessary with the auditors and valuers, the Audit Committee is satisfied that the financial statements appropriately address the critical judgements and key estimates, both in respect of the amounts reported and the disclosures. The Committee is also satisfied that the processes used for determining the value of the assets and liabilities have been appropriately scrutinised, challenged and are sufficiently robust.
Month Principal activities
February 2013 Year-end planning update
– Meeting with the Auditors
– Review of:
– Group forecasting processes review by Deloitte
– significant accounting, reporting and judgement matters – see opposite
– developments in accounting and reporting requirements and proposed disclosure in the 2013 Annual Report in relation to changes in the UK Corporate Governance Code and The Department of Business Innovation and Skills Directors’ Remuneration Reforms
– Audit Plan update
Agreement of 2013 Audit fee
May 2013 Review of year end results
– Meeting with the Valuers
– Meeting with the Auditors
– Review of:
– significant accounting, reporting and judgement matters – see opposite
– the Group’s tax matters with the Head of Corporate Finance
– internal controls and risk management process – see pages 52 to 55
– the potential need for internal audit
– Annual Report/Preliminary Announcement
– Ethics policy and Whistleblowing policy – see page 57
– the Committee’s effectiveness
– relationship between the auditors and GPE management
– reappointment of the auditors
Annual Report 2013 Great Portland Estates 109
Corporate governance
is required by the Audit Committee for assignments over £50,000, or where such an assignment would take the cumulative total of non-audit fees paid to the external auditors over 50% of that year’s audit fees to ensure auditor independence and objectivity is maintained. Drivers Jonas, which was acquired by Deloitte LLP in 2010, and renamed Deloitte Real Estate, on occasions provides the Group and the Group’s joint ventures with advice on rights of light, party walls and other items involving adjoining owners or third parties (“neighbourly matters”). Fees paid to Deloitte Real Estate by both the Group and the joint ventures are, therefore, also monitored by the Audit Committee.
During the year activities undertaken by the auditors for the Group outside of the main audit included:
— reporting on the income cover in connection with the debenture trust deed compliance certificate;
— advice on the application of tax legislation on property transactions;
— neighbourly matters undertaken by Deloitte Real Estate at 73/89 Oxford Street, W1;
— assurance on achievement against 2012/13 sustainability objectives and targets and energy consumption data; and
— ad hoc accounting advice.
Payments made by the Group for audit and non-audit fees for the year are disclosed on page 76. Deloitte LLP has confirmed to the Audit Committee that it remains independent and has maintained internal safeguards to ensure its objectivity.
Deloitte LLP has been the Group’s auditor since 2003. It is a requirement that the audit partner responsible for the Group and subsidiary audits is rotated every five years and a new lead audit partner will take responsibility for the audit in June 2013. The Audit Committee is mindful that under the UK Corporate Governance Code, the audit should be put out for tender every ten years; however, the exact timing remains at its discretion. Under the transitional arrangements of the UK Corporate Governance Code, the latest date the Audit Committee would need to consider putting out the audit tender is 2023, however, the Committee will consider the tender of the audit annually depending on the auditor’s performance. In the opinion of the Audit Committee, the relationship with the auditors works well and the Committee remains satisfied with their independence and effectiveness. There are no contractual obligations restricting the Company’s choice of external auditor.
Internal auditDue to its size and structure, the Group does not have an internal audit function, a matter which is kept under review by the Committee. Although there is no formal internal audit function, a rolling programme of review of key controls is conducted through a combination of the external audit process or through reviews by members of the finance team and/or external advisors as appropriate.
The external audit, review of its effectiveness, non-audit services and auditor reappointmentThe Audit Committee advises the Board on the appointment of the external auditors, their remuneration for audit and non-audit work, and their cost effectiveness, independence and objectivity, and discusses the nature, scope and results of the audit with the external auditors. As part of the review of the effectiveness of the external audit process, a formal evaluation process incorporating views from the Audit Committee and relevant members of management is considered by the Audit Committee and feedback is provided to the auditors. Areas covered by this review include:
— the calibre of the external audit firm – including reputation, coverage and industry presence;
— quality controls – including review processes, partner oversight, reports from the Audit Inspection Units and regulators, and use of specialists;
— the audit team – covering quality of individuals, knowledge, resources, partner involvement, team rotation, the audit scope including planning and execution, scope adequacy and
specialist areas;
— audit fee – reasonableness and scope changes;
— audit communications and effectiveness – planning, new developments/regulations, approach to critical accounting policies, issues and risks, quality of processes; timely resolution of issues; freedom of communication with the Audit Committee and feedback on management performance;
— governance and independence – internal governance arrangements, lines of communication with the Audit Committee; integrity of the Audit team, Audit Committee confidence in the audit team and transparency;
— ethical standards – including conflicts of interest, non-audit work and partner rotation; and
— potential impairment of independence by non-audit fee income.
The Committee also considers the effectiveness of management in the external audit process in respect of the timely identification and resolution of areas of accounting judgement with input from the auditors and the Audit Committee as appropriate; and the timely provision of the draft Half year results announcement and Annual Report and Accounts for review by the auditors and the Committee.
In addition to the review of the formal management letter from the auditors which outlines how points raised by the auditors have been addressed by management, feedback is sought from the auditors on the conduct of members of the finance team during the audit process.
The auditors are responsible for the annual statutory audit and other services which the Audit Committee believe they are best placed to undertake due to their position as auditors. Under the Group’s policy in respect of non-audit services permitted to be provided by the external auditor (available from the Company’s website at www.gpe.co.uk/investors/governance), prior approval
110 Great Portland Estates Annual Report 2013
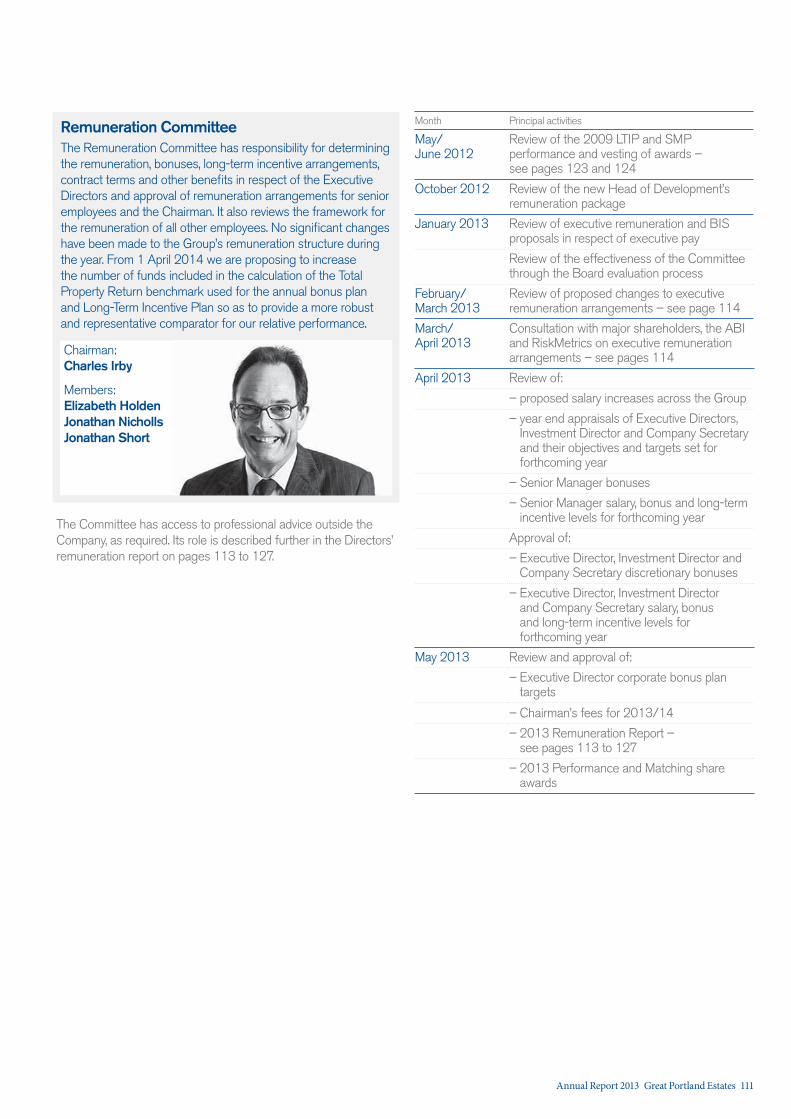
The Committee has access to professional advice outside the Company, as required. Its role is described further in the Directors’ remuneration report on pages 113 to 127.
Chairman: Charles Irby
Members: Elizabeth Holden Jonathan Nicholls Jonathan Short
Remuneration CommitteeThe Remuneration Committee has responsibility for determining the remuneration, bonuses, long-term incentive arrangements, contract terms and other benefits in respect of the Executive Directors and approval of remuneration arrangements for senior employees and the Chairman. It also reviews the framework for the remuneration of all other employees. No significant changes have been made to the Group’s remuneration structure during the year. From 1 April 2014 we are proposing to increase the number of funds included in the calculation of the Total Property Return benchmark used for the annual bonus plan and Long-Term Incentive Plan so as to provide a more robust and representative comparator for our relative performance.
Month Principal activities
May/ June 2012
Review of the 2009 LTIP and SMP performance and vesting of awards – see pages 123 and 124
October 2012 Review of the new Head of Development’s remuneration package
January 2013 Review of executive remuneration and BIS proposals in respect of executive pay
Review of the effectiveness of the Committee through the Board evaluation process
February/ March 2013
Review of proposed changes to executive remuneration arrangements – see page 114
March/ April 2013
Consultation with major shareholders, the ABI and RiskMetrics on executive remuneration arrangements – see pages 114
April 2013 Review of:
– proposed salary increases across the Group
– year end appraisals of Executive Directors, Investment Director and Company Secretary and their objectives and targets set for forthcoming year
– Senior Manager bonuses
– Senior Manager salary, bonus and long-term incentive levels for forthcoming year
Approval of:
– Executive Director, Investment Director and Company Secretary discretionary bonuses
– Executive Director, Investment Director and Company Secretary salary, bonus and long-term incentive levels for forthcoming year
May 2013 Review and approval of:
– Executive Director corporate bonus plan targets
– Chairman’s fees for 2013/14
– 2013 Remuneration Report – see pages 113 to 127
– 2013 Performance and Matching share awards
Annual Report 2013 Great Portland Estates 111
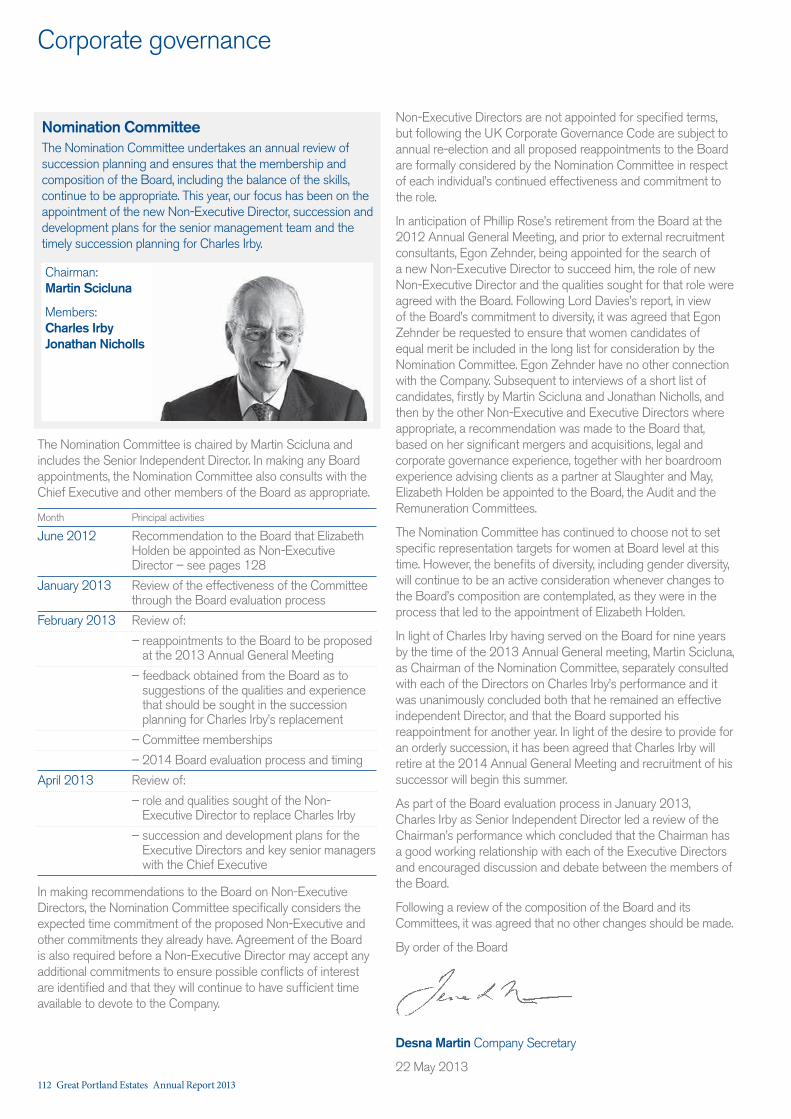
Corporate governance
The Nomination Committee is chaired by Martin Scicluna and includes the Senior Independent Director. In making any Board appointments, the Nomination Committee also consults with the Chief Executive and other members of the Board as appropriate.
Month Principal activities
June 2012 Recommendation to the Board that Elizabeth Holden be appointed as Non-Executive Director – see pages 128
January 2013 Review of the effectiveness of the Committee through the Board evaluation process
February 2013 Review of:
– reappointments to the Board to be proposed at the 2013 Annual General Meeting
– feedback obtained from the Board as to suggestions of the qualities and experience that should be sought in the succession planning for Charles Irby’s replacement
– Committee memberships
– 2014 Board evaluation process and timing
April 2013 Review of:
– role and qualities sought of the Non-Executive Director to replace Charles Irby
– succession and development plans for the Executive Directors and key senior managers with the Chief Executive
In making recommendations to the Board on Non-Executive Directors, the Nomination Committee specifically considers the expected time commitment of the proposed Non-Executive and other commitments they already have. Agreement of the Board is also required before a Non-Executive Director may accept any additional commitments to ensure possible conflicts of interest are identified and that they will continue to have sufficient time available to devote to the Company.
Chairman: Martin Scicluna
Members: Charles Irby Jonathan Nicholls
Nomination CommitteeThe Nomination Committee undertakes an annual review of succession planning and ensures that the membership and composition of the Board, including the balance of the skills, continue to be appropriate. This year, our focus has been on the appointment of the new Non-Executive Director, succession and development plans for the senior management team and the timely succession planning for Charles Irby.
Non-Executive Directors are not appointed for specified terms, but following the UK Corporate Governance Code are subject to annual re-election and all proposed reappointments to the Board are formally considered by the Nomination Committee in respect of each individual’s continued effectiveness and commitment to the role.
In anticipation of Phillip Rose’s retirement from the Board at the 2012 Annual General Meeting, and prior to external recruitment consultants, Egon Zehnder, being appointed for the search of a new Non-Executive Director to succeed him, the role of new Non-Executive Director and the qualities sought for that role were agreed with the Board. Following Lord Davies’s report, in view of the Board’s commitment to diversity, it was agreed that Egon Zehnder be requested to ensure that women candidates of equal merit be included in the long list for consideration by the Nomination Committee. Egon Zehnder have no other connection with the Company. Subsequent to interviews of a short list of candidates, firstly by Martin Scicluna and Jonathan Nicholls, and then by the other Non-Executive and Executive Directors where appropriate, a recommendation was made to the Board that, based on her significant mergers and acquisitions, legal and corporate governance experience, together with her boardroom experience advising clients as a partner at Slaughter and May, Elizabeth Holden be appointed to the Board, the Audit and the Remuneration Committees.
The Nomination Committee has continued to choose not to set specific representation targets for women at Board level at this time. However, the benefits of diversity, including gender diversity, will continue to be an active consideration whenever changes to the Board’s composition are contemplated, as they were in the process that led to the appointment of Elizabeth Holden.
In light of Charles Irby having served on the Board for nine years by the time of the 2013 Annual General meeting, Martin Scicluna, as Chairman of the Nomination Committee, separately consulted with each of the Directors on Charles Irby’s performance and it was unanimously concluded both that he remained an effective independent Director, and that the Board supported his reappointment for another year. In light of the desire to provide for an orderly succession, it has been agreed that Charles Irby will retire at the 2014 Annual General Meeting and recruitment of his successor will begin this summer.
As part of the Board evaluation process in January 2013, Charles Irby as Senior Independent Director led a review of the Chairman’s performance which concluded that the Chairman has a good working relationship with each of the Executive Directors and encouraged discussion and debate between the members of the Board.
Following a review of the composition of the Board and its Committees, it was agreed that no other changes should be made.
By order of the Board
Desna Martin Company Secretary
22 May 2013112 Great Portland Estates Annual Report 2013
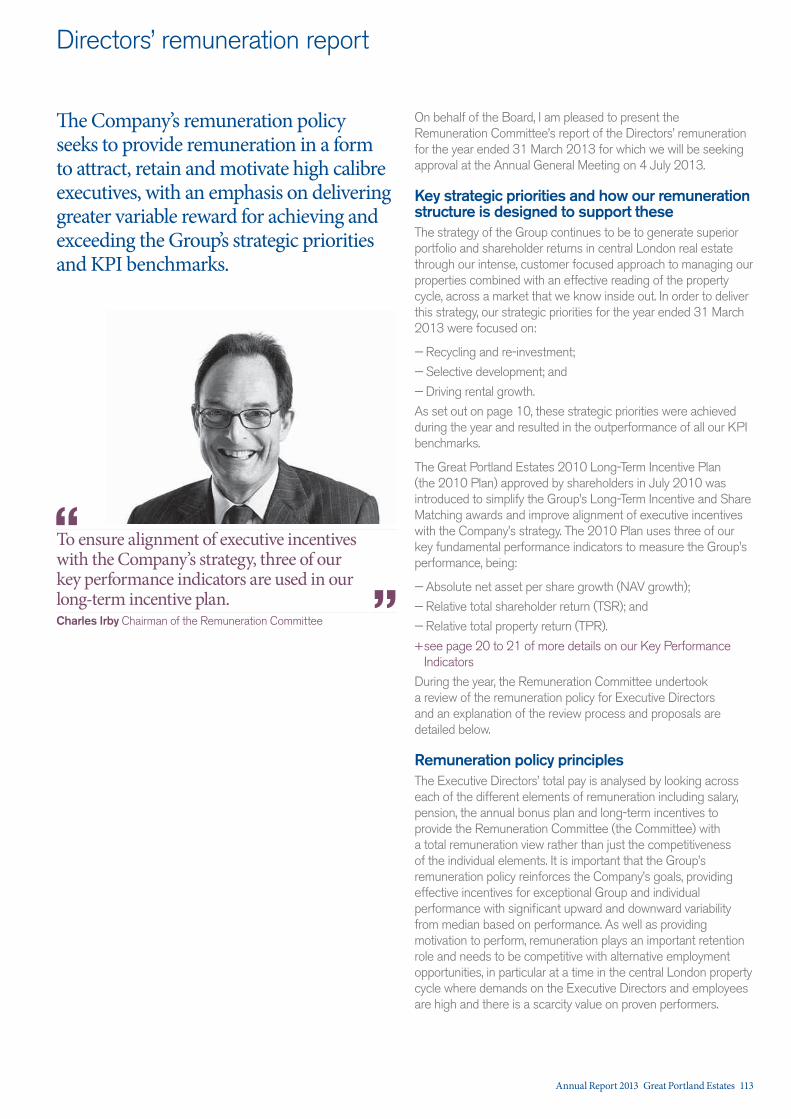
Directors’ remuneration report
The Company’s remuneration policy seeks to provide remuneration in a form to attract, retain and motivate high calibre executives, with an emphasis on delivering greater variable reward for achieving and exceeding the Group’s strategic priorities and KPI benchmarks.
On behalf of the Board, I am pleased to present the Remuneration Committee’s report of the Directors’ remuneration for the year ended 31 March 2013 for which we will be seeking approval at the Annual General Meeting on 4 July 2013.
Key strategic priorities and how our remuneration structure is designed to support theseThe strategy of the Group continues to be to generate superior portfolio and shareholder returns in central London real estate through our intense, customer focused approach to managing our properties combined with an effective reading of the property cycle, across a market that we know inside out. In order to deliver this strategy, our strategic priorities for the year ended 31 March 2013 were focused on:
— Recycling and re-investment;
— Selective development; and
— Driving rental growth.
As set out on page 10, these strategic priorities were achieved during the year and resulted in the outperformance of all our KPI benchmarks.
The Great Portland Estates 2010 Long-Term Incentive Plan (the 2010 Plan) approved by shareholders in July 2010 was introduced to simplify the Group’s Long-Term Incentive and Share Matching awards and improve alignment of executive incentives with the Company’s strategy. The 2010 Plan uses three of our key fundamental performance indicators to measure the Group’s performance, being:
— Absolute net asset per share growth (NAV growth);
— Relative total shareholder return (TSR); and
— Relative total property return (TPR).
+see page 20 to 21 of more details on our Key Performance Indicators
During the year, the Remuneration Committee undertook a review of the remuneration policy for Executive Directors and an explanation of the review process and proposals are detailed below.
Remuneration policy principlesThe Executive Directors’ total pay is analysed by looking across each of the different elements of remuneration including salary, pension, the annual bonus plan and long-term incentives to provide the Remuneration Committee (the Committee) with a total remuneration view rather than just the competitiveness of the individual elements. It is important that the Group’s remuneration policy reinforces the Company’s goals, providing effective incentives for exceptional Group and individual performance with significant upward and downward variability from median based on performance. As well as providing motivation to perform, remuneration plays an important retention role and needs to be competitive with alternative employment opportunities, in particular at a time in the central London property cycle where demands on the Executive Directors and employees are high and there is a scarcity value on proven performers.
To ensure alignment of executive incentives with the Company’s strategy, three of our key performance indicators are used in our long-term incentive plan. Charles Irby Chairman of the Remuneration Committee
“
”
Annual Report 2013 Great Portland Estates 113
Annual Bonus PlanOne of the current performance conditions for the annual bonus plan for the Executive Directors compares the Group’s annual portfolio capital growth to annual capital growth of the IPD Central and Inner London Quarterly Index. As a result of the proposed change to the long-term incentive arrangements set out below, in order to ensure consistency between our incentive schemes, it is proposed to move from the current benchmark to the IPD Central and Inner London March Valued Index, which contains a more comparable fund universe whilst maintaining the current outperformance payout schedule.
No other changes to the performance measures are proposed for the Annual Bonus Plan for the year ending 30 March 2014.
2010 LTIPAs a result of its review, and following consultation with major shareholders and shareholder representative bodies, the Committee proposes a change to the way the TPR performance condition operates.
Measurement of TPR performanceTPR is one of the three performance conditions we use to determine vesting levels for awards granted under the 2010 Plan. We are proposing a change to the benchmark against which the Company’s TPR performance is compared through the use of the IPD Central and Inner London March Valued Index, as opposed to the Quarterly Index used to date.
By benchmarking performance against the IPD Central and Inner London March Valued Index, and thus increasing the number of funds from 182 to 190 and their value from approximately £25 billion to £36 billion, it will bring some of the Company’s competitors into the index from which they are currently excluded as they do not report quarterly data to the IPD index.
This change should ensure the most comprehensive comparator group whilst maintaining its direct comparability through including central and inner London properties only.
We believe major shareholders consulted to be widely supportive of this change.
This change to how the TPR measure operates in practice is within the scope of the terms of the 2010 Plan approved by shareholders, all other measurement aspects remaining the same.
No other changes are proposed for the performance conditions for the 2013 awards.
Charles Irby Chairman of the Remuneration Committee
22 May 2013
To achieve the aims of the Company’s remuneration policy, the Committee seeks to position fixed remuneration including benefits and pension at or below market and total executive remuneration around mid-market for on-target performance taking into account the size and complexity of the business as compared to other peer companies in the sector, using a significant proportion of variable reward to increase total potential remuneration for superior performance through the annual bonus plan and long-term incentives.
2012/13 overviewNo changes were made to the Group’s remuneration structure in the year ended 31 March 2013.
Basic salaries for Executive Directors were increased by 3%, in line with the average increases provided to employees.
In June 2012, the Group’s 2009 Long-Term Incentive Plan Awards and Share Matching Plan awards based on outperformance of TSR and NAV vested in full.
The Executive Directors achieved the maximum performance under the Company’s bonus plan in respect of targets set for NAV and capital growth of the Company’s property portfolio against IPD’s relevant Capital Growth Index. As a result of the achievement of the Executive Directors’ personal objectives during the year outlined on page 120, the Committee has awarded the Executive Directors the full potential bonus for operational excellence.
Proposed changes in 2013/14
Review of remuneration arrangementsDuring the year, the Committee has conducted a review of the effectiveness of the current incentive plans and their linkage to business strategy.
Overall the Committee concluded that the incentives have provided strong alignment between shareholders and the executive team and since the last review in 2010 the Company has consistently outperformed the market and delivered substantial returns to shareholders across all of the key performance measures.
The Committee’s review also concluded that salaries remain below market median levels and both minimum and maximum vesting thresholds under the 2010 Plan are more challenging than market norms.
SalaryAs in 2012/13, it is proposed that salaries will be increased by 3%, in line with the average increases provided to employees.
Directors’ remuneration report
114 Great Portland Estates Annual Report 2013
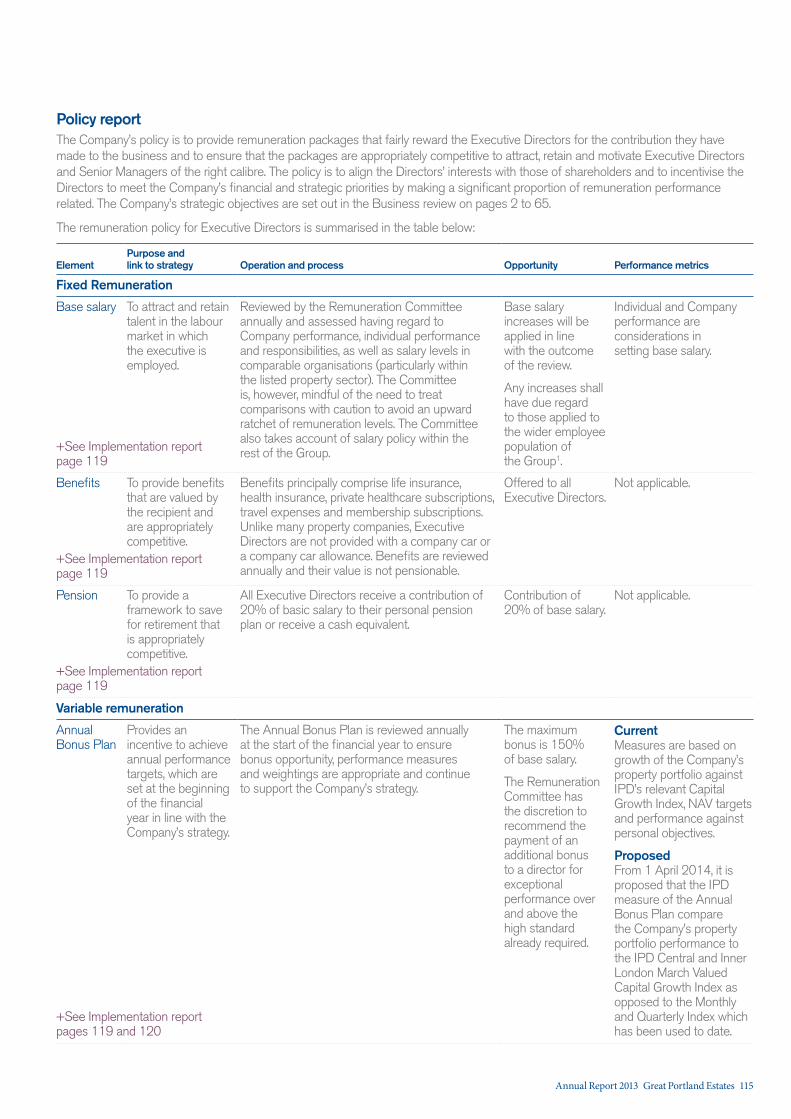
Policy report The Company’s policy is to provide remuneration packages that fairly reward the Executive Directors for the contribution they have made to the business and to ensure that the packages are appropriately competitive to attract, retain and motivate Executive Directors and Senior Managers of the right calibre. The policy is to align the Directors’ interests with those of shareholders and to incentivise the Directors to meet the Company’s financial and strategic priorities by making a significant proportion of remuneration performance related. The Company’s strategic objectives are set out in the Business review on pages 2 to 65.
The remuneration policy for Executive Directors is summarised in the table below:
ElementPurpose and link to strategy Operation and process Opportunity Performance metrics
Fixed Remuneration
Base salary To attract and retain talent in the labour market in which the executive is employed.
Reviewed by the Remuneration Committee annually and assessed having regard to Company performance, individual performance and responsibilities, as well as salary levels in comparable organisations (particularly within the listed property sector). The Committee is, however, mindful of the need to treat comparisons with caution to avoid an upward ratchet of remuneration levels. The Committee also takes account of salary policy within the rest of the Group.
Base salary increases will be applied in line with the outcome of the review.
Any increases shall have due regard to those applied to the wider employee population of the Group1.
Individual and Company performance are considerations in setting base salary.
+See Implementation report page 119
Benefits To provide benefits that are valued by the recipient and are appropriately competitive.
Benefits principally comprise life insurance, health insurance, private healthcare subscriptions, travel expenses and membership subscriptions. Unlike many property companies, Executive Directors are not provided with a company car or a company car allowance. Benefits are reviewed annually and their value is not pensionable.
Offered to all Executive Directors.
Not applicable.
+See Implementation report page 119
Pension To provide a framework to save for retirement that is appropriately competitive.
All Executive Directors receive a contribution of 20% of basic salary to their personal pension plan or receive a cash equivalent.
Contribution of 20% of base salary.
Not applicable.
+See Implementation report page 119
Variable remuneration
Annual Bonus Plan
Provides an incentive to achieve annual performance targets, which are set at the beginning of the financial year in line with the Company’s strategy.
The Annual Bonus Plan is reviewed annually at the start of the financial year to ensure bonus opportunity, performance measures and weightings are appropriate and continue to support the Company’s strategy.
The maximum bonus is 150% of base salary.
The Remuneration Committee has the discretion to recommend the payment of an additional bonus to a director for exceptional performance over and above the high standard already required.
CurrentMeasures are based on growth of the Company’s property portfolio against IPD’s relevant Capital Growth Index, NAV targets and performance against personal objectives.
ProposedFrom 1 April 2014, it is proposed that the IPD measure of the Annual Bonus Plan compare the Company’s property portfolio performance to the IPD Central and Inner London March Valued Capital Growth Index as opposed to the Monthly and Quarterly Index which has been used to date.
+See Implementation report pages 119 and 120
Annual Report 2013 Great Portland Estates 115
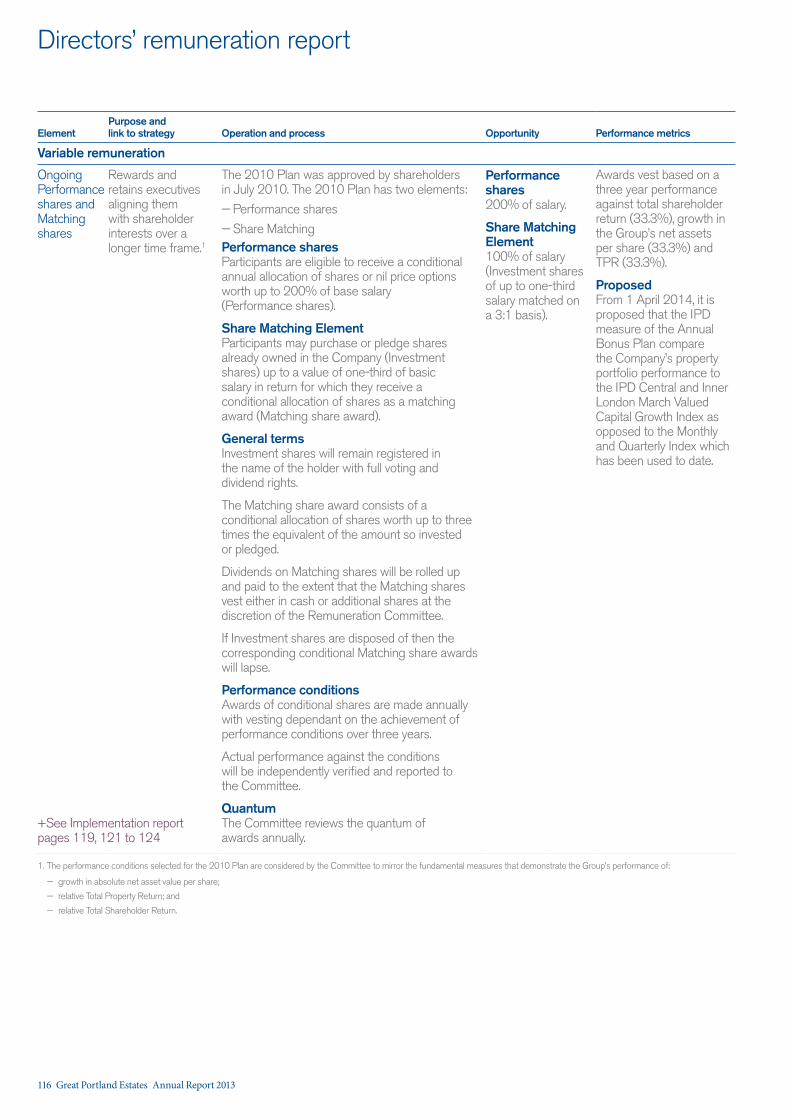
ElementPurpose and link to strategy Operation and process Opportunity Performance metrics
Variable remuneration
Ongoing Performance shares and Matching shares
Rewards and retains executives aligning them with shareholder interests over a longer time frame.1
The 2010 Plan was approved by shareholders in July 2010. The 2010 Plan has two elements:
— Performance shares
— Share MatchingPerformance sharesParticipants are eligible to receive a conditional annual allocation of shares or nil price options worth up to 200% of base salary (Performance shares).
Share Matching ElementParticipants may purchase or pledge shares already owned in the Company (Investment shares) up to a value of one-third of basic salary in return for which they receive a conditional allocation of shares as a matching award (Matching share award).
General termsInvestment shares will remain registered in the name of the holder with full voting and dividend rights.
The Matching share award consists of a conditional allocation of shares worth up to three times the equivalent of the amount so invested or pledged.
Dividends on Matching shares will be rolled up and paid to the extent that the Matching shares vest either in cash or additional shares at the discretion of the Remuneration Committee.
If Investment shares are disposed of then the corresponding conditional Matching share awards will lapse.
Performance conditionsAwards of conditional shares are made annually with vesting dependant on the achievement of performance conditions over three years.
Actual performance against the conditions will be independently verified and reported to the Committee.
QuantumThe Committee reviews the quantum of awards annually.
Performance shares200% of salary.
Share Matching Element100% of salary (Investment shares of up to one-third salary matched on a 3:1 basis).
Awards vest based on a three year performance against total shareholder return (33.3%), growth in the Group’s net assets per share (33.3%) and TPR (33.3%).
ProposedFrom 1 April 2014, it is proposed that the IPD measure of the Annual Bonus Plan compare the Company’s property portfolio performance to the IPD Central and Inner London March Valued Capital Growth Index as opposed to the Monthly and Quarterly Index which has been used to date.
+See Implementation report pages 119, 121 to 124
1. The performance conditions selected for the 2010 Plan are considered by the Committee to mirror the fundamental measures that demonstrate the Group’s performance of:
— growth in absolute net asset value per share;
— relative Total Property Return; and
— relative Total Shareholder Return.
Directors’ remuneration report
116 Great Portland Estates Annual Report 2013
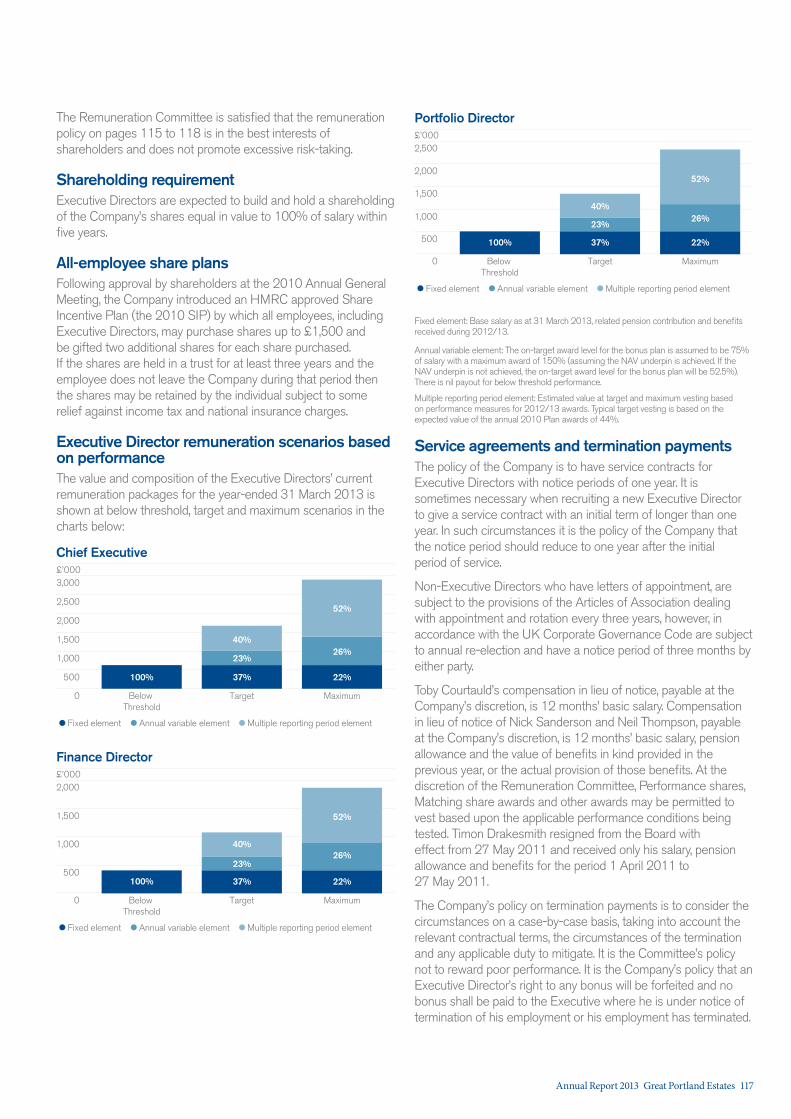
The Remuneration Committee is satisfied that the remuneration policy on pages 115 to 118 is in the best interests of shareholders and does not promote excessive risk-taking.
Shareholding requirementExecutive Directors are expected to build and hold a shareholding of the Company’s shares equal in value to 100% of salary within five years.
All-employee share plansFollowing approval by shareholders at the 2010 Annual General Meeting, the Company introduced an HMRC approved Share Incentive Plan (the 2010 SIP) by which all employees, including Executive Directors, may purchase shares up to £1,500 and be gifted two additional shares for each share purchased. If the shares are held in a trust for at least three years and the employee does not leave the Company during that period then the shares may be retained by the individual subject to some relief against income tax and national insurance charges.
Executive Director remuneration scenarios based on performanceThe value and composition of the Executive Directors’ current remuneration packages for the year-ended 31 March 2013 is shown at below threshold, target and maximum scenarios in the charts below:
0
1,500
500
1,000
Chief Executive
Below Threshold
Target Maximum
3,000
100% 37% 22%
2,000
2,500
23%26%
40%
52%
Fixed element Annual variable element Multiple reporting period element
£’000
0
2,000
1,000
1,500
500
Finance Director
Below Threshold
100%
Target
37%
23%
40%
Maximum
22%
26%
52%
Fixed element Annual variable element Multiple reporting period element
£’000
0
2,500
1,000
1,500
500
Portfolio Director
Below Threshold
Target Maximum
100%
2,000
37%
23%
40%
22%
26%
52%
Fixed element Annual variable element Multiple reporting period element
£’000
Fixed element: Base salary as at 31 March 2013, related pension contribution and benefits received during 2012/13.
Annual variable element: The on-target award level for the bonus plan is assumed to be 75% of salary with a maximum award of 150% (assuming the NAV underpin is achieved. If the NAV underpin is not achieved, the on-target award level for the bonus plan will be 52.5%).There is nil payout for below threshold performance.
Multiple reporting period element: Estimated value at target and maximum vesting based on performance measures for 2012/13 awards. Typical target vesting is based on the expected value of the annual 2010 Plan awards of 44%.
Service agreements and termination payments The policy of the Company is to have service contracts for Executive Directors with notice periods of one year. It is sometimes necessary when recruiting a new Executive Director to give a service contract with an initial term of longer than one year. In such circumstances it is the policy of the Company that the notice period should reduce to one year after the initial period of service.
Non-Executive Directors who have letters of appointment, are subject to the provisions of the Articles of Association dealing with appointment and rotation every three years, however, in accordance with the UK Corporate Governance Code are subject to annual re-election and have a notice period of three months by either party.
Toby Courtauld’s compensation in lieu of notice, payable at the Company’s discretion, is 12 months’ basic salary. Compensation in lieu of notice of Nick Sanderson and Neil Thompson, payable at the Company’s discretion, is 12 months’ basic salary, pension allowance and the value of benefits in kind provided in the previous year, or the actual provision of those benefits. At the discretion of the Remuneration Committee, Performance shares, Matching share awards and other awards may be permitted to vest based upon the applicable performance conditions being tested. Timon Drakesmith resigned from the Board with effect from 27 May 2011 and received only his salary, pension allowance and benefits for the period 1 April 2011 to 27 May 2011.
The Company’s policy on termination payments is to consider the circumstances on a case-by-case basis, taking into account the relevant contractual terms, the circumstances of the termination and any applicable duty to mitigate. It is the Committee’s policy not to reward poor performance. It is the Company’s policy that an Executive Director’s right to any bonus will be forfeited and no bonus shall be paid to the Executive where he is under notice of termination of his employment or his employment has terminated.
Annual Report 2013 Great Portland Estates 117
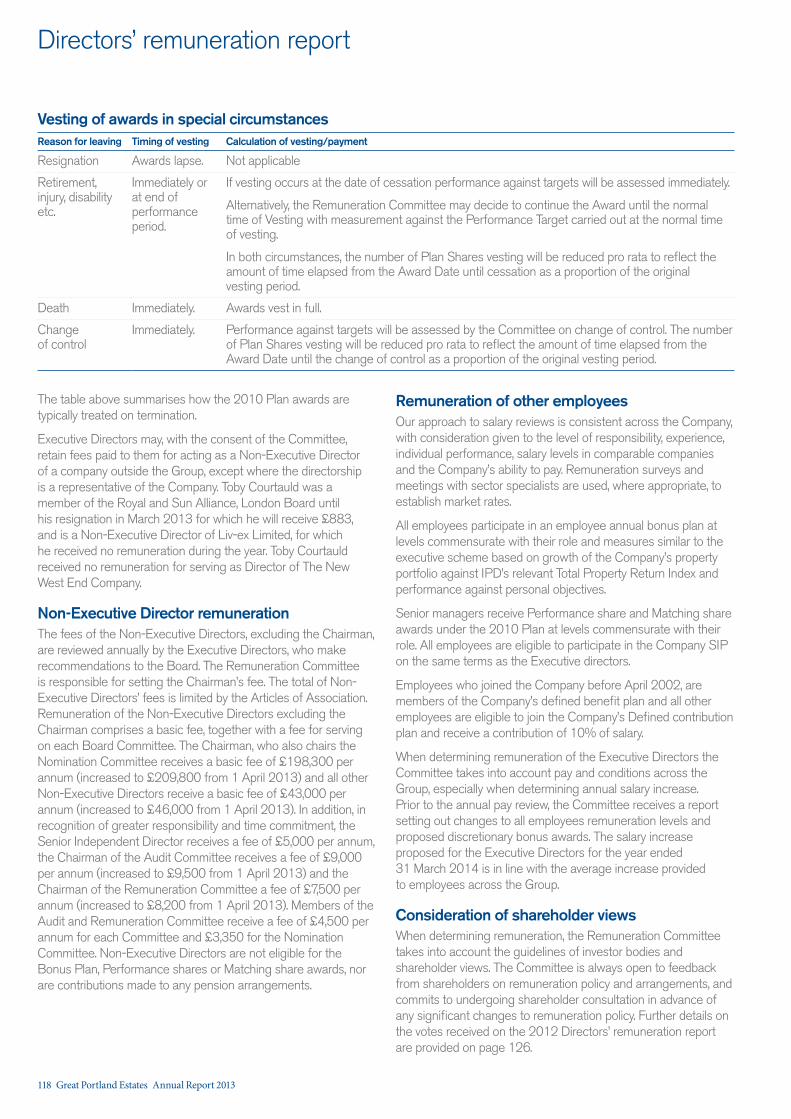
Directors’ remuneration report
The table above summarises how the 2010 Plan awards are typically treated on termination.
Executive Directors may, with the consent of the Committee, retain fees paid to them for acting as a Non-Executive Director of a company outside the Group, except where the directorship is a representative of the Company. Toby Courtauld was a member of the Royal and Sun Alliance, London Board until his resignation in March 2013 for which he will receive £883, and is a Non-Executive Director of Liv-ex Limited, for which he received no remuneration during the year. Toby Courtauld received no remuneration for serving as Director of The New West End Company.
Non-Executive Director remunerationThe fees of the Non-Executive Directors, excluding the Chairman, are reviewed annually by the Executive Directors, who make recommendations to the Board. The Remuneration Committee is responsible for setting the Chairman’s fee. The total of Non-Executive Directors’ fees is limited by the Articles of Association. Remuneration of the Non-Executive Directors excluding the Chairman comprises a basic fee, together with a fee for serving on each Board Committee. The Chairman, who also chairs the Nomination Committee receives a basic fee of £198,300 per annum (increased to £209,800 from 1 April 2013) and all other Non-Executive Directors receive a basic fee of £43,000 per annum (increased to £46,000 from 1 April 2013). In addition, in recognition of greater responsibility and time commitment, the Senior Independent Director receives a fee of £5,000 per annum, the Chairman of the Audit Committee receives a fee of £9,000 per annum (increased to £9,500 from 1 April 2013) and the Chairman of the Remuneration Committee a fee of £7,500 per annum (increased to £8,200 from 1 April 2013). Members of the Audit and Remuneration Committee receive a fee of £4,500 per annum for each Committee and £3,350 for the Nomination Committee. Non-Executive Directors are not eligible for the Bonus Plan, Performance shares or Matching share awards, nor are contributions made to any pension arrangements.
Remuneration of other employeesOur approach to salary reviews is consistent across the Company, with consideration given to the level of responsibility, experience, individual performance, salary levels in comparable companies and the Company’s ability to pay. Remuneration surveys and meetings with sector specialists are used, where appropriate, to establish market rates.
All employees participate in an employee annual bonus plan at levels commensurate with their role and measures similar to the executive scheme based on growth of the Company’s property portfolio against IPD’s relevant Total Property Return Index and performance against personal objectives.
Senior managers receive Performance share and Matching share awards under the 2010 Plan at levels commensurate with their role. All employees are eligible to participate in the Company SIP on the same terms as the Executive directors.
Employees who joined the Company before April 2002, are members of the Company’s defined benefit plan and all other employees are eligible to join the Company’s Defined contribution plan and receive a contribution of 10% of salary.
When determining remuneration of the Executive Directors the Committee takes into account pay and conditions across the Group, especially when determining annual salary increase. Prior to the annual pay review, the Committee receives a report setting out changes to all employees remuneration levels and proposed discretionary bonus awards. The salary increase proposed for the Executive Directors for the year ended 31 March 2014 is in line with the average increase provided to employees across the Group.
Consideration of shareholder viewsWhen determining remuneration, the Remuneration Committee takes into account the guidelines of investor bodies and shareholder views. The Committee is always open to feedback from shareholders on remuneration policy and arrangements, and commits to undergoing shareholder consultation in advance of any significant changes to remuneration policy. Further details on the votes received on the 2012 Directors’ remuneration report are provided on page 126.
Vesting of awards in special circumstancesReason for leaving Timing of vesting Calculation of vesting/payment
Resignation Awards lapse. Not applicable
Retirement, injury, disability etc.
Immediately or at end of performance period.
If vesting occurs at the date of cessation performance against targets will be assessed immediately.
Alternatively, the Remuneration Committee may decide to continue the Award until the normal time of Vesting with measurement against the Performance Target carried out at the normal time of vesting.
In both circumstances, the number of Plan Shares vesting will be reduced pro rata to reflect the amount of time elapsed from the Award Date until cessation as a proportion of the original vesting period.
Death Immediately. Awards vest in full.
Change of control
Immediately. Performance against targets will be assessed by the Committee on change of control. The number of Plan Shares vesting will be reduced pro rata to reflect the amount of time elapsed from the Award Date until the change of control as a proportion of the original vesting period.
118 Great Portland Estates Annual Report 2013
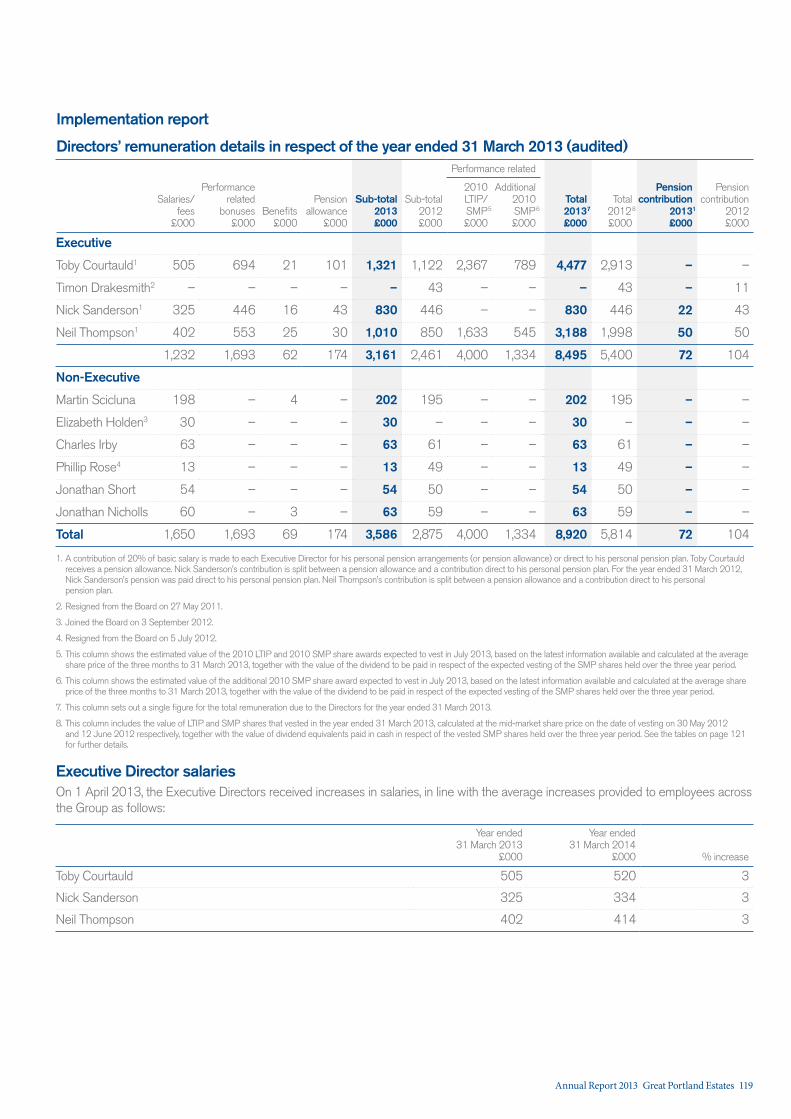
Implementation report
Directors’ remuneration details in respect of the year ended 31 March 2013 (audited)Performance related
Salaries/ fees
£000
Performance related
bonuses £000
Benefits £000
Pension allowance
£000
Sub-total 2013 £000
Sub-total 2012 £000
2010LTIP/SMP5 £000
Additional 2010SMP6
£000
Total 20137
£000
Total 20128 £000
Pension contribution
20131
£000
Pension contribution
2012 £000
Executive
Toby Courtauld1 505 694 21 101 1,321 1,122 2,367 789 4,477 2,913 – –
Timon Drakesmith2 – – – – – 43 – – – 43 – 11
Nick Sanderson1 325 446 16 43 830 446 – – 830 446 22 43
Neil Thompson1 402 553 25 30 1,010 850 1,633 545 3,188 1,998 50 50
1,232 1,693 62 174 3,161 2,461 4,000 1,334 8,495 5,400 72 104
Non-Executive
Martin Scicluna 198 – 4 – 202 195 – – 202 195 – –
Elizabeth Holden3 30 – – – 30 – – – 30 – – –
Charles Irby 63 – – – 63 61 – – 63 61 – –
Phillip Rose4 13 – – – 13 49 – – 13 49 – –
Jonathan Short 54 – – – 54 50 – – 54 50 – –
Jonathan Nicholls 60 – 3 – 63 59 – – 63 59 – –
Total 1,650 1,693 69 174 3,586 2,875 4,000 1,334 8,920 5,814 72 104
1. A contribution of 20% of basic salary is made to each Executive Director for his personal pension arrangements (or pension allowance) or direct to his personal pension plan. Toby Courtauld receives a pension allowance. Nick Sanderson’s contribution is split between a pension allowance and a contribution direct to his personal pension plan. For the year ended 31 March 2012, Nick Sanderson’s pension was paid direct to his personal pension plan. Neil Thompson’s contribution is split between a pension allowance and a contribution direct to his personal pension plan.
2. Resigned from the Board on 27 May 2011.
3. Joined the Board on 3 September 2012.
4. Resigned from the Board on 5 July 2012.
5. This column shows the estimated value of the 2010 LTIP and 2010 SMP share awards expected to vest in July 2013, based on the latest information available and calculated at the average share price of the three months to 31 March 2013, together with the value of the dividend to be paid in respect of the expected vesting of the SMP shares held over the three year period.
6. This column shows the estimated value of the additional 2010 SMP share award expected to vest in July 2013, based on the latest information available and calculated at the average share price of the three months to 31 March 2013, together with the value of the dividend to be paid in respect of the expected vesting of the SMP shares held over the three year period.
7. This column sets out a single figure for the total remuneration due to the Directors for the year ended 31 March 2013.
8. This column includes the value of LTIP and SMP shares that vested in the year ended 31 March 2013, calculated at the mid-market share price on the date of vesting on 30 May 2012 and 12 June 2012 respectively, together with the value of dividend equivalents paid in cash in respect of the vested SMP shares held over the three year period. See the tables on page 121 for further details.
Executive Director salariesOn 1 April 2013, the Executive Directors received increases in salaries, in line with the average increases provided to employees across the Group as follows:
Year ended 31 March 2013
£000
Year ended 31 March 2014
£000 % increase
Toby Courtauld 505 520 3
Nick Sanderson 325 334 3
Neil Thompson 402 414 3
Annual Report 2013 Great Portland Estates 119
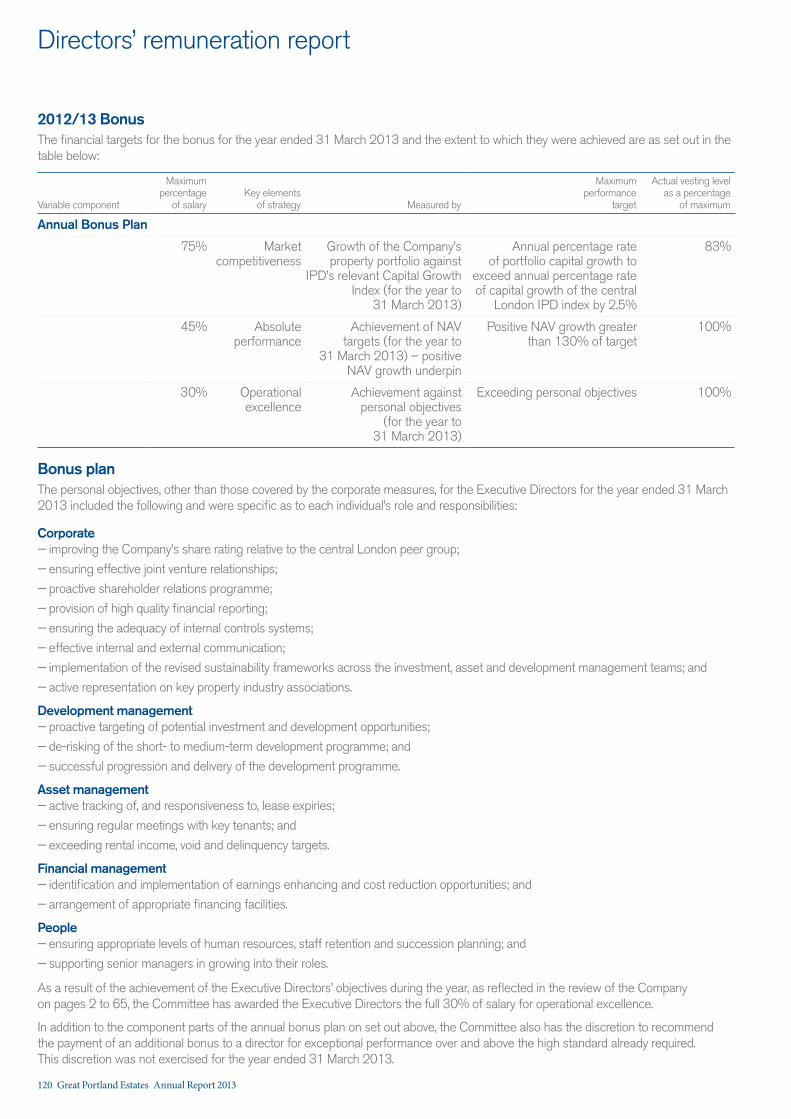
Directors’ remuneration report
2012/13 Bonus The financial targets for the bonus for the year ended 31 March 2013 and the extent to which they were achieved are as set out in the table below:
Variable component
Maximum percentage
of salaryKey elements
of strategy Measured by
Maximum performance
target
Actual vesting level as a percentage
of maximum
Annual Bonus Plan
75% Market competitiveness
Growth of the Company’s property portfolio against
IPD’s relevant Capital Growth Index (for the year to
31 March 2013)
Annual percentage rate of portfolio capital growth to
exceed annual percentage rate of capital growth of the central
London IPD index by 2.5%
83%
45% Absolute performance
Achievement of NAV targets (for the year to
31 March 2013) – positive NAV growth underpin
Positive NAV growth greater than 130% of target
100%
30% Operational excellence
Achievement against personal objectives
(for the year to 31 March 2013)
Exceeding personal objectives 100%
Bonus planThe personal objectives, other than those covered by the corporate measures, for the Executive Directors for the year ended 31 March 2013 included the following and were specific as to each individual’s role and responsibilities:
Corporate — improving the Company’s share rating relative to the central London peer group;
— ensuring effective joint venture relationships;
— proactive shareholder relations programme;
— provision of high quality financial reporting;
— ensuring the adequacy of internal controls systems;
— effective internal and external communication;
— implementation of the revised sustainability frameworks across the investment, asset and development management teams; and
— active representation on key property industry associations.
Development management — proactive targeting of potential investment and development opportunities;
— de-risking of the short- to medium-term development programme; and
— successful progression and delivery of the development programme.
Asset management — active tracking of, and responsiveness to, lease expiries;
— ensuring regular meetings with key tenants; and
— exceeding rental income, void and delinquency targets.
Financial management — identification and implementation of earnings enhancing and cost reduction opportunities; and
— arrangement of appropriate financing facilities.
People — ensuring appropriate levels of human resources, staff retention and succession planning; and
— supporting senior managers in growing into their roles.
As a result of the achievement of the Executive Directors’ objectives during the year, as reflected in the review of the Company on pages 2 to 65, the Committee has awarded the Executive Directors the full 30% of salary for operational excellence.
In addition to the component parts of the annual bonus plan on set out above, the Committee also has the discretion to recommend the payment of an additional bonus to a director for exceptional performance over and above the high standard already required. This discretion was not exercised for the year ended 31 March 2013.
120 Great Portland Estates Annual Report 2013
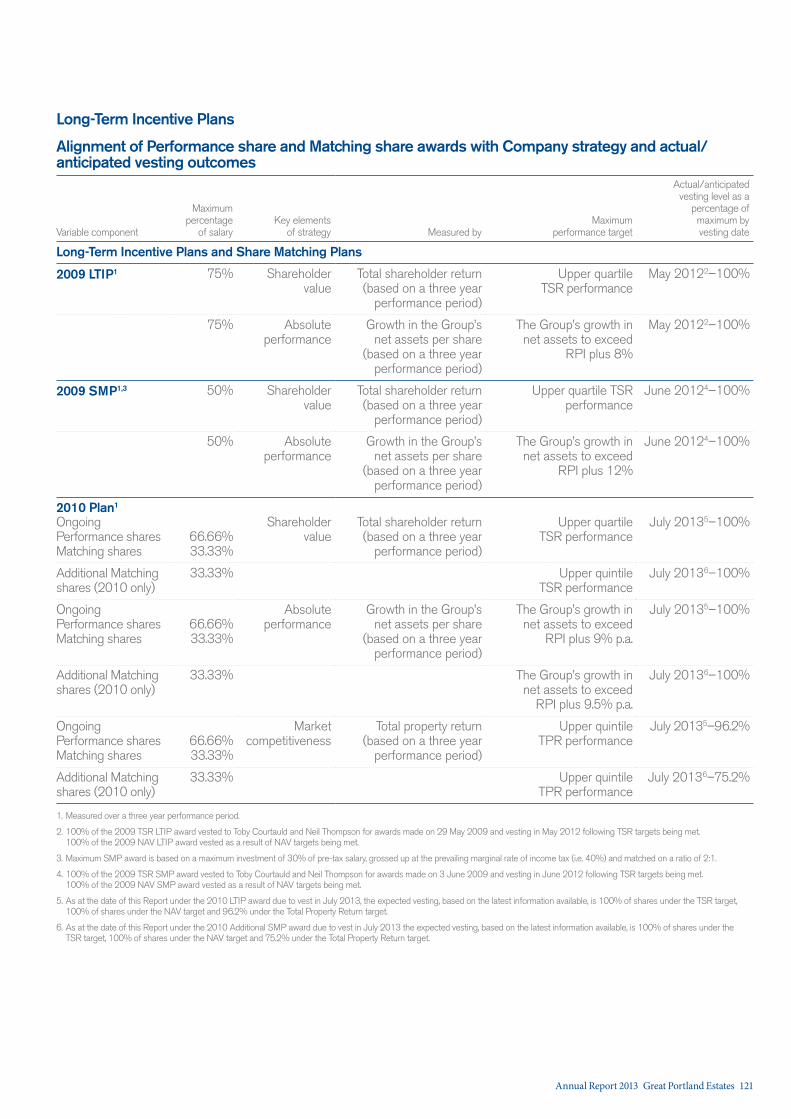
Long-Term Incentive Plans
Alignment of Performance share and Matching share awards with Company strategy and actual/anticipated vesting outcomes
Variable component
Maximum percentage
of salaryKey elements
of strategy Measured byMaximum
performance target
Actual/anticipated vesting level as a
percentage of maximum by vesting date
Long-Term Incentive Plans and Share Matching Plans
2009 LTIP1 75% Shareholder value
Total shareholder return (based on a three year
performance period)
Upper quartile TSR performance
May 20122–100%
75% Absolute performance
Growth in the Group’s net assets per share
(based on a three year performance period)
The Group’s growth in net assets to exceed
RPI plus 8%
May 20122–100%
2009 SMP1,3 50% Shareholder value
Total shareholder return (based on a three year
performance period)
Upper quartile TSR performance
June 20124–100%
50% Absolute performance
Growth in the Group’s net assets per share
(based on a three year performance period)
The Group’s growth in net assets to exceed
RPI plus 12%
June 20124–100%
2010 Plan1
Ongoing Performance shares Matching shares
66.66% 33.33%
Shareholder value
Total shareholder return (based on a three year
performance period)
Upper quartile TSR performance
July 20135–100%
Additional Matching shares (2010 only)
33.33% Upper quintile TSR performance
July 20136–100%
Ongoing Performance shares Matching shares
66.66% 33.33%
Absolute performance
Growth in the Group’s net assets per share
(based on a three year performance period)
The Group’s growth in net assets to exceed
RPI plus 9% p.a.
July 20135–100%
Additional Matching shares (2010 only)
33.33% The Group’s growth in net assets to exceed
RPI plus 9.5% p.a.
July 20136–100%
Ongoing Performance shares Matching shares
66.66% 33.33%
Market competitiveness
Total property return (based on a three year
performance period)
Upper quintile TPR performance
July 20135–96.2%
Additional Matching shares (2010 only)
33.33% Upper quintile TPR performance
July 20136–75.2%
1. Measured over a three year performance period.
2. 100% of the 2009 TSR LTIP award vested to Toby Courtauld and Neil Thompson for awards made on 29 May 2009 and vesting in May 2012 following TSR targets being met. 100% of the 2009 NAV LTIP award vested as a result of NAV targets being met.
3. Maximum SMP award is based on a maximum investment of 30% of pre-tax salary, grossed up at the prevailing marginal rate of income tax (i.e. 40%) and matched on a ratio of 2:1.
4. 100% of the 2009 TSR SMP award vested to Toby Courtauld and Neil Thompson for awards made on 3 June 2009 and vesting in June 2012 following TSR targets being met. 100% of the 2009 NAV SMP award vested as a result of NAV targets being met.
5. As at the date of this Report under the 2010 LTIP award due to vest in July 2013, the expected vesting, based on the latest information available, is 100% of shares under the TSR target, 100% of shares under the NAV target and 96.2% under the Total Property Return target.
6. As at the date of this Report under the 2010 Additional SMP award due to vest in July 2013 the expected vesting, based on the latest information available, is 100% of shares under the TSR target, 100% of shares under the NAV target and 75.2% under the Total Property Return target.
Annual Report 2013 Great Portland Estates 121
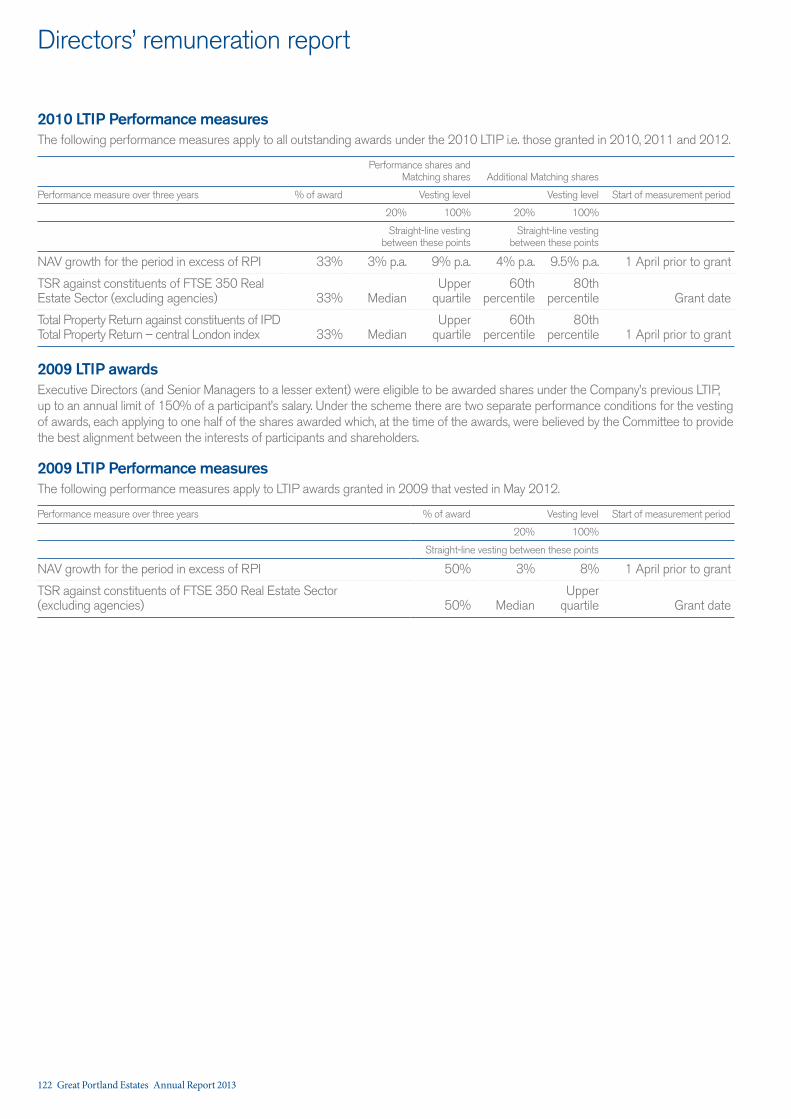
Directors’ remuneration report
2010 LTIP Performance measuresThe following performance measures apply to all outstanding awards under the 2010 LTIP i.e. those granted in 2010, 2011 and 2012.
Performance shares and Matching shares Additional Matching shares
Performance measure over three years % of award Vesting level Vesting level Start of measurement period
20% 100% 20% 100%
Straight-line vesting between these points
Straight-line vesting between these points
NAV growth for the period in excess of RPI 33% 3% p.a. 9% p.a. 4% p.a. 9.5% p.a. 1 April prior to grant
TSR against constituents of FTSE 350 Real Estate Sector (excluding agencies) 33% Median
Upper quartile
60th percentile
80th percentile Grant date
Total Property Return against constituents of IPD Total Property Return – central London index 33% Median
Upper quartile
60th percentile
80th percentile 1 April prior to grant
2009 LTIP awardsExecutive Directors (and Senior Managers to a lesser extent) were eligible to be awarded shares under the Company’s previous LTIP, up to an annual limit of 150% of a participant’s salary. Under the scheme there are two separate performance conditions for the vesting of awards, each applying to one half of the shares awarded which, at the time of the awards, were believed by the Committee to provide the best alignment between the interests of participants and shareholders.
2009 LTIP Performance measuresThe following performance measures apply to LTIP awards granted in 2009 that vested in May 2012.
Performance measure over three years % of award Vesting level Start of measurement period
20% 100%
Straight-line vesting between these points
NAV growth for the period in excess of RPI 50% 3% 8% 1 April prior to grant
TSR against constituents of FTSE 350 Real Estate Sector (excluding agencies) 50% Median
Upper quartile Grant date
122 Great Portland Estates Annual Report 2013
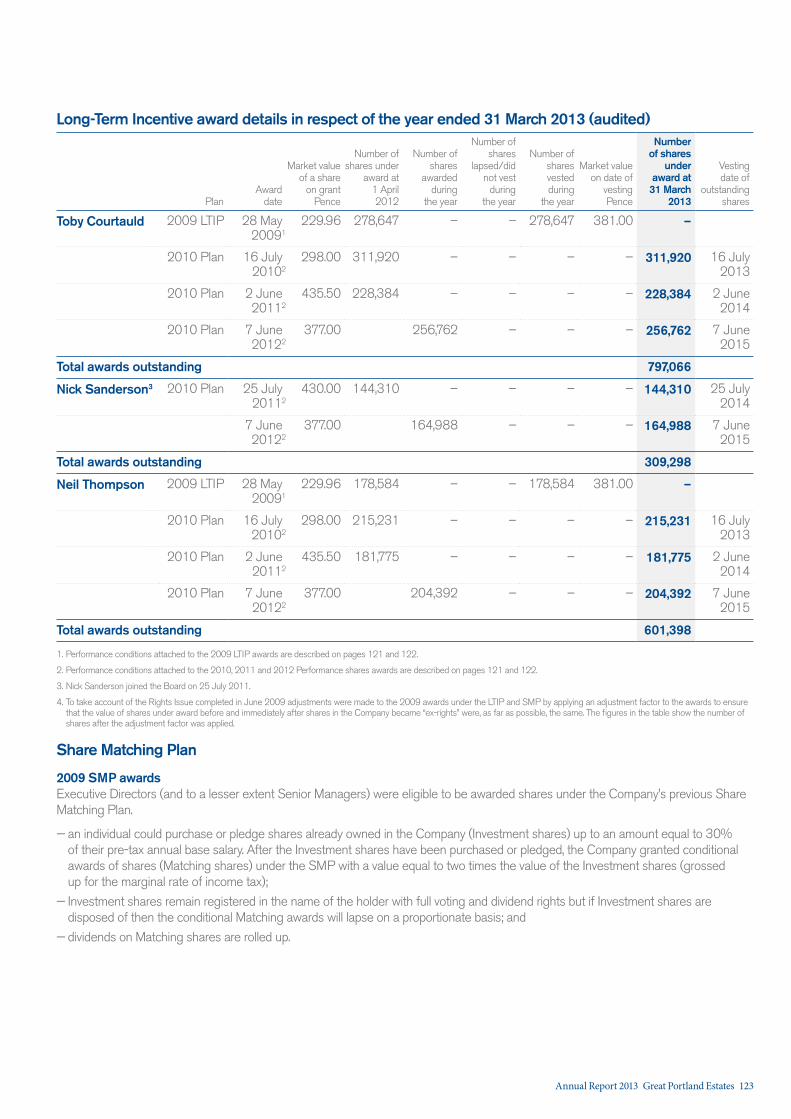
Long-Term Incentive award details in respect of the year ended 31 March 2013 (audited)
PlanAward
date
Market value of a share
on grant Pence
Number of shares under
award at 1 April 2012
Number of shares
awarded during
the year
Number of shares
lapsed/did not vest
during the year
Number of shares vested during
the year
Market value on date of
vesting Pence
Number of shares
under award at
31 March 2013
Vesting date of
outstanding shares
Toby Courtauld 2009 LTIP 28 May20091
229.96 278,647 – – 278,647 381.00 –
2010 Plan 16 July20102
298.00 311,920 – – – – 311,920 16 July 2013
2010 Plan 2 June 20112
435.50 228,384 – – – – 228,384 2 June 2014
2010 Plan 7 June 20122
377.00 256,762 – – – 256,762 7 June 2015
Total awards outstanding 797,066
Nick Sanderson3 2010 Plan 25 July 20112
430.00 144,310 – – – – 144,310 25 July 2014
7 June 20122
377.00 164,988 – – – 164,988 7 June 2015
Total awards outstanding 309,298
Neil Thompson 2009 LTIP 28 May 20091
229.96 178,584 – – 178,584 381.00 –
2010 Plan 16 July 20102
298.00 215,231 – – – – 215,231 16 July 2013
2010 Plan 2 June 20112
435.50 181,775 – – – – 181,775 2 June 2014
2010 Plan 7 June 20122
377.00 204,392 – – – 204,392 7 June 2015
Total awards outstanding 601,398
1. Performance conditions attached to the 2009 LTIP awards are described on pages 121 and 122.
2. Performance conditions attached to the 2010, 2011 and 2012 Performance shares awards are described on pages 121 and 122.
3. Nick Sanderson joined the Board on 25 July 2011.
4. To take account of the Rights Issue completed in June 2009 adjustments were made to the 2009 awards under the LTIP and SMP by applying an adjustment factor to the awards to ensure that the value of shares under award before and immediately after shares in the Company became “ex-rights” were, as far as possible, the same. The figures in the table show the number of shares after the adjustment factor was applied.
Share Matching Plan
2009 SMP awardsExecutive Directors (and to a lesser extent Senior Managers) were eligible to be awarded shares under the Company’s previous Share Matching Plan.
— an individual could purchase or pledge shares already owned in the Company (Investment shares) up to an amount equal to 30% of their pre-tax annual base salary. After the Investment shares have been purchased or pledged, the Company granted conditional awards of shares (Matching shares) under the SMP with a value equal to two times the value of the Investment shares (grossed up for the marginal rate of income tax);
— Investment shares remain registered in the name of the holder with full voting and dividend rights but if Investment shares are disposed of then the conditional Matching awards will lapse on a proportionate basis; and
— dividends on Matching shares are rolled up.
Annual Report 2013 Great Portland Estates 123
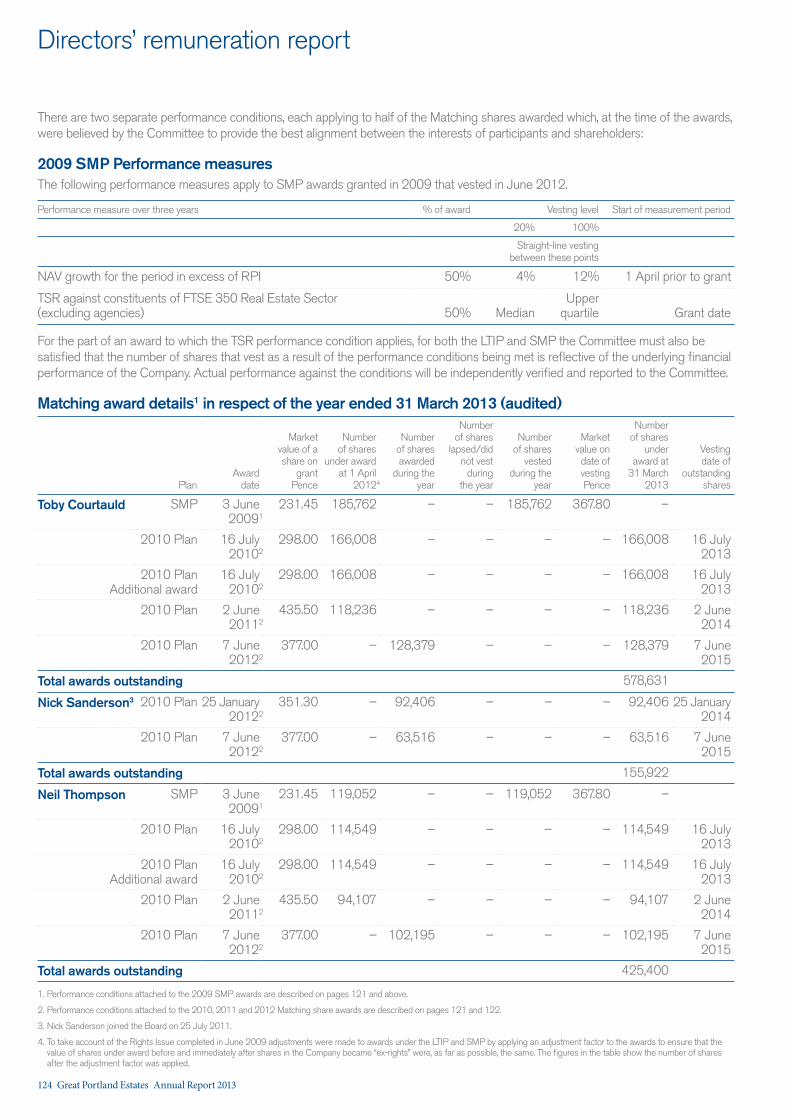
Directors’ remuneration report
There are two separate performance conditions, each applying to half of the Matching shares awarded which, at the time of the awards, were believed by the Committee to provide the best alignment between the interests of participants and shareholders:
2009 SMP Performance measuresThe following performance measures apply to SMP awards granted in 2009 that vested in June 2012.
Performance measure over three years % of award Vesting level Start of measurement period
20% 100%
Straight-line vesting between these points
NAV growth for the period in excess of RPI 50% 4% 12% 1 April prior to grant
TSR against constituents of FTSE 350 Real Estate Sector (excluding agencies) 50% Median
Upper quartile Grant date
For the part of an award to which the TSR performance condition applies, for both the LTIP and SMP the Committee must also be satisfied that the number of shares that vest as a result of the performance conditions being met is reflective of the underlying financial performance of the Company. Actual performance against the conditions will be independently verified and reported to the Committee.
Matching award details1 in respect of the year ended 31 March 2013 (audited)
PlanAward
date
Market value of a share on
grant Pence
Number of shares
under award at 1 April
20124
Number of shares awarded
during the year
Number of shares
lapsed/did not vest
during the year
Number of shares
vested during the
year
Market value on date of vesting Pence
Number of shares
under award at
31 March 2013
Vesting date of
outstanding shares
Toby Courtauld SMP 3 June 20091
231.45 185,762 – – 185,762 367.80 –
2010 Plan 16 July20102
298.00 166,008 – – – – 166,008 16 July 2013
2010 Plan Additional award
16 July20102
298.00 166,008 – – – – 166,008 16 July 2013
2010 Plan 2 June 20112
435.50 118,236 – – – – 118,236 2 June 2014
2010 Plan 7 June 20122
377.00 – 128,379 – – – 128,379 7 June 2015
Total awards outstanding 578,631
Nick Sanderson3 2010 Plan 25 January20122
351.30 – 92,406 – – – 92,406 25 January 2014
2010 Plan 7 June 20122
377.00 – 63,516 – – – 63,516 7 June 2015
Total awards outstanding 155,922
Neil Thompson SMP 3 June 20091
231.45 119,052 – – 119,052 367.80 –
2010 Plan 16 July 20102
298.00 114,549 – – – – 114,549 16 July 2013
2010 Plan Additional award
16 July 20102
298.00 114,549 – – – – 114,549 16 July 2013
2010 Plan 2 June 20112
435.50 94,107 – – – – 94,107 2 June 2014
2010 Plan 7 June 20122
377.00 – 102,195 – – – 102,195 7 June 2015
Total awards outstanding 425,400
1. Performance conditions attached to the 2009 SMP awards are described on pages 121 and above.
2. Performance conditions attached to the 2010, 2011 and 2012 Matching share awards are described on pages 121 and 122.
3. Nick Sanderson joined the Board on 25 July 2011.
4. To take account of the Rights Issue completed in June 2009 adjustments were made to awards under the LTIP and SMP by applying an adjustment factor to the awards to ensure that the value of shares under award before and immediately after shares in the Company became “ex-rights” were, as far as possible, the same. The figures in the table show the number of shares after the adjustment factor was applied.
124 Great Portland Estates Annual Report 2013
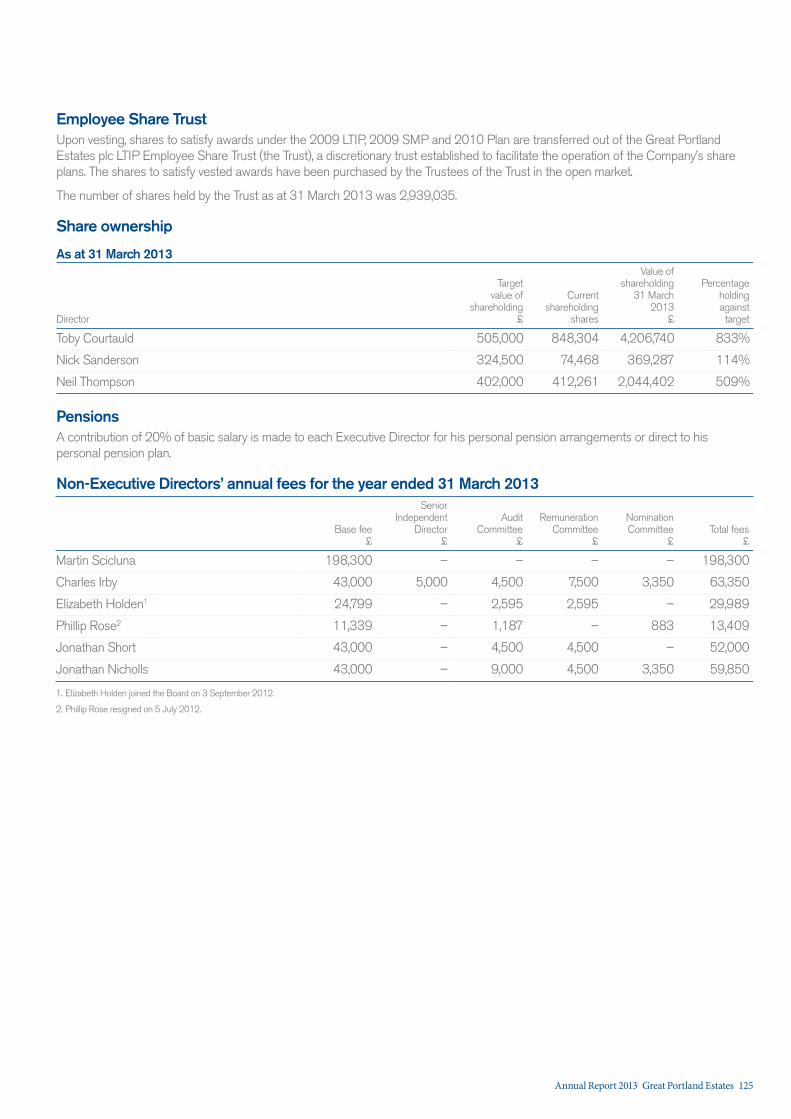
Employee Share TrustUpon vesting, shares to satisfy awards under the 2009 LTIP, 2009 SMP and 2010 Plan are transferred out of the Great Portland Estates plc LTIP Employee Share Trust (the Trust), a discretionary trust established to facilitate the operation of the Company’s share plans. The shares to satisfy vested awards have been purchased by the Trustees of the Trust in the open market.
The number of shares held by the Trust as at 31 March 2013 was 2,939,035.
Share ownership
As at 31 March 2013
Director
Target value of
shareholding £
Current shareholding
shares
Value of shareholding
31 March 2013
£
Percentage holding against target
Toby Courtauld 505,000 848,304 4,206,740 833%
Nick Sanderson 324,500 74,468 369,287 114%
Neil Thompson 402,000 412,261 2,044,402 509%
PensionsA contribution of 20% of basic salary is made to each Executive Director for his personal pension arrangements or direct to his personal pension plan.
Non-Executive Directors’ annual fees for the year ended 31 March 2013
Base fee £
Senior Independent
Director £
Audit Committee
£
Remuneration Committee
£
Nomination Committee
£Total fees
£
Martin Scicluna 198,300 – – – – 198,300
Charles Irby 43,000 5,000 4,500 7,500 3,350 63,350
Elizabeth Holden1 24,799 – 2,595 2,595 – 29,989
Phillip Rose2 11,339 – 1,187 – 883 13,409
Jonathan Short 43,000 – 4,500 4,500 – 52,000
Jonathan Nicholls 43,000 – 9,000 4,500 3,350 59,850
1. Elizabeth Holden joined the Board on 3 September 2012.
2. Phillip Rose resigned on 5 July 2012.
Annual Report 2013 Great Portland Estates 125
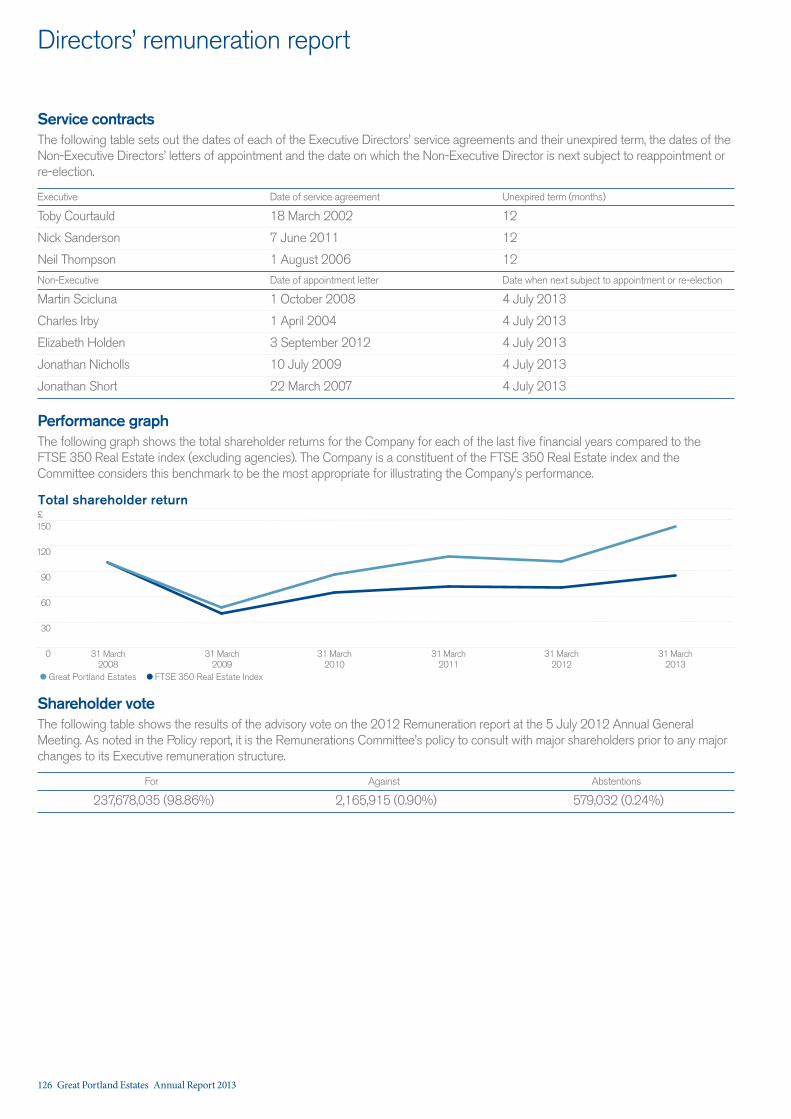
Directors’ remuneration report
Service contractsThe following table sets out the dates of each of the Executive Directors’ service agreements and their unexpired term, the dates of the Non-Executive Directors’ letters of appointment and the date on which the Non-Executive Director is next subject to reappointment or re-election.
Executive Date of service agreement Unexpired term (months)
Toby Courtauld 18 March 2002 12
Nick Sanderson 7 June 2011 12
Neil Thompson 1 August 2006 12
Non-Executive Date of appointment letter Date when next subject to appointment or re-election
Martin Scicluna 1 October 2008 4 July 2013
Charles Irby 1 April 2004 4 July 2013
Elizabeth Holden 3 September 2012 4 July 2013
Jonathan Nicholls 10 July 2009 4 July 2013
Jonathan Short 22 March 2007 4 July 2013
Performance graphThe following graph shows the total shareholder returns for the Company for each of the last five financial years compared to the FTSE 350 Real Estate index (excluding agencies). The Company is a constituent of the FTSE 350 Real Estate index and the Committee considers this benchmark to be the most appropriate for illustrating the Company’s performance.
Total shareholder return
150
120
90
60
30
0 31 March2008
31 March2009
31 March2010
31 March2011
31 March2012
31 March2013
Great Portland Estates FTSE 350 Real Estate Index
£
Shareholder voteThe following table shows the results of the advisory vote on the 2012 Remuneration report at the 5 July 2012 Annual General Meeting. As noted in the Policy report, it is the Remunerations Committee’s policy to consult with major shareholders prior to any major changes to its Executive remuneration structure.
For Against Abstentions
237,678,035 (98.86%) 2,165,915 (0.90%) 579,032 (0.24%)
126 Great Portland Estates Annual Report 2013
Remuneration Committee and AdvisersDuring the year the Remuneration Committee comprised of the independent Non-Executive Directors Charles Irby, Jonathan Nicholls and Jonathan Short. Elizabeth Holden joined the Committee on her appointment to the Board on 3 September 2012.
The Committee was advised during the year by PwC as independent remuneration consultants who were appointed by the Committee in 2009. PwC attends Committee meetings and provides advice on remuneration for the Executive Directors, analysis on all elements of the remuneration policy and regular market and best practice updates. PwC reports directly to the Committee and complies with the Code of Conduct for Remuneration Consultants (which can be found at www.remunerationcounsultantsgroup.com). PwC also act as the Group’s tax adviser and in 2012 provided advice on the Group’s Business Continuity Plan and the winding up of a number of the Group’s dormant companies. PwC’s fees for the year to 31 March 2013 were £55,800 in relation to remuneration matters.
During the year the Committee was also advised by New Bridge Street, a firm of independent remuneration consultants, who provided advice to the Committee in respect of vesting of the Total Shareholder Return element of the LTIP and SMP awards and Investment Property Databank (IPD) who provide measurement against its property benchmark, with both companies being appointed by the Committee in respect of these roles.
Toby Courtauld, the Chief Executive, provided input with regard to the discretionary bonuses for the other Executive Directors.
Remuneration reportIn preparing this Remuneration report, the Committee has followed the requirements of the UK Corporate Governance Code, the Companies Act 2006, schedule 8 of the Large and Medium sized Companies and Groups (Accounts and Reports) Regulation 2008, and the Listing Rules of the Financial Conduct Authority. The Committee has considered the draft of the new remuneration report regulations published by the Department of Business, Innovation and Skills in June 2012. This report includes, where appropriate, some of the new disclosures expected to be required once the new regulations become effective, and which will be reflected in the remuneration report published in 2014.
This report will be submitted to shareholders for approval at the Annual General Meeting to be held on 4 July 2013.
Approved by the Board on 22 May 2013 and signed on its behalf by
Charles Irby Chairman of the Remuneration Committee
Annual Report 2013 Great Portland Estates 127
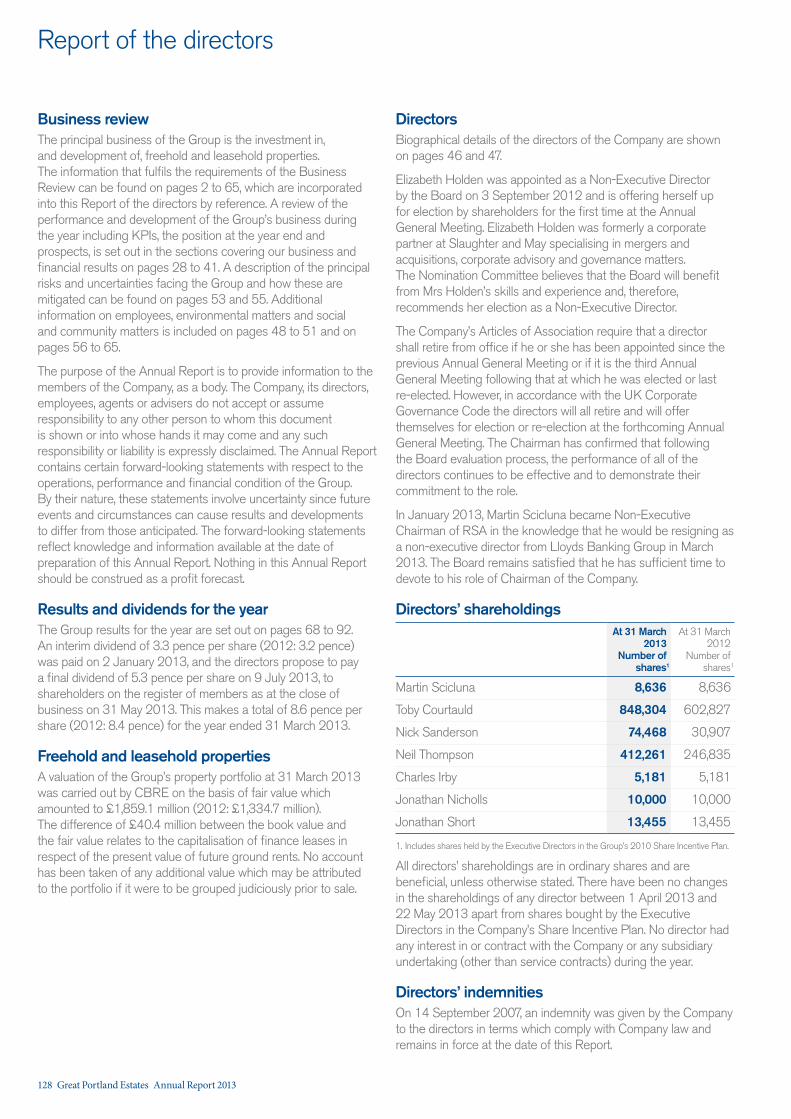
Report of the directors
Business reviewThe principal business of the Group is the investment in, and development of, freehold and leasehold properties. The information that fulfils the requirements of the Business Review can be found on pages 2 to 65, which are incorporated into this Report of the directors by reference. A review of the performance and development of the Group’s business during the year including KPIs, the position at the year end and prospects, is set out in the sections covering our business and financial results on pages 28 to 41. A description of the principal risks and uncertainties facing the Group and how these are mitigated can be found on pages 53 and 55. Additional information on employees, environmental matters and social and community matters is included on pages 48 to 51 and on pages 56 to 65.
The purpose of the Annual Report is to provide information to the members of the Company, as a body. The Company, its directors, employees, agents or advisers do not accept or assume responsibility to any other person to whom this document is shown or into whose hands it may come and any such responsibility or liability is expressly disclaimed. The Annual Report contains certain forward-looking statements with respect to the operations, performance and financial condition of the Group. By their nature, these statements involve uncertainty since future events and circumstances can cause results and developments to differ from those anticipated. The forward-looking statements reflect knowledge and information available at the date of preparation of this Annual Report. Nothing in this Annual Report should be construed as a profit forecast.
Results and dividends for the yearThe Group results for the year are set out on pages 68 to 92. An interim dividend of 3.3 pence per share (2012: 3.2 pence) was paid on 2 January 2013, and the directors propose to pay a final dividend of 5.3 pence per share on 9 July 2013, to shareholders on the register of members as at the close of business on 31 May 2013. This makes a total of 8.6 pence per share (2012: 8.4 pence) for the year ended 31 March 2013.
Freehold and leasehold propertiesA valuation of the Group’s property portfolio at 31 March 2013 was carried out by CBRE on the basis of fair value which amounted to £1,859.1 million (2012: £1,334.7 million). The difference of £40.4 million between the book value and the fair value relates to the capitalisation of finance leases in respect of the present value of future ground rents. No account has been taken of any additional value which may be attributed to the portfolio if it were to be grouped judiciously prior to sale.
DirectorsBiographical details of the directors of the Company are shown on pages 46 and 47.
Elizabeth Holden was appointed as a Non-Executive Director by the Board on 3 September 2012 and is offering herself up for election by shareholders for the first time at the Annual General Meeting. Elizabeth Holden was formerly a corporate partner at Slaughter and May specialising in mergers and acquisitions, corporate advisory and governance matters. The Nomination Committee believes that the Board will benefit from Mrs Holden’s skills and experience and, therefore, recommends her election as a Non-Executive Director.
The Company’s Articles of Association require that a director shall retire from office if he or she has been appointed since the previous Annual General Meeting or if it is the third Annual General Meeting following that at which he was elected or last re-elected. However, in accordance with the UK Corporate Governance Code the directors will all retire and will offer themselves for election or re-election at the forthcoming Annual General Meeting. The Chairman has confirmed that following the Board evaluation process, the performance of all of the directors continues to be effective and to demonstrate their commitment to the role.
In January 2013, Martin Scicluna became Non-Executive Chairman of RSA in the knowledge that he would be resigning as a non-executive director from Lloyds Banking Group in March 2013. The Board remains satisfied that he has sufficient time to devote to his role of Chairman of the Company.
Directors’ shareholdingsAt 31 March
2013 Number of
shares1
At 31 March 2012
Number of shares1
Martin Scicluna 8,636 8,636
Toby Courtauld 848,304 602,827
Nick Sanderson 74,468 30,907
Neil Thompson 412,261 246,835
Charles Irby 5,181 5,181
Jonathan Nicholls 10,000 10,000
Jonathan Short 13,455 13,455
1. Includes shares held by the Executive Directors in the Group’s 2010 Share Incentive Plan.
All directors’ shareholdings are in ordinary shares and are beneficial, unless otherwise stated. There have been no changes in the shareholdings of any director between 1 April 2013 and 22 May 2013 apart from shares bought by the Executive Directors in the Company’s Share Incentive Plan. No director had any interest in or contract with the Company or any subsidiary undertaking (other than service contracts) during the year.
Directors’ indemnitiesOn 14 September 2007, an indemnity was given by the Company to the directors in terms which comply with Company law and remains in force at the date of this Report.
128 Great Portland Estates Annual Report 2013
Corporate governance statementThe information fulfilling the requirements of the Corporate Governance Statement can be found in this Report of the directors and on pages 100 to 112, which are incorporated into this Report of the directors by reference.
Significant shareholdingsAs at 13 May 2013, the Company had been notified of the following beneficial or discretionary interests amounting to 3% or more of the voting rights of the issued share capital:
Number of shares %
Norges Bank Investment Management 30,637,673 8.91
BlackRock, Inc 27,967,011 8.13
Ell Capital Manegement Inc 20,777,071 6.04
Legal & General Investment Management Limited 12,322,508 3.58
Standard Life Investments Limited 11,738,557 3.41
Scottish Widows Investment Partnership 10,661,321 3.09
Share capital and controlOn 31 March 2013, there were 343,926,149 ordinary shares of 12.5 pence in issue. There are no restrictions on transfer or limitations on the holding of the ordinary shares. None of the shares carries any special rights with regard to the control of the Company. There are no known arrangements under which financial rights are held by a person other than the holder of the shares and no known agreements on restrictions on share transfers and voting rights.
The Great Portland Estates plc LTIP Employee Share Trust (the Trust) is an employees’ share scheme which holds ordinary shares in the Company on trust for the benefit of employees within the Group. The Trustee of the Trust has the power to exercise all the rights and powers (including rights with regard to control of the Company) incidental to, and to generally act in relation to, the ordinary shares subject to the Trust in such manner as the Trustee in its absolute discretion thinks fit as if it were absolutely entitled to those ordinary shares.
As far as the Company is aware, there are no persons with significant direct or indirect holdings in the Company other than those noted above.
The powers of the directors are contained in the Company’s Articles. These include powers, subject to relevant legislation, to authorise the issue and buy-back of the Company’s shares by the Company, subject to authority being given to the directors by the shareholders in a general meeting.
The rules about the appointment and replacement of directors are contained in the Company’s Articles of Association. Changes to the Articles of Association must be approved by the shareholders in accordance with legislation in force from time to time.
Change of controlThe Company has a number of unsecured borrowing facilities provided by various lenders. These facilities generally include provisions that may require any outstanding borrowings to be repaid or the alteration or termination of the facilities upon the occurrence of a change of control of the Company.
The Company’s 2010 LTIP contains provisions relating to the vesting of awards in the event of a change of control.
Financial instrumentsDetails of the financial instruments used by the Group are set out in notes 1 and 17 forming part of the Group financial statements on page 74 and pages 85 to 88, which are incorporated into this Report of the directors by reference. The Group’s financial risk management objectives and policies are included in the Risk management overview on pages 54 and 55, in Financial management on pages 36 and 37 and in Our financial results on pages 39 to 41.
Creditor payment policyIt is the Company’s policy that suppliers be paid in accordance with those terms and conditions agreed between the Company and the supplier, provided that all trading terms and conditions have been complied with and we have signed up to the UK Government’s Prompt Payment Code. For the year ended 31 March 2013, the average payment period for trade creditors was 28 days (2012: 28 days).
Essential contractsThe Company has no contractual or other arrangements which are considered essential to the business.
Charitable and other donationsCharitable donations for the year supporting organisations involved in health, the homeless and the community amounted to £48,804 (2012: £52,339); no contributions for political purposes were made.
Going concernThe Group’s business activities, together with the factors affecting its performance, position and future development are set out in the Annual review on pages 2 to 65. Details of the finances of the Group, including its strong liquidity position, attractively priced borrowing facilities and favourable debt maturity profile are set out in Our financial results on pages 39 to 41 and in notes 16 and 17 of the accounts on pages 84 to 88.
The directors have reviewed the current and projected financial position of the Group, making reasonable assumptions about future trading performance. As part of the review the Group has considered the Group’s cash balances, its debt maturity profile, including undrawn facilities, and the long-term nature of tenant leases. On the basis of this review, and after making due enquiries, the directors have a reasonable expectation that the Company and the Group have adequate resources to continue in operational existence for the foreseeable future. Accordingly, they continue to adopt the going concern basis in preparing the Annual Report and Accounts.
Annual Report 2013 Great Portland Estates 129
ordinary shares referred to in paragraph (a)(i) of Resolution 14, further of the Company’s ordinary shares in connection with a pre-emptive offer by way of a Rights Issue to ordinary shareholders up to a maximum nominal amount of £28,660,512, representing approximately two-thirds (66.6%) of the Company’s existing issued share capital and calculated as at 21 May 2013 (being the latest practicable date prior to publication of this Report). The directors have no present intention of exercising this authority. However, if they do exercise the authority, the directors intend to follow best practice as regards its use as recommended by the ABI.
Resolution 14 will be proposed as an ordinary resolution to renew this authority until the conclusion of the next AGM or, if earlier, the close of business on 1 October 2014.
Disapplication of pre-emption rightsAlso at last year’s meeting, a special resolution was passed, under sections 570 and 573 of the Companies Act 2006, empowering the directors to allot equity securities for cash without first being required to offer such shares to existing shareholders. Resolution 15 will seek to renew this authority. If approved, the resolution will authorise directors in accordance with the Articles of Association to issue shares in connection with a rights issue or other pre-emptive offer and otherwise to issue shares for cash up to a maximum nominal amount of £2,149,538 which includes the sale for cash on a non pre-emptive basis of any shares held in treasury. The maximum nominal amount of equity securities to which this authority relates represents approximately 5% of the issued share capital of the Company as at 21 May 2013 (being the latest practicable date prior to publication of this Report).
The directors do not intend to issue more than 7.5% of the issued share capital of the Company for cash on a non pre-emptive basis in any rolling three year period without prior consultation with the shareholders and the Investment Committees of the Association of British Insurers and the National Association of Pension Funds.
Resolution 15 will be proposed as a special resolution to renew this authority until the conclusion of the next AGM or, if earlier, the close of business on 1 October 2014.
2013 Annual Report and AccountsHaving taken all matters considered by the Board and brought to the attention of the Board during the year into account, the Board is satisfied that the Annual Report and Accounts, taken as a whole, is fair, balanced and understandable. The Board believes that the disclosures set out in of the Annual Report provide the information necessary for shareholders to assess the Company’s performance, business model and strategy.
Statement as to disclosure of information to the auditorSo far as the directors who held office at the date of approval of this Report are aware, there is no relevant audit information of which the auditor is unaware and each director has taken all steps that he or she ought to have taken as a director to make himself or herself aware of any relevant audit information and to establish that the auditor is aware of that information.
AuditorA resolution to reappoint Deloitte LLP as auditor of the Company will be proposed at the Annual General Meeting.
Annual General Meeting The Notice of Meeting on pages 134 and 135 sets out the resolutions to be proposed at the Annual General Meeting and gives details of the voting record date and proxy appointment deadline for that meeting. Resolutions 1 to 13 comprise ordinary business and resolutions 14 to 17 special business.
Authority to allot shares and grant rightsAt the Annual General Meeting held on 5 July 2012, shareholders authorised the directors, under section 551 of the Companies Act 2006 to allot ordinary shares without the prior consent of shareholders for a period expiring at the conclusion of the Annual General Meeting to be held in 2013 or, if earlier, on 1 October 2013. Resolution 14 will seek to renew this authority and to authorise the directors under section 551 of the Companies Act 2006 to allot ordinary shares or grant rights to subscribe for or convert any securities into shares for a period expiring no later than 1 October 2014.
Paragraph (a)(i) of Resolution 14 will allow the directors to allot ordinary shares up to a maximum nominal amount of £14,330,256 representing approximately one-third (33.3%) of the Company’s existing issued share capital and calculated as at 21 May 2013 (being the latest practicable date prior to publication of this Report). In accordance with institutional guidelines issued by the Association of British Insurers, paragraph (a)(ii) of Resolution 14 will allow directors to allot, including the
Report of the directors
130 Great Portland Estates Annual Report 2013
Notice of general meetingsThe notice period required by the Companies Act 2006 for general meetings of the Company is 21 days, unless shareholders approve a shorter notice period, which cannot however be less than 14 clear days. (Annual General Meetings must always be held on at least 21 clear days’ notice.)
At last year’s Annual General Meeting, shareholders authorised the calling of general meetings other than an Annual General Meeting on not less than 14 clear days’ notice and Resolution 17 seeks to renew this authority. The authority granted by this resolution, if passed, will be effective until the Company’s next Annual General Meeting, when it is intended that a similar resolution will be proposed.
Note that in order to be able to call a general meeting on less than 21 clear days’ notice, the Company must make a means of electronic voting available to all shareholders for that meeting.
The flexibility offered by this resolution will be used where, taking into account the circumstances, the directors consider this appropriate in relation to the business to be considered at the meeting and in the interests of the Company and shareholders as a whole.
RecommendationThe directors consider that all the resolutions to be put to the meeting are in the best interests of the Company and its shareholders as a whole. Your Board will be voting in favour of them and unanimously recommends that you do so as well.
By order of the Board
Desna Martin Company Secretary
Great Portland Estates plc Company number: 596137
22 May 2013
Authority to purchase own sharesA special resolution was also passed at last year’s meeting enabling the Company to purchase its own shares in the market. Resolution 16 will seek to renew this authority. The maximum number of shares to which the authority relates is 51,554,530. This represents 14.99% of the share capital of the Company in issue as at 21 May 2013. The directors intend only to exercise this authority if to do so would, in their opinion, enhance shareholder value. If Resolution 16 is passed at the Annual General Meeting, the Company will have the option of holding as treasury shares any of its own shares that it purchases pursuant to the authority conferred by this resolution. This would give the Company the ability to sell treasury shares or use them to satisfy share awards under employee share schemes, providing the Company with additional flexibility in the management of its capital base. No dividends will be paid on shares whilst held in treasury and no voting rights will attach to the treasury shares. Any shares purchased by the Company under this authority would be cancelled unless the shares are being purchased by the Company to hold as treasury shares.
The price paid for ordinary shares will not be less than the nominal value of 12.5 pence per share and not more than the higher of 5% above the average of the middle market quotations of the Company’s ordinary shares as derived from the London Stock Exchange Daily Official List for the five business days’ preceding the day on which the ordinary shares are purchased and the amount stipulated by Article 5(1) of the Buy-back and Stabilisation Regulation 2003.
There were no purchases of shares by the Company during the year. At 31 March 2013, the number of shares which may be purchased under the shareholders’ authority given at the 2012 Annual General Meeting was 46,870,154.
At 21 May 2013, the Company held no shares in treasury.
Resolution 16 will be proposed as a special resolution to renew this authority until the conclusion of the next AGM or, if earlier, the close of business on 1 October 2014.
Annual Report 2013 Great Portland Estates 131
Directors’ responsibilities statement
The directors are responsible for keeping adequate accounting records that are sufficient to show and explain the Company’s transactions and disclose with reasonable accuracy at any time the financial position of the Company and enable them to ensure that the financial statements comply with the Companies Act 2006. They are also responsible for safeguarding the assets of the Company and hence for taking reasonable steps for the prevention and detection of fraud and other irregularities.
The directors are responsible for the maintenance and integrity of the corporate and financial information included on the Company’s website. Legislation in the United Kingdom governing the preparation and dissemination of financial statements may differ from legislation in other jurisdictions.
Responsibility statement We confirm that to the best of our knowledge:
— the financial statements, prepared in accordance with the relevant financial reporting framework, give a true and fair view of the assets, liabilities, financial position and profit or loss of the Company and the undertakings included in the consolidation taken as a whole; and
— the management report, which is incorporated into the directors’ report, includes a fair review of the development and performance of the business and the position of the Company and the undertakings included in the consolidation taken as a whole, together with a description of the principal risks and uncertainties that they face.
By order of the Board
Toby Courtauld Nick Sanderson Chief Executive Finance Director
22 May 2013 22 May 2013
Directors’ responsibilities statementThe directors are responsible for preparing the Annual Report and the financial statements in accordance with applicable law and regulations.
Company law requires the directors to prepare financial statements for each financial year. Under that law the directors are required to prepare the Group financial statements in accordance with International Financial Reporting Standards (IFRSs) as adopted by the European Union and Article 4 of the IAS Regulation and have elected to prepare the parent company financial statements in accordance with United Kingdom Generally Accepted Accounting Practice (United Kingdom Accounting Standards and applicable law). Under company law the directors must not approve the accounts unless they are satisfied that they give a true and fair view of the state of affairs of the Company and of the profit or loss of the Company for that period.
In preparing the parent company financial statements, the directors are required to:
— select suitable accounting policies and then apply them consistently;
— make judgements and accounting estimates that are reasonable and prudent;
— state whether applicable UK Accounting Standards have been followed, subject to any material departures disclosed and explained in the financial statements; and
— prepare the financial statements on the going concern basis unless it is inappropriate to presume that the Company will continue in business.
In preparing the group financial statements, International Accounting Standard 1 requires that directors:
— properly select and apply accounting policies;
— present information, including accounting policies, in a manner that provides relevant, reliable, comparable and understandable information;
— provide additional disclosures when compliance with the specific requirements in IFRSs are insufficient to enable users to understand the impact of particular transactions, other events and conditions on the entity’s financial position and financial performance; and
— make an assessment of the Company’s ability to continue as a going concern.
132 Great Portland Estates Annual Report 2013
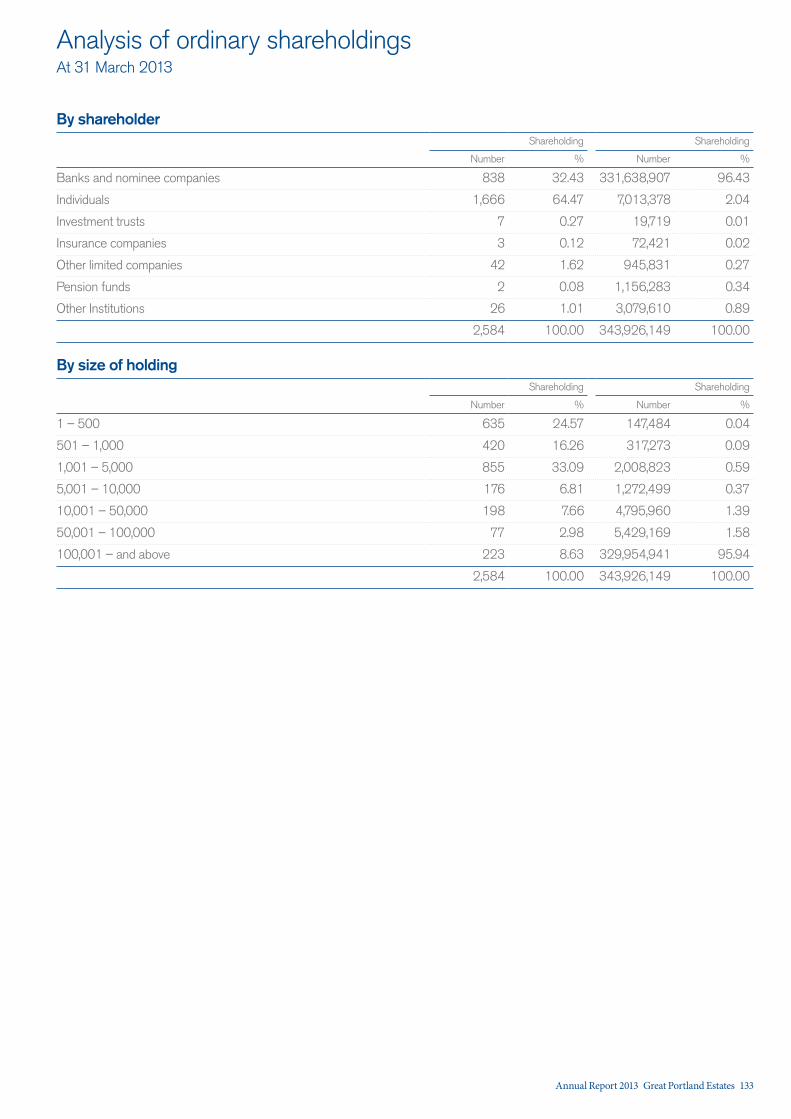
Analysis of ordinary shareholdingsAt 31 March 2013
By shareholderShareholding Shareholding
Number % Number %
Banks and nominee companies 838 32.43 331,638,907 96.43
Individuals 1,666 64.47 7,013,378 2.04
Investment trusts 7 0.27 19,719 0.01
Insurance companies 3 0.12 72,421 0.02
Other limited companies 42 1.62 945,831 0.27
Pension funds 2 0.08 1,156,283 0.34
Other Institutions 26 1.01 3,079,610 0.89
2,584 100.00 343,926,149 100.00
By size of holdingShareholding Shareholding
Number % Number %
1 – 500 635 24.57 147,484 0.04
501 – 1,000 420 16.26 317,273 0.09
1,001 – 5,000 855 33.09 2,008,823 0.59
5,001 – 10,000 176 6.81 1,272,499 0.37
10,001 – 50,000 198 7.66 4,795,960 1.39
50,001 – 100,000 77 2.98 5,429,169 1.58
100,001 – and above 223 8.63 329,954,941 95.94
2,584 100.00 343,926,149 100.00
Annual Report 2013 Great Portland Estates 133
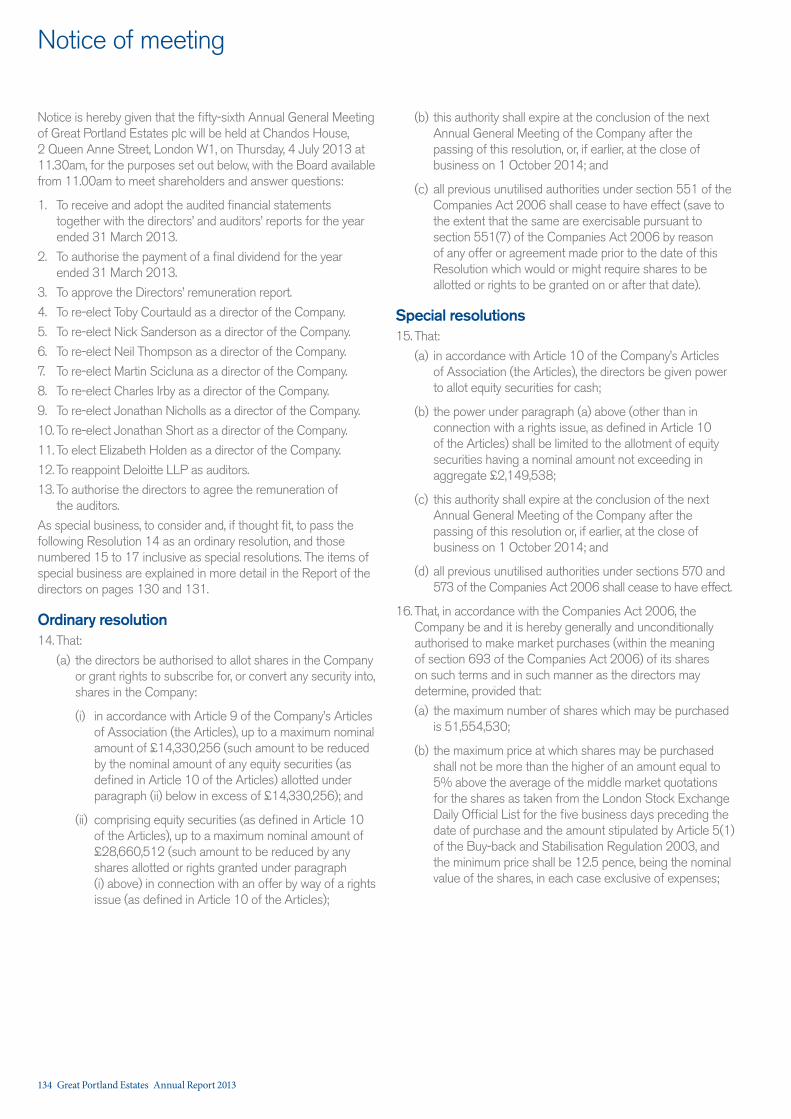
Notice of meeting
Notice is hereby given that the fifty-sixth Annual General Meeting of Great Portland Estates plc will be held at Chandos House, 2 Queen Anne Street, London W1, on Thursday, 4 July 2013 at 11.30am, for the purposes set out below, with the Board available from 11.00am to meet shareholders and answer questions:
1. To receive and adopt the audited financial statements together with the directors’ and auditors’ reports for the year ended 31 March 2013.
2. To authorise the payment of a final dividend for the year ended 31 March 2013.
3. To approve the Directors’ remuneration report.
4. To re-elect Toby Courtauld as a director of the Company.
5. To re-elect Nick Sanderson as a director of the Company.
6. To re-elect Neil Thompson as a director of the Company.
7. To re-elect Martin Scicluna as a director of the Company.
8. To re-elect Charles Irby as a director of the Company.
9. To re-elect Jonathan Nicholls as a director of the Company.
10. To re-elect Jonathan Short as a director of the Company.
11. To elect Elizabeth Holden as a director of the Company.
12. To reappoint Deloitte LLP as auditors.
13. To authorise the directors to agree the remuneration of the auditors.
As special business, to consider and, if thought fit, to pass the following Resolution 14 as an ordinary resolution, and those numbered 15 to 17 inclusive as special resolutions. The items of special business are explained in more detail in the Report of the directors on pages 130 and 131.
Ordinary resolution14. That:
(a) the directors be authorised to allot shares in the Company or grant rights to subscribe for, or convert any security into, shares in the Company:
(i) in accordance with Article 9 of the Company’s Articles of Association (the Articles), up to a maximum nominal amount of £14,330,256 (such amount to be reduced by the nominal amount of any equity securities (as defined in Article 10 of the Articles) allotted under paragraph (ii) below in excess of £14,330,256); and
(ii) comprising equity securities (as defined in Article 10 of the Articles), up to a maximum nominal amount of £28,660,512 (such amount to be reduced by any shares allotted or rights granted under paragraph (i) above) in connection with an offer by way of a rights issue (as defined in Article 10 of the Articles);
(b) this authority shall expire at the conclusion of the next Annual General Meeting of the Company after the passing of this resolution, or, if earlier, at the close of business on 1 October 2014; and
(c) all previous unutilised authorities under section 551 of the Companies Act 2006 shall cease to have effect (save to the extent that the same are exercisable pursuant to section 551(7) of the Companies Act 2006 by reason of any offer or agreement made prior to the date of this Resolution which would or might require shares to be allotted or rights to be granted on or after that date).
Special resolutions15. That:
(a) in accordance with Article 10 of the Company’s Articles of Association (the Articles), the directors be given power to allot equity securities for cash;
(b) the power under paragraph (a) above (other than in connection with a rights issue, as defined in Article 10 of the Articles) shall be limited to the allotment of equity securities having a nominal amount not exceeding in aggregate £2,149,538;
(c) this authority shall expire at the conclusion of the next Annual General Meeting of the Company after the passing of this resolution or, if earlier, at the close of business on 1 October 2014; and
(d) all previous unutilised authorities under sections 570 and 573 of the Companies Act 2006 shall cease to have effect.
16. That, in accordance with the Companies Act 2006, the Company be and it is hereby generally and unconditionally authorised to make market purchases (within the meaning of section 693 of the Companies Act 2006) of its shares on such terms and in such manner as the directors may determine, provided that:
(a) the maximum number of shares which may be purchased is 51,554,530;
(b) the maximum price at which shares may be purchased shall not be more than the higher of an amount equal to 5% above the average of the middle market quotations for the shares as taken from the London Stock Exchange Daily Official List for the five business days preceding the date of purchase and the amount stipulated by Article 5(1) of the Buy-back and Stabilisation Regulation 2003, and the minimum price shall be 12.5 pence, being the nominal value of the shares, in each case exclusive of expenses;
134 Great Portland Estates Annual Report 2013
(c) the authority conferred by this Resolution shall expire at the conclusion of the next Annual General Meeting of the Company after the passing of this Resolution or at the close of business on 1 October 2014, whichever is the earlier, save that the Company may before such expiry enter into a contract or contracts for purchase under which such purchase may be completed or executed wholly or partly after the expiration of this authority and may make a purchase of shares in pursuance of any such contract; and
(d) all existing authorities for the Company to make market purchases of its shares are revoked, except in relation to the purchase of shares under a contract or contracts concluded before the date of this Resolution and which has or have not yet been executed.
17. That, in accordance with the Company’s Articles of Association, a general meeting other than an Annual General Meeting may be called on not less than 14 clear days’ notice.
Registered office: 33 Cavendish Square London W1G 0PW
By order of the Board
Desna Martin Company Secretary
22 May 2013
1. Members are entitled to appoint a proxy to exercise all or any of their rights to attend and to speak and vote on their behalf at the meeting. A shareholder may appoint more than one proxy in relation to the Annual General Meeting provided that each proxy is appointed to exercise the rights attached to a different share or shares held by that shareholder. A proxy need not be a shareholder of the Company. In order to be valid an appointment of proxy must be returned by one of the following methods:
— in hard copy form by post, by courier or by hand to the Company’s Registrar at the address shown on the form of proxy; or
— in the case of CREST members, by utilising the CREST electronic proxy appointment service in accordance with the procedures set out below,
and in each case must be received by the Company’s Registrar not less than 48 hours before the time of the meeting.
2. The return of a completed proxy form, other such instrument or any CREST Proxy Instruction (as described in paragraph 8 below) will not prevent a shareholder attending the Annual General Meeting and voting in person if he/she wishes to do so. A shareholder must inform the Company’s Registrar in writing of any termination of the authority of a proxy.
3. Any person to whom this notice is sent who is a person nominated under section 146 of the Companies Act 2006 to enjoy information rights (a Nominated Person) may, under an agreement between him/her and the shareholder by whom he/she was nominated, have a right to be appointed (or to have someone else appointed) as a proxy for the Annual General Meeting. If a Nominated Person has no such proxy appointment right or does not wish to exercise it, he/she may, under any such agreement, have a right to give instructions to the shareholder as to the exercise of voting rights.
4. The statement of rights of shareholders in relation to the appointment of proxies in paragraph 1 above does not apply to Nominated Persons. The rights described in this paragraph can only be exercised by shareholders of the Company.
5. Nominated persons are reminded that they should contact the registered holder of their shares (and not the Company) on matters relating to their investments in the Company.
6. As at 21 May 2013 (being the latest practicable date prior to the publication of this Notice) the Company’s issued share capital consists of 343,926,149 ordinary shares, carrying one vote each. Therefore, the total voting rights in the Company as at 21 May 2013 are 343,926,149.
7. Copies of all directors’ contracts are available for inspection at 33 Cavendish Square, London W1G 0PW during normal business hours on any weekday (English public holidays excepted) and will be available at the place of the Annual General Meeting for at least 15 minutes prior to and during the Annual General Meeting.
8. (a) CREST members who wish to appoint a proxy or proxies by utilising the CREST electronic proxy appointment service may do so by utilising the procedures described in the CREST Manual on the Euroclear website (www.euroclear.com/CREST). CREST Personal Members or other CREST sponsored members, and those CREST members who have appointed a voting service provider(s), should refer to their CREST sponsor or voting service provider(s), who will be able to take the appropriate action on their behalf.
(b) In order for a proxy appointment made by means of CREST to be valid, the appropriate CREST message (a CREST Proxy Instruction) must be properly authenticated in accordance with Euroclear UK & Ireland Limited specifications and must contain the information required for such instructions, as described in the CREST Manual. The message regardless of whether it constitutes the appointment of a proxy or an amendment to the instruction given to a previously appointed proxy must, in order to be valid, be transmitted so as to be received by the issuer’s agent (ID: RA10) by the latest time(s) for receipt of proxy appointments specified in the notice of meeting. For this purpose, the time of receipt will be taken to be the time (as determined by the timestamp applied to the message by the CREST Applications Host) from which the issuer’s agent is able to retrieve the message by enquiry to CREST in the manner prescribed by CREST. After this time any change of instructions to proxies appointed through CREST should be communicated to the appointee through other means.
(c) The Company may treat as invalid a CREST Proxy Instruction in the circumstances set out in Regulation 35(5)(a) of the Uncertificated Securities Regulations 2001.
(d) CREST members and, where applicable, their CREST sponsors or voting service providers should note that Euroclear UK & Ireland Limited does not make available special procedures in CREST for any particular messages. Normal system timings and limitations will therefore apply in relation to the input of CREST Proxy Instructions. It is the responsibility of the CREST member concerned to take (or, if the CREST member is a CREST personal member or sponsored member or has appointed a voting service provider(s), to procure that their CREST sponsor or voting service provider(s) take(s)) such action as shall be necessary to ensure that a message is transmitted by means of the CREST system by any particular time. In this connection, CREST members and, where applicable, their CREST sponsors or voting service providers are referred, in particular, to those sections of the CREST Manual concerning practical limitations of the CREST system and timings.
9. The Company specifies that only those shareholders registered in the Register of Members of the Company as at 6.00pm on 2 July 2013 (or in the event of any adjournment, at 6.00pm on the date which is two days before the date of the adjourned meeting) shall be entitled to attend and vote at the meeting in respect of the number of shares registered in their name at that time and changes to the Register after that time shall be disregarded in determining the rights of any person to attend or vote at the meeting.
10. Any corporation which is a member can appoint one or more corporate representatives who may exercise on its behalf all of its powers as a member provided that they do not do so in relation to the same shares.
11. Under section 527 of the Companies Act 2006 members meeting the threshold requirements set out in that section have the right to require the Company to publish on a website a statement setting out any matter relating to: (i) the audit of the Company’s accounts (including the auditor’s report and the conduct of the audit) that are to be laid before the Annual General Meeting; or (ii) any circumstance connected with an auditor of the Company ceasing to hold office since the previous meeting at which annual accounts and reports were laid in accordance with section 437 of the Companies Act 2006. The Company may not require the members requesting such website publication to pay its expenses in complying with sections 527 or 528 of the Companies Act 2006, and it must forward the statement to the Company’s auditors not later than the time when it makes the statement available on the website. The business which may be dealt with at the Annual General Meeting includes any statement that the Company has been required under section 527 of the Companies Act 2006 to publish on its website.
12. A member attending the meeting has the right to ask questions. The Company must cause to be answered any such question relating to the business being dealt with at the meeting but no such answer need be given if (a) to do so would interfere unduly with the preparation for the meeting or involve the disclosure of confidential information, (b) the answer has already been given on a website in the form of an answer to a question, or (c) it is undesirable in the interests of the Company or the good order of the meeting that the question be answered.
13. A copy of this notice, and other information required by section 311A of the Companies Act 2006 can be found at www.gpe.co.uk/investors/agm/
14. You may not use any electronic address provided either in this Notice of Meeting or any related documents (including the form of proxy) to communicate with the Company for any other purposes other than those expressly stated.
15. Voting on all resolutions will be conducted by way of a poll rather than on a show of hands. This will result in a more accurate reflection of the views of shareholders by ensuring that every vote is recognised, including all votes of shareholders who are unable to attend the meeting but who appoint a proxy for the meeting. On a poll, each shareholder has one vote for every share held.
Notes to notice of meeting
Annual Report 2013 Great Portland Estates 135
Glossary
Core West EndAreas of London with W1 and SW1 postcodes.
Earnings Per Share (EPS)Profit after tax divided by the weighted average number of ordinary shares in issue.
EPRA adjustmentsStandard calculation methods for adjusted EPS and NAV as set out by the European Public Real Estate Association (EPRA) in their Best Practice and Policy Recommendations.
EPRA vacancy rateThe element of a property which is unoccupied but available for letting, expressed as the ERV of the vacant space divided by the ERV of the total portfolio.
Estimated Rental Value (ERV)The market rental value of lettable space as estimated by the Company’s valuers at each balance sheet date.
Fair valueThe amount as estimated by the Company’s valuers for which a property should exchange on the date of valuation between a willing buyer and a willing seller in an arm’s-length transaction after proper marketing wherein the parties had each acted knowledgeably, prudently and without compulsion. In line with market practice, values are stated net of purchasers’ costs.
F&BSFinance and Business Services sector.
IPDThe Investment Property Databank Limited (IPD) is a company that produces an independent benchmark of property returns.
IPD central LondonAn index, compiled by IPD, of the central and inner London properties in their monthly and quarterly valued universes.
Like-for-like portfolioProperties that have been held for the whole of the period of account.
Loan To Value (LTV)Total bank loans, private placement notes and debenture stock, net of cash, (including our share of joint ventures balances) expressed as a percentage of the market value of the property portfolio (including our share of joint ventures).
Net assets per share or Net Asset Value (NAV)Equity shareholders’ funds divided by the number of ordinary shares at the balance sheet date.
Net gearingTotal borrowings less short-term deposits and cash as a percentage of adjusted equity shareholders’ funds.
Net initial yieldAnnual net rents on investment properties as a percentage of the investment property valuation having added notional purchaser’s costs.
Non-PIDsDividends from profits of the Group’s taxable residual business.
Portfolio Internal Rate of Return (IRR)The rate of return that if used as a discount rate and applied to the projected cash flows from the portfolio would result in a net present value of zero.
Property Income Distributions (PIDs)Dividends from profits of the Group’s tax-exempt property rental business.
REITUK Real Estate Investment Trust.
Rent rollThe annual contracted rental income.
Return on shareholders’ equityThe growth in the EPRA diluted net assets per share plus dividends per share for the period expressed as a percentage of the EPRA net assets per share at the beginning of the period.
Reversionary or under-rentedThe percentage by which ERV exceeds rents passing, together with the estimated rental value of vacant space.
Reversionary yieldThe anticipated yield, which the initial yield will rise to once the rent reaches the ERV.
Total Property Return (TPR)Capital growth in the portfolio plus net rental income derived from holding these properties plus profit on sale of disposals expressed as a percentage return on the period’s opening value.
Total Shareholder Return (TSR)The growth in the ordinary share price as quoted on the London Stock Exchange plus dividends per share received for the period expressed as a percentage of the share price at the beginning of the period.
Triple net asset value (NNNAV)NAV adjusted to include the fair value of the Group’s financial liabilities on a diluted basis.
True equivalent yieldThe constant capitalisation rate which, if applied to all cash flows from an investment property, including current rent, reversions to current market rent and such items as voids and expenditures, equates to the market value having taken into account notional purchaser’s costs. Assumes rent is received quarterly in advance.
Weighted Average Cost of Capital (WACC)The weighted average pre-tax cost of the Group’s debt and the notional cost of the Group’s equity used as a benchmark to assess investment returns.
Weighted Average Unexpired Lease Term (WAULT)The Weighted Average Unexpired Lease Term expressed in years.
136 Great Portland Estates Annual Report 2013
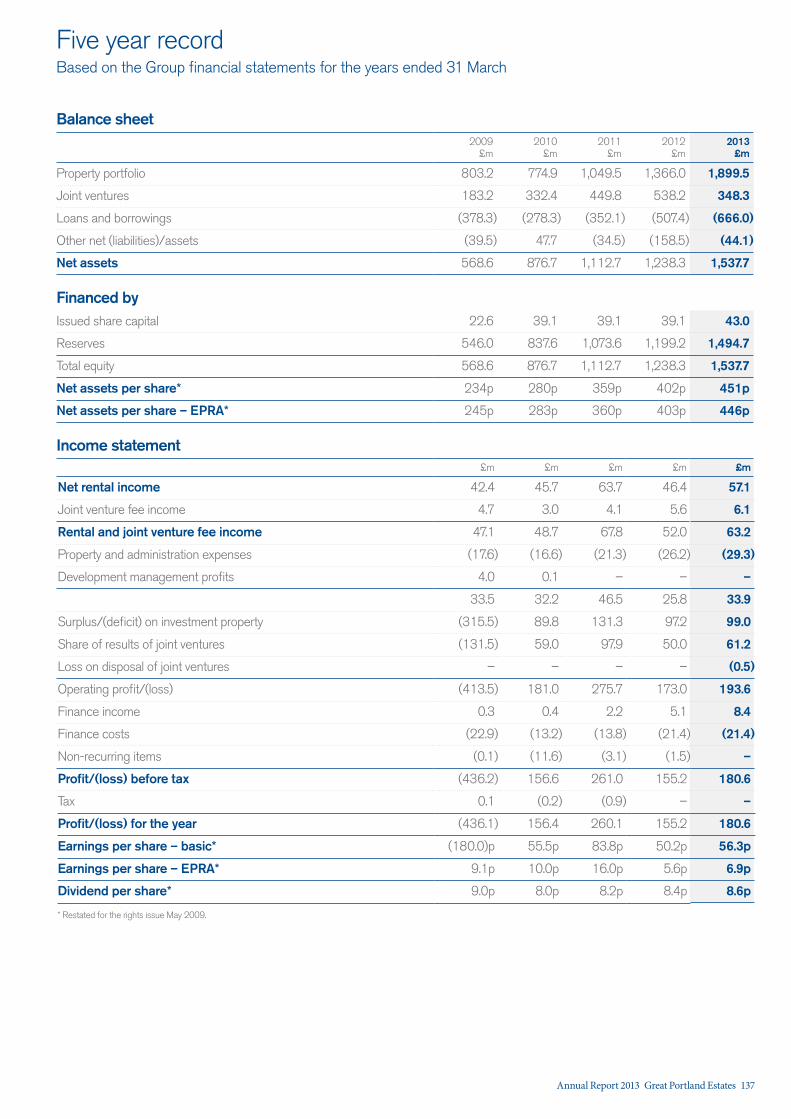
Five year recordBased on the Group financial statements for the years ended 31 March
Balance sheet2009
£m2010
£m2011
£m2012
£m2013
£m
Property portfolio 803.2 774.9 1,049.5 1,366.0 1,899.5
Joint ventures 183.2 332.4 449.8 538.2 348.3
Loans and borrowings (378.3) (278.3) (352.1) (507.4) (666.0)
Other net (liabilities)/assets (39.5) 47.7 (34.5) (158.5) (44.1)
Net assets 568.6 876.7 1,112.7 1,238.3 1,537.7
Financed byIssued share capital 22.6 39.1 39.1 39.1 43.0
Reserves 546.0 837.6 1,073.6 1,199.2 1,494.7
Total equity 568.6 876.7 1,112.7 1,238.3 1,537.7
Net assets per share* 234p 280p 359p 402p 451p
Net assets per share – EPRA* 245p 283p 360p 403p 446p
Income statement£m £m £m £m £m
Net rental income 42.4 45.7 63.7 46.4 57.1
Joint venture fee income 4.7 3.0 4.1 5.6 6.1
Rental and joint venture fee income 47.1 48.7 67.8 52.0 63.2
Property and administration expenses (17.6) (16.6) (21.3) (26.2) (29.3)
Development management profits 4.0 0.1 – – –
33.5 32.2 46.5 25.8 33.9
Surplus/(deficit) on investment property (315.5) 89.8 131.3 97.2 99.0
Share of results of joint ventures (131.5) 59.0 97.9 50.0 61.2
Loss on disposal of joint ventures – – – – (0.5)
Operating profit/(loss) (413.5) 181.0 275.7 173.0 193.6
Finance income 0.3 0.4 2.2 5.1 8.4
Finance costs (22.9) (13.2) (13.8) (21.4) (21.4)
Non-recurring items (0.1) (11.6) (3.1) (1.5) –
Profit/(loss) before tax (436.2) 156.6 261.0 155.2 180.6
Tax 0.1 (0.2) (0.9) – –
Profit/(loss) for the year (436.1) 156.4 260.1 155.2 180.6
Earnings per share – basic* (180.0)p 55.5p 83.8p 50.2p 56.3p
Earnings per share – EPRA* 9.1p 10.0p 16.0p 5.6p 6.9p
Dividend per share* 9.0p 8.0p 8.2p 8.4p 8.6p
* Restated for the rights issue May 2009.
Annual Report 2013 Great Portland Estates 137

Financial calendar
201329 May 31 MayEx-dividend date for 2012/2013 final dividend
Registration qualifying date for 2012/2013 final dividend
4 July 9 JulyAnnual General Meeting 2012/2013 final
dividend payable
12 Nov 20 NovAnnouncement of 2013/2014 interim results (provisional)1
Ex-dividend date for 2013/2014 interim dividend (provisional)1
22 NovRegistration qualifying date for 2013/2014 interim dividend (provisional)1
20142 Jan 21 May2013/2014 interim dividend payable (provisional)1
Announcement of 2013/2014 full year results (provisional)2
1. Provisional dates will be confirmed in the Half Year results announcement 2013.
2. The timetable for the potential final dividend will be confirmed in the 2014 Annual Report.
138 Great Portland Estates Annual Report 2013
Shareholders’ information
Shareholder enquiriesAll enquiries relating to holdings of shares, bonds or debentures in Great Portland Estates, including notification of change of address, queries regarding dividend/interest payments or the loss of a certificate, should be addressed to the Company’s registrars:
Capita Registrars The Registry 34 Beckenham Road Beckenham Kent BR3 4TU Tel: 0871 664 0300 Email: [email protected]
(Calls cost 10 pence per minute plus network extras; lines are open 8.30am–5.30pm Monday to Friday). If you are calling from overseas please dial +44 20 8639 3399
Unsolicited telephone calls – Boiler room scamsOver the last year, some of our shareholders have received unsolicited telephone calls or correspondence concerning investment matters from organisations or persons claiming or implying that they have some connection with the Company.
These are typically from overseas based “brokers” who target UK shareholders offering to sell them shares that often turn out to be worthless or non-existent, or an inflated price for shares they own. These operations are commonly known as “boiler rooms”. Shareholders are advised to be very wary of any offers of unsolicited advice, discounted shares, premium prices for shares they own or free reports into the Company. If you receive any unsolicited investment advice:
— ensure you get the correct name of the person and organisation;
— check that the organisation is on the Financial Conduct Authority (FCA) Register to ensure they are authorised at www.fsa.gov.uk/register/home.do
— use the details on the FCA Register to contact the firm;
— call the FCA Consumer Helpline (0800 111 6767) if there are no contact details in the Register or you are told they are out of date; and
— if the calls persist, hang up.
If you use an unauthorised firm to buy or sell shares, you will not have access to the Financial Ombudsman Service or the Financial Services Compensation Scheme.
Payment of dividendsIf you would like your dividends/interest paid directly into your bank or building society account you should write to Capita Registrars including details of your nominated account. Although this will enable your dividend/interest to be paid directly into your account, your tax voucher will still be sent to your registered address.
Tax consequences of REIT statusAs a REIT, dividend payments must be split between PIDs and non-PIDs. Information in respect of the tax consequences for shareholders of receiving dividends can be found on the Company’s website at www.gpe.co.uk/investors/shareholder-information/reits
Share dealing serviceAn online and telephone dealing service is available for UK shareholders through Capita Deal. For further information on this service, or to buy and sell shares, please contact:
Online dealing – www.capitadeal.com
Telephone dealing – 0871 664 0364
(Calls cost 10 pence per minute plus network extras; lines are open 8.00am–4.30pm Monday to Friday).
WebsiteThe Company has a corporate website, which holds, amongst other information, a copy of our latest annual report and accounts, a list of properties held by the Group and copies of all press announcements released over the last 12 months. The site can be found at www.gpe.co.uk
Company SecretaryDesna Martin, BCom CA(Aust) ACIS Registered office 33 Cavendish Square London W1G 0PW Tel: 020 7647 3000 Fax: 020 7016 5500 Registered number: 596137
Annual Report 2013 Great Portland Estates 139

Your notes
140 Great Portland Estates Annual Report 2013

Design and production by Radley Yeldar | ry.com
Board and people photography by Andy Wilson
200 Gray’s Inn Road photography by Nick Guttridge
Printed by Pureprint Group, using pureprint environmental print technology, a CarbonNeutral company certified to FSC® and IS0 14001.
This annual report is printed on Amadeus 50 Silk paper and board, produced using 50% deinked, recycled fibre and 50% virgin fibre. Both the paper mill and the printer involved in this production hold ISO 14001 accreditation, which specifies a process for continuous environmental improvement, and both are FSC certified. If after reading, you no longer wish to retain this report, please pass it on to other interested readers or dispose of it in your recycled paper waste.
This is a CarbonNeutral® Publication.
The greenhouse gas emissions from the production and distribution of this Annual Report and Accounts have been neutralised in accordance with the CarbonNeutral Protocol.

Great Portland Estates plc 33 Cavendish Square London W1G 0PW
Tel: 020 7647 3000 Fax: 020 7016 5500
www.gpe.co.uk