green sector desk review in fata-task … sector...green sector desk review in fata-task force ......
TRANSCRIPT

GREEN SECTOR DESK REVIEW IN FATA-TASK FORCE
Facilitated By:Food and Agriculture Organization
of the United Nations (UN-FAO)

TORs of Task Force- FATA Agriculture working Group
To avoid duplication of efforts by different organizations striving towards
similar or related objectives.
To ensure better coordination amongst various UN agencies and partners
for achieving economy of resources and time.
To achieve objectives through synchronized/ concerted efforts by proper
prioritizing and gap identification.
To expedite response in critical situations.
To integrate decision making mechanisms.2

Presentation Preview• Scope and methodology of the study• FATA profile• Map of FATA• Agency wise estimated population 2011• IDPs Crisis in FATA - Background• Agriculture Statistics and damages• Livestock and Poultry profile and damages• Irrigation and Soil Conservation damages• Forestry and Fisheries damages• Total losses due to insurgency and floods , current projects and
gap analysis• SWOT analysis of Agriculture, Livestock, Irrigation and Water
Management• Coordination mechanism• Implementation modality
3

Scope and Methodology of the study
• Desk Review of Secondary Data; FDMA PlanningManual, PCNA, DNA, One UN report of multisectoral earlyrecovery programe in FATA, Websites of FDMA andhumanitarian response, USAID-Agency Development Plan(FDP-LD), PHRP-2010, few PC-1s developed by Agriculture andLSDD directorate of FATA secretariat.
• Consultation Meetings; ACS, DG Projects, Directorateof Agriculture, LSDD, Conservator Forests, DS P&DD of FATAsecretariat.
• Meeting Minutes; Agriculture cluster and Task Force
4
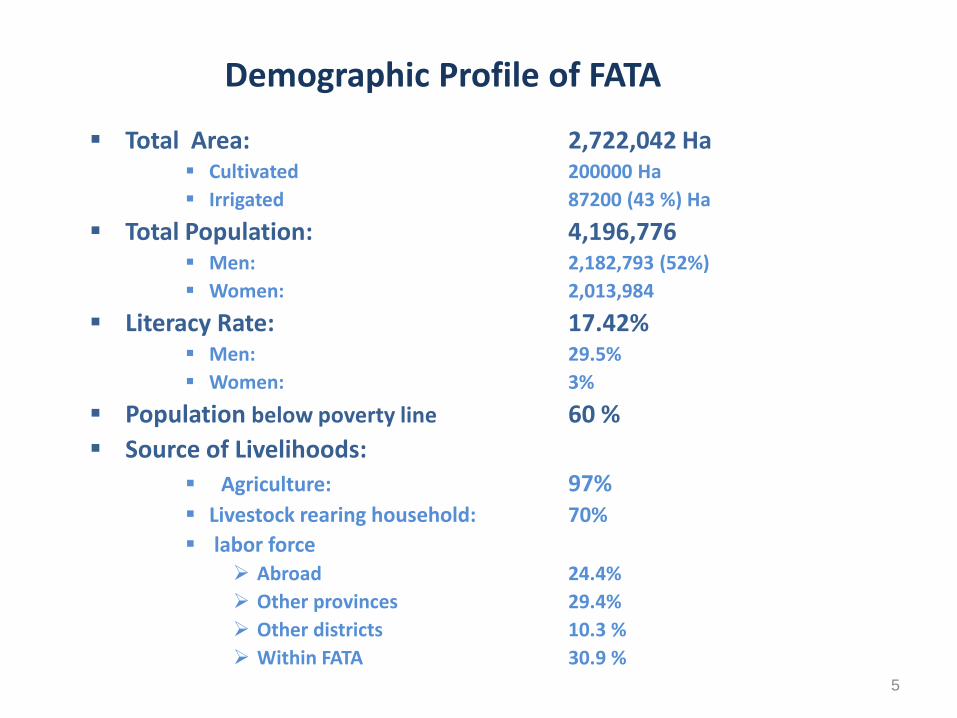
Demographic Profile of FATA
Total Area: 2,722,042 Ha Cultivated 200000 Ha Irrigated 87200 (43 %) Ha
Total Population: 4,196,776 Men: 2,182,793 (52%) Women: 2,013,984
Literacy Rate: 17.42% Men: 29.5% Women: 3%
Population below poverty line 60 % Source of Livelihoods:
Agriculture: 97% Livestock rearing household: 70% labor force
Abroad 24.4% Other provinces 29.4% Other districts 10.3 % Within FATA 30.9 %
5

FATA MAP
6
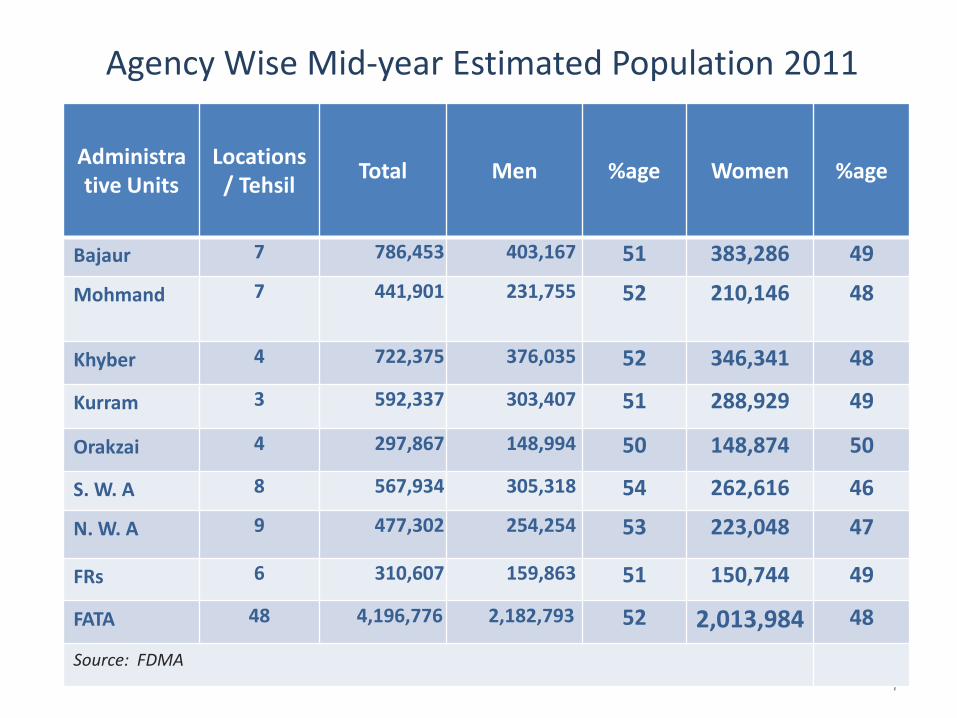
Agency Wise Mid-year Estimated Population 2011
7
Administrative Units
Locations / Tehsil Total Men %age Women %age
Bajaur 7 786,453 403,167 51 383,286 49
Mohmand 7 441,901 231,755 52 210,146 48
Khyber 4 722,375 376,035 52 346,341 48
Kurram 3 592,337 303,407 51 288,929 49
Orakzai 4 297,867 148,994 50 148,874 50
S. W. A 8 567,934 305,318 54 262,616 46
N. W. A 9 477,302 254,254 53 223,048 47
FRs 6 310,607 159,863 51 150,744 49
FATA 48 4,196,776 2,182,793 52 2,013,984 48
Source: FDMA
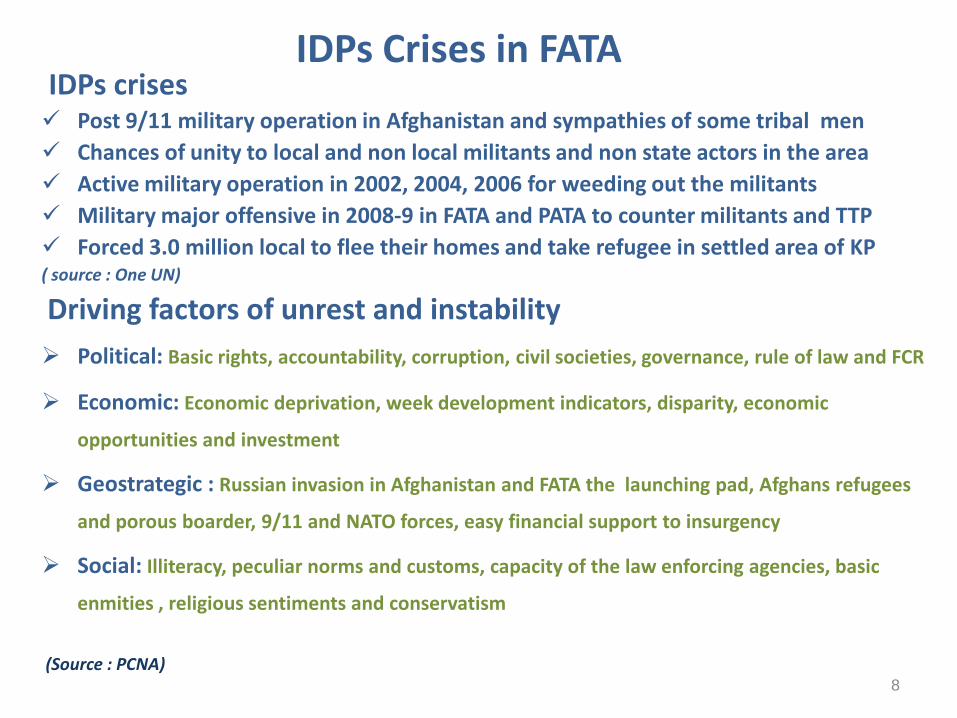
IDPs Crises in FATAIDPs crises Post 9/11 military operation in Afghanistan and sympathies of some tribal men Chances of unity to local and non local militants and non state actors in the area Active military operation in 2002, 2004, 2006 for weeding out the militants Military major offensive in 2008-9 in FATA and PATA to counter militants and TTP Forced 3.0 million local to flee their homes and take refugee in settled area of KP ( source : One UN)
Driving factors of unrest and instability Political: Basic rights, accountability, corruption, civil societies, governance, rule of law and FCR
Economic: Economic deprivation, week development indicators, disparity, economic
opportunities and investment
Geostrategic : Russian invasion in Afghanistan and FATA the launching pad, Afghans refugees
and porous boarder, 9/11 and NATO forces, easy financial support to insurgency
Social: Illiteracy, peculiar norms and customs, capacity of the law enforcing agencies, basic
enmities , religious sentiments and conservatism
(Source : PCNA)8

FATA IDPs Status (Updated till 09th June 2011, Source: FDMA)
•
9
Agency Registered Families Location
Returned Current Balance
Comments Total Registrations
NADRA Verified
In Camps Off Camps In Camp Off
Camp Total
Bajaur 70,258 70,258 24,850 45,408 51,763 - - 18,495 Return figures include latest return (April-May 2011) from Jalozai and off-camp
Mohmand 32,955 32,955 1,657 31,298 12,645 - - 20,310 Return figures include latest return (April-May 2011) from Jalozai and off-camp
Mohmand (Fresh) 9,182 - 9,182 - 3,973 5,209 - 5,209
1368 IDP familes in Nahqi are already registered and verfied by NADRA in Jalozai Data
Khyber 4,679 3,205 3,205 - - 3,205 - 3,205
Approx. 1100 families data still to be verified by NADRA, while another 600 unregesitered families reside in Jalozai
Kurram 34,785 21,885 - 21,885 - - 21,885 21,885
Orakzai 58,519 33,940 - 33,940 20,642 - 13,298 13,298 Approx. 4,000 families still be verified by NADRA
SWA 69,279 41,563 - 41,489 3,301 - 38,262 38,262
Only 1024 families of the returnees are verified IDPs. Phase 1c of SWA return is started since 8th June.
Bhittani Tribe (FR Tank) 2,097 2,097 - 2,097 - - 2,097 2,097
Total 281,754 205,903 38,894 176,117 92,324 8,414 75,542 122,761
Comments Return of Bajaur and Mohmand IDPs is in progress from Jalozai Camp since 11 April, 2011. The figures will be updated once the return phase is complete.
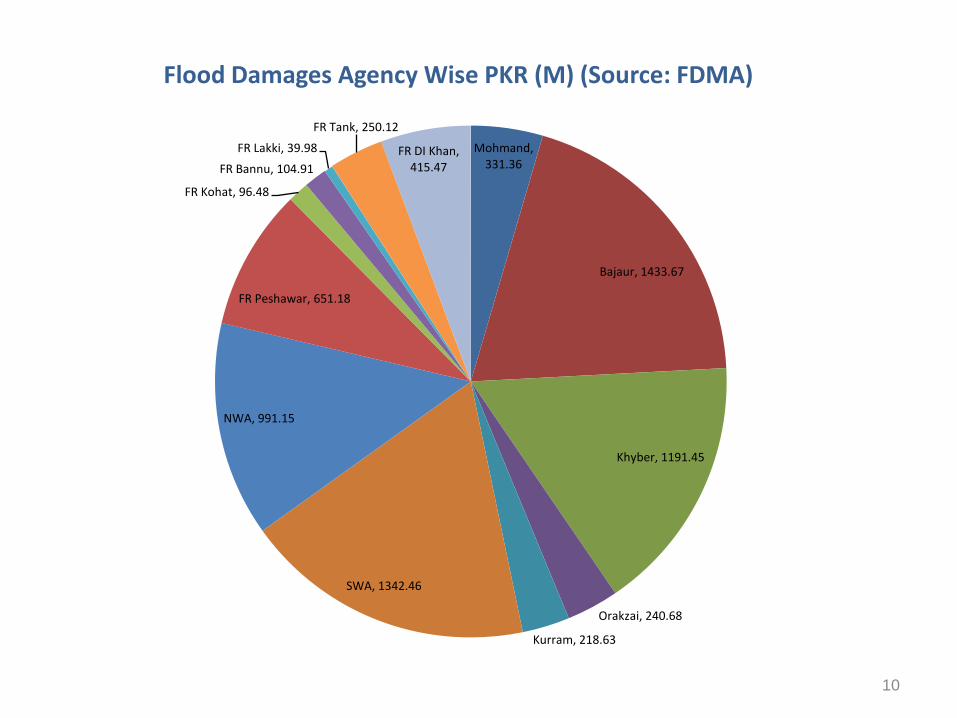
Mohmand, 331.36
Bajaur, 1433.67
Khyber, 1191.45
Orakzai, 240.68
Kurram, 218.63
SWA, 1342.46
NWA, 991.15
FR Peshawar, 651.18
FR Kohat, 96.48
FR Bannu, 104.91
FR Lakki, 39.98
FR Tank, 250.12
FR DI Khan, 415.47
Flood Damages Agency Wise PKR (M) (Source: FDMA)
10

11
Human Loss Compensation
30.851%
Private Houses Compensation
689.79%
Energy307.83
4% Bridges201.52
3%
Roads1076.5
14%
PHE72.47
1%Education
274.24%Agriculture
3262.7643%
Livestock1119.6
15%
Irrigation399.98
5%
Fisheries10.51
0%
Forest104.34
1%
Flood Damages All Sectors PKR (M) (Source: FDMA)

Agency/FR wise Cropped and Area Eroded
12
S. No. Agency/FR Cultivated Area (Ac) Area Eroded (Ac)
1 Bajaur 185,991 1,235
2 Mohmand 52,883 62
3 Khyber 49,286 7,850
5 Kurram 51,623 148
4 Orakzai 42,015 321
6 S.W. Agency 44,559 741
7 N.W. Agency 43,052 198
Sub Total Agencies 469,409 10,555
8 FR Peshawar 12,367 4,399
9 FR Kohat 10,288 203
10 FR Bannu 21,222 44
11 FR Lakki 14,148 37
12 FR Tank 7,277 618
13 FR DI Khan 10,915 667
Sub Total FRs 76,217 5,968
Grand Total 545,626 16,523 Source: Agriculture Extension Dept. FATA

Agricultural Losses due to Insurgency
AgencyRabi Losses (2008-09)PKR (M)
Kharif Losses (2009)
Rabi Losses (2009-10) Total
Bajaur 790 201 189 1180
Mohmand 403 149 148 700
G.Total 1193 350 337 1880
13

Post Flood Damages and Losses of Crops
Agency CropArea
under Crop (Ha)
%age Damages
Area Damaged
(Ha)
Production (MT)
LossesPKR (M)
Total Cultivated Area (Ac)
Area eroded
(Ac)
Orkazai
Maize 4010 6 241 553 11.068
42015 321Vegetable 650 31 202 1411 35.263Fruits 420 10 42 420 12.6Total 5080 16 485 2384 58.931
S .W.A
Maize 6660 60 3996 9191 183.816
44559 741Vegetable 1665 90 1499 10490 262.238Fruits 3335 50 1668 16675 500.25
Total 11660 67 7163 36356 946.304
Mohmand
Maize 2730 10 273 628 12.558
52883 62Vegetable 1250 40 500 3500 87.5Fruits 205 9 18 185 5.535
Total 4185 20 791 4313 105.593
Bajaur
Maize 6500 46 2990 6877 137.545
185991 1235Vegetable 650 60 390 2730 68.25Paddy 5060 18 911 3643 145.728
Total 12210 41 4291 13250 351.523Source: PC1s. Post Flood Reconstruction /Replacement Project of Agriculture in FATA area. Non-ADP (2011-11). Director of Agriculture Extension FATA.
Peshawar

Agency/FR wise Livestock Damages due to Insurgencies Source: FATA Livestock Secretariat
15
S. # Agency / FR Cow (No.) Buffaloes (No.) Sheep (No.) Goats (No.) Poultry (No.) Building (Nos) Animal Shelter
1 Bajaur30,000 4,000 10,000 30,000 90,000 6 10,500
2 Mohmand 4666 80 8122 8815 34893 3 3587
3 Khyber20 - 80 110 1,100 - -
4 Kurram- - - - - 17 -
5 Orakzai51,469 10,383 38,562 38,346 280,588 30 -
6 S.W. Agency315 32 726 671 2,100 - -
7 N.W. Agency- - - - - - -
Sub Total86,470 14,495 57,490 77,942 408,681 56 14,087
8 FR Peshawar25 - 10 30 60 - 20
9 FR Kohat30 - 23 25 22 - 25
10 FR Bannu600 100 1,000 2,000 7,000 14 250
11 FR Lakki400 - 300 1,000 3,000 5 130
12 FR Tank734 - 1,240 1,130 1,170 6 190
13 FR DI Khan840 - 1,190 1,027 1,200 8 194
Sub Total2,629 100 3,763 5,212 12,452 33 809
Total Nos.89,099 14,595 61,253 83,154 421,133 89 14,896
Losses PKR(M) 4454.95 1021.65 735.03 1081.0 105.28 4.45 148.96

Livestock Flood Damages Source: FDMA
Agency / FRs
Cow Buffalo
Lactating Pregnant Dry young calves Lactating Pregnant Dry young
calves Mohmand 54 41 27 149 8 7 5 20
Bajaur 1,644 822 411 1,233 48 32 16 64
Khyber 20 17 52 121 3 3 - 4
Orakzai 5 - 3 10 1 2 2 6
Kurram 21 9 22 57 6 5 2 16
S.W. Agency 52 31 41 191 8 3 1 20
N.W. Agency 5 - 3 11 - - - 2
Sub Total 1,801 920 559 1,772 74 52 26 132
FR Peshawar 10 3 3 20 - - - 3
FR Kohat 13 - - 17 - 2 2 5
FR Bannu 16 10 12 40 12 10 4 16
FR Lakki 15 3 2 17 - - - -
FR Tank 197 90 78 374 - - - -
FR DI Khan 111 90 140 515 - - - -
Sub Total 362 196 235 983 12 12 6 24
Total 2,163 1,116 794 2,755 86 64 32 156 16

Livestock Flood Damages (Cont.) Source: FDMA
Agency / FRs
Sheep Goat Poultry
Died
Feed &Fodder
destroyed
Total Losses PKR (M)
Adult Female
Adult Male Young Stock
Adult Female
Adult Male Young Stock
Mohmand 51 58 113 90 65 155 11,583 7,100 125.891
Bajaur 310 124 186 924 154 462 73,222 10,000 392.968
Khyber 50 52 131 43 63 165 1,500 8,250 134.868
Orakzai 30 10 30 20 48 45 563 3,271 51.964
Kurram 63 40 91 41 65 113 3,410 6,741 110.620
S.W. Agency 70 25 631 121 75 575 2,100 1,700 46.344
N.W. Agency 30 10 65 44 65 87 241 2,500 40.761
Sub total 604 319 1,247 1,283 535 1,602 92,619 39,562 903.418
FR Peshawar 15 20 40 67 60 117 2,500 1,100 21.331
FR Kohat 14 8 23 17 12 63 900 831 15.187
FR Bannu 70 28 70 60 54 144 1,731 1,010 24.403
FR Lakki 70 64 101 71 51 181 751 771 17.860
FR Tank 239 360 641 364 163 613 5,145 1,451 70.745
FR DI Khan 419 245 581 275 170 611 5,432 1,300 66.656
Sub total 827 725 1,456 854 510 1,729 16,459 6,463 216.183
Total 1,431 1,044 2,703 2,137 1,045 3,331 109,078 46,025 1,119.602 17

FATA Flood Damages: Irrigation Source: FDMA
Agency / FRs
Flood Protection Schemes
Irrigation Channels Water courses MHPs Units Total
Nos Cost (Rs. M)
Nos Cost (Rs. M)
Nos Cost (Rs. M)
Nos Cost (Rs. M) Nos Cost (Rs. M)
Mohmand - - - - - - - - - -Bajaur 18 13.08 3 4.754 2 1.044 - - 23 18.879 Khyber
8 26.32 8 20.055 10 1.050 15 7.50 41 54.924 Orakzai - - 10 15.150 - - - - 10 15.150 Kurram 3 12.60 6 26.062 - - - - 9 38.662 S.W. Agency 8 42.35 30 154.250 - - - - 38 196.600 N.W. Agency 15 56.26 9 19.500 - - - - 24 75.760 Sub total
52 150.61 66 239.771 12 2.094 15 7.50 145 399.975 FR Peshawar
- - - - - - - - - -
FR Kohat - - - - - - - - - -FR Bannu - - - - - - - - - -FR Lakki - - - - - - - - - -FR Tank - - - - - - - - - -FR DI Khan - - - - - - - - - -Sub total - - - - - - - - - -Total
52 150.61 66 239.771 12 2.094 15 7.50 145 399.975 18

Agency Description Cost in PKR(M)
Bajaur Plantation, SoilConservation,
Infrastructure & nurseries
306.139
Mohmand Same as above 181.772
Orakzai Same as above 1.621318
North Waziristan Same as above 65.250
Khyber Same as above 126.000
F.R Peshawar Same as above 21.840
FR Kohat Same as above 0.90867
South Waziristan Same as above 34.186
Total 431.578
FATA Insurgency Damages: Forests Source: Conservator Forests FATA Sect.

FATA Flood Damages: Forests Source: Conservator Forests FATA Sect.
Tehsil Level Loss of Forests Land and Infrastructure
Agency / FR Tehsil
Baseline (Ac)
Baseline (number of
trees)
Area Inundated (acre, or in
percent terms)
Area Irreversibly Lost (acres, or in percent terms)
% Forest Area
destroyed
Cost of replanting & maintenance
PKR (M)
Mohmand Pindyali 1,500 659,500 - - 3.00 3.022 Prang ghar 1,000 435,000 - - 2.00
Bajaur - - - - - -
Khyber Jamrud 1,193 518,955 1,193 208 17.43 59.037 Bara 4,845 2,107,575 4,845 972 20.06 Landi Kotal 265 115,275 265 66 24.90
Orakzai - - - - - -Kurram - - - - - -
S.W. Agency Wana 3,920 1,705,200 - - 15.00 19.553 Sarwakai 980 426,300 - - 15.00
N.W. Agency Mir Ali 3,527 1,534,245 529 - - 12.537 Sub Total 17,230 7,502,050 6,832 1,246 94.149 FR Peshawar 620 269,700 620 125 20.16 5.925 FR Kohat - - - - - -FR Bannu Ghumbati
(Manan area)300 130,500 45 - - 1.067
FR Lakki - - - - - -FR Tank - - - - - -FR DI Khan 900 391,500 - - 15.00 3.196
Sub Total 1,820 791,700 665 125 10.188 Total 19,050 8,293,750 7,497 1,371 104.337 20

FATA Flood Damages: Fisheries Source: FDMA
Total Losses to Fishery PKR(M) 10.515Fish Ponds in Private sector
S. No. AgencyNo. of Farm Damaged Cost per Fish Total
1 Mohmand 15 185,000 275,000
2 Khyber 12 185,000 2,220,000
3 Kurram 18 185,000 3,330,000
4 N.W. Agency 13 185,000 2,405,000
5 FR Bannu 8 185,000 1,480,000
Dams/ReservoirS.No. Name of Dam Agencies Stock till 09-10 Cost /Seed Total
1 Milward Khyber 50,000 5 250,000
2 Maidain Kurram 20,000 5 100,000
3 Kot Ragha Kurram 20,000 5 100,000
450,000Office Equipment Damaged 355,000
21
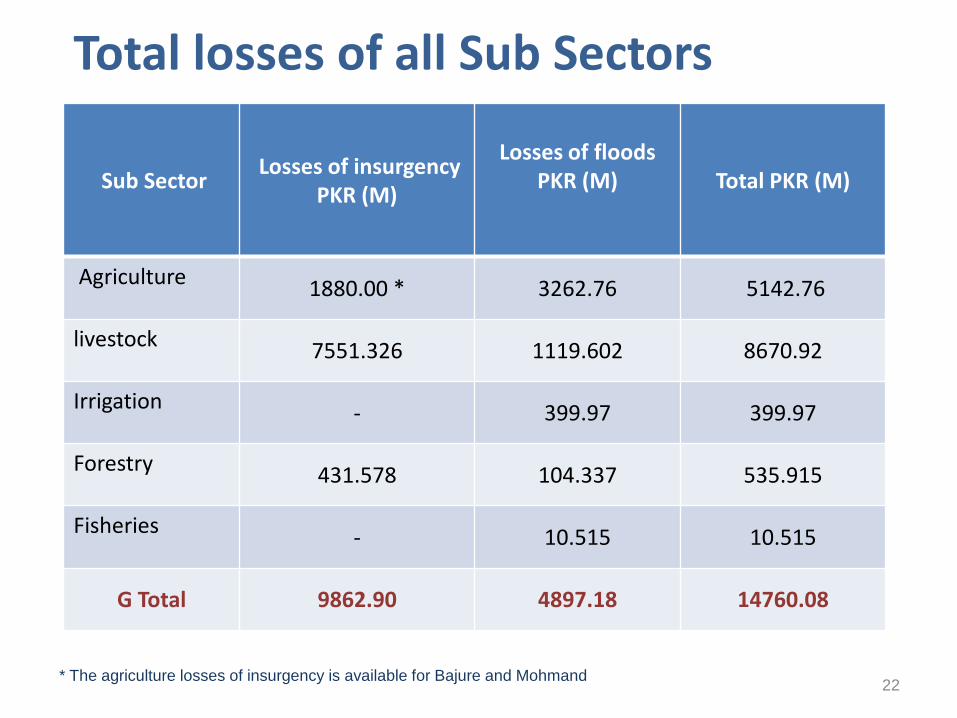
Total losses of all Sub Sectors
Sub Sector Losses of insurgency PKR (M)
Losses of floods PKR (M) Total PKR (M)
Agriculture 1880.00 * 3262.76 5142.76
livestock 7551.326 1119.602 8670.92
Irrigation - 399.97 399.97
Forestry 431.578 104.337 535.915
Fisheries - 10.515 10.515
G Total 9862.90 4897.18 14760.08
* The agriculture losses of insurgency is available for Bajure and Mohmand 22

Current Projects and Financial Gaps v/s DamagesProject Title Location Duration Financial outlay
PKR (M)
Bajaur Area Development Project ( BADP) Bajaur Agency 2000 to 2011 16.250
Mohmand Area development ProjectMohmand Agency 2000 to 2011 9.896
FATA rural Development Project (FRDP)
Bajaur and MohmandAgencies 2006 to 2011 472.158
FATA development Programme, Livelihoods' development (FDP-LD)
SWA and OrakzaiAgencies 2008 to 2013 Not available
FATA development Programme Government to community
Bajaur , Mohmand,SWA and OrakzaiAgency
2007 to 2012 Not available
Total Support 453.30 (3%)
Total integrated losses of insurgency and floods
14760.08
Gap/ Shortfall 14306.77 (97%)23

SWOT Analysis of Cereal Crops in Bajaur and Mohmand (Source, Agency Dev. Plan USAID FDP-LD)
Strengths Weaknesses
Land resources are available �Manpower at low labor cost is available �Prioritized by FATA Secretariat �Diverse agro-ecosystems are available, with many land-types
and cultivars �Land ownership exists �Previous experience for land reclamation �Machinery available for land leveling. �Experience in cereal crops cultivation �Wheat, maize are the main staple crops and barley as fodder
for animals �Cereal crops straw as fodder
Availability of quality seed of range of varieties and basic seed for multiplication�Scarcity of irrigation water.�Farmers/extension workers have weak knowledge, access to technology, and skills�Soil fertility is low in many areas.�The productivity of agricultural labor, land and water is low�Poor resources for reclamation and inputs �In time availability of inputs�Small size of farms�Reluctance of private sector for investment.
Opportunities Threats
Tested technology for crop productivity�Land Reclamation & protection bund/spurs for maximization of crop production�Wheat seed production by seed growers�Establishing laboratories to test soil status Linkages private seed companies & dealers�Private sectors investment in land leveling Strengthening the existing organized community organizations and FSC for seed production program/extension�Using the lessons learnt of ongoing and past developmental projects
Political administration ban fertilizer and sowing of maize crop any time�Degradation of the environment due to flood caused land sliding Security risk hamper in time inputs supply�Damage to crops due to drought or flood The ongoing developmental activities can be hampered any time due to terrorism and thus is a fear of huge loss�Acceptability of NGOs in FATA�Conflict among the stakeholders in selection of beneficiaries
24

SWOT Analysis of Horticulture in Bajaur and Mohmand (Source, Agency Dev. Plan USAID FDP-LD)
Strengths Weaknesses
Approved FATA Horticulture Policy�Defined role of public & private sector in the development of horticulture�Different agro ecological zones for wide range of high value crops� Commercial growers for fruit and vegetables available.� Source of high income� Horticulture specialists in the AgriculturalUniversity & Agricultural Research System� Specialized horticulture development board at national level.�Approved USAID document on pesticides (PERSUAP) for FATA� Low cost labor/family labor available
Lack of regulations and certification system in FATA and farmers have poor resources�Non availability of quality plant material, vegetable seed and new varieties.�Subsistence production due to small farm size and scarcity of water� Lack of processing, grading, packaging & cold storage facilities.� Farm to Market roads.�Comprehensive data for the sector is not available.� Traditional, out-dated delivery mechanisms� No grading and labeling of the produces.��Animal grazing damage fruit trees
Opportunities Threats
First emphasis is on local market, then national & finally export market. Potential role of private sector in packaging and processing industries establishment� Establishment of commercial fruit farm�Establishment of pesticides testing laboratory� Promotion of drip irrigation and organic farming in high value vegetables and fruits �Establish Private fruit nursery Innovations in horticulture production and marketing techniques�Value Chain Analysis�Plastic Tunnel farming for off season vegetables.� Research on horticulture crops in FATA
Access to Priority Areas due to security� Reluctance of resource persons to work in FATA due to security� Selection of beneficiaries for intervention� Conflict causes blockage of roads hamper in time supply of inputs and disposal of perishable vegetable and fruit� Uncertainty of donor� fund flow� The ongoing developmental activities can be hampered any time due to terrorism � Acceptability of NGOs in FATA�Failures in plastic tunnel farming occur during seed germination stage
25

SWOT Analysis of Livestock and poultry in Bajaur and Mohmand (Source, Agency Dev. Plan USAID FDP-LD)
Strengths Weaknesses
Livestock asset for women and landless�Livestock integral part of livelihood.�High level of interest of farmers in improving livestock production.� The private sector has a greater responsibility for vet service delivery and marketing.� Opportunities for investment in Dairy development and livestock-based industry� Customary rights in grazing areas are the motivational forces for resource sustainability.� Training sources in public and private sector.� Presence of livestock extension staff in field are suitable for small and large ruminants� Government main focus on this sub sector
Degradation of pasture/ range land� Shortage of green fodder in winter�Animals are poorly nourished, disease and parasite infestation.� High cost of feed for Poultry rearing� Role of women in the sector ignored� Lack of improved livestock breed.� Animal market sites lack facilities.� Farmers access to veterinary services�Veterinary facilities are underutilized.� Illegal smuggling of animals causes transboundry transmission of diseases.� Lack of comprehensive data for the sector� Limited Poultry expertise
Opportunities Threats
Potential role of private sector in value addition of dairy products�Health and nutrition management�Proper planning and Management of pasturesLocal tradition in pasture management�Introduction of varieties of fodder�Strengthening livestock farmers association�Training private livestock extension workers�Farmer Field School for extension services�Integrated approach for livestock management�Fattening of small ruminants�Linkages of farmers to livestock trading areas.�Support market linkages and train farmers in enterprise development� Value chain Analysis of livestock & products
Epidemic disease occur in livestock and poultry and a fear of great losses� Where capacities exist, the security situation in some agencies hinders field service delivery.� At the administrative level, poor control over the cross-border movement of animals also affects the local livestock economy.� In case of becoming IDPs, losses to animals due to slaughtering or selling on low price or theft may occurs� With the introduction of exotic breed, thedisappearance of local indigenous breed in FATA
26

SWOT Analysis of Perennial Surface Irrigation Schemes in Bajaur and Mohmand (Source, Agency Dev. Plan USAID FDP-LD)
Strengths Weaknesses
Potential for further development of perennial surface irrigation as balance water is available.Adequate and relevant experience in participatory irrigation management is available in KPK and GB.Cost –effective both in capital and O& M if effectively constructed and managed.No energy requirement as these can be operated as gravity –flow schemes.Storage of excess water in small ponds.
Current designing procedures are having in –built weaknesses where rights of downstream users’ are not considered while developing surface irrigation schemes.Schemes are designed to distribute perennial water thinly rather than enhancing productivity-low designed cropping intensity.Farm water productivity is not the design objective.No consideration for storage of excess water.Low value assigned to perennial surface waters.
Opportunities Threats
Perennial surface irrigation schemes can be designed effectively with higher irrigation efficiency and productivity.Pipe-flow water conveyance irrigation system using PE/PVC pipes can eliminate losses and reduce O & M cost.Drip and sprinkler irrigation system can improve cropping intensity and productivity by eliminating losses and improving water uniformity.
Resistance from engineers of public sector institutions for adopting integrated strategy Lack of awareness and motivation of public-sector institutions in integrating irrigation with livelihood Lack of ownership among communities to take over O&M of schemes Lack of enforcement for recovery of capital and operational cost for irrigation waterAreas are not fully recovered from militancy and any future military action would affect investment.
27

SWOT Analysis of Perennial Groundwater Irrigation in Bajaur and Mohmand (Source, Agency Dev. Plan USAID FDP-LD)
Strengths Weaknesses
Perennial groundwater irrigation schemes provide water on demand.Provides water during droughts to meet shortfall in rainfall and/or surface water.Managed groundwater schemes individually having minimal or no conflicts on distribution of water. Generate new livelihoods for unemployed youths in areas having balance groundwater.
Knowledge support is not provided to farmers for design, installation and operation of groundwater schemes.Provision of free electricity resulted in wasteful use of waterGroundwater abstraction in dry and average year is more than recharge.Inefficient delivery and application of water
Opportunities Threats
Perennial groundwater irrigation schemes can be designed effectively with higher irrigation efficiency and water productivityPipe-flow water conveyance irrigation system using PE/PVC pipes can eliminate losses and reduce O&M cost.Drip and sprinkler irrigation systems can improve cropping intensity and water productivity by eliminating losses and improving water uniformity
Availability of free electricity for further development is going to increase burden onFATA and wasteful use of scarce and finite resourceInefficient pumping systemsFurther groundwater abstraction would worsen lowering of water table and mining of groundwaterNon-sustainability of groundwater irrigation schemes until and unless it is considered a trust
28

COORDINATIONTo complement and avoid overlapping and duplications
FDMA / NDMAFATA SecretariatConcerned Directorates of FATA Political Administration11 Corps Humanitarian partners

IMPLEMENTATION MECHANISM
Directorates of agriculture, livestock, Irrigation and hydel power, Forests and Fisheries
Farm Services Centers
Local NGOs
CSOs/ CBOs

Thank you31