greenbook part 2 - federal reserve system · tilting) and lightly cleaned (to remove dark spots...
TRANSCRIPT
Prefatory Note The attached document represents the most complete and accurate version available based on original copies culled from the files of the FOMC Secretariat at the Board of Governors of the Federal Reserve System. This electronic document was created through a comprehensive digitization process which included identifying the best-preserved paper copies, scanning those copies,1
and then making the scanned versions text-searchable.2
Though a stringent quality assurance process was employed, some imperfections may remain. Please note that some material may have been redacted from this document if that material was received on a confidential basis. Redacted material is indicated by occasional gaps in the text or by gray boxes around non-text content. All redacted passages are exempt from disclosure under applicable provisions of the Freedom of Information Act. 1 In some cases, original copies needed to be photocopied before being scanned into electronic format. All scanned images were deskewed (to remove the effects of printer- and scanner-introduced tilting) and lightly cleaned (to remove dark spots caused by staple holes, hole punches, and other blemishes caused after initial printing). 2 A two-step process was used. An advanced optical character recognition computer program (OCR) first created electronic text from the document image. Where the OCR results were inconclusive, staff checked and corrected the text as necessary. Please note that the numbers and text in charts and tables were not reliably recognized by the OCR process and were not checked or corrected by staff.
Content last modified 6/05/2009.

Confidential (FR) Class III FOMC
Part 2 May 1, 2002
CURRENT ECONOMICAND FINANCIAL CONDITIONS
Recent Developments
Prepared for the Federal Open Market Committeeby the staff of the Board of Governors of the Federal Reserve System

Confidential (FR) Class III FOMC
May 1, 2002
Recent Developments
Prepared for the Federal Open Market Committeeby the staff of the Board of Governors of the Federal Reserve System

Domestic NonfinancialDevelopments

Domestic Nonfinancial Developments
Overview Economic activity increased rapidly early this year, with real GDP now estimated to have risen at an annual rate of about 5-3/4 percent in the first quarter. The improvement in economic conditions extended to the industrial sector, where production posted broad-based gains as inventory adjustments slowed and spending on high-tech goods and consumer durables turned up. Although the demand for labor has firmed a bit of late, hours fell again in the first quarter, implying another substantial increase in productivity. Despite the boost to headline inflation from the recent surge in energy prices, core measures of inflation remain subdued.
Real Gross Domestic Product According to the advance estimate prepared by the Bureau of Economic Analysis (BEA), real GDP increased at an annual rate of 5.8 percent in the first quarter. The acceleration from the pace of nearly 2 percent recorded in the fourth quarter was driven by a marked slowing in the rate of inventory liquidation. Final sales increased at about a 2-1/2 percent rate in the first quarter, as sizable increases in spending by households and governments were partially offset by another decline in business fixed investment and a further sharp deterioration in real net exports. At this stage, we do not anticipate any change to the advance GDP estimate. This assessment takes into account the monthly construction data, which were released on May 1 and were weaker than the BEA had assumed, as well as our anticipation of a small upward revision to real net exports.
Labor Market Developments Although the large declines in payroll employment appear to have ended, the economy has not yet begun to generate robust employment gains. Private nonfarm payroll employment was essentially flat in February and March after having fallen 277,000 per month on average from October to January. The unemployment rate rose 0.2 percentage point in March, retracing most of its decline in January and February.
Nevertheless, some leading indicators of labor market conditions did improve in March. The manufacturing workweek rose 0.4 hour, much of the rise due to increased overtime; the factory workweek is now up 3/4 hour from its trough in November. In addition, employment in the help-supply industry rose 69,000 in March after a smaller rise in February; the back-to-back increases in this sector represent the first gains in nearly a year and a half. Though classified as a services industry, help supply provides many of its workers to the manufacturing sector, where employment losses have abated of late as well.
Turning to April, our reading of initial claims for unemployment insurance in recent weeks has been complicated by the federal temporary extended

II-2

II-3

II-4

II-5
unemployment compensation program (TEUC). The law required some TEUC claimants to file new claims for state unemployment benefits even though they were not eligible for further regular state benefits, and this contributed to initial claims jumping to 492,000 in the week ended March 30.1 By the week ended April 20, claims had fallen back to 421,000.2 The TEUC program also appears to have raised the level of insured unemployment, as individuals nearing the expiration of their state benefits—but assured of up to thirteen additional weeks of benefits from TEUC—may have searched less intensively for jobs than they otherwise would have. The data provided by the Employment and Training Administration show that some states continued to report the filing of TEUC-induced initial claims for the week ended April 20, but the sharp drop-off in claims since the end of March leads us to believe that the influence of TEUC on initial claims will largely disappear within the next few weeks. Nonetheless, the effect of the program on the unemployment rate is likely to persist through the end of the year.
Although the exact effect of the TEUC program is difficult to gauge, we think that most of the recent rise in initial claims and insured unemployment reflects this special factor rather than a pickup in the pace of layoffs. Indeed, layoff announcements compiled by the outplacement firm Challenger, Gray, and Christmas, Inc., and by Board staff have declined from the peaks recorded in September and October. In March, the Challenger series stood at about the average level prevailing during the first half of last year. Over the eight months in which it has been compiled, the Board staff’s layoff series has trended downward, broadly in line with the Challenger series, and was at a low level in April.
Other indicators of developments in the labor market have been mixed of late. The help-wanted index inched up in March but is little changed from its trough in November. Current employment conditions, as measured by the Conference Board, have firmed only a little in recent months. However, expectations of employment conditions, as measured by both the Michigan Survey Research
1. Specifically, under the TEUC law, individuals whose “benefit year” expired after March 15, 2001, are eligible to receive TEUC benefits if they file a new claim for regular UI benefits between March 15, 2001, and the end of this year, when the TEUC program ends. The “benefit year” is the twelve months following the first payment of UI benefits. The TEUC program extends the duration of unemployment insurance benefits by half the length of state benefits. For the week ended April 6, persons receiving benefits from the TEUC program numbered 1.2 million, approximately the number receiving assistance one month after the enactment of a similar program in November 1991.
2. Beginning with the April 11 unemployment insurance release, the Employment and Training Administration began seasonally adjusting initial claims and insured unemployment using a procedure developed at the Board. Revised data show the rise and fall in both initial claims and insured unemployment in the last two quarters to have been less precipitous than originally published.

II-6
Center and the Conference Board, have improved significantly and have retraced all their losses since the middle of 2000.
The Bureau of Labor Statistics will release its advance estimate of productivity for the first quarter on May 7. Based on the NIPA output data and the available data on hours, we estimate that output per hour in the nonfarm business sector increased at an annual rate of about 8-1/2 percent in the first quarter after having risen more than 5 percent in the fourth quarter—making the two-quarter gain the largest since the early 1980s. Rapid increases in productivity in the initial
Labor Output per Hour(Percent change from preceding period at compound annual rate;
based on seasonally adjusted data)
Sector 20001 20011,4 2001 2002
Q3 Q44 Q14
Nonfarm businesses All persons2 2.6 2.0 1.1 5.5 8.4 All employees 2.3 2.0 1.2 5.8 7.3
Nonfinancial corporations3 2.9 2.7 .9 10.5 n.d.
1. Changes are from the fourth quarter of the preceding year to the fourth quarter of the year shown.
2. Includes non-employees (published definition). 3. The nonfinancial corporate sector consists of all corporations doing business in
the United States with the exception of banks, stock and commodity brokers, and finance and insurance companies; the sector accounts for about two-thirds of business employment.
4. Staff estimate.
quarters of an economic upturn are not unusual because employers, having hoarded labor during the downturn, can increase output without a similar increase in hours. But the recent gain in productivity has been greater than historical relationships would suggest, thereby raising a number of possibilities. First, businesses may have been surprised by the strength of demand during the winter. Moreover, they may still be uncertain about the durability and vigor of the recovery going forward. If so, the recent productivity performance would represent only a temporary departure from its longer-term structural trend. Some evidence that businesses—particularly non-manufacturing firms—were surprised by the upturn in demand appeared in a recent survey conducted by the National Association of Business Economists. More than half of the respondents reported that demand since October has exceeded the expectations that they formed in October, and three-fourths of those whose demand exceeded expectations reported that they had met the increase in demand by increasing productivity. However, we doubt that all of the recent productivity performance

II-7
can be attributed to these factors. Thus, we are also inferring that the rate of increase in structural productivity has been faster than we previously assumed.
Industrial Production Output in the industrial sector rose 0.7 percent in March, its third consecutive monthly gain. Increases were widespread across market groups and among industries. For the first quarter as a whole, production expanded at an annual rate of 2-1/2 percent after having dropped nearly 7 percent in the fourth quarter of 2001. Capacity utilization in manufacturing rose half a percentage point in March, to about 74 percent, but remains 7 percentage points below its long-run (1967 to 2001) average.
The production of motor vehicles averaged 12.2 million units (annual rate) in the first quarter and apparently was slightly above this level in April. With days’ supply of vehicles near comfortable levels for GM and Ford, and somewhat lean for other manufacturers, assemblies are scheduled to remain above 12 million units in May and June. Elsewhere in transportation, the production of aircraft and parts fell again in March; for the first quarter as a whole, output dropped at an annual rate of about 30 percent, following a similar decline in the fourth quarter of 2001.
.
Production of Domestic Autos and Trucks (Millions of units at an annual rate except as noted; FRB seasonal basis)
Item 2001 2002
Q3 Q4 Q1 Jan. Feb. Mar. Apr. 1
U.S. production 11.6 11.6 12.2 12.1 12.3 12.1 12.4 Autos 4.7 4.8 5.2 5.1 5.5 5.2 5.3 Trucks 6.9 6.8 6.9 7.1 6.8 6.9 7.1
Days' supply2
Autos 49.1 38.3 51.1 49.4 51.2 47.9 n.a. Light trucks3 74.0 52.3 61.8 65.6 60.0 61.6 n.a.
Inventories4 2.69 2.27 2.41 2.34 2.42 2.41 n.a.
Note. Components may not sum to totals because of rounding. 1. Production rates reflect Ward’s Communications’ latest estimates for April. 2. Quarterly average calculated using end-of-period stocks and average reported sales. 3. Excludes medium and heavy (classes 3-8) trucks. 4. End-of-period stocks; excludes medium and heavy (class 3-8) trucks. n.a. Not available.

II-8

II-9
The production of high-tech goods increased 1.4 percent in March. During the first quarter, high-tech output surged at an annual rate of 17 percent, driven by a recovery in the production of semiconductors. The strength of the revival in this industry going forward is uncertain. The book-to-bill ratio for semiconductor equipment manufacturers in March exceeded 1 for the first time since November 2000. Industry contacts indicate that inventories held by customers are at desirable levels, except for some segments of the communications equipment industry. They caution, however, that a significant share of this recent increase in orders might be the result of inventory restocking rather than a sustained pickup in demand for downstream equipment.
The recent performance of industries downstream from semiconductors has been mixed. The output of computers rose at an annual rate of nearly 20 percent in the first quarter. Although the production of communications equipment rose in March for the first time since September 2000, M3 orders fell substantially in March, and industry contacts remain pessimistic about prospects for demand in the near term.
The output of consumer durables other than motor vehicles has risen appreciably in recent months, in part because of a sharp rise in the production of appliances. In response to both the continued strength in housing starts and lean inventories, the production of construction supplies has also increased noticeably. Meanwhile, the production of business equipment has been moving sideways after having fallen considerably in 2001.
The few available data for April point to another increase in monthly production. The weekly physical product data should contribute about 0.2 percentage point to the change in IP, mainly on the strength of motor vehicle assemblies and electricity generation; excluding these two industries, the weekly physical product data have no net effect on IP growth. The staff’s series on real adjusted durable goods orders fell 2-1/2 percent in March but rose 2-1/2 percent in the first quarter as a whole.3 The Institute for Supply Management’s diffusion index of new orders retreated in April from the fifteen-year high reached in March but remained comfortably within the region associated with an expanding industrial sector. The new orders index from the Business Outlook Survey conducted by the Federal Reserve Bank of Philadelphia, which has also proved useful as an indicator of near-term manufacturing output, increased in April and has been positive for four consecutive months. By contrast,
3. The number of large semiconductor manufacturers choosing not to participate in the M3 survey increased in March. As a consequence, the Census Bureau can no longer produce monthly estimates of semiconductor shipments, orders, and inventories, and the durable goods aggregates no longer include semiconductor data. We have adjusted our orders series to remove semiconductor orders from previous months. Because semiconductors are not considered capital goods, this change has no effect on shipments and orders of nondefense capital goods.

II-10

II-11
New Orders for Durable Goods (Percent change from preceding period except as noted; seasonally adjusted)
Component
Share, 2001:
H1 (percent)
2001 2002
Q4 Q1 Jan. Feb. Mar.
Total orders 100.0 1.1 .6 .9 2.7 -.6
Adjusted orders1 71.0 -1.4 2.2 3.3 -.9 -2.6 Computers 4.0 8.5 -.4 4.5 -3.2 -3.3 Communication equipment 3.0 4.3 4.5 12.2 1.3 -15.1 Other capital goods 23.0 -2.9 -.7 -1.5 1.7 -1.7 Other2 37.0 -1.9 4.2 5.4 -2.3 -2.1
Memo: Real adjusted orders . . . -.6 2.6 3.1 -.6 -2.5
Excluding high tech . . . -2.1 2.6 3.5 -.8 -2.9
1. Orders excluding defense capital goods, nondefense aircraft, and motor vehicle parts.
2. Includes primary metals, most fabricated metals, most stone, clay, and glass products, household appliances, scientific instruments, and miscellaneous durable goods.
. . . Not applicable.
manufacturing layoff announcements rose in April after having declined earlier in the year; layoffs were split evenly between the high-tech sector and manufacturers outside the high-tech sector.
Business Inventories According to the advance GDP release, real nonfarm inventories excluding motor vehicles contracted at an annual rate of $39 billion in the first quarter after having fallen $78 billion in the fourth quarter. The BEA estimate incorporates the book value data for the manufacturing and trade sector in January and February, which showed a liquidation (excluding motor vehicles) of $48 billion, on average—just about half the fourth-quarter pace. The only hard data for March are for durable goods manufacturers, where stocks fell $34 billion in book value terms, largely because of a steep drop in aircraft inventories; the liquidation in March was about the same as the average since the middle of last year.
Although some industries still appear to be weighed down by excessive holdings, the inventory situation seems to have improved over the past couple of months. Data from the staff’s flow-of-goods system, which classifies inventories by the type of product, regardless of where it is held in the distribution channel, point toward a few areas in which days’ supply ratios

II-12

II-13
Status of Inventory Overhangs
Inventory overhang Products
None evident Chemicals and products; petroleum products; stone, clay, and glass; fabricated metals; transportation equipment; instruments
Largely eliminated Electronic components (including semiconductors); computer and office equipment; textiles; lumber and wood products; rubber and plastics; industrial machinery excl. computing equipment; miscellaneous manufactures
Evident but some improvement
Apparel; furniture and fixtures; printing and publishing; primary metals
Evident and little improvement
Communications equipment; paper and products; electrical machinery excluding high-tech equipment
Source. FRB staff flow-of-goods inventory system.
remain elevated and continue to exhibit little improvement: paper products, communications equipment, and electrical machinery excluding high-tech equipment.4 For some other products, inventories remain high but have retreated, most notably apparel, furniture and fixtures, printing and publishing, and primary metals.5 By market group, the days’ supply ratios for consumer goods and for intermediate products (particularly construction supplies) have fallen sharply in recent months, and excessive inventories appear to have been eliminated. The inventory-consumption ratio for materials has improved considerably, but the days’ supply measure for business equipment, although down from its recent peak, remains elevated.
4. The FRB staff’s flow-of-goods system measures changes in inventories by tracking the flow of goods in the economy. The system divides the output from the staff’s industrial production indexes into more than seventy product categories. For each product category, the system estimates the supply of goods flowing into the economy—that is, domestic production plus imports. The system then estimates how much of the supply flows out, whether as final demand, including exports, or as inputs for other goods. The difference between the amount flowing in and the amount flowing out represents that change in inventories. We find inventory accumulation if inflows exceed outflows and inventory liquidation if outflows exceed inflows.
5. In the March 2002 Greenbook, industrial machinery excluding computing equipment was included in the “evident but some improvement” category, but this industry has since largely eliminated its overhang problem.

II-14

II-15
Consumer Spending Consumer spending has been well maintained of late after having posted big increases around the turn of the year. Expenditures on motor vehicles have been robust—albeit not as high as in the fourth quarter—and outlays on other goods and services have expanded briskly. All told, real PCE rose at an annual rate of 3-1/2 percent in the first quarter; excluding motor vehicles, PCE was up at a 6 percent pace.
Sales of light motor vehicles edged up in March to an annual rate of 16.7 million units, bringing the average for the first quarter to 16.3 million units, about 1 million units higher than the automakers had anticipated at the beginning of the year. Industry contacts report that sales were brisk in April. Since the middle of September, the automakers have supported sales through aggressive incentive packages, which are expected to persist in the near term. These incentive programs are also reflected in the above-average assessments of car-buying conditions in the Michigan Survey Research Center’s report on consumer sentiment. Consumers have cited good prices and interest rates as reasons why it is a good time to buy a car.
Outside of cars and trucks, the rise in consumption in the first quarter was broad based. Spending for durable goods other than motor vehicles advanced at an annual rate of more than 14 percent—a pace not seen since early 2000—led by sizable increases in spending on computers and household furnishings. In addition, expenditures for nondurable goods rose at a rate of nearly 8-1/2 percent, with particularly large increases in outlays for food and apparel. Outlays for services also were relatively strong, up at a 3-3/4 percent pace, in part because of a rebound in spending on energy services.
The recent strength in consumer spending has been driven in part by sizable gains in income. Indeed, according to the BEA’s advance estimate, real disposable income rose at an annual rate of 10-1/2 percent in the first quarter. This increase reflected in large part the effects of last year’s tax legislation and cost-of-living adjustments in government transfer programs, and it brought the increase in real DPI over the year ending in the first quarter to about 4 percent. Moreover, the incoming data on personal income tax collections in April suggest that real DPI may have risen even more rapidly in the first quarter than

II-16

II-17

II-18

II-19
the BEA figure indicates.6 In the first quarter, the wealth-to-income ratio was little changed at 5.3, about where it has been since early 2001.
The Michigan Survey Research Center’s overall index of consumer confidence rebounded early this year to levels last seen in late 2000, while recent readings from the Conference Board’s index are the highest since mid-2001. Although both confidence measures ticked down in April, the indexes stand close to their averages over the past decade, at levels consistent with moderate increases in overall consumer spending.
Housing Markets Starts of single-family homes jumped to a 23-year high of 1.47 million units in February but fell back in March, to an annual rate of 1.30 million units. Permit issuance for single-family construction—adjusted to include construction in areas where permits are not required—decreased in March to about the same level as starts. Meanwhile, the backlog of unused single-family permits edged down toward the middle of its range over the past year and a half. The February peaks in starts and permits appear to be outliers, even when compared with the brisk pace of activity in recent years; unusually mild weather conditions probably explain part of the jump, and a return to normal weather in March drove part of the dropoff in starts in that month. Nevertheless, with support from relatively low mortgage rates, a high backlog of permits, and a tight inventory level, the pace of starts in March remained above the average for last year.
The contract rate on thirty-year fixed-rate conventional mortgages now stands a bit below 7 percent, and initial rates on adjustable-rate mortgages are a bit below 5 percent. Partly reflecting these low rates, homebuying attitudes, as measured by the Michigan survey, remained robust in April, and the latest four-week average from the Mortgage Bankers Association index of mortgage applications for home purchases was at a record high.
New home sales have moderated from the very strong pace in late 2001 and in March stood at an annual rate of 878,000 units. Existing home sales fell 8-1/4 percent in March, to an annual rate of 5.4 million units, following a record
6. Under the BEA’s normal procedures, its initial estimate of personal tax payments in the first quarter is based on an assumption about April’s final payments, which are spread through the year. This year, April collections are much lower than would be consistent with the BEA’s assumption. In the Greenbook projection we therefore assume that the BEA will revise up the change in real DPI for the first quarter to an annual rate of about 14 percent and will raise the saving rate to 2-3/4 percent, compared with its advance estimate of about 2 percent. However, on April 26, the BEA also indicated that state unemployment insurance records point to a $90 billion smaller increase in wages and salaries in 2001 than is currently embedded in the NIPA.

II-20

II-21
high in January and a surprisingly strong level in February. Some of the movements in home sales this year may owe to shifts in the timing of contract signings and closings caused by the events of September 11. Sales of new homes, which are recorded at signing, peaked in November and December; and sales of existing homes, which are recorded mostly at closing, piled up two months later. These postponements transferred sales into the winter months when seasonal factors—which anticipated weak sales—provided a large boost. All told, the solid pace of sales of both new and existing homes in March suggests continued strength in housing demand.
House prices have been rising briskly of late, likely reflecting the strength in demand. Among the various measures of house price increases, the constant-quality and repeat-sales indexes are probably the most useful.7 When deflated by the PCE price index, the constant-quality index of new home prices rose 4-1/2 percent over the year ending in the first quarter, the most rapid real increase in the past twenty years.8 In the fourth quarter of last year, the real repeat-sales index of existing home prices increased 5-3/4 percent from a year earlier.9 This rise in the repeat-sales price index was among the more rapid in the history of the series, but it was slower than the year-over-year increases recorded in each of the four preceding quarters. The deceleration in repeat-sales prices was especially pronounced in the Pacific region.
Turning to the multifamily sector, starts rose about 9 percent in March to an annual rate of 343,000 units, as construction rebounded following a drop in February. The average level of starts in the first quarter was 340,000 units, similar to the pace of construction seen over 2001 as a whole. Available indicators suggest that market conditions for multifamily rental units have deteriorated over the past year. In the first quarter, the vacancy rate for multifamily rental units rose to the highest level since the late 1980s, and was only a touch below the peak in the 34-year history of the series. Furthermore, property values for multifamily housing did not increase last year for the first time since mid-1993, and the average year-over-year increase in nominal rent,
7. Transaction prices—such as the average and median prices of new homes—can be misleading because they register the effects of compositional changes both in the quality of the houses sold and in the geographic composition of sales, which can be a problem owing to the substantial price differences among regions. The average and median prices of existing homes can also reflect changes in the quality of homes sold, but they are computed with fixed regional weights.
8. The constant-quality new home price index uses regression techniques to estimate how the price has changed for a house with structural and locational characteristics typical of houses built in 1996, the base period for the index.
9. The repeat-sales price index for existing homes computes the change in house prices from pairs of prices that are generated when the same house is resold or refinanced. However, this index reflects any factors that alter the value of the property between the two “sale” dates, including improvements, structural deterioration, or changes in the neighborhood.

II-22

II-23
as measured by the National Real Estate Index, was only 3/4 percent, the smallest rise since early 1992.10 More recently, anecdotal reports have noted rent concessions by landlords in several metropolitan areas.
Business Fixed Investment
Equipment and software. Real outlays on equipment and software were about unchanged in the first quarter after having fallen at an annual rate of about 5 percent in the fourth quarter. Real spending for computer equipment rose at an annual rate of nearly 40 percent—the second large quarterly increase in a row— and outlays for communications equipment were about flat after a series of huge declines. Business spending on both motor vehicles and aircraft decreased sharply. Excluding the high-tech and transportation categories, spending rose moderately.
New orders for nondefense capital goods excluding aircraft fell more than 3 percent in March after having posted small increases in January and February. Although the recovery in real computer spending appears to be on track, bookings for communications equipment plunged in March after two months of increases and once again have fallen below shipments. Outside of the high-tech sector, orders (excluding aircraft) decreased nearly 2 percent in March and were down nearly 1 percent for the first quarter as a whole. These declines are fully explained by a steep drop in orders for engines and turbines. Due to the long delivery lags for engines and turbines, however, the decline in their orders conveys little information about equipment spending in the current quarter.
Business demand for motor vehicles seems to be firming in the most recent months. Fleet sales of light vehicles moved up again in March and, at an annual rate of 3 million units, were only a touch below the average for all of last year.11
Sales of medium and heavy trucks remained flat in March at an annual rate of 460,000 units, the same rate seen in both the fourth quarter and the first quarter.
Orders for the largest trucks (class 8 trucks) skyrocketed in March. Industry analysts attribute this run-up to a shift in the timing of purchases to avoid buying trucks with modified engines to meet EPA requirements. In a court settlement, manufacturers agreed to begin selling engines as of October 1, 2002, that pass
10. This rent index differs considerably from the CPI rent index. The NREI series measures rents as reported by institutional investors in apartment buildings, whereas the CPI index covers not only apartment buildings but also small properties and single-family homes. From mid-1992 through early last year, the NREI index increased much more rapidly than the CPI rent index, but it has since decelerated sharply.
11. Big Three fleet sales are reported to us on a confidential basis; sales by other firms are estimated by the staff.

II-24

II-25

II-26

II-27
emission requirements when in actual operation or to face fines of about $7,000 per engine sold. Trucking firms believe that these new engines will deliver poorer performance and be more costly to maintain.
Nonresidential construction. Spending on nonresidential construction declined sharply again in the first quarter, with sizable decreases in expenditures for industrial structures, office buildings, lodging facilities, and drilling and mining.12 Moreover, advance indicators point to further weakness. For example, according to estimates from Torto Wheaton, vacancy rates for office and industrial buildings continued to rise sharply in the first quarter, owing in part to a further contraction in occupied space for both types of structure. The deterioration in the office sector has been especially pronounced in high-technology areas, where space is available for sublease at very low rent. Conditions in the non-office commercial sector have also worsened, as property values and rents for both retail space and warehouses fell appreciably in the fourth quarter.
Expenditures for drilling and mining fell at an annual rate of 44 percent in the first quarter, after an even larger drop in the fourth quarter. Drilling activity for petroleum and particularly natural gas has not yet responded to higher energy prices. One reason may be that, despite the recent upturn, natural gas prices remain far below the levels seen early last year. In recent months, the number of oil drilling rigs in operation has been about flat, and the number of gas rigs has declined. Construction outlays by public utilities declined 2 percent in the first quarter.
Government Sector
Federal sector. The federal government recorded a $64 billion deficit in March, a considerably larger deficit than was recorded last year, mostly reflecting weak receipts. Overall spending was restrained by declines in net interest payments, which offset robust increases in most other categories—particularly defense and income security.13
Receipts in March were about 15 percent lower than in March of 2001, with weakness exhibited across the board. Individual income and payroll taxes were down almost 12 percent, reflecting a surge in individual tax refunds, as well as declines in withheld and nonwithheld tax payments. Corporate tax payments were well below last year’s levels, as gross payments fell and refunds rose. The
12. After taking into account the construction data for March, we estimate that real spending on nonresidential construction declined at an annual rate of almost 18 percent. The BEA’s advance estimate had included a 20 percent decline.
13. Part of the increase in income security reflects a surge in the earned income and child tax credits, the refundable portion of which is deemed outlays.

II-28

II-29

II-30

II-31
decline in corporate tax receipts reflects a combination of weak corporate profits and the recently enacted investment expensing provisions, which retroactively lowered corporate tax liabilities back to September 11, 2001.
According to Daily Treasury Statements, the shortfall in receipts continued into April. Nonwithheld individual income tax payments, which are largely final payments on 2001 tax liabilities, were well below the level recorded last year. Cumulative receipts by the end of April were about 35 percent lower than last year. Although returns are still being processed, payments in May are unlikely to be able to make up much of this shortfall.
This downturn in final payments is much larger than can be explained by changes in the tax law, and collections are significantly lower than the CBO and the OMB had projected. While confirming data will not be available for some time, we suspect that a drop in capital gains realizations is a key factor behind the shortfall. One piece of evidence pointing in this direction is a sharp decline in capital gains realizations from mutual funds recorded for 2001. Although realizations from mutual funds represent only a small share of taxable realizations, they have been a useful indicator of total capital gains realizations in recent years.
The President submitted a $27 billion supplemental spending package for fiscal year 2002, with $14 billion allocated to defense. We expect the Congress to pass some form of the bill this spring. The House has passed the Administration’s budget request for fiscal 2003; the Senate has yet to pass a budget resolution for 2003.
State and local governments. According to the BEA’s advance estimate, real spending on consumption and gross investment by state and local governments increased at an annual rate of 5-1/2 percent in the first quarter, although subsequent data for construction suggest that the increase will be revised down to about 4-1/4 percent. After factoring in the new data, we estimate that real spending on construction rose at an annual rate of nearly 20 percent in the first quarter, a bit more than the increase over 2001 as a whole. Real outlays for consumption items, which represent the current expenditures of these governments, rose 2-1/4 percent (annual rate) in the first quarter, down from a gain of nearly 4 percent during the second half of 2001; the slowing probably owed in part to budget-cutting actions in many states and localities.
For several quarters, states have been reporting reduced revenue collections along with overruns in spending, particularly for Medicaid, and many states projected budgetary deficits in their general fund accounts if no actions were taken. However, most states have planned or undertaken remedies, and the National Conference of State Legislatures reported in mid-April that states have generally been successful in addressing pressures on this year’s budgets. For

II-32

II-33
fiscal 2002, which ends on June 30 in most states, forty states made or expect to make expenditure cuts, almost forty states tapped or expect to tap other funds (rainy-day, special/dedicated, tobacco, and other), and eight states raised or expect to raise taxes or fees or both. Many state analysts think that the weakness in revenue collections will bottom out in the second quarter of 2002, and they are looking for receipts to begin to show gains this summer. Even so, the level of receipts is expected to remain subdued, and states continue to be concerned about fiscal 2003. Hence, along with budget cuts and fund transfers, more than half the states are planning to raise taxes or fees next year.
Prices Although higher energy prices pushed up headline consumer price inflation in March, inflation generally looks to be on a downward trajectory. Both the overall CPI and the PCE chain-type price index have decelerated notably over the past year. In part, the smaller increases reflect the sharp declines in energy prices over most of this period: The PCE chain-type price index increased only 0.8 percent over the twelve months to March, while the CPI increased 1.5 percent. Excluding food and energy, inflation has also fallen over the past year. This slowing has been more pronounced in the PCE price index than in the CPI. Over the past twelve months, the core PCE price index increased just 1.1 percent, down from a 1.7 percent increase over the preceding twelve-month period. The core CPI has increased 2.4 percent over the past twelve months, down from a 2.7 percent increase over the preceding year.
Consumer energy prices rebounded after their substantial declines last year. Reflecting a surge in gasoline prices, the CPI for energy jumped 3.8 percent in March, and weekly data point to further increases through early April. These recent gasoline price hikes have totaled about 30 cents per gallon since early March, reflecting higher crude oil costs, strong demand, and the shutdown of two refineries in the Midwest, which has created a major shortfall in inventories of the reformulated gasoline specific to that region. Nevertheless, overall U.S. inventories of gasoline, including stocks of summer-blend reformulated gasoline, remain normal for the season. As a result, futures prices suggest that gasoline prices have likely peaked, and indeed retail gasoline prices have already eased a penny or two per gallon since early April. Nonetheless, on a monthly-average basis, surveys indicate substantial increases in both wholesale and retail gasoline prices in April. Consumer natural gas prices moved up 0.8 percent in March, retracing part of a decline in February. Although natural gas inventories remain at record high levels for the season, spot prices have risen about 70 cents per million BTUs (more than 20 percent) from their level in mid-March. The increase in spot prices may owe to market participants’ expectations of higher demand for gas by industry and electric utilities in light of the strength of the economic recovery thus far.

II-34

II-35
Retail food prices rose at an annual rate of 3 percent over the first three months of the year. Consumer prices for vegetables surged over this period, reflecting both lower winter acreage and some mediocre growing conditions. However, spring acreage, which began to be harvested in early April, is about in line with the previous spring, and during April, new supplies have pushed down the staff’s weekly index of vegetable prices by more than 50 percent. Similarly, the CPI for meats, poultry, fish, and eggs jumped in March, but this increase is likely to be short lived given that spot prices for beef, pork, and poultry have fallen sharply over recent weeks. Prices for other food items, including restaurant meals, have been well contained so far this year. Over the twelve months to March, the CPI for food rose 2.6 percent, about 1/2 percentage point less than over the previous year.
Consumer prices other than food and energy have remained subdued. The core CPI edged up 0.1 percent in March after a 0.3 percent rise in February. Goods prices have been especially soft. Prices of apparel have increased over the past two months, but these reported increases likely reflected difficulties in seasonal adjustment; apparel prices are down 3 percent over the past year. Prices of new and used motor vehicles have continued to fall as well. By contrast, prices of non-energy services have accelerated over the past year, driven by the housing sector. Owners’ equivalent rent and tenants’ rent have both increased 4-1/2 percent over the past twelve months, and owners’ equivalent rent in particular has accelerated notably. The rate of inflation of services other than energy and housing has picked up slightly over the past year.
The PCE price index for items other than food and energy has continued to rise by less than the core CPI. As noted above, the PCE index decelerated notably more over the past year, and the difference between the twelve-month changes in these two indexes, at 1-1/4 percent, is now exceptionally large. Frequently, the portions of PCE that are outside the scope of the CPI and for which market-based prices are not available can explain a large part of the different behavior of the two price measures. In the present case, however, our “market-based” core PCE price index, which omits these imputed nonmarket components, has increased at a rate similar to the official core PCE price index. Instead, differences between the core CPI and PCE price measures have been driven by three other factors, and these argue for putting more—though not exclusive— emphasis on the PCE measure.
First, the fact that the PCE index is constructed using a Fisher aggregation formula while the CPI uses a fixed-weight Laspeyres formula appears to have contributed to a slightly larger difference over the past year than it did over the previous year. The PCE index’s Fisher formula is preferable because it takes consumer substitution into account, while the CPI’s Laspeyres-based formula does not. Second, the indexes for tenants’ rent and owners’ equivalent rent have a much larger weight in the CPI than in the PCE index; thus, the notable

II-36

II-37
acceleration in these prices over the past year has had a larger influence on the CPI. Because we believe that measurement problems have generated weights for housing in the CPI that are too large, we again tend to prefer the signal coming from the PCE index.14
The third—and apparently most important—factor has been the behavior of medical services prices. PCE prices for physicians’ and hospital services are based mainly on PPIs instead of CPIs, and in recent years these two measures have diverged strikingly. Over the twelve months to March, for example, the CPI for hospital services increased 8 percent, up from a 6-3/4 percent rise over the preceding twelve-month period. By contrast, the PPI for hospital services only increased 2-1/2 percent over the past year, down from a 3-1/4 percent rise over the preceding period. For physicians’ services, the CPI has decelerated about 1 percentage point over the past year, while the PPI has decelerated nearly 3 percentage points.15 The effects of these price differences are magnified by the fact that medical services have a much larger weight in PCE because the CPI is limited to households’ out-of-pocket expenditures. In general, we think that the PPI indexes do a better job than the CPI indexes in capturing medical services prices; but because the recent differences have been so large, and because the small increases in the PPI indexes seem to be inconsistent with anecdotal evidence of rising health-care costs, we hesitate to write off the CPIs for medical services entirely.
Broader price indexes have also decelerated over the past year. The chain-type price index for GDP increased 1.3 percent over the four quarters through 2002:Q1, down 1 percentage point from the increase over the preceding year. GDP prices have been affected by last year’s drop in energy prices, but even excluding food and energy, GDP prices decelerated about 1/2 percentage point over the past year. In addition to the drop in energy prices and the slowing in core PCE inflation, GDP prices have been held down by a rapid decline in investment prices. Prices of equipment and software have decreased 2 percent over the past four quarters after having fallen about 1-1/2 percent over the preceding period. A notable deceleration in software prices can account for that
14. The weights in the CPI are derived from the consumer expenditure survey. Because the survey relies on respondents’ memory of their expenditures on many items, knowledge of the spending of other household members, and willingness to report expenditures that may be viewed as embarrassing, the survey appears to undercount expenditures on a wide variety of items. We believe that the weight of housing (and other items for which expenditures are measured more accurately) is therefore boosted by the undercounting of such expenditures.
15. For hospital services, a small part of the difference between the PPI and CPI measures reflects the fact that the PPI includes prices paid by Medicare and Medicaid, which have decelerated notably over the past year. These prices are not in the CPI’s scope because they are not paid by consumers out of pocket. For physicians’ services, the effect of Medicare and Medicaid on the PPI is not known, though anecdotal evidence suggests that a sharp deceleration in these prices could account for much of the difference between the PPI and CPI measures.

II-38

II-39

II-40

II-41
slowdown, while computer prices have declined 18 percent over the past year—the same as the decline over the previous year.
Although inflation is slowing according to all indicators, survey measures of expected inflation have continued to move up after a period of unusually low readings last autumn. According to the Michigan survey, median one-year-ahead inflation expectations were 2.8 percent in April, about the same as had prevailed last summer and well above the readings of 1 percent or lower in October and November. Longer-term inflation expectations have remained relatively low, however. The Michigan survey's median five- to ten-year-ahead inflation expectations were also 2.8 percent in April, a bit below the 3 percent levels from last summer.
Outside of the energy area, few inflationary pressures appear to be coming from earlier stages of processing. The PPI for intermediate materials other than food and energy moved up in March but is down more than 3 percent over the past year, and the PPI for core crude materials has dropped more than 6 percent over the past year. Since mid-March, industrial commodity prices have been little changed on balance after having picked up earlier in the year. The Journal of Commerce industrial price index is about unchanged since mid-March, though a rise in steel scrap prices has pushed up the metals component of the index since that time.
Labor Costs The employment cost index for hourly compensation of private industry workers increased at an annual rate of 3.6 percent over the three months ended in March. The wages and salaries component rose at a 3.7 percent annual rate, and benefits costs were up at a 4.4 percent rate.16 Over the past twelve months, the ECI for compensation increased 3.9 percent—down about 1/4 percentage point from its increase over the previous twelve-month period. Both the wages and salaries index and the benefits index decelerated a similar amount. Among the major components of benefits, employers’ health insurance costs rose rapidly again last quarter, bringing the twelve-month change above 10 percent, up from an increase of about 8 percent over the year-earlier period. But these faster increases in health insurance costs were outweighed by a slowing in the cost increases for other benefits.17 Nonproduction bonuses declined in the three months ended in March, bringing the twelve-month change in this component to
16. Rounding of index levels and separate seasonal adjustment can account for the fact that the indexes for wages and salaries and benefits were both reported to have increased more rapidly than the overall compensation index.
17. With the exception of health insurance, detail on the benefits costs are unpublished and are provided by the BLS on a confidential basis.

II-42

II-43
0.8 percent—down from a 4 percent increase over the preceding period.18
Increases in pay rates for overtime work and for alternative shifts also slowed over the past year. In addition, pension costs decelerated over the past year, as a flattening out of costs of defined contribution plans outweighed a much faster pace of payments to defined benefit plans that likely reflected the weakening in the stock market.
The increase in the ECI for health insurance costs over the past year is roughly in line with survey evidence of this year’s premium increases in private employer-sponsored health plans. Looking forward to 2003, California’s public employees retirement system—the nation’s second largest health-care purchaser behind the federal government’s FEHB program—has approved a huge 25 percent increase in premiums for its HMOs next year and a 20 percent increase for its PPOs. A variety of factors are said to be driving recent and prospective premium increases, including cuts in Medicare reimbursements that necessitate larger fee increases from other payers and a general increase in demand for medical care, including prescription drug expenditures.
Compensation per hour in the nonfarm business sector (CPH), which had surged in 2000, decelerated sharply thereafter and rose a little less than the ECI in 2001. In the first quarter, CPH likely increased at an annual rate of about 2-1/2 percent, bringing the four-quarter change to 3-1/4 percent, somewhat lower than in the ECI. The main indicator used to construct the recent CPH figures is the monthly series on average hourly earnings of production or nonsupervisory workers, which increased at an annual rate of only 2-1/2 percent over the first three months of the year. In addition, the BEA judgmentally adjusts the compensation data in light of lagged payroll information from unemployment insurance tax records; these data are much more comprehensive than average hourly earnings in that they include such forms of compensation as bonuses and the value of stock option exercises.19 These unemployment insurance records, which are available through the third quarter of last year, apparently point to very low payroll gains last year, which we interpret as suggesting that stock option exercises slowed considerably; the BEA has extrapolated those low readings going forward through the first quarter of this year, helping to account for the low CPH figures in the past few quarters.
18. Nonproduction bonuses in the ECI do not include grants or exercises of stock options. 19. The unemployment insurance data are also more comprehensive than average hourly
earnings because they are not limited to production workers and cover nearly all nonfarm establishments.

II-44

Domestic FinancialDevelopments

Domestic Financial Developments
OverviewSince the last FOMC meeting, mixed readings on the strength of the economicexpansion and comments by Federal Reserve officials led market participants totrim substantially their expectations for policy tightening. In addition, whilefirst-quarter corporate earnings reports mostly matched or exceededexpectations, they were marked by a notable lack of positive guidance on futuresales and profits. These developments reinforced investors’ sense that theeconomic expansion may not be as buoyant as previously expected, leading to aslump in equity prices and declines in interest rates on both Treasury andcorporate bonds.
Domestic nonfinancial debt continued growing at a moderate rate, even thoughbusiness borrowing remained sluggish. On the household side, the most recentdata suggest that borrowing has been well maintained, as households continue totap mortgage markets. In addition, shortfalls in tax receipts and increasedspending have prompted an expansion of federal government debt so far thisyear.
Interest Rates, Policy Expectations, and Stock PricesMarket participants are confident that the FOMC will leave the target federalfunds rate unchanged at next week’s meeting—a significant change from only amonth ago, when most expected a 25 basis point tightening. In addition, recentsurvey evidence suggests that market participants generally believe that theFOMC will retain its current assessment of balanced risks at the May meeting. Looking further out, futures quotes suggest a firming in monetary policy byyear-end of 50 basis points, less than half the rise expected at the time of theMarch FOMC meeting.
Against this backdrop, Treasury rates fell 11 to 36 basis points across thematurity spectrum over the intermeeting period. Corporate bond yields alsomoved lower, but credit risk spreads increased for investment-grade borrowersbecause of concerns about financial transparency at companies such as GeneralElectric and warnings of expected lower sales by a number of highly ratedtelecom firms. In contrast, risk spreads for junk-rated firms fell slightly. Riskspreads on commercial paper narrowed, although they remained somewhatabove historical norms.
Even though earnings reports suggested that profits met expectations in the firstquarter, broad indexes of stock prices declined 6 percent over the intermeetingperiod because of the uncertainity about future profitability. Larger share-pricedeclines were posted for telecom and technology firms, for which earnings’guidance was especially gloomy, and the broad-based Dow Jones telecom andtechnology indexes fell 19 percent and 14 percent respectively. The decline in

III-2

III-3
share prices pushed the forward earnings-price ratio up, but with the rise inAAA yields, the gap between these two measures of return remained narrow.
Business FinanceGross bond issuance proceeded at a rapid clip in March and April as investment-grade issuers continued to substitute long-term debt for commercial paper. Inaddition, some investment-grade firms issued bonds to pay down bank debt andbonds having higher coupons. Issuance of below-investment-grade bonds heldup well, accounting for about 20 percent of issuance in the past two months; thisshare is about the same as it was last year but is well below the shares seen inthe latter half of the 1990s.
Commercial paper continued to run off in April, but at a slower pace than in theprevious two months. Some firms have been shut out of the market because ofconcerns about their accounting transparency, while others have shifted toalternative forms of financing in the face of elevated risk spreads. Moreover,bank caution has added to the cost of commercial paper issuance. In the AprilSenior Loan Officer Survey, many banks reported having tightened standardsand increased fees and spreads on commercial paper back-up lines of credit overthe past year, especially for lower-rated issuers. The respondents pointed toheightened concerns about deterioration in issuers’ credit quality and a higherprobability of lines being drawn down.
C&I loans at banks also continued to run off in April, consistent with the SeniorLoan Officer Survey responses of generally weaker business loan demand. Banks reported that they continued to tighten standards and terms on such loans,on net, but to a lesser degree in April than at any time over the past two years.
Public equity issuance remained subdued in April. Seasoned equity offerings,while off somewhat in April, have been fairly well maintained this year. Thepace of initial public offerings has continued to be weak, though new IPO filingsand the number of deals slated for completion in the coming months haveincreased modestly, with a heavy concentration in the energy sector. Shareretirements from cash-financed mergers and acquisitions were small in the firstquarter, and only $10 billion of share repurchases were announced, the slowestlevel since 1994.
With about 80 percent of the S&P 500 firms reporting so far, first-quarterearnings are estimated to have exceeded fourth-quarter earnings by almost10 percent (on a seasonally adjusted basis). However, much of the first-quarter

III-4

III-5

III-6

III-7
1. In addition, earnings estimates were revised upward in January and February because ofnew goodwill accounting rules, which further reduce amortization expenses.
2. The survey defined such properties as landmark buildings and commercial properties intheir vicinity, stadiums and other sports/entertainment venues, and large shopping malls.
earnings improvement appears to reflect cost-cutting rather than revenue gains.1 Overall, company reports offered little support for the strong rebound inearnings that analysts were expecting for the coming year.
The most recent measures of corporate credit quality continued to show a highlevel of distress but did not deteriorate further in March. Moody’s downgraded$75 million more debt than it upgraded in March, leaving the pace of first-quarter net downgrades similar to the fourth-quarter pace. The twelve-monthmoving average of bond defaults remained elevated, but a forward-lookingmeasure of aggregate credit quality, KMV’s year-ahead expected defaultfrequency, improved in March, reflecting stock price gains early in the monthand a decline in asset volatility.
Commercial Real Estate FinanceGrowth in commercial mortgage debt dropped back in the first quarter afterhaving surged late last year. Moreover, CMBS issuance—a major component ofcommercial mortgage debt—remained weak for the first three weeks of April,although trade reports indicated that a sizable amount is in the pipeline. Riskspreads have narrowed considerably this year, despite a steady rise in officevacancy rates and in CMBS delinquency rates.
Some observers have cited the difficulty of purchasing terrorism insurance as onereason for the falloff in CMBS issuance. However, market reports indicate thatonly high-profile properties, which constitute a small part of the CMBS marketand of bank portfolios, are having difficulty getting funding because of a lack ofterrorism insurance. According to the April Senior Loan Officer Survey, mostdomestic banks required terrorism insurance on fewer than 10 percent of theloans being used to finance high-profile or heavy-traffic commercial properties,2 although a few banks required much higher levels.
Household FinanceSince the last FOMC meeting, home mortgage rates have again dipped below7 percent, helping to sustain a robust pace of home sales. Mortgage refinancingactivity, while well below its peak late last year, remains at a relatively highlevel.
Overall, household debt is estimated to have risen 8 percent at an annual rate inthe first quarter, the same pace as in the fourth quarter of 2001. Mortgage debtexpanded at a robust 9-1/2 percent pace, slightly faster than in the fourth quarter. However, consumer credit growth slowed to 4 percent at an annual rate in the

III-8

III-9

III-10

III-11
3. The Treasury also announced the discontinuance of regular reopenings of five-year notesand that it would conduct an additional TIIS auction in October in an effort to enhance theliquidity of these securities.
4. The Treasury also conducted three buyback operations last month totaling $4 billion--thefirst ones this year. The April 18 buyback was the first to include Treasury inflation-indexedsecurities. Prices on those securities seemed to benefit from their inclusion, as yieldsimmediately fell several basis points relative to those on nominal Treasury securities.
first quarter, after a surge in motor vehicle sales in the fourth quarter pushed therate up to 8-1/4 percent.
Despite further substantial growth in household debt, a continuation of lowinterest rates and a sharp rise in disposable income growth led to a small declinein the household debt-service burden last quarter. Although subprimedelinquency rates remained quite elevated, rates on some broader delinquencymeasures continued to hover within their range of recent years. Bankruptcyfilings by households declined in recent weeks but remained in the elevatedrange seen so far this year. According to the April Senior Loan Officer Survey,credit standards for residential mortgage loans were largely unchanged, whilestandards for consumer loans continued to tighten somewhat.
The ratio of household assets to disposable income is estimated to havedecreased slightly in the first quarter, as the jump in disposable personal incomeoutpaced a moderate rise in the value of household assets. Net flows into long-term mutual funds slowed in April, as contributions into equity funds slowedfrom their robust pace in March.
Government FinanceIndividual non-withheld tax receipts were considerably weaker than expected inApril. Indeed, as part of its midquarter refunding announcement, the Treasuryindicated that it expected to borrow $1 billion, on net, over the second quarter,as opposed to paying down a large amount of debt, as it had announced severalmonths ago.3 To avoid breaching its statutory borrowing limit, the Treasurydisinvested almost $19 billion in April from the Government SecuritiesInvestment Fund (the G-fund). This disinvestment, which elicited little marketreaction, allowed the Treasury to issue cash-management bills to meet its short-term financing needs and still stay under the debt ceiling.4 Later in the month,the Treasury was able to reinvest the G-fund assets, with an adjustment for lostinterest.
Both Fannie Mae and Freddie Mac issued sizable amounts of securities over theintermeeting period, including a little more than $15 billion of Fannie Maebenchmark securities and $9 billion of Freddie Mac reference securities. Yields

III-12

III-13
5. Amid increasing concerns about their disclosure practices, Fannie Mae and Freddie Macboth voluntarily provided more information about their derivatives positions and counterpartyexposures, which indicated that their total exposure in the event of a default by all over-the-counter derivative counterparties was small. Fannie Mae also attracted attention last month withits announcement that it would exercise a “cleanup call” of $1-1/2 billion of older MBS. It laterretracted this comment to quell investors’ criticism, effectively forgoing near-term profit inexcess of $100 million. Neither of the events had a significant effect on agency yields orissuance.
6. Mortgage refinancings cause liquid deposits to swell as mortgage servicers accumulatethe proceeds of prepaid mortgages in escrow accounts for a short time before their distribution toholders of mortgage-backed securities. In addition, households typically build up M2 assetsahead of April 15 to make final payments on their prior-year tax liabilities. M2 growth is helddown when refinancings subside or tax payments are low.
7. Deposit rates typically lag movements in market rates. As policy eased aggressively lastyear, deposits became increasingly attractive. Now that short-term market rates have been stablefor some time, deposit rates have caught up.
on these securities over the intermeeting period moved down with Treasuryyields.5
Gross offerings of long-term debt by state and local governments have remainedstrong in recent months, boosted by continued hefty new capital issuance tofund a variety of infrastructure projects. In contrast, partly because municipalyields have risen, refundings slowed in April to about two-thirds of the levelseen earlier in the year. While the overall credit quality of the sector remains ata high level, the fiscal stresses being felt by state and local governments resultedin some additional rating downgrades in municipal bonds, and the pace ofupgrades, while remaining above downgrades, has tailed off. Yield ratiosrelative to Treasuries ticked up in April and remained in the elevated rangeobserved since late 1999.
Monetary Aggregates and Bank CreditThe broad monetary aggregates decelerated noticeably over the intermeetingperiod. A slowdown in the liquid components of M2 owed in part to lessmortgage refinancing and low tax payments6 and a leveling out in theopportunity cost of holding deposits.7 Precautionary demands for M2, built uplast year, apparently continued to unwind, further slowing liquid components. Foreign demands for U.S. currency added very little to money growth, on net,despite sizable shipments to Argentina in March. M3 growth also dropped off,but not as much as the growth of M2, because of a surge in large time deposits.
Bank credit expanded at a fairly brisk pace in April, with the strengthconcentrated in banks’ securities portfolios. Loans edged up, continuing thepattern of anemic lending activity that has prevailed this year.

III-14

III-15
Incoming reports for large bank holding companies show earnings coming in ator above expectations, with first-quarter earnings 28 percent above levels a yearago. However, with credit quality an ongoing concern, loan loss provisions andcharge-offs increased substantially in the first quarter relative to a year earlier,although banks generally remained very well capitalized.

III-16

Appendix
April 2002 Senior Loan Officer Opinion Survey
The April 2002 Senior Loan Officer Opinion Survey on Bank Lending Practicesfocused on changes in the supply of and demand for bank loans to businessesand households over the past three months. The survey contained two sets ofsupplementary questions. The first set addressed changes in banks’ lendingpolicies with regard to commercial paper backup lines of credit over the pasttwelve months, and the second set focused on the role in commercial real estatelending of problems in the market for terrorism insurance. Loan officersrepresenting fifty-six large domestic banks and twenty-one U.S. branches andagencies of foreign banks participated in the April survey.
Results of the survey indicate some further tightening of standards and terms forloans to both businesses and households. However, the number of domestic andforeign banking institutions that reported tightening standards and terms oncommercial and industrial (C&I) loans over the past three months moved downconsiderably from the January survey. The net fraction of domestic institutionsthat indicated that they had tightened standards for commercial real estate loansin the April survey also declined, though it remained in a relatively high range. Banks continued to report a weakening of demand for C&I and commercial realestate loans, albeit at a lesser rate than in January. According to the domesticrespondents, standards for residential mortgage loans were largely unchangedover the past three months, and demand for these loans was moderately strongeron net. As in January, only a small portion of domestic banks, on net, reportedtightening standards for consumer loans. For the second consecutive survey,banks reported tightening terms on non-credit-card loans to a greater extent thanthey have terms on credit card loans. Demand for consumer loans was roughlyunchanged over the past three months.
Lending to BusinessesCompared with the January survey, significantly smaller fractions of domesticbanks and U.S. branches and agencies of foreign banks reported that they hadtightened standards on C&I loans. The percentage of domestic banks thatreported having tightened their standards on C&I loans to large and middle-market firms over the past three months moved down to 25 percent from 45 percent in the previous survey; the percentage tightening standards onbusiness loans to small firms declined even more, from more than 40 percent inJanuary to about 15 percent in April. Similarly, the fraction of U.S. branchesand agencies of foreign banks that had tightened standards for customersseeking C&I loans or credit lines fell from 70 percent in January to about 40 percent in the current survey.
In April, smaller fractions of domestic banks reported tightening the terms listedin the survey to large and middle-market firms than in January. The largest

III-A-2
change was in the net fraction of banks that had increased spreads of loan ratesover their cost of funds, which fell from 40 percent in January to about 25 percent in the current survey. In addition, somewhat smaller net percentagesof banks reported that they had tightened loan covenants and increased the costof credit lines for these customers over the past three months. However, about45 percent of domestic banks increased premiums charged on riskier loans tolarge and middle-market firms, about the same as in the January survey. Changes in terms on C&I loans to small firms followed a similar though morepronounced pattern. The net fraction of domestic banks that tightenedcovenants on loans to small firms fell from 40 percent in January to only about12 percent in the current survey; the net percentage of banks that increasedspreads of loan rates over their cost of funds moved down from 37 percent to 13 percent over the same period. The net fraction of banks that reportedincreasing premiums charged on riskier loans to small firms over the past threemonths edged down from 40 percent in January to 34 percent in the currentsurvey.
The fraction of U.S. branches and agencies of foreign banks that tightened termson C&I loans generally declined but remained in an elevated range. Thepercentage of foreign institutions that raised premiums on riskier loansdecreased from 75 percent in January to 52 percent in the current survey, andthe fraction of foreign banks that strengthened loan covenants declined from 52 percent to 43 percent over the same period. The one exception was thepercentage of foreign institutions that increased the costs of credit lines, whichmoved up noticeably from 35 percent in the previous survey to 57 percent inApril. Among foreign institutions, the tightening of terms on C&I loans wasparticularly widespread at the branches and agencies of Japanese banks. All sixJapanese institutions that participated in the April survey increased the cost ofcredit lines, and all but one of these institutions reported raising spreads of loanrates over their cost of funds. According to these banks, the most commonreason for imposing more stringent terms on business borrowers was adeterioration in their capital position followed by a less favorable economicoutlook and reduced tolerance for risk.
A significant percentage of banks that tightened standards or terms on C&Iloans over the past three months pointed to a reduced tolerance for risk as areason for doing so and continued to voice concerns about the economicoutlook. In the current survey, three-quarters of domestic and foreignrespondents cited reduced tolerance for risk as a reason for tightening theirlending policies, about the same fraction as in January. About 70 percent ofdomestic banks also indicated that a less favorable or more uncertain economicoutlook was a reason for changing their standards and terms over the past threemonths. While still high, this fraction represents a marked decline from theJanuary survey in which all but one domestic bank indicated that this was at

III-A-3
1. To account for the concentration of commercial paper backup lines of credit among thelargest institutions, responses for domestic banks were weighted by the sum of C&I loans andunused commitments obtained from the 2001:Q4 Call Report. These weights are intended toproxy for banks’ participation in this line of business.
least a somewhat important reason for tightening their lending policies. Furthermore, only 10 percent of domestic respondents in the current surveynoted that a less favorable or more uncertain economic outlook was a “veryimportant” reason, down from 40 percent in the January survey.
About one-third of domestic banks, on net, reported weaker demand for C&Iloans from both large and small firms over the past three months, down fromroughly one-half in the January survey. Every domestic bank that experiencedweaker demand reported that a decline in customers’ needs for bank loans tofinance capital expenditures was at least a somewhat important reason for theweakness in demand, and more than one-third of respondents chose this reasonas “very important.” As in the January survey, banks also reported weakerdemand for loans to finance mergers and acquisitions, inventories, and accountsreceivable. Out of eight banks that reported an increase in demand for C&Iloans, six of them indicated that the increase was due to a shift in borrowingfrom other bank or nonbank credit sources that became less attractive, likely, atleast in part, a reflection of the recent pressures in the market for commercialpaper. The same number of banks identified a decline in customers’ internallygenerated funds as a reason for higher C&I loan demand.
The net percentage of foreign branches and agencies reporting weaker demandfor C&I loans fell from nearly 50 percent in January to 14 percent in the currentsurvey. Despite the widespread tightening of lending standards and terms atJapanese banks, only one of these institutions reported moderately weakerdemand for C&I loans over the past three months. The most frequently citedreason for weaker demand at foreign institutions was a decline in requests formerger and acquisition financing.
Commercial paper backup lines of credit. A series of special questions wereaimed at changes in banks’ lending policies for commercial paper backup linesof credit over the past twelve months. Forty-six of the largest domestic banksand nineteen foreign institutions indicated that they provide these facilities on aregular basis.1 Domestic banks accounting for more than one-third of totallending facilities—defined as the sum of C&I loans and unusedcommitments—tightened standards on commercial paper backup lines of creditfor nonfinancial firms with A1/P1 commercial paper ratings; domesticinstitutions accounting for about 60 percent of total lending facilities indicateddoing so for firms with A2/P2 ratings. The (unweighted) fraction of foreigninstitutions that had tightened standards on commercial paper backup lines ofcredit for nonfinancial firms with an A1/P1 commercial paper rating over the

III-A-4
2. For the purposes of the survey, high profile or heavy traffic commercial real estateproperties were defined as landmark buildings and commercial properties in their vicinity,stadiums and other sports/entertainment venues, and large shopping malls.
past twelve months stood at 60 percent, while almost 90 percent reported doingso for lower-rated borrowers.
Domestic banks accounting for more than 90 percent of total lending facilitiesindicated that they had increased fees and raised spreads associated withcommercial paper backup lines of credit for commercial paper issuers with bothA1/P1 and A2/P2 ratings. Banks pointed to heightened concerns about possibledeterioration in issuers’ credit quality and a higher probability of lines beingdrawn because of less certain conditions in the commercial paper market asreasons for tightening standards and terms. Over the past twelve months, about10 percent of domestic banks (weighted) and 10 percent of foreign institutions(unweighted), on net, reported stronger demand for commercial paper backuplines of credit from nonfinancial issuers with both A1/P1 and A2/P2 ratings.
Commercial real estate lending. The net fraction of domestic banks thatreported tighter standards on commercial real estate loans over the past threemonths declined from 46 percent in January to 30 percent in the current survey. At branches and agencies of foreign banks, the net percentage reporting tighterstandards on commercial real estate loans remained stable at about 20 percent. In the current survey, more than 30 percent of domestic respondents, on net,noted that demand for commercial real estate loans had weakened, down from43 percent in January; among foreign institutions, 25 percent, on net, reportedweaker demand for this type of loan over the past three months.
A set of special questions addressed how the lack of insurance against terrorismhas affected commercial real estate lending. About 70 percent of domesticrespondents indicated that less than 5 percent of the dollar volume of theircommercial real estate loans outstanding—either held on their books orsecuritized—is backed by “high profile” or “heavy traffic” commercial realestate properties.2 For about one-fifth of banks, loans financing high profileproperties make up between 5 percent and 10 percent of their commercial realestate loan portfolio, while for the remainder, such loans account for between 10 percent and 20 percent of commercial real estate loans outstanding. Atforeign institutions, loans backed by high profile properties account forsomewhat larger shares of the respondents’ commercial real estate portfolios.
Almost three-quarters of domestic banks indicated that they require terrorisminsurance on less than 10 percent of loans financing high profile or heavy trafficcommercial real estate properties. Indeed, in their comments, a number ofbanks noted that their standard commercial real estate loan

III-A-5
contracts—especially for smaller loans (less than $10 million)—generally donot require terrorism insurance. However, six domestic and six foreignrespondents that answered these special questions reported that they requireinsurance against terrorism on more than 90 percent of loans financing suchproperties. At the end of last year, these six domestic institutions held about 9 percent of all commercial real estate loans on the books of domestic banksaccording to the 2001:Q4 Call Report. The most recent weekly bank credit dataindicate that the six foreign institutions account for less than 2 percent of allcommercial real estate loans on the books of domestic banks and U.S. branchesand agencies of foreign banks.
Domestic respondents indicated that if coverage was required and an existingborrower were unable to secure adequate insurance against terrorism for a highprofile commercial real estate property, their most likely response was to ask foradditional collateral and to modify the existing loan covenants to allow forpartial coverage. The foreign institutions, by contrast, noted that their mostlikely course of action was to increase fees or interest rates associated with theloan, and three foreign respondents indicated that they are very likely to call theloan or refuse to roll it over when the loan comes due.
Among domestic banks that received applications for loans to finance highprofile commercial real estate properties since the events of September 11, 90 percent indicated that their rejection rate on these loan applications hasstayed about the same. Sixty percent of U.S. branches and agencies of foreignbanks that received applications for loans to finance these types of propertiesreported their rejection rate as essentially unchanged. Almost 80 percent ofdomestic banks and more than 70 percent of foreign institutions indicated thatthey experienced little or no change in demand for loans to finance high profileproperties because potential borrowers were unable to secure affordableinsurance against acts of terrorism. Seven domestic banks reported moderatelyweaker demand and four domestic and three foreign institutions experiencedsubstantially weaker demand for loans to finance high profile commercial realestate properties because of terrorism insurance issues.
Lending to HouseholdsDomestic banks’ credit standards for approving residential mortgage loans werelargely unchanged over the past three months, with only one bank reporting thatit had tightened lending standards somewhat, the same as in the January survey. On net, about 6 percent of domestic respondents reported increased demand forresidential mortgages, down from 30 percent in January.
In the current survey, less than 10 percent of banks indicated that they hadtightened standards on credit card loans over the past three months, a somewhatsmaller percentage than in January; terms and conditions on existing credit cardaccounts were largely unchanged. For other types of consumer loans, one-fifth

III-A-6
of banks reported that they had tightened standards over the past three months,about the same percentage as in the January survey. Almost one-quarter ofdomestic banks raised the minimum required credit score on consumer loansother than credit card loans, and 15 percent reduced the number of exceptionsgranted to customers not meeting credit-scoring thresholds. On net, banksreported demand for consumer loans as about unchanged over the past threemonths.

III-A-7

III-A-8

International Developments

International Developments
U.S. International Transactions
Trade in Goods and ServicesThe U.S. international trade deficit in goods and services was $31.5 billion inFebruary, up $3.3 billion from January (revised). The widening of the tradedeficit was accounted for primarily by a strong increase in imports of goods andservices. For January and February combined, the trade deficit was $359 billionat an annual rate, $27 billion larger than in the fourth quarter of 2001.
The value of exported goods and services rose 1.2 percent in February. A3.6 percent rise in services exports, which were boosted by receipts associatedwith the Winter Olympic Games, accounted for nearly all of the increase. Goodsexports were little changed, as a modest decrease in exports of capital goods(mainly aircraft) was offset by small increases in most other categories of trade.For January and February combined, the value of exported goods and servicesincreased about 1 percent from the fourth quarter level: a 1.4 percent decline ingoods exports was outweighed by a 6.6 percent increase in services exports.
The value of imported goods and services surged 4 percent in February.Services imports rose more than 5 percent, though about half of that increase isexplained by royalties and license fees paid to the International OlympicCommittee for the rights to broadcast the 2002 Winter Olympic Games. Thevalue of imported goods, excluding gold and oil, rose 4.6 percent, with relativelystrong increases occurring in all major categories of trade. Within the capitalgoods category, imports of computers and aircraft declined somewhat inFebruary, but this was more than offset by higher imports of semiconductors,telecommunications equipment, and other machinery. The value of imported oil

IV-2

IV-3

IV-4

IV-5
declined 8 percent, resulting entirely from a lower import volume. For Januaryand February combined, the value of imported goods and services rose2.8 percent from the fourth quarter level, with both goods and servicescontributing to the increase.
Prices of Internationally Traded GoodsOil. The BLS price of imported oil shot up nearly 16 percent in March,following smaller increases in the two preceding months. For the first quarter,the price of imported oil was up about 14 percent (a.r.) relative to the fourthquarter of last year. The spot price of West Texas intermediate (WTI) crude oil,which also rose in both January and February, moved sharply higher in March.In April, the spot price has been volatile, ranging between $23 and $28 perbarrel. The current spot price of WTI is about $27 per barrel. Factors generatingthe price increase include production restraint by OPEC, heightened tensions inthe Middle East, a suspension of exports by Iraq, and uncertainty regardingpolitical stability in Venezuela, and hence its oil shipments.
Non-oil imports. The price of imported non-oil core goods was unchanged inMarch following a decline of about 0.4 percent in February. Increases in pricesof foods and industrial supplies (excluding petroleum), both of which had fallenin February, were offset by continued small declines in prices of capital andconsumer goods. For the first quarter on average, the core goods price indexwas down about 2.2 percent at an annual rate, the fourth consecutive quarterlydecline. However, the first-quarter drop was less steep than the earlier declines,as prices of industrial supplies fell only about 5 percent at an annual ratefollowing three quarters of double-digit declines. The slower rate of deflation inindustrial supplies reflects the recent turnabout in prices of raw industrialcommodities, which were about 8 percent above their November trough bymid-April.
Exports. Prices of U.S. core goods exports rose 0.4 percent in March, followingmore than a year of nearly continuous declines. Among major categories, thelargest increase in March was in the price of industrial supplies, which rose0.7 percent following a decline of about 8.5 percent over the preceding year.Food prices also rose in March, partially reversing their February decline. Pricesin other major categories were unchanged or up slightly in March. On average,the price of core goods was down about 1.2 percent at an annual rate in the firstquarter following an annual rate decline of 3.4 percent in the fourth quarter.

IV-6
U.S. International Financial TransactionsU.S. financial flows through international securities transactions decreasedconsiderably in the first two months of the year. For January and Februarycombined, net purchases of foreign securities by U.S. investors were near zero(line 5 of the Summary table of U.S. International Transactions), while netpurchases of U.S. securities by private foreigners (line 4) recorded the lowesttwo-month total since early 1999.
The weakness in foreign demand for U.S. securities was first apparent lastSeptember, but the pattern has varied somewhat by instrument. Private netforeign purchases of all types of U.S. securities—Treasury, agency, andcorporate—were very weak in September. Net private foreign purchases of U.S.Treasury and agency securities (lines 4a and 4b) then bounced back strongly inthe fourth quarter—perhaps owing to flight-to-quality buying—but slowedmarkedly in the first two months of 2002. The recent weak demand by privateforeigners for Treasury securities was not entirely unexpected; net sales were thenorm before the fourth quarter. For agency bonds, however, the recent weaknesshas been surprising since it coincided with strong issuance.
Private purchases of U.S. corporate securities have exhibited a slightly differentpattern (lines 4c and 4d). Foreigners sold U.S. equities heavily last September,but returned to the U.S. equity market with strong demand in the last two monthsof 2001. The demand for U.S. equities continued, albeit at a somewhat lowerlevel, in January, but fell to only $6 billion in February, about half of which tookthe form of a merger-related stock swap. Foreign purchases of corporate bondsfollowed a similar but more muted pattern—weakening in September followedby very solid demand through January and some slowing in February.
Issuance patterns for March could support a pickup in foreign purchases ofagency and corporate debt. In particular, Fannie Mae reports strong foreigndemand for its new issues in the month, and bond issuance by U.S. corporationsreached near-record levels.
In February, capital inflows from foreign official sources were somewhatstronger than in previous months (line 1). The largest inflow in the month wasattributable to China, whose holdings increased $12 billion, in line with theiroverall increase in foreign reserves. Taiwan’s official holdings in the UnitedStates also increased substantially ($3.5 billion), while the largest decrease in themonth was posted for Norway ($5 billion).
We have no new data on foreign direct investment flows. As noted previously,U.S. direct investment abroad (line 6) was very strong in 2001, notwithstandinga slight weakening in the fourth quarter. Foreign direct investment in the United

IV-7
States (line 7), however, fell off sharply in the second half of 2001. Timely dataon completed merger and acquisition activity suggest that both inflows andoutflows of direct investment may well be weak in the first quarter.
With inflows through securities slowing, net banking inflows increased to$28 billion in February, following moderate outflows in January (line 3).
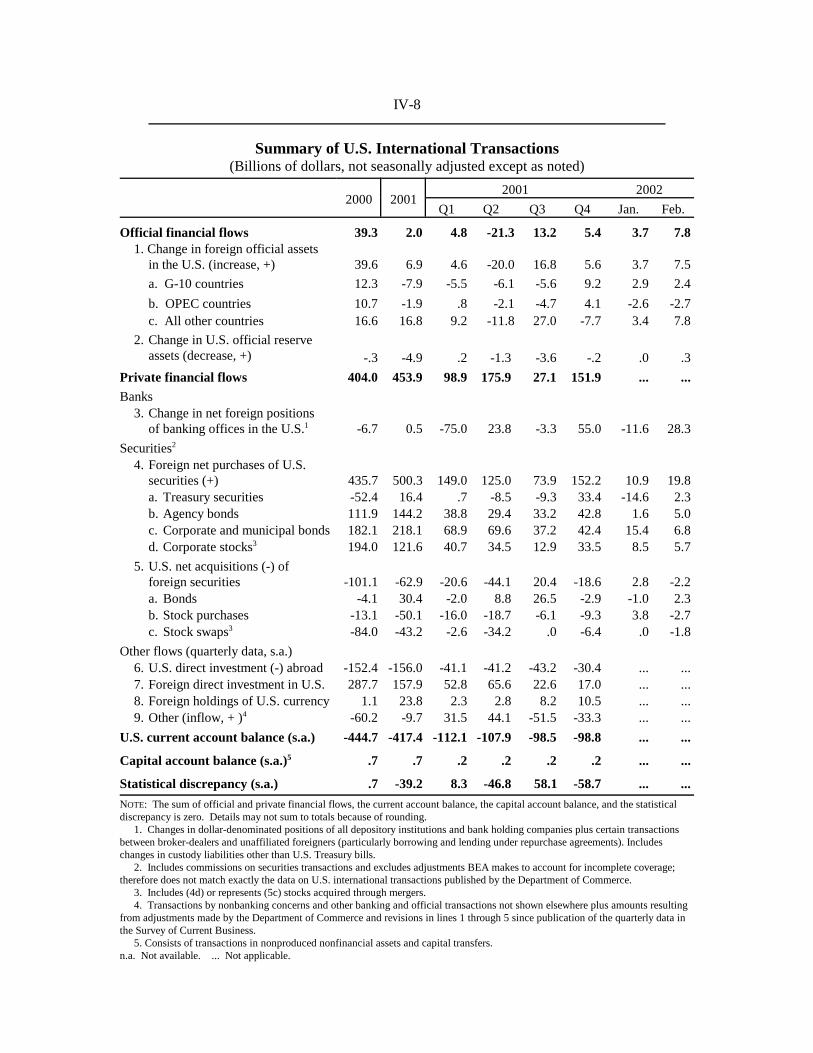
IV-8
Summary of U.S. International Transactions(Billions of dollars, not seasonally adjusted except as noted)
2000 20012001 2002
Q1 Q2 Q3 Q4 Jan. Feb.
Official financial flows 39.3 2.0 4.8 -21.3 13.2 5.4 3.7 7.81. Change in foreign official assets
in the U.S. (increase, +) 39.6 6.9 4.6 -20.0 16.8 5.6 3.7 7.5
a. G-10 countries 12.3 -7.9 -5.5 -6.1 -5.6 9.2 2.9 2.4
b. OPEC countries 10.7 -1.9 .8 -2.1 -4.7 4.1 -2.6 -2.7c. All other countries 16.6 16.8 9.2 -11.8 27.0 -7.7 3.4 7.8
2. Change in U.S. official reserveassets (decrease, +) -.3 -4.9 .2 -1.3 -3.6 -.2 .0 .3
Private financial flows 404.0 453.9 98.9 175.9 27.1 151.9 ... ...
Banks3. Change in net foreign positions
of banking offices in the U.S.1 -6.7 0.5 -75.0 23.8 -3.3 55.0 -11.6 28.3
Securities2
4. Foreign net purchases of U.S.securities (+) 435.7 500.3 149.0 125.0 73.9 152.2 10.9 19.8a. Treasury securities -52.4 16.4 .7 -8.5 -9.3 33.4 -14.6 2.3b. Agency bonds 111.9 144.2 38.8 29.4 33.2 42.8 1.6 5.0c. Corporate and municipal bonds 182.1 218.1 68.9 69.6 37.2 42.4 15.4 6.8d. Corporate stocks3 194.0 121.6 40.7 34.5 12.9 33.5 8.5 5.7
5. U.S. net acquisitions (-) offoreign securities -101.1 -62.9 -20.6 -44.1 20.4 -18.6 2.8 -2.2a. Bonds -4.1 30.4 -2.0 8.8 26.5 -2.9 -1.0 2.3b. Stock purchases -13.1 -50.1 -16.0 -18.7 -6.1 -9.3 3.8 -2.7c. Stock swaps3 -84.0 -43.2 -2.6 -34.2 .0 -6.4 .0 -1.8
Other flows (quarterly data, s.a.)6. U.S. direct investment (-) abroad -152.4 -156.0 -41.1 -41.2 -43.2 -30.4 ... ...7. Foreign direct investment in U.S. 287.7 157.9 52.8 65.6 22.6 17.0 ... ...8. Foreign holdings of U.S. currency 1.1 23.8 2.3 2.8 8.2 10.5 ... ...9. Other (inflow, + )4 -60.2 -9.7 31.5 44.1 -51.5 -33.3 ... ...
U.S. current account balance (s.a.) -444.7 -417.4 -112.1 -107.9 -98.5 -98.8 ... ...
Capital account balance (s.a.)5 .7 .7 .2 .2 .2 .2 ... ...
Statistical discrepancy (s.a.) .7 -39.2 8.3 -46.8 58.1 -58.7 ... ...
NOTE: The sum of official and private financial flows, the current account balance, the capital account balance, and the statisticaldiscrepancy is zero. Details may not sum to totals because of rounding.
1. Changes in dollar-denominated positions of all depository institutions and bank holding companies plus certain transactionsbetween broker-dealers and unaffiliated foreigners (particularly borrowing and lending under repurchase agreements). Includeschanges in custody liabilities other than U.S. Treasury bills.
2. Includes commissions on securities transactions and excludes adjustments BEA makes to account for incomplete coverage;therefore does not match exactly the data on U.S. international transactions published by the Department of Commerce.
3. Includes (4d) or represents (5c) stocks acquired through mergers.4. Transactions by nonbanking concerns and other banking and official transactions not shown elsewhere plus amounts resulting
from adjustments made by the Department of Commerce and revisions in lines 1 through 5 since publication of the quarterly data inthe Survey of Current Business.
5. Consists of transactions in nonproduced nonfinancial assets and capital transfers.n.a. Not available. ... Not applicable.

IV-9
Foreign Exchange Markets
On balance, the trade-weighted index of the dollar’s exchange value againstother major currencies fell 2.4 percent over the intermeeting period. The dollardepreciated as market participants pushed back expectations of monetary policytightening in the United States, following mixed economic data releases, theChairman’s Congressional testimony, and comments by other FOMC members.Late in the intermeeting period, the dollar fell following Congressionaltestimony by Treasury Secretary O’Neill. Some market participants apparentlyinterpreted his remarks as suggesting a softening of the “strong dollar” policy.
The index of the dollar’s value against our other important trading partners, incontrast, rose 0.8 percent, led by a large depreciation of the Argentine peso and amodest decline in the Mexican peso.
On net, the dollar depreciated 2.7 percent against the euro and 2.6 percent versussterling. The European Central Bank and the Bank of England left their policyrates unchanged over the intermeeting period, as expected. Expectations offuture monetary policy tightening that are implicit in interest rate futures havebeen pushed back in time in both the euro area and the United Kingdom,although not as much as in the United States. Yields implied by euro andsterling interest rate futures contracts maturing in the last quarter of 2002 fellabout 40 basis points on net over the period. Factors that tended to limit theappreciation of the euro against the dollar included concerns over labor unrest in

IV-10
Germany and Italy and the success of the far-right candidate, Jean-Marie Le Pen,in the first round of the French Presidential election. The Swiss francappreciated 3.3 percent relative to the dollar, which market participantsattributed to safe haven flows and the belief that domestic inflationary pressuresleave the Swiss National Bank little scope to weaken the currency by easingmonetary policy.
The Bank of Canada raised its policy rate 25 basis points. This followed theCanadian March employment report, which was much stronger than expected.Data on Canadian GDP and housing starts also came in above marketexpectations. The Canadian dollar appreciated 1.9 percent against the U.S.dollar. The New Zealand dollar and Australian dollar likewise appreciatedagainst the U.S. dollar following strong economic data releases in bothcountries. The Reserve Bank of New Zealand and the Bank of Sweden bothraised their policy rates 25 basis points twice over the intermeeting period.
The Japanese yen appreciated 2.9 percent against the dollar, despite a one-notchdowngrade of Japan’s sovereign debt rating by Standard & Poor’s to AA- andreports that Moody’s is considering an aggressive two-notch downgrade.Japanese officials stated that they were concerned about the strengthening of theyen.

IV-11
After rising sharply at the end of the fiscal year, current account balances at theBank of Japan have fallen back somewhat but have remained above the current10-15 trillion yen target range.
On net, broad equity indices fell about 2 to 5 percent in Europe and Canada andwere little changed in Japan. The new fiscal year did not produce the largecapital outflows from Japan that some market participants had feared. Indeed,Japanese public pension funds are reported to have made large purchases ofJapanese stocks. Shares in export-oriented firms outperformed broader indexesin Japan, as market participants hope for an export-led recovery. Japanesebanking shares also outperformed, in part following a report on the loanportfolios of banks by the Financial Services Agency that contained no negativesurprises. Benchmark 10-year bond yields in most industrial economiesdecreased over the intermeeting period, but by smaller amounts than in theUnited States.
The dollar appreciated 28 percent against the Argentine peso. The peso hadfallen even further but later retraced some of its losses in very thin and restrictedtrading. Reports indicate that the peso was supported by central bankintervention and by the requirement that exporters repatriate their earningswithin 5 days, instead of the 180 days that had previously been allowed. Thecentral bank declared a banking and foreign exchange holiday that lasted for oneweek in response to the depletion of its dollar reserves and an ongoing trend ofbank withdrawals facilitated by court orders allowing access to frozen deposits.In response, the Argentine congress passed legislation making it harder fordepositors to do this. Economy Minister Remes Lenicov resigned after theArgentine congress failed to act on a plan converting frozen bank deposits intogovernment bonds and was replaced by Roberto Lavagna. Negotiations with theIMF are in stalemate.
The Venezuelan bolivar appreciated against the dollar after President Chavezwas ousted in a coup, but the currency fell back after he was reinstated a fewdays later.
Developments in Argentina and Venezuela had little contagion effect on otheremerging markets. In Taiwan and Malaysia, stock prices rose 1 to 5 percent, ledby gains in technology shares. In Korea, the won appreciated 2.4 percent againstthe dollar and sovereign bond yield spreads over Treasuries fell 17 basis points,in part due to an upgrading of Moody’s sovereign debt rating for Korea. TheMexican peso fell 4.1 percent against the dollar, following the recent looseningof monetary policy in Mexico. In Brazil, stock prices fell 8.1 percent, sovereignbond yield spreads over Treasuries rose 145 basis points, and the real fell

IV-12
0.7 percent against the dollar. Market participants attributed these movementsin part to the fact that the candidate of the opposition Workers’ Party is ahead ofthe current government’s likely candidate in opinion polls for the Octoberpresidential election.
. The Desk did not intervene
during the period for the accounts of the System or the Treasury.

IV-13
Developments in Foreign Industrial Countries
Indicators for the first quarter point to a recovery of activity among most foreignindustrial countries, but the pace of the rebound varied widely. Signs of stronggrowth emerged in Canada, including a large increase in employment and arebound in manufacturing output. Data in the euro area suggest a modestrecovery started in the first quarter. In the United Kingdom, real GDP expandedslightly, while it appears likely that Japan continued to contract, though at amore moderate rate than over the second half of last year.
The first quarter was marked by a pick-up in the rate of inflation in most foreignindustrial countries. The twelve-month rate approached the 2 percent midpointof the Bank of Canada’s 1 to 3 percent target range in March, after ending lastyear just below the bottom limit. In the United Kingdom, the rate of retail priceinflation ticked up slightly in March, but remained below the Bank of England’s2.5 percent target. Euro-area inflation remained above the European CentralBank’s (ECB) 2 percent target ceiling. Deflation appears to be moderating a bitin Japan.
In Japan, indicators suggest that the pace of contraction has moderated andsigns of stabilization have begun to emerge in some sectors. Industrialproduction rose slightly in the first quarter, the first increase in over a year, withnotable growth in the production of electrical machinery. The broader all-industry index, a production-based proxy for GDP, was up slightly in Januaryand February on average, although service sector activity continued to decline.Real exports rose sharply in the first quarter, reflecting an increase in shipmentsto Asia and the United States. However, most indicators of domestic demandcontinued to weaken. On average, core machinery orders in January andFebruary were roughly 7 percent below their fourth-quarter average level, whilenonresidential building starts continued to decline, suggesting furtherretrenchment in capital spending. Residential building starts were about flat inJanuary and February on average. Private consumption remained sluggish, withworkers’ household expenditures up slightly in January and February onaverage.
Labor market conditions generally remain unfavorable, although March datashowed slight improvement. The unemployment rate edged down to 5.2 percentin March, from 5.3 percent in February and a record-high 5.5 percent inDecember. The job-offers-to-applicants ratio edged up to .51 in March, still wellbelow its recent peak of .66 in December 2000. Core consumer goods prices inthe Tokyo area (which exclude fresh food but include energy) were down

IV-14
1.1 percent from a year earlier in April. Wholesale prices for domestic goodswere unchanged in March from February, but continued to decline at asignificant rate on a twelve-month basis.
Japanese Economic Indicators(Percent change from previous period, except as noted, s.a.)
Indicator
2001 2002 2002
Q3 Q4 Q1 Jan. Feb. Mar. Apr.
Industrial production1 -4.4 -3.4 .5 -.1 1.2 .5 n.a.
All-industry index -1.8 -.9 n.a. -.1 .5 n.a. n.a.
Housing starts 4.4 -2.5 .8 9.0 -4.9 -6.2 n.a.
Machinery orders2 -5.7 -7.8 n.a. -15.6 10.8 n.a. n.a.
Machinery shipments -5.9 -4.7 3.4 1.4 1.9 1.6 n.a.
New car registrations 1.6 -5.5 1.9 3.0 -2.4 -5.3 10.8
Unemployment rate3 5.1 5.4 5.3 5.3 5.3 5.2 n.a.
Job offers ratio4 .58 .52 .51 .51 .50 .51 n.a.
Business sentiment5 -36 -40 -41 ... ... ... ...
CPI (Core, Tokyo area)6 -1.2 -1.0 -.9 -1.2 -.9 -.7 -1.1
Wholesale prices6 -1.1 -1.4 -1.4 -1.5 -1.4 -1.3 n.a.
1. Mining and manufacturing.2. Private sector, excluding ships and electric power.3. Percent.4. Level of indicator.5. Tankan survey, diffusion index.6. Percent change from year earlier, n.s.a.n.a. Not available. ... Not applicable.
The Bank of Japan’s Tankan index of business conditions worsened slightly inMarch, with the diffusion index for all enterprises edging down to -41 from -40in December. Survey respondents project a slight improvement in the index,back to -40, for June. The closely watched index for large manufacturers wasunchanged at -38, the first time in five quarters that the index did not deteriorate.The index for large non-manufacturing firms was also unchanged, whilesentiment among small-sized manufacturing and non-manufacturing firmscontinued to deteriorate. Fewer firms expect output prices to fall over the nextthree months, while the number of firms that expect input prices to fall wasunchanged. Sales and profits are expected to recover in FY2002. However,capital investment is expected to fall 8 percent in FY2002, compared with an

IV-15
estimated decline of roughly 5 percent in FY2001, suggesting weakness indomestic demand.
The Bank of Japan continued to provide funds in excess of its ¥10 trillion to¥15 trillion target range for the outstanding balance of financial institutions’accounts held at the central bank. In the last week of FY2001, which ended inMarch, the balance moved above ¥20 trillion, reaching ¥27.6 trillion onMarch 29. Since then, the BOJ has begun to drain reserves from the bankingsystem, although balances remain relatively high at about ¥18 trillion. OnMarch 20, the BOJ announced measures to broaden the range of instruments thatcan be used in open-market operations to include loan certificates issued by theDeposit Insurance Corporation and by regional governments.
On April 12, the Financial Services Agency (FSA) released the results of itsspecial examination of 149 borrowers from Japan’s major banks. Theexamination, which focused on borrowers that had experienced large downwardmovements in stock prices, credit ratings, or other financial indicators, forcedthe banks to take additional loan losses of ¥1.9 trillion and to classify anadditional ¥4.7 trillion in loans as non-performing over what was reported lastSeptember. Despite the current write-offs, the FSA release states that the majorbanks’ total capital ratios remain in the 10-11 percent range.
Recent data point to a modest improvement in the euro-area economy in thefirst quarter. Euro-area industrial production for January and February onaverage was 0.2 percent above the fourth-quarter average. Survey data onproduction expectations suggest a further production increase in March, makingit likely that industrial production rose in the first quarter for the first time sincethe fourth quarter of 2000. The volume of retail sales for January and Februaryon average also edged up slightly from the fourth quarter. Euro-area businesssentiment continued to rebound in March, rising back to its September level.The purchasing managers’ index (PMI) for the manufacturing sector rose inMarch to its highest level in a year, suggesting that growth likely returned to thesector last month, and the service sector PMI rose in March to its highest levelsince last July. Other indicators, however, suggest that the recovery is unevenand still somewhat tentative. Consumer sentiment has picked up less thanbusiness sentiment; the April survey of Italian consumers showed confidencefalling back to the lowest level in more than a year, in part owing to increasedtensions over labor reform. German growth appears to be lagging that of theother major economies, and German March manufacturing orders and Aprilbusiness sentiment (based on both the ZEW and IFO surveys) have retraced partof their earlier gains.

IV-16
Labor market data for the euro area as a whole continue to show only slightdeterioration, as the harmonized unemployment rate edged up to 8.4 percent inNovember and remained at that rate through March. According to thepreliminary estimate, the twelve-month rate of euro-area consumer priceinflation edged down to 2.2 percent in April, exceeding the ECB’s 2 percentceiling for the 23rd consecutive month. Excluding food and energy prices, thetwelve-month inflation rate was 2.5 percent in March. Producer prices remainbelow year-ago levels.
Euro-Area Economic Indicators(Percent change from previous period except as noted, s.a.)
Indicator2001 2002 2002
Q3 Q4 Q1 Jan. Feb. Mar. Apr.
Industrial production1 -.4 -1.7 n.a. .0 .2 n.a. n.a.
Retail sales volume .3 .2 n.a. -.4 .5 n.a. n.a.
Unemployment rate2 8.3 8.4 8.4 8.4 8.4 8.4 n.a.
Consumer confidence3 -7.7 -10.7 -9.7 -11.0 -9.0 -9.0 n.a.
Industrial confidence4 -10.0 -17.0 -13.0 -14.0 -14.0 -11.0 n.a.
Mfg. orders, Germany -2.4 -1.0 n.a. -.7 -1.3 n.a. n.a.
CPI5 2.5 2.2 2.5 2.7 2.4 2.5 2.2
Producer prices5 1.6 -.8 n.a. -.9 -1.1 n.a. n.a.
M35 6.8 8.2 7.3 7.9 7.4 7.3 n.a.
1. Excludes construction.2. Euro-area standardized to ILO definition. Includes Eurostat estimates in some cases.3. Diffusion index based on European Commission surveys in individual countries;
Averages of responses to questions on financial situation, general economic situation,and purchasing attitudes.
4. Diffusion index based on European Commission surveys in individual countries;Averages of responses to questions on production expectations, orders, and stocks.
5. Eurostat harmonized definition, 12-month percent change.n.a. Not available.
Bi-annual German wage negotiations have come to a turning point, withmembers of the bellwether metalworkers union having voted to go on strike toback the demand for a wage increase of at least 4 percent, versus the employers’latest offer of 3.3 percent. The German chemical industry recently agreed to a3.6 percent increase, and that is believed to have set the floor for increases in themuch larger metalworking industry. The European Central Bank has expressed

IV-17
concern that high wage settlements, seeking to catch up for past inflationsurprises, run the risk of keeping inflation from falling below its 2 percentceiling.
The first round of the French presidential election produced a surprise, withfar-right candidate Jean-Marie Le Pen moving into the second round of votingalong with incumbent President Jacques Chirac. Chirac led the voting with19 percent, while Le Pen took 17 percent of the vote to 16 percent for PrimeMinister Lionel Jospin. The second round had been expected to be a showdownbetween Chirac of the center-right and Jospin of the center-left, but votersperceived little difference between the two mainstream candidates andresponded by abstaining in record numbers and voting for a plethora of marginalcandidates, especially on the left. President Chirac now is expected to win thesecond round on May 5, with polls showing as much as 80 percent of theelectorate supporting him against Le Pen.
Real GDP in the United Kingdom rose 0.4 percent (s.a.a.r.) in the first quarterof 2002, after being flat in the previous quarter. For the four quarters ending inMarch, real GDP grew 1 percent, the weakest four-quarter growth rate since thefourth quarter of 1992, when it was 0.9 percent. The service sector grew at arate of 1.9 percent (s.a.a.r), similar to its growth in the fourth quarter. TheOffice of National Statistics estimates that industrial production fell sharplyagain in the first quarter.
The few available indicators for the second quarter indicate a pick-up in growth.The manufacturing sector’s four-month-ahead output expectations continued toclimb in April. The manufacturing PMI was more positive with the overallindex, as well the indices for output and new orders, all rising again in April andcontinuing to indicate expansion. Consumer confidence ticked-up slightly inApril, remaining around its pre-September level. April’s retail sales surveysuggested increased sales volumes for the month. Housing prices surged3.4 percent in April, bringing the twelve-month growth rate to around16 percent.
Notwithstanding the recent slowing of GDP growth, labor market conditionsremain tight. The official claims-based unemployment rate remained at3.1 percent in March, and the labor force survey measure of the unemploymentrate held steady at 5.1 percent for the three months centered in January. Bothunemployment rates are near record lows.

IV-18
U.K. Economic Indicators(Percent change from previous period except as noted, s.a.)
Indicator
2001 2002 2002
Q3 Q4 Q1 Jan. Feb. Mar. Apr.
Real GDP* 1.7 .0 .4 ... ... ... ...
Industrial production -1.1 -2.2 n.a. -.6 -.2 n.a. n.a.
Retail sales 1.5 1.3 .9 .0 1.1 .1 n.a.
Unemployment rate1
Claims-based 3.2 3.2 3.1 3.2 3.1 3.1 n.a.
Labor force survey2 5.1 5.1 n.a. 5.1 n.a. n.a. n.a.
Business confidence3 -6.0 -24.0 -3.3 -13.0 1.0 2.0 14.0
Retail prices4 2.4 2.0 2.4 2.6 2.2 2.3 n.a.
Producer input prices5 -2.7 -8.2 -5.4 -6.2 -7.4 -2.5 n.a.
Average earnings5 4.4 3.3 n.a. 2.9 .8 n.a. n.a.
* Preliminary release.1. Percent.2. Three-month average centered on month shown.3. Percentage of firms expecting output to increase in the next four months less percentage
expecting output to decrease.4. Excluding mortgage interest payments. Percent change from year earlier.5. Percent change from year earlier.n.a. Not available.
The twelve-month rate of retail price inflation (excluding mortgage interestpayments) ticked up slightly to 2.3 percent in March. As a result of lowerbonuses, the twelve-month growth rate of average earnings dropped to0.9 percent in February, well below the 4.5 percent rate that the Bank of Englandbelieves to be compatible with its inflation target.
Chancellor of the Exchequer Gordon Brown presented the government’s budgetto Parliament on April 17. The budget includes additional spending on publicservices, directed primarily towards the National Health Service, as well as anincrease in the National Insurance payroll tax rate, several tax breaks forbusinesses, and a supplementary surcharge on North Sea oil profits. The budgetdeficit was 0.1 percent of GDP in 2001-2002, instead of an expected 0.3 percentof GDP. For 2002-2003 and 2003-2004, the deficit is expected to be 1 percentof GDP and 1.2 percent of GDP, respectively.
In Canada, real GDP measured by industry in January and February on averageincreased 4.5 percent (s.a.a.r) from the fourth quarter, with auto sales and

IV-19
housing-related purchases providing much of the impetus for growth.Manufacturing shipments increased 3.2 percent in January and 0.8 percent inFebruary, the first back-to-back monthly increases since 1999. In January, thegain was broad-based as 18 out of 21 sectors experienced growth, with the motorvehicle industry being a notable exception. February’s increase, conversely, waslargely the result of a 9.1 percent (monthly rate) increase in motor vehicleshipments, as shipments excluding motor vehicles actually fell 0.4 percent. InMarch the PMI survey, which includes both manufacturing and service sectors,rose for the third consecutive month to its highest level since May 2001.
Residential construction, a key component of growth in the fourth quarter,continued to show strength throughout the first quarter. In the first quarter,housing starts increased 19 percent from the fourth quarter, reaching atwelve-year high. Auto sales extended their fourth quarter run-up, with theaverage of January and February new vehicle sales running 3.5 percent (quarterlyrate) above the fourth quarter level. Business confidence recovered sharply inthe first quarter, returning to a level not seen since the end of 2000.
The unemployment rate in March declined to 7.7 percent from 7.9 percent inFebruary. The Canadian economy added a net of 88,000 jobs in March, thehighest one-month increase in the 26-year history of the series.
The twelve-month rate of consumer price inflation rose to 1.8 percent in March,largely on account of higher vegetable, electricity, and tobacco prices.Excluding energy and food prices, the twelve-month rate stood at 2.2 percent inMarch, up from 1.8 percent in February.

IV-20
Canadian Economic Indicators(Percent change from previous period except as noted, s.a.)
Indicator
2001 2002 2001 2002
Q3 Q4 Q1 Dec. Jan. Feb. Mar.
GDP at basic prices -.3 .3 n.a .2 .6 .5 n.a
Industrial production -2.2 -1.7 n.a -.9 1.7 1.7 n.a.
New mfg. orders -3.6 -4.7 n.a -2.1 4.0 2.2 n.a.
Retail sales -.7 2.6 n.a 1.5 1.3 -.1 n.a.
Employment -.1 .1 .7 -.1 .5 .0 .6
Unemployment rate1 7.2 7.7 7.8 8.0 7.9 7.9 7.7
Consumer prices2 2.7 1.1 1.5 .7 1.3 1.5 1.8
Consumer attitudes3 107.9 114.1 125.9 ... ... ... ...
Business confidence3 93.0 117.6 141.5 ... ... ... ...
1. Percent.2. Percent change from year earlier, n.s.a.3. Level of index, 1991 = 100.n.a. Not available. ... Not applicable.

IV-21
External Balances(Billions of U.S. dollars, s.a.a.r.)
Countryand balance
2001 2002
Q3 Q4 Q1 Dec. Jan. Feb. Mar.
Japan
Trade 52.0 52.7 72.4 50.7 59.8 60.6 96.8Current account 87.8 101.1 n.a. 97.3 112.0 100.7 n.a.
Euro areaTrade1 61.5 82.7 n.a. 85.0 10.8 43.3 n.a.Current account1 26.8 53.7 n.a. 47.1 -15.9 21.9 n.a.
GermanyTrade 48.5 46.7 n.a. 58.5 62.3 50.8 n.a.Current account 3.7 25.5 n.a. 14.8 5.4 35.8 n.a.
FranceTrade 1.2 1.3 n.a. .5 2.1 .7 n.a.Current account 5.6 4.6 n.a. 5.2 5.6 2.2 n.a.
ItalyTrade 2.1 15.1 n.a. 15.6 4.4 7.1 n.a.Current account1 9.3 9.9 n.a. -2.5 -28.4 -.4 n.a.
United KingdomTrade -46.3 -48.2 n.a. -55.3 -42.8 -44.7 n.a.Current Account -13.7 -43.7 n.a. ... ... ... ...
CanadaTrade 31.1 32.0 n.a. 34.5 38.1 34.2 n.a.Current Account 10.2 8.2 n.a. ... ... ... ...
1. Not seasonally adjusted.n.a. Not available. ... Not applicable.

IV-22

IV-23

IV-24
Economic Situation in Other Countries
Since the last Greenbook, evidence of economic recovery in the majordeveloping countries has mounted, with the exceptions of Argentina, Venezuela,and Hong Kong. Argentina’s economic and financial crisis deepened, but withlittle spillover to other emerging market economies to date. Inflation in mostcountries has remained well contained.
Over the intermeeting period, the economic environment continued todeteriorate in Argentina. Banking conditions worsened even further as legalchallenges by depositors allowed for continued drain in deposits. In late April,Economy Minister Jorge Remes Lenicov resigned after his proposal to convert alarge amount of deposits into government bonds was rejected by the congress.He was replaced by Roberto Lavagna. To address the deposit drain, followingRemes Lenicov’s resignation the Argentine congress approved a measure toslow the legal process that has been allowing many depositors access to theirfunds. However, this is only a stop-gap measure and the government is expectedto unveil a plan similar to that proposed by Remes Lenicov.
Argentine banks reopened on April 29, after being closed for one week. Sincemid-April, the peso has appreciated 5½ percent on balance, closing at P2.95/$ onApril 30, reflecting very tight liquidity conditions. International reserves stoodat $12.3 billion on April 29, down from $13.3 billion in mid-March. Observersare watching to see whether Argentina’s central government and provinces takethe steps that they promised to take in a statement issued on April 25. Thisstatement promises to reform the bankruptcy law, stimulate the economy,undertake fiscal reforms, improve relations with the international financialcommunity, and revoke an “economic subversion” law that has been used toharass bank executives. IMF staff will again visit Argentina in mid-May, butprospects for an IMF agreement within the next few weeks are unclear.Nevertheless, hoping that an agreement with the IMF can be completed in June,the Argentine government is attempting to obtain a bridge loan to enable it tomake a sizeable payment to the World Bank in May.
Data releases since the last Greenbook continue to paint a picture of an economyin distress; industrial production continued to fall in March, putting it more than25 percent below its peak in mid-1998, and consumer confidence remaineddepressed. Inflation continued to rise, reflecting the effects of the collapse of thepeso. The CPI has increased a total of 9 percent in 2002 through March, andanalysts estimate that inflation in April was at least 6 percent. The depressedstate of the economy has contributed to an improvement in the trade balance.

IV-25
Argentine Economic Indicators(Percent change from previous period, s.a., except as noted)
Indicator 2000 20012001 2002
Q4 Q1 Jan. Feb. Mar.
Real GDP1 -1.9 -9.9 -18.5 n.a. ... ... ...
Industrial production -1.8 -5.4 -5.4 -3.3 -1.2 .1 -.3
Unemployment rate2 15.1 17.4 18.3 ... ... ... ...
Consumer prices3 -.7 -1.5 -1.6 4.2 .6 4.0 7.9
Trade balance4 1.2 6.3 11.1 17.6 15.8 18.9 18.0
Current account5 -10.3 -5.6 .6 n.a. ... ... ...
1. Annual rate. Annual figures are Q4/Q4.2. Percent, n.s.a. Data are released for May and October only. Figures for Q4 reflect data
for October.3. Percent change from year-earlier period, except annual figures, which are Dec./Dec.4. Billions of U.S. dollars, annual rate.5. Billions of U.S. dollars, n.s.a., annual rate.n.a. Not available. ... Not applicable.
In Mexico, there are signs that the economy is turning around. Overalleconomic activity (a monthly index that proxies for real GDP) and industrialproduction posted significant gains in February. Business confidence hascontinued to rise and in March was at about the level that prevailed around early2000. After several quarters of decline, exports stabilized in the first quarterand, as imports continued to fall, the trade deficit narrowed. The unemploymentrate was up a bit in March.
In mid-April, the Bank of Mexico (BOM) surprised observers by looseningmonetary policy (through a relaxation of the “corto”) only two months aftertightening policy in February. The BOM argued that its February tightening hadrestrained inflation expectations and thus helped keep price increases in linewith this year’s 4½ percent target–the twelve-month rise in consumer prices inMarch was 4.7 percent–thereby justifying the subsequent loosening. However,the policy move is increasingly being viewed by markets as aimed at weakeningthe peso because of concerns that the strength of the currency may hinder aneconomic recovery. Since the monetary policy decision, the peso hasdepreciated over 3 percent against the dollar.

IV-26
Mexican Economic Indicators(Percent change from previous period, s.a., except as noted)
Indicator 2000 20012001 2002
Q4 Q1 Jan. Feb. Mar.
Real GDP1 4.9 -1.5 -.9 n.a. ... ... ...
Overall economic activity 6.5 -.1 -.4 n.a. -.1 .6 n.a.
Industrial production 6.0 -3.3 -1.0 n.a. -.3 .7 n.a.
Unemployment rate2 2.2 2.5 2.8 2.7 2.8 2.5 2.7
Consumer prices3 9.0 4.4 5.2 4.7 4.8 4.8 4.7
Trade balance4 -8.0 -10.0 -11.0 -7.3 -6.2 -9.8 -5.8
Imports4 174.5 168.4 163.1 160.1 158.8 164.4 157.1
Exports4 166.5 158.4 152.1 152.9 152.7 154.6 151.3
Current account5 -17.7 -17.7 -23.2 n.a. ... ... ...
1. Annual rate. Annual figures are Q4/Q4.2. Percent; counts as unemployed those working one hour a week or less.3. Percent change from year-earlier period, except annual figures, which are Dec./Dec.4. Billions of U.S. dollars, annual rate.5. Billions of U.S. dollars, n.s.a., annual rate.n.a. Not available. ... Not applicable.
In Brazil, data releases since the last Greenbook have provided further evidenceof economic recovery. Industrial output rose nearly 5 percent between Octoberand February, putting it about 2 percent below its year-earlier level. However,retail sales were flat on balance over the January-February period, and consumerconfidence remains at a low level. Inflation rose in March, driven by rises ingovernment-controlled gas and electricity rates, bringing twelve-month inflationto 7.8 percent. The rebound in economic activity contributed to a narrowing inthe trade surplus in the first quarter.
At its mid-April meeting, the central bank left its target for the overnight interestrate unchanged at 18.5 percent, after having reduced the rate 50 basis points intwo steps earlier this year. The central bank cited its concern that the recent risein the price of oil makes it increasingly likely that inflation, by the end of thisyear, will still exceed the 5.5 percent upper limit of the government’s inflationtarget range.

IV-27
Brazilian Economic Indicators(Percent change from previous period, s.a., except as noted)
Indicator 2000 20012001 2002
Q4 Q1 Jan. Feb. Mar.
Real GDP1 4.1 -2.3 -6.5 n.a. ... ... ...
Industrial production 6.6 1.5 -.3 n.a. 1.4 .3 n.a.
Unemployment rate2 7.1 6.2 7.5 7.3 7.5 7.4 7.0
Consumer prices3 6.0 7.7 7.5 7.6 7.6 7.5 7.7
Trade balance4 -.7 2.6 9.2 4.6 7.7 -1.8 7.8
Current account5 -24.6 -23.2 -23.0 -12.9 -13.7 -13.1 -12.0
1. Annual rate. Annual figures are Q4/Q4.2. Percent. “Open” unemployment rate.3. Percent change from year-earlier period, except annual figures, which are Dec./Dec. Price
index is IPC-A.4. Billions of U.S. dollars, annual rate.5. Billions of U.S. dollars, n.s.a., annual rate.n.a. Not available. ... Not applicable.
In Venezuela, political events have taken center stage since the last Greenbook.In early April, tensions between President Hugo Chavez and workers atVenezuela’s state-owned oil company led to work stoppages that paralyzed theoil industry. The strike escalated into mass anti-government demonstrations thatculminated in violence and the brief ouster of Chavez by a faction of themilitary, supported by a loose coalition of business and labor groups. With thehelp of loyal troops and militant civilian supporters, Chavez reclaimed thepresidency after only two days. Since his return, Chavez has called for nationalunity and has changed the leadership of the oil company to appease the workers,but many analysts are skeptical that his conciliatory stance will last once he hasconsolidated power. Tensions in the country remain high and the politicalupheaval has brought into even sharper relief the divisions within the militaryand between the business community and the poor.
On the economic front, conditions are also precarious. Over the twelve monthsended March, consumer prices rose 17.6 percent, up notably from previousmonths, as the effect of February’s move to a floating currency continues to feedinto prices. Anecdotal reports are that investment has all but ceased and that thenumber of unemployed has jumped sharply.

IV-28
Venezuelan Economic Indicators(Percent change from previous period, s.a., except as noted)
Indicator 2000 20012001 2002
Q4 Q1 Jan. Feb. Mar.
Real GDP1 5.7 n.a. n.a. n.a. ... ... ...
Unemployment rate2 13.4 13.3 11.8 n.a. 16.4 n.a. n.a.
Consumer prices3 13.4 12.3 12.4 14.6 12.3 13.7 17.6
Non-oil trade balance4 -10.8 n.a. n.a. n.a. n.a. n.a. n.a.
Trade balance4 18.0 n.a. n.a. n.a. n.a. n.a. n.a.
Current account5 13.4 4.4 -1.8 n.a. ... ... ...
1. Annual rate. Annual figures are Q4/Q4.2. Percent, n.s.a.3. Percent change from year-earlier period, except annual figures, which are Dec./Dec.4. Billions of U.S. dollars, annual rate.5. Billions of U.S. dollars, n.s.a., annual rate.n.a. Not available. ... Not applicable.
Economic conditions in Korea have further strengthened over the intermeetingperiod. In the first quarter, industrial production was up 1.4 percent andconsumption rose sharply, while consumer confidence reached a five-year high.Moreover, government spending in the first quarter was boosted by preparationsfor hosting the World Cup in June. The trade and current account balances alsoimproved in the first quarter, as exports rebounded while imports wereessentially flat. Inflation remains well within the central bank’s 2 to 4 percenttarget range, but strong growth indicators in the first quarter have raisedconcerns that inflationary pressures are mounting. As a result, the newlyappointed Governor of the Bank of Korea, Park Seung, signaled that interestrates would be raised soon. The Finance Ministry also changed hands over theintermeeting period and the new minister, Jeon Yun Churl, is thought likely toaccelerate reforms and bolster investor confidence. Even before hisappointment, Moody’s upgraded its sovereign debt rating of Korea to A3 as aresult of Korea’s improved macroeconomic performance and progress onstructural reforms.

IV-29
Korean Economic Indicators(Percent change from previous period, s.a., except as noted)
Indicator 2000 20012001 2002
Q4 Q1 Feb. Mar. Apr.
Real GDP1 5.1 4.4 6.4 n.a. ... ... ...
Industrial production 16.9 1.7 2.2 1.4 -4.0 3.7 n.a.
Unemployment rate2 4.1 3.7 3.4 3.0 2.8 2.9 n.a.
Consumer prices3 2.8 3.2 3.3 2.5 2.7 2.3 2.5
Trade balance4 16.9 13.4 7.8 19.4 11.6 23.1 n.a.
Current account5 12.2 8.6 4.2 7.2 4.6 13.1 n.a.
1. Annual rate. Annual figures are Q4/Q4.2. Percent.3. Percent change from year earlier, except annual changes, which are Dec./Dec.4. Billions of U.S. dollars, annual rate.5. Billions of U.S. dollars, n.s.a., annual rate.n.a. Not available. ... Not applicable.
Recent data for the ASEAN region continue to indicate that a recovery has beenunderway. Thailand, the last to report fourth-quarter real GDP numbers, grew8.8 percent (s.a.a.r.). Since the last Greenbook, industrial production in theregion continued to rebound, putting each country’s production well above itsfourth-quarter level.
The region continued to report strong trade surpluses in January and February,and in most cases the first-quarter trade surplus is on pace to exceed that of thefourth quarter. Exports have, in general, been above fourth-quarter levels,although imports have also risen somewhat. With the exception of Indonesia,inflationary pressures have been kept at bay.

IV-30
ASEAN Economic Indicators: Growth(Percent change from previous period, s.a., except as noted)
Indicator and country 2000 20012001 2002
Q4 Q1 Jan. Feb. Mar.
Real GDP1
Indonesia 7.3 1.2 3.4 n.a. ... ... ...Malaysia 6.4 -.9 7.1 n.a. ... ... ...Philippines 3.9 3.8 3.9 n.a. ... ... ...Singapore 11.4 -6.4 5.6 n.a. ... ... ...Thailand 3.5 2.1 8.8 n.a. ... ... ...
Industrial production2
Indonesia3 11.6 .7 .3 n.a. 1.6 7.3 n.a.Malaysia 19.1 -4.1 -.5 n.a. 3.6 5.3 n.a.Philippines 14.9 -.4 4.7 n.a. .2 n.a. n.a.Singapore 15.3 -11.6 4.5 7.4 17.9 -5.6 2.0Thailand 3.3 1.3 3.3 .6 -.1 .4 4.1
1. Annual rate. Annual figures are Q4/Q4.2. Annual figures are annual averages.3. Staff estimate.n.a. Not available. ... Not applicable.
ASEAN Economic Indicators: Trade Balance(Billions of U.S. dollars, s.a.a.r.)
Country 2000 20012001 2002
Q4 Q1 Jan. Feb. Mar.
Indonesia 28.6 25.2 25.8 n.a. 27.9 31.2 n.a.
Malaysia 16.0 14.4 13.0 n.a. 19.2 13.2 n.a.
Philippines 6.7 2.6 5.9 n.a. 10.1 4.0 n.a.
Singapore 3.3 5.8 6.5 6.5 16.4 .8 2.3
Thailand 5.5 2.5 2.7 2.9 .1 3.7 4.9
n.a. Not available.

IV-31
ASEAN Economic Indicators: CPI Inflation(Percent change from year earlier, except as noted)
Country 20001 200112001 2002
Q4 Q1 Jan. Feb. Mar.
Indonesia 9.3 12.5 12.6 14.5 14.4 15.1 14.1
Malaysia 1.3 1.2 1.2 1.4 1.1 1.2 2.1
Philippines 6.7 4.1 4.7 3.6 3.8 3.4 3.6
Singapore 2.1 -.6 -.2 -.8 -1.1 -.6 -.9
Thailand 1.4 .8 1.1 .6 .8 .3 .6
1. December/December.
China recorded 8.5 percent (s.a.a.r.) growth in real GDP in the first quarter.This was above even the most optimistic expectations of private-sector analysts.Strong growth in investment, consumption, and net exports, were all cited byChinese officials as contributing to first-quarter growth. The March figure onthe trade balance was in line with the average level for last year, but was downconsiderably from the first two months of this year. Both exports and importsare up about 20 percent over fourth-quarter levels. Industrial production alsocontinued to rise at a robust pace in the first quarter. Despite all of the signs ofstrong economic activity, consumer prices continued to fall and are now0.8 percent below their year ago levels.
What little data we have received for Hong Kong since the last Greenbooksuggest that economic conditions remain weak. The three-month averageunemployment rate hit 7 percent in March, a new high. Consumer prices havecontinued to fall, although at a somewhat slower pace than in the previous fewmonths. The trade balance recorded a smaller deficit in the first quarter than inthe fourth quarter, but exports remain weak.
Recent indicators for Taiwan point to a recovery in economic activity.Industrial production rose 3.6 percent in the first quarter, as the economycontinued to rebound from last year’s slowdown. The unemployment rate hasstabilized, after rising most of last year. The trade balance also improved in thefirst quarter, although the March data were significantly weaker than theprevious two months. Consumer prices were flat in March after rising inFebruary, a big change from the almost 2 percent deflation experienced last year.

IV-32
Chinese Economic Indicators(Percent change from previous period, s.a., except as noted)
Indicator 2000 20012001 2002
Q4 Q1 Jan. Feb. Mar.
Real GDP1 8.0 7.5 7.1 8.5 ... ... ...
Industrial production2 11.4 8.9 8.5 8.2 18.6 2.7 10.9
Consumer prices2 1.5 -.3 -.1 -.6 -1.0 .0 -.8
Trade balance3 24.1 23.1 34.2 40.3 42.5 55.4 22.9
1. Annual rate. Quarterly data estimated by staff from reported four-quarter growth rates.Annual figures are Q4/Q4.
2. Percent change from year earlier. Annual figures are year over year.3. Billions of U.S. dollars, annual rate. Imports are c.i.f.... Not applicable.
Hong Kong Economic Indicators(Percent change from previous period, s.a., except as noted)
Indicator 2000 20012001 2002
Q4 Q1 Jan. Feb. Mar.
Real GDP1 6.9 -1.8 -.8 ... ... ... ...
Unemployment rate2 5.1 4.9 6.1 7.0 6.7 6.8 7.0
Consumer prices3 -2.1 -3.5 -2.1 -2.6 -3.4 -2.3 -2.1
Trade balance4 -11.0 -11.4 -7.6 -4.5 -15.5 5.4 -3.5
1. Annual rate. Annual figures are Q4/Q4.2. Percent. Monthly numbers are averages of the current and previous two months.3. Percent change from year-earlier period, except annual figures, which are Dec./Dec.4. Billions of U.S. dollars, annual rate. Imports are c.i.f.... Not applicable.

IV-33
Taiwan Economic Indicators(Percent change from previous period, s.a., except as noted)
Indicator 2000 20012001 2002
Q4 Q1 Jan. Feb. Mar.
Real GDP1 3.9 -1.8 10.3 n.a. ... ... ...
Unemployment rate2 3.0 4.6 5.3 5.3 5.4 5.2 5.3
Industrial production 7.4 -7.3 1.4 3.6 3.8 .7 2.2
Consumer prices3 1.7 -1.7 -.6 -.1 -1.7 1.4 .0
Trade balance4 8.3 15.6 21.0 22.9 26.5 28.1 14.0
Current account5 8.9 19.0 28.2 n.a. ... ... ...
1. Annual rate. Annual figures are Q4/Q4.2. Percent.3. Percent change from year-earlier period, except annual figures, which are Dec./Dec.4. Billions of U.S. dollars, annual rate. Imports are c.i.f.5. Billions of U.S. dollars, n.s.a., annual rate.n.a. Not available. ... Not applicable.