greenbook part 2 - federal reserve system · confidential (fr) class iii fomc october 22, 2003...
TRANSCRIPT

Prefatory Note The attached document represents the most complete and accurate version available based on original copies culled from the files of the FOMC Secretariat at the Board of Governors of the Federal Reserve System. This electronic document was created through a comprehensive digitization process which included identifying the best-preserved paper copies, scanning those copies,1
and then making the scanned versions text-searchable.2
Though a stringent quality assurance process was employed, some imperfections may remain. Please note that some material may have been redacted from this document if that material was received on a confidential basis. Redacted material is indicated by occasional gaps in the text or by gray boxes around non-text content. All redacted passages are exempt from disclosure under applicable provisions of the Freedom of Information Act. 1 In some cases, original copies needed to be photocopied before being scanned into electronic format. All scanned images were deskewed (to remove the effects of printer- and scanner-introduced tilting) and lightly cleaned (to remove dark spots caused by staple holes, hole punches, and other blemishes caused after initial printing). 2 A two-step process was used. An advanced optical character recognition computer program (OCR) first created electronic text from the document image. Where the OCR results were inconclusive, staff checked and corrected the text as necessary. Please note that the numbers and text in charts and tables were not reliably recognized by the OCR process and were not checked or corrected by staff.
Content last modified 5/20/2009.

Confidential (FR) Class III FOMC
Part 2 October 22, 2003
CURRENT ECONOMICAND FINANCIAL CONDITIONS
Recent Developments
Prepared for the Federal Open Market Committeeby the staff of the Board of Governors of the Federal Reserve System

Confidential (FR) Class III FOMC
October 22, 2003
Recent Developments
Prepared for the Federal Open Market Committeeby the staff of the Board of Governors of the Federal Reserve System

Domestic NonfinancialDevelopments

Domestic Nonfinancial Developments
OverviewThe pace of the economic expansion appears to have picked up substantially.Consumer spending and the demand for housing were quite strong in the thirdquarter, and business outlays for capital equipment appear to have accelerated.Meanwhile, activity in the labor market seems to be leveling out, and industrialproduction has firmed in recent months. Core consumer prices have risensomewhat faster over the past several months than they did earlier in the year;even so, the twelve-month change in core CPI prices was only 1.2 percent inSeptember, a full percentage point less than the increase during the precedingyear.
Labor Market DevelopmentsThe labor market appears to be stabilizing. Total nonfarm payrolls rose 57,000in September, and the July and August declines in employment now areestimated to have been smaller than previously reported.' The averageworkweek of production or nonsupervisory workers held steady last month atAugust's upward-revised level of 33.7 hours. Aggregate hours of productionworkers were unchanged in September, although hours for the third quarter as awhole were nearly 1 percent (annual rate) below those for the second quarter. 2
Private payroll employment climbed 72,000 in September, the first increasesince January. The largest gain was in professional and business services, whichadded 66,000 jobs in September-half of them at temporary help supply firms.Employment also increased in most other major industries in September. Keyexceptions were manufacturing and the related wholesale trade industry,although even in these sectors, the pace of job loss (29,000 and 5,000respectively) was somewhat slower than in previous months. Governmentemployment fell 15,000 in September as a large cutback in local education morethan offset gains at the federal and state level and elsewhere in localgovernment.
In the household survey, the unemployment rate in September was unchanged at6.1 percent, and the labor force participation rate ticked down further, to66.1 percent. The number of job losers unemployed less than five weeks as apercent of household employment moved down for the fourth month in a row,but the number of individuals unemployed more than twenty-six weeks as a
1. The Bureau of Labor Statistics' preliminary estimate of the benchmark revision to thelevel of payroll employment in March 2003 is a downward revision of 145,000, or 0.1 percent-small relative to the average absolute revision of 0.3 percent over the preceding ten years.
2. However, because of a sharp rise in hours of the self-employed, total hours of all personsin the nonfarm business sector will likely show an increase in the third quarter.

II-2
CHANGES IN EMPLOYMENT
(Thousands of employees; based on seasonally adjusted data)
2003 20032002 H1 Q3 July Aug. Sept.
-Average monthly change-Nonfarm payroll employment¹ -39 -49 -14 -57 -41 57
Private -55 -36 -2 -39 -39 72Previous -55 -36 n.a. -56 -67 n.a.Manufacturing -57 -55 -45 -61 -46 -29Construction -4 12 12 4 19 14Wholesale trade -7 -6 -8 -11 -9 -5Retail trade -6 -7 2 -6 1 10Transportation and utilities -4 -11 -0 -10 -2 12Information -14 -11 -8 -7 -14 -4Financial activities 5 14 6 9 -2 10Professional and business services -10 6 39 57 -5 66
Temporary help services 1 8 23 19 18 33Non-business services 2 45 23 3 -11 21 0
Total government 16 -13 -12 -18 -2 -15
Total employment (household survey) 31 217 -55 -260 147 -52
Memo:Aggregate hours of private production
workers (percent change)¹³ -1.0 -1.7 -0.9 -0.4 0.3 0.0Average workweek (hours)¹ 33.9 33.7 33.7 33.6 33.7 33.7
Manufacturing (hours) 40.5 40.3 40.2 40.1 40.2 40.4
Note. Average change from final month of preceding period to final month of period indicated.1. Survey of establishments.2. Non-business services comprises education and health, leisure and hospitality, and "other."3. Annual data are percent changes from Q4 to Q4. Quarterly data are percent changes from
preceding quarter at an annual rate. Semiannual data are percent changes from Q4 to Q2.Monthly data are percent changes from preceding month.
n.a. Not available.
Private Payroll Employment Growth Aggregate Hours of Production orNonsupervisory Workers
Thousands of employees 2002= 100-- 500 -i 106

SELECTED UNEMPLOYMENT AND LABOR FORCE PARTICIPATION RATES
(Percent; based on seasonally adjusted data)
2003 20032002 Ql Q2 Q3 July Aug. Sept.
Civilian unemployment rate(16 years and older) 5.8 5.8 6.2 6.1 6.2 6.1 6.1
Teenagers 16.5 17.2 18.6 17.5 18.4 16.6 17.620-24 years old 9.7 9.2 10.4 10.5 10.3 10.3 10.9Men, 25 years and older 4.7 4.9 5.3 5.2 5.2 5.3 5.0Women, 25 years and older 4.6 4.4 4.6 4.7 4.7 4.6 4.8
Labor force participation rate 66.6 66.3 66.4 66.2 66.2 66.2 66.1
Teenagers 47.4 45.2 45.1 44.2 44.3 44.3 43.920-24 years old 76.4 75.5 75.9 75.5 75.4 75.3 75.7Men, 25 years and older 75.9 75.3 75.6 75.5 75.4 75.5 75.4Women, 25 years and older 59.4 59.6 59.8 59.5 59.6 59.6 59.2
Labor Force Participation Rateand Unemployment Rate Pe
nonegc- Participation rate (left scale)
- Sept.-
Unemployment rate (right scale), , , I , , I , , ,. I , , , I , , , I , , , I , , , I , , , I , , , I , , ,
1994 1995 1996 1997 1998 1999 2000 2001 2002 2003
rcent7.0
6.5
6.0
5.5
5.0
4.5
4.0
3a5
Job Losers(Less than 5 weeks)
(Percent of household employment) Percent
- 1.3
- 1.2
- 1.1
apt.- 1.0
- 0.9
- 0.8
, 0.7
Long-term Unemployed(More than 26 weeks)
(Percent of labor force)
Percen67.4
67.2
67.0
66.8
66.6
66.4
66.2
66.0
Percent- 1.6
lept.- 1.4
1.2
1.0
0.8
0.6
0.4
0.2
L 0.0
_

Labor Market Indicators
Unemployment Insurance
Millions4.5 -week moving average
|4-week moving average
4.0 |
1.5 1
Insured unemployment c"(left scale)
- Initial claims(right scale)
990 1992 1994 1996 1998 2000 2002 2004
Exhaustion Rate
Thousands1 550
Layoff AnnouncementsThousands
- 250
Note. Seasonally adjusted by FRB staff.Source. Challenger, Gray and Christmas, Inc.
Net Hiring StrengthPercent
- 30
Percent-- 1 50
--L -4 1 L 20990 1992 1994 1996 1998 2000 2002 2004
Note. Seasonally adjusted by FRB staff. Exhaustion rateis the number of individuals who exhausted their benefitswithout finding a job, expressed as a share of the indi-viduals who began receiving benefits six months earlier.
Current Labor Market ConditionsIndex
- -- 150
I I I I I I I I 501990 1992 1994 1996 1998 2000 2002 2004
Note. The proportion of households believing jobsare plentiful, minus the proportion believing jobs arehard to get, plus 100.
Source. Conference Board.
Small Business Hiring Plans
Percent- - 25
- 20
15
10
5
0
-51990 1992 1994 1996 1998 2000 2002 2004
Note. Percent planning an increase in employmentminus percent planning a reduction.
Source. National Federation of Independent Businesses.
I I I I I I I I I I I I 0190 1992 1994 1996 1998 2000 2002 2004
Note. Percent planning an increase in employmentminus percent planning a reduction.Source. Manpower, Inc.
I . . . . . . . . . .
500UU
~

percent of the labor force edged up. These figures suggest that layoffs arecontinuing to subside but that hiring remains depressed.
This interpretation of the labor market is reinforced by other data. The four-week moving average of initial claims for unemployment insurance has declineda bit recently, reaching 391,000 in the week ending October 11. Similarly,layoff announcements, as tracked by the outplacement firm Challenger, Gray,and Christmas, Inc., remain well below the level in the first half of the year.However, the four-week moving average of insured unemployment has changedlittle since early August, and the proportion of unemployment insurancerecipients who exhausted their benefits remained elevated in September.Moreover, household perceptions of job availability, as reported in theConference Board survey, deteriorated further in September and now stand attheir lowest level since December 1993.
In contrast, a large fraction of firms participating in the Manpower surveydeclared plans to boost hiring in the fourth quarter, although the net marginremains well below its first-quarter level.³ And, despite a downtick inSeptember, the third-quarter average of the volatile survey on small businesshiring plans, reported by the National Federation of Independent Businesses, isnear the upper end of the range of the past few years.
Industrial ProductionConditions in the industrial sector have improved somewhat in recent months.Industrial production posted a noticeable increase of 0.4 percent in September.Although much of the strength in output last month reflected a jump in motorvehicle assemblies, manufacturing output excluding motor vehicles and partsstill moved up 0.2 percent.4 For the third quarter as a whole, industrialproduction expanded at an annual rate of 3.3 percent, and capacity utilizationturned up after having reached a twenty-year low in the second quarter.Production gains have apparently become more widespread across industries inthe third quarter, as the diffusion index of three-month percent changes in IP hasnow registered above 50 three months in a row.
Increased production of high-tech goods contributed 1.3 percentage points to theoverall change in IP in the third quarter. In particular, the production ofsemiconductors advanced at an annual rate of more than 50 percent, the fastestquarterly increase in this category since the second quarter of 2000. The recent
3. Manpower participants reported the fourth-quarter hiring plans as of the third quarter. Interms of their usefulness in predicting employment changes, we believe these reported plansactually pertain to the remainder of the third quarter following the survey and to October.
4. According to our industry contacts, production in a few industries, such as motor vehiclesand steel, was briefly affected by Hurricane Isabel; nonetheless, most of the lost productionappears to have been made up within the month.

II-6
Selected Components of Industrial Production(Percent change from preceding comparable period)
Proportion 20032 200332002 2002¹
Component (percent) Q2 Q3 July Aug. Sept.
Total 100.0 1.4 -3.7 3.3 .8 -.1 .4Previous 100.0 1.4 -3.8 ... .7 .1
Manufacturing 84.6 1.0 -2.9 2.9 .5 -.3 .7Ex. motor veh. and parts 77.5 .1 -2.0 1.3 .3 -.1 .2
Ex. high-tech industries 72.2 -.5 -3.0 -.3 .2 -.4 .1
Mining 6.0 -1.9 -.1 3.1 .0 .4 .0Utilities 9.3 7.7 -13.2 7.1 3.5 1.8 -2.2
Selected industriesHigh technology 5.3 7.1 13.3 25.6 2.1 2.9 1.5
Computers 1.2 19.9 18.4 20.5 1.7 2.0 2.0Communications equipment 1.7 -16.6 -3.0 -4.7 -1.1 1.0 -1.7Semiconductors 4 2.4 19.8 22.4 52.6 4.4 4.6 3.1
Motor vehicles and parts 7.1 10.9 -11.7 21.6 3.2 -1.9 6.6
Market groups excludingenergy and selected industriesConsumer goods 22.5 -1.3 -.7 -2.5 -.4 -.5 .0Durables 3.5 .5 -3.2 -.5 .1 .2 -.5Nondurables 19.0 -1.6 -.3 -2.9 -.5 -.7 .1
Business equipment 7.2 -6.0 -3.6 3.0 .2 .4 .0Defense and space equipment 1.9 4.9 6.3 8.2 .2 .8 1.0
Construction supplies 6.7 .8 -2.3 .5 .1 .3 -.1Business supplies 7.5 .3 -4.7 -.7 -.1 -.6 .3
Materials 25.5 .9 -5.2 -.2 .6 -.6 .2Durables 13.6 .6 -6.1 1.6 .9 -.6 .0Nondurables 11.9 1.3 -4.2 -2.1 .2 -.7 .3
1. Fourth-quarter to fourth-quarter change.2. Annual rate.3. Monthly rate.4. Includes related electronic components.... Not applicable.
Capacity Utilization(Percent of capacity)
1972- 1990- 20032002 1982 91 [ Q3 Aug. Sept.
Sector average low low Q1 Q2 Q3 Aug. Sept.
Total industry 81.3 70.8 78.6 75.2 74.2 74.6 74.5 74.7
Manufacturing 80.2 68.6 77.2 73.2 72.5 72.9 72.7 73.1High-tech industries 79.3 75.6 74.6 62.1 62.6 64.6 64.9 65.3Excluding high-tech industries 80.2 68.1 77.3 74.7 74.0 74.2 73.9 74.4
Mining 86.9 78.6 83.3 84.4 84.3 84.9 85.0 84.9Utilities 86.7 77.2 84.2 86.9 82.9 83.4 84.5 82.4

acceleration has been concentrated in high-value microprocessors. Elsewhere inthe high-tech sector, the third-quarter increase in computer production, at anannual rate of just over 20 percent, was about even with the average gain in thefirst half of the year. A pickup in demand for mobile computing equipmentaccounted for much of the strength in overall PC shipments. In contrast, theoutput of communications equipment, which has continued to founder, fell at anannual rate of nearly 5 percent.
Forward-looking indicators for the high-tech sector have been, on balance,positive: Intel's latest revenue projections are consistent with anothernoticeable rise in semiconductor production in the fourth quarter. The latestprojections by Gartner call for PC shipments to rise modestly in the fourthquarter, although shipments of servers are expected to decrease. New ordersfor communications equipment have stabilized, and a diffusion index of futurespending on data-networking equipment (such as routers, switches, and hubs),compiled by CIO Magazine, moved up in August and September. However,anecdotal reports from our business contacts indicate that industry conditionsare still mixed. In addition, days' supply for communications equipment, asmeasured by the staff's flow-of-goods system, remains elevated, a factor thatmay hinder production for a while longer.
In the energy sector, electricity generation pulled back in September, whentemperatures returned to more normal levels after an unusually hot July andAugust. In contrast, the production of manufactured energy goods and oil andgas extraction posted solid gains-the result, in part, of a response to the sharprise in energy prices over the same period.
Among the various IP market groups excluding energy, high-tech, and motorvehicles and parts, most categories registered output gains in September.Prod uction of consumer nondurable goods edged up after having fallen in theprevious two months, as did the output of business supplies. Production ofbusiness equipment was held down, in part, by continued declines in the outputof commercial aircraft; Boeing recently announced further reductions in itsplanned assemblies, a move that suggests that the level of production in thiscategory will remain tepid through early next year. The production of defenseand space equipment registered another outsized gain in September.Construction supplies dropped back, but for the quarter as a whole, output inthis category was up a bit from the average level recorded in the second quarter.
The forward-looking indicators of near-term production suggest that the recentexpansion in activity in the industrial sector will continue in coming months.For example, the ISM index of new orders moved up in September to its highestlevel in nine months, and the index of order backlogs was at its highest level inmore than a year. The various diffusion indexes of new orders published by the

Indicators of Manufacturing Activity
Weekly Physical Product Data ExceptElectricity Generation and Motor Vehicles
New Orders: ISM andFRB Philadelphia Surveys
Diffusion index70
FRB Philadelphia survey ct 65
- 60
55
50
45
ISM 40
1997 1998 1999 2000 2001 2002 2003 2004Note. The diffusion index equals the percentage of
respondents reporting greater levels of new orders, plusone-half the percentage of respondents reporting thatnew orders were unchanged.
Export Share of ManufacturingExcluding Motor Vehicles
Percent- 20
3-month moving average
- 18
Aug.
- 14
1997 1998 1999 2000 2001 2002 2003
Note. The export share is the ratio of the value of exportsto the value of domestic shipments.
Source. Census Bureau.
Industrial Production Diffusion Index
Index-i 70
Sept
I-4- 40
- 30
1997 1998 1999 2000 2001 2002 2003 2004Note. The diffusion index equals the percentage of
series that increased over three months plus one-half thepercentage that were unchanged.
Boeing Commercial Aircraft Completions
1997 = 100- - 1603-month moving average
140
130
120
110
1009080
-1- 70
60I, . I .I 0 I 50
1997 1998 1999 2000 2001 2002 2003 2004 2005Note. 1998 price-weighted index. Actual completions equal
deliveries plus the change in the stock of finished aircraft.Data through September are actual completions;
Import Share of ManufacturingExcluding Motor Vehicles
Percent28
3-month moving average- 26
Aug 22
20
S- 18
- 16
- 14
, , I , , I , , I , , , I ,., I , , , I , , I 121997 1998 1999 2000 2001 2002 2003
Note. The import share is the ratio of the value of importsto the value of domestic shipments plus net imports.
Source. Census Bureau.
- 3U~LI

II-9
Indicators of High-Tech Manufacturing Activity
Microprocessor Unit (MPU) Shipmentsand Intel Revenue
Billions of dollars, ratio scale- 9.0
- 8.5Intel revenue Q3 ~ -Intel revenue Q4 8.07.5
7.06.56.05.55.0
4.5
4.0
Worldwide MPU shipments 3.5
I I I I I I 3.01996 1998 2000 2002 2004
Note. Q4 is the range of Intel's guidance as of October 15, 2003.Source. Intel and Semiconductor Industry Association.
U.S. Server Shipments
Millions of units, ratio scale0.66
0.60
0.54
4 0.48
1999 2000 2001 2002 2003Note. FRB seasonals. Value for Q4 is a Gartner forecast.Source. Gartner.
High-Tech Capacity Utilization Rates
Percent- 100
Computers and peripherals and semiconductors
90
80
70
Sept. 60
Communications equipment 50
1 98 I I I 0 I 1 I , , I I I 401998 1999 2000 2001 2002 2003
U.S. Personal Computer Shipments
Millions of units, ratio scale
Note. FRB seasonals. Value for Q4 is a Gartner forecast.Source. Gartner.
Days' Supply of Computers and Peripherals,Communications Equipment, and Semiconductors
January 1999 = 100- -140
Communications equipment - 1
130
- 120
Semiconductors- 110
- 100
Computers and peripherals - 90
1999 2000 2001 2002 2003
Source. Board staffs flow-of-goods system.
CIO Magazine Future SpendingDiffusion Index
Index-i 75
2001 2002 2003Note. The diffusion index equals the percentage of respon-
dents planning to increase future spending plus one-half thepercentage of respondents planning to leave future spendingunchanged. The average number of respondents per monthfrom February 2001 to September 2003 was 273.
Source. CIO Magazine.

II-10
Sales of Automobiles and Light Trucks(Millions of units at an annual rate, FRB seasonals)
2003 2003
2002 Q1 Q2 Q3 July Aug. Sept.
Total 16.7 15.8 16.2 17.5 17.2 18.9 16.6
Autos 8.1 7.7 7.4 7.9 7.8 8.2 7.5Light trucks 8.6 8.1 8.8 9.7 9.4 10.6 9.0
North American¹ 13.5 12.5 12.9 14.2 13.9 15.4 13.2Autos 5.9 5.5 5.4 5.8 5.8 6.1 5.4Light trucks 7.6 6.9 7.5 8.4 8.1 9.3 7.8
Foreign-produced 3.3 3.4 3.3 3.4 3.3 3.5 3.3Autos 2.2 2.2 2.0 2.1 2.0 2.2 2.1Light trucks 1.1 1.2 1.3 1.3 1.3 1.4 1.2
Memo:Medium and heavy trucks .40 .37 .39 .45 .45 .44 .45
Note. Components may not sum to totals because of rounding. Data on sales of trucks and imported autos for the mostrecent month are preliminary and subject to revision.
1. Excludes some vehicles produced in Canada that are classified as imports by the industry.
Average Value of Incentives on Light Vehicles
Ratio scale, current dollars per vehicle
Fleet and Retail Sales of Light Vehicles
Millions of units
2000 2001 2002 2003
Note. Weighted average of customer cash rebate andinterest rate reduction. Data are seasonally adjusted.
Source. J.D. Power and Associates.
1998 1999 2000 2001 2002 2003
Note. Annual rate. FRB seasonals.
Michigan Survey Index of Car-Buying Attitudes
1998 1999 2000 2001 2002 2003
Note. Data are preliminary.

II-11
New Orders for Durable Goods(Percent change from preceding period except as noted; seasonally adjusted)
Proportion, 2003Component 2003: H1 -
(percent) Q1 Q2 June July Aug.
Total orders 100.0 0.7 -0.2 2.5 1.6 -1.1
Adjusted orders' 75.0 0.6 -0.8 1.5 1.7 -2.4Computers 4.0 -4.7 13.4 3.4 3.5 -1.9Communication equipment 4.0 25.6 -8.9 0.4 13.4 -4.5Other capital goods 24.0 2.0 0.3 1.9 -1.9 -0.3Other2 43.0 -1.4 -2.0 1.2 2.5 -3.3
MEMOReal adjusted orders ... 1.0 -0.5 1.7 1.8 -2.2
Excluding high tech ... 0.2 -1.2 1.8 1.0 -2.6
1. Orders excluding defense capital goods, nondefense aircraft, and motor vehicle parts.2. Primary metals, most fabricated metals, most stone, clay, and glass products, household
appliances, scientific instruments, and miscellaneous durable goods.... Not applicable.
regional Federal Reserve Banks, some of which are available through October,have been similarly upbeat. Furthermore, although the staffs series for realadjusted durable goods orders declined in August, a three-month movingaverage of this volatile series suggests that, on balance, orders have improvedmodestly over the past few months. On the downside, data on import and exportshares indicate that the net trade position for manufacturing outside of motorvehicles has shown little improvement as yet in response to the decline in theexchange value of the dollar since early 2002.
Motor VehiclesAfter having surged in August, sales of autos and light trucks receded to anannual rate of 16.6 million units in September. For the third quarter as a whole,sales of light vehicles averaged 17.5 million units (annual rate), up 1-1/2 millionunits from the average sales pace over the first half the year. During thesummer, consumer demand for vehicles probably was boosted by the sharpincrease in sales incentives in July and August. The tax cuts that becameeffective at mid-year may also have played a role. Incentives fell back a bit inSeptember and slid still further in early October. Nevertheless, according to theMichigan survey, consumer car-buying attitudes moved back up in earlyOctober to a very positive level. In contrast, business demand for light vehicle

II-12
Production of Domestic Autos and Trucks(Millions of units at an annual rate except as noted; FRB seasonal basis)
2002 2003 2003Item
Q4 Q1 Q2 Q3 June July Aug. Sept.
U.S. production 12.4 12.4 11.7 12.3 11.9 12.2 11.8 13.0Autos 4.9 4.7 4.4 4.6 4.5 4.5 4.3 4.9Trucks 7.5 7.7 7.3 7.7 7.4 7.7 7.4 8.0
Days' supply' 63 74 70 62 70 65 55 67
Inventories2 2.73 3.01 2.96 2.88 2.96 2.95 2.76 2.88
NOTE. Components may not sum to totals because of rounding.1. Quarterly values calculated with end-of-period stocks and average reported sales; excludes
medium and heavy trucks (classes 3-8).2. End-of-period stocks; excludes medium and heavy trucks.
Share of Motor Vehicle Leases in Total Sales UAW Membership
Percent Millions of members
2002
1980 1985 1990 19950
. 4
2000 2005
Source. J.D. Power and Associates. Source. UAW year-end financial reports. Includes active and retired.
Domestic Market Share of Big Three
Percent
Q3
1986 1987 1988 1989 1990 1991 1992 1993 1994 1995 1996 1997 1998 1999 2000 2001 2002 2003 2004 2005
A

II-13
fleets edged lower in the third quarter, to 3.1 million units, a sales rate a bitbelow the average in 2002.5
Total motor vehicle production jumped sharply to an annual rate of 13 millionunits in September. For the third quarter as a whole, production was at a12.3 million unit rate, up from 11.7 million units in the second quarter. Thesupply of light vehicles held in inventory averaged sixty-two days in the thirdquarter, down from averages of well over seventy days during the first half ofthe year. The industry currently expects sales in the fourth quarter to averagebelow their high third-quarter pace, and production is scheduled to drop back toan 11.9 million unit pace.
The UAW union recently ratified four-year agreements with the Big Three andparts suppliers Delphi and Visteon.6 According to industry reports, a keyobjective for the UAW was to make the Big Three more competitive andpreserve union jobs, and in pursuit of this objective, the union was prepared tomake some concessions on compensation and plant closings. The membershipof the UAW has fallen from its 1979 peak of 1.5 million to less than 640,000 in2002. 7
Under the new contracts, workers immediately receive a $3,000 signing bonusand will get another bonus equal to 3 percent of their wages in the second year.They will receive a 2 percent base-wage increase in the third year and a3 percent increase in the fourth year.8 The UAW estimates that union memberswill see their base wages, including COLAs, rise an average of 2-3/4 percent ineach year of the agreement. 9 Retirement benefits were little changed, as was thehealth care package, which is provided free of charge to employees. For the BigThree, the costs per vehicle of providing health and retirement benefits to their
5. In the NIPA, vehicles leased to consumers are captured in business spending rather thanin PCE. In recent years, the Big Three have favored incentive programs that encourageconsumers to purchase their vehicles rather than lease them. In the 1990s, the Big Threesupported vehicle sales with lucrative lease deals, which later turned out to be unprofitable.According to data from J. D. Power and Associates through September of this year, the share ofleases in motor vehicle sales has averaged about 12 percent, down from an average of almost30 percent in 2000.
6. The UAW's official name is the United Automobile, Aerospace and AgriculturalImplement Workers of America.
7. In recent years, the UAW has been able to offset its steep losses in manufacturing to asmall extent by successfully organizing some employees in the service sector.
8. Workers will continue to receive a cost-of-living adjustment (COLA) every three months,but the amount of the COLA will be reduced by 2 cents each quarter. In the 1999 agreement,workers received a 3 percent base-wage increase in each year of the agreement in addition to theCOLA. They also received a $1,350 signing bonus.
9. The UAW reports that an average union-represented assembler earns $25.60 an hour andhas an average annual salary of $70,200 per year.

II-14
Retail and Food Services Sales(Percent change; seasonally adjusted)
2003
Category Q1 Q2 Q3 July Aug. Sept.
Total sales 1.4 1.4 2.9 1.4 1.2 -.2Previous estimate ... ... 2.4 1.3 .6 ...
Retail control¹ 1.9 .1 2.7 1.0 1.3 .1Previous estimate ... ... 2.0 .9 .8 ...
GAF² .2 1.3 3.2 1.2 1.0 .2Gasoline stations 7.6 -6.4 3.6 1.8 3.5 .3Food services 2.3 2.3 2.3 .4 2.0 -1.4Other retailers³ 1.9 .1 2.2 .9 .8 .4
1. Total retail trade and food services less sales at building material and supply stores and automobileand other motor vehicle dealers.
2. Furniture and home furnishing stores; electronics and home appliance stores; clothing andaccessories stores; sporting goods, hobby, book, and music stores; and general merchandise stores.
3. Health and personal care stores, food and beverage stores, electronic shopping and mail orderhouses, and miscellaneous other retailers.
... Not applicable.
Real PCE Goods Real PCE Services
Billions of chained (1996) dollars Billions of chained (1996) dollars- 2800 - - 3800
* Quarterly average ept. * Quarterly averageAug.
- 2700- 3700
- 2600
- - 3600
- 2500
Excluding autos and trucks - - 3500- 2400
S l ' I , , l-I , , I-I 2300 J,- I , , , I- , ,-I- , I , 34002000 2001 2002 2003 2000 2001 2002 2003
Change in Real Personal Income and Real DPI
S Real personal incomeReal DPI
Percent, annual rate18
- 16
- 14
- 12
- 10
- 8
6
4
2
0
-2H2 Q1
2002Q2 July Aug.
2003

II-15
employees currently outstrip the same costs of other domestic auto producers bywide margins.10
Consumer SpendingReal personal consumption expenditures appear to have fallen back inSeptember after having surged in July and August." This pattern largelyreflects a swing in consumer purchases of motor vehicles, which reversed theirJuly-August run-up last month. However, apart from motor vehicles, outlaysalso rose at a solid pace in August and appear to have declined only slightly inSeptember. Spending has been supported of late by the sizable boost todisposable personal income from the recently enacted tax cuts as well as bylevels of wealth and confidence that are considerably above their values earlierthis year.
In September, nominal sales in the retail control group of stores, which excludesautomotive dealers and building materials and supply stores, ticked up0.1 percent after having posted a robust 1.3 percent in August. Factoring in theeffect of rising gasoline prices, we estimate that real retail control fell0.1 percent in September after having jumped 0.8 percent in August. For thethird quarter as a whole, real retail control skyrocketed at an annual rate of9.8 percent.
Real outlays for services rose modestly in August, the most recent month forwhich official estimates are available. The increase was driven by a rise inspending for energy services. Expenditures for other services, which continuedto advance at a lackluster pace, were held back, in part, by continued weaknessin travel and recreation spending.
Real disposable income advanced 0.6 percent (at a monthly rate) in August afterhaving jumped 1.3 percent in July, with both increases reflecting sizablereductions in tax payments. Real pre-tax income was essentially unchanged inboth months.
The early October rise in the Michigan Survey Research Center's index ofconsumer sentiment just offset the decline in September. The Conference Boardmeasure of consumer sentiment also fell some in September. These measures ofconfidence have changed little, on balance, in recent months and stand wellabove their March lows.
10. For example, Prudential Securities estimates that GM spends $1,360 per vehicle onhealth and retirement benefits, Ford spends $734, and Chrysler $631; the comparable figures forToyota and Honda are $180 and $107, respectively.
11. The September decrease does not appear to be attributable to Hurricane Isabel, whichlikely had negligible effects on aggregate consumer spending.

II-16
Household Indicators
Household Net Worth and Wilshire 5000
Index Ratio15000 - - 7.0
13000 - - 6.5
11000 6.01OOO - \ Sept.
9000 - Ratio of household net worth to DPI - 5.5
(right scale)7000 - Q2 - 5.0
Wilshire 50005000 - (left scale) - 4.5
3000 4.0
1994 1995 1996 1997 1998 1999 2000 2001 2002 2003
Personal Saving RatePercent
7
- 6
5
1994 1995 1996 1997 1998 1999 2000 2001 2002 2003
Consumer Confidence
1985 =100 1966 =100160 - - 120
140 - 110
120 - Michigan SRC Index I I I I 100-
(right scale) Oct (p )
160 - - 8120
Michigan SR Conference Board Index Sept
60 - (leftscale) 70
........ l................................... ^.......

II-17
Housing MarketsHousing construction and sales remained very strong in August and Septembereven though mortgage rates were above the extremely low levels briefly reachedat the beginning of the summer. In the single-family sector, new homes werestarted at an annual rate of 1.52 million units in September, only slightly belowthe blistering pace seen in June and July. 12 Permit issuance-adjusted foractivity in areas where permits are not required-was roughly in line with startsin September, and the backlog of unused permits moved up, suggesting thatstarts will remain robust in coming months.
Sales of existing homes spiked to an annual rate of 6.47 million units in August,the fastest pace on record. In addition, sales of new homes moved back up inAugust to a level only a bit below June's record-setting rate. Taken together,these figures imply that commissions paid to real-estate brokers-a componentof residential spending-were robust in the third quarter.
Between June and August, the rate on fixed-rate mortgages moved up more than100 basis points, while the rate on one-year adjustable rate mortgages (ARMs)increased only 30 basis points. As a result, the share of new mortgageoriginations going to ARMs rose sharply in August, to 20 percent. This shiftmay have tempered the effect of rising rates on housing activity.
In the multifamily sector, starts rose to an annual rate of 368,000 units inSeptember, the highest pace since August 2002. The ratio of permits to startswas well below its historical level, suggesting that multifamily starts will bereduced in coming months.
Recent indicators signal a robust pace of housing activity going into the fourthquarter. Since August, rates on both fixed- and adjustable-rate mortgages havereversed part of the run-up of earlier in the summer. Consumer sentimenttoward homebuying, as measured by the Michigan Survey, improved noticeablyin early October to a level just a bit below its recent high in May. In addition,the Mortgage Bankers Association's index of mortgage applications for thepurchase of a home (as opposed to refinancing) moved down only slightly in themiddle of October from its recent high.
The most recent data on house prices show that the median price for existinghomes sold in August was 9-3/4 percent higher than during August 2002, upfrom a 5-1/4 percent increase during the preceding twelve months. In contrast,the repeat-sales price index for existing homes, which partially adjusts for shifts
12. Hurricane Isabel appears to have had little effect on housing starts in September. Inaddition, using the aftermath of the significantly more destructive Hurricane Andrew as a guide,we expect that replacement and repair spending in the wake of Isabel will have only a minoreffect on overall construction outlays.

II-18
Private Housing Activity(Millions of units; seasonally adjusted annual rate)
2003
Sector 2002 Q1 Q2 Q3P Julyr Aug.r Sept.P
All unitsStarts 1.70 1.74 1.74 1.87 1.89 1.83 1.89Permits 1.75 1.75 1.78 1.85 1.80 1.90 1.86
Single-family unitsStarts 1.36 1.41 1.42 1.51 1.53 1.47 1.52Permits 1.33 1.35 1.37 1.46 1.43 1.48 1.47Adjusted permits¹ 1.38 1.39 1.40 1.51 1.48 1.52 1.53
New home sales 0.97 0.98 1.09 n.a. 1.11 1.15 n.a.
Existing home sales 5.57 5.87 5.83 n.a. 6.13 6.47 n.a.
Multifamily unitsStarts 0.35 0.33 0.32 0.36 0.36 0.35 0.37Permits 0.42 0.41 0.41 0.39 0.37 0.42 0.39
Mobile homesShipments 0.17 0.14 0.13 0.13 0.14 0.13 n.a.
1. Adjusted permits equal permit issuance plus total starts outside of permit-issuing areas.p Preliminary. r Revised. n.a. Not available.
Private Housing Starts(Seasonally adjusted annual rate)
Millions of units-1 2.0

II-19
Indicators of Single-Family Housing
Mortgage Rates ARM Share of OriginationsPercent
-, 10
Fixed rate %
8
7
6
Adjustable rate Oct. 5
4,, , I , , I , , I , , , I , , , I , , . I 3
1998 1999 2000 2001 2002 2003
Note. The October reading is based on data throughOctober 17.
Source. Freddie Mac.
Perceived Homebuying Conditions
Diffusion index- - 190
- A -180
1998 1999 2000 2001 2002 2003
Source. Michigan Survey, not seasonally adjusted.
Prices of Existing Homes
PercentS 16
Change from year earlier - 14
- 12
S 10Repeat sales Aug.
02 64-2
Median - 2
0
S-2
, , , I I I l .I ' I '" I I -41998 1999 2000 2001 . 2002 2003
Source. National Association of Realtors and Freddie Mac.
Percent-. 40
Source. Federal Housing Finance Board.
MBA Index of Purchase Applications
Index- 450
4-week moving averageOct. 17A. Ann
I I I I I I I I I I 1 1 2001998 1999 2000 2001 2002 2003
Source. Mortgage Bankers' Association.
Prices of New Homes
Percent- - 16
Change from year earlier 14
- 12
-Median - 10
S6Q2 4
S|Aug- 2
quaity 0-2- -2
i t s e a l i i l u r l i a i e s s i -41998 1999 2000 2001 2002 2003
Source. Census Bureau.

II-20
Equipment and Software Investment Fundamentals
Real Business Output
Percent change, annual rate
Real Corporate Cash Flow
Percent change, annual rate
1990 1991 1992 1993 1994 1995 1996 1997 1998 1999 2000 2001 2002 2003
High-Tech
I I I I I I I I I I I I
User Cost of Capital*
1996 0 lo Non-High-Tech- 160
S140
- 120
100
- 80
- 60SQ3
I I1990 1992 1994 1996 1998 2000 2002 2004
*Excludes the effects of the partial expensing tax incentive.
40
30
20
10
0
-10
-20
-30
-40
1996= 100- 104

II-21
in the composition of homes sold, has shown a marked deceleration since early2001. This suggests that the acceleration of the unadjusted figures reflectscompositional shifts rather than a genuine acceleration in house values. Themedian price of new homes sold in August was up about 3 percent from theprevious August, the same increase as recorded during the year-earlier period.Quality-adjusted new home prices rose 3-3/4 percent during the year ending inthe second quarter, compared with a 3-1/4 percent increase during the precedingyear.
Equipment and SoftwareReal outlays for equipment and software in the third quarter appear to haveadvanced faster than the 8-1/4 percent annual rate recorded in the secondquarter. Business purchases of motor vehicles moved up a good bit in the thirdquarter, while aircraft expenditures declined. The apparently strong third-quarter increases in spending aside from that on transportation equipment areconsistent with the continued gains in business output and corporate cash flowas well as the low user cost of capital.
In the high-tech sector, nominal shipments of computing equipment dropped10 percent (monthly rate) in August-not quite enough to reverse the Julyincrease-and shipments of communications equipment receded a bit. But withprices for these goods falling, total real high-tech spending likely posted asizable gain in the third quarter as a whole. Outside of the high-tech sector,shipments weakened in August, with small declines in most subcategories; still,a solid showing in July put this category on track for a moderate third-quarterincrease. Looking forward, new orders for computers and peripherals havemoved up in line with shipments, and bookings for communications equipmentappear to have stabilized, albeit at a low level. While new orders apart fromhigh-tech edged down in August, they have increased, on balance, since thebeginning of the year-a development that suggests ongoing spending gains inthis category.
Outlays in the transportation sector appear to have risen in the third quarter,spurred importantly by stronger sales of medium and heavy (class 8) trucks.Part of the increase in business demand for these vehicles over the past twoquarters likely reflects the effects of partial expensing. In addition, sales ofheavy trucks this year have been supported by a string of incentive programsfrom manufacturers; the removal of incentives in July likely contributed to thesubsequent softening in orders for these vehicles. Meanwhile, domesticshipments and imports of aircraft moved down significantly in August fromelevated levels in July.
Nonresidential ConstructionSpending on nonresidential construction appears to be bottoming out. Afterhaving fallen 25 percent from October 2000 to August 2002, nominal outlays

II-22
Orders and Shipments of Nondefense Capital Goods(Percent change from preceding period; seasonally adjusted current dollars)
2003
Indicators Q1 Q2 June July Aug.
Annual rate Monthly rate
Shipments -5.1 5.7 3.8 2.2 -3.1Excluding aircraft -1.9 5.6 2.8 2.5 -2.5
Computers and peripherals 7.6 35.8 9.1 12.5 -9.9Communications equipment -3.5 -6.5 16.4 -1.8 -1.2All other categories -3.2 2.7 -.1 1.3 -1.1
Orders 1.1 12.9 3.6 1.5 -2.3Excluding aircraft 14.6 3.2 1.9 .5 -1.1
Computers and peripherals -17.5 65.1 3.4 3.5 -1.9Communications equipment 148.9 -31.2 .4 13.4 -4.5All other categories 8.2 1.0 1.9 -1.9 -.3
MemoShipments of complete aircraft¹ 29.5 25.8 33.5 - 33.8 25.7
1. From Census Bureau, Current Industrial Reports; billions of dollars, annual rate.
Computers and Peripherals
Billions of dollars, ratio scale
Other Equipment
Billions of dollars, ratio scale
2000 2001 2002 2003
Communications Equipment
Billions of dollars, ratio scale
Sales of Medium and Heavy Trucks
Millions of units, ratio scale
1999 2000 2001 2002 2003
Note. Annual rate, FRB Seasonals.Source. Ward's Communications.

II-23
Nonresidential Construction(Staff translation of CPIP data into traditional NIPA categories; seasonally adjusted annual rate)
Total Building Office
Ratio scale, billions of dollars1 224
1997 1998 1999 2000 2001 2002 2003
Other Commercial
Ratio scale, billions of dollars
Ratio scale, billions of dollars
Aug.
1997 1998 1999 2000 2001 2002 2003
Institutional
Ratio scale, billions of dollars146
1997 1998 1999 2000 2001 2002 2003
Lodging and MiscellaneousIndustrial
Ratio scale, billions of dollars
17 18 1 2000 2001 2 Aug.
1997 1998 1999 2000 2001 2002 2003

II-24
Indicators of Nonresidential Construction
Office Buildings
Property Values and Rent Vacancy Rate
Percent Percent- 4-quarter change - 20 - - 20
S- 15 103
S- -10
- - 1 5
0
-5Propery values Q2
V P - -10
I_ I I_ I l I III IIIIi -15 5Ii i I I I I Il I i I1990 1992 1994 1996 1998 2000 2002 2004 1990 1992 1994 1996 1998 2000 2002 2004
Source. National Real Estate Index. Source. Torto Wheaton Research.
Other Commercial Buildings
Retail Property Values and Rent Warehouse Property Values and RentPercent Percent
4-quarter change 10 4-quarter change 10Property values Property values
Rent - 5 - 5
Q2 Rent 00 0
Q2
S-5 - -5
I I I I I II I I III- 0IIIIIl l l ll- 0I I -101990 1992 1994 1996 1998 2000 2002 2004 1990 1992 1994 1996 1998 2000 2002 2004
Source. National Real Estate Index. Source. National Real Estate Index.
Industrial Buildings Drilling Activity
Vacancy Rate Rigs in Operation
Percent Numtx- - 12 - - 12
Q3
- 11
1- Natural gas rigs - 95(
_ - 80(
8 Oct- 50
7 Petroleum rigs
9- 20(
I I I I I I I I I I I I I 6 501990 1992 1994 1996 1998 2000 2002 2004 1990 1992 1994 1996 1998 2000 2002 2004
er50
)0
Note. August values are averages through October 17.Source. DOE/Baker Hughes.
Source. Torto Wheaton Research.

II-25
for the construction of privately owned buildings were about flat, on net, duringthe twelve months ending in August. However, there are few signs so far of asustained pickup in this sector.13
The recent sideways pattern of overall construction spending masks thedisparate performance of its principal components. Nominal spending on officespace continued to decline in August; office rents fell again in the secondquarter, and although vacancy rates edged down slightly in the third quarter,they remained at a very high level. In contrast, outlays for the construction ofother commercial buildings (such as those for retail and wholesaleestablishments) have moved higher in recent months despite falling rentsthrough at least the second quarter. 14 Spending on private institutional buildings(such as schools, churches, and hospitals) has continued its strong uptrend.
Among the smaller subsectors of nonresidential construction, spending onindustrial buildings continued to be very weak in August, and vacancy ratesmoved up again in the third quarter. Outlays for hotels and motels alsoremained depressed in August, although anecdotes suggest that spending in thissector may be reaching a trough. The increase in drilling and mining activitythrough October implies that outlays for drilling and mining structures are likelyto increase further this fall, albeit at a slower pace than seen in the secondquarter.
Business InventoriesThe book value of manufacturing and trade inventories excluding motorvehicles dropped in August after having edged down in July. Manufacturers ranoff stocks at a fairly rapid clip in both months, while wholesalers and retailers,excluding motor vehicles and parts dealers, recorded small declines in stocks inAugust after accumulations in July. Generally small changes in shipments andsales in the July-August period have kept book-value inventory-sales ratiosabout flat.
Days' supply for total IP in the flow-of-goods system edged up in Septemberbut remained below the average level recorded in the second quarter. Excludingmotor vehicles and parts, the inventory-consumption ratio edged down to arecord low. Among the various industries, only paper, communications
13. Again, with the aftermath of Hurricane Andrew as a guide, we do not expect thatreconstruction following Hurricane Isabel will make a significant contribution to overallnonresidential construction spending. Indeed, a portion of the repair work may be classified asan intermediate good (like repairs to business equipment) and therefore would not be reflected inthe spending figures.
14. Prices for office and other commercial buildings moved higher in the second quarterdespite declines in rents, perhaps because favorable financing conditions helped reduce the costof owning a building. Still, weak rents could threaten recovery in these sectors.

II-26
Changes in Manufacturing and Trade Inventories(Billions of dollars, seasonally adjusted book value, annual rate)
2002 2003 2003
Sector Q4 Q1 Q2 June July Aug.
Manufacturing and trade 43.7 55.7 -11.8 5.0 -26.4 -59.1Ex. wholesale and retail
motor vehicles & parts 15.1 23.4 -21.3 -11.0 -7.6 -17.3
Manufacturing 2.4 4.0 -10.1 -16.6 -22.8 -12.7Ex. aircraft 1.5 5.0 -7.7 -8.5 -14.1 -12.3
Wholesale trade 7.6 8.4 -8.1 -.5 1.7 -5.7Motor vehicles & parts 3.4 1.5 1.1 4.9 -7.4 -5.0Ex. motor vehicles & parts 4.2 6.8 -9.2 -5.4 9.1 -.7
Retail trade 33.8 43.4 6.4 22.1 -5.3 -40.7Motor vehicles & parts 25.3 30.8 8.4 11.1 -11.4 -36.8Ex. motor vehicles & parts 8.5 12.6 -2.0 11.0 6.1 -3.9
Book-Value Inventories Relative to Shipments and Sales
Retail trade ex. motor vehicles & parts
Inventory-Consumption Ratios, Flow-of-Goods SystemDays' supply

II-27
equipment, and, to a lesser degree, electrical equipment appear to have elevatedinventory-consumption ratios.
Federal Government SectorSpending resulting from the U.S. presence in Iraq and income tax cuts enactedunder the Jobs and Growth Tax Relief Reconciliation Act continue to putupward pressure on the federal unified budget deficit. The deficit for fiscal2003 was $374 billion, up substantially from the deficit of $158 billion recordedin the previous year. Limited progress is being made on the budget for fiscal2004, and the federal government is operating on a continuing resolution thatprovides funding through the end of October.
Federal receipts, totaled over August and September, fell almost 4 percent fromtheir corresponding year-earlier level owing to the effects of the tax legislationenacted in late May. The decline in individual income and payroll taxes overthe two months reflects the new withholding tables, reduced quarterlydeclarations, and the two waves of child-credit refund checks that were mailedout in early August. On balance, corporate receipts edged up over the two-month period relative to a year earlier despite provisions of the tax legislationthat both delayed about $5 billion of September payments to October 1 and helddown taxes by allowing partial expensing of certain investments.
Outlays, adjusted for financial transactions and payment-timing shifts, roseabout 8 percent in the August-September period from the year-earlier level.Apart from interest payments, which fell, increases were widespread, led by asizable rise in both defense and Medicaid outlays.
On the legislative front, only three of the thirteen regular appropriations bills forfiscal 2004 have been enacted into law. The House and Senate have passedsupplemental appropriations bills to fund activities in Iraq and Afghanistan. TheHouse-passed bill provides $66 billion for added defense spending and$21 billion in aid for reconstruction. The Senate version is similar, but itconverts a portion of the aid to Iraq into a loan.
State and Local Government SectorIndicators of spending by state and local governments have been mixed so far inthe third quarter. As of September, employment had fallen in almost everymonth since its high last February, with a cumulative drop of more than100,000. The cutbacks have been spread nearly equally between stategovernments and local governments and between education and non-educationalfunctions. Until September, the local education sector had not shown muchdeterioration in employment. But September was the start of the 2003-04academic year in most school districts, and last month's employment declineprobably reflected more recent budget decisions to cut education spending bymany governments that had previously hoped to spare education. Meanwhile,

II-28
Federal Government Outlays and Receipts(Unified basis; billions of dollars)
September 12 months ending in September
Percent PercentFunction or source 2002 2003 change 2002 2003 change
OutlaysFinancial transactions'Payment timing²Adjusted outlays
ReceiptsPayment timingAdjusted receipts
Surplus/deficit(-)
Adjusted outlaysNet interestNon-interest
National defenseSocial securityMedicareMedicaidIncome securityAgricultureOther
Adjusted receiptsIndividual income and
payroll taxesWithheld + FICANonwithheld + SECARefunds (-)
CorporateGrossRefunds (-)
Other
Adjusted surplus/deficit(-)
150.3-0.4
-12.2162.9
192.70.0
192.7
165.3-0.0
-13.1178.4
191.60.0
191.6
42.4 26.4
10.0
9.5
-0.5
-0.5
2,011.0-1.0-0.9
2,013.0
1,853.226.0
1,827.2
2,156.5-1.3-0.8
2,158.7
1,782.70.0
1,782.7
... -157.8 -373.8
Selected components of adjusted outlays and receipts
162.95.6
157.232.238.419.712.923.1
0.730.2
178.44.9
173.438.539.922.413.723.8
1.234.0
9.5-12.910.319.74.0
13.46.53.1
56.512.3
192.7 191.6 -0.5
148.2106.545.9
4.230.835.3
4.513.7
144.9105.843.5
4.430.334.5
4.116.4
29.8 13.3
2,013.0171.2
1,841.8347.7456.4231.3147.5309.5
24.3325.1
2,158.7154.7
2,004.0404.7474.7249.6160.7335.024.1
355.2
1,827.2 1,782.7
1,518.81,377.1
321.1179.4125.0188.463.4
183.4
1,464.31,368.8
289.0193.4131.8194.5
62.7186.6
7.2-9.68.8
16.44.07.98.98.2
-0.99.3
-2.4
-3.6-0.6
-10.07.95.43.2
-1.01.8
-185.8 -376.0
Note. Components may not sum to totals because of rounding.1. Financial transactions consist of deposit insurance, spectrum auctions, and sales of major assets.2. A shift in payment timing occurs when the first of the month falls on a weekend or holiday, or
when the first three days of a month are nonworking days. Outlays for defense, social security,Medicare, income security, and "other" have been adjusted to account for these shifts.
... Not applicable.

II-29
construction spending ticked up in August after having risen during most of thespring and summer months, and the average level in July and August stood1.8 percent above the average seen in the second quarter.
State legislatures are currently not considering fiscal issues, and lawmakers inmost states appear to be taking a break from addressing the budgetary pressuresthat were pervasive last spring. Many seem to be hoping that a strongerunderlying economy will bring receipts and spending into better alignment thisyear. Most states begin their next legislative sessions in January.
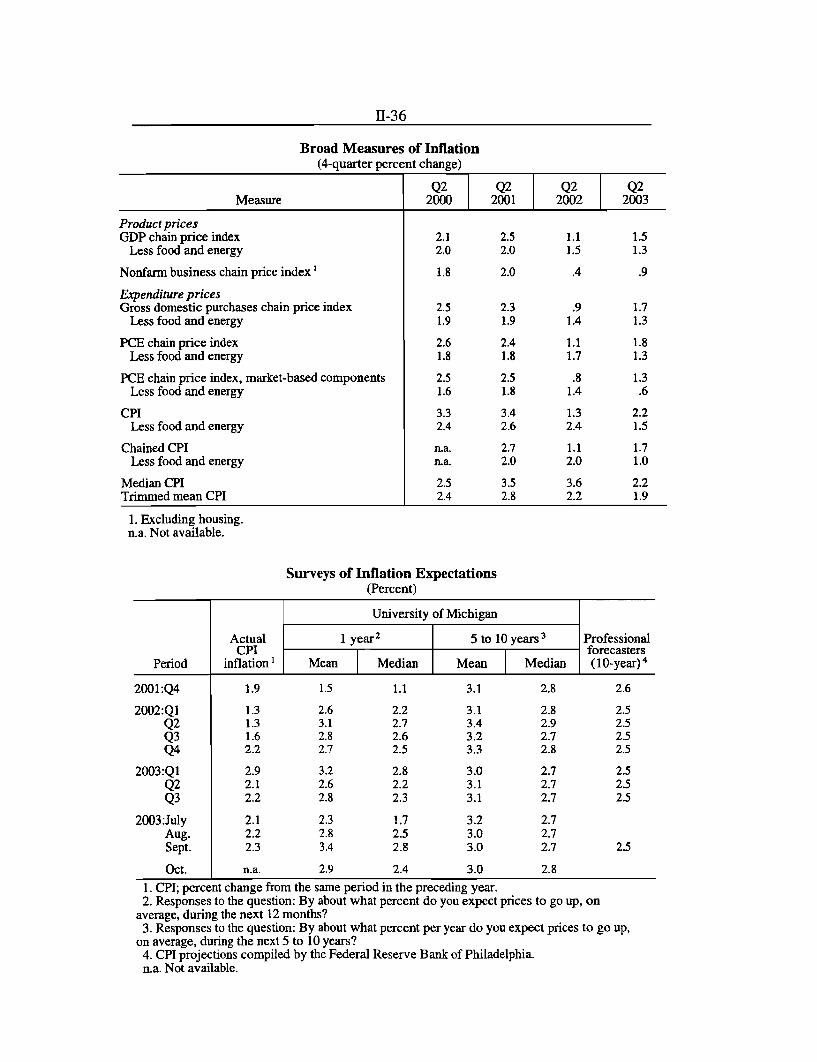
Prices and Labor CostsBoosted by a run-up in gasoline prices, the consumer price index rose0.3 percent in September. A sharp increase in energy prices over the precedingyear pushed up the September twelve-month change in the CPI to 2.3 percent,compared with 1.5 percent a year earlier.
Excluding food and energy, the CPI increased 0.1 percent in September after asimilar increase in August. Core consumer prices have risen somewhat fasterover the past several months than they did earlier in the year when core inflationwas depressed by a number of transitory factors. As of September, the twelve-month change in the core CPI stood at 1.2 percent, well below the2.2 percent increase recorded during the comparable period a year earlier. Theindex for core goods fell again last month and was 2.4 percent below its level ayear earlier, the largest twelve-month decline in more than fifty years. Coreservices prices rose 0.2 percent last month after a similar increase in August.Faced with continuing budget problems, many states raised university tuitionsharply for the current school year and thereby pushed up the CPI for educationservices during the summer. Even so, prices of non-energy services as a wholedecelerated 0.9 percentage point over the twelve months ending in September.
Core PCE prices edged up 0.1 percent in August. Over the twelve monthsending in August, core PCE prices increased 1.3 percent; the rise was1.7 percent during the comparable year-earlier period. The 0.4 percentage pointdeceleration in core PCE inflation between the two periods is noticeably lessthan the 1.0 percentage point deceleration in the core CPI over the same period.The difference between the two inflation measures is attributable in part to anappreciable acceleration in the prices of PCE items that are not included in theCPI and for which no market-based prices exist. The market-based componentof the core PCE price index decelerated 3/4 percentage point over the twelvemonths ending in August, to a 0.7 percent rate of increase. The core portion ofthe chained CPI, like PCE prices, uses a superlative aggregation formula toaccount for substitution by consumers in response to changes in relative prices;core chained CPI also rose 0.7 percent over the twelve months ending inSeptember, down 1.0 percentage point from the previous twelve-month period.

II-30
Measures of Inflation(Percent)
12-month change 3-month change 2003
Sept. Sept. June Sept.Measures 2002 2003¹ 2003 2003 Aug. Sept. ¹
Annual rate Monthly rate
CPITotal 1.5 2.3 -.7 3.1 .3 .3
Food 1.3 2.4 2.7 2.5 .3 .2Energy -4.8 14.7 -24.5 27.8 2.7 3.0Ex. food and energy 2.2 1.2 1.0 1.5 .1 .1
Ex. tobacco 2.2 1.3 1.1 1.4 .1 .1Core commodities -1.1 -2.4 -3.1 -2.3 -. 1 -.4Core services 3.6 2.7 2.9 2.9 .2 .2
Current-methods total 1.5 2.3 -.7 3.1 .3 .3Ex. food and energy 2.3 1.2 1.0 1.5 .1 .1
Ex. tobacco 2.2 1.2 1.1 1.4 .1 .1Chained CPI (NSA) 2 1.2 1.8 -- -- -- --
Ex. food and energy 2 1.7 .7 -- -- -- --
PCE PricesTotal 2.1 2.0 -.2 2.9 .3 .2
Food 1.5 2.2 2.6 2.1 .3 .2Energy -5.4 15.5 -27.0 29.5 2.8 3.2Ex. food and energy 2.7 1.2 1.2 1.7 .1 .1
Ex. tobacco 2.6 1.3 1.3 1.7 .1 .1Core commodities -1.1 -2.4 -2.7 -1.2 -. 1 -.2Core services 4.3 2.8 2.9 3.0 .2 .2
Core market-based 1.4 .6 .4 1.7 .1 .0Core nonmarket-based 7.4 3.5 4.3 1.9 .1 .2
PPITotal finished goods -1.8 3.5 -5.9 3.4 .4 .3
Food -2.9 6.6 5.1 6.8 .7 1.2Energy -6.3 12.9 -27.8 6.5 1.2 .1Ex. food and energy -.3 .1 -2.4 1.3 .1 .0
Ex. tobacco -.5 .6 -2.2 1.4 .1 .0Core consumer goods .1 -.1 -3.0 1.3 .1 .1Capital equipment -.9 .6 -1.7 1.4 .1 -.1
Intermediate materials -.6 3.7 -9.9 2.1 .5 -.1Ex. food and energy .5 1.7 -.9 .9 .1 .1
Crude materials 3.1 22.3 -36.4 -4.1 -1.4 3.4Ex. food and energy 8.6 11.1 -9.4 30.7 3.7 2.3
1. PCE prices in September are staff estimates.2. Higher frequency figures are not shown for data that are not seasonally adjusted.

II-31
Consumer energy prices moved up 3.0 percent in September on the heels of again of 2.7 percent in August. These increases reflected low inventories ofgasoline in August and a gasoline pipeline breakdown in Phoenix, which pushedwholesale and retail gasoline prices sharply higher through late August.Gasoline inventories moved up to normal levels in September, and markupsreverted to their historical values by the first week of October; nonetheless, thearithmetic of monthly averaging led to a large increase in the gasoline CPI inSeptember and implies a substantial decline in the gasoline CPI for October.
Earlier in the year, extremely tight inventories of natural gas and heating oilheightened concerns about possible shortfalls in the coming winter heatingseason. However, supplies of natural gas have since risen to normal levelsbecause of both higher production and temperate weather. Total distillate fueloil inventories have also returned to normal levels in recent months, but theheating oil component of distillate inventories remains below normal, especiallyin New England, the big consuming region for heating oil.
The CPI for food rose 0.2 percent in September, with pronounced increases forprices of beef and pork. Livestock prices have been pushed up by a ban onimports of live cattle from Canada, where a case of mad cow disease wasidentified this past spring.
The PPI for capital equipment edged down in September but was still0.6 percent above its level of a year earlier. Prices for core intermediatematerials rose 0.1 percent and were up 1.7 percent from a year earlier-anacceleration relative to the previous twelve-month period that, to a large extent,reflects sizable price increases for energy-intensive products. The majorindexes of spot commodity prices have moved higher since the SeptemberGreenbook. The Journal of Commerce industrial price index has increased5.8 percent, in part because of a pickup in prices for metals, crude oil, cotton,and plywood. The Commodity Research Bureau's spot industrial commodityprice index, which excludes energy and forest products, has increased9.2 percent.
Like consumer price inflation, most broad measures of total price inflation havebeen boosted over the past year by accelerating energy prices, while broadmeasures of core price inflation have generally moved a bit lower. In particular,the four-quarter change in the GDP price index excluding food and energy was1.3 percent in the second quarter, 0.2 percentage point below the pace recordeda year earlier.
According to the Michigan Survey, median year-ahead expected inflation fellback in early October to 2.4 percent, close to the average for the second andthird quarters. Median expected consumer price inflation over the next five toten years ticked up, to 2.8 percent, remaining in the narrow range that has

II-32
Core Consumer Price Inflation(12-month change except where noted)
CPI and PCE excluding Food and Energy
Percent
PCE excluding Food and Energy
Percent
* PCE for September is staff estimate.
CPI excluding Food and Energy(Current Methods)
Percent
CPI Services and Commodities
Percent
- Services ex. energy -
Sept.
Commodities ex. food and energy
A - Sept. -
1998 1999 2000 2001 2002 2003 2004
* Staff estimate.

II-33
Spot Prices of Selected Commodities(Percent change except as noted)
Memo:Current 12/31/02 9/9/03 52-weekprice to to change to
Commodity (dollars) 2001¹ 2002¹ 9/9/032 10/21/032 10/21/03
MetalsCopper (lb.) 0.910 -22.0 2.8 17.8 5.8 24.7Steel scrap (ton) 130.667 -17.7 49.2 32.6 1.6 26.9Aluminum, London (lb.) 0.680 -14.3 0.7 5.5 5.7 13.1
Precious metalsGold (oz.) 378.200 1.2 24.7 10.9 -1.1 21.0Silver (oz.) 5.100 -3.5 3.0 9.7 -2.9 15.1
Forest products³Lumber (m. bdft.) 293.000 25.0 -13.0 73.0 -15.3 48.0Plywood (m. sqft.) 550.000 3.2 -0.3 79.9 5.8 82.1
PetroleumCrude oil (barrel) 29.590 -16.3 65.8 -13.9 7.5 11.3Gasoline (gal.) 0.884 -28.0 54.6 12.3 -7.0 10.6Fuel oil (gal.) 0.831 -42.6 57.4 -13.0 10.4 11.0
LivestockSteers (cwt.) 108.990 -19.7 12.9 16.5 29.8 65.2Hogs (cwt.) 36.000 -9.9 -18.9 31.7 -8.9 28.6Broilers (lb.) 0.627 3.7 7.4 4.6 0.1 29.2
U.S. farm cropsCorn (bu.) 2.025 -4.1 19.2 0.9 -12.5 -15.6Wheat (bu.) 3.600 -8.9 30.4 -14.8 1.7 -29.3Soybeans (bu.) 7.120 -13.4 35.6 9.1 16.4 34.7Cotton (lb.) 0.705 -45.7 53.8 12.6 30.8 75.0
Other foodstuffsCoffee (lb.) 0.525 -35.3 1.1 32.6 -11.0 8.2
MemoJOC Industrials 102.000 -17.1 16.2 14.9 5.8 25.9JOC Metals 90.900 -17.0 9.5 12.9 6.2 19.3CRB Futures 244.790 -16.3 23.0 4.2 0.2 7.5CRB Spot Industrials 294.730 -14.6 14.4 8.6 9.2 22.4
1. Changes are from the last week of the preceding year to the last week of the year indicated.2. 9/9/03 is the Tuesday immediately preceding publication of the September Greenbook.3. Prices shown apply to the Friday before the date indicated.

II-34
Commodity Price Measures
Journal of Commerce IndexRatio scale, 1996=100
- 115
Oct. 105
95
85
75
65
Total- 104
L 102100
- 9896
- 94-92
Aug Sep Oct2003
Metals92
- 90
- 88
-84
--" ----- 82Aug Sep Oct
2003
CRB Spot IndustrialsRatio scale, 1967=100
I 360
CRB Industrials
- 290
- 280
- 270
' 260Aug Sep Oct
2003
CRB FuturesRatio scale, 1967=100 270
Oct. - 250
230
S210
- 190
'- - -- 250
245
- - 240
Aug Sep Oct 235
2003
L ll I JIJu IJIJJ 1 1 1 1 1 1 _ILdjd.JjI1jlI11 . 11 1 I 1111, 111 1701986 1988 1990 1992 1994 1996 1998 2000 2002 2004
Note. Larger panels show monthly average of weekly data through last available week. Smaller panels show weekly data, Tuesdays. Verticallines on small panels indicate week of last Greenbook. The Journal of Commerce index is based almost entirely on industrial commodities, witha small weight given to energy commodities, and the Commodity Research Board (CRB) spot price index consists entirely ol industrial commodities,excluding energy. The CRB futures index gives about a 60 percent weight to food commodities and splits the remaining weight roughly equallyamong energy commodities, industrial commodities, and precious metals. Copyright for Journal of Commerce data is held by CIBCR, 1994.

II-35
prevailed over the past two years. In September, the Philadelphia Fed publishedthe most recent quarterly survey of professional forecasters' long-term inflationexpectations, which remained unchanged at 2.5 percent.
We have received relatively little information about labor costs since theprevious Greenbook. Average hourly earnings of production or nonsupervisoryworkers on private nonfarm payrolls edged down 0.1 percent in September, to alevel 2.7 percent above a year earlier. That twelve-month increase was0.2 percentage point less than during the previous twelve-month period andmore than 1/2 percentage point below the pre-recession peak.
On benefits, the Survey of Employer-Sponsored Health Benefits conductedannually by the Kaiser Family Foundation and the Health Research andEducational Trust (HRET) showed that health insurance premiums increasednearly 14 percent, on average, between the spring of 2002 and the spring of2003. The Kaiser/HRET survey also indicated that health insurance costs rosesharply for both employers and workers, with the share of premiums paid bycovered workers holding virtually steady at 27 percent (for a family policy) in2003. For 2004, premiums in the Federal Employees Health Benefits Programare expected to rise 10-1/2 percent, the fourth consecutive double-digit increase.Also, Towers Perrin has released some preliminary results from its survey for2004, which show health insurance premiums increasing an average of11 percent for active workers.
II-36
Broad Measures of Inflation(4-quarter percent change)
Q2 Q2 Q2 Q2Measure 2000 2001 2002 2003
Product pricesGDP chain price index 2.1 2.5 1.1 1.5
Less food and energy 2.0 2.0 1.5 1.3
Nonfarm business chain price index 1.8 2.0 .4 .9
Expenditure pricesGross domestic purchases chain price index 2.5 2.3 .9 1.7
Less food and energy 1.9 1.9 1.4 1.3
PCE chain price index 2.6 2.4 1.1 1.8Less food and energy 1.8 1.8 1.7 1.3
PCE chain price index, market-based components 2.5 2.5 .8 1.3Less food and energy 1.6 1.8 1.4 .6
CPI 3.3 3.4 1.3 2.2Less food and energy 2.4 2.6 2.4 1.5
Chained CPI n.a. 2.7 1.1 1.7Less food and energy n.a. 2.0 2.0 1.0
Median CPI 2.5 3.5 3.6 2.2Trimmed mean CPI 2.4 2.8 2.2 1.9
1. Excluding housing.n.a. Not available.
Surveys of Inflation Expectations(Percent)
University of Michigan
Actual 1 year 2 5 to 10 years 3 ProfessionalCPI forecasters
Period inflation¹ Mean Median Mean Median (10-year) 4
2001:Q4 1.9 1.5 1.1 3.1 2.8 2.6
2002:Ql 1.3 2.6 2.2 3.1 2.8 2.5Q2 1.3 3.1 2.7 3.4 2.9 2.5Q3 1.6 2.8 2.6 3.2 2.7 2.5Q4 2.2 2.7 2.5 3.3 2.8 2.5
2003:Q1 2.9 3.2 2.8 3.0 2.7 2.5Q2 2.1 2.6 2.2 3.1 2.7 2.5Q3 2.2 2.8 2.3 3.1 2.7 2.5
2003:July 2.1 2.3 1.7 3.2 2.7Aug. 2.2 2.8 2.5 3.0 2.7Sept. 2.3 3.4 2.8 3.0 2.7 2.5
Oct. n.a. 2.9 2.4 3.0 2.81. CPI; percent change from the same period in the preceding year.2. Responses to the question: By about what percent do you expect prices to go up, on
average, during the next 12 months?3. Responses to the question: By about what percent per year do you expect prices to go up,
on average, during the next 5 to 10 years?4. CPI projections compiled by the Federal Reserve Bank of Philadelphia.n.a. Not available.

II-37
AVERAGE HOURLY EARNINGS(Percent change; based on seasonally adjusted data)
Percent change12-month to Sept. 2003
percent change from month indicated Percent change
Sept. Sept. Sept. Mar. June Aug. Sept.2001 2002 2003 2003 2003 2003 2003
- - - - - - - - - -Annual rate - - - - - - - - - - Monthly rate-
Total private nonfarm 3.7 2.9 2.7 2.1 1.8 0.2 -0.1
Manufacturing 3.5 3.2 3.0 2.6 3.1 0.4 0.3
Construction 2.4 3.4 2.0 2.0 1.3 0.2 0.2
Wholesale trade 2.6 1.2 2.1 2.2 1.6 0.2 0.1
Retail trade 3.7 3.5 2.0 2.2 2.0 0.2 0.0Transportation and
warehousing 2.0 2.6 3.3 1.6 1.2 -0.2 -0.1
Information 3.7 2.7 3.6 2.5 0.6 0.3 -0.8
Financial activities 3.9 4.6 5.3 5.9 2.4 0.1 -0.4Professional and
business services 5.2 2.6 2.0 0.2 0.0 0.1 -0.2Education and
health services 4.8 4.1 3.0 2.4 3.9 0.4 0.3
Leisure and hospitality 2.3 2.6 1.9 1.2 0.9 0.0 0.1
Other services 4.4 3.1 1.4 -0.3 0.6 0.1 0.1
Average Hourly Earnings forProduction or Nonsupervisory Workers
(12-month change)
Percent- 4.5
- 4.0

Appendix
The Household and Payroll Measures of Employment
Each month, the Bureau of Labor Statistics (BLS) publishes two independent estimatesof employment. The payroll employment measure is based on a survey ofestablishments conducted as part of the Current Employment Statistics program, and thehousehold measure of employment is based on a survey of households called theCurrent Population Survey. The payroll survey estimates the number of employees onnonfarm payrolls based on a sample of about 400,000 establishments that account forabout one-third of total nonfarm payroll employment. Each year, the payrollemployment estimates are benchmarked to a near-universe count of payrollemployment that is taken in March of the previous year from unemployment insurancetax records and other administrative data. In contrast, the household survey estimatesthe number of persons with a job by interviewing approximately 60,000 households.The household survey figures are inflated by monthly estimates of the population togenerate estimates of national employment and unemployment. Although the rawhousehold survey data are not revised, the population estimates used to inflate them areoccasionally updated to incorporate new information from decennial censuses and newestimates of immigration.
The two measures differ importantly in concept. First, the payroll survey tallies jobs,whereas the household survey counts the number of individuals with a job. Thus, aperson who holds multiple jobs at different establishments would appear more thanonce in the payroll survey but only once in the household survey. In addition tocovering wage and salary workers on nonfarm payrolls, the household survey's measureof employment includes unincorporated self-employed individuals, workers in privatehouseholds, unpaid family workers, workers on unpaid absences, and farm employees,all of whom are excluded from the payroll records of nonfarm establishments. At thesame time, the payroll survey includes wage and salary workers under the age of 16;these workers are excluded from the household survey.
The BLS has made major changes to both employment surveys over the past decade.Over the past several years, the payroll survey methodology has shifted from anarchaic, quota-sampling procedure to a probability sample of establishments. In 1994, amajor redesign of the household survey sharpened the clarity of its questions andimproved the interviewing techniques used in the survey. In addition, the householdsurvey adopted the North American Industrial Classification System (NAICS) for itsindustrial and occupational classifications in January 2003; the payroll survey estimateswere converted to NAICS in June 2003. How such changes may have altered thecomparability of the two measures of employment or their cyclical characteristics is notknown.
Reconciling the Levels of the Two Employment MeasuresEach month, the Board's staff adjusts household employment to the concept underlyingthe payroll survey insofar as the available data allow (table). We also incorporateestimates of the updates to the population controls over the historical period to which

II-A-2
they apply.¹ Although these adjustments, on net, reduce the level of householdemployment and narrow the discrepancy in the levels of the reported series, thedifference remains large (chart 1).
Over time, the discrepancy between the adjusted household measure and the payrollmeasure has had two components: one secular and one cyclical. The secular componenthas tended to expand as monthly household estimates progressively extend beyond themost recent update to Census population controls. Indeed, before the incorporation (inJanuary 2003) of the new controls for the 2000 decennial Census and the annual updateto the population estimates for immigration, the average monthly discrepancy wasaround 4.1 million. The updates to the population estimates eliminated about60 percent of that gap.
Regarding cyclical behavior, the payroll series has historically been more pro-cyclicalthan the adjusted household series. In the past, the inability of the payroll survey toadequately capture births and deaths of establishments as they occurred contributed toits cyclical pattern during the periods between annual benchmarks. But even afterbenchmarking, it remained more pro-cyclical than the household measure, andresearchers have not been fully able to explain why this is so. Among the possibleexplanations is an increase during periods of weak labor markets in work "off thebooks" of establishments, which might cushion the reported decline in householdemployment relative to the payroll measure. Another contributing factor may be relatedto the procedures for dealing with persons who do not respond to the household surveyeither because they refuse to participate or because the interviewers cannot reach them.Those procedures assume that the labor force characteristics of the nonrespondents arethe same as those for persons in a similar demographic group who are interviewed. Ifthose missed tend to be marginal workers who are less likely to be employed duringweak labor markets and more likely to hold jobs when employment is expanding, theprocedures would dampen the cyclicality of household employment. Finally, theexpanded use of multiweek pay periods may result in workers appearing on the payrollsof more than one establishment, and thus as employed more than once in the payrollsurvey- particularly when hiring is robust and workers are changing jobs more often.Such job changers would be counted as employed at only one job in the householdsurvey, which measures labor force activity during a single reference week during themonth.
Another unresolved issue in reconciling the two employment measures is an apparentbreak in the level of the gap between the two series. That break seems to coincide withthe introduction of the new household survey in 1994. Before 1994, the discrepancybetween the adjusted household series and the payroll series tended to fluctuate widelybut averaged close to zero; since then, the gap, while still seemingly cyclical, has beenpersistently negative-that is, the level of the adjusted household series has been belowthat of the payroll series.
1. The BLS typically does not revise its historical data to reflect updates to the populationcontrols; this omission can result in a noticeable break in the official time series, as it did inJanuary 2003.

II-A-3
Differences in Employment Changes Indicated by the Two MeasuresMore recently, attention has focused not on the levels of the two measures but on theirdivergent signals of the change in employment. For example, between the most recentrecession trough (November 2001) and September 2003, the payroll survey showed adecline of roughly 1 million jobs, while the official household survey indicated a rise of1 million; the increase in our adjusted household series was even larger--1-1/4 million. 2
That said, the labor market by either measure has been very weak during the pasttwenty-two months-with employment even somewhat weaker than during therecovery from the 1990-91 recession and much weaker than in earlier economicexpansions (chart 2).
Two upcoming revisions to the series are likely to change those estimates, and whetherthey will, on net, narrow the difference between the two is unclear. First, the BLSrecently reported that its preliminary tabulations of employment from first-quarterunemployment insurance tax records imply a downward revision of approximately145,000 in the level of payroll employment for March 2003; those revisions arescheduled for release with the preliminary estimates for January 2004. Taken alone,that change would increase the discrepancy between the changes indicated by the twoemployment measures. However, at the same time, the household survey figures willbe adjusted to new population controls that incorporate information on immigration inthe period since 2000. Because we believe that immigration has slowed recently, weanticipate that the upcoming adjustment may lower the estimate of the population andof its future rate of change and, thus, result in a lower reported level of householdemployment. The magnitude of this change is uncertain, but assuming that it goes inthe direction that we anticipate, it also would tend to reduce the recent increase inhousehold employment over the period since the recession trough.
The Two Surveys as Economic IndicatorsEach of the two surveys has strengths and weaknesses as an indicator of economicactivity. The principal advantage of the household survey is that it provides a broaderview of employment than does the payroll survey. However, measurement of many ofthe components of household survey employment that are missing from the payrollconcept may be subject to greater nonsampling reporting error than the components thatthe two surveys have in common. In addition, unlike the payroll estimates, the monthlyestimates from the household survey are not revised, and the sampling variation of thehousehold survey is noticeable. The approximate standard error for the month-to-month change in household employment is 177,000.³ By comparison, before its recentmajor redesign, the root mean squared error of the month-to-month change in payrollemployment was about 65,000. Finally, as noted earlier, the household survey
2. Changes in employment over shorter periods also diverge widely. In September 2003, theadjusted household survey was down 847,000 from its year-earlier level while payrollemployment was 427,000 lower-a difference of 420,00. In June, the adjusted householdfigures showed an increase of 780,000 from a year earlier while payroll employment wasestimated to have fallen 480,000-a difference of more than I million.
3. Information on the statistical characteristics of the two surveys is routinely available in anappendix, "Explanatory Notes and Estimates of Error," to the monthly Employment andEarnings volume published by the BLS.

II-A-4
questionnaire was redesigned in 1994. Although researchers have developed a goodunderstanding of how to bridge the old and new series, we do not know to what extentthe cyclical properties of the household measures of labor market activity may havechanged.
On balance, the Board's staff has found the payroll survey to be the more reliableindicator of current economic activity, although it also has a number of disadvantagesas a current indicator. For example, the monthly revisions to the preliminary estimatesof payroll employment have tended to be pro-cyclical. And, as noted earlier, before therecent redesign of the sample, preliminary payroll survey estimates were subject tolarge and systematic benchmark revisions. Before the changeover to the new sample,benchmark revisions to payroll employment were generally positively correlated withboth the change in payroll employment and with whether it was accelerating ordecelerating. They also tended to be positively serially correlated. Thus, the upcomingMarch 2003 adjustment of -145,000 is not necessarily surprising because payrollemployment was declining, on balance, over the period from March 2002 to March2003. 4 The recent statistical improvements in the payroll survey were, in part, intendedto improve its ability to estimate employment between benchmarks; whether theredesign will, over time, alter these earlier systematic patterns is unclear.
We also found that benchmark revisions to the change in payroll employment were notcorrelated with changes in household employment when information on initial claimsfor unemployment insurance was used to control for the stage of the business cycle. Ina recent report to the House Budget Committee, John Kitchen reports the oppositeresult.5 However, because he did not control for the stage of the business cycle andincluded only early stages of recoveries in his sample, we believe that he may bepicking up a spurious correlation in which the less-cyclically-sensitive householdsurvey may be acting as a proxy for the stage of the cycle. He also did not adjust, as wedo in our empirical work, for the discontinuities in the household survey when newpopulation controls are introduced.
4. The March 2003 revision will be small by historical standards--0.1 percent comparedwith an average absolute revision of 0.3 percent over the preceding ten years.
5. John Kitchen, "A Note on the Observed Downward Bias in Real-Time Estimates ofPayroll Jobs Growth in Early Expansions," U.S. House of Representatives, Committee on theBudget, August 2003 (mimeo.).

RECONCILIATION OF HOUSEHOLD AND PAYROLL EMPLOYMENT(Seasonally adjusted, in thousands)
Adjustments
Less Plus Memo
(1) (2) (3) (4) (5) (6) (7) (8) (9) (10) (11) (12)
2001: Sept. 131,550 137,184 2,353 9,069 796 1,978 5,126 410 423 128,949 2,601 136,858Oct. 131,198 136,714 2,366 9,022 878 2,042 4,792 383 421 128,003 3,195 136,370Nov. 130,900 136,580 2,245 8,913 901 1,925 4,807 385 422 128,210 2,690 136,218Dec. 130,661 136,447 2,297 8,955 942 1,914 4,894 392 409 128,033 2,628 136,067
2002: Jan. 130,578 136,189 2,380 8,714 879 1,775 4,892 391 406 128,131 2,447 135,791Feb. 130,510 136,867 2,356 8,746 853 1,723 4,949 396 408 128,942 1,568 136,450Mar. 130,481 136,578 2,349 8,702 832 1,947 4,942 395 411 128,496 1,985 136,143Apr. 130,415 136,649 2,350 8,773 835 1,838 5,065 405 403 128,726 1,689 136,196May 130,411 136,958 2,247 8,875 792 2,071 4,884 391 401 128,649 1,762 136,487June 130,383 136,872 2,185 8,865 881 1,979 5,073 406 403 128,844 1,539 136,383July 130,204 136,850 2,330 8,946 871 1,979 5,001 400 401 128,527 1,677 136,343Aug. 130,224 137,282 2,178 9,015 848 1,685 4,970 398 400 129,324 900 136,757Sept. 130,289 137,855 2,324 9,084 844 1,764 5,045 404 409 129,698 591 137,312Oct. 130,408 137,549 2,493 9,117 894 1,928 4,953 396 408 128,875 1,533 136,988Nov. 130,409 137,122 2,324 9,314 908 1,689 4,945 396 397 128,623 1,786 136,542Dec. 130,198 137,037 2,352 9,290 810 1,840 5,174 414 393 128,726 1,472 136,439
2003: Jan. 130,356 137,536 2,314 9,444 748 1,733 5,145 412 389 129,243 1,113 137,536Feb. 130,235 137,408 2,178 9,258 729 1,985 5,197 416 383 129,254 981 137,408Mar. 130,084 137,348 2,227 9,181 778 1,845 5,026 402 370 129,115 969 137,348Apr. 130,062 137,687 2,128 9,139 818 1,986 4,965 397 376 129,354 708 137,687May 129,986 137,487 2,157 9,065 851 2,081 4,951 396 375 129,055 931 137,487June 129,903 137,738 2,213 9,250 958 1,872 5,084 407 371 129,307 596 137,738July 129,846 137,478 2,193 9,306 1,019 1,966 5,073 406 369 128,842 1,004 137,478Aug. 129,805 137,625 2,348 9,538 975 1,769 5,238 419 378 129,029 776 137,625Sept. 129,862 137,573 2,362 9,394 895 1,816 4,976 398 371 128,851 1,011 137,573
- - - - - - - - - - - - - - - Memo: Change over the 12 months ending September 2003 - - - - - - - - - - - - -
-427 -282 38 310 51 52 -69 -6 -39 -847 420 261
(1)(2)(3)(4)(5)(6)(7)(8)(9)
(10)(11)(12)
Nonfarm payroll employment.Household employment, corrected for updates to population.Agriculture.Self-employed.Unpaid family and private household.Unpaid absences.Multiple job holders who are nonfarm, nonprivate household, wage and salary workers on their secondary jobs.Estimate of jobs beyond secondary held by multiple job holders.Estimate of 15-year-old wage and salary workers.Adjusted household.Nonfarm payroll minus adjusted household.Household employment, as published.

II-A-6
Chart 1
Comparison of Household and Payroll Employment Measures
Household Employment Less Payroll Employment
Sep.
~v-t -
1976 1978 1980 1982 1984 1986 1988 1990 1992 1994 1996 1998 2000 2002 2004
Adjusted Household Employment Less Payroll Employment
A\-t
Note. Shaded bars are periods of recession.
Thousands- 13000
- 12000
- 11000
- 10000
- 9000
p. - 8000
- 7000
- 6000
4000
Thousands3000
- 2000
- 1000
-0
-1000
- -2000
- -3000
LLLL -40001984 1986 1988 1990 1992 1994 1996 1998 2000 2002 2004
... ... ... .. .. .. I' ~
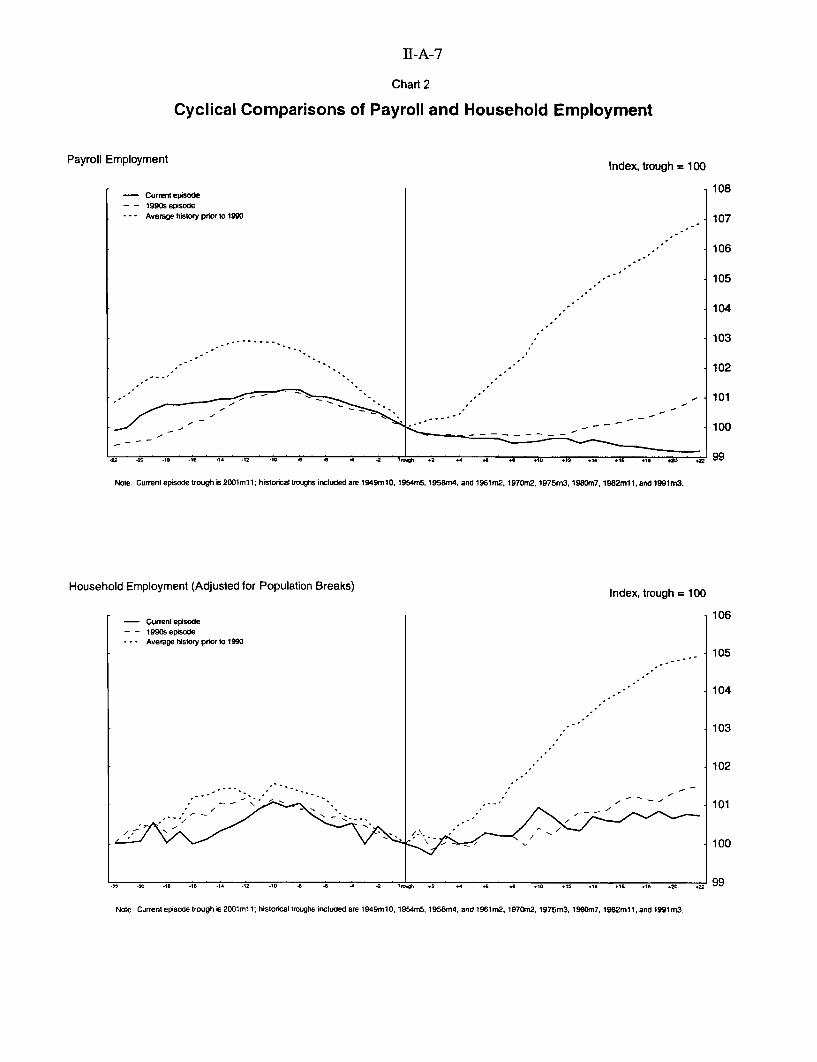
Payroll Employment
II-A-7
Chart 2
Cyclical Comparisons of Payroll and Household Employment
Index, trough = 100
- Current episode-- 1990s episode- - - Average history prior to 1990
oo ..
- 2-. -s16 - 14 -12 -10 a4 4 -a 2 ua +2 - .a * . 10 * 12 , 1. 1 .1 +wa n 1
99
Note. Current episode trough is 2001mll11; historical troughs included are 1949mrn10, 1954m5, 1958m4, and 1961m2, 1970m2, 1975m3,1980m7. 1982m11, and 1991m3.
Household Employment (Adjusted for Population Breaks) Index, trough = 100
- Current episode- - 1990s episode- - - Average history prior to 1990
7 -7
7/
- -- IN ~.-
.22 .20 -18 16 -14 -12 -10 - -6 4 -2 "T 92 94 + .a .10 +12 14 .19 *1B .20 .229
Note Current episode trough is 2001m11; historical troughs included are 1949m10, 1954m5, 1958m4, and 1961m2, 1970m2, 1975m3, 1980m7, 1982m11, and 1991m3.

Domestic FinancialDevelopments

III-T-1
Selected Financial Market Quotations(One-day quotes in percent except as noted)
Change to Oct. 21 from2001 2003 selected dates (percentage points)
Instrument 2001 2003 2003Sept. 10 June 24 Sept. 15 Oct. 21 Sept. 10 June 24 Sept. 15
Short-termFOMC intended federal funds rate 3.50 1.25 1.00 1.00 -2.50 -.25 .00
Treasury bills 13-month 3.19 0.81 0.94 0.91 -2.28 .10 -.036-month 3.13 0.82 1.01 1.02 -2.11 .20 .01
Commercial paper (Al/P1 rates)1-month 3.42 0.91 1.01 1.02 -2.40 .11 .013-month 3.24 0.88 1.03 1.04 -2.20 .16 .01
Large negotiable CDs 11-month 3.46 0.96 1.07 1.06 -2.40 .10 -.013-month 3.26 0.93 1.08 1.11 -2.15 .18 .036-month 3.24 0.92 1.12 1.16 -2.08 .24 .04
Eurodollar deposits 21-month 3.41 0.94 1.06 1.05 -2.36 .11 -.013-month 3.26 0.91 1.09 1.11 -2.15 .20 .02
Bank prime rate 6.50 4.25 4.00 4.00 -2.50 -.25 .00
Intermediate- and long-termU.S. Treasury3
2-year 3.59 1.14 1.64 1.89 -1.70 .75 .2510-year 5.14 3.46 4.45 4.54 -.60 1.08 .0930-year 5.55 4.53 5.34 5.37 -.18 .84 .03
U.S. Treasury 10-year indexed note 3.28 1.70 2.17 2.13 -1.15 .43 -.04
Municipal revenue (Bond Buyer) 4 5.25 4.89 5.32 5.34 .09 .45 .02
Private instruments10-year swap 5.62 3.67 4.73 4.76 -.86 1.09 .0310-year FNMA 5 5.68 3.84 4.84 4.89 -.79 1.05 .0510-year AA 6 6.30 4.13 5.14 5.19 -1.11 1.06 .0510-year BBB 6 7.11 5.16 5.99 5.98 -1.13 .82 -.01High-yield 7 12.72 9.03 9.02 8.51 -4.21 -.52 -.51
Home mortgages (FHLMC survey rate) 830-year fixed 6.89 5.21 6.16 6.05 -.84 .84 -. 111-year adjustable 5.64 3.51 3.87 3.79 -1.85 .28 -.08
Change to Oct. 21Record high 2003 from selected dates (percent)
Stock exchange index Record 2003 2003Level Date June 24 Sept. 15 Oct. 21 high June 24 Sept. 15
Dow-Jones Industrial 11,723 1-14-00 9,110 9,449 9,748 -16.85 7.00 3.16S&P 500 Composite 1,527 3-24-00 983 1,015 1,046 -31.52 6.36 3.08Nasdaq (OTC) 5,049 3-10-00 1,606 1,846 1,941 -61.56 20.88 5.16Russell 2000 606 3-9-00 441 508 526 -13.30 19.20 3.52Wilshire 5000 14,752 3-24-00 9,388 9,843 10,165 -31.09 8.27 3.27
1. Secondary market.2. Bid rates for eurodollar deposits collected around 9:30 a.m. Eastern time.3. Derived from a smoothed Treasury yield curve estimated using off-the-run securities.4. Most recent Thursday quote.5. Constant maturity yields estimated from Fannie Mae domestic non-callable coupon securities.6. Derived from smoothed corporate yield curves estimated using Merrill Lynch bond data.7. Merrill Lynch Master II high-yield bond.8. For week ending Friday previous to date shown.
NOTES:
September 10, 2001 is the day before the terrorist attacks.June 24, 2003 is the day before the most recent policy easing.September 15, 2003 is the day before the most recent FOMC meeting.

Interest Rates and Policy Expectations
10-Year Treasury*September G-7
FOMC AnnouncementConsumer Employ.
Confidence, ReportChicago
PurchasingManager's Index
I I I I I I I I
Retail Sales,Empire StateManufacturing
Survey
Percent-i 4.8
I I I I I I I I I I I I I
9/09/03 9/12/03 9/17/03 9/22/03 9125/03 9/30/03 10/03/03 10/08/03 10/13/03 10/16/03 10/21/03
'On-the-run issue, 5-minute intervals.
Expected Federal Funds Rates* Per
..-... September 15, 2003-- October 21, 2003
I I I I I I I I I I I I I I I I I I I I I I I I I I I I
Oct. Dec. Feb. Apr. June Aug. Oct. Dec. Feb. Apr. June Aug. Oct. Dec.
2003 2004 2005*Estimates from federal funds and eurodollar futures, with an allowance for term premia and other adjustments.
cent- 4.5
Feb.2006
Implied Distribution of Federal Funds RateAbout 6 Months Ahead*
Inflation Compensation
Percent
September 15, 2003
i-I
I-9II October 21, 2003
I -
Jan. Mar. May July Sept.2003
Note. Vertical line indicates September FOMC meeting.
I I I I I II
Percent
0.25 0.50 0.75 1.00 1.25 1.50 1.75 2.00 2.25
*Based on the distribution of the three-month eurodollar rate fivemonths ahead (adjusted for a risk premium), as implied by optionson eurodollar futures contracts.
I I I I I I ,
WqNAVY
rsJtr1 G

Domestic Financial Developments
OverviewGenerally favorable economic data and earnings news contributed to a moreoptimistic tone in financial markets over the intermeeting period. Investorsmarked up the expected path for policy, and Treasury and high-grade privateyields rose. Signs of strengthening economic activity led to an appreciablenarrowing of risk spreads, pushing down borrowing costs for many mid- tolower-tier corporate credits. In addition, equity prices were buoyed by third-quarter profits that generally beat analysts' expectations.
Corporate bond issuance stepped up in September, but the runoff of short-termdebt continued, leaving overall business borrowing lackluster. Householdborrowing has held up well despite a notable drop-off in mortgage refinancingactivity. Federal borrowing has continued at a brisk pace, driven by elevatedmilitary expenditures and sluggish tax revenues. In addition, state and localgovernments continued to issue substantial amounts of debt to finance capitalprojects.
Policy Expectations and Treasury YieldsInvestors marked up the expected path for policy substantially over the period,largely on a string of better-than-expected economic releases in October as wellas on comments by Federal Reserve officials that led investors to anticipate anearlier onset of policy tightening. Current money market futures quotes suggestthat market participants are confident that the FOMC will not change policy atits October meeting. Futures quotes further out on the curve imply that investorsnow place considerable odds on a quarter-point tightening by the middle of nextyear. Consistent with the upward revision in policy expectations, nominalTreasury coupon yields rose about 10 to 25 basis points. Market-basedmeasures of inflation compensation increased about as much as nominal yields,although survey-based measures of inflation expectations were little changed.
Stock Prices and Corporate YieldsBroad equity price indexes rose about 3 percent over the intermeeting period,with many touching new highs for the year. Market volatility was low, andoptions prices indicated that investors expect volatility to remain subdued.Technology-sector stock prices outpaced the broader market, keeping theforward price-earnings ratio for this sector well above the P-E ratios for nontechfirms. The forward-earnings yield on the entire S&P 500 continued to hover atabout 5-3/4 percent, and its gap over the real Treasury yield remained steady aswell. This measure of the equity premium falls squarely within its range prior tothe run-up in stock prices in the late 1990s.
Yields on investment-grade corporate bonds rose slightly less than yields onlonger-dated Treasuries, leaving risk spreads for these securities a touch lower.

III-2
Stock Prices
Stock Prices and Corporate Risk SpreadsImplied Volatility on Nasdaq 100 (VXN) and
Dec. 31, 2002=100 S&P 500 (VIX)
Sep. 16 150 Weekly FridaySFOMC I 150... . 411n - Nasdaq i lI
July Oct. Jan. Apr. July Oct.2002 2003*Dow Jones Technology Index
12-Month Forward Earnings-Price Ratiofor S&P 500 and 10-Year Treasury Percent
.Monthly - 12
- 10
E/P ratio - 8
6
4
Real 10-year Treasury yield* 2
01985 1988 1991 1994 1997 2000 2003
* 10-year Treasury yield minus Philadelphia Fed 10-year expected inflation.+ Denotes the latest observation using daily interest rates and stock prices and
latest eamrnings data from I/B/E/S.
Corporate Bond Spreads to Similar Maturity Treasury
Basis points Basis pointsr- - 450
1998 1999 2000 2001 2002 2003
10/22/03
Percent
1998 1999 2000 2001 2002 2003
Selected S&P 500 Price-Earnings Ratios*
Percent
1985 1988 1991 1994 1997 2000 2003
"Using expected earnings for twelve months aheadSource: I/B/E/S.
Commercial Paper Quality Spread(30-Day A2/P2 less A1/P1) Basis point.
Weekly Friday
Oct. 21
I I I 2000 2001 2002 2003
1998 1999 2000 2001 2002 2003

III-3
Yields on speculative-grade bonds further extended their recent declines,slipping about another 50 basis points and significantly narrowing their spreadsagainst Treasuries.
Corporate Earnings and Credit QualityTo date, reports on third-quarter S&P 500 earnings suggest that profits increasedmarkedly, far surpassing analysts' already optimistic forecasts, on balance.Seasonally adjusted earnings per share are estimated to have jumped roughly10 percent at a quarterly rate from the second quarter. Overall, guidance for thefourth quarter has also been favorable, even if somewhat cautious, and earningsforecasts for 2003 and 2004 inched higher in September and October.
On the basis of dividend announcements thus far, the annual indicated dividendper share of the S&P 500 has risen more than 10 percent since the end of 2002.Although some of the increases likely reflect a response to the dividend tax cut,the breadth of the advance may be a sign of the corporate sector's growingconfidence in a sustained profit recovery. Announcements of new sharerepurchase programs also jumped in the third quarter, but are running a bitbelow the previous year's pace.
Bond rating downgrades ofnonfinancial corporations remained modest inSeptember and were almost matched by upgrades, a substantial improvementfrom the first half of this year. The trailing six-month bond default rateremained at around 1 percent. The forecast of aggregate year-ahead defaultprobability, however, continued to fall as broad equity prices improvedmoderately and market volatility declined.
Business FinanceBond issuance by nonfinancial corporations bounced back in September after alull in July and August. The pickup was especially pronounced in theinvestment-grade sector, but speculative-grade issuance was also robust. Withmuch of the proceeds from bond offerings earmarked to retire other debt, short-and intermediate-term credit once again was paid down, as reflected in thecontractions in both commercial paper and C&I loans. However, the mostrecent Senior Loan Officer Opinion Survey on Bank Lending Practices indicatedthat this weakening in C&I loan demand may be diminishing. For the thirdquarter as a whole, total net debt financing appears to have run at a roughly zerorate as strong earnings and a buildup of cash assets from strong borrowingearlier this year may have reduced the demand for funds. However, data for thefirst half of October suggest that net debt financing has risen a bit.
Presumably supported by stock price increases this summer, gross issuance ofpublic equity by nonfinancial firms totaled $6-1/2 billion in September, the

Corporate Credit Quality and EarningsS&P 500 EPS Revisions Index
Percent
1990 1992 1994 1996 1998 2000 2002
e Analysts' estimate as of August 29.* Change from 4 quarters earlier.Source. I/BlE/S for S&P 500 EPS.
S&P 500 Indicated Dividends*Percent Dollars
1988 1991 1994 1997 2000 2003
*Annual dividends per share based on firms'most recent announcementsSource: Standard & Poor
1989 1992 1995 1998 2001 2004
Note. Index is a weighted average of the percent change in the consensusforecasts of current-year and tollowing-year EPS.
Ratings Changes ofNonfinancial Companies
1998 1999 2000 2001 2002 2003
Note. Data are at an annual rate. Debt upgrades and downgrades as apercentage of par value of all bonds outstanding.
Source. Moody's Investors Service.
Bond Default andLoan Delinquency Rates Percent of outstandings
Expected Year-Ahead DefaultsPercent of liabilities
hMonthly
I I I I I I I I I I I I I I
1991 1993 1995 1997 1999 2001 2003Note. Firm-level estimates of default weighted by firm liablities as a
percent of total liabilities.Source. KMV Corporation.
M-4
Corporate Earnings Growth
1991 1993 1995 1997 1999 2001 2003*6-month moving average, from Moody's Investors Service.
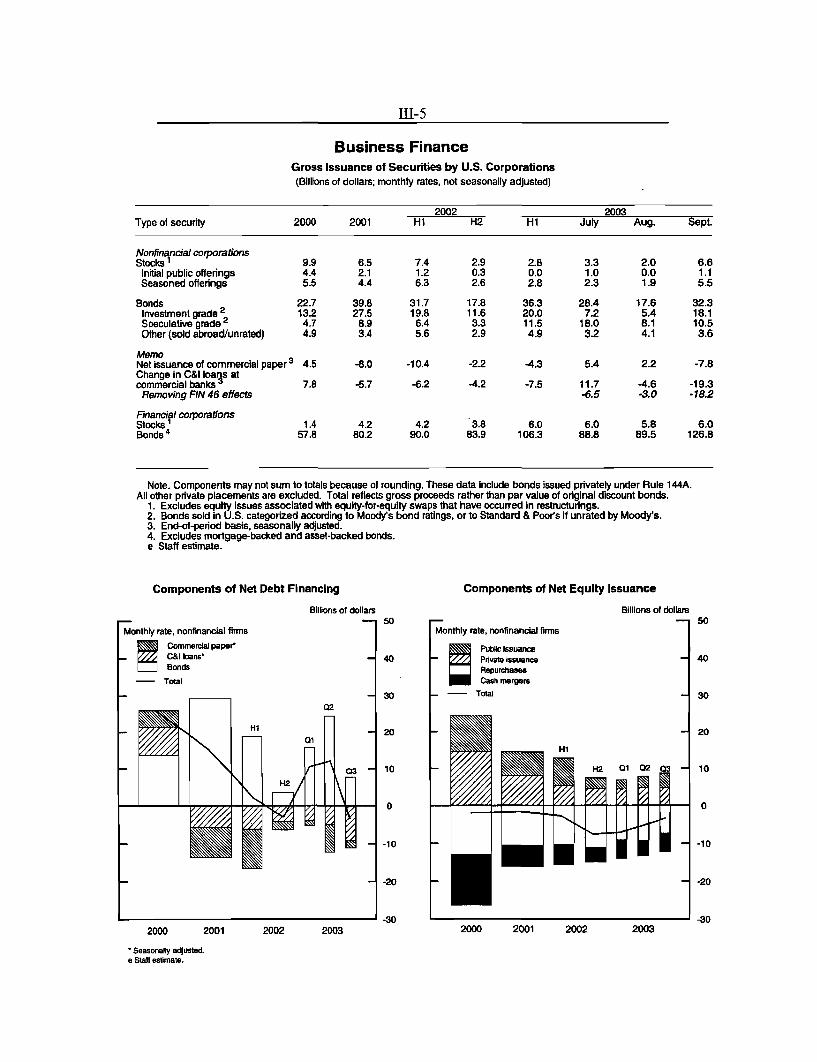
III-5
Business FinanceGross Issuance of Securities by U.S. Corporations(Billions of dollars; monthly rates, not seasonally adjusted)
2002 2003Type of security 2000 2001 H1 H2 H1 July Aug. Sept.
Nonfinancial corporationsStocks 1 9.9 6.5 7.4 2.9 2.8 3.3 2.0 6.6
Initial public offerings 4.4 2.1 1.2 0.3 0.0 1.0 0.0 1.1Seasoned offerings 5.5 4.4 6.3 2.6 2.8 2.3 1.9 5.5
Bonds 22.7 39.8 31.7 17.8 36.3 28.4 17.6 32.3Investment grade 2 13.2 27.5 19.8 11.6 20.0 7.2 5.4 18.1Speculative grade 2 4.7 8.9 6.4 3.3 11.5 18.0 8.1 10.5Other (sold abroad/unrated) 4.9 3.4 5.6 2.9 4.9 3.2 4.1 3.6
MemoNet issuance of commercial paper 3 4.5 -8.0 -10.4 -2.2 -4.3 5.4 2.2 -7.8Change in C&I loarls atcommercial banks3 7.8 -5.7 -6.2 -4.2 -7.5 11.7 -4.6 -19.3
Removing FIN 46 effects -6.5 -3.0 -18.2
Financifl corporationsStocks 1.4 4.2 4.2 3.8 6.0 6.0 5.8 6.0Bonds 4 57.8 80.2 90.0 83.9 106.3 88.8 89.5 126.8
Note. Components may not sum to totals because of rounding. These data include bonds issued privately under Rule 144A.All other private placements are excluded. Total reflects gross proceeds rather than par value of original discount bonds.
1. Excludes equity issues associated with equity-for-equity swaps that have occurred in restructurings.2. Bonds sold in U.S. categorized according to Moody's bond ratings, or to Standard & Poor's if unrated by Moody's.3. End-of-period basis, seasonally adjusted.4. Excludes mortgage-backed and asset-backed bonds.e Staff estimate.
Components of Net Debt Financing
Billions of dollars
2000 2001
* Seasonally adjusted.e Staff estimate.
2002 2003
Components of Net Equity Issuance
Billions of dollars
Monthly rate, nonfinancial firms
Public issuancePrivate issuanceRepurchasesCash mergers
- -- Total
7
2000 2001 2002
H2 01 02 03
2003
1ZZXm

III-6
Commercial Real Estate
Growth of Commercial Mortgage DebtPercent
Gross Issuance of CMBSBillions of dollars
1996 1998 2000 2002e Staff estimate.
Investment-Grade CMBS Yields
- .A Weekly
1996 1998 2000 2002p Period to date at a quarterly rate.Source. Commercial Mortgage Alert.
Percent
-3
I I I I I
2000 2001 2002Source. Morgan Stanley.
Investment-Grade CMBSSpreads over Swaps
[Weekly
I I
2000 2001Source. Morgan Stanley.
2003
Basis points
I I I
2002 2003
BBB YieldsPercent
2002 2003
Source. Merrill Lynch, Morgan Stanley.
1990 1993 1996 1999 2002
Source. Call Report, ACLI, Morgan Stanley.
.O ct . 15

III-7
strongest monthly showing in more than a year. IPOs increased, reflectinggreater willingness of investors to fund risky ventures. Seasoned offerings wererobust and came from a variety of industries, although apparently a large chunkof the proceeds was earmarked to pay down debt. Cash-financed mergersinched higher in the third quarter, and net equity issuance is estimated to haveremained marginally negative.
Commercial Real EstateCommercial mortgage debt expanded in the third quarter at an estimated8 percent rate, down slightly from its second quarter pace. In the commercial-mortgage-backed securities (CMBS) market, rates fell slightly on net over theintermeeting period, and incoming data suggests a slight increase in CMBSissuance. CMBS credit spreads remain narrow, consistent with the low level ofmortgage delinquency rates overall. However, BBB-rated CMBS continued totrade at a yield premium to BBB-rated corporate debt, reflecting some concernamong investors about commercial real estate fundamentals and the rapid paceof CMBS issuance.
Household FinanceInterest rates on both adjustable-rate and thirty-year fixed-rate mortgages fell onnet over the intermeeting period. However, the declines produced only anuptick in refinancing applications, as rates remain well above their lows in mid-June. With a slight rise in purchase originations offsetting some of the declinein refinancing activity, home mortgage debt growth is estimated to have slowedto a still-brisk 11 percent annual rate in the third quarter.
Consumer credit grew at an estimated annual rate of 5 percent in the thirdquarter, up slightly from the pace in the second quarter. This modestacceleration in consumer credit occurred even though some households mayhave used their tax rebates to pay down consumer debt.
Consumer credit quality appears to have improved slightly in recent months.Delinquency rates on consumer loans and home mortgages at commercial banksfell in the second quarter, and those on auto loans at the captive financecompanies remained at low levels in August. Household bankruptcy filings areestimated to have remained stable in October, albeit at elevated levels.
Although the growth of house prices is estimated to have moderated somewhatover the third quarter, sizable stock price gains produced a substantial increasein household net worth. At the same time, though, tax cuts boosted households'disposable income, so that the ratio of net worth to disposable income was about

III-8
Household Liabilities
Freddie Mac Mortgage RatesPercent
r Weekly
1515
S19 I I I 2 20 I
1996 1998 2000 2002 2004
Household Debt GrowthPercent
Mortgage Refinancing ActivityMarch 16, 1990 = 100 Billions of dollars
9 16000- -Monthly, n.s.a. Monthly, n.s.a.
8
12000 - , s
7
6 8000 Originations
1996 1998 2000 2002 2004Source. Staff estimates.
Delinquency Rates at Commercial BanksPercent
3 0
1996 1998e Staff estimate.
2000 2002 2004
Quarterly, s.a.02
/Consumer loans
02Mortgage loans
I I I I I I I I
1996 1998Source. Call Report.
2000 2002 2(
Delinquency RatesPercent
Monthly, s.a.
Aug
Credit cards insecuritized pools
Auto loans at Augcaptive finance companies
1996 1998 2000 2002 2004Source. Moody's, Federal Reserve.
Household Bankruptcy FilingsFilings per 100,000 persons
| 4-week moving average, s.a.a.r |
1996 1998 2000 2002 2004Source. Visa Bankruptcy Notification ServiceStatistics.
5.5
5.0
4.5
4.0
3.5
3.0
2.5
2.0
1.5
1.0
0.5
0.0004
-

Ratio18
III-9
Household Assets
Assets Relative to Disposable Income
[-Quarterly, period-end, s.a.
Total
1990 1991 1992 1993 1994 1995 1996 1997 1998 1999 2000 2001 2002 2003 2004
e Staff estimate.
Asset Prices1993:01 = 10C
Stock prices (Wilshire 5000)*
1 I . I ,,.. I. 1 I, ,1.. I I I I. i. I 1 1501990 1991 1992 1993 1994 1995 1996 1997 1998 1999 2000 2001 2002 2003 2004
* Based on data through October 20.Office of Federal Housing Enterprise Oversight (OFHEO).
e Staff estimate.
Net Flows into Long-Term Mutual Funds(Billions of dollars, monthly rate)
2001 2002 2003 AssetsH1 July Aug. Sept. Aug.
Total long-term funds 10.8 10.3 19.1 14.1 13.6 18.3 4,828Equity funds 2.8 -2.2 5.8 21.4 22.9 16.8 3,237
Domestic 4.6 -2.0 5.4 19.0 18.1 16.9 2,807Intemational -1.8 -0.2 0.5 2.4 4.8 -0.1 430
Hybrid funds 0.7 0.7 2.0 3.5 3.3 3.6 382Bond funds 7.3 11.7 11.3 -10.8 -12.6 -2.1 1,209
High-yield 0.6 0.9 3.7 -1.7 0.6 1.3 138Other taxable 5.7 9.5 7.1 -7.1 -10.4 -2.6 743Municipals 1.0 1.4 0.5 -2.1 -2.8 -0.8 328
Source. Investment Company Institute.
Note. Excludes reinvested dividends.
e Staff estimates based on confidential ICI weekly data.

III-10
State and Local Government FinanceGross Offerings of Municipal Securities
(Billions of dollars; monthly rate, not seasonally adjusted)
2003
Type of security 2000 2001 2002 HI Q3 Sep.
Total 17.9 29.0 36.4 40.1 34.1 29.7Long-term 1 15.0 24.3 30.3 34.1 28.0 25.0
Refundings 2 2.2 7.6 10.1 11.3 7.9 5.4New capital 12.9 16.7 20.3 22.8 20.1 19.6
Short-term 2.8 4.7 6.0 6.0 6.2 4.7
Memo: Long-term taxable 0.7 1.4 1.7 3.9 2.5 4.2
1. Includes issues for public and private purposes.2. All issues that include any refunding bonds.
Municipal Bond YieldsAA1 General Obligation Percent
-7Weekly
Oct. 16- 4
1-year
1997 1999 2001 2003
Source. Bloomberg.
Bond Rating ChangesNumber of rating actions
- - 1600Annual Upgrades
S 12 0 0
Sn8 - 00
- 4 0 0
0
Downgrades 400* 800
1200
16001997 1999 2001 2003
* Lightly shaded region shows a staff estimate of the numberof downgrades related to downgrades of financial institutionsthat provided financial support for the bonds.
" Data through October 15 at an annual rate.Source. S&P's Credit Week Municipal and Ratings Direct.
Municipal Bond RatiosAl General Obligation over Treasury
r Weekly
Ratio
20-year
1997 1999 2001 2003Source. Bond Buyer.
Revenue Bond SpreadBBB less Insured AAA
r Weekly average
Basis points-
Oct. 17
I I I I I .
1997 1999 2001 2003
Source. Bloomberg.
I I I I
J Oct. 16

III-11
uunchanged in the third quarter. In September, households continued to shiftassets out of corporate bond funds and into equity funds, although the flows intoequity funds were not as large as they had been in August.
State and Local Government FinanceGross municipal bond issuance has maintained a fairly robust pace in the thirdquarter, as municipalities continued to borrow for both short-term cash needsand long-term capital projects. However, the run-up in municipal yields inrecent months has contributed to a dwindling volume of advance refundingissues.
Downgrades of municipal issues picked up a bit in recent weeks and included afive-notch downgrade to junk status of nearly $900 million in Pittsburgh generalobligation bonds. Because the bonds are insured, prices were mostlyunaffected, but the city has cancelled plans to issue new debt, and market reportssuggested that this may be a sign of financing problems for other cities. Morebroadly, risk spreads for municipal revenue bonds, which have climbed of late,have hit a five-year high.
Treasury and Agency FinanceThe Treasury borrowed less in the third quarter than it had projected at theAugust mid-quarter refunding, in part because of both a smaller-than-expectedbudget deficit over that period and a larger-than-projected drawdown of its cashbalances.
The G-7 statement in mid-September raised some concerns that foreign officialinstitutions would reduce their holdings of Treasury securities. However, suchconcerns were quieted after investors noted that indirect bidding at Treasuryauctions, which includes bidding by the Federal Reserve Bank of New York onbehalf of foreign monetary authorities, had not fallen off sharply.
The Congress continued to consider legislation that would affect the regulatoryoversight of Fannie Mae and Freddie Mac, although it seems unlikely that suchlegislation will be passed this year. Share prices of the two GSEs rose andagency yield spreads narrowed a bit over the intermeeting period.
Several of the Federal Home Loan Banks announced notable losses over theintermeeting period, prompting the Administration and some members of theCongress to consider including these institutions under a new regulatoryframework. Despite the losses, spreads of yields on Federal Home Loan Bankbonds over those on comparable Treasury securities moved up only a few basispoints.

III-12
Treasury Financing(Billions of dollars)
2002 2003Item
Q4 Q1 Q2 Q3 Sep.
Total surplus, deficit (-) -107.8 -144.9 -16.6 -104.5 26.4
Means of financing deficitNet borrowing 96.9 63.5 106.3 107.6 -23.4
Nonmarketable 14.9 -50.5 45.9 31.4 -26.9Marketable 82.0 114.0 60.4 76.2 3.5
Bills 20.0 67.0 -27.2 -14.9 -46.3Coupons¹ 62.0 47.0 87.6 91.1 49.8Debt buybacks 0.0 0.0 0.0 0.0 0.0
Decrease in cash balance 27.9 19.8 -16.8 -4.9 -29.5
Other² -16.9 61.6 -73.0 1.8 26.6
MEMOCash balance, end of period 33.0 13.3 30.0 35.0 35.0
NOTE. Components may not sum to totals because of rounding.1. Does not include Treasury debt buybacks.2. Direct loan financing, accrued items, checks issued less checks paid, and other
transactions.
Agency Market Developments
Agency Stock Price May 1=100 5-Year Agency Yield Spreads Basis points
May June July Aug. Sept. Oct.2003
May June July Aug. Sept. Oct.2003
Note. Vertical lines indicate September FOMC meeting.

III-13
Money and Bank CreditM2 declined at about a 5 percent rate in September after having grown briskly inJuly and August. During previous months, M2 growth had been pushed up asfunds related to MBS prepayments were temporarily placed in short-termdeposit accounts. As the volume of refinancings diminished, this process wasreversed and liquid deposits declined. M3 also declined in September, althoughnot as quickly as M2.
Bank credit decreased at a 5.6 percent rate in September after having grownsluggishly during the two preceding months.' The ongoing reduction in banks'holdings of mortgage-backed securities has been a significant factor. C&Ilending contracted more rapidly in September than in August, probably in partbecause of resurgent bond issuance. Weakness in C&I lending remainedconfined to large domestic banks and branches and agencies of foreign banks asbusiness lending at small banks continued to expand.
1. Data on C&I loans presented in the Greenbook have been adjusted to remove theestimated effects of the adoption by some banks of Financial Accounting Standards Board(FASB) Interpretation 46 (FIN 46). This accounting change, which was issued in January, hadoriginally required institutions to consolidate some variable interest entities into their balancesheets in the third quarter. During the intermeeting period, however, FASB announced thatinstitutions could delay implementation of the new accounting treatment until the fourth quarter,reducing its effect for now.
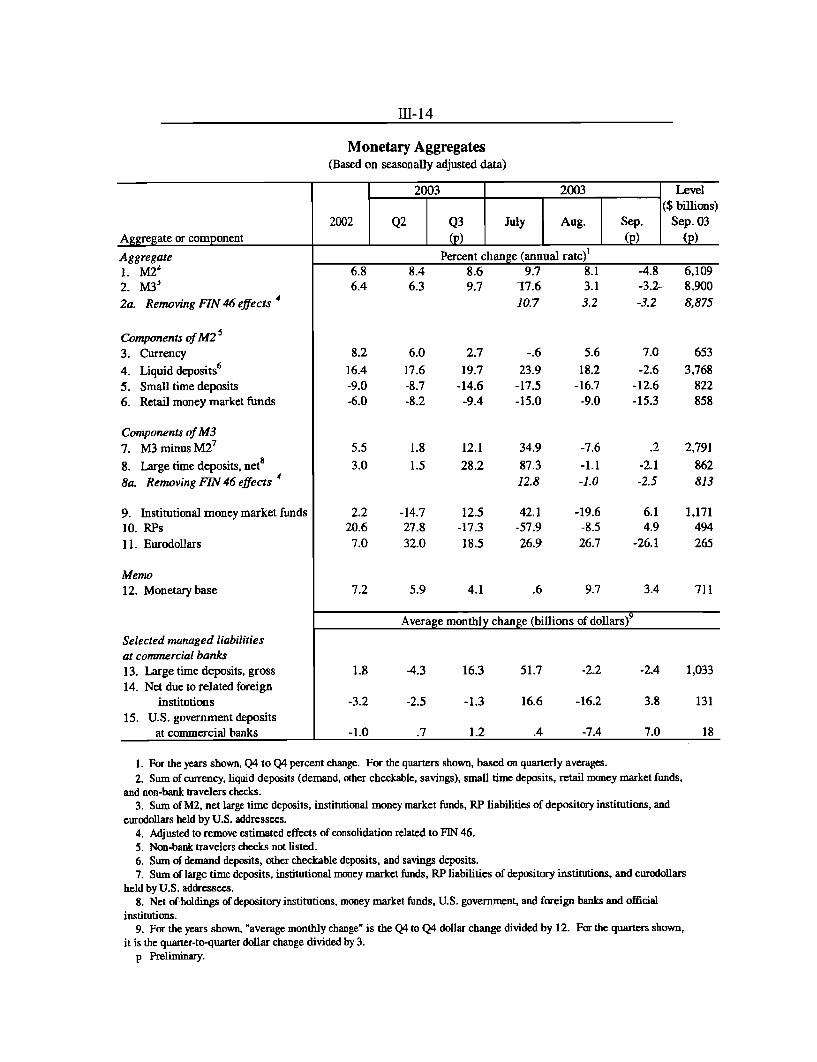
III-14
Monetary Aggregates(Based on seasonally adjusted data)
2003 2003 Level($ billions)
2002 Q2 Q3 July Aug. Sep. Sep. 03
Aggregate or component (p) (p) (p)
Aggregate1. M22. M32a. Removing FIN 46 effects 4
Components of M253. Currency
4. Liquid deposits6
5. Small time deposits6. Retail money market funds
Components of M3
7. M3 minus M27
8. Large time deposits, net8
8a. Removing FIN 46 effects 4
9. Institutional money market funds10. RPs11. Eurodollars
Memo12. Monetary base
Selected managed liabilities
at commercial banks13. Large time deposits, gross
14. Net due to related foreigninstitutions
15. U.S. government depositsat commercial banks
Percent change (annual rate)'8.69.7
2.7
19.7-14.6-9.4
9.7 8.1-7.6 3.110.7 3.2
-.623.9
-17.5-15.0
12.1 34.9
28.2 87.312.8
2.2 -14.7 12.5 42.120.6 27.8 -17.3 -57.9
7.0 32.0 18.5 26.9
5.6
18.2-16.7
-9.0
-7.6
-1.1-1.0
-19.6-8.526.7
-4.8 6,109-3,2- 8,900-3.2 8,875
7.0-2.6
-12.6-15.3
653
3,768822858
.2 2,791
-2.1 862-2.5 813
6.1 1,1714.9 494
-26.1 265
7.2 5.9 4.1 .6 9.7 3.4 711
Average monthly change (billions of dollars)9
1.8 -4.3 16.3 51.7 -2.2 -2.4 1,033
-3.2 -2.5 -1.3 16.6 -16.2 3.8 131
-1.0 .7 1.2 .4 -7.4 7.0 18
1. For the years shown, Q4 to Q4 percent change. For the quarters shown, based on quarterly averages.
2. Sum of currency, liquid deposits (demand, other checkable, savings), small time deposits, retail money market funds,and non-bank travelers checks.
3. Sum of M2, net large time deposits, institutional money market funds, RP liabilities of depository institutions, and
eurodollars held by U.S. addressees.4. Adjusted to remove estimated effects of consolidation related to FIN 46.5. Non-bank travelers checks not listed.6. Sum of demand deposits, other checkable deposits, and savings deposits.7. Sum of large time deposits, institutional money market funds, RP liabilities of depository institutions, and eurodollars
held by U.S. addressees.8. Net of holdings of depository institutions, money market funds, U.S. government, and foreign banks and official
institutions.9. For the years shown, "average monthly change" is the Q4 to Q4 dollar change divided by 12. For the quarters shown,
it is the quarter-to-quarter dollar change divided by 3.p Preliminary.

III-15
Type of credit
1. Adjustedl2. Reported
Securities3. Adjustedl4. Reported5. Treasury and agency6. Other2
Loans3
7. Total7a. Removing FIN 46 effects*8. Business8a. Removing FIN 46 effects 4
9. Real estate10. Home equity11. Other12. Consumer13. Adjusted5
14. Other6
14a. Removing FIN 46 effects?
Commercial Bank Credit(Percent change, annual rate, except as noted; seasonally adjusted)
Level,2002 QI Q27 July Aug. Sept. Sept. 2003
2003 2003 2003 2003 2003 ($ billions)
7.27.3
13.613.320.2
4.3
10.911.6
2.9 -5.6-3.1 -. 1
17.7 -6.7 -9.2 -22.018.9 -30.4 -28.2 -.728.9 -37.1 -41.1 -18.5
3.6 -19.8 -7.7 27.0
5.0 5.6 8.6 15.3 7.2 .18.3 6.1 7.3 0.4
-6.9 -5.4 -6.8 4.0 -10.2 -15.1-7.3 -15.7 -10.4 -14.2
13.1 14.5 11.6 21.1 24.6 8.536.6 28.1 28.1 20.1 20.2 25.110.9 12.9 9.6 21.1 25.2 6.45.5 2.8 -. 1 1.0 1.4 10.14.1 6.6 3.6 1.9 -4.1 1.81.6 -3.5 31.5 25.5 -20.1 -15.9
30.6 -7.8 -20.8 -16.5
5,9506,187
1,5731,7711,061
710
4,416
910
2,256258
1,997602961648
Note. All data are adjusted for breaks caused by reclassifications. Monthly levels are pro rata averages of weekly (Wednesday)levels. Quarterly levels (not shown) are simple averages of monthly levels. Annual levels (not shown) are levels for the fourthquarter. Growth rates are percentage changes in consecutive levels, annualized but not compounded. The conversion from a thriftto a commercial bank charter added approximately $37 billion to the assets and liabilities of domestically chartered commercialbanks in the week ending May 8,2002.
1. Adjusted to remove effects of mark-to-market accounting rules (FIN 39 and FIN 115), as well as the estimated effects ofconsolidation related to FIN 46.
2. Includes private mortgage-backed securities, securities of corporations, state and local governments, foreign governments, andany trading account assets that are not Treasury or agency securities, including revaluation gains on derivative contracts.
3. Excludes interbank loans.4. Adjusted to remove estimated effects of consolidation related to FIN 46.5. Includes an estimate of outstanding loans securitized by commercial banks.6. Includes security loans and loans to farmers, state and local governments, and all others not elsewhere classified. Also includes
lease financing receivables.7. Banks implemented FIN 46 on July 1, but because of the staff's standard interpolation procedure for weekly bank credit series,
this change also affected the levels and growth rates of bank credit and various components in June.
Total

Appendix
October 2003 Senior Loan Officer Opinion Survey
The October 2003 Senior Loan Officer Opinion Survey on Bank Lending Practicesaddressed changes in the supply of, and demand for, bank loans to businesses andhouseholds over the past three months. In addition, the survey contained asupplementary question on potential demand for commercial and industrial (C&I)loans, a series of questions on banks' participation in the secondary market for C&Iloans, and a question on loans secured by real estate but used for purposes other thanthe acquisition or improvement of real estate. Responses were received from fifty-sixdomestic and twenty-one foreign banking institutions.
Almost all domestic banks and U.S. branches and agencies of foreign banks indicatedthat lending standards were about unchanged over the past three months for all types ofloans. In addition, for the second consecutive survey, small net fractions of domesticbanks reported easing spreads on C&I loans and on credit card loans. Banks that easedlending conditions on C&I loans frequently reported doing so in response to increasedcompetition from nonbank lenders.
On the demand side, also for the second consecutive survey, the net fraction of banksthat reported weaker demand for C&I loans declined, to less than 15 percent forborrowers of all sizes. Demand for commercial real estate loans at domestic banksweakened at about the same pace as in the previous survey (August 2003). Meanwhile,respondents indicated that demand for mortgage loans to purchase homes declined overthe past three months, the first reported weakness in two years.' Demand for consumerloans, however, reportedly continued to strengthen, though at a less rapid pace than inAugust.
The large majority of domestic banks with assets of more than $20 billion and U.S.branches and agencies of foreign banks reported selling their adversely rated loans inthe secondary loan market over the past two years. Domestic banks indicated that themost important reason for doing so was to reduce the level of risk in their C&I loanportfolios as a whole, while foreign institutions ranked reducing their exposure toindividual borrowers highest. Investment banks and other nonbank financialinstitutions were reportedly the primary purchasers of adversely rated loans.
Lending to BusinessesIn the October survey, domestic banks, on net, reported that lending standards on C&I
loans for firms of all sizes were about unchanged. In contrast, a small percentage hadtightened standards on those loans in the August survey. However, the largest domesticbanks in the sample-those with assets of more than $20 billion-eased their lending
standards, on net, over the past three months. A small net fraction of U.S. branches and
1. Although banks are asked to consider only new originations when answering thisquestion, historically there has been fairly high correlation between responses to this questionand the volume of mortgage refinancing.

III-A-2
agencies of foreign banks also eased lending standards, including one foreign bank thatreported it had eased standards "considerably."
For the second consecutive survey, modest net fractions of domestic banks reportedreducing the spreads of loan rates over the cost of funds for borrowers of all sizes.Domestic banks also reported easing terms on credit lines for larger borrowers, with11 percent of respondents, on net, increasing the maximum size of credit lines and5 percent, on net, reducing the cost of these lines. As with standards, the easing ofterms generally occurred at the largest banks in the sample, while smaller bankscontinued to tighten most terms, on net. This movement reverses the pattern onsurveys between the middle of 2000 and the end of 2002, in which the largest bankshad been more likely than other banks to report tightening standards and terms.Foreign institutions, on net, reported no change in spreads on loans or in the cost orsize of credit lines. As in August, however, moderate net fractions of domestic andforeign institutions increased the risk premiums charged on loans to their riskiestborrowers, and small fractions tightened collateral requirements.
Nearly 70 percent of the domestic banks that reported tightening standards and termson C&I loans continued to report a reduced tolerance for risk as an important reason fordoing so. Nearly 80 percent of the domestic and foreign banks that tightened lendingstandards or terms indicated that concern about the economic outlook was at least asomewhat important reason for tightening; but a similar percentage of the institutionsthat eased standards or terms cited an improved economic outlook as a reason for doingso. Moreover, although the percentages of banking institutions tightening standardsand terms that cited concern about the economic outlook and industry-specificproblems were higher than in August, they represented a much smaller number ofbanks because fewer institutions reported tightening standards and terms. Increasedcompetition from other banks or nonbanks was cited by all of the foreign banks thateased lending conditions and about 80 percent of the domestic banks that did so.
The October survey indicates that the deterioration in demand from commercialborrowers has slowed and shows signs of stabilizing. Although 12 percent of domesticbanks, on net, reported that demand for C&I loans from large and middle-marketborrowers had weakened over the previous three months, that percentage is downsignificantly from the 22 percent that reported weaker loan demand in August and fromthe 40 percent that had reported weaker demand in April. In the current survey, only4 percent of domestic banks, on net, reported weaker demand from small firms,whereas 12 percent, on net, had reported weaker demand in August. About 20 percentof domestic respondents and 35 percent of the largest banks, on net, indicated thatinquiries from potential business borrowers had increased, up from only 10 percent and20 percent, respectively, in August. U.S. branches and agencies of foreign banksreported no change in demand, on net, over the past three months, and 24 percent ofthese institutions, on net, indicated that the flow of inquiries from potential customershad picked up.
On net, banks continued to cite reduced investment in plant and equipment as the mostimportant reason for weaker demand for C&I loans. A small net percentage of banksreported that demand for credit to finance inventories and accounts receivable had

III-A-3
decreased. Several respondents said that demand for C&I loans had risen in partbecause borrowing had shifted to their bank from other credit sources; however, otherdomestic and foreign banks indicated that increased competition had reduced demandat their institutions. Demand for loans to finance mergers and acquisitions, which hadpreviously been a frequently cited reason for weaker demand, was reported to havenearly stabilized, on net, in October.
The secondary market for C&I loans. Most of the domestic survey respondents withassets of more than $20 billion and nearly all of the U.S. branches and agencies offoreign banks indicated that they had sold adversely rated loans (those rated as specialmention or classified as substandard, doubtful, or loss) in the secondary market at sometime during the past two years. Almost 20 percent of the largest banks indicated thatthey sold more than 10 percent of those loans, while about 55 percent of all domesticbanks that participated in the secondary market sold less than 5 percent of theiradversely rated loans. Foreign institutions used the secondary market to reduce theirexposure to these credits somewhat more aggressively: About one-third had sold morethan 10 percent of their problem credits.
The most important reasons domestic banks gave for selling adversely rated loans wereto trim the overall credit risk of their portfolio and to reduce exposure to particularfirms. On average, domestic banks ranked the price that they obtained in the secondarymarket relative to their perception of the loan's value as a less important motive forselling than reducing credit risk. By contrast, foreign institutions on average ranked theattractiveness of the price as a close second to reducing exposure to particular firms.
Investment banks purchased about 50 percent of the adversely rated loans sold bydomestic banks and more than 40 percent of those sold by U.S. branches and agenciesof foreign banks. Nearly 25 percent of the adversely rated credits sold by domesticbanks, and 30 percent of such loans at foreign banks, were bought by nonbank financialinstitutions, such as hedge funds and distressed debt funds, or other private investors.About 15 percent of the adversely rated loans sold by domestic banks reportedly wentto other U.S. commercial banks, and about the same percentage of those loans sold byforeign banks were said to have been purchased by U.S. commercial banks. Amongdomestic banks that sold a significant share-more than 10 percent--of their adverselyrated loans on the secondary market, purchasers were mainly investment banks,distressed-loan funds, or private venture groups.
Banks were also asked to indicate the shares of any loans (adversely rated or other) thatthey sold at specified ratios of the secondary market price to face value. As industryreports also indicate, the distressed market was very important for banking institutionsthat wanted to unload deteriorating credits. Domestic banks reported that, on average,almost 35 percent of loan sales were at 75 percent or less of face value and about50 percent of the loans were sold for 85 percent or less. At foreign banks, the shareswere 31 percent and 47 percent respectively. About 25 percent of the loans sold bydomestic banks and 34 percent of the loans sold by foreign banks, on average, weresold at between 95 percent and 100 percent of par, and a small percentage of loanswere sold above par.

III-A-4
A much smaller fraction of domestic banks-about 25 percent-reported that they hadpurchased loans in the secondary market, and those that did tended to purchase onlyloans that were trading above 90 percent of their face value. Foreign institutions weremuch more active purchasers of loans, though they too tended to buy only loans tradingabove 90 percent of face value.
Commercial real estate lending. Domestic banks reported that standards oncommercial real estate loans were about unchanged, on net, over the past three months;the response ended a long period in which they had continuously tightened standards.One foreign bank reported easing standards on these loans. Demand for commercialreal estate loans continued to erode at domestic banks, with 11 percent, on net,reporting a decline in demand in the October survey, about the same as in August,while at foreign institutions demand was unchanged. On net, 6 percent of domesticbanks reported that there had been a slight increase over the past year in the volume ofloans to commercial and industrial firms secured by real estate but used for purposesother than the acquisition or improvement of real estate. Thus, increases in such loanshave apparently not contributed significantly to the decline in C&I loans over the sameperiod, at least at respondent banks.
Lending to HouseholdsDemand for mortgages to purchase homes reportedly weakened over the past threemonths. On net, 21 percent of domestic banks reported weaker demand for residentialmortgage loans, whereas in August, 45 percent of banks had reported increased demandfor mortgages. However, banks may find it hard to separate mortgage originations usedto buy homes from those used to refinance existing mortgages. Concurrently, banksreported no change, on net, in lending standards on residential mortgages, littlechanged from the August survey.
Fifteen percent of banks, on net, indicated that they were more willing to makeconsumer loans in the current survey, about the same share as in August. As isconsistent with this report, only one bank tightened standards on credit card loans and,as had been the case in the past two surveys, a small net fraction of banks reportedeasing spreads on credit card loans. No banks tightened standards on other types ofconsumer loans, but about 8 percent reported increasing spreads on those loans.However, 10 percent of banks increased the minimum credit score required to obtain acredit card loan, and 4 percent did so for other types of consumer loans. In addition,about 20 percent of respondents indicated that they had reduced the extent to whichthey were willing to grant credit card loans to individuals who did not meet creditscoring thresholds, while 12 percent of domestic banks had done so for other types ofconsumer loans. About 4 percent of respondents, on net, indicated an increase indemand, compared with an unusually large 30 percent that had reported strongerdemand in the August survey.

III-A-5
Measures of Supply and Demand for C&I Loans,by Size of Firm Seeking Loan
Net Percentage of Domestic Respondents Tightening Standards for C&I LoansPercent
Large and medium*.** Smal ,m u
S
1990 1991 1992 1993 1994 1995 1996 1997 1998 1999 2000 2001 2002 2003 200
Net Percentage of Domestic Respondents Increasing Spreads of Loan Rates over Banks' Costs of FundsPercent
19 9 I I I L 1 I9" 19 9 I .1 1 99 I 1 9 19 .1 -1-601990 1991. 1992 1993 1994 1995 1996 1997 1998 1999 2000 2001 2002 2003 2004
Net Percentage of Domestic Respondents Reporting Stronger Demand for C&I LoansPercent
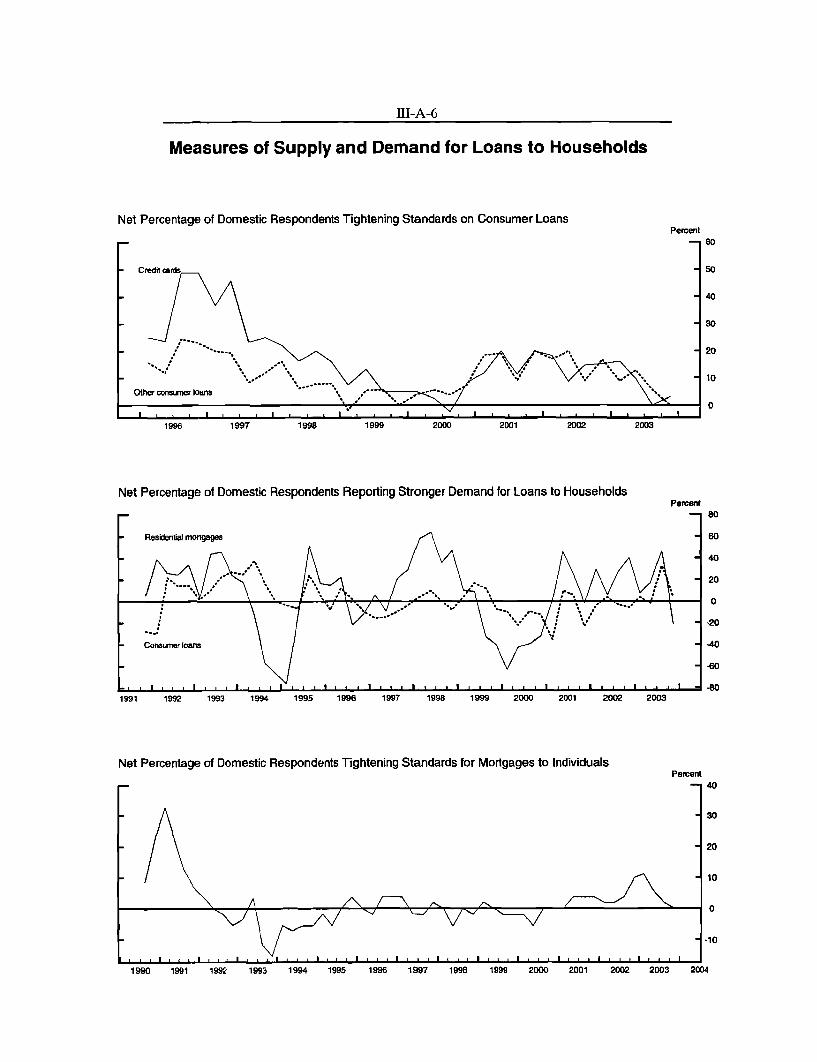
III-A-6
Measures of Supply and Demand for Loans to Households
Net Percentage of Domestic Respondents Tightening Standards on Consumer Loans
1996
Net Percentage of Domestic Respondents Reporting Stronger Demand for Loans to Households
1991 1992 1993 1994 1995 1996 1997 1998 1999 2000 2001
Net Percentage of Domestic Respondents Tightening Standards for Mortgages to Individuals
Percent
Percent
2002 2003
Percent-1 40
1990 1991 1992 1993 1994 1995 1996 1997 199 1999 2000 2001 2002 2003 20141990 1991 1992 1993 1994 1995 1996 1997 199B 1999 2000 2001 2002 2003 20D4

International Developments

International Developments
U.S. International Transactions
Trade in Goods and ServicesThe U.S. international trade deficit in August was $39.2 billion, smaller than inany month since February and down from $40.0 billion in July (revised), asimports declined more than exports.
Net Trade in Goods and Services(Billions of dollars, seasonally adjusted)
Annual rate Monthly rate2002 2003 2003
Q1 I 02 I Q3 e June I July I Aug.Real NIPA'Net exports of G&S -488.5 -510.3 -546.1 n.a.
Nominal BOPNet exports of G&S -418.0 -486.5 -494.1 -475.4 -40.0 -40.0 -39.2
Goods, net -482.9 -544.1 -552.4 -537.1 -45.1 -45.0 -44.5Services, net 64.8 57.6 58.3 61.7 5.0 5.0 5.3
1. Billions of chained (1996) dollars.e. BOP data are two months at an annual rate.Source: U.S. Department of Commerce, Bureaus of Economic Analysis and Census.n.a. Not available. ... Not applicable.
The value of exports of goods and services fell 2.7 percent in August, followingthree months of solid increases. The decline owed entirely to lower exports ofgoods; exported services rose 1.1 percent. Within goods, exports fell in mostmajor trade categories. Particularly large declines occurred in agriculturalproducts, aircraft, and automotive products, which reversed sizable increases inJuly. Despite the decline in August, the value of exported goods and services inJuly and August on average increased 11 percent at an annual rate from thesecond quarter level. About half of the increase owed to services, largelyreflecting a rebound in travel-related activity. The remainder of the two-monthincrease was attributable primarily to higher exports of capital goods, particularlyaircraft and computers, and agricultural products.
The value of imported goods and services fell 2.5 percent in August, reflectinglower imports of goods and unchanged imports of services. The monthly declinewas largely driven by a 13 percent drop in imported automotive products.Smaller declines were recorded in aircraft, computers, and consumer goods.Imports of industrial supplies and machinery (other capital goods) increasedmoderately. For July and August combined, the value of imported goods andservices increased at an annual rate of 2 percent from the second quarter level.Higher imports of services and oil (entirely from higher oil prices) more thanoffset lower imports of non-oil goods. The decline in imported non-oil goodsresulted mainly from the drop in automotive imports.

IV-2
U.S. International Trade in Goods and Services
Contribution of Net Exports to Real GDP GrowthPercentage points, s.a.a.r.
1996 1998 2000 2002 2004
Bil$, s.a.a.r.
Net trade in computersand semiconductors
I I I I I I I , , , li1 -1996 1998 2000 2002 2004
Selected Imports
1996 1998 2000 2002 20041. Excludes oil and gold.2. Excludes computers and semiconductors.3. Excludes Canada and Mexico.
996 1998 2000 2002
1. Excludes agriculture and gold.2. Excludes computers and semiconductors.

IV-3
U.S. Exports and Imports of Goods and Services(Billions of dollars, s.a.a.r., BOP basis)
Levels Amount Change¹2003 2003 2003 2003
Q2 Q3 e July Aug. Q2 Q3e July Aug.Exports of G&S 992.8 1018.2 1032.1 1004.3 3.3 25.4 18.6 -27.8
Goods exports 697.0 708.6 724.2 693.0 3.6 11.6 13.2 -31.2Gold 5.6 5.4 3.8 7.0 1.8 -0.2 -4.0 3.3Other goods 691.4 703.2 720.5 686.0 1.8 69.3 17.1 -34.5
Aircraft & parts 43.8 48.9 52.6 45.1 -1.9 5.1 5.6 -7.5Computers & accessories 37.2 40.0 40.8 39.3 -1.1 2.8 1.8 -1.4Semiconductors 45.3 46.3 47.9 44.7 2.5 1.0 2.4 -3.2Other capital goods 155.7 156.9 155.8 157.9 -0.5 1.2 -2.6 2.1
Automotive 79.8 77.5 81.7 73.4 -0.0 -2.2 3.1 -8.4to Canada 45.2 41.6 45.6 37.6 -1.5 -3.6 1.3 -8.0to Mexico 14.4 12.7 11.4 13.9 1.3 -1.8 -2.8 2.5to ROW 20.2 23.2 24.6 21.8 0.1 3.1 4.6 -2.8
Agricultural 57.5 61.8 67.6 56.0 0.6 4.3 8.8 -11.6Ind supplies (ex. ag, gold) 156.0 154.6 156.8 152.3 -1.1 -1.4 1.4 -4.5Consumer goods 88.1 89.9 90.6 89.3 1.7 1.8 -1.7 -1.2All other goods 28.0 27.3 26.7 27.8 1.7 -0.7 6.6 1.1
Services exports 295.8 309.6 307.9 311.3 -0.3 13.8 5.5 3.4
Imports of G&S 1486.9 1493.7 1512.5 1474.8 10.9 6.8 18.6 -37.7
Goods imports 1249.3 1245.8 1264.6 1226.9 11.9 -3.6 12.6 -37.7Petroleum 130.5 138.4 139.5 137.2 -5.4 7.9 6.8 -2.3Gold 4.1 3.9 2.5 5.3 1.7 -0.2 -3.2 2.8Other goods 1114.7 1103.4 1122.5 1084.3 15.6 -11.3 9.1 -38.2
Aircraft & parts 23.7 22.7 24.6 20.8 0.2 -1.0 0.7 -3.9Computers & accessories 75.2 75.4 76.7 74.1 2.0 0.3 1.8 -2.6Semiconductors 24.6 24.4 24.6 24.2 0.1 -0.2 0.1 -0.4Other capital goods 168.3 167.8 167.6 168.0 5.8 -0.5 -1.9 0.4
Automotive 211.6 201.5 215.6 187.4 7.0 -10.1 -3.2 -28.2from Canada 59.6 58.9 63.5 54.3 0.4 -0.7 1.4 -9.2from Mexico 42.8 39.8 37.0 42.5 2.7 -3.1 -6.3 5.5from ROW 109.2 102.9 115.2 90.6 3.9 -6.3 1.7 -24.5
Ind supplies (ex. oil, gold) 177.3 180.0 179.1 180.9 -2.0 2.7 3.8 1.7Consumer goods 328.3 326.4 327.5 325.3 0.9 -1.9 7.4 -2.2Foods, feeds, bev. 55.0 54.8 55.0 54.5 0.7 -0.2 1.5 -0.5All other goods 50.8 50.4 51.7 49.1 0.9 -0.3 -1.0 -2.6
Services imports 237.5 247.9 247.9 247.9 -1.0 10.4 5.9 0.0
Memo:Oil quantity (mb/d) 13.50 13.41 13.78 13.04 1.39 -0.09 0.15 -0.74Oil import price ($/bbl) 26.46 28.27 27.72 28.81 -4.28 1.80 1.05 1.09
1. Change from previous quarter or month. e. Average of two months.Source: U.S. Department of Commerce, Bureaus of Economic Analysis and Census.

IV-4
Prices of U.S. Imports and Exports(Percentage change from previous period)
Annual rates Monthly rates2003 2003
Ql Q2 Q3 July Aug. Sept.
Merchandise importsOilNon-oil
Core goods*Cap. goods ex comp & semiAutomotive productsConsumer goodsFoods, feeds, beveragesIndustrial supplies ex oil
ComputersSemiconductors
Merchandise exports
Core goods*Cap. goods ex comp & semiAutomotive productsConsumer goodsAgricultural productsIndustrial supples ex ag
ComputersSemiconductors
Chain price indexImports of goods & services
Non-oil merchandiseCore goods*
Exports of goods & servicesTotal merchandise
Core Poods*
------------ BLS prices (2000 weights)-----13.5 -9.2 3.2 0.5 0.1 -0.5
133.7 -54.6 29.7 5.1 2.4 -5.23.9 -1.0 0.7 0.1 -0.3 0.2
5.3 -0.5 1.1 0.2 -0.4 0.32.1 1.7 1.9 0.4 -0.2 -0.3
-0.4 0.5 0.0 0.0 0.0 -0.1-0.3 0.1 -0.1 -0.1 -0.1 0.07.1 -1.0 0.7 0.9 -0.2 0.6
25.3 -5.1 2.9 -0.2 -0.8 1.4
-5.7 -5.5 -7.8 -1.4 -0.1 -0.6-4.0 -1.0 5.8 1.7 -0.2 0.2
2.7 0.9 -0.3
1.6 1.00.1 0.90.1 0.90.5 0.36.1 6.43.4 0.3
3.1 -0.6 -3.7-5.8 -6.3 -12.1
---Prices in the NIPA a11.7 -3.9 n.a.4.6 -0.6 n.a.5.5 -0.3 n.a.
3.9 0.8 n.a.3.4 1.6 n.a.4 6 22 n a
-0.1 0.0
-0.2 0.10.1 0.00.2 0.00.0 -0.20.0 -1.1
-0.5 0.4
-0.1 -0.20.2 0.0
:counts (1996 weights)---
*/ Excludes computers and semiconductors.n.a. Not available. ... Not applicable.
Oil PricesDollars per barrel
Spot West Texas Intermediate
1994 1995 1996 1997 1998 1999 2000 2001 2002

IV-5
Prices of Internationally Traded GoodsNon-oil imports. In September, the prices of U.S. imports of non-oil goods andof core goods rose 0.2 and 0.3 percent, respectively, reversing similarly sizeddeclines in August. Within core goods, the largest price changes were inindustrial supplies and foods, feeds and beverages. Prices of imported foods,feeds and beverages rose 0.6 percent in September. The 1.4 percent increase inthe price of industrial supplies was the result of higher prices for lumber andnatural gas. In other major trade categories within core goods, only prices forcapital goods excluding computers and semiconductors experienced a notablechange, falling 0.3 percent. The prices of U.S. imports of computers continuedto decline in September, but semiconductor prices edged higher. In the thirdquarter of 2003, the prices of imported core goods rose 1 percent at an annualrate. The largest contributions came from industrial supplies and capital goodsexcluding computers and semiconductors. Prices of computers fell 8 percent(a.r.), in the third quarter, whereas prices of semiconductors rose 6 percent (a.r.).
Oil. The BLS price of imported oil fell 5.2 percent in September, the firstdecrease in the price since May. The spot price of West Texas Intermediate(WTI) crude oil was also lower in September, averaging $28.29 per barrel, downmore than 10 percent from August. However, the spot price began to rise at theend of September and has averaged nearly $31 per barrel thus far in October.The recent increase in the spot price reflects OPEC's decision in late Septemberto reduce its production target by 900,000 barrels per day effective November 1.Prices also remain elevated owing in part to the slow return of Iraqi exports.
Exports. In September, the prices of U.S. exports of total goods and of coregoods increased 0.4 and 0.5 percent, respectively. The rise was driven by a5.5 percent increase in the price of agricultural products. Prices for exportedindustrial supplies rose 0.2 percent in September. In other major trade categorieswithin core goods, prices were little changed. The prices of U.S. exports ofcomputers and semiconductors both moved lower in September. In the thirdquarter, the prices of exported core goods rose at an annual rate of 1 percent. Allof the major categories in core goods experienced price increases, but the largestrise came from agricultural products.
U.S. International Financial TransactionsNet foreign official inflows remained strong in August at $9 billion (line 1 of theSummary of U.S. International Transactions table) and were little changed fromthe inflows in July. Increases were largest for Asia, notably for Japan and Korea,and for Brazil. Through August, year-to-date foreign official inflows totaled

IV-6
$112 billion. In September, foreign official assets held at the Federal ReserveBank of New York increased a substantial $32 billion;
.
Private foreign purchases of U.S. securities (line 4) also continued to be verystrong in August, sustaining the brisk pace set in the second quarter. Thoughnearly mirroring the previous month's total net purchases, the distribution ofinstruments changed. Foreign acquisitions of Treasury issues declined somewhatfrom the exceptionally high levels in July. There were small net sales of agencydebt, and purchases of corporate bonds were lower, which may reflect a declinein new issuance for the month. In contrast, there was a marked increase inforeigners' purchases of U.S. equities. These amounted to $12 billion in August,up from net sales of $8 billion in July, and coincide with the uptick in the U.S.stock market in August. The net purchases of equities are mostly attributed toEurope and Canada.
Net U.S. purchases of foreign stocks (line 5b) surged to $15 billion duringAugust, up from $6 billion in July. For the year through August, U.S. investors'purchases totaled $57 billion, more than double new foreign investment in U.S.stocks. U.S. investors' purchases in August were concentrated in Asia withTaiwan ($7 billion) and Japan ($5 billion) accounting for the largest inflows.U.S. investors continued their net sales of foreign bonds, but at a slower pacethan in recent months.
The banking sector (line 3) saw net inflows of $11 billion, down from $47 billionin July. The August net flows reflected large interoffice outflows associated withrepurchase activity in European markets that were more than offset by inflows inlending and deposits from the Caribbean centers. A number of large revisionshave been made recently to the banking series to correct reporting errors andomissions. For the first half of this year banking transactions resulted in netoutflows of $35 billion (revised from near zero).
Although merger and acquisition activity was slight, U.S. direct investmentabroad (line 6) continued to expand at a rate near trend in the second quarter,owing in part to significant reinvested earnings. There are some signs of apickup in merger activity and two acquisitions of foreign firms are pending forthe third quarter. Foreign direct investment in the United States (line 7), buoyedby a large merger in the first quarter, fell back to the lower levels seen last year.

IV-7
Summary of U.S. International Transactions(Billions of dollars, not seasonally adjusted except as noted)
2002 20032001 2002
1 Q3 Q4 Ql Q2 July Aug.
Official financial flows -.5 90.5 7.8 28.5 39.0 54.8 8.9 9.21. Change in foreign official assets
in the U.S. (increase, +)a. G-10 countries
b. OPEC countries
c. All other countries
2. Change in U.S. official reserveassets (decrease, +)
Private financial flows
Banks3. Change in net foreign positions
of banking offices in the U.S.'
Securities2
4. Foreign net purchases of U.S.securities (+)a. Treasury securities
b. Agency bonds
c. Corporate and municipal bonds
d. Corporate stocks 3
5. U.S. net acquisitions (-) of foreignsecuritiesa. Bonds
b. Stock purchases
c. Stock swaps3Other flows (quarterly data, s.a.)
4.4 94.2 9.2 29.3 39.0 55.0-8.4 30.7 2.1 6.0 26.9 25.2
-3.1 -7.5 -1.3 .7 -7.5 1.1
15.9 70.9 8.4 22.7 19.5 28.7
-4.9 -3.7 -1.4 -.8 .1 -.2
416.1 437.5 163.4 124.1 101.6 93.8
-6.2 139.1 62.1 35.5 -32.4 -2.5
398.1 403.5 105.1 82.9 68.5 144.3-7.4 106.4 58.1 14.2 13.4 57.4
81.8 78.1 21.9 15.5 -2.3 -1.7201.8 160.3 17.2 39.8 59.5 67.3
121.8 58.8 8.0 13.3 -2.1 21.2
-85.1 15.5 21.4 -5.3 -27.5 9.024.6 33.5 8.8 7.6 7.0 26.1
-62.7 -14.8 14.0 -12.9 -19.9 -17.1
-47.0 -3.2 -1.4 .0 -14.7 .0
8.7 9.26.0 1.6
-.3 .6
3.0 7.0
.3 -.1
46.7 10.6
50.7 51.532.0 24.2
1.9 -1.2
24.6 16.9
-7.9 11.7
-2.8 -13.43.0 1.0
-5.8 -14.5
.0 .0
6. U.S. direct investment (-) abroad -120.0 -137.8 -31.6 -31.7 -34.4 -32.0
7. Foreign direct investment in U.S. 151.6 39.6 14.2 15.3 34.4 12.1
8. Foreign holdings of U.S. currency 23.8 21.5 2.6 7.2 4.9 1.5
9. Other (inflow, +)4 53.9 -43.9 -10.4 20.2 88.2 -38.6
U.S. current account balance (s.a.) -393.7 -480.9 -122.7 .128.6 -138.7 -138.7 ... ...
Capital account balance (s.a.) s -1.1 -1.3 -.4 -.4 -.4 -.3 ... ...Statistical discrepancy (s.a.) -20.8 -45.8 -48.1 -23.6 -1.6 -9.6 ... ...NOTE: Data in lines I through 5 differ in timing and coverage from the balance of payments data published by The Department
of Commerce. Details may not sum to totals because of rounding.1. Changes in dollar-denominated positions of all depository institutions and bank holding companies plus certain transactions
between broker-dealers and unaffiliated foreigners (particularly borrowing and lending under repurchase agreements). Includeschanges in custody liabilities other than U.S. Treasury bills.
2. Includes commissions on securities transactions and excludes adjustments BEA makes to account for incomplete coverage;therefore does not match exactly the data on U.S. international transactions published by the Department of Commerce.
3. Includes (4d) or represents (5c) stocks acquired through mergers.4. Transactions by nonbanking concerns and other banking and official transactions not shown elsewhere plus amounts resulting
from adjustments made by the Department of Commerce and revisions in lines I through 5 since publication of the quarterly data inthe Survey of Current Business
5. Consists of transactions in nonproduced nonfinancial assets and capital transfers.n.a. Not available. ... Not applicable.
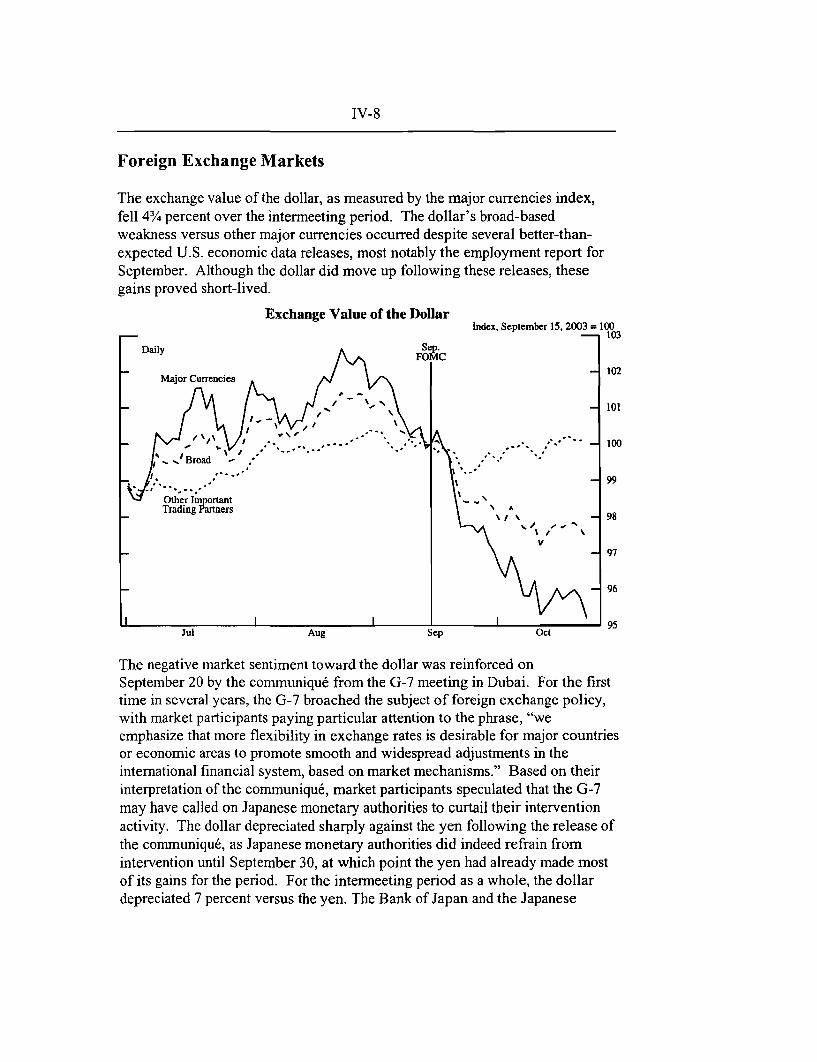
IV-8
Foreign Exchange Markets
The exchange value of the dollar, as measured by the major currencies index,fell 4 percent over the intermeeting period. The dollar's broad-basedweakness versus other major currencies occurred despite several better-than-expected U.S. economic data releases, most notably the employment report forSeptember. Although the dollar did move up following these releases, thesegains proved short-lived.
Exchange Value of the DollarIndex, September 15, 2003 = 100
103Daily S p.
FO M C
- 102Major Currencies
101
Other Important \ 0Trading Partners 98
S- 97
- 96
I I I95Jul Aug Sep Oct
The negative market sentiment toward the dollar was reinforced onSeptember 20 by the communiqu6 from the G-7 meeting in Dubai. For the firsttime in several years, the G-7 broached the subject of foreign exchange policy,with market participants paying particular attention to the phrase, "weemphasize that more flexibility in exchange rates is desirable for major countriesor economic areas to promote smooth and widespread adjustments in theinternational financial system, based on market mechanisms." Based on theirinterpretation of the communique, market participants speculated that the G-7may have called on Japanese monetary authorities to curtail their interventionactivity. The dollar depreciated sharply against the yen following the release ofthe communique, as Japanese monetary authorities did indeed refrain fromintervention until September 30, at which point the yen had already made mostof its gains for the period. For the intermeeting period as a whole, the dollardepreciated 7 percent versus the yen. The Bank of Japan and the Japanese

IV-9
Cabinet Office both upgraded their assessments of the Japanese economy andthe Japanese stock market outperformed other major indexes.
The dollar depreciated 3¾ percent against the euro, as economic data releasessignaled a pickup in euro-area economic activity. The U.S. dollar depreciated4 and 5 percent relative to the Canadian and Australian dollars, respectively, asthe continued rise in commodity prices amid expectations of a global recoveryreportedly buoyed these currencies. The Canadian currency touched its highestlevel against the U.S. dollar since 1993. Questions about the Administration'sresolve to maintain the "strong dollar" policy amid growing complaints fromU.S. manufacturers about foreign competition appeared to play a role in thedollar's weakness over the period, as did concerns over the size of the U.S.fiscal and current account deficits.
Financial Indicators in Major Industrial Countries
Three-month rate Ten-year yield EquitiesPercentage Percentage
Oct. 22 Point Oct. 22 Point PercentCountry (Percent) Change (Percent) Change Change
Canada 2.73 .04 4.84 .03 1.75
Japan .08 .00 1.44 -.09 2.98
Euro area 2.15 .00 4.24 .07 -.56
United Kingdom 3.75 .16 4.93 .34 .63
Switzerland .16 .01 2.62 -.06 -1.92
Australia 5.04 .08 5.65 .15 3.56
United States 1.11 .03 4.47 .19 2.10
Memo:Weighted-averageforeign 1.83 .03 4.11 .04 n.a.
NOTE. Change is from September 15 to October 22 (10 a.m. EDT).n.a. Not available.
Short-term interest rates moved little over the intermeeting period in the majorindustrial countries, as central banks kept policy interest rates unchanged. TheBank of Japan raised the upper limit of its target range for current accountbalances at the BOJ by ¥2 trillion to ¥32 trillion and clarified the conditions thatwould have to be met before it would end its quantitative easing policy.

IV-10
Long-term rates in most industrial countries were little changed, on balance,except for the United Kingdom, where the yield on gilts rose 35 basis points.Futures markets priced in greater expectations of the Bank of England soontightening monetary policy after BOE Governor King indicated that improvedglobal economic activity might prompt action by the Monetary PolicyCommittee. Reinforcing these comments, minutes from the October MPCmeeting showed that four of the nine MPC members had voted for a rate hike.
Despite the improved global economic outlook, equity prices in the industrialcountries were mixed over the period. Japanese equities posted a modest3 percent gain, outperforming shares on U.S. and European exchanges. Shareprices for the Japanese banking sector jumped a heady 17 percent, as reportedearnings by several key institutions came in well above market expectations.However, the strength of the yen against the dollar did weigh on the share pricesof Japanese exporters, with the automobile sector subindex declining 7 percent.
Financial Indicators in Latin America, Asia, and Russia
Currency/ Short-term Dollar-denominated EquityUS dollar Interest rates 1 bond spread 2 prices
Percentage PercentagePercent Oct.21/22 Point Oct.21/22 Point Percent
Economy Oct. 22 Change (Percent) Change (Percent) Change Change
Mexico 11.20 2.05 4.93 .71 2.15 .03 2.69
Brazil 2.86 -1.07 19.40 -.25 6.16 -.45 12.38
Argentina 2.85 -1.21 n.a. n.a. 54.87 6.79 17.37
Chile 641.70 -4.30 3.04 .00 .84 -3.08 13.02
China 8.28 -.01 n.a. n.a. .29 -2.25 .03
Korea 1181.00 .69 4.07 .05 ... ... 3.41
Taiwan 33.85 -.82 1.12 -.06 ... ... 7.44
Singapore 1.74 -1.18 .81 .06 ... ... 12.53
Hong Kong 7.75 -.61 .22 -.84 ... ... 11.33
Malaysia 3.80 -.01 3.00 .00 .70 -2.14 8.36
Thailand 39.94 -1.94 1.25 .00 .54 .07 6.75
Indonesia 8460.00 .00 8.79 -. 11 2.72 .59 12.42
Philippines 55.15 .46 6.44 .13 4.02 .14 8.19
Russia 29.92 -2.50 n.a. n.a. 2.35 -. 16 8.25
NOTE. Change is from September 15 to October 21/22.1. One month interbank interest rate, except Chile: 30-day deposit rate; Korea: 1-week call rate.
No reliable short-term interest rates exist for China or Russia.2. Spread over similar maturity U.S. Treasury security yield. Mexico, Brazil, Argentina, Korea,
the Philippines and Russia: EMBI+ yield. Chile and China: Global bond yield. Malaysia: Eurobondyield. Thailand and Indonesia: Yankee bond yield. Taiwan, Singapore, and Hong Kong do not haveoutstanding sovereign bonds denominated in dollars.
n.a. Not available. ... Not applicable.

IV-11
Emerging markets stocks performed much better over the intermeeting periodthan those of industrial countries, as the anticipated global recovery reportedlyhelped foster an environment favoring riskier investments. Sentiment towardsemerging markets was further enhanced after Moody's upgraded Russia'sforeign-currency debt rating to investment grade status. Market participantsadded to positions in Brazil in hopes that Brazil will be the next country to haveits debt rating upgraded. The yield spread of Brazil's dollar-denominated debtnarrowed 50 basis points. Share prices on South American exchanges rose morethan 12 percent.
Stocks in emerging Asia also performed well, with share prices gaining as muchas 12 percent. Much attention was focused on China's exchange rate policy,with Bundesbank President Welteke stating that the section in the G-7communiqué that called for flexibility in exchange rates pertained to countries inAsia. In addition, some Japanese officials commented that the call for flexibilitywas primarily directed at China. The amount of appreciation of the yuan versusthe dollar priced in by twelve-month non-deliverable forward contracts rose by1½ percentage points, to a total of 4 percent.
. The Desk did not
intervene on behalf of the System or the Treasury during the period.

IV-12
Developments in Foreign Industrial Countries
Available data for the third quarter generally suggest a moderate pace of growthin the major foreign industrial countries. In Japan, indicators of privateinvestment and consumption were fairly flat following the second quarter'simpressive gains, but the September Tankan recorded a broad-based increase inbusiness sentiment. Euro-area surveys, particularly the purchasing managers'index (PMI) for manufacturing and industrial confidence, suggest that economicgrowth turned positive in the third quarter. In the United Kingdom, both themanufacturing and services PMIs hint at continued recovery. In Canada, dataon GDP by industry, as well as on housing starts and employment, point topositive growth for the third quarter.
Twelve-month rates of consumer price inflation were little changed in recentmonths. Canadian headline inflation inched up to 2.2 percent in September.The U.K. inflation rate declined slightly, but remained above the 2 percenttarget level. In the euro area, inflation held steady, just a bit above the ECB's2 percent ceiling. In Japan, mild deflation continued.
In Japan, evidence for the third quarter suggests that growth continued at amoderate pace. For July and August on average, industrial production was up0.2 percent from the second-quarter level. Indicators of consumer expendituressuggest only slight changes from second-quarter levels. New car registrations inthe third quarter rose about 2 percent from the second-quarter average, whilehousehold expenditures in July and August on average were about flat comparedto the second quarter. Core machinery orders, a leading indicator of businessfixed investment, fell 1.7 percent in July and August on average relative to thesecond quarter. Non-residential building starts were about flat in July andAugust compared with the second quarter. Both real exports and imports rose inJuly and August, on average, from second-quarter levels, but imports grew morethan exports.
Labor market conditions have generally been improving, but mild deflationcontinues. In August, the unemployment rate fell to its lowest rate since August2001, down from a peak of 5.5 percent recorded early this year. Thejob-offers-to-applicants ratio, a leading indicator of employment, rose slightly.Core consumer goods prices in the Tokyo area (which exclude fresh food butinclude energy) fell 0.2 percent in September from the previous month, and weredown 0.3 percent from a year earlier. Wholesale prices for domestic goods fell0.5 percent in September from a year earlier.
On a more positive note, the Bank of Japan's Tankan index of businessconditions rose in September, with the level of the aggregate diffusion index for

IV-13
Japanese Economic Indicators(Percent change from previous period, except as noted, s.a.)
2003
Indicator Q1 Q2 Q3 Jun. July Aug. Sept.
Industrial production' .3 -.7 n.a. -1.3 .5 -.7 n.a.
All-industries index .7 .0 n.a. .8 -1.5 n.a. n.a.
Housing starts .7 4.3 n.a. 8.7 -8.6 -8.5 n.a.
Machinery orders2 5.8 3.4 n.a. 2.4 -3.1 -4.3 n.a.
Machinery shipments³ .2 1.5 n.a. -.9 -1.4 3.4 n.a.
New car registrations 1.3 -6.1 2.2 -6.0 1.2 -. 0 5.0
Unemployment rate 4 5.4 5.4 n.a. 5.3 5.3 5.1 n.a.
Job offers ratio5 .60 .61 n.a. .61 .62 .63 n.a.
Business sentiment6 -26 -26 -21 ...
CPI (Core, Tokyo area) 7 -.7 -.4 -.3 -.4 -.4 -.3 -.3
Wholesale prices 7 -.9 -1.0 -.7 -1.1 -.8 -.7 -.5
1. Mining and manufacturing.2. Private sector, excluding ships and electric power.3. Excluding ships and railway vehicles.4. Percent.5. Level of indicator.6. Tankan survey, diffusion index.7. Percent change from year earlier, n.s.a.n.a. Not available. ... Not applicable.
business sentiment increasing to -21 from -26 in June. This improvement wasbroadly based, with increases for both manufacturers and nonmanufacturersacross nearly all firm sizes. Survey respondents project a further improvement inthe index, to -19, for December. The closely watched index for largemanufacturers entered positive territory for the first time since December 2000,increasing to 1 from -5 in June. For FY2003, firms generally expect increases insales, profits, and investment.
On October 10, the Bank of Japan announced several measures intended toreinforce its commitment to a policy of quantitative easing. For one, the Bankincreased the upper limit of its target range for the outstanding balance of reserveaccounts held by private financial institutions at the BOJ to ¥32 trillion from ¥30trillion. (The new target range is thus ¥27-32 trillion, as compared to ¥27-30trillion previously.) It also announced that its policy of quantitative easing will

IV-14
not be lifted unless the core consumer price index registers inflation of zeropercent or more (on a twelve-month basis) for a few months, and the Bank isconvinced that the core CPI will not fall below zero percent soon thereafter. Inaddition, the BOJ will extend the maximum term of its repo operations from sixmonths to one year.
Prime Minister Koizumi was reelected as Liberal Democratic Party (LDP)president on September 20, after which he reshuffled the Cabinet. HeizoTakenaka retained his posts as head of the Financial Services Agency andMinister of Economic and Fiscal Policy, despite strong calls for replacing him byseveral senior LDP lawmakers. Sadakazu Tanigaki was named Japan's newfinance minister. On October 10, Koizumi dissolved the lower house of the Dietand called for a general election to be held on November 9.
In the euro area, recent data suggest that economic growth turned positive in thethird quarter. In September, the euro-area PMI for manufacturing rose again,topping the 50 threshold and indicating expansion for the first time in sevenmonths; industrial confidence also moved higher. Euro-area industrialproduction fell 0.4 percent in August, in part because of a greater than usualnumber of holidays in Germany. While this decline offset some of the gain madein July, the July-August average was 0.5 percent above the second-quarteraverage. German manufacturing orders were flat in August, but foreign ordersrose about 2 percent, suggesting that the upturn in global growth is boosting theGerman manufacturing sector. German retail sales also picked up in August,while French retail sales declined. Along with the recent rise in the German PMIand fall in the French PMI, this raises the possibility that the under-performanceof the German economy relative to the French economy over the past few yearsmay not have continued in the third quarter.
Euro-area twelve-month consumer price inflation remained just above the ECB's2 percent ceiling in September. Core inflation, excluding energy andunprocessed food, reversed its recent declines by moving back up to 2 percent.The heat wave this summer led to an increase in food price inflation, althoughenergy price inflation declined in September.
In September, the French government announced measures to reduce itsstructural budget deficit by 0.7 percentage points of GDP in 2004. Its goal is tobring the deficit to 3.6 percent of GDP, down to the 4.0 percent projected for thisyear, but still above the 3 percent ceiling required by the Stability and GrowthPact (SGP). In October, the European Commission (EC) directed France to cutits deficit next year more than planned but gave it until 2005 to fully comply withthe SGP. Specifically, the EC recommended that France reduce its structural

IV-15
Euro-Area Economic Indicators(Percent change from previous period except as noted, s.a.)
2003IndicatorIndicator Q1 Q2 Q3 Jun. Jul. Aug. Sept.
Industrial production¹ .2 -.5 n.a. -.0 1.0 -.4 n.a.
Retail sales volume2 .7 -.0 n.a. .0 .1 n.a. n.a.
Unemployment rate3 8.7 8.8 n.a. 8.8 8.8 8.8 n.a.
Consumer confidence 4 -19.3 -19.3 -17.3 -19.0 -18.0 -17.0 -17.0
Industrial confidence 4 -11.0 -12.0 -11.3 -12.0 -14.0 -11.0 -9.0
Mfg. orders, Germany .3 -1.9 n.a. 2.2 -.2 .0 n.a.
CPI 5 2.3 1.9 2.0 1.9 1.9 2.1 2.1
Producer prices 5 2.4 1.5 n.a. 1.4 1.4 1.4 n.a.
M3 5 8.0 8.4 n.a. 8.4 8.6 8.2 n.a.
1. Excludes construction.2. Excludes motor vehicles.3. Percent. Euro area standardized to ILO definition. Includes Eurostat estimates in some
cases.4. Diffusion index based on European Commission surveys in individual countries.5. Eurostat harmonized definition. Percent change from year earlier.n.a. Not available.
deficit by a whole percentage point in 2004. If the Council of Finance Ministersapproves the EC recommendation and the French government does not changeits budget accordingly, France could be forced to make a non-interest bearingdeposit of just over 0.2 percent of its GDP. That deposit, which would be placedwith the European Community, would be forfeited if the French government didnot make sufficient progress on deficit reduction over the next two years.
In the United Kingdom, the Office of National Statistics recently released aconsiderably revised GDP series. A downward adjustment in 2002 mainlystemmed from higher imports. Newly released data on construction outputcontributed to a substantial upward revision to growth for the second quarter of2003, from 1.4 percent to 2.4 percent. These revisions coincided with a switch tochain-weighted GDP, but the adjustments due to the change in methodologywere relatively small.
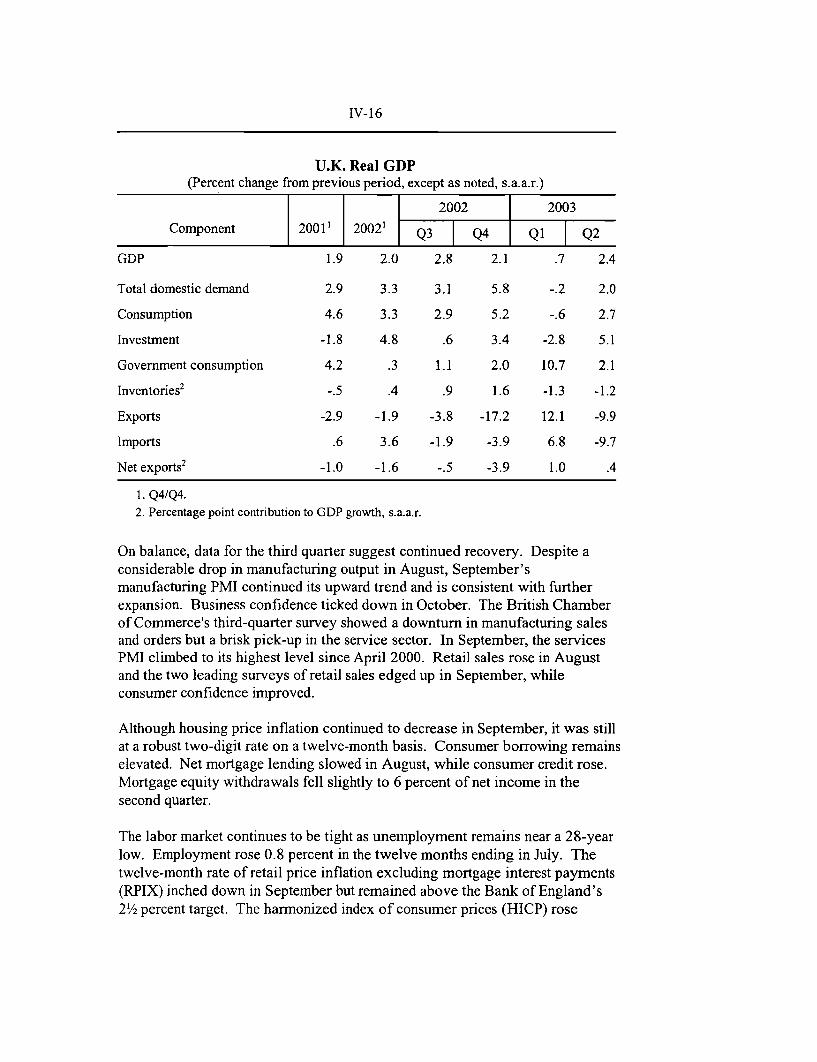
IV-16
U.K. Real GDP(Percent change from previous period, except as noted, s.a.a.r.)
2002 2003
Component 2001' 2002' Q3 Q4 Q1 Q2
GDP 1.9 2.0 2.8 2.1 .7 2.4
Total domestic demand 2.9 3.3 3.1 5.8 -.2 2.0
Consumption 4.6 3.3 2.9 5.2 -.6 2.7
Investment -1.8 4.8 .6 3.4 -2.8 5.1
Government consumption 4.2 .3 1.1 2.0 10.7 2.1
Inventories 2 -.5 .4 .9 1.6 -1.3 -1.2
Exports -2.9 -1.9 -3.8 -17.2 12.1 -9.9
Imports .6 3.6 -1.9 -3.9 6.8 -9.7
Net exports2 -1.0 -1.6 -.5 -3.9 1.0 .4
1. Q4/Q4.2. Percentage point contribution to GDP growth, s.a.a.r.
On balance, data for the third quarter suggest continued recovery. Despite aconsiderable drop in manufacturing output in August, September'smanufacturing PMI continued its upward trend and is consistent with furtherexpansion. Business confidence ticked down in October. The British Chamberof Commerce's third-quarter survey showed a downturn in manufacturing salesand orders but a brisk pick-up in the service sector. In September, the servicesPMI climbed to its highest level since April 2000. Retail sales rose in Augustand the two leading surveys of retail sales edged up in September, whileconsumer confidence improved.
Although housing price inflation continued to decrease in September, it was stillat a robust two-digit rate on a twelve-month basis. Consumer borrowing remainselevated. Net mortgage lending slowed in August, while consumer credit rose.Mortgage equity withdrawals fell slightly to 6 percent of net income in thesecond quarter.
The labor market continues to be tight as unemployment remains near a 28-yearlow. Employment rose 0.8 percent in the twelve months ending in July. Thetwelve-month rate of retail price inflation excluding mortgage interest payments(RPIX) inched down in September but remained above the Bank of England's2½ percent target. The harmonized index of consumer prices (HICP) rose

IV-17
U.K. Economic Indicators(Percent change from previous period except as noted, s.a.)
2003
Indicator Q1 Q2 Q3 Jul. Aug. Sept. Oct.
Industrial production -.3 .2 n.a. -. 1 -. 8 n.a. n.a.
Retail sales volume¹ .0 1.5 n.a. -.6 .2 n.a. n.a.
Unemployment rate²
Claims-based 3.1 3.1 3.1 3.1 3.1 3.1 n.a.
Labor force survey³ 5.1 5.0 n.a. 5.0 n.a. n.a. n.a.
Business confidence4 -1.3 -6.3 -3.3 -4.0 -3.0 -3.0 -4.0
Consumer confidence5 -10.0 -6.7 -5.0 -6.0 -6.0 -3.0 n.a.
Retail prices 6 2.9 2.9 2.9 2.9 2.9 2.8 n.a.
Producer input prices7 1.8 -.5 1.1 1.0 1.8 .4 n.a.
Average earnings7 3.5 3.0 n.a. 3.6 3.4 n.a. n.a.
1. Excludes motor vehicles.2. Percent3. Three-month average centered on month shown.4. Percentage of firms expecting output to increase in the next four months less percentage
expecting output to decrease.5. Average of the percentage balance from consumers' expectations of their financial
situation, general economic situation, unemployment, and savings over the next 12months.6. Excluding mortgage interest payments. Percent change from year earlier.7. Percent change from year earlier.n.a. Not available.
1.4 percent in the twelve months ending in September. Most of the difference
between the RPIX and the HICP can be attributed to the exclusion of housingcomponents in the latter.
On October 9, the Monetary Policy Committee voted 5 to 4 against raising rates25 basis points, with both Mervyn King and Rachel Lomax, both of whom manyhad thought would be among the first to argue for higher rates, in the majority.The committee agreed that strength in the housing market suggested thatconsumption growth would not moderate as quickly as previously expected, butthe minority contended that inflation would likely be above the target in twoyears time as a result, while the majority was concerned that "a premature rise inthe repo rate might choke off the improvement in business conditions."

IV-18
In Canada, real GDP by industry increased 7.2 percent (a.r.) in July, led by astrong performance in the auto sector. In August, however, manufacturingshipments decreased sharply, largely reflecting production disruptions associatedwith the Northeast power outage. The effects of the power outage wereparticularly evident in the motor vehicle sector, where July's gains were morethan reversed, and in sharp declines in both exports and imports.
Employment rose slightly in the third quarter, as a large increase in Septembermore than offset losses in July and August. Despite continued weakness inmanufacturing employment, conditions in Canadian labor markets haveimproved of late benefitting from rising employment in the booming constructionsector. Housing starts reached a thirteen-year high during the third quarter.Domestic demand has remained resilient in recent months, with preliminaryestimates indicating that motor vehicle sales climbed in the third quarter toremain in the vicinity of the record-breaking levels of 2002.
Canadian Economic Indicators(Percent change from previous period except as noted, s.a.)
2003
Indicator Q1 Q2 Q3 Jun. Jul. Aug. Sept.
GDP by industry .8 -.1 n.a. .1 .6 n.a. n.a.
Industrial production .1 -1.9 n.a. -.8 1.1 n.a. n.a.
New mfg. orders 1.5 -4.7 n.a. 1.9 2.3 -4.9 n.a.
Retail sales 1.8 -.1 n.a. .3 1.0 .3 n.a.
Employment .5 .1 .1 .3 -.1 -.1 .3
Unemployment rate¹ 7.4 7.7 7.9 7.7 7.8 8.0 8.0
Consumer prices² 4.5 2.8 2.1 2.6 2.2 2.0 2.2
Core Consumer Prices²³ 3.2 2.4 1.7 2.0 1.7 1.6 1.8
Consumer attitudes4 114.5 115.1 n.a. ... ...
Business confidence 4 131.4 109.9 n.a. ... ...
1. Percent.2. Percent change from year earlier, n.s.a.3. Excluding food, energy, and indirect taxes.4. Level of index, 1991 = 100.n.a. Not available. ... Not applicable.

IV-19
In September, the twelve-month rate of headline CPI inflation rose slightly to2.2 percent. Higher natural gas prices as well as a large increase in universitytuition contributed to the rise. Twelve-month core inflation, excluding food,energy prices, and indirect taxes, edged up to 1.8 percent in September.
External Balances(Billions of U.S. dollars, s.a.a.r.)
Country 2002 2003
and balance Q4 Q1 Q2 Jun. Jul. Aug.
Japan
TradeCurrent account
Euro areaTrade¹Current account¹
GermanyTradeCurrent account¹
FranceTradeCurrent account
ItalyTradeCurrent account¹
United KingdomTradeCurrent Account
CanadaTradeCurrent Account
84.9 73.3 77.2 73.8 75.8 91.5102.2 117.3 133.6 114.1 149.4 148.1
103.4 31.3 70.3 102.0 182.0 86.889.9 12.0 -22.4 39.2 16.4 n.a.
129.1 125.7 139.1 140.4 170.3 163.887.0 41.9 39.2 35.4 16.8 30.5
1.1 .54.6 3.7
5.3 .9 -3.9 -6.2 -2.1 -3.3-15.8 -30.2 -42.3 -61.3 28.2 -11.3
-83.3 -69.1 -71.1-25.1 -14.9 -55.7
34.7 43.4 42.712.4 18.3 14.5
-89.0 -58.5
41.6 41.6
-68.7
44.9
1. Not seasonally adjusted.n.a. Not available. ... Not applicable.

IV-20
Consumer Price Inflation in Selected Industrial Countries(12-month change)
Germany
FrancePercent
1996 1997 1998 1999 21100 20111 2002 211113
.111.111,11111111111111111 I
Percent- 6
3
0
-I
1996 1997 1998 1999 2000 2001 2002 211113
United KingdomPercent
6
4
3
-I- - -1
, I , I-- I I , , I , , I,-I-,-, I..
1996 1997 1998 1999 20111) 2111) 2002 2003
CanadaPercent
6- -
3
-1
I
-I
LLLL

IV-21
Japan
1996 1997 1998 1
France
lllll lllIl1996 1997 1998 1'
Italv
Industrial Production in Selected Industrial Countries1996=100 4)ermany
- 130 -
120
111)
- 90911
,I ,I ,,,- I ,I ,,-- 811 I 1 1 1 ,,,I, , I,,I ,,,I
99) 2000 211101 201102 2003 1996 1997 1998 1999 211111
Uniled Kingdom- 130 -
90
999 2000 211001 21102 2003 1996 1997 1998 1999 20110
Canada- 130
120
11
1996=100
21101 20112 21113
I2 II I 11 III20011 2002 2003
r :O
/uS h
111,1111111111996I I 19 19 911II) -1 lll -11112 2111.3

IV-22
Economic Situation in Other Countries
The economies of emerging Asia appear to have recovered quickly from theeconomic effects of SARS. The Chinese economy, in particular, is racingahead. In addition, indicators of high-tech production in the region haverecently shown signs of a rapid expansion. In Latin America, the story is moreuncertain. Recent indicators for Mexico have been mixed, although theBrazilian economy appears to have bottomed out and the economic recovery inArgentina has continued.
In general, inflation in the emerging market economies remains in check, withtwelve-month consumer price inflation falling or staying put at already very lowlevels in most economies.
Chinese real GDP grew 17.5 percent in the third quarter, with growth boostedby strength in state-sector investment and exports. All indications are thatChina has completely recovered from the economic impact of SARS, with retailsales and tourism, in particular, having reached pre-SARS levels. Twelve-month consumer price inflation edged up again in September to just above 1percent. Despite the low overall inflation figure, Chinese officials are concernedabout possible overheating in some sectors and have made efforts to slowlending to those sectors. China's trade balance turned negative in September, asimports surged. Moreover, China's year-to-date trade surplus is considerablysmaller than last year's surplus, and some analysts are forecasting that the tradebalance will be close to zero for the year as a whole.
Chinese Economic Indicators(Percent change from previous period, s.a., except as noted)
2003Indicator 2001 2002 20
1Q2 Q3 July Aug. I Sept.
Real GDP' 7.5 8.0 -2.9 17.5
Industrial production 2 8.9 11.8 15.1 16.6 16.5 17.1 16.3
Consumer prices2 -. 3 -.4 .7 .8 .5 .9 1.1
Trade balance 3 23.1 30.3 12.5 7.0 5.8 19.1 -3.7
1. Annual rate. Quarterly data estimated by staff from reported four-quarter growth rates.Annual figures are Q4/Q4.
2. Percent change from year earlier. Annual figures are year over year.3. Billions of U.S. dollars, annual rate. Imports are c.i.f.... Not applicable.

IV-23
Despite the narrowing of the trade balance, attention has remained focused onChina's exchange rate regime. Nondeliverable forward contracts point toappreciation of the renminbi exchange rate over the next twelve months.Chinese officials continue to insist, however, that no changes to the exchangerate regime will be made in the near future.
Economic conditions in Hong Kong are rapidly improving as the economiceffects of SARS subside. Retail sales are now above and tourist arrivals are justbelow their pre-SARS levels. Moreover, the SARS-related climb in theunemployment rate appears to have begun to reverse itself. Even the propertysector, which has been in a five-year slump, has recently shown some limitedsigns of improving, as recent changes in Chinese laws now allow someinvestment in the Hong Kong property market by Chinese companies. Althoughthe trade balance slipped in August, total trade-a good indicator of economicactivity for Hong Kong's entrepôt economy-remained near historical highs.Consumer prices continue to fall, although the rate of decline slowed somewhatin August.
Hong Kong Economic Indicators(Percent change from previous period, s.a., except as noted)
2003Indicator 2001 2002
Q2 Q3 July Aug. Sept.
Real GDP' -1.3 5.2 -14.0 n.a.
Unemployment rate2 4.9 7.3 8.6 8.3 8.7 8.6 8.3
Consumer prices 3 -3.7 -1.6 -2.5 n.a. -4.0 -3.8 n.a.
Trade balance 4 -11.4 -7.7 -6.8 n.a. -2.6 -10.5 n.a.
1. Annual rate. Annual figures are Q4/Q4.2. Percent. Monthly numbers are averages of the current and previous two months.3. Percent change from year-earlier period, except annual figures, which are Dec./Dec.4. Billions of U.S. dollars, annual rate. Imports are c.i.f.n.a. Not available. ... Not applicable.
Recent data for Taiwan have been encouraging. Production of high-tech goodssoared in August, although this was largely offset by declines in othermanufacturing sectors and construction. Export order books for electronics areat levels not seen since the high-tech bubble in 2000. Unemployment fell in thethird quarter, after rising somewhat in the second quarter due to the effects ofSARS. Both exports and imports rose at very rapid rates in September, with thenet effect being a widening of the trade surplus. The renewed economicstrength contributed to an easing of deflationary pressures, with consumer pricesfalling only slightly in September on a twelve-month basis.

IV-24
Taiwan Economic Indicators(Percent change from previous period, s.a., except as noted)
2003Indicator 2001 2002 ---- i ---- | ---- | ---- \_ ---
Q2 Q3 July Aug. Sept.
Real GDP¹ -1.9 4.3 -8.1 n.a.
Unemployment rate 2 4.6 5.2 5.2 5.0 5.0 5.0 4.9
Industrial production -7.3 6.4 -1.0 n.a. 5.0 .1 n.a.
Consumer prices 3 -1.7 .8 -.1 -.6 -1.0 -.6 -.2
Trade balance 4 15.6 18.1 16.2 20.0 20.0 18.8 21.3
Current account5 17.9 25.7 26.3 n.a.
1. Annual rate. Annual figures are Q4/Q4.2. Percent.3. Percent change from year-earlier period, except annual figures, which are Dec./Dec.4. Billions of U.S. dollars, annual rate. Imports are c.i.f.5. Billions of U.S. dollars, n.s.a., annual rate.n.a. Not available. ... Not applicable.
In Korea, indications are that the economy is recovering, although third-quarteroutput was damped by some adverse shocks. A series of labor strikes depressedindustrial production in July, although it bounced back in August, and a typhoonin mid-September damaged some key infrastructure and hurt agricultural output.Even so, the unemployment rate has stabilized recently, after rising ½percentage point earlier in the year. Retail sales were up in August, andbusiness confidence indicators rose in September. In late September, thegovernment confirmed that it would introduce a second supplementary budgetthis year to help pay for typhoon-related reconstruction. Twelve-monthconsumer price inflation inched up in September due to rising agriculturalprices. The trade balance widened in August, as imports declined more thanexports.

IV-25
Korean Economic Indicators(Percent change from previous period, s.a., except as noted)
2003Indicator 2001 2002 - --
Q2 Q3 July Aug. Sept.
Real GDP' 4.2 7.0 -2.9 n.a.
Industrial production .4 8.3 -.4 n.a. -3.8 3.4 n.a.
Unemployment rate2 3.8 3.1 3.4 3.5 3.6 3.5 3.5
Consumer prices³ 3.2 3.8 3.3 3.2 3.2 3.0 3.3
Trade balance 4 13.5 14.2 19.3 n.a. 19.8 29.3 n.a.
Current account 5 8.2 6.1 10.1 n.a. 5.1 16.7 n.a.
1. Annual rate. Annual figures are Q4/Q4.2. Percent.3. Percent change from year earlier, except annual changes, which are Dec./Dec.4. Billions of U.S. dollars, annual rate.5. Billions of U.S. dollars, n.s.a., annual rate.n.a. Not available. ... Not applicable.
In general, the ASEAN economies appear to have recovered from the economic
effects of SARS, with tourist arrivals and consumption indicators at or nearpre-SARS levels. Real GDP in Thailand grew 3.5 percent in the SARS-affectedsecond quarter, on the back of strong performances in the manufacturing andconstruction sectors. The recent behavior of industrial output in the region hasbeen mixed. Production in Malaysia and Thailand contracted in August, butSingapore posted an impressive gain due to a surge in output in thepharmaceuticals industry. In addition, there are signs of strength in high-techproduction in several of these countries. In August, trade balances improvedslightly in Malaysia and the Philippines, while in Indonesia and Thailandsurpluses shrank as exports fell more than imports. Singapore's trade surpluswidened considerably in September due to surging exports. Inflation remainedbenign, with only Indonesia posting twelve-month consumer price inflationgreater than 3 percent.

IV-26
ASEAN Economic Indicators: Growth(Percent change from previous period, s.a., except as noted)
2003Indicator and country 2001 2002 Q I Q2 June July Aug.
Q1 Q2 June July Aug.
Real GDP¹
IndonesiaMalaysiaPhilippinesSingaporeThailand
1.7 3.8 4.5 6.3-.9 5.3 2.9 6.93.6 5.7 -2.1 .3
-6.0 3.0 1.4 -11.42.2 6.4 5.4 3.5
Industrial production2
Indonesia³ .7 -1.1 1.1 -2.5 -.9 4.2 n.a.
Malaysia -4.1 4.6 2.1 4.3 -2.0 1.7 -1.8Philippines -5.7 -6.1 2.9 1.6 -8.4 9.8 n.a.
Singapore -11.6 8.5 4.9 -5.3 1.8 -.6 17.8
Thailand 1.3 8.5 4.0 3.2 -2.1 1.8 -2.8
1. Annual rate. Annual figures are Q4/Q4.2. Annual figures are annual averages.3. Staff estimate.n.a. Not available. ... Not applicable.
ASEAN Economic Indicators: Trade Balance(Billions of U.S. dollars, s.a.a.r.)
2003Country 2001 2002 Q2 Q3 July
Q2 Q3 July Aug. Sept.
Indonesia 25.4 25.9 29.2 n.a. 29.2 25.5 n.a.
Malaysia 14.2 13.5 20.8 n.a. 16.2 17.0 n.a.
Philippines -.9 -.2 -1.2 n.a. -1.9 -1.0 n.a.
Singapore 5.8 8.7 13.2 18.7 18.7 14.5 22.8
Thailand 2.5 3.4 5.8 n.a. 4.2 1.6 n.a.
n.a. Not available.

IV-27
ASEAN Economic Indicators: CPI Inflation(Percent change from year earlier, except as noted)
2003Country 2001¹ 2002¹ Q2 Q3 July Aug. Sept.
Indonesia 12.5 10.0 7.0 6.1 5.8 6.4 6.2
Malaysia 1.2 1.7 .9 1.0 1.0 1.0 1.1
Philippines 4.1 2.6 3.0 3.1 3.4 3.0 2.9
Singapore -.6 .4 .2 n.a. .3 .5 n.a.
Thailand .8 1.6 1.8 1.9 1.8 2.2 1.7
1. December/December.n.a. Not available
In Mexico, supply-side indicators generally continued to point to someweakness in economic activity, although the monthly pattern provides somegrounds for encouragement. An index of overall economic activity (a monthlyproxy for real GDP) was about flat in July, but industrial production increased inAugust after three consecutive months of decline. Exports registered a smallincrease in August, and business confidence appears to be holding up. On thedemand side, there are some tentative indications that consumption spending-akey component of the strong second-quarter GDP performance-may be losingsome steam. Although retail sales held up in July, some consumer surveysshowed a decline in confidence in August and September. Inflation hasremained in check, with twelve-month consumer price increases recentlycoming in at the upper end of the government's 2-4 percent target range.Inflation expectations for year-end inflation currently stand at about 3.8 percent.

IV-28
Mexican Economic Indicators(Percent change from previous period, s.a., except as noted)
2003Indicator 2001 2002
Q2 Q3 July Aug. Sept.
Real GDP' -1.4 2.0 4.9 n.a.
Overall economic activity -.1 .8 .4 n.a. .0 n.a. n.a.
Industrial production -3.3 -.1 -.1 n.a. -.2 .4 n.a.
Unemployment rate2 2.5 2.7 3.0 3.7 3.5 4.0 3.6
Consumer prices 3 4.4 5.7 4.7 4.1 4.1 4.0 4.0
Trade balance 4 -10.0 -7.9 -7.5 n.a. -7.8 -7.1 n.a.
Imports 4 168.4 168.7 168.4 n.a. 170.1 169.7 n.a.
Exports4 158.4 160.8 160.9 n.a. 162.3 162.6 n.a.
Current account 5 -18.0 -14.0 -5.9 n.a.
1. Annual rate. Annual figures are Q4/Q4.2. Percent; counts as unemployed those working one hour a week or less.3. Percent change from year-earlier period, except annual figures, which are Dec./Dec.4. Billions of U.S. dollars, annual rate.5. Billions of U.S. dollars, n.s.a., annual rate.n.a. Not available. ... Not applicable.
In Brazil, data releases since the last Greenbook suggest that the economy hasbottomed out. Although unemployment climbed in recent months, industrialproduction rose 1.5 percent in August, the second consecutive monthly gainfollowing a sharp decline in June. Production was strongest in the tradeablegoods sectors, consistent with the view that external demand has continued tofuel growth. Month-to-month consumer price inflation rose in September,driven largely by an increase in government-regulated prices and gasolineprices. However, the average of one-year ahead inflation expectations are at 6.3percent, well below current levels. Brazil has continued to register sizeabletrade surpluses, leading to a small current account surplus.
Prompted by favorable inflation trends and the still weak economy, the centralbank reduced its benchmark interest rate, the Selic, 200 basis points in lateSeptember. The Selic now stands at 20 percent, compared with 26.5 percent last
June.

IV-29
Brazilian Economic Indicators(Percent change from previous period, s.a., except as noted)
2003Indicator 2001 2002
Q2 Q3 July Aug. Sept.
Real GDP' -.9 3.2 -6.2 n.a.
Industrial production 1.6 2.5 -2.4 n.a. .9 1.5 n.a.
Unemployment rate2 12.4 12.5 12.1 13.0 12.7 12.9 13.4
Consumer prices 3 7.7 12.5 16.9 15.2 15.4 15.1 15.1
Trade balance 4 2.7 13.1 23.6 26.8 22.8 26.4 31.3
Current account 5 -23.2 -7.7 1.6 n.a. 8.9 14.6 n.a.
1. Annual rate. Annual figures are Q4/Q4.2. Percent. Break in October 2001 as a result of change in methodology. Thus, 2001 is
average for Q4 only.3. Percent change from year-earlier period, except annual figures, which are Dec./Dec.
Price index is IPC-A.4. Billions of U.S. dollars, annual rate.5. Billions of U.S. dollars, n.s.a., annual rate.n.a. Not available. ... Not applicable.
In Argentina, the economic recovery has continued. Real GDP rose 6.6 percent
in the second quarter, and the average of July and August industrial productionwas more than 2 percent above its second quarter average. Consumer priceinflation has continued to decline, with the twelve-month rate falling to3.5 percent in September.
In mid-September, Argentina and the IMF agreed on a new three-year program.The final agreement does not include a timetable for utility tariff increases anddoes not explicitly require the government to compensate banks for the damageits crisis-management policies did to their balance sheets, conditions that theIMF had originally insisted would be necessary. The program sets a target forthe primary surplus in 2004 of 3 percent of GDP, but it does not specify targetsfor the two subsequent years.
In late September, Argentina proposed a 75 percent reduction in the face valueof more than $90 billion in defaulted debt owned by private bondholders. UnderArgentina's complex plan, the country would offer investors a choice of threenew bonds-discount bonds, par bonds, and capitalization bonds-in exchange for152 existing issues denominated in seven currencies and issued in eightjurisdictions. Bondholders' reaction to the proposal has been largely negative.

IV-30
Argentine Economic Indicators(Percent change from previous period, s.a., except as noted)
2003Indicator 2001 2002
Q2 Q3 July Aug. Sept.
Real GDP' -10.3 -3.3 6.6 n.a.
Industrial production -7.6 -10.6 .4 n.a. 1.3 1.8 n.a.
Unemployment rate2 18.1 20.4 16.4 n.a.
Consumer prices³ -1.4 41.0 14.5 5.2 7.3 4.9 3.5
Trade balance 4 7.5 16.7 19.1 n.a. 18.5 15.5 n.a.
Current account 5 -4.5 9.6 11.7 n.a.
1. Annual rate. Annual figures are Q4/Q4.2. Percent, n.s.a. Data for Greater Buenos Aires. Data released semi-annually.3. Percent change from year-earlier period, except annual figures, which are Dec./Dec.4. Billions of U.S. dollars, annual rate.5. Billions of U.S. dollars, n.s.a., annual rate.n.a. Not available. ... Not applicable.
In Venezuela, real GDP rebounded in the second quarter, but still remains20 percent below its end-2001 level. Growth in the second quarter was led by arecovery in oil production, although non-oil production also experienced asizeable increase. Oil production is still believed to be below the levelprevailing before the general strike last December-January. Moreover, analystshave continued to express doubts about the sustainability of current productionlevels, given numerous technical problems following the dismissal by PresidentChavez of a large fraction of the employees of the government-owned oil firmearly this year. Unemployment has remained high. Consumer price inflationfell in September, partly due to price controls and to the fixed exchange rateregime established last February. On a twelve-month basis, however, inflationremained above 25 percent. Stringent capital controls remain in place, but havebeen loosened somewhat. The official exchange rate is 1,600 bolivares perdollar, but the black market continued to price the bolivare at a significantlymore depreciated exchange rate.
Venezuela's political outlook remains highly uncertain. The oppositioncontinues to push for a national referendum that would "recall" PresidentChavez, but this does not appear likely to happen any time soon.

IV-31
Venezuelan Economic Indicators(Percent change from previous period, s.a., except as noted)
2003Indicator 2001 2002
Q2 Q3 July Aug. Sept.
Real GDP' .9 -16.7 87.5 n.a.
Unemployment rate2 13.4 16.0 18.4 n.a. 18.0 17.4 n.a
Consumer prices³ 12.3 31.2 34.2 29.5 31.8 30.4 26.5
Non-oil trade balance 4 -12.2 -7.4 -2.4 n.a. n.a. n.a. n.a
Trade balance 4 9.3 13.9 15.1 n.a. n.a. n.a. n.a
Current account5 3.9 7.7 9.4 n.a.
1. Annual rate. Annual figures are Q4/Q4.2. Percent, n.s.a.3. Percent change from year-earlier period, except annual figures, which are Dec./Dec.4. Billions of U.S. dollars, annual rate.5. Billions of U.S. dollars, n.s.a., annual rate.n.a. Not available. ... Not applicable.