guidance for assessment of flooding hazards due …
TRANSCRIPT
DRAFT – 2013-06-21 U.S. NUCLEAR REGULATORY COMMISSION
GUIDANCE FOR ASSESSMENT OF FLOODING HAZARDS DUE TO DAM FAILURE JLD-ISG-2013-01

DRAFT – 2013-06-21
Page ii
Table of Contents
Table of Contents ........................................................................................................................................ ii Tables ......................................................................................................................................................... v Figures ........................................................................................................................................................ v 1. Introduction ........................................................................................................................................ 1
1.1 Purpose ................................................................................................................................................. 1 1.2 Scope .................................................................................................................................................... 2 1.3 Framework for Dam Failure Flood Hazard Estimation ......................................................................... 3
1.3.1 Screening .......................................................................................................................................... 3 1.3.2 Detailed Analysis .............................................................................................................................. 5
1.4 Probabilistic and Deterministic Hazard Analysis .................................................................................. 7 1.4.1 Historical Dam and Levee Failure Rates ........................................................................................... 8 1.4.2 Hydrologic Failure ............................................................................................................................ 8 1.4.3 Seismic Failure ................................................................................................................................. 8 1.4.4 Sunny-Day Failure ............................................................................................................................ 9
1.5 Interfacing with Owners and Regulators of Dams and Levees ............................................................. 9 1.5.1 Dam Safety Governance ................................................................................................................. 10 1.5.2 Dam Safety Guidance by Other Federal Agencies .......................................................................... 10 1.5.3 Obtaining Information on Dams and Levees .................................................................................. 11
1.6 Organization of guidance ................................................................................................................... 13 2. Background ....................................................................................................................................... 14
2.1 Classification of Dams and Levees ...................................................................................................... 14 2.1.1 Concrete Dams ............................................................................................................................... 14 2.1.2 Embankment Dams ........................................................................................................................ 16 2.1.3 Levees ............................................................................................................................................ 19
2.2 Classification of Dam Failures ............................................................................................................. 21 2.2.1 Influence of Dam Type on Failure Modes ...................................................................................... 22
2.2.1.1 Concrete Dams ...................................................................................................................... 22 2.2.1.2 Embankment Dams ............................................................................................................... 22
2.2.2 Failure of Spillways, Gates, Outlet Works and Other Appurtenances ........................................... 23 2.2.3 Operational Failures and Controlled Releases ............................................................................... 23
2.3 Multiple Dam Failures ........................................................................................................................ 24 3. Screening and Simplified Modeling Approaches for Watersheds with Many Dams ............................. 25
3.1 Criteria for “Inconsequential” Dams .................................................................................................. 26 3.2 Simplified Modeling Approaches........................................................................................................ 27
3.2.1 Representing Clusters of Dams ...................................................................................................... 33 4. Hydrologic Dam Failure ..................................................................................................................... 36
4.1 Hydrologic Failure by Structure Type ................................................................................................. 36 4.1.1 Concrete Dams ............................................................................................................................... 36 4.1.2 Embankment Dams ........................................................................................................................ 37 4.1.3 Spillways, Gates, Outlet Works and Other Appurtenances ........................................................... 37 4.1.4 Levees ............................................................................................................................................ 37
4.2 Analysis of Hydrologic Failure Modes................................................................................................. 38 4.2.1 Internal Pressure ............................................................................................................................ 38 4.2.2 Overtopping ................................................................................................................................... 39
4.2.2.1 Reservoir Capacity ................................................................................................................. 39 4.2.2.2 Starting Reservoir Elevation .................................................................................................. 40 4.2.2.3 Reservoir Surcharge Capacity ................................................................................................ 40 4.2.2.4 Spillway Discharge Capacity .................................................................................................. 41 4.2.2.5 Wave Action .......................................................................................................................... 43
4.2.3 Structural Overstressing of Dam Components ............................................................................... 43
DRAFT – 2013-06-21
Page iii
4.2.4 Surface Erosion from High Velocity and Wave Action .................................................................... 44 4.2.5 Failure of Spillways ......................................................................................................................... 45 4.2.6 Failure of Gates .............................................................................................................................. 46 4.2.7 Operational Failures and Controlled Releases ............................................................................... 47
4.2.7.1 Operational Failures .............................................................................................................. 47 4.2.7.2 Controlled releases ................................................................................................................ 48
4.2.8 Waterborne Debris ........................................................................................................................ 48 4.2.9 Multiple Dam Failure due to Single Storm Scenario ...................................................................... 49 4.2.10 Levee Failures ............................................................................................................................ 50
5. Seismic Dam Failure .......................................................................................................................... 52 5.1 Overview ............................................................................................................................................ 52
5.1.1 Seismic Hazard Characterization .................................................................................................... 53 5.1.1.1 Use of USGS National Seismic Hazard Maps ......................................................................... 53
5.1.2 Structural Considerations............................................................................................................... 53 5.1.3 Deterministic versus Probabilistic Seismic Hazard Analysis ........................................................... 54
5.2 Seismic Failure by Structure Type ...................................................................................................... 54 5.2.1 Concrete Dams ............................................................................................................................... 54 5.2.2 Embankment Dams ........................................................................................................................ 56 5.2.3 Spillways, Gates, Outlet Works and Other Appurtenances ........................................................... 56 5.2.4 Levees ............................................................................................................................................ 57
5.3 Analysis of Seismic Hazards Using Readily Available Tools and Information ..................................... 57 5.3.1 Ground Shaking .............................................................................................................................. 58 5.3.2 Fault Displacement ........................................................................................................................ 59 5.3.3 Liquefaction ................................................................................................................................... 59
5.4 Assessment of Seismic Performance of Dams Using Existing Studies ................................................ 60 5.4.1 Ground Shaking .............................................................................................................................. 61 5.4.2 Fault Displacement ........................................................................................................................ 61 5.4.3 Liquefaction ................................................................................................................................... 61
5.5 Multiple Dam Failure Due to a Single Seismic Event .......................................................................... 62 5.6 Modeling Consequences of Seismic Dam Failure ............................................................................... 64 5.7 Detailed Site Specific Seismic Hazard Analysis ................................................................................... 65
5.7.1 Ground Shaking .............................................................................................................................. 65 5.7.1.1 Seismic Source Characterization ........................................................................................... 65 5.7.1.2 Ground Motion Attenuation ................................................................................................. 66 5.7.1.3 Site Response ........................................................................................................................ 67 5.7.1.4 Development of Uniform Hazard Spectra ............................................................................. 68 5.7.1.5 Development of Acceleration Time-histories ........................................................................ 68
5.7.2 Fault Displacement Hazard Analysis .............................................................................................. 68 5.8 Detailed Analysis of Seismic Capacity of the Dam .............................................................................. 69
5.8.1 Concrete Dams ............................................................................................................................... 69 5.8.1.1 Sliding and Overturning Stability ........................................................................................... 70 5.8.1.2 Dynamic Analysis ................................................................................................................... 71
5.8.2 Embankment Dams ........................................................................................................................ 72 5.8.2.1 Deformation Analyses ........................................................................................................... 72
6. Other (Sunny Day) Failures ................................................................................................................ 74 6.1 Overview of Sunny Day Failures by Structure Type ............................................................................ 75
6.1.1 Concrete Dams ............................................................................................................................... 75 6.1.2 Embankment Dams ........................................................................................................................ 76
6.2 Analysis of Sunny Day Failures ........................................................................................................... 76 6.2.1 Sunny Day Failure Modes ............................................................................................................... 77 6.2.2 Initial Water Surface Elevation ....................................................................................................... 77
7. Dam Breach Modeling ....................................................................................................................... 78 7.1 Breach Modeling for Concrete Dams ................................................................................................. 78
DRAFT – 2013-06-21
Page iv
7.2 Breach Modeling of Embankment Dams ............................................................................................ 78 7.2.1 Regression Equations for Peak Outflow from Breach .................................................................... 80 7.2.2 Regression Equations for Breach Parameters ................................................................................ 81
7.2.2.1 Uncertainty in Predicted Breach Parameters and Hydrographs ........................................... 83 7.2.2.2 Performing Sensitivity Analyses to Select Final Breach Parameters ..................................... 84
7.2.3 Physically-Based Combined Process Breach Models ..................................................................... 85 8. Levee Breach Modeling ..................................................................................................................... 85 9. Flood Wave Routing .......................................................................................................................... 87
9.1 Applicability and Limitations of Hydrologic Routing Models ................................................ 87 9 . 1 . 1 Backwater Effects .................................................................................................................... 87 9.1.2 Floodplain Storage ......................................................................................................................... 88 9.1.3 Interaction of Channel Slope and Hydrograph Characteristics ......................................... 88 9.1.4 Configuration of Flow Networks ........................................................................................... 89 9 .1 .5 Occurrence of Subcritical and Supercritical Flow ................................................................. 89 9.1.6 Availability of Calibration Data Sets ...................................................................................... 89
9.2 Hydraulic Models ................................................................................................................................ 89 10. Terms and Definitions ................................................................................................................... 91 11. References .................................................................................................................................. 106
DRAFT – 2013-06-21
Page v
Tables
Table 1. Roles of Federal Agencies in Dam Safety1 ............................................................ 10 Table 2. Possible Dam Clustering Combinations ................................................................. 35 Table 3. Impact Durations for Impact Load Estimation ...... Error! Bookmark not defined.46
Figures
Figure 1. Levels of Analysis ................................................................................................... 4 Figure 2. Overview of Detailed Dam Failure Flood Hazard Analysis ..................................... 7 Figure 3. Concrete Gravity Dam (British Dam Society, 2013) ............................................. 15 Figure 4. Typical Concrete Arch Dam Cross Section and Plan Form (Youssef, 2013) ....... 15 Figure 5. Concrete Buttress Dam (SimScience, 2013) ........................................................ 16 Figure 6. Concrete Multi-Arch Dam (Bartlett Dam. U.S. Bureau of Reclamation; Photo: National Park Service, 2013) ................................................................................................ 16 Figure 7. Typical Earthfill Embankment Dams (USACE, 2004) ........................................... 17 Figure 8. Typical Rockfill Dams (USACE, 2004) .................................................................. 18 Figure 9. Typical Levee Cross-Section (Wikimedia Commons, 2013) ................................. 21 Figure 10. Screening approach for watersheds with many dams. ....................................... 26 Figure 11. Screening Method Flowchart (a) – Method 1 (Volume) ...................................... 30 Figure 12. Screening Method Flowchart (b) – Method 2 (Peak Flow without Attenuation) .. 31 Figure 13. Screening Method Flowchart (c) – Method 3 (Peak Flow with Attenuation) ....... 32 Figure 14. Screening Method Flowchart (d) – Method 4 (Hydrologic Method) .................... 33 Figure 15. Hypothetical Dam Representing Storage Upstream ........................................... 35 Figure 16. Seismic Dam Failure Analysis Options ............................................................... 58 Figure 17. Using Knowledge about the Attenuation of Ground Motion with Distance ......... 63 Figure 18. Refinement of Seismic Influence Using Deaggregation ..................................... 64 Figure 19. Generalized Trapezoidal Breach Progression (Gee, 2008) ................................ 80
DRAFT – 2013-06-21
Page 1
1. Introduction
When evaluating flooding hazards for nuclear power plants, floods resulting from dam failures need to be considered. In engineering terms, dams and levees fail when they do not deliver the services for which they are designed, such as flood protection, water supply, and hydropower. This Interim Staff Guidance (ISG) defines failure from a point of view at the Nuclear Power Plant (NPP). Therefore, in this ISG dam failure refers to flooding caused by any uncontrolled release of water that threatens to impact structures, systems and components (SSCs) important to safety at the NPP site.
It should be noted that there may be instances where controlled releases can lead to inundation at the NPP site. Examples include, but are not limited to: 1) releases performed in order to prevent dam failure during flood conditions; 2) releases performed to rapidly drawdown a reservoir to prevent incipient failure after a seismic event; and 3) releases performed to rapidly drawdown reservoir to prevent incipient sunny day failure.
In some cases, the elevation of the site provides the principle protection from flooding hazards. In some cases, SSCs important to safety are protected by passive (e.g., structures), or active (e.g., equipment), flood protection features. In other cases flood protection is provided by procedures. NPPs may also use some combination of the protection methods outlined above. Therefore, the site elevation and the lowest flood protection elevation of SSCs important to safety are the primary criteria for flood hazard assessment.
In general, failure of any dam upstream from the plant site is a potential flooding mechanism (consideration of upstream dams should include all water-impounding structures, whether or not defined as dams in the traditional sense). Dams that are not upstream from the plant, but whose failure would impact the plant because of backwater effects, may also present potential flooding hazards. Failures of dikes or levees in the watershed surrounding the site may contribute to or ameliorate flooding hazards, depending on the location of the levee and the circumstances under which it fails.
Failures of onsite water-storage or water-control structures (such as onsite cooling or auxiliary water reservoirs and onsite levees) that are located at or above the grade of safety-related equipment are potential flooding mechanisms. In addition, flood-induced failure of a dam or levee that impounds the ultimate heat sink constitutes a hazard to the plant. These structures should be evaluated for failure due to hydrologic and sunny-day mechanisms. Seismic failure of these structures fall under the scope of the R2.1 Seismic Reevaluations.
The dam failure itself may be due to flooding or some other cause such as a seismic event, a structural defect, or human performance related issues. The potential for these mechanisms to initiate dam failure, as well as the potential failure modes must be evaluated to fully characterize the dam failure flooding hazard.
1.1 Purpose
The purpose of this ISG is to provide guidance acceptable to NRC staff for re-evaluating flooding hazards due to dam failure for the purpose of responding to the March 2012 Request for Information (ML12053A340). However, licensees are not required to follow this guidance. Approaches and methods that differ from those presented in this ISG will be evaluated on a case-by-case basis. It should be noted that dam failures discussed as a

DRAFT – 2013-06-21
Page 2
result of applying this guidance are postulated solely to ensure the safety of a NPP. This guidance should in no way supersede or be used in lieu of guidance developed by any agency that owns, operates or regulates the dam(s) of interest.
This ISG supplements and clarifies other NRC guidance that discusses dam failure such as:
• Regulatory Guide 1.59, “Design Basis Floods for Nuclear Power Plants”, Revision 2 (USNRC, 1977)1
• NUREG-0800, “Review of Safety Analysis Reports for Nuclear Power Plants” (USNRC, 2007)
• NUREG/CR-7046, “Design-Basis Flood Estimation for Site Characterization at Nuclear Power Plants in the United States of America”, (USNRC, 2011)
This ISG is intended to provide guidance that is broadly consistent with other federal agencies that have direct responsibility for ownership, operation or regulation of dams, or direct responsibility for emergency planning and response for dam failure incidents. Therefore this guide draws from guidelines developed by the Federal Emergency Management Agency (FEMA), Federal Energy Regulatory Commission (FERC), the Bureau of Reclamation (USBR), and the U.S. Army Corps of Engineers (USACE). Some portions of this guidance draw from dam safety guidelines developed by states, including California, Colorado, and Washington. A draft white paper on dam failure prepared by the Nuclear Energy Institute was also used.
Although this ISG is broadly consistent with best practices identified in the federal and state guidance discussed above, there may be differences. In some cases, guidance is not uniform across agencies. In some cases, variance between this ISG and guidance of other agencies is due to differences in risk tolerance levels between the nuclear power sector and sectors such as water resources and flood control.
Certain widely-used modeling software packages are mentioned in this ISG for illustrative purposes, but the NRC does not recommend or endorse specific software packages. In general, hydrologic, hydraulic, geotechnical and structural simulation models accepted in standard engineering practice by Federal agencies and other authorities responsible for similar design considerations may be used. Justification for selection and use of a particular modeling method, approach or software package is the responsibility of the licensee.
1.2 Scope
A prioritization memo dated May 11, 2012 (ML12097A509) specified three categories for submittal of reevaluated flooding hazard reports. Those plants in Category 1 should have already submitted their flood reevaluation report by March 11, 2013 (unless an extension has been granted), which predates issuance of this ISG. Therefore, this ISG is not strictly applicable to Category 1 sites that have submitted their completed flood reevaluation report, and their dam failure flood hazard evaluations will be reviewed using present-day methodologies and regulatory guidance, as described in the Request for Information. This
1 Regulatory Guide 1.59, Rev. 2 included ANSI Standard N170-1976, “Standards for Determining Design Basis
Flooding at Power Reactor Sites” as an appendix. ANSI-N170-1976 was superseded by ANSI/ANS-2.8, “Determining Design Basis Flooding at Power Reactor Sites” in 1981. ANSI/ANS-2.8 was last updated in 1992. It has lapsed as an ANSI standard, but is still used by NRC staff.
DRAFT – 2013-06-21
Page 3
ISG is applicable to Category 2 and Category 3 sites (i.e., sites with submittal dates of March 12, 2014 and 2015, respectively), as well as most Category 1 sites that have been granted an extension. Instances where Category 1 sites have been granted a very short extension (e.g. a few weeks), will considered on a case-by-case basis.
This ISG is applicable to estimating flood hazards due to failure of both onsite and offsite water control structures and impoundments (excluding tanks). For offsite structures, hydrologic, seismic and sunny-day failure mechanisms are within the scope of the R2.1 Flooding Hazard Reevaluation and this ISG. For onsite structures, only hydrologic and sunny-day mechanisms are in scope. Seismic failure of onsite structures falls within the scope of the R2.1 Seismic Reevaluations and is not discussed in this ISG.
1.3 Framework for Dam Failure Flood Hazard Estimation
1.3.1 Screening
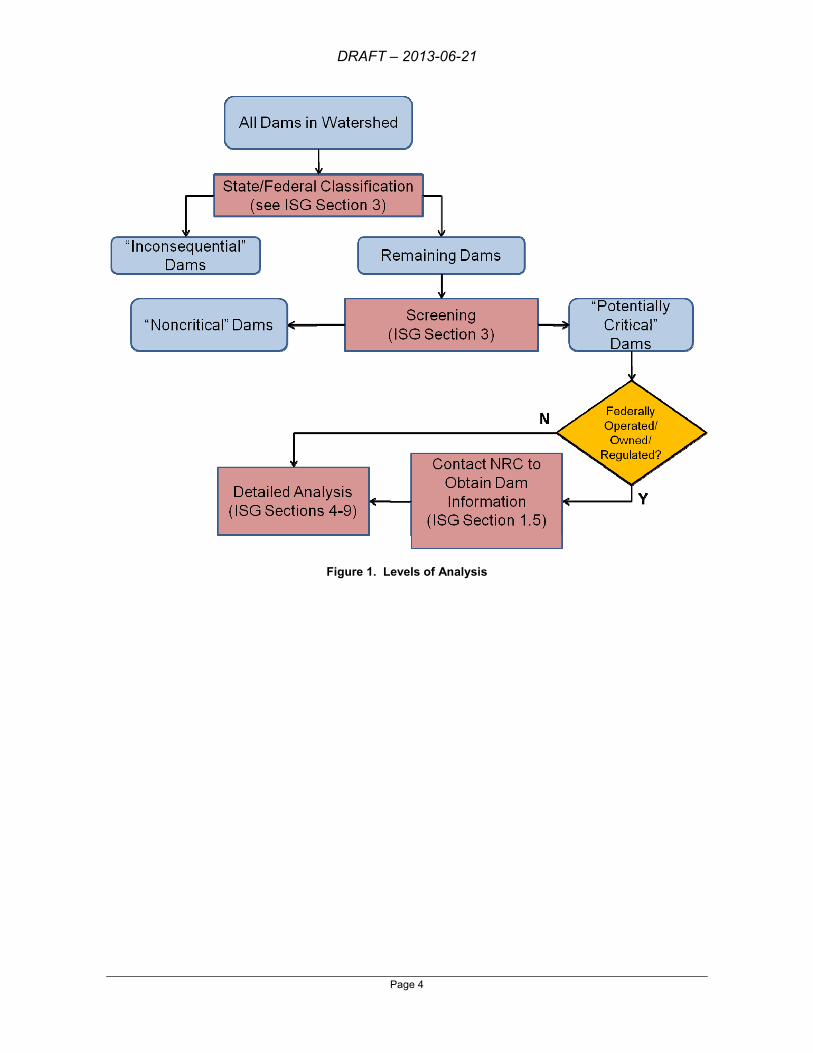
Any sufficiently large watershed in the U.S. typically contains many dams (hundreds to thousands for major watersheds). It is generally not practicable to perform detailed failure analysis on each dam in the watershed. Even if it were a tractable problem, a large number of the dams in the watershed will have no impact on flooding at the NPP due to some combination of small size or large distance from the NPP. Therefore, it is useful to perform a screening level analysis to identify these dams. Section 3 describes several procedures for identifying the small/distant dams whose failure would likely have negligible impacts on flooding at the NPP site. The approach identifies several classes of dams for the purposes of this ISG. Dams that can be removed from consideration without analysis because they meet criteria described in ISG Section 3.1 (e.g., dams not owned by a NPP licensee and identified by federal or state agencies as having minimal or no adverse failure consequences beyond the dam owner’s property), are called “inconsequential” dams. Dams that can be shown to have little impact on flooding at the NPP site using simplified analyses (as described in Section 3) are termed “noncritical“ dams. All other dams are considered “potentially critical”. Detailed analyses will be required to further assess these dams. Detailed analysis will show which of the “potentially critical“ dams are truly critical to flood hazard estimates at the NPP site. Critical dams are those whose failure, either alone, or as part of a cascading/multiple dam failure scenario, would cause inundation of the NPP site. Figure 1 illustrates the screening concept and the various dam classes. Details of the screening methods are provided in Section 3.
DRAFT – 2013-06-21
Page 4
Figure 1. Levels of Analysis
DRAFT – 2013-06-21
Page 5
1.3.2 Detailed Analysis
For those dams not screened out (see preceding section), the first step in detailed dam failure flood hazard estimation is determining the demand or loading cases that will be applied to the dam. For the purposes of responding to the March 2012 Request for Information (NRC, 2012), failure under hydrologic loadings associated with extreme floods, as well as ground motions associated with earthquakes must be considered. In addition, failure due to non-hydrologic, non-seismic causes (i.e., sunny day failures) must be considered. Sunny day failures encompass a wide variety of mechanisms (e.g., geologic or structural defects, miss-operation, etc.),
Detailed dam failure flood hazard estimation will require collecting data on the dam(s) to be analyzed (e.g., design documents, construction records, maintenance, and inspection program, planned modifications) as well as hydrometeorological and hydrologic data (e.g., design storms, topography, rainfall-runoff characteristics) on the river basin(s) in question. Typically, information about the dam is obtained from the dam owner and/or regulator. In the U.S., there is no single entity responsible for regulation of dams. Instead, dam regulation is distributed among various federal and state authorities. Dams may be privately owned, or owned by federal, state or local agencies. Many large dams on major rivers are owned by self-regulating federal agencies (e.g., USACE, USBR, TVA). Information on the physical characteristics and flooding history of watersheds can be obtained from federal agencies (e.g., USGS, NOAA/NWS), states, and organizations such as river basin commissions and flood plain managers.
Existing estimates for design storms and floods (e.g., PMP and PMF) in the region of interest developed by federal, state or other agencies may be used. However, some of these reports may be quite old (e.g. the NOAA/NWS Hydrometeorological Report 51 for the Eastern U.S. was published in 1978). The licensee should exercise due diligence and examine the record of extreme storms and floods in the region of interest to provide assurance that the existing estimates are still valid.
Any sufficiently large river basin in the U.S. will have a large number of dams and many of them will be small or located at a large distance from a NPP site. Such dams will not pose a significant flooding hazard to the NPP. Therefore, some sort of screening process will be needed in most cases to focus effort and resources on those dams considered potentially critical to safety of the NPP.
The potentially critical dams will be subjected to more detailed analysis to estimate the demand associated with the hazard or failure mechanism under consideration. Staff positions in this guide will inform the level of conservatism used for these analyses.
Once the demand or loads have been estimated, the capacity of the dam to withstand the estimated loads is considered. The level of detail and effort expended will depend upon several factors including, but not limited to, consequence of failure (e.g. a very large dam or a dam very near the NPP site versus a very small dam or one that is very far away), availability of design/construction information, and availability of recent studies to support capacity estimates (e.g., spillway capacity ratings, seismic capacity ratings, inspection and maintenance records, etc.). In lieu of a detailed analysis, one can simply assume that the dam fails under appropriate loading and move on to estimation of the consequences.
DRAFT – 2013-06-21
Page 6
Comparison of the estimated capacities to the applied loads is used to assess the credibility of failure modes associated with those cases. The assessment may consider factors of safety incorporated into the dam design or dam capacity assessments, with appropriate justification. Likewise, uncertainties in capacity and loading estimates should be considered to arrive at an appropriately conservative decision. If it cannot be demonstrated that the dam-failure likelihood over the expected remaining life of the nuclear power plant is extremely low (or consequences of failure are negligible), failure should be postulated and the flooding consequences estimated. It is recognized that such assessments will often require a combination of deterministic, qualitative probabilistic, and/or quantitative probabilistic analysis. For example, current NRC guidance accepts deterministic analysis of hydraulic hazards (e.g., PMP, PMF). Deterministic analyses of capacity to withstand loads that were arrived at by probabilistic or deterministic analysis are also accepted.
Dam failure consequence analysis will generally include estimating the reservoir outflow hydrograph (discharge hydrograph) resulting from dam failure (dam-breach analysis) and routing of the dam breach discharge to the plant site. The flood routing analysis should consider any potential for domino-type or cascading dam failures. Transport of sediment and debris by flood waters should be considered.
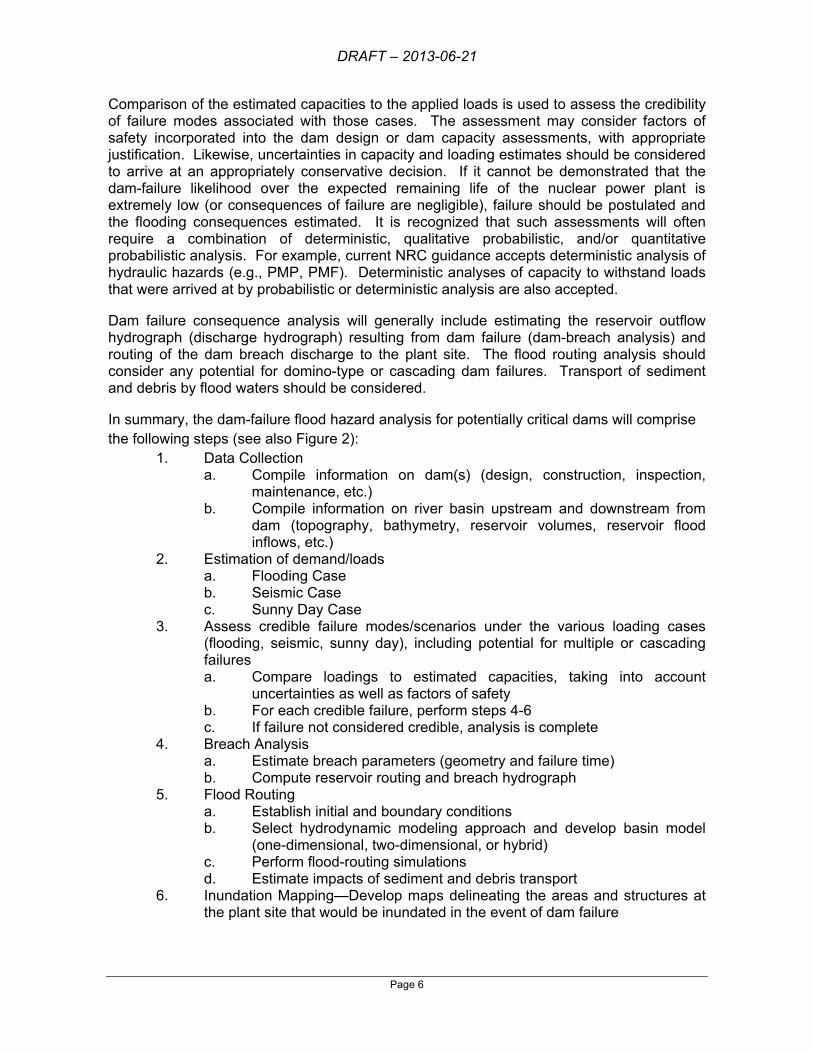
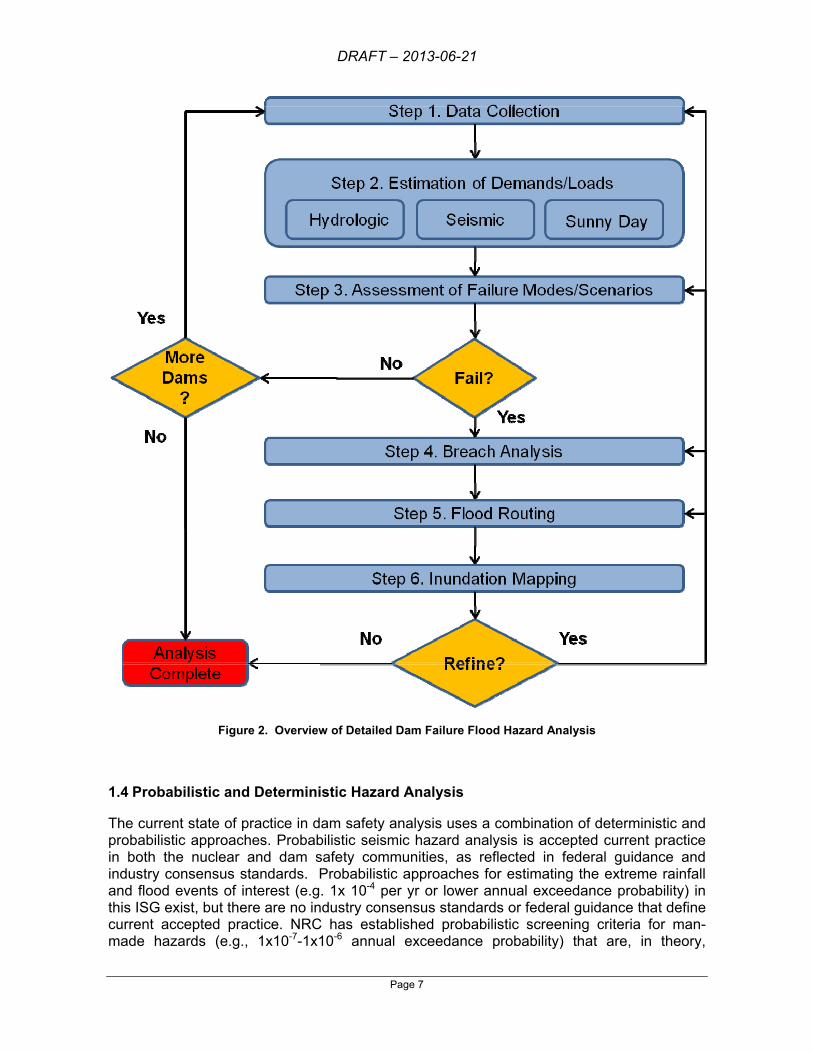
In summary, the dam-failure flood hazard analysis for potentially critical dams will comprise the following steps (see also Figure 2):
1. Data Collection a. Compile information on dam(s) (design, construction, inspection,
maintenance, etc.) b. Compile information on river basin upstream and downstream from
dam (topography, bathymetry, reservoir volumes, reservoir flood inflows, etc.)
2. Estimation of demand/loads a. Flooding Case b. Seismic Case c. Sunny Day Case
3. Assess credible failure modes/scenarios under the various loading cases (flooding, seismic, sunny day), including potential for multiple or cascading failures a. Compare loadings to estimated capacities, taking into account
uncertainties as well as factors of safety b. For each credible failure, perform steps 4-6 c. If failure not considered credible, analysis is complete
4. Breach Analysis a. Estimate breach parameters (geometry and failure time) b. Compute reservoir routing and breach hydrograph
5. Flood Routing a. Establish initial and boundary conditions b. Select hydrodynamic modeling approach and develop basin model
(one-dimensional, two-dimensional, or hybrid) c. Perform flood-routing simulations d. Estimate impacts of sediment and debris transport
6. Inundation Mapping—Develop maps delineating the areas and structures at the plant site that would be inundated in the event of dam failure
DRAFT – 2013-06-21
Page 7
Figure 2. Overview of Detailed Dam Failure Flood Hazard Analysis
1.4 Probabilistic and Deterministic Hazard Analysis
The current state of practice in dam safety analysis uses a combination of deterministic and probabilistic approaches. Probabilistic seismic hazard analysis is accepted current practice in both the nuclear and dam safety communities, as reflected in federal guidance and industry consensus standards. Probabilistic approaches for estimating the extreme rainfall and flood events of interest (e.g. 1x 10⁻⁴ per yr or lower annual exceedance probability) in this ISG exist, but there are no industry consensus standards or federal guidance that define current accepted practice. NRC has established probabilistic screening criteria for man-made hazards (e.g., 1x10⁻⁷-1x10⁻⁶ annual exceedance probability) that are, in theory,
DRAFT – 2013-06-21
Page 8
applicable to sunny-day dam failures. However, there is no widely accepted methodology for estimating sunny-day dam failure probabilities on the order of 1x10⁻⁷-1x10⁻⁶ annual exceedance probability.
1.4.1 Historical Dam and Levee Failure Rates
Nearly 1,500 dam failures have been recorded in the United States since the middle of the 19th century (records are unreliable for prior periods). Over this period, the long-term average rate of dam failures is about 10 per year, although this figure represents dams of all sizes and types, including small dams, whose failures have little or no consequences (NAS, 2012). If instead one looks at a running 10-year average of the dam failure rates since 1850, the failure rate has been over 20 per year for most of the period since the late 1970s (NAS, 2012). Expressed in terms of dam years, numerous studies of dam failures in the U.S. and worldwide have indicated an average failure rate on the order of 10-4 per dam year (e.g., Baecher et al., 1980). These historical rates for dam failure provide useful information about generic failure probabilities, but generic dam failure rates are not sufficient to screen out dam failure for the purpose of the R2.1 flooding hazard reevaluations (see ML090510269). Even when failure probability estimates are developed based upon site and dam specific data and information, there is not a widely accepted current engineering practice for estimating failure rates on the order of at the 1x 10⁻⁶ per year. Therefore, even with site specific information the staff will not accept screening out all dam failures based on probabilistic arguments, for the purpose of the R2.1 flooding hazard reevaluations. .
1.4.2 Hydrologic Failure
Probabilistic approaches for estimating the extreme rainfall and flood events of interest in this ISG (e.g. 1x 10⁻⁴ per yr or lower annual exceedance probability) exist, but there are no industry consensus standards or federal guidance that define current accepted practice. Therefore, for the purpose of the R2.1 Flooding Hazard reevaluation, a deterministic approach based on the probable maximum precipitation (PMP) and probable maximum flood (PMF) should be used. The PMP is an estimate of the maximum possible precipitation depth over a given size catchment for a given length of time (Stedinger et al., 1996). The PMF is the flood that may be expected from the most severe combination of critical meteorological and hydrologic conditions that are reasonably possible in the drainage basin under study. Consult Section 4 for additional detail on hydrologic failure.
Staff Position:
• A dam should be assumed to fail due to hydrologic hazard if cannot withstand its PMF, with associated effects.
1.4.3 Seismic Failure
Probabilistic seismic hazard analysis (PSHA) is considered to be present-day methodology in both the dam safety and the nuclear safety communities. Estimation of seismic hazards (e.g. vibratory ground motion, fault displacement, loss of strength) at annual exceedances of 10-4 per year is routine. Widely accepted earthquake source characterization data sets,
DRAFT – 2013-06-21
Page 9
ground motion prediction equations, and site amplification factors are publicly available. Section provides additional detail on analysis of seismic dam failures.
Staff Position:
• A dam should be assumed to fail if it cannot withstand the relevant seismic hazards (e.g., vibratory ground motion at spectral frequencies of importance, fault displacement, loss of strength) with an annual exceedance probability of 1x10⁻⁴ per year. Although the probability of extreme flooding occurring at the same time as an earthquake is extremely low, the probability of lesser floods should not be neglected. In addition, if the seismic capacity of the dam is considerably less that that required withstand the 10-4 seismic hazard, the possibility of large (though not extreme) floods should be considered. Therefore, the dam should be assumed to fail due to seismic hazard if it cannot withstand the more severe of the following combinations:
o 10-4 annual exceedance seismic hazard combined with a 25-year flood o Half of the 10-4 hazard, combined with a 500-year flood.
1.4.4 Sunny-Day Failure
The hydrologic and seismic failures discussed above require a natural hazard initiator, and can therefore be considered, at least in part, a natural hazard. On the other hand, sunny-day failures are clearly a purely man-made hazard.
The NRC’s traditional approach to assessing impacts from man-made hazards is provided in the Standard Review Plan for the Safety Review of Nuclear Power Plants (NUREG-0800), Sections 2.2.1-2.2.3. The NRC considers that design-basis events resulting from the presence of hazardous materials or activities in the vicinity of the plant is acceptable based on estimated annual frequency. If a postulated accident type meets the NRC staff objective (order of magnitude of 10-7 per year) then the potential exposures are considered to meet the requirements of 10 CFR 50.34(a)(1) as it relates to the requirements of 10 CFR Part 100. If data are not available to make an accurate estimate of the event probability, an expected rate of occurrence of potential exposures resulting in radiological dose in excess of 10 CFR 50.34(a)(1) as relates to the requirements of 10 CFR Part 100, by an order of magnitude of 10-6 per year is acceptable if, when combined with reasonable qualitative arguments, the realistic probability can be shown to be lower. This exception is made since data are often not available to enable the accurate calculation of probabilities because of the low probabilities associated with the events under consideration.
The approach outlined in the preceding paragraph has been applied to man-made hazards such as those associated with industrial and transportation activities. However, as discussed above in the introductory paragraph to Section 1.4, even when failure probability estimates are developed based upon site and dam specific data and information, there is not a widely accepted current engineering practice for estimating failure rates on the order of at the 1x 10⁻⁶ per year.
Staff Position:
• Because there is not a widely accepted current engineering practice for estimating failure rates on the order of at the 1x 10⁻⁶ per year, sunny-day failure should be assumed to occur and the consequences estimated.
1.5 Interfacing with Owners and Regulators of Dams and Levees
DRAFT – 2013-06-21
Page 10
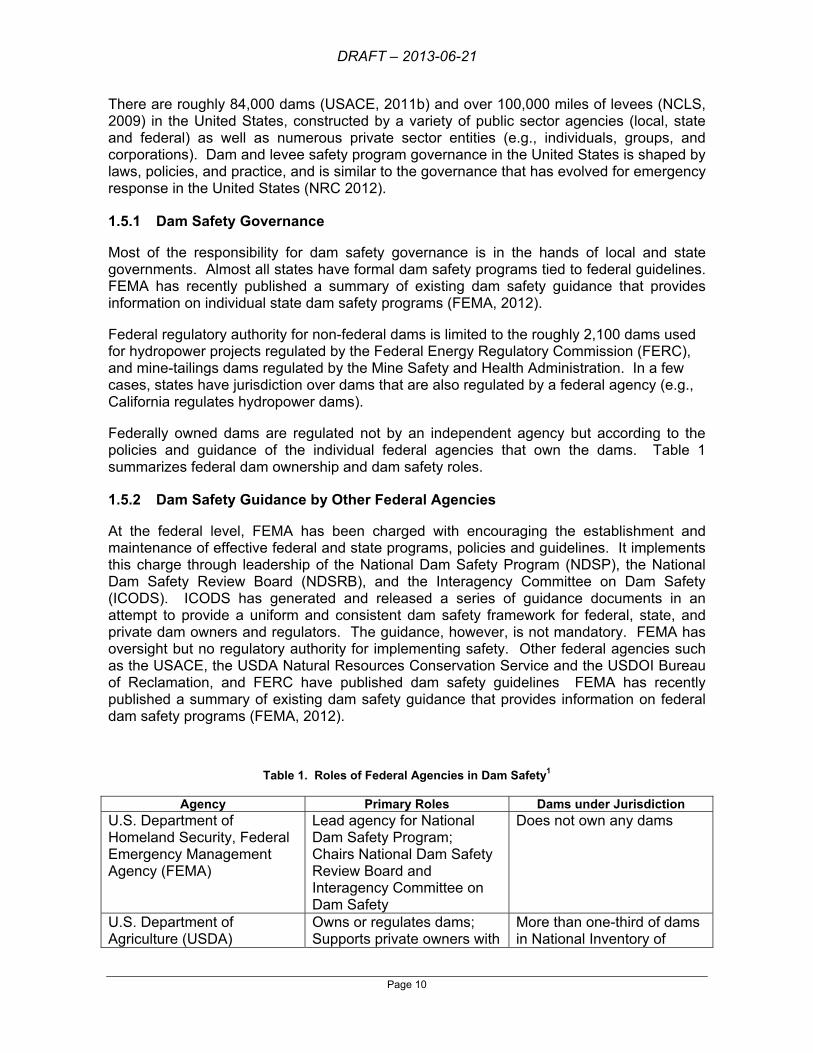
There are roughly 84,000 dams (USACE, 2011b) and over 100,000 miles of levees (NCLS, 2009) in the United States, constructed by a variety of public sector agencies (local, state and federal) as well as numerous private sector entities (e.g., individuals, groups, and corporations). Dam and levee safety program governance in the United States is shaped by laws, policies, and practice, and is similar to the governance that has evolved for emergency response in the United States (NRC 2012).
1.5.1 Dam Safety Governance
Most of the responsibility for dam safety governance is in the hands of local and state governments. Almost all states have formal dam safety programs tied to federal guidelines. FEMA has recently published a summary of existing dam safety guidance that provides information on individual state dam safety programs (FEMA, 2012).
Federal regulatory authority for non-federal dams is limited to the roughly 2,100 dams used for hydropower projects regulated by the Federal Energy Regulatory Commission (FERC), and mine-tailings dams regulated by the Mine Safety and Health Administration. In a few cases, states have jurisdiction over dams that are also regulated by a federal agency (e.g., California regulates hydropower dams).
Federally owned dams are regulated not by an independent agency but according to the policies and guidance of the individual federal agencies that own the dams. Table 1 summarizes federal dam ownership and dam safety roles.
1.5.2 Dam Safety Guidance by Other Federal Agencies
At the federal level, FEMA has been charged with encouraging the establishment and maintenance of effective federal and state programs, policies and guidelines. It implements this charge through leadership of the National Dam Safety Program (NDSP), the National Dam Safety Review Board (NDSRB), and the Interagency Committee on Dam Safety (ICODS). ICODS has generated and released a series of guidance documents in an attempt to provide a uniform and consistent dam safety framework for federal, state, and private dam owners and regulators. The guidance, however, is not mandatory. FEMA has oversight but no regulatory authority for implementing safety. Other federal agencies such as the USACE, the USDA Natural Resources Conservation Service and the USDOI Bureau of Reclamation, and FERC have published dam safety guidelines FEMA has recently published a summary of existing dam safety guidance that provides information on federal dam safety programs (FEMA, 2012).
Table 1. Roles of Federal Agencies in Dam Safety1
Agency Primary Roles Dams under JurisdictionU.S. Department of Homeland Security, Federal Emergency Management Agency (FEMA)
Lead agency for National Dam Safety Program; Chairs National Dam Safety Review Board and Interagency Committee on Dam Safety
Does not own any dams
U.S. Department of Agriculture (USDA)
Owns or regulates dams; Supports private owners with
More than one-third of dams in National Inventory of

DRAFT – 2013-06-21
Page 11
1.5.3 Obtaining Information on Dams and Levees
Obtaining detailed information to support the dam failure flood hazard evaluation may be challenging due to the disperse nature of dam ownership and regulation in the United States. In most cases, licensees do not operate or own the dams or levees that potentially may contribute to flooding hazards at the NPP site.
National and state dam inventories can be used to identify dams within the watershed of a stream/river and to obtain characteristics for each dam (location, height, and volume). The USACE maintains the National Inventory of Dams (NID), which provides information on thousands of dams (USACE, 2011b). Following Hurricane Katrina, Congress authorized the USACE to develop a National Levee Database (NLD). Initially, the NLD contained information only for USACE levees. However, integration of levee data collected by the FEMA National Flood Insurance Program (NFIP) into the NLD, which is under way, will increase the total number of miles of levee systems in the NLD. These databases and inventories are useful sources of basic geographic and physical information on dams and levees in the U.S.
planning, design, finance, and construction
Dams (NID) are associated with the USDA
U.S. Department of Defense (USDOD)
Plans, designs, finances, constructs, owns, operates, and permits dams; limited to military lands with exception of USACE civil-works programs
DOD has total of 267 dams under its jurisdiction on military lands
U.S. Army Corps of Engineers (USACE)
Plans, designs, constructs, operates, and regulates dams; permits and inspects dams
Jurisdiction over USACE dams, dams constructed by USACE but operated by others, and other flood-control dams subject to federal regulation; 631 dams in NID are associated with USACE
U.S. Department of the Interior, (USDOI)
Plans, designs, constructs, operates and maintains dams
About 2,000 dams in NID under five bureaus, mainly Bureau of Reclamation
U.S. Department of Labor (USDOL)
Regulates safety and health-related aspects of miners
About 1,400 dams under Mine Safety and Health Administration
Federal Energy Regulatory Commission (FERC)
Issues licenses, provides inspections, and regulates for nonfederal dams with hydroelectric capability
2,530 dams in NID affecting navigable waters
Tennessee Valley Authority
Plans, designs, constructs, operates, and maintains dams
Approximately 49 major dams in Tennessee River Valley
Source: NRC (2012) and FEMA (2009) 1. NRC regulates dams providing ultimate heat sink at NPPs as well as tailings dams at uranium mill tailings sites.
DRAFT – 2013-06-21
Page 12
Staff Positions:
• In the case of dams and levees owned or operated by U.S. federal agencies, the federal agency responsible (owner/operator) for the dam should be involved in any discussions, including possibly reviewing any analysis performed. Evaluation of dams is complex, requiring extensive expertise and site specific knowledge. It is critical for the owner/operator of the dam to assist NRC or its licensees when modifying the assumptions or methods used to develop the inundation maps for a specific area. If a federally owned dam is identified as critical to the flooding reanalysis, the licensee should contact NRC promptly. NRC will act as the interface between these agencies and licensees. Memoranda of Agreement or other mechanisms are being developed to facilitate sharing of data (including necessary safeguards to protect sensitive information) between NRC and the appropriate federal agencies. It is important to note that in many cases federal agencies that own or operate dams have conducted detailed failure analysis. To the extent that these analyses are applicable, they should be used in the Recommendation 2.1 flooding reanalysis.
• In some cases, the dam or levee will be owned or operated by a private entity, but regulated by a federal agency. In this case, NRC will interface with the federal regulatory agency to obtain available information. Interactions between the licensee and the owner should be coordinated with NRC and the federal regulator.
• In most cases dams and levees will be owned and operated by private entities and regulated by a state agency. In this case, the licensee should interact directly with the owner and regulator. The licensee should notify NRC if they encounter difficulties in obtaining information. On a case-by-case basis, NRC may be able to provide some assistance in interfacing with state agencies.
DRAFT – 2013-06-21
Page 13
1.6 Organization of guidance
ISG Section 1 provides an overview of the flood hazard reevaluation process, discusses dam safety governance and existing guidance and discusses procedures for obtaining information on dams and levees, particularly in regard to those that are federally owned or regulated. An overview of dams and levee types and causative mechanisms for dam failure is presented in ISG Section 2. Screening methods and simplified analysis approaches for drainage basins with many small dams are discussed in ISG Section 3. Dam failure due to hydrologic mechanisms is discussed in ISG Section 4. Dam failure due to seismic mechanisms is discussed in ISG Section 5. Dam failure due to causes other than hydrologic or seismic mechanisms (e.g. sunny day failures) discussed in ISG Section 6. Details of dam breach modeling are discussed in ISG Section 7. ISG Section 8 discusses levee breach modeling. Details of flood routing are discussed in ISG Section 9. A list of terms and definitions is provided in ISG Section 10. ISG Section 11 provides references used to develop this guidance.
DRAFT – 2013-06-21
Page 14
2. Background
This section provides a brief overview of the various types of dams in common use, and the principal classes of mechanisms that initiate damage and failure. As will be seen, failure mechanisms of concern vary with the type of dam, as well as materials used in construction.
2.1 Classification of Dams and Levees
Dams may be classified using several criteria (e.g., purpose, size, construction material, hazard potential, etc.). This ISG will mainly use a classification based on construction material since modes of failure, as well as susceptibility to a given initiating mechanism, are generally correlated with construction material. The major categories discussed in this ISG are concrete and embankment dams. Note that there a large number of composite dams comprised of concrete and embankment sections.
A levee or dike is a manmade barrier (embankment, floodwall, or structure) along a water course constructed for the primary purpose to provide hurricane, storm, and flood protection relating to seasonal high water, storm surges, precipitation, and other weather events; and that normally is subject to water loading for only a few days or weeks during a year. Almost all levees are earthen embankments, although some may have parapets or flood walls comprised of other materials built on their crest.
2.1.1 Concrete Dams
As the name implies, concrete dams are typically constructed of concrete or other masonry components. The major types of concrete dams include gravity, arch, multi-arch, and buttress dams (Figure 3 - Figure 6). Some dams are combinations of the major types. For example, gravity-arch dams combine the features of arch and gravity designs. Multi-arch dams typically employ buttresses to support the arches (Figure 6).
Concrete gravity dams typically consist of a solid concrete structure that maintains stability against design loads from the geometric shape, mass and strength of the concrete (Figure 3). Conventionally placed mass concrete and roller compacted concrete (RCC) are the two general concrete construction methods for concrete gravity dams (USACE, 1995a,b). Gravity dams depend primarily on self-weight for stability. Generally, gravity dams are sized and shaped to resist overturning, sliding, and crushing at the toe. Provided that the moment around the turning point caused by the water pressure is smaller than the moment caused by the weight of the dam, the dam will not overturn. This is the case if the resultant force of water pressure and weight falls within the base of the dam. Typically gravity dams are constructed on a straight axis, though they may be slightly angled or curved, in an arch shape. In earlier periods of dam design, gravity dams were built of masonry materials such as stone, brick, or concrete blocks jointed with mortar. Additionally, gravity dams may have a hollow interior with concrete or masonry used on the outside. Engineering manuals published by the U.S. Army Corps of Engineers (USACE, 1995a), the Bureau of Reclamation (USBR, 1976, 1977b), and the Federal Energy Regulatory Commission (FERC, 2002) provide more detailed discussion of concrete gravity dam engineering and design.

DRAFT – 2013-06-21
Page 15
Figure 3. Concrete Gravity Dam (British Dam Society, 2013)
The arch dam is a structure that is designed to curve upstream so that the force of the water against it presses against the arch, compressing and strengthening the structure as it pushes into its foundation or abutments (Figure 4). Since they are thinner than any other dam type, they require much less construction material, making them economical and practical in remote areas. There are two basic designs for an arch dam: constant-radius dams, which have constant radius of curvature, and variable-radius dams, which have both upstream and downstream curves that systematically decrease in radius below the crest. Arch dams may be double-curved in both horizontal and vertical planes. Arch dams with more than one contiguous arch or plane are described as multiple-arch dams. The foundation or abutments for an arch dam must be very stable with strength proportionate to that of the concrete. Engineering manuals published by several federal agencies provide more detailed discussion of concrete arch dam engineering and design (USACE, 1994; USBR, 1977a,b, FERC, 1999).
Figure 4. Typical Concrete Arch Dam Cross Section and Plan Form (Youssef, 2013)
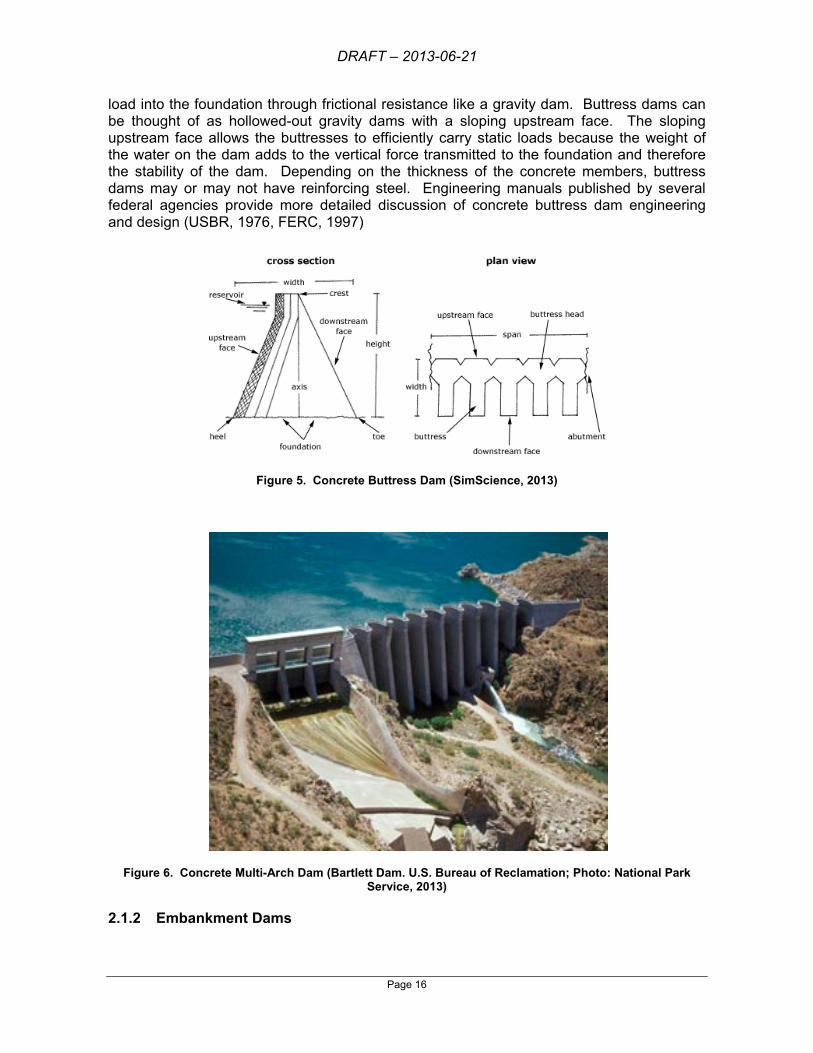
Buttress dams are concrete structures consisting of two basic features: an upstream water barrier and buttresses (Figure 5). Buttress dams are typically designed as reinforced concrete structures. The upstream water barrier can be a flat slab or massive heads. The upstream water barrier transfers the reservoir load into the buttresses that then transfer the
DRAFT – 2013-06-21
Page 16
load into the foundation through frictional resistance like a gravity dam. Buttress dams can be thought of as hollowed-out gravity dams with a sloping upstream face. The sloping upstream face allows the buttresses to efficiently carry static loads because the weight of the water on the dam adds to the vertical force transmitted to the foundation and therefore the stability of the dam. Depending on the thickness of the concrete members, buttress dams may or may not have reinforcing steel. Engineering manuals published by several federal agencies provide more detailed discussion of concrete buttress dam engineering and design (USBR, 1976, FERC, 1997)
Figure 5. Concrete Buttress Dam (SimScience, 2013)
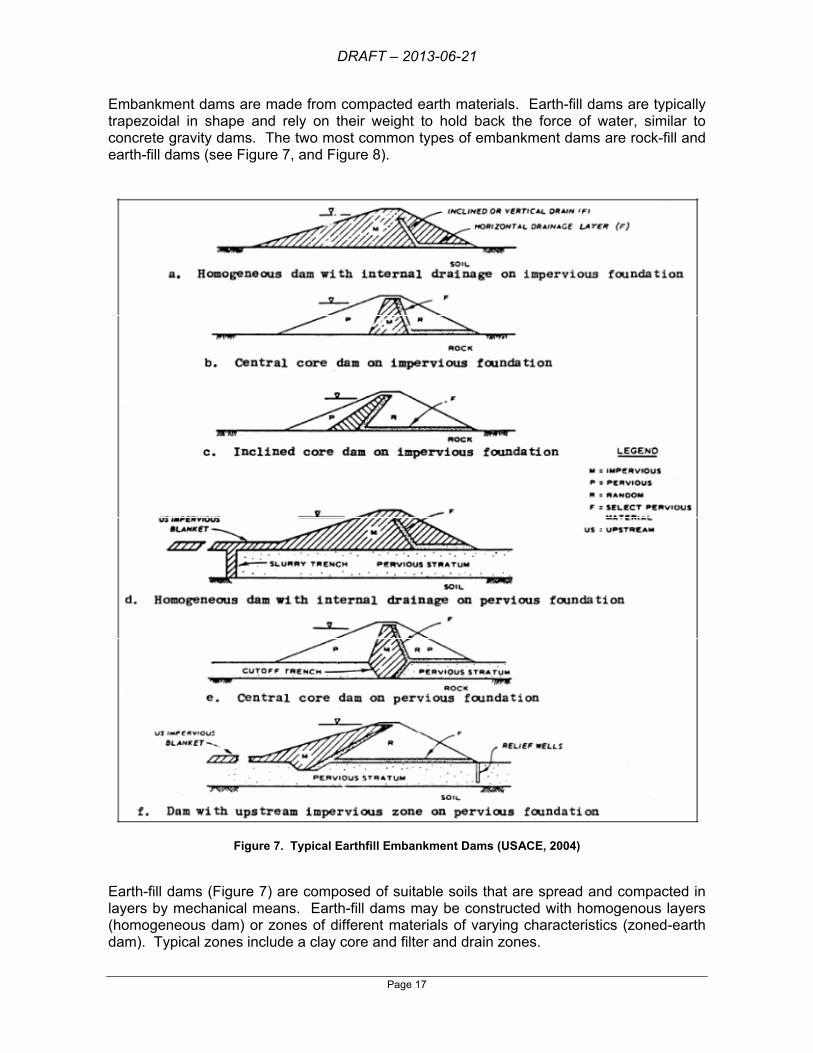
Figure 6. Concrete Multi-Arch Dam (Bartlett Dam. U.S. Bureau of Reclamation; Photo: National Park Service, 2013)
2.1.2 Embankment Dams
DRAFT – 2013-06-21
Page 17
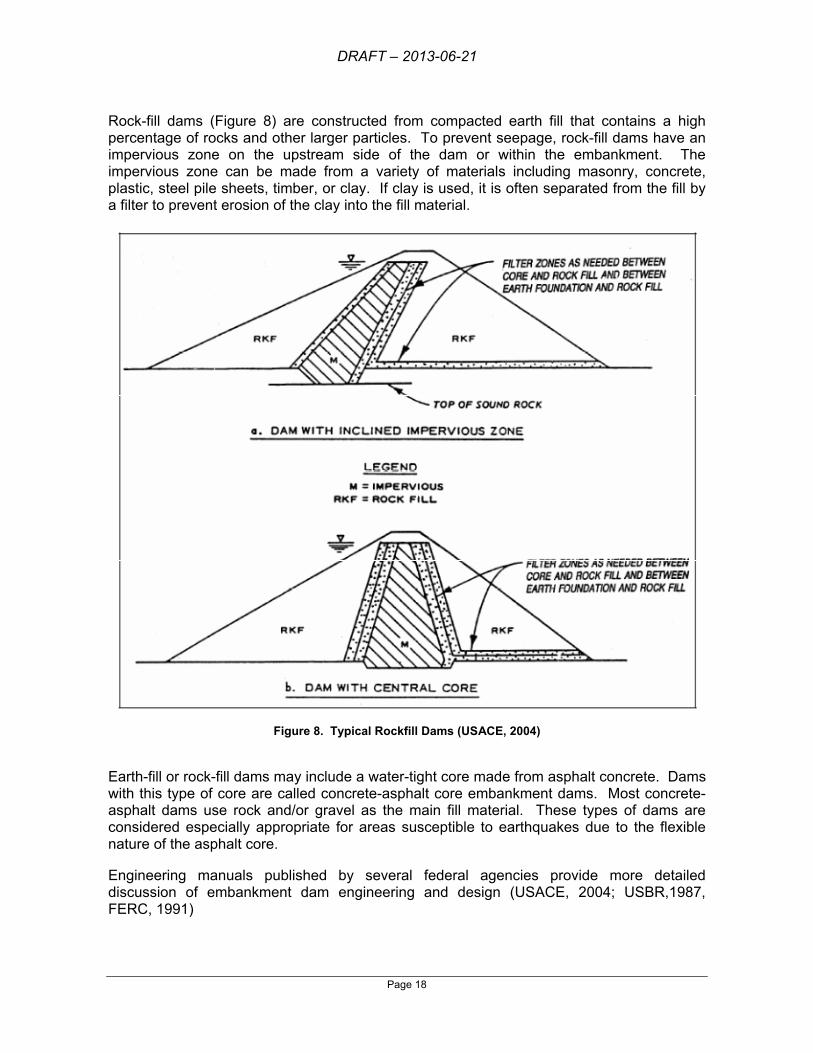
Embankment dams are made from compacted earth materials. Earth-fill dams are typically trapezoidal in shape and rely on their weight to hold back the force of water, similar to concrete gravity dams. The two most common types of embankment dams are rock-fill and earth-fill dams (see Figure 7, and Figure 8).
Figure 7. Typical Earthfill Embankment Dams (USACE, 2004)
Earth-fill dams (Figure 7) are composed of suitable soils that are spread and compacted in layers by mechanical means. Earth-fill dams may be constructed with homogenous layers (homogeneous dam) or zones of different materials of varying characteristics (zoned-earth dam). Typical zones include a clay core and filter and drain zones.
DRAFT – 2013-06-21
Page 18
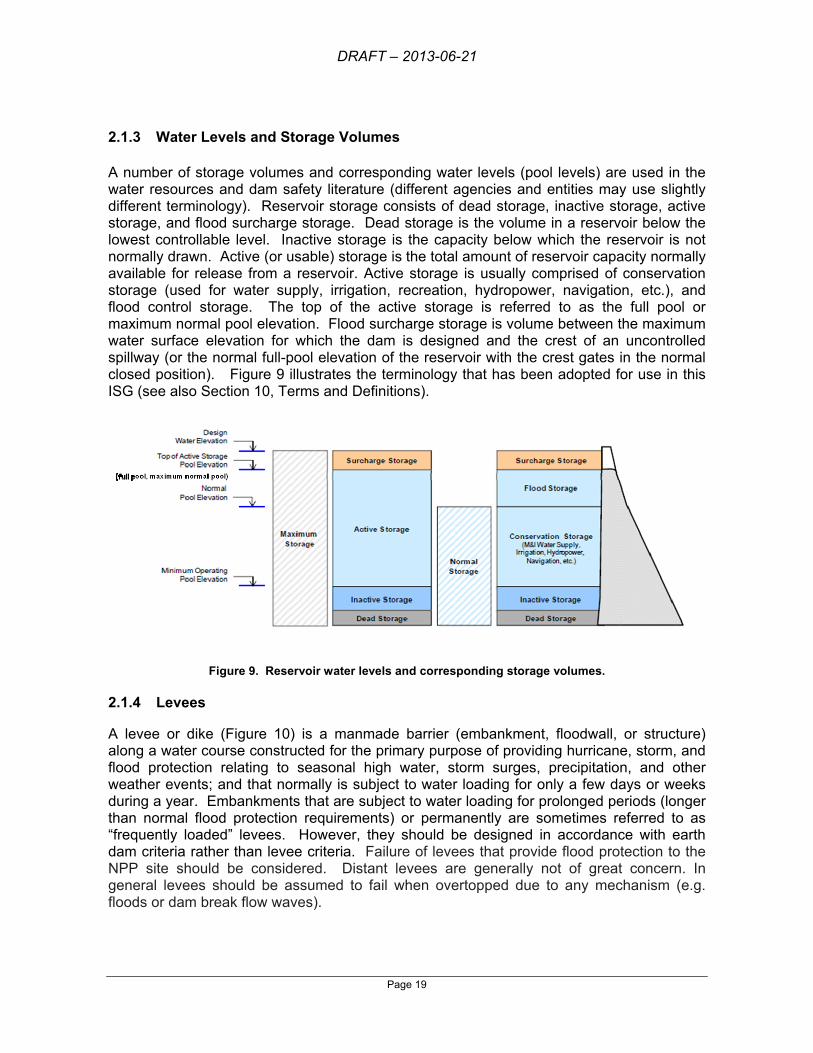
Rock-fill dams (Figure 8) are constructed from compacted earth fill that contains a high percentage of rocks and other larger particles. To prevent seepage, rock-fill dams have an impervious zone on the upstream side of the dam or within the embankment. The impervious zone can be made from a variety of materials including masonry, concrete, plastic, steel pile sheets, timber, or clay. If clay is used, it is often separated from the fill by a filter to prevent erosion of the clay into the fill material.
Figure 8. Typical Rockfill Dams (USACE, 2004)
Earth-fill or rock-fill dams may include a water-tight core made from asphalt concrete. Dams with this type of core are called concrete-asphalt core embankment dams. Most concrete-asphalt dams use rock and/or gravel as the main fill material. These types of dams are considered especially appropriate for areas susceptible to earthquakes due to the flexible nature of the asphalt core.
Engineering manuals published by several federal agencies provide more detailed discussion of embankment dam engineering and design (USACE, 2004; USBR,1987, FERC, 1991)
DRAFT – 2013-06-21
Page 19
2.1.3 Water Levels and Storage Volumes
A number of storage volumes and corresponding water levels (pool levels) are used in the water resources and dam safety literature (different agencies and entities may use slightly different terminology). Reservoir storage consists of dead storage, inactive storage, active storage, and flood surcharge storage. Dead storage is the volume in a reservoir below the lowest controllable level. Inactive storage is the capacity below which the reservoir is not normally drawn. Active (or usable) storage is the total amount of reservoir capacity normally available for release from a reservoir. Active storage is usually comprised of conservation storage (used for water supply, irrigation, recreation, hydropower, navigation, etc.), and flood control storage. The top of the active storage is referred to as the full pool or maximum normal pool elevation. Flood surcharge storage is volume between the maximum water surface elevation for which the dam is designed and the crest of an uncontrolled spillway (or the normal full-pool elevation of the reservoir with the crest gates in the normal closed position). Figure 9 illustrates the terminology that has been adopted for use in this ISG (see also Section 10, Terms and Definitions).
Figure 9. Reservoir water levels and corresponding storage volumes.
2.1.4 Levees
A levee or dike (Figure 10) is a manmade barrier (embankment, floodwall, or structure) along a water course constructed for the primary purpose of providing hurricane, storm, and flood protection relating to seasonal high water, storm surges, precipitation, and other weather events; and that normally is subject to water loading for only a few days or weeks during a year. Embankments that are subject to water loading for prolonged periods (longer than normal flood protection requirements) or permanently are sometimes referred to as “frequently loaded” levees. However, they should be designed in accordance with earth dam criteria rather than levee criteria. Failure of levees that provide flood protection to the NPP site should be considered. Distant levees are generally not of great concern. In general levees should be assumed to fail when overtopped due to any mechanism (e.g. floods or dam break flow waves).

DRAFT – 2013-06-21
Page 20
Levees may also be embankments, floodwalls, and structures that provide flood protection to lands below sea level and other lowlands and that may be subject to water loading for much, if not all, portions of the year, but do not constitute barriers across water courses or constrain water along canals.
As with dams, levees incorporate features and appurtenances that are critical to proper functioning. Examples include floodwall sections, closure structures, pumping stations, interior drainage works, and flood damage reduction channels.
Most levees and dikes are constructed using clay, silt, or sand with a clay core or cover, often on a foundation of erodible substrata. The levee definition used here does not include shore line protection or river bank protection systems such as revetments, barrier islands, etc. Such shoreline or riverbank protection systems are hardened structures that inhibit erosion but not necessarily hold back water. Natural coastal barriers often consist mostly of sandy material.
Even though levees are similar to small earth dams they differ from earth dams in the following important respects: 1) a levee embankment may become saturated for only a short period of time beyond the limit of capillary saturation; 2) levee alignment is dictated primarily by flood protection requirements, which often leads to construction on poor foundations; and 3) borrow soil is generally obtained from shallow pits or from channels excavated adjacent to the levee, which produce fill material that is often heterogeneous and far from ideal.
A levee system comprises one or more levee segments that collectively provide flood damage reduction to a defined area. A levee segment is a discrete portion of a levee system that is owned, operated and maintained by a single entity, or discrete set of entities. A levee segment may have one or more levee features. Highway and railroad embankments can be considered to be levees only if they are designed to perform as part of a flood control system.
More detail on the design, maintenance, and inspection of levees and floodwalls can be found in several engineering manuals and technical letters published by the U. S. Army Corps of Engineers (USACE,1989, 2000, 2011b).
DRAFT – 2013-06-21
Page 21
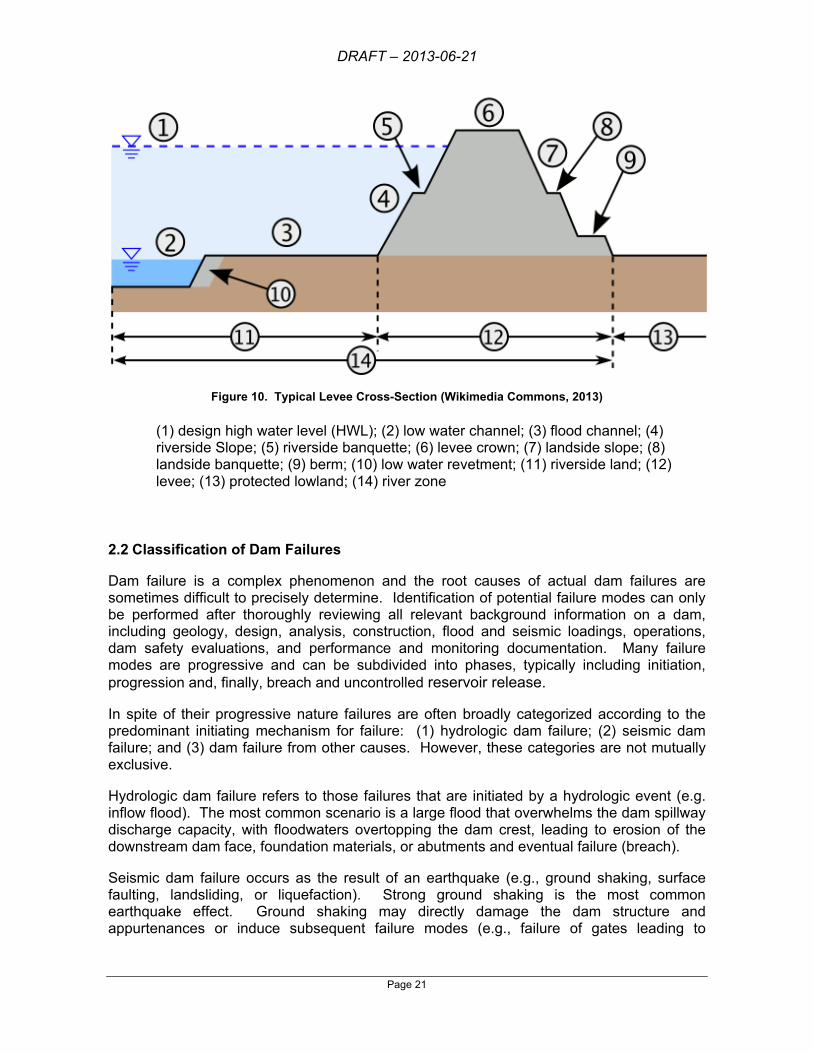
Figure 10. Typical Levee Cross-Section (Wikimedia Commons, 2013)
(1) design high water level (HWL); (2) low water channel; (3) flood channel; (4) riverside Slope; (5) riverside banquette; (6) levee crown; (7) landside slope; (8) landside banquette; (9) berm; (10) low water revetment; (11) riverside land; (12) levee; (13) protected lowland; (14) river zone
2.2 Classification of Dam Failures
Dam failure is a complex phenomenon and the root causes of actual dam failures are sometimes difficult to precisely determine. Identification of potential failure modes can only be performed after thoroughly reviewing all relevant background information on a dam, including geology, design, analysis, construction, flood and seismic loadings, operations, dam safety evaluations, and performance and monitoring documentation. Many failure modes are progressive and can be subdivided into phases, typically including initiation, progression and, finally, breach and uncontrolled reservoir release.
In spite of their progressive nature failures are often broadly categorized according to the predominant initiating mechanism for failure: (1) hydrologic dam failure; (2) seismic dam failure; and (3) dam failure from other causes. However, these categories are not mutually exclusive.
Hydrologic dam failure refers to those failures that are initiated by a hydrologic event (e.g. inflow flood). The most common scenario is a large flood that overwhelms the dam spillway discharge capacity, with floodwaters overtopping the dam crest, leading to erosion of the downstream dam face, foundation materials, or abutments and eventual failure (breach).
Seismic dam failure occurs as the result of an earthquake (e.g., ground shaking, surface faulting, landsliding, or liquefaction). Strong ground shaking is the most common earthquake effect. Ground shaking may directly damage the dam structure and appurtenances or induce subsequent failure modes (e.g., failure of gates leading to
DRAFT – 2013-06-21
Page 22
overtopping, reservoir landslide or seiche leading to overtopping, cracking or deformation of the embankment that leads to overtopping or an internal erosion failure).
Dam failures not caused by a concurrent extreme flood or seismic event may arise from a wide variety of causes. Examples include, but are not limited to:
• Latent design or construction errors • Age-related weakness or deterioration of embankment material, foundations,
abutments or spillways. • Malfunction or misoperation of appurtenances such as flood gates, valves, conduits,
and other components may also lead to dam failure.
Dam failures due to hydrologic events are discussed in Section 4. Seismic dam failure is discussed in Section 5. Dam failures due to nonhydrologic, nonseismic events are discussed in Section 6.
2.2.1 Influence of Dam Type on Failure Modes
As mentioned in section 2.1, predominant causes for failure, failure modes, and failure progression for dams are dependent upon dam type. In the event of failure, the breach shape and timing will also depend upon the dam type.
2.2.1.1 Concrete Dams
In general, concrete dams are much stronger in compression than in tension. With the exception of buttress dams, concrete dams are typically made of plain concrete that possesses limited tensile strength. Therefore dam structural response to tensile loads is characterized by a stress-strain relationship composed of elastic and inelastic strain ranges followed by a complete loss of strength. The inelastic-strain range provides only limited inelastic behavior. The dam response beyond this range is governed by complete loss of strength, sliding, and nonlinear response behavior of discrete blocks bounded by opened joints and cracked sections.
Due to their strength, concrete dam sections can usually withstand some degree of overtopping. Some concrete dams (or dam sections) actually are designed to be overtopped. However, overtopping may lead to unacceptable erosion of the dam foundation and abutments.
Observation and analysis indicate that degree and speed of failure for concrete dams depends on dam type. Due to their strength and mass, concrete gravity dams are typically subject to partial rather than complete failure, and failure is typically not instantaneous. By contrast, concrete arch dams typically fail completely, and very rapidly. For buttress and multi-arch dams, failure of one or more sections is much more common than complete failure. Failure of the sections is typically treated as essentially instantaneous.
2.2.1.2 Embankment Dams
Failure modes for embankment dams are heavily influenced by the design (e.g., homogenous vs. zoned), the materials (e.g., cohesive vs. noncohesive soils), and construction methods (e.g., degree of compaction) used.
DRAFT – 2013-06-21
Page 23
Failure of embankment dams under hydrologic loading associated with flooding mainly fall into three categories: 1) increased internal seepage rates; 2) overtopping which initiates embankment erosion; and 3) structural overstressing. The design, materials and construction methods used will heavily influence failure initiation and progression in each of these categories. For example, cohesionless soils are less able to withstand erosion due to overtopping, internal seepage pressures or structural overstressing than cohesive soils. The degree to which a given soil is compacted is an important factor determining its load bearing capacity and resistance to erosion. Zoned dams with internal drainage layers and filters are better able to accommodate significant internal seepage rates.
The ability of an embankment dam to withstand earthquake shaking without loss of strength or liquefaction of foundation or embankment soils (leading to deformation, sliding, cracking or other failures) is very dependent on the materials and degree of compaction used. Design features such as conduits passing through the dam can be an important consideration in its behavior under seismic loading.
2.2.2 Failure of Spillways, Gates, Outlet Works and Other Appurtenances
There are a number of facilities, not unique to any one dam type, for which loss of function could directly cause uncontrolled release of the reservoir or lead to uncontrolled release of the reservoir via overtopping, erosion, or some combination of these. Chief among these are spillways, gates and other outlet works. Spillway discharge capacity is usually the critical component in passing large floods. More details on spillway failure are provided in Section 4, which discusses hydrologic failure mechanisms
A variety of gates are used to control spillways. Gates range in complexity from simple slide gates (e.g., fixed-wheel gates or roller gates), to float-type gates (e.g. drum gates and ring gates), to gates which use hydrodynamic forces of flowing water to assist in actuation (e.g., radial or tainter gates). Uncontrolled releases could result from gates failing open, while overtopping and eventual loss of the entire dam could result from gates failing closed. Gate failures may be associated with hydrologic, seismic or sunny-day failure mechanisms. Gate failures associated with hydrologic, seismic and sunny day failure mechanisms are discussed in sections 4, 5, and 6, respectively.
Outlet works are typically less important since they involve smaller flows. They will not be discussed further in this guide, but the potential impact of this type of failure should be considered.
2.2.3 Operational Failures and Controlled Releases
Certain operational failures and even certain controlled releases can lead to flooding at the NPP site. They may occur in a variety of situations and cannot be not neatly categorized as a hydrologic, seismic or sunny day mechanism. They may be a compounding factor in any of these mechanisms. Operational failures occur when equipment, instrumentation, control systems (including both hardware and software), or processes fail to perform as intended. This, in turn, can lead to uncontrolled reservoir release. Instances where controlled releases can lead to inundation at the NPP site include, but are not limited to: 1) releases performed in order to prevent dam failure during flood conditions; 2) releases performed to rapidly drawdown a reservoir to prevent incipient failure after a seismic event; and 3) releases performed to rapidly drawdown reservoir to prevent incipient sunny day failure. Operational failures and controlled releases are discussed further in Section 4.2.7.

DRAFT – 2013-06-21
Page 24
2.3 Multiple Dam Failures
At some NPP sites, there may be potential for flooding due to essentially simultaneous failure of multiple dams or the domino failure of a series of dams. For example, the site may be located in a region where dams are located close enough to one another that a single storm or seismic event can cause multiple failures. Failure of a critically located dam storing a large volume of water may produce a flood wave that triggers domino-type failures of downstream dams. Additional detail on multiple dam failure due to hydrometeorological phenomena is provided in Section 4.2.5. Additional detail on multiple dam failure due to a seismic event is provided in Section 5.

DRAFT – 2013-06-21
Page 25
3. Screening and Simplified Modeling Approaches for Watersheds with Many Dams
Section 1.3.1 and Figure 1 provided an overview of “screening” approaches intended to reduce the analysis burden for watersheds with many dams. This section provides detailed discussion. Criteria used to identify those dams that may be removed and not given further consideration in the analysis (i.e. “inconsequential” dams) are discussed. This section also discusses conservative screening approaches based on simplified empirical and mechanistic methods. These screening approaches are intended to reduce the amount of effort required to show that failure of certain upstream dams does not result in water levels above the flood protection level of SSCs important to safety, or plant grade, if appropriate (i.e., screen out “noncritical” dams). The guidance in this section may be applied to both single dams and groups of dams. All other dams should be considered “potentially critical” dams and subjected to further evaluation.
These screening methods are intended to be used with publicly available information. Online information on thousands of dams is available from the USACE National Inventory of Dams (NID; http://nid.usace.army.mil). Other federal agencies, as well as State and local government agencies may also maintain information on dams that they own or regulate. Data used to delineate and describe watersheds (e.g. topographic maps, digital elevation datasets, watershed boundaries) are available from the U.S. Geological Survey (http://ned.usgs.gov; http://nhd.usgs.gov/wbd.html).
A justification for using simplified methods should be developed on a site-specific basis and included in the flood hazard reevaluation report. Note that other methods can be used and will be reviewed on a case-by-case basis.
DRAFT – 2013-06-21
Page 26
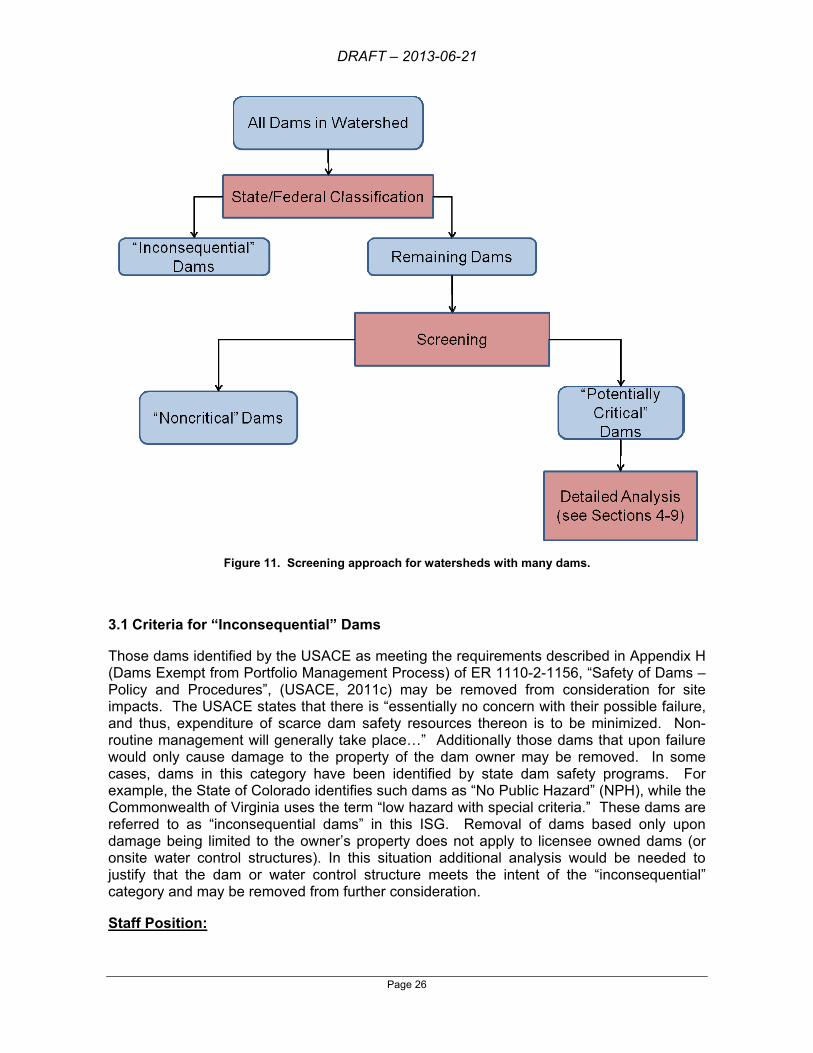
Figure 11. Screening approach for watersheds with many dams.
3.1 Criteria for “Inconsequential” Dams
Those dams identified by the USACE as meeting the requirements described in Appendix H (Dams Exempt from Portfolio Management Process) of ER 1110-2-1156, “Safety of Dams – Policy and Procedures”, (USACE, 2011c) may be removed from consideration for site impacts. The USACE states that there is “essentially no concern with their possible failure, and thus, expenditure of scarce dam safety resources thereon is to be minimized. Non-routine management will generally take place…” Additionally those dams that upon failure would only cause damage to the property of the dam owner may be removed. In some cases, dams in this category have been identified by state dam safety programs. For example, the State of Colorado identifies such dams as “No Public Hazard” (NPH), while the Commonwealth of Virginia uses the term “low hazard with special criteria.” These dams are referred to as “inconsequential dams” in this ISG. Removal of dams based only upon damage being limited to the owner’s property does not apply to licensee owned dams (or onsite water control structures). In this situation additional analysis would be needed to justify that the dam or water control structure meets the intent of the “inconsequential” category and may be removed from further consideration.
Staff Position:

DRAFT – 2013-06-21
Page 27
• Dams identified by federal or state agencies as having minimal or no adverse failure consequences beyond the owner’s property may be removed from consideration. Dams owned by licensees may not be removed. Other inconsequential dams may be removed with appropriate justification (e.g. can be easily shown to have minimal or no adverse downstream failure consequences).
• Consideration should be given to the failure consequences for clusters of dams that individually meet the above criteria if engineering judgment indicates their collective failure would exceed the removal criteria.
3.2 Simplified Modeling Approaches
Several optional methods discussed below provide a quantitative basis for simplified modeling of upstream dams. The methods are presented in a Hierarchical-Hazard-Assessment-type gradation of conservatism (HHA, see NUREG/CR-7046) and are applicable to all initiating events (hydrologic, seismic, and sunny-day).
SSCs important to safety located below site grade must also be confirmed to have flood protection to the elevation of the site in order to apply the screening methods. If SSCs important to safety do not have this level of flood protection, then replace ‘site grade’ in the screening discussion with the lowest flood protection elevation of SSCs important to safety.
The following methods may be applied sequentially in a HHA-type gradation of conservatism. Alternatively, a single method or a subset of the methods may be applied, as appropriate. The methods are described below and illustrated in Figure 12 through Figure 15.
1. Volume Method: This calculation is representative of having the total upstream storage volume simultaneously transferred to the site without attenuation. The following steps illustrate the method (see also Figure 12):
a. Estimate and sum the storage volume for all upstream dams (“inconsequential” dams may be excluded) in the watershed, assuming pool levels are at levels corresponding to the maximum storage volume (i.e. corresponding to top of dam).
b. The 500-year flood is used to capture antecedent flood conditions at the NPP site. Current information on 500-year water surface elevations may be be used, if available. Existing stage-discharge functions or USGS streamflow rating curves may also be used to estimate the flood stage at the site corresponding to the 500 year return period. If neither estimates of 500-year water surfaces elevations nor stage-discharge functions exist, then they may be developed using appropriate methods (e.g., using hydrologic and hydraulic models).
c. Using available topographic data (e.g., LiDAR datasets or USGS digital elevation models, develop the stage-storage function at the site. The lowest stage should correspond to the 500-year flood elevation estimated in step (b). The stage-storage function should exclude remote floodplain storage areas that could not be accessed by overbank floodwaters. Compute the flood elevation at the site by applying the total storage volume for all upstream dams (step a) to the stage-storage function.
d. If the resulting water surface elevation is above the flood protection level of SSCs important to safety (or plant grade, if appropriate), iteratively repeat the process,
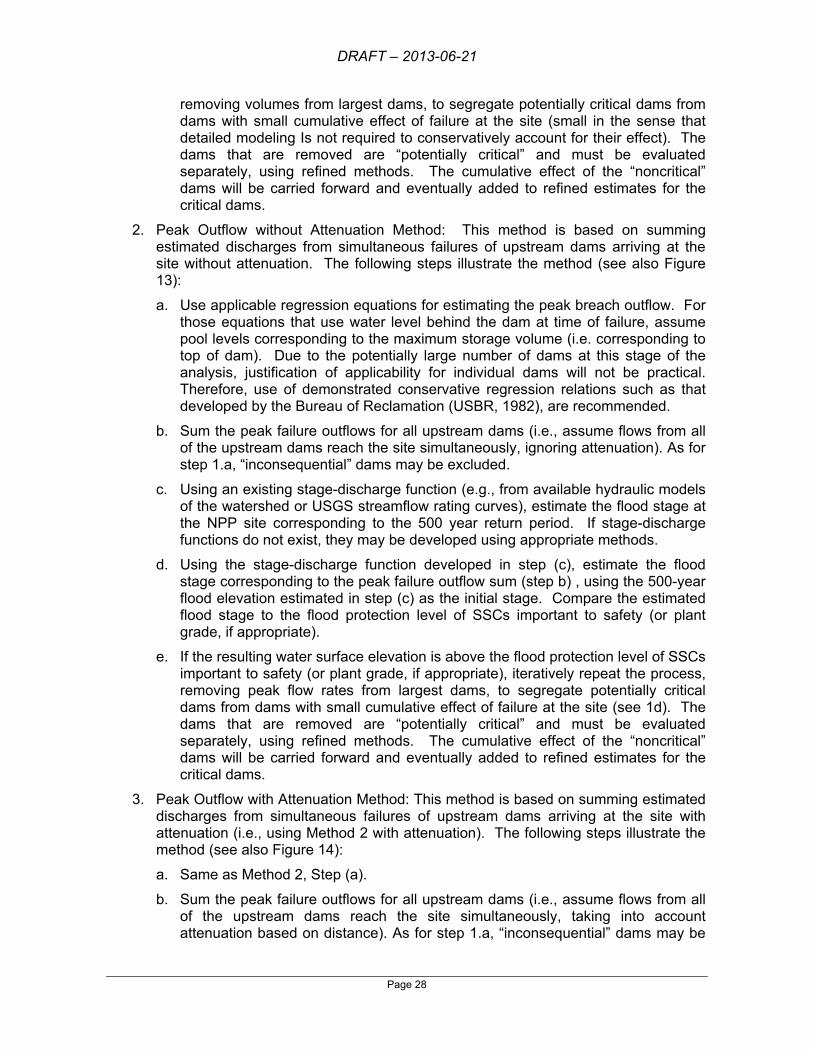
DRAFT – 2013-06-21
Page 28
removing volumes from largest dams, to segregate potentially critical dams from dams with small cumulative effect of failure at the site (small in the sense that detailed modeling Is not required to conservatively account for their effect). The dams that are removed are “potentially critical” and must be evaluated separately, using refined methods. The cumulative effect of the “noncritical” dams will be carried forward and eventually added to refined estimates for the critical dams.
2. Peak Outflow without Attenuation Method: This method is based on summing estimated discharges from simultaneous failures of upstream dams arriving at the site without attenuation. The following steps illustrate the method (see also Figure 13):
a. Use applicable regression equations for estimating the peak breach outflow. For those equations that use water level behind the dam at time of failure, assume pool levels corresponding to the maximum storage volume (i.e. corresponding to top of dam). Due to the potentially large number of dams at this stage of the analysis, justification of applicability for individual dams will not be practical. Therefore, use of demonstrated conservative regression relations such as that developed by the Bureau of Reclamation (USBR, 1982), are recommended.
b. Sum the peak failure outflows for all upstream dams (i.e., assume flows from all of the upstream dams reach the site simultaneously, ignoring attenuation). As for step 1.a, “inconsequential” dams may be excluded.
c. Using an existing stage-discharge function (e.g., from available hydraulic models of the watershed or USGS streamflow rating curves), estimate the flood stage at the NPP site corresponding to the 500 year return period. If stage-discharge functions do not exist, they may be developed using appropriate methods.
d. Using the stage-discharge function developed in step (c), estimate the flood stage corresponding to the peak failure outflow sum (step b) , using the 500-year flood elevation estimated in step (c) as the initial stage. Compare the estimated flood stage to the flood protection level of SSCs important to safety (or plant grade, if appropriate).
e. If the resulting water surface elevation is above the flood protection level of SSCs important to safety (or plant grade, if appropriate), iteratively repeat the process, removing peak flow rates from largest dams, to segregate potentially critical dams from dams with small cumulative effect of failure at the site (see 1d). The dams that are removed are “potentially critical” and must be evaluated separately, using refined methods. The cumulative effect of the “noncritical” dams will be carried forward and eventually added to refined estimates for the critical dams.
3. Peak Outflow with Attenuation Method: This method is based on summing estimated discharges from simultaneous failures of upstream dams arriving at the site with attenuation (i.e., using Method 2 with attenuation). The following steps illustrate the method (see also Figure 14):
a. Same as Method 2, Step (a).
b. Sum the peak failure outflows for all upstream dams (i.e., assume flows from all of the upstream dams reach the site simultaneously, taking into account attenuation based on distance). As for step 1.a, “inconsequential” dams may be
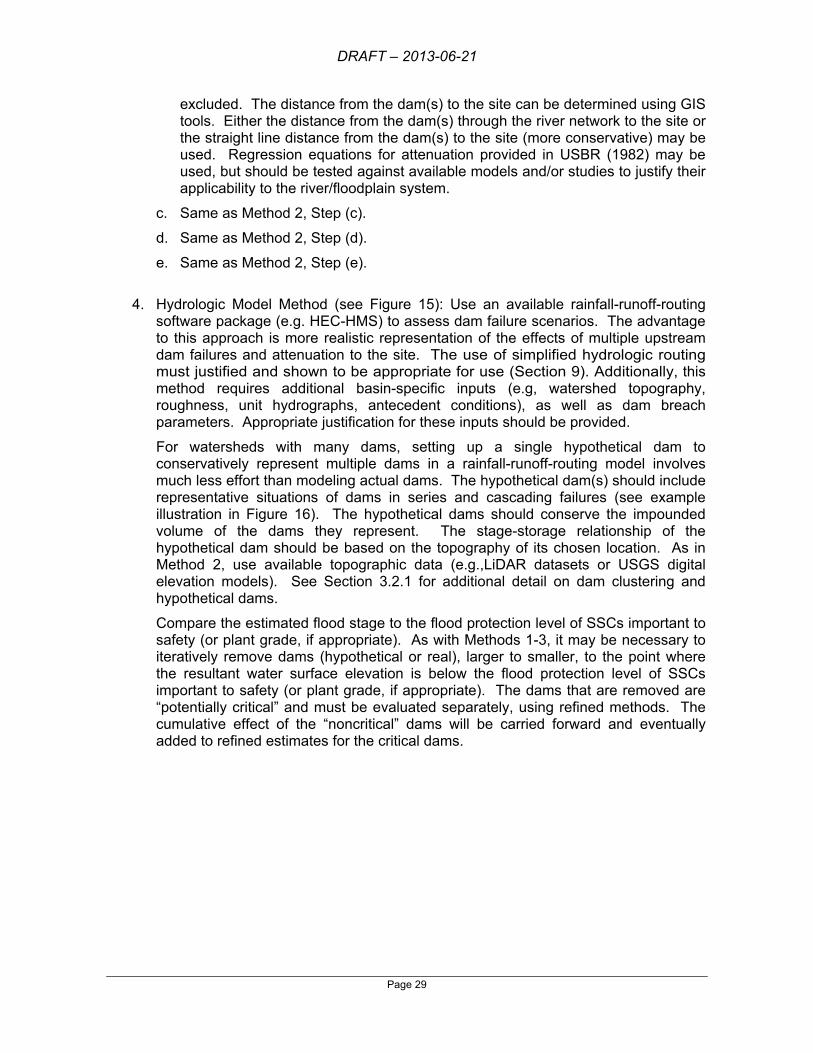
DRAFT – 2013-06-21
Page 29
excluded. The distance from the dam(s) to the site can be determined using GIS tools. Either the distance from the dam(s) through the river network to the site or the straight line distance from the dam(s) to the site (more conservative) may be used. Regression equations for attenuation provided in USBR (1982) may be used, but should be tested against available models and/or studies to justify their applicability to the river/floodplain system.
c. Same as Method 2, Step (c).
d. Same as Method 2, Step (d).
e. Same as Method 2, Step (e).
4. Hydrologic Model Method (see Figure 15): Use an available rainfall-runoff-routing
software package (e.g. HEC-HMS) to assess dam failure scenarios. The advantage to this approach is more realistic representation of the effects of multiple upstream dam failures and attenuation to the site. The use of simplified hydrologic routing must justified and shown to be appropriate for use (Section 9). Additionally, this method requires additional basin-specific inputs (e.g, watershed topography, roughness, unit hydrographs, antecedent conditions), as well as dam breach parameters. Appropriate justification for these inputs should be provided.
For watersheds with many dams, setting up a single hypothetical dam to conservatively represent multiple dams in a rainfall-runoff-routing model involves much less effort than modeling actual dams. The hypothetical dam(s) should include representative situations of dams in series and cascading failures (see example illustration in Figure 16). The hypothetical dams should conserve the impounded volume of the dams they represent. The stage-storage relationship of the hypothetical dam should be based on the topography of its chosen location. As in Method 2, use available topographic data (e.g.,LiDAR datasets or USGS digital elevation models). See Section 3.2.1 for additional detail on dam clustering and hypothetical dams.
Compare the estimated flood stage to the flood protection level of SSCs important to safety (or plant grade, if appropriate). As with Methods 1-3, it may be necessary to iteratively remove dams (hypothetical or real), larger to smaller, to the point where the resultant water surface elevation is below the flood protection level of SSCs important to safety (or plant grade, if appropriate). The dams that are removed are “potentially critical” and must be evaluated separately, using refined methods. The cumulative effect of the “noncritical” dams will be carried forward and eventually added to refined estimates for the critical dams.
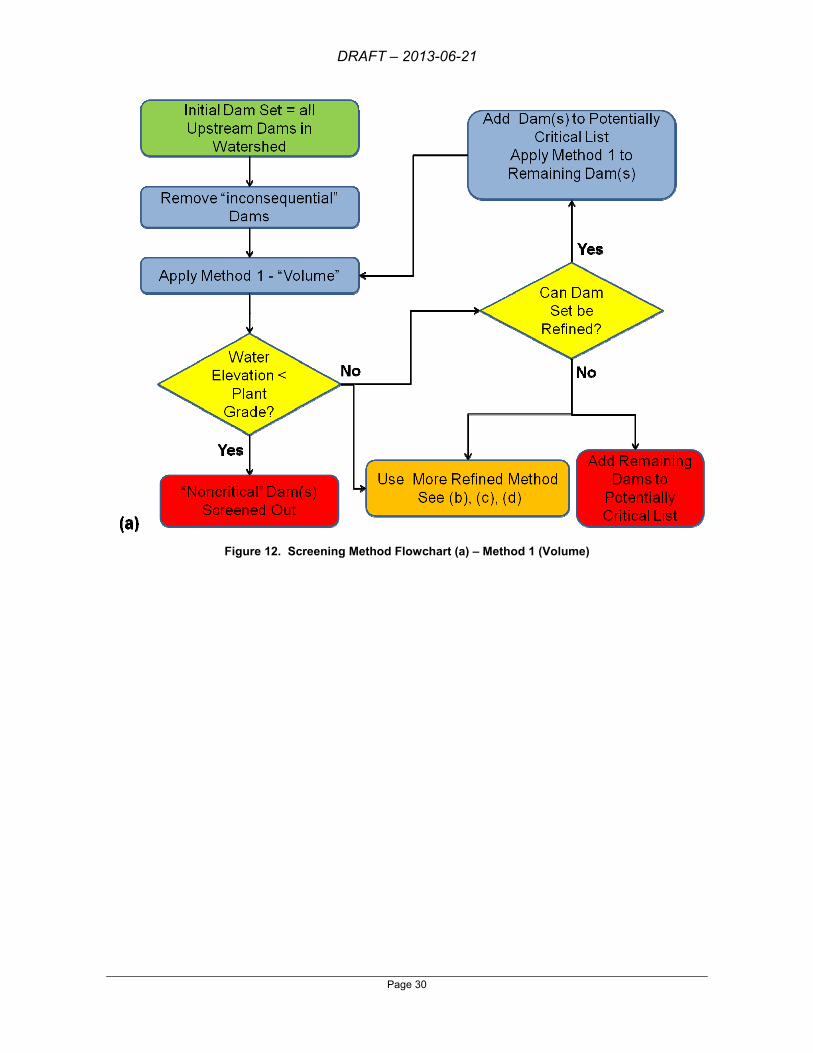
DRAFT – 2013-06-21
Page 30
Figure 12. Screening Method Flowchart (a) – Method 1 (Volume)

DRAFT – 2013-06-21
Page 31
Figure 13. Screening Method Flowchart (b) – Method 2 (Peak Flow without Attenuation)
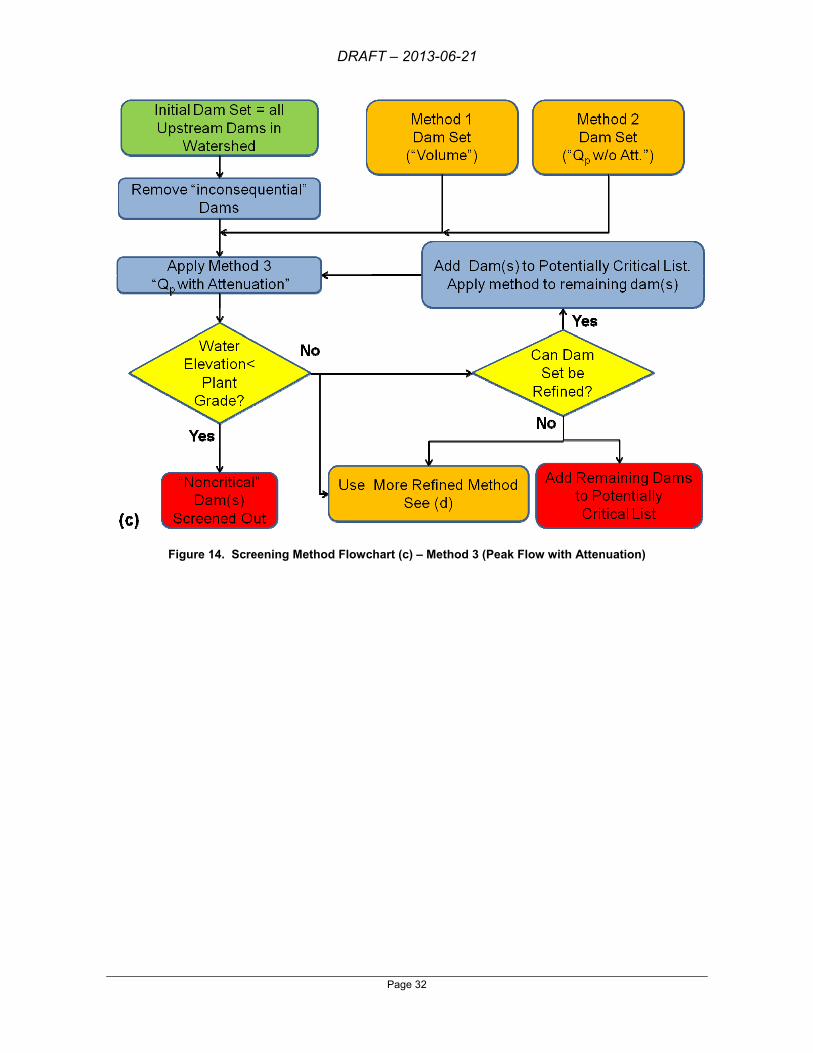
DRAFT – 2013-06-21
Page 32
Figure 14. Screening Method Flowchart (c) – Method 3 (Peak Flow with Attenuation)
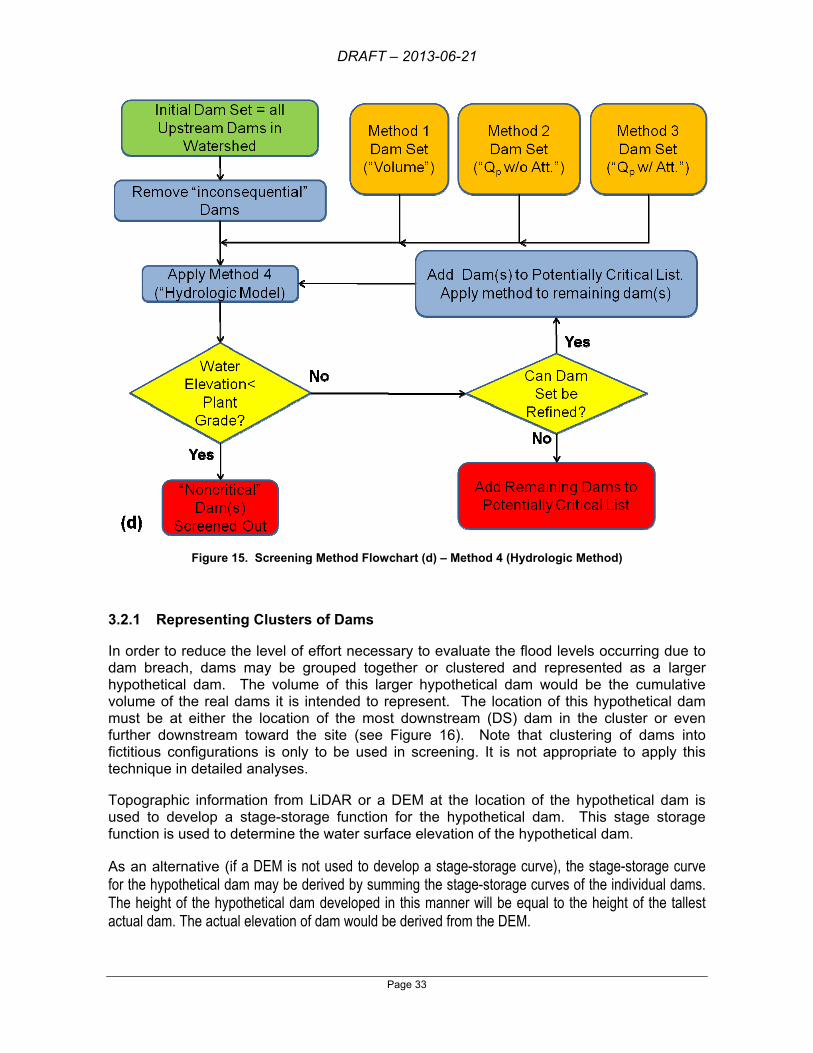
DRAFT – 2013-06-21
Page 33
Figure 15. Screening Method Flowchart (d) – Method 4 (Hydrologic Method)
3.2.1 Representing Clusters of Dams
In order to reduce the level of effort necessary to evaluate the flood levels occurring due to dam breach, dams may be grouped together or clustered and represented as a larger hypothetical dam. The volume of this larger hypothetical dam would be the cumulative volume of the real dams it is intended to represent. The location of this hypothetical dam must be at either the location of the most downstream (DS) dam in the cluster or even further downstream toward the site (see Figure 16). Note that clustering of dams into fictitious configurations is only to be used in screening. It is not appropriate to apply this technique in detailed analyses.
Topographic information from LiDAR or a DEM at the location of the hypothetical dam is used to develop a stage-storage function for the hypothetical dam. This stage storage function is used to determine the water surface elevation of the hypothetical dam.
As an alternative (if a DEM is not used to develop a stage-storage curve), the stage-storage curve for the hypothetical dam may be derived by summing the stage-storage curves of the individual dams. The height of the hypothetical dam developed in this manner will be equal to the height of the tallest actual dam. The actual elevation of dam would be derived from the DEM.

DRAFT – 2013-06-21
Page 34
While choosing which dams to cluster and where to place the hypothetical dam representing the dam one must keep in mind that the clustering must make hydrologic sense. For example in Figure 16, the following dams may be represented or clustered according to Table 2.
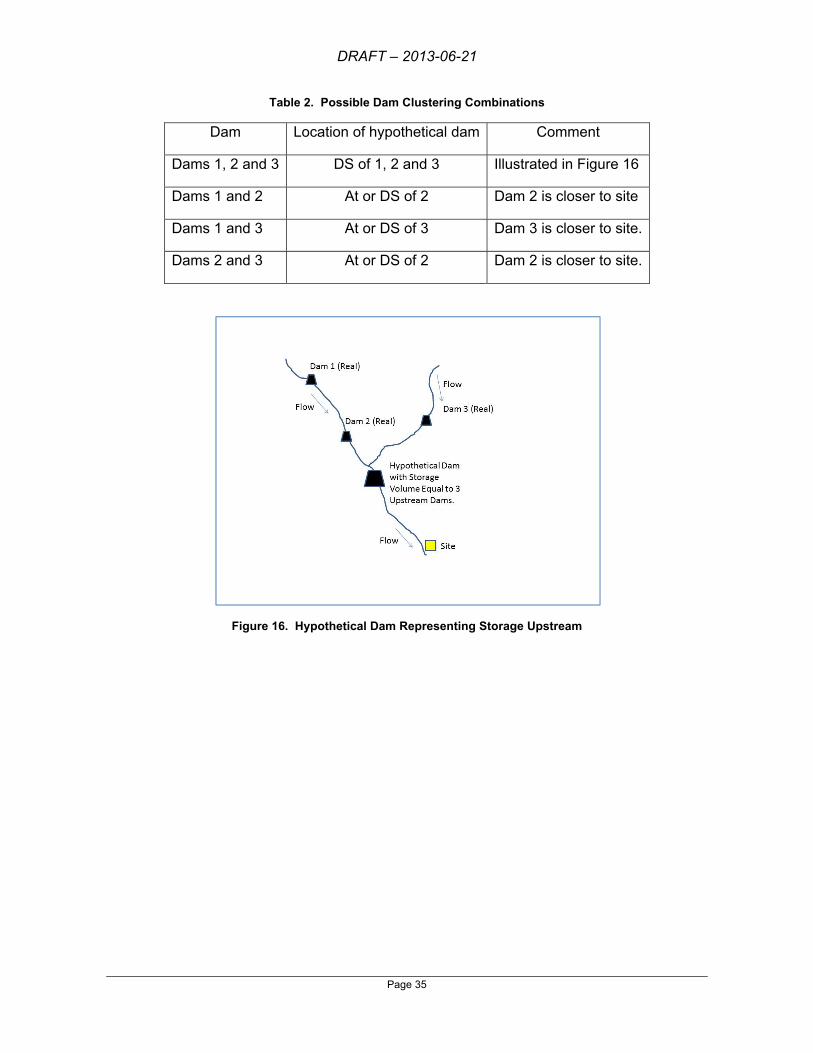
DRAFT – 2013-06-21
Page 35
Table 2. Possible Dam Clustering Combinations
Dam Location of hypothetical dam Comment
Dams 1, 2 and 3 DS of 1, 2 and 3 Illustrated in Figure 16
Dams 1 and 2 At or DS of 2 Dam 2 is closer to site
Dams 1 and 3 At or DS of 3 Dam 3 is closer to site.
Dams 2 and 3 At or DS of 2 Dam 2 is closer to site.
Figure 16. Hypothetical Dam Representing Storage Upstream
DRAFT – 2013-06-21
Page 36
4. Hydrologic Dam Failure
Hydrologic dam failures are induced by extreme rainfall or snowmelt events that can lead to natural floods of variable magnitude. The main causes of hydrologic dam failure include overtopping, structural overstressing, and surface erosion due to high velocity flow and wave action. Section 4.1 provides an overview of hydrologic failure by dam type. Section 4.2 provides more detail on analysis of various hydrologic failure modes.
4.1 Hydrologic Failure by Structure Type
4.1.1 Concrete Dams
Concrete dams are generally perceived to be relatively resistant to overtopping failure. Non-overflow sections of concrete dams (i.e. sections not designed to be overtopped) are typically able to withstand some overtopping due to the inherent strength of the concrete However, the foundation or abutments may be susceptible to significant erosion during overtopping flows (e.g. due to weak/fractured rock, or erodible soils), and if foundation or abutment support is lost due to overtopping erosion, the dam could be lost. Other portions of the concrete dam or appurtenances may be vulnerable under flood hydrologic loading. Examples include, but are not limited to: 1) erosion of an unlined tunnel or spillway chute; 2) erosion of a channel downstream from a stilling basin due to flow in excess of capacity; and 3) erosion of the spillway foundation where floor slabs have been damaged or lost; and 4) cavitation damage to lined tunnels or spillway chutes.
Overstressing of the dam may occur under flood conditions. As the reservoir rises during flood loading, there may be a level at which the heel of the dam goes into tension (based on effective stress), in which case the potential for cracking along a lift joint at that elevation may increase. At some point, the estimated tensile strength of the concrete may be exceeded, leading to failure of the dam.
Overstressing of an abutment may be a concern for concrete arch dams. An abutment foundation block upon which the dam rests could become unstable under increased loading due to flood conditions. The increase in reservoir level not only affects the dam loads on the block, but also the water forces on the block bounding planes (joints, faults, shears, bedding plane partings, foliation planes, etc.).
Staff Position:
• Concrete dams should be evaluated for potential hydrologic failure modes including, but not limited to:
o overtopping of the main dam, overtopping erosion of a dam abutment or foundation
o erosion of an unlined tunnel or spillway chute o erosion of a channel downstream from a stilling basin due to flow in excess
of capacity o erosion of the spillway foundation where floor slabs have been damaged or
lost o overstressing of the dam, foundation, or abutments

DRAFT – 2013-06-21
Page 37
o cavitation damage to spillway and outlet flow surfaces
4.1.2 Embankment Dams
Hydrologic loadings on embankments associated with flooding mainly fall into two categories: 1) increased internal seepage pressures; and 2) overtopping which initiates embankment erosion. Overtopping may be due to stillwater elevation alone, or in combination with wave action. Overtopping may also be due to failure of gates, outlet works, or other appurtenances. Deterioration or plugging of drains may lead to increased internal seepage pressures.
Staff Position:
• Embankment dams should be analyzed for conditions leading to and the effects of: o Overtopping o Increases in internal seepage pressures
4.1.3 Spillways, Gates, Outlet Works and Other Appurtenances
There are a number of facilities, not unique to any one dam type, for which loss of function during flooding events could directly cause uncontrolled release of the reservoir or lead to uncontrolled release of the reservoir via overtopping, erosion, or some combination of these. Chief among these are spillways, gates and other outlet works. Treatment of spillways, gates and outlet works in the analysis of hydrologic failures is discussed further in Sections 4.2.5 and 4.2.6, respectively.
Staff Position:
• Analysis of hydrologic failure modes should consider the potential for loss or degraded function of spillways, gates, outlet works and other appurtenances.
4.1.4 Levees
Failure of levees that provide flood protection to the NPP site should be considered. Such levees should be considered to fail when overtopped. Stability when not overtopped should be handled on a case-by-case basis. Distant levees are generally not of great concern.
Overtopping can lead to significant landside erosion of the levee or even be the mechanism for complete breach. Often levees are armored or reinforced with rocks or concrete to minimize erosion and prevent failure. In the riverine context, levee overtopping will initiate when floodwaters exceed the lowest crest of the levee system. Wind waves and setup may contribute to the overtopping. In the coastal context overtopping from the seaward side is most often caused by sustained high water levels and waves, due to a combination of storm surges and tide (and potentially tsunamis). Overtopping can also occur from the landward side if the water level is raised under extreme precipitation in the basin.
Except for so-called “frequently loaded” levees, levees are generally not designed to withstand high water levels for long periods of time. A frequently loaded levee is one that experiences a water surface elevation of one foot or higher above the elevation of the
DRAFT – 2013-06-21
Page 38
landside levee toe at least once a day for more than 36 days per year on average (CADWR, 2012). Frequently loaded levees should be designed to earthen dam standards.
Staff Positions:
• In general, earthen embankment levees should be assumed to fail when overtopped. The case for nonfailure must be developed using detailed engineering analysis supported by site-specific information, including material properties of the embankment and foundation soils, material properties of embankment protection (if any), levee condition, etc.
• Other forms of levees (e.g., pile walls, concrete flood walls) should be evaluated for potential failures applicable to the particular type of levee.
• Levees are generally not designed to withstand high water levels for long periods. However, there is no generally accepted method for predicting how long a levee will continue to function under high loading conditions. Therefore historical information is the best available basis for predicting levee performance. The historical information should be from levees that have similar design and construction characteristics as the levee being analyzed.
• The potential for loss or degraded function of levee control works should be considered.
• Because levees are typically designed to function as a system, the potential for failure of an individual segment should be evaluated for its impact on the functioning of the levee system as whole.
• Levees should not be assumed to fail in a beneficial manner without appropriate justification.
4.2 Analysis of Hydrologic Failure Modes
Overtopping is the most widely recognized hydrologic failure mode. Other common modes include overstressing of the dam or abutments due to hydrologic loads, erosion of embankments due to wave action, and erosion or cavitation in spillways. Analysis of these and potential other failure modes associated with flooding are discussed in more detail below. In addition, the potential failure of multiple dams due to a single storm event is discussed.
4.2.1 Internal Pressure
Estimating internal seepage pressures associated with various reservoir levels is an essential element of embankment dam design. However, deterioration or plugging of drains, as well as internal erosion mechanisms can lead to increased internal pressures and seepage. These conditions can compromise the structural strength of the dam.
Staff position:
• Embankment dams should be evaluated for potential failures due to internal pressures from a hydrologic inflow event (flood). Potential failure modes that should be evaluated include deterioration or plugging of drains and internal erosion mechanisms. Evaluation should generally include reviewing the dam design to assure that appropriate filters, drains, and monitoring points are included.
DRAFT – 2013-06-21
Page 39
Monitoring records of piezometers, observation wells or other observation methods can be used to show absence of unremediated deficiencies.
4.2.2 Overtopping
Overtopping occurs when the water surface elevation in the reservoir exceeds the height of the dam. Water can then flow over the crest of the dam, an abutment, or a low point in the reservoir rim.
During a severe overtopping event, the foundation and abutments of concrete dams may also be eroded, leading to a loss of support and failure from sliding or overturning (FEMA, 2004a). Overtopping of a dam as a result of flooding, leading to erosion and breach of the embankment, is the most common failure mode for embankment dams. The details of breach modeling are discussed in Section 7.
Dams are typically designed to accommodate the so-called inflow design flood (IDF). In many cases the IDF is the probable maximum flood (PMF) developed by analyzing the impacts of the probable maximum precipitation (PMP) event over the dams upstream watershed. In some cases, a lesser flood is considered. Inadequacy of the dam/spillway system and reservoir storage capacity to handle the inflow design flood is the most common cause of overtopping (inflow design flood estimates often change over time as more data is acquired or changes occur in the watershed). An overtopping failure may also occur when a reservoir’s outlet system is not functioning properly, thereby raising the water surface elevation of the dam.
Staff Position:
• Dams unable to pass their individual PMF should be considered for failure. o Embankment dams should generally be assumed to fail when overtopped. If
failure is not assumed when a dam is overtopped, justification should include detailed engineering analysis supported by site-specific information, including material properties of the embankment and foundation soils, material properties of embankment protection (if any), dam condition, etc.
o Concrete dams are not assumed to fail due to minor overtopping, but must be evaluated for failure due to loss of foundation or abutment support. Impact of the flood flows on structures such as tunnels, spillways, chutes and stilling basins should be examined.
• The potential for overtopping due to nonfunctioning gates, outlets and other appurtenances should be evaluated to determine the appropriate failure assumptions with appropriate engineering justification.
• On-site or off-site temporary structures can continue to be credited in the R2.1 flood hazard reevaluation if such credit has been evaluated and accepted by NRC staff prior to the 50.54(f) information request (USNRC 2012). All other temporary structures, or measures (including mitigation or compensatory measures), should not be credited in the flood hazard reevaluation. Temporary structures or measures not credited in the hazard reevaluation may be proposed as interim actions and discussed in the appropriate section(s) of the hazard reevaluation response as described in the 50.54(f) information request letter (USNRC 2012).
4.2.2.1 Reservoir Capacity
DRAFT – 2013-06-21
Page 40
The reservoir capacity will influence the maximum water surface elevation as well as the rate of change in elevation during floods. Consideration should be given to the potential for reductions in reservoir capacity over the life of nuclear power plant. The most common reason for reservoir capacity reduction is sedimentation. Other potential mechanisms, although much less likely, include: mud or debris flows (e.g., from fire-impacted watersheds), failure of coal ash impoundments, and failure of mine tailings impoundments.
Staff Position:
• Consideration should be given to the potential for reductions in reservoir capacity due to sedimentation over the life of nuclear power plant. Records from periodic bathymetric surveys of the reservoir, records of sediment production in upstream reaches, or estimates for sediment production rates for the upstream watershed can be used to support modeling assumptions.
4.2.2.2 Starting Reservoir Elevation
The starting reservoir water surface elevation at the beginning of a flood can impact the maximum reservoir water surface elevation, and thus the potential for overtopping. A lower starting reservoir water surface elevation can impact the maximum water surface achieved in flood routings due to the additional surcharge space in the reservoir. Some reservoirs are operated to provide more surcharge storage during flood season.
Staff Position:
• In view of the uncertainties involved in estimating reservoir levels that might reasonably be expected to prevail at the beginning of a flood, the default starting water surface elevation used in flood routings for evaluation of overtopping should be the maximum normal pool elevation (i.e. top of active storage pool). Other starting water surface elevations may be used, with appropriate justification. Justification should be based on operating rules and operating history of the reservoir. For example, if the flood being considered is associated with a distinct season and the operation of the dam has seasonal variations that are codified and have historically been followed, then it may be reasonable to select a starting reservoir elevation consistent with the operating rules and history. The operating history used should be of sufficient length to support any conclusions drawn (e.g., 20 years or more). But consideration should be given to possible instances where the operating history and/or rules have been influenced by anomalous conditions such as drought.
4.2.2.3 Reservoir Surcharge Capacity
Reservoir surcharge capacity will also affect the ability to pass large floods at a dam. Reservoir surcharge space can be used to store a portion of the incoming flood and in combination with the spillway capacity, can attenuate the peak of the flood (the peak outflow released through the spillway may be significantly less than the peak flood inflow). The amount of the peak inflow attenuation is a function of the reservoir surcharge volume in comparison to the flood volume, in addition to the spillway type and capacity. If the reservoir surcharge volume is large in comparison to the flood volume, significant attenuation will occur.
DRAFT – 2013-06-21
Page 41
Staff Position:
• Reservoir surcharge capacity can be credited in flood routings for evaluation of overtopping, with appropriate justification and documentation.
4.2.2.4 Spillway Discharge Capacity
Spillway discharge capacity is one of the most significant factors in the ability of a dam to pass floods. Spillway discharge capacity is usually the critical component in passing large floods, but in some cases, release capacity through other waterways (outlets, turbines, etc.) may be significant and will contribute to the total available release capacity. The term spillway discharge capacity as used in this document is intended to include spillway discharge capacity and any additional release capacity that would be available through other release structures at the dam.
If the spillway discharge capacity is roughly equal to the peak inflow from large floods approaching the Probable Maximum Flood (PMF), dam overtopping is usually not an issue. If the spillway discharge capacity is significantly less than the peak inflow of large floods, and if the volume of the floods is large in comparison to the surcharge capacity of the reservoir, dam overtopping will be likely for large floods. The likelihood of these floods and erodibility of the dam or foundation materials controls the risk.
With regard to crediting release capacity through appurtenances other than the spillway (e.g., outlets, turbines), existing federal guidance is not consistent. For example, USACE engineering manual EM 1110-2-1603, “Hydraulic Design of Spillways” states that a powerhouse should not be considered as a reliable discharge facility when considering the safe conveyance of the spillway. Conversely, FERC Engineering Guidelines for the Evaluation of Hydropower Projects states that those release facilities which can be expected to operate reliably under the assumed flood condition can be credited for flood routing. USBR best practice guidelines (USBR 2011) suggest that at least one turbine should always be assumed to be down (e.g. for maintenance or other reasons) in performing flood routing.
Operational history on generating unit outages (e.g., maintenance, planned, and forced outages) can be used to inform assumptions about release capacity through turbines. The North American Electric Reliability Corporation (NERC) provides reports on generating unit availability for North America (e.g. NERC 2012), which can be used if site-specific information is not available. Site-specific records from past flooding events, if available, should be reviewed.
Staff Positions:
• Release capacity through appurtenances other than the spillway (e.g., outlets, turbines) may be credited as part of the total available release capacity, with appropriate engineering justification that these appurtenances will be available and remain operational during a flood event. Access to the site during a flood event should be considered.
• The generators and transmission facilities to support the credited turbine(s) must be shown to be operational under concurrent flood and expected prevailing weather conditions if the turbines are credited as part of the total available release capacity.
Potential for Reservoir Debris to Block Spillway
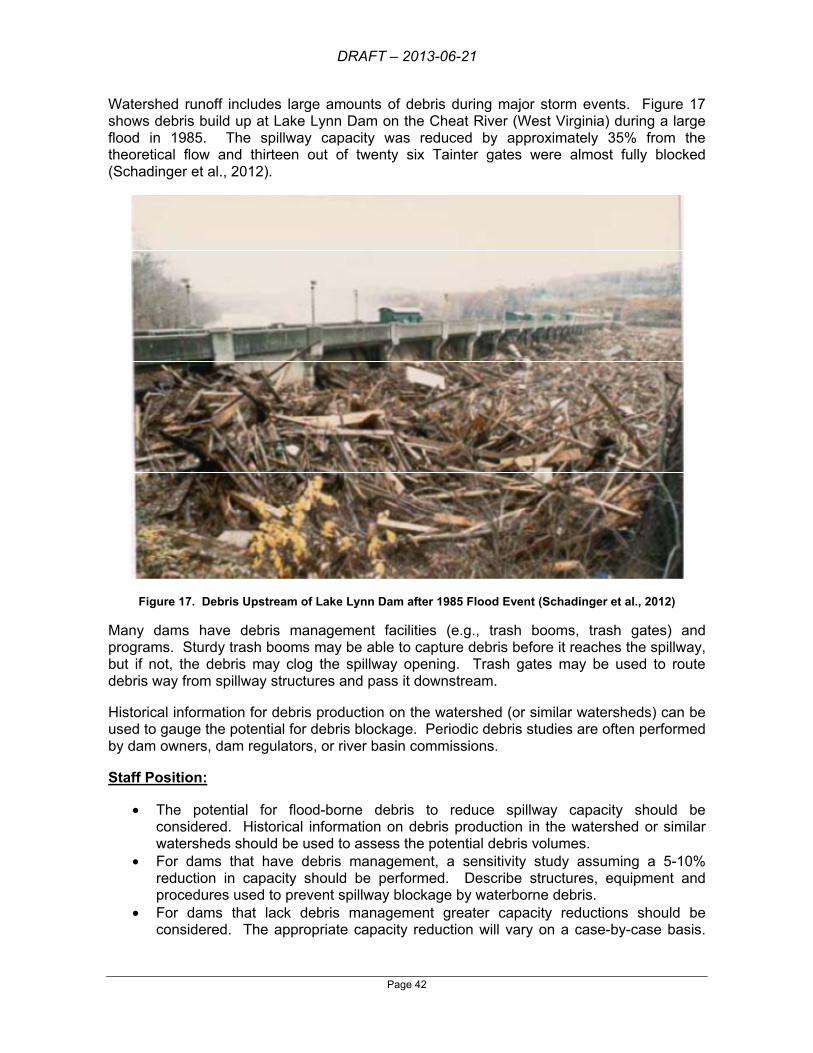
DRAFT – 2013-06-21
Page 42
Watershed runoff includes large amounts of debris during major storm events. Figure 17 shows debris build up at Lake Lynn Dam on the Cheat River (West Virginia) during a large flood in 1985. The spillway capacity was reduced by approximately 35% from the theoretical flow and thirteen out of twenty six Tainter gates were almost fully blocked (Schadinger et al., 2012).
Figure 17. Debris Upstream of Lake Lynn Dam after 1985 Flood Event (Schadinger et al., 2012)
Many dams have debris management facilities (e.g., trash booms, trash gates) and programs. Sturdy trash booms may be able to capture debris before it reaches the spillway, but if not, the debris may clog the spillway opening. Trash gates may be used to route debris way from spillway structures and pass it downstream.
Historical information for debris production on the watershed (or similar watersheds) can be used to gauge the potential for debris blockage. Periodic debris studies are often performed by dam owners, dam regulators, or river basin commissions.
Staff Position:
• The potential for flood-borne debris to reduce spillway capacity should be considered. Historical information on debris production in the watershed or similar watersheds should be used to assess the potential debris volumes.
• For dams that have debris management, a sensitivity study assuming a 5-10% reduction in capacity should be performed. Describe structures, equipment and procedures used to prevent spillway blockage by waterborne debris.
• For dams that lack debris management greater capacity reductions should be considered. The appropriate capacity reduction will vary on a case-by-case basis.
DRAFT – 2013-06-21
Page 43
Justification for the reduction used should be provided (e.g., debris studies for the watershed or similar watersheds).
4.2.2.5 Wave Action
In addition to still water levels associated with flood flows, wave action may lead to overtopping of a dam. In extreme circumstances, overtopping of the dam solely due to wave action could initiate erosion of the embankment and ultimately breach the dam. Part of the evaluation would be to determine the potential for waves of significant depths (based on the prevailing wind direction, the wind speeds and the fetch of the reservoir). While there is currently no rigorous method for evaluating overtopping failure due to wave action, it would require erosive embankment materials and a long duration of waves overtopping the dam.
Parapet walls are sometimes employed to contain waves that might overtop the dam and may need to be evaluated for a sustained water load. If a parapet wall is provided on the dam crest across the entire length of the dam, dam overtopping will initiate when the reservoir water surface exceeds the elevation of the top of the parapet wall. If a parapet wall overtops, the impinging jet from overtopping flows may erode the dam crest and undermine the parapet wall. If the parapet wall or a section of the wall fails, the depth of flows overtopping the dam crest will be significant and the embankment will likely erode rapidly.
Staff Positions: Overtopping due to wave action should be evaluated, in addition to stillwater levels. Coincident wind waves should be estimated at the dam site based on the longest fetch length and a sustained 2-year wind and added to the stillwater elevation.
4.2.3 Structural Overstressing of Dam Components
Higher loading conditions are typically found in dams where the reservoir elevation is increased due to a hydrologic event. While the dam itself may not be overtopped, the surcharge may be increased, overstressing the dam’s structural components. This overstressing may then result in an overturning failure, sliding failure, or failure of specific components of the dam.
Embankment dams may be at risk when increased water surface elevations produce in increased pore pressures and seepage rates that exceed the design seepage control measures for the dam. Concrete dams may be at risk due to potential failure of specific components of the dam, such as overturning or slipping of a slab section (FEMA, 2004a).
Staff Position:
• Static stability of the dam and key appurtenances under hydrologic loads associated with the dam’s PMF should be demonstrated using current methods and standards. If the dam cannot withstand the applied loads, the dam should be assumed to fail. If the appurtenance cannot withstand the load, assume failure of the appurtenance and estimate impact of its failure on stability of the dam. If the dam stability is not impacted, one still must consider the downstream impact of uncontrolled release (if any) associated with appurtenance failure.
DRAFT – 2013-06-21
Page 44
4.2.4 Surface Erosion from High Velocity and Wave Action
Surface erosion can occur along earthen spillways, the upstream or downstream embankment slopes, or along other appurtenant structure inlet and outlet channels. Surface erosion is primarily caused by high velocity runoff, reservoir wave action, and ice action. High flow velocities may cause headcutting along spillway sides that can progress towards the spillway crest, eventually leading to a full dam beach (FEMA, 2004a).
Staff Position:
• Surface erosion of earthen embankments, spillways, channels, etc. due to wave action, high velocity flows, and ice effects should be considered.
DRAFT – 2013-06-21
Page 45
4.2.5 Failure of Spillways
Concrete-lined spillways, as well as unlined or grass-lined earthen spillways, or unlined spillways excavated through rock, are subject to processes that may lead to failure during high flows associated with flooding.
Concrete-lined spillways are subject to stagnation pressure related failures that occur as a result of water flowing into cracks and joints during spillway releases. If water entering a joint or a crack reaches the foundation, failure can result from excessive pressure and/or flow into the foundation. If no drainage exists, or if the drainage is inadequate, and the slab is insufficiently tied down, the build-up of hydrodynamic pressure under a concrete slab can cause hydraulic jacking. If drainage paths are available, but are not adequately filtered, erosion of foundation material is possible and structural collapse may occur.
Concrete-lined spillways are also subject to cavitation related failures. Cavitation occurs in high velocity flow, where the water pressure is reduced locally because of an irregularity in the flow surface; if the pressure drops below the vapor pressure, the water "boils" at ambient temperatures and water vapor bubbles form in the flow. As the vapor cavities move into a zone of higher pressure, they rapidly collapse as they return to the liquid state, sending out high pressure shock waves. If the cavities collapse near a flow boundary, there will be damage to the material at the boundary. Cracks, offsets, surface irregularities and/or open joints in chute slabs and the lower portions of chute walls exposed to flow, may allow this failure mode to initiate. The geometry of the flow surface irregularities will affect the initiation of cavitation. The more abrupt the irregularity, the more prone the spillway will be to the initiation of cavitation. Once a flow surface is damaged by cavitation, the intensity of cavitation produced by the roughened surface increases, so damage can become severe in a short time.
Concrete deterioration in the form of delamination, alkali-silica reaction, freeze-thaw damage and sulfate attack can exacerbate stagnation pressure or cavitation related failure by initiating cracks, opening cracks and joints in the chute concrete, creating offsets into the flow at joints, and causing separation of the chute from the supporting foundation.
Unlined (soil or grass-covered) spillways are subject to erosion phenomena similar to that associated with overtopping of embankments. The most common scenarios involve: 1) failure of the grass or vegetation cover in the spillway; 2) concentrated erosion that initiates a headcut; and 3) deepening and upstream advance of the headcut. The U.S. Department of Agriculture Agricultural Research Service (USDA/ARS) and Natural Resources Conservation Service (USDA/NRCS) have developed tools to assess erosion in earthen and vegetated auxiliary spillways of dams. The Water Resource Site Analysis Computer Program (SITES) model and the Windows Dam Analysis Modules (WinDAM) are publicly available (NRCS, 2009, 2011). Both computer programs implement similar technology for evaluating spillway integrity. They are able to indicate whether breach of a spillway due to headcutting is likely, but do not model the consequences of breach (i.e., the simulations stop when spillway breach initiation is predicted; enlargement of the spillway breach and release of the reservoir storage are not modeled). A detailed discussion of causative mechanisms and predictive models for erosion of unlined soil or grass-covered spillways is provided in USSD (2006).
DRAFT – 2013-06-21
Page 46
For spillways excavated in rock, the models discussed in the previous paragraph have some ability to accommodate rock-like materials through their use of the headcut erodibility index which is defined for both soil-like and rock-like materials. Appropriate conservatism should be exercised when applying this model to a rock channel, since it was not originally developed in that environment. Another alternative for dealing with scour of rock materials is the use of a curve relating the headcut erodibility index and the required stream power to produce scour. Variations of this type of curve have been proposed by Annandale (2006), and Wibowo et al. (2005). A detailed discussion of causative mechanisms and predictive models for erosion of unlined spillways excavated in rock is provided in USSD (2006).
Staff Positions:
• Dams should be evaluated for potential failure due to spillway failure.
• Concrete spillways should be evaluated for relevant failure modes including stagnation pressure failures, cavitation, concrete deterioration (e.g., delamination, alkali-silica reaction, freeze-thaw damage and sulfate attack) and other relevant modes.
• Other (non-concrete) spillways should be evaluated for potential failures including failure of the grass or vegetation cover in the spillway; concentrated erosion that initiates a headcut; deepening and upstream advance of the headcut; and other relevant modes.
4.2.6 Failure of Gates
A variety of gates are used to control spillways. Gates range in complexity from simple slide gates (e.g., fixed-wheel gates or roller gates), to float-type gates (e.g. drum gates and ring gates), to gates which are shaped to balance hydrostatic forces (e.g., radial or tainter gates).
Another class of spillway gate is the fuse plug, which is a collapsible dam installed on spillways to increase the dam's capacity. The principle behind the fuse plug is that the majority of water that overflows a dam's spillway can be safely dammed except in high flood conditions. The fuse plug may be a sand-filled container, a steel structure or a concrete block. Under normal flow conditions the water will spill over the fuse plug and down the spillway. In high flood conditions, where the water velocity may be so high that the dam itself may be put in danger, the fuse plug breaches, and the flood waters safely spill over the dam.
Gates may fail to operate due to mechanical or power failures. Gates may also fail to operate when needed in flooding situations due to excessive friction or corrosion. This is more common with gates that are not properly maintained or seldom used. There is also the potential for actual gate operations to differ from planned operations (e.g., inability of an operator to access gate controls or an operator decision to delay opening the gates due to downstream flooding concerns).
Fuse plugs are generally considered to be reliable, but there is some inherent uncertainty about the exact depth and duration of overtopping needed to initiate breach. There is also uncertainty about the exact rate of breach development. Understanding the magnitude of these uncertainties is important because delayed operation of the fuse plug to lead to failure of the dam.

DRAFT – 2013-06-21
Page 47
Staff Position:
• The evaluation should consider the potential for gate failure under flooding conditions to lead to an uncontrolled release of the reservoir.
• With regard to fuse plugs, one should show that flood routings are not sensitive to the depth and duration of overtopping needed to initiate breach so that delayed operation does not lead to failure of a main dam.
4.2.7 Operational Failures and Controlled Releases
Certain operational failures and even certain controlled releases can lead to flooding at the NPP site. They may occur in a variety of situations, but the primary concern is that operational failures or controlled releases may be a compounding factor in flooding situations.
4.2.7.1 Operational Failures
Operational failures occur when equipment, instrumentation, control systems (including both hardware and software), or processes fail to perform as intended. This, in turn, can lead to uncontrolled reservoir release. Some illustrative examples of these types of failures include:
• Failure of a log boom allows reservoir debris to drift into and plug the spillway, leading to premature overtopping of the dam.
• Gates fail to operate as intended causing premature overtopping of the dam. This could result from mechanical or electrical failure, control system failure, or failure of the decision process for opening the gates. Gates may also fail to operate when needed due to excessive friction or corrosion. This is more common with gates that are not maintained or used very seldom.
• Loss of access to operate key equipment during a flood leads to overtopping of the dam or other uncontrolled releases.
• Loss of release capacity leads to overtopping of the dam. For example, if releases through the powerplant are a major component of the release capacity and the switchyard is taken out during a flood or earthquake, that release capacity will be lost. If the powerhouse is lower than the switchyard, then loss of the powerhouse without loss of the switchyard would also result in loss of release capacity.
• Mechanical equipment failure due to changes in operation without a corresponding change in maintenance. For example, if river operation requires frequent gate opening to enhance fisheries without a corresponding increase in the frequency of gate lubrication, component failure could occur when the gate is needed to pass a flood, leading to premature dam overtopping.
• Overfilling off-stream storage leads to overtopping and failure of the dam. This could happen due to faulty instrumentation, control system issues, or operator error.
• Failure to detect hazardous flows or a breakdown in the communication process to get people out of harm’s way. For example, power and phone lines may be cut by a

DRAFT – 2013-06-21
Page 48
large earthquake or flood. This may result in inability to warn in advance of life-threatening downstream flows.
An exhaustive analysis of all potential operational failures is generally not required. Instead, the intent is to understand the relationship between potential operational failures and existing safety margins (e.g. available freeboard).
Staff Position:
• Operational failures that may lead to uncontrolled releases and threaten to inundate the NPP site should be considered. Applicable operational failures should be identified, and consequences for the most likely failures should be evaluated. Operational history of similar dams, equipment, and procedures should be used to identify and rank operational failures.
4.2.7.2 Controlled releases
There may be instances where controlled releases can lead to inundation at the NPP site. Examples include, but are not limited to: 1) releases performed in order to prevent dam failure during flood conditions; 2) releases performed to rapidly drawdown a reservoir to prevent incipient failure after a seismic event; and 3) releases performed to rapidly drawdown reservoir to prevent incipient sunny day failure.
Consideration of the potential for controlled releases to generate flooding at the NPP site may include examination of spillway and gate discharge capacities and examination of reservoir/dam operating rules and procedures. Communication plans and systems for warning downstream entities of impending release should also be considered.
Staff Position:
• The potential for controlled releases that may threaten SSCs important to safety at the NPP site should be considered.
4.2.8 Waterborne Debris
Waterborne debris (e.g., trees, logs, or other objects) produce drag and impact loads that may damage or destroy buildings, structures, or parts thereof. The magnitude of these loads is very difficult to predict, yet some reasonable allowance must be made for them. The loads are influenced by where the structure is in the potential debris stream:
• immediately adjacent to or downstream from another building • downstream from large floatable objects (e.g., exposed or minimally covered storage
tanks) • among closely spaced buildings
Building standard ASCE 7-10 developed by the American Society of Civil Engineers (ACSE 2010) describes a methodology for determining impact loads based on the momentum-impulse method. The methodology differs from the classic impulse-momentum approach (USACE 1995d, FEMA, 2011,) in that it assumes a half-sine form for the applied load and includes several coefficients to allow design professionals to adapt the resulting force to local flood, debris, and building characteristics. The ASCE 7-10 methodology incorporates

DRAFT – 2013-06-21
Page 49
an importance coefficient to represent the risk category of the impacted structure. For critical or potentially critical dams (and for SSCs important to safety at NPP sites), an importance coefficient of 1.3, corresponding to Risk Category IV is appropriate. The ASCE 7-10 methodology also uses a depth coefficient meant to take into account the structure location within the flood hazard zone and flood depth. For dam and NPP sites, this coefficient should be based upon stillwater depth (i.e., disregard the selection criteria based upon flood insurance rate map zones). ASCE 7-10 also provides a method for estimating drag loads on structures. ACSE 7-10 provides guidance regarding the debris object weight selection for impact loads. The standard states that large woody debris with weights typically ranging from 1,000 to 2,000 lbs are appropriate for riverine floodplains in most areas of the U.S. In the Pacific Northwest, larger tree and log sizes suggest a typical 4,000 lb debris weight. Debris weights in riverine areas subject to floating ice typically range from 1,000 to 4,000 lbs. ASCE considers the 1,000 lb object to represent a reasonable weight for other types of debris ranging from small ice floes, to boulders, to man-made objects. However, licensees should consider regional and/or local conditions before the final debris weight is selected.
Staff Position:
• Drag and impact loads due to waterborne debris carried by flood waters should be considered with regard to impacts on the dam (i.e., gates and associated mechanical equipment, appurtenances, parapets, etc.).
• In the case of dam break flood waves, debris loads on to SSCs important to safety should be considered.
• The methodologies for debris load estimation described in ASCE 7-10, with the caveats described above, are acceptable to NRC staff.
• Licenses should consider regional and/or local conditions before the final debris weight is selected. On navigable waterways, for example, the potential for impact from water craft and barges should be considered in addition to trees, logs and common man-made objects.
4.2.9 Multiple Dam Failure due to Single Storm Scenario
At some NPP sites, there may be potential for flooding due to multiple dam failures (e.g. on different reaches above the plant) or the domino failure of a series of dams on the same reach. For example, the site may be located in a watershed where dams are located close enough to one another that a single storm event can cause multiple failures that have a compound effect on flood waves reaching the site. Failure of a critically located dam storing a large volume of water may produce a flood wave compounded by domino-type failures of downstream dams (e.g., failure of an upstream dam may generate a flood that would become an inflow into the reservoir impounded by a downstream dam and may cause failure by overtopping of the downstream dam. If several such dams exist in a river basin, each sequence of dams within the river basin could fail in a cascade).
Staff Positions:
• Those dams unable to be removed as “inconsequential” or screened out as “noncritical” (see Section 3) are considered potentially critical dams. Potentially critical dams should be evaluated for potential of hydrologic dam failures to lead to cascading failures of downstream dams and simultaneous dam failures causing
DRAFT – 2013-06-21
Page 50
flood conditions at the site. Operational rules may be considered but the starting water surface elevation must be as specified in Section 4.2.2.1. Flood waves from multiple dam failures should be assumed to reach the NPP site simultaneously unless appropriate justification for differing flood arrival times is provided.
• Two cases of multiple dam failure should be considered: (1) failure of individual dams on separate tributaries upstream from the site and (2) cascading or domino-like failures of dams upstream from the site.
o In the first case, one or more dams may be located upstream from the site but on different tributaries so the flood generated from the failure of an individual dam would not flow into the reservoir impounded by another dam. These individual dam failures should be analyzed together because of the potential for a severe storm to cause large floods on multiple tributaries.
o In the second case, failure of an upstream dam may generate a flood that would become an inflow into the reservoir impounded by a downstream dam and may cause failure by overtopping of the downstream dam. If several such dams exist in a river basin, each sequence of dams within the river basin could fail in a cascade. Each of these cascading failure sequences should be investigated to determine one or more sequences of dam failures that may generate the most severe flood at the site. Simplified estimates of the total volume of storage in each of the potential cascades should provide a good indication of the most severe combination. In multiple cascades that cannot be separated by simple hydrologic reasoning, all of the candidate cascades that are comparable in terms of their potential to generate the most severe flood at the site should be simulated using the methods described in Section 9. The most severe flood at the site resulting from these cascades should be considered in determining the design-basis flood.
• Depending on the storage capacities of the reservoirs impounded by dams in a given cascading scenario, it may be reasoned that the scenario that would release the largest volume of stored water may likely lead to the most severe flooding scenario. However, the distance a flood has to travel to reach a plant site also may affect the severity of the flood at the site. If a definite conclusion cannot be reached, all possible cascading scenarios should be simulated to determine the most severe scenario.
4.2.10 Levee Failures
Failure of levees that provide flood protection to the NPP site should be considered. Such levees should be considered to fail when overtopped. Stability when not overtopped should be handled on a case-by-case basis. Distant levees are generally not of great concern.
Earthen levees (the most common type) are designed to withstand flood conditions, but typically for limited durations, discharges and water surface elevations. Under flooding conditions, pore pressures within the embankment soils may increase to the point where the embankment slopes become unstable. Slope failure and subsequent breaching may be quite sudden. Similar instability may arise in the foundation soils. Such conditions are often accompanied by levee boils, or sand boils, in which underseepage resurfaces on the landside, in the form of a volcano-like cone of sand. Boils signal a condition of incipient instability which may lead to erosion of the levee toe or foundation or sinking of the levee into the liquefied foundation below (i.e., the boils may be the result of internal erosion or piping or they may also be a symptom of generalized instability of the foundation).

DRAFT – 2013-06-21
Page 51
Lack of inspection, maintenance and control is often a major contributing factor in levee failure. Uncontrolled vegetation growth (especially trees) or animal burrows may be sources of local weaknesses.
Natural geomorphic processes associated with channel migration may endanger a riverine levee system. For example, the downstream end of bends and areas across from tributary inflows are areas of high energy river flow and significant erosion may occur resulting in bank retreat and eventual levee failure. Embankments constructed across ancient river beds or stream channel meanders can provide weak points for seepage and pipe formation.
In some cases levees are breached intentionally, with the purpose to protect other areas. In most cases an intentional breach is not initiated without significant planning and notification.
Not all levees are earthen embankment type. Concrete and sheet piles are sometimes used. Some earthen levees have sheet pile or concrete parapets.
Staff Positions:
• If the performance of levees is potentially important to estimation of inundation at the NPP site, failures should be treated in a conservative manner, but realistic manner.
• If credit is taken for a specific levee behavior (either failure or nonfailure), engineering justification should be provided.
• Crediting intentional levee breaching will generally not be accepted due to large uncertainties in implementation of such plans (i.e., decisions are often political in nature).
• Assumptions regarding conveyance and off-stream storage should be supported with engineering justifications.
DRAFT – 2013-06-21
Page 52
5. Seismic Dam Failure
Seismic hazard is generally defined as the physical effects that occur as the result of an earthquake (e.g., ground shaking, surface faulting, landsliding, or liquefaction). The severity of these effects depends on factors such as the intensity and spectral characteristics of ground motions, dam type, dam construction materials and methods, and local site conditions. For some dam sites, the potential for surface fault displacement through the site is a major concern, but strong ground shaking is the most common earthquake effect. Ground shaking may directly damage the dam structure and appurtenances or induce subsequent failure modes. For example, seismically induced soil liquefaction can lead to the embankment failure of earthen embankment dams or foundation failure for other types of dams.
Another possibility concerns an active fault passing through the reservoir of a dam. Fault offset within the reservoir could create a seiche wave capable of overtopping and eroding the dam. Seiche waves can be generated by large fault offsets beneath the reservoir or by regional ground tilting that encompasses the entire reservoir. “Sloshing” can lead to multiple overtopping waves from these phenomena.
Note that the seismic dam failure scenario is one where “load combinations” come into play (e.g., a more frequent earthquake combined with a flood event). This is discussed in Section 5.6. In some instances (e.g. when downstream consequences are likely to be small), the licensee may elect to simply assume that the dam fails seismically in lieu of conducting a seismic analysis. In this case, the question arises of what flood event to assume, since no frequency is assigned to the seismic event. In Section 5.6, the 500-year flood is used in conjunction with the lower of the two seismic hazard levels. Therefore, a lesser flood would not be appropriate in this case.
Staff Position:
• If seismic failure is simply assumed without analysis, the seismic failure should be assumed to occur under 500-year flood conditions.
5.1 Overview
A complete seismic evaluation of an existing dam typically includes: 1) an assessment of site-specific geological and seismological conditions to determine seismic potential and associated ground motions (a field and laboratory testing program may be needed to characterize the distribution and properties of the soils if they are not known); and 2) an analysis of the effects of earthquake shaking on the dam structure and its appurtenances. The basic steps in analyzing the seismic failure problem are as follows:
1. Estimate earthquake ground motions a. Characterize earthquake sources b. Apply attenuation relations to estimate bedrock motion at site c. Determine site amplification function to estimate ground surface response at
site 2. Estimate the loadings imposed on the dam by the earthquake ground motions 3. Analyze the ability of the dam to withstand the earthquake-induced loadings
DRAFT – 2013-06-21
Page 53
The behavior of dams and their foundations under earthquake loading is an extremely complex problem. It is therefore essential that seismic investigations be conducted by knowledgeable seismic engineers following the state-of-the-practice in the profession.
5.1.1 Seismic Hazard Characterization
Seismic parameters represent one of several ground motion-related variables or characteristics, such as peak ground acceleration (PGA), peak ground velocity (PGV) displacement, response spectra, acceleration time histories, or duration. They can be obtained using deterministic or probabilistic seismic hazard analysis (PSHA) procedures.
Preferably, seismic evaluation parameters should be specified using site-dependent considerations, making use of existing knowledge and actual observations that pertain to earthquake records obtained from sites with similar characteristics. In particular, attenuation characteristics should not be applied blindly due to differences in earthquake focal depths, transmission paths, and tectonic settings. It is important to indicate if seismic parameters predicted by attenuation relationships take into account the effect of surface soil layers since soft deposits can alter the bedrock motions dramatically. The duration of shaking is a significant seismic evaluation parameter, as it has been shown to be directly related to the extent of damage, especially in the case of embankment dams. This is even more critical when the foundation or the embankment contain soils that are prone to accumulate excess pore pressures during an earthquake. Local conditions may affect the expected duration of earthquake shaking and should be considered on a case-by-case basis.
Vertical peak and spectral accelerations are usually considered less critical than horizontal motions for embankment dams that are distant from the earthquake source(s). They are more important for concrete dams and concrete appurtenances. Vertical motions are sometimes estimated by scaling horizontal accelerations, along with corresponding frequencies in the case of spectral values, using factors in the range of 1/2 to 2/3. When vertical accelerations are critical, it is preferable to rely on attenuation relationships developed specifically for vertical accelerations.
While definition of seismic parameters by peak values and spectral shapes is sufficient for some dam applications, in other cases a time history analysis may be required. This will be the case when induced stresses approach the strength of the dam or foundation materials, or when it is necessary to consider the inelastic behavior of the dam.
5.1.1.1 Use of USGS National Seismic Hazard Maps
The USGS National Seismic Hazard Maps (USGS, 2008) are developed from seismic sources and ground-motion equations specific to the Central and Eastern United States earthquakes, to the Western United States crustal fault earthquakes, and to subduction-zone interface and in-slab earthquakes. In the Central and Eastern United States, the USGS generally calculate ground motions from sources that are up to 1,000 kilometers from the site. In the Western United States, the USGS calculates ground motion from crustal sources less than 200 kilometers and subduction sources less than 1,000 kilometers from the site. The USGS also maintains a website where the maps, as well as the data and software used to create the maps, are available ( http://earthquake.usgs.gov/hazards/?source=sitenav ).
5.1.2 Structural Considerations
DRAFT – 2013-06-21
Page 54
It is important for the engineers who will be doing the fragility evaluation to coordinate with the seismologist on generating the hazard curves, uniform hazard spectra, and time-history accelerograms. These products should reflect the parameters that control the structural response of the dam and/or appurtenant structures. Typically this is the spectral acceleration at the predominant period of a structure, or perhaps the area under a response spectrum curve covering more than one structural vibration period if several modes contribute to the structural response. It may be necessary to ask for different hazard curves for different structures forming the reservoir retention system. In some cases, a certain combination of acceleration and velocity may be critical to the structural response, and hazard curves would need to be developed that relate to simultaneous exceedance of given acceleration and velocity levels.
5.1.3 Probabilistic Seismic Hazard Analysis
A probabilistic seismic hazard analysis (PSHA) involves relating a ground motion parameter and its probability of exceedance at the site. The value of the ground motion parameter to be used for the seismic evaluation is then selected after defining a probability level, applicable to the dam and site considered. PSHA considers the contributions from all potential sources of earthquake shaking collectively. Uncertainty is treated explicitly, and the annual probability of exceeding specified ground motions (commonly expressed as response spectra acceleration(s) at the period of interest), are computed. Alternatively the analysis may be performed for a specified duration of time (such as the operating life of the dam). PSHA involves a thorough mathematical and statistical process that takes into account local and regional geologic and tectonic settings, as well as applicable historic and geologic rates of seismic activity. The results are typically expressed in terms of peak ground acceleration (PGA), peak ground velocity (PGV), or spectral amplitudes at specified periods
Whereas in the past deterministic approaches have been favored in dam engineering, there has been a gradual shift to probabilistic methods for determining ground motion parameters. Therefore, the rest of this document will concentrate on the PSHA approach. In any PSHA study, there are three basic components: 1) seismic source characterization; 2) development of ground motion estimates; 3) and development of the site response. Additional steps include the development of uniform hazard spectra and development of acceleration time-histories.
Staff Position:
• PSHA is considered to be the state of practice for evaluating seismic hazards for dam failure.
5.2 Seismic Failure by Structure Type
The impact of seismic ground motions and key failure modes of interest will depend the design and construction of the dam. The following sections discuss the key concerns and seismic failure modes for concrete and embankment dams, as well as spillways, gates and other appurtenances. This is followed by a short discussion of levees.
5.2.1 Concrete Dams
Under earthquake loading, concrete dams will respond to the level and frequency of the ground shaking, combined with the forces due to water in the reservoir. The tensile strength
DRAFT – 2013-06-21
Page 55
of the concrete under such dynamic loading is typically an important consideration. However, both structural and foundation failure modes may be important. If the shaking is severe enough, cracking and subsequent partial or complete separation of the contact surface between blocks may propagate through the structure. Ground surface displacement along a fault or liquefaction of foundation soils could lead to cracking and failure. It should be noted that the post-earthquake stability of the dam and foundation may be reduced depending upon the level and duration of shaking experienced. An earthquake may also damage the dam’s drainage system. The stability of the dam could be threatened if the drain functions are impaired to the point that uplift pressure increases significantly.
Although no concrete dam foundations are known to have failed as a result of earthquake shaking, unprecedented seismic loads would in effect be a first-loading condition that could trigger movement and failure of arch dam foundation blocks. Therefore, it is important to analyze and evaluate the risks associated with potential earthquake induced foundation instability.
Historically, concrete arch dam failures have resulted primarily from sliding of large blocks within the foundation or abutments. However, since there have been no known arch dam failures as a result of earthquake shaking (USBR 2011), there is no direct empirical evidence to indicate how an arch dam would structurally fail under seismic loading. Shake table model studies and numerical simulations (e.g., three-dimensional dynamic finite element analysis) provide the basis for postulated failure modes. These studies indicate that structural failure is initiated by cantilever cracking across the lower central portion of the dam, followed by diagonal cracking parallel to the abutments. This type of cracking eventually leads to isolated blocks within the dam that subsequently rotate and swing downstream, releasing the reservoir.
The design of older buttress dams generally considered only the gravity and water pressure loads, and the buttress configuration is remarkably efficient in providing the resistance required for such loading. However, in the interest of efficiency, the buttresses were made very slender and thus they have very little strength for resisting cross-stream accelerations. Under strong shaking, it is conceivable that an older slab and buttress or multiple arch dam designed in this manner may suffer significant cracking/buckling and fail in domino fashion through the successive collapse of its buttresses. Typically both structural and foundation failure modes should be considered. The foundation stiffness can have a large effect on the rotations at the base of the buttresses and the dynamic response of the dam.
Under earthquake loading, concrete buttress and multi-arch dams will respond to the level and frequency of the ground shaking, combined with the forces due to water in the reservoir. Forces due to the water will depend upon the details of the design. The entire mass of water directly over the dam face will move with the vertical seismic motion. For flat slabs, there will be little or no cross-canyon hydrodynamic forces generated. Designs with cylindrical arches, domes or massive head buttresses will be subject to cross-canyon hydrodynamic forces. Depending upon the element of the structure under consideration, either the tensile, shear, or compressive strength will be an important consideration. For struts (which provide lateral support to the buttresses, when present) compressive strength is important. Slab-type water barriers supported by a corbel carry load by compression, shear and moment. Shear and tensile strength is important for the buttresses and the supporting corbels.
Staff Positions:
DRAFT – 2013-06-21
Page 56
• Seismic analysis of concrete dams should include assessment of ground shaking, surface displacement, and forces due to water in the reservoir.
• Both structural and foundation failure modes should be considered. • Foundation liquefaction/deformation potential should be considered. • Structural failure modes considered should take into account the unique concerns for
the type of dam in question.
5.2.2 Embankment Dams
Although many embankment dams have been exposed to earthquake shaking, there have been few instances where an earthquake has damaged an embankment dam enough to result in the uncontrolled release of reservoir water. Either the damage caused by the earthquake was not extensive enough, or in the rare cases where damage was extensive, the reservoir was far below the damage and uncontrolled releases did not occur. But, in spite of the relatively few failures experienced, it remains true that earthquakes can initiate a wide variety of potential failure modes in embankment dams. Shaking can cause loss of strength or even liquefaction of foundation or embankment soils, leading to deformation, sliding, or cracking failures.
Extensive shear strength reduction beneath an embankment slope can trigger a flow slide which, in turn, can produce a very rapid dam failure. Many cycles of low-amplitude loading can also induce a fatigue-like shear strength loss in dense, saturated, materials. A translational failure can occur if the entire foundation beneath an embankment liquefies and the reservoir pushes the embankment downstream far enough to create a gap in the vicinity of an abutment.
There are many ways in which cracking can occur due to seismic shaking, such as differential settlement upon shaking, general disruption of the embankment crest, offset of a foundation fault, or separation at spillway walls. Surface displacements can lead to cracking of the dam foundation, embankment or conduits passing through the dam. Shearing of a conduit passing through an embankment dam due to fault displacement can allow transmission of high pressure water into the dam, leading to increased gradients and potential for internal erosion.
Staff Positions:
• Seismic analysis of embankment dams should include assessment of ground shaking and surface displacement.
• Both structural and foundation failure modes should be considered. • Deformation and liquefaction potential of both the dam and the foundation should be
considered.
5.2.3 Spillways, Gates, Outlet Works and Other Appurtenances
There are a number of facilities, not unique to any one dam type, for which loss of function during or following a seismic event could directly cause uncontrolled release of the reservoir through the failed gate or lead to uncontrolled release of the reservoir via overtopping, erosion, or some combination of these. Chief among these are spillways, gates and other outlet works.
DRAFT – 2013-06-21
Page 57
Gates may fail to operate for a variety of reasons during seismic events. Dynamic loading may cause buckling of the gate itself. The seismic event could damage a gate hoist mechanism mounted above the gates, or cause shear or moment failure of supporting structures such as the piers in which the gates are mounted. Inoperability of a gate can cause a reservoir to fill beyond its design maximum water level (causing failure due to increased hydrostatic forces or overtopping) if not corrected in a timely manner.
Staff Position:
• Seismic evaluation of dams should include consideration of whether a seismic event could lead to dam failure and subsequent uncontrolled release of the reservoir due to loss or degraded function of spillways, gates, outlet works and other appurtenances.
5.2.4 Levees
Earthquakes can damage or cause complete failures of levees. The most common mode of earthquake-induced damage is expected to be lateral spreading and cracking associated with earthquake shaking. As for earthen dams, shaking may cause liquefaction of soils within the levee or in the foundation soils. Design of levee systems for seismic performance has generally had low priority in the past, except for levees with a high likelihood of having coincident high water and earthquake loading. (e.g., levees in the Sacramento-San Joaquin Delta of California). Staff Position:
• Survival of a loaded levee during an earthquake event should be justified through appropriate engineering analysis.
• Levees should not be assumed to fail in a beneficial manner, without appropriate engineering justification.
5.3 Analysis of Seismic Hazards Using Readily Available Tools and Information
Since there will generally be insufficient time and resources to perform detailed seismic analyses for all dams upstream from the NPP site, the following approach may be applied. It is assumed that the screening approach described in Section 3 has already been applied (i.e., inconsequential dams have been removed and non-critical dams have been screened out).
The analysis approach outlined in this section and in Section 5.4 is meant to take advantage of existing information for the dam (e.g. seismic design information or seismic qualification studies), along with a consistent level analysis of the seismic hazard (e.g. existing seismic hazard curves or seismic hazard assessments developed using readily available tools and data). In order to apply this approach, the seismic capacity of the dam (i.e., based on seismic design or post-construction seismic capacity studies) must be known. The seismic capacity should be characterized for frequencies of importance to the dam (e.g. design response spectrum). Note that there may be different capacities depending upon the failure mode. For example, the capacity for concrete cracking for a concrete dam may be different from the capacity for sliding.
The licensee has the option of using this approach or conducting more detailed site-specific characterization of seismic hazards at the dam site (as discussed in Section 5.7) as well as

DRAFT – 2013-06-21
Page 58
more detailed analysis of the seismic capacity of the dam (discussed in Section5.8 ). The options for performing seismic hazard analysis are outlined in Figure 18.
Figure 18. Seismic Dam Failure Analysis Options
5.3.1 Ground Shaking
Ground shaking is one of the most common seismic loads that should be considered for dams. As discussed in Section 1.4.2, it acceptable to use the 1x10⁻⁴ annual frequency ground motions, at spectral frequencies important to the dam, for seismic evaluation.
Staff positions:
• The seismic hazard at the dam site should be characterized using probabilistic seismic hazard assessment (PSHA) for the spectral frequencies of interest to the dam:
o The data and software tools available from USGS, which were used to develop the most recent version of the National Seismic Hazard Maps (this is the 2008 version as of the publishing of this guidance) are suitable for developing bedrock hazard curves and uniform hazard spectra at 1x10⁻⁴ annual frequency of exceedance. (USGS, 2008)
DRAFT – 2013-06-21
Page 59
o The site amplification functions developed by the Electric Power Research Institute (EPRI, 1989) should be used to perform a site response analysis as described in NUREG/CR-6728 (USNRC, 2001).
• As an alternative to use of the USGS seismic hazard curves, it is acceptable to performance a site-specific PSHA consistent with the methodologies suitable for use in characterizing seismic hazard at U.S. nuclear power plant sites, as described in Regulatory Guide 1.208 (USNRC, 2007).
5.3.2 Fault Displacement
For some dam sites, the potential for surface fault displacement through the dam site or foundation is a concern. Another possibility concerns an active fault passing through the reservoir of an embankment dam. Fault offset within the reservoir could create a seiche wave capable of overtopping and eroding the dam. Seiche waves can be generated by large fault offsets beneath the reservoir or by regional ground tilting that encompasses the entire reservoir. “Sloshing” can lead to multiple overtopping waves from these phenomena.
Two types of surface faulting are generally recognized: principal (or primary) and distributed (or secondary) surface faulting. Principal faulting occurs along the main fault plane(s) that is the locus of release of seismic energy. Distributed, or secondary faulting, is displacement that occurs on a fault or fracture away from the primary rupture and can be quite spatially discontinuous.
Probabilistic fault displacement hazard analyses (PFDHA) can be performed in a manner analogous to that used for probabilistic ground motion. The results are represented by a hazard curve which shows annual occurrence of fault displacement values (i.e., the annual frequency of exceeding a specified amount of displacement). A recent example is the analysis conducted for Lauro Dam near Santa Barbara, California (Anderson and Ake, 2003). This analysis followed the methodology that was used for the proposed Yucca Mountain, Nevada nuclear waste repository (Stepp et al. 2001; Youngs et al., 2003).
Staff Position:
• Dam sites should be evaluated for the potential for surface fault displacement to cause damage to the dam.
• The potential for primary and secondary surface faulting should be considered. • It is acceptable to utilize existing analyses that demonstrate that a dam is not
susceptible to fault displacement.
5.3.3 Liquefaction
During an earthquake, soils may undergo either transient or permanent reduction in undrained shear resistance as a consequence of excess pore water pressures or disruption of the soil structure accompanying cyclic loading. Such strength degradation may range from slight diminution of shear resistance to the catastrophic and extreme case of seismically induced liquefaction, which is a transient phenomenon. In this guide, the term seismically induced liquefaction includes any drastic loss of undrained shear resistance (stiffness and/or strength) resulting from repeated rapid straining, regardless of the state of stress prior to loading. The term is interchangeably applied to the development of either

DRAFT – 2013-06-21
Page 60
excessive cyclic strains or complete loss of effective stress within an undrained laboratory specimen under cyclic loading (sometimes referred to as initial liquefaction).
An initial assessment of the potential for earthquake-induced ground failure typically includes:
1. Geomorphology of the site. 2. A soil profile, including classification of soil properties and the origin of soils at the
site 3. Water-level records, representative of both current and historical fluctuations. 4. Evidence obtained from historical records, aerial photographs, or previous
investigations of past ground failure at the site or at similar (geologically and seismologically) nearby areas (including historical records of liquefaction, topographical evidence of landslides, sand boils, effects of ground instability on trees and other vegetation, subsidence, and sand intrusions in the subsurface).
5. Seismic history of the site.
Detailed investigations would include surveys and undisturbed sampling borings to (1) refine the preliminary interpretation of the stratigraphy and the extent of potentially liquefiable soils, (2) measure in situ densities and dynamic properties for input to dynamic response analyses, and (3) recover undisturbed samples for laboratory testing when site soils are not adequately represented in the available data base.
Regulatory Guide 1.198, “Procedures and Criteria for Assessing Seismic Soil Liquefaction at Nuclear Power Plants” (USNRC, 2003) provides guidance on acceptable methods for evaluating the potential for earthquake-induced instability of soils resulting from liquefaction and strength degradation. It provides descriptions of screening techniques as well as procedures for detailed analysis.
Staff position:
• The dam site should be evaluated for liquefaction potential. • Regulatory Guide 1.198 provides guidance on acceptable methods for evaluating the
potential for earthquake-induced instability of soils resulting from liquefaction and strength degradation.
5.4 Assessment of Seismic Performance of Dams Using Existing Studies
In lieu of performing a new seismic hazard evaluation of dam performance, it is acceptable to utilize existing studies or design documentation to demonstrate the seismic capability of a dam.
Staff Positions
• Existing studies will be accepted on a case-by-case basis. However, studies utilized should ideally consider seismic capacity for both the maximum normal operating pool level (i.e. top of active storage) and average pool level (i.e 50% exceedance duration pool level calculated using average daily water levels for the period of record). The average non-flood tailwater level should be used with both headwater conditions above.

DRAFT – 2013-06-21
Page 61
5.4.1 Ground Shaking
In order to utilize existing studies to demonstrate the seismic capability of a dam, the seismic capacity of the dam (e.g., based on seismic design or post-construction seismic capacity studies) must be known for spectral frequencies of importance to the dam (e.g., using design response spectrum).
Staff positions:
• The seismic demands on the structure should be defined using the site-specific hazard spectrum (based on the UHS and accounting for site amplification) as described in Section 5.3.1. The design spectrum (or spectrum determined by other seismic analyses) is compared against the site-specific hazard spectrum to assess the failure potential of the dam. If the capacity of the structure exceeds the site-specific seismic demands at the spectral frequencies of relevance to the dam, with appropriate margin to account for uncertainties in the analysis, the dam can be assumed not to fail due to seismic ground shaking. Appropriate margin is usually expressed as a factor of safety, which will depend upon the type of dam and failure mode under consideration. FEMA guidelines on earthquake analysis of dams (FEMA 2005) provide additional detail.
• In cases where information does not exist to characterize the capacity of the dam by response spectrum or define capacities at the frequencies of relevance to the dam (e.g., in the case when the dam design was based on pseudo-static analysis using a single demand such as peak ground acceleration and the dam has not been reevaluated to define capacity in terms of other intensity measures), the licensee may leverage such analysis with appropriate justification. Examples of appropriate justification include demonstration of the conservatism and applicability of the analysis, in light of the UHS developed in Section 5.3.1 including effects of site amplification of a range of spectral frequencies.
• Dams that cannot be shown to have sufficient capacity should be assumed to fail and breach parameters computed as described in Section 7 Moreover, dams that are susceptible to seismic failure should be evaluated for the potential for multiple dams to fail during a single seismic event as described in Section 5.5. Alternatively, it is acceptable to perform more detailed assessment of the performance of the dam (i.e., performing new assessments) as described in Section 5.8.
5.4.2 Fault Displacement
Staff position:
• Existing studies or data on dam or foundation materials can be used to assess performance of the dam with respect to surface displacement, in light of the seismic hazard defined for the site, with appropriate justification of their applicability and with appropriate conservatism to account for uncertainties.
5.4.3 Liquefaction
Staff position:
• Existing studies or data on dam or foundation soils can be used to assess performance of the dam with respect to liquefaction or loss of strength, in light of the
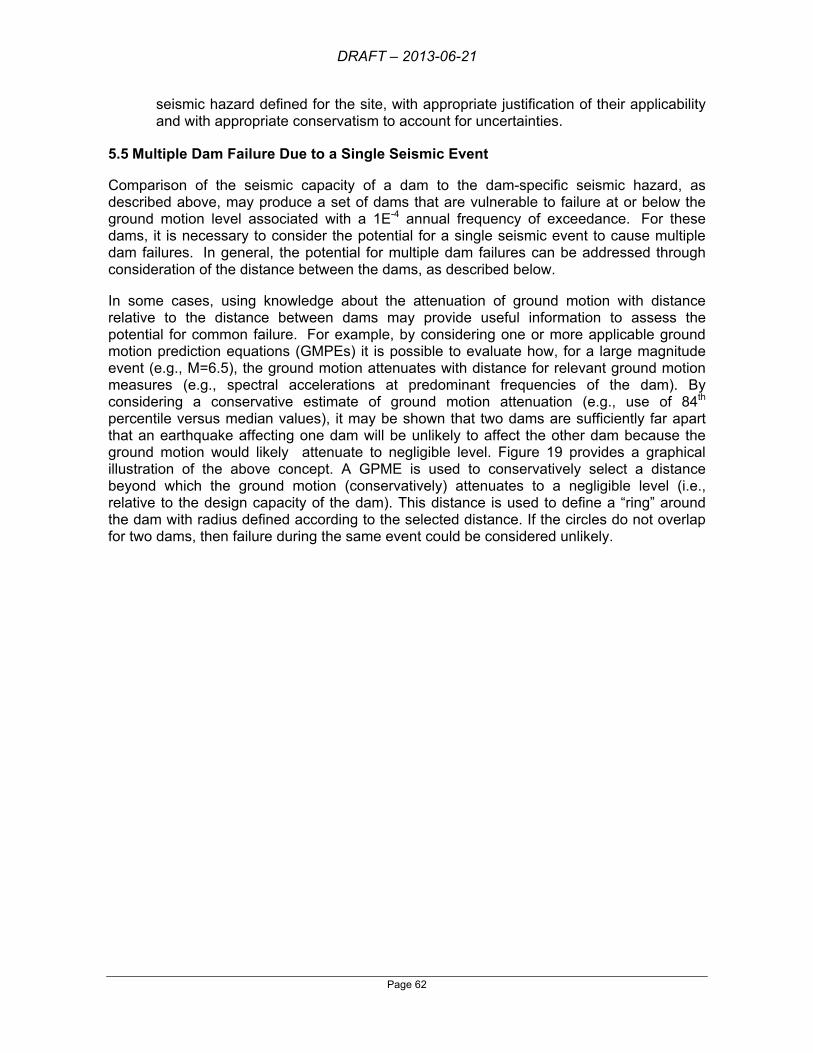
DRAFT – 2013-06-21
Page 62
seismic hazard defined for the site, with appropriate justification of their applicability and with appropriate conservatism to account for uncertainties.
5.5 Multiple Dam Failure Due to a Single Seismic Event
Comparison of the seismic capacity of a dam to the dam-specific seismic hazard, as described above, may produce a set of dams that are vulnerable to failure at or below the ground motion level associated with a 1E-4 annual frequency of exceedance. For these dams, it is necessary to consider the potential for a single seismic event to cause multiple dam failures. In general, the potential for multiple dam failures can be addressed through consideration of the distance between the dams, as described below.
In some cases, using knowledge about the attenuation of ground motion with distance relative to the distance between dams may provide useful information to assess the potential for common failure. For example, by considering one or more applicable ground motion prediction equations (GMPEs) it is possible to evaluate how, for a large magnitude event (e.g., M=6.5), the ground motion attenuates with distance for relevant ground motion measures (e.g., spectral accelerations at predominant frequencies of the dam). By considering a conservative estimate of ground motion attenuation (e.g., use of 84th percentile versus median values), it may be shown that two dams are sufficiently far apart that an earthquake affecting one dam will be unlikely to affect the other dam because the ground motion would likely attenuate to negligible level. Figure 19 provides a graphical illustration of the above concept. A GPME is used to conservatively select a distance beyond which the ground motion (conservatively) attenuates to a negligible level (i.e., relative to the design capacity of the dam). This distance is used to define a “ring” around the dam with radius defined according to the selected distance. If the circles do not overlap for two dams, then failure during the same event could be considered unlikely.
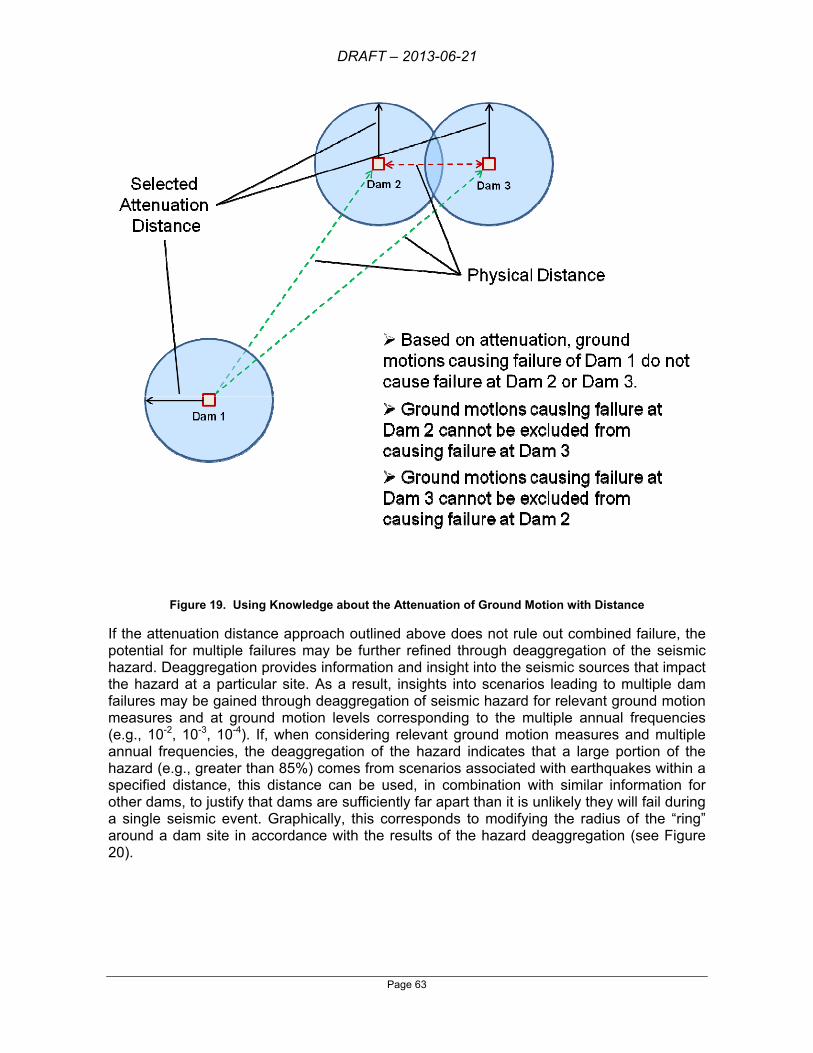
DRAFT – 2013-06-21
Page 63
Figure 19. Using Knowledge about the Attenuation of Ground Motion with Distance
If the attenuation distance approach outlined above does not rule out combined failure, the potential for multiple failures may be further refined through deaggregation of the seismic hazard. Deaggregation provides information and insight into the seismic sources that impact the hazard at a particular site. As a result, insights into scenarios leading to multiple dam failures may be gained through deaggregation of seismic hazard for relevant ground motion measures and at ground motion levels corresponding to the multiple annual frequencies (e.g., 10-2, 10-3, 10-4). If, when considering relevant ground motion measures and multiple annual frequencies, the deaggregation of the hazard indicates that a large portion of the hazard (e.g., greater than 85%) comes from scenarios associated with earthquakes within a specified distance, this distance can be used, in combination with similar information for other dams, to justify that dams are sufficiently far apart than it is unlikely they will fail during a single seismic event. Graphically, this corresponds to modifying the radius of the “ring” around a dam site in accordance with the results of the hazard deaggregation (see Figure 20).
DRAFT – 2013-06-21
Page 64
Figure 20. Refinement of Seismic Influence Using Deaggregation
Staff positions:
• The approaches outlined above can be used to identify the collection of dams that should be considered in a multiple-failure scenario, but not the precise sequence of the failures.
• Once the critical dams have been identified, various failure sequences should be considered to arrive at a suitably conservative estimate of the multiple-failure consequences.
5.6 Modeling Consequences of Seismic Dam Failure
Once a dam has been assumed to fail under seismic load, the consequences of dam failure will be developed through breach modeling and flood wave routing as discussed in Sections 7 and 9, respectively. However, assumptions regarding headwater and tailwater levels, as well as coincident flood flows are discussed here

DRAFT – 2013-06-21
Page 65
Staff Positions:
• If the dam failed under the 10-4 annual exceedance probability seismic hazard, assume that failure coincides with the peak water level from a 25-yr flood in the watershed above the dam.
• If the dam failed at half of the 10-4 annual exceedance probability seismic hazard, assume that failure coincides with the peak water level from a 500-yr flood in the watershed above the dam.
• In view of the uncertainties involved in estimating reservoir levels that might reasonably be expected to prevail at the time of failure, the default starting water surface elevation used in flood routings for evaluation of seismic failure consequences should be the maximum normal pool elevation (i.e. top of active storage pool). Other starting water surface elevations may be used, with appropriate justification. Justification should be based on operating rules and operating history of the reservoir. The operating history used should be of sufficient length to support any conclusions drawn. But consideration should be given to possible instances where the operating history and/or rules have been influenced by anomalous conditions such as drought.
• Reservoir and downstream tributary inflows should be consistent with the selected reservoir level. Hydrologically consistent headwater/tailwater relationships should be used in routing the flood wave.
5.7 Detailed Site Specific Seismic Hazard Analysis
When the screening approach described above indicates that a dam cannot be screened out based upon its design-basis information, a more detailed, site-specific seismic hazard evaluation is required if failure is not assumed. Approaches for such a detailed analysis are discussed below.
Staff Position:
• Because each dam and its immediate environment form a unique system, it is not feasible to provided detailed guidance that will be applicable in all cases. Therefore, detailed, site-specific seismic hazard analyses will be reviewed on a case-by-case basis. The following discussion is meant to provide a general overview of the pieces that would normally be part of a detailed seismic hazard evaluation.
5.7.1 Ground Shaking
Detailed estimates for ground shaking at the dam site can be developed using the same PSHA procedures discussed earlier, only using more detailed, site-specific information. This may take the form of more detailed seismic source characterization, attenuation relations or site response functions.
5.7.1.1 Seismic Source Characterization
Seismic source characterization is concerned with the identification of all the relevant potential earthquake sources. Earthquake sources typically consist of: 1) faults, and 2) areal or background seismic source zones. Fault sources are usually modeled as planar surfaces, where the parameters such as activity (expressed by either slip rate or recurrence

DRAFT – 2013-06-21
Page 66
interval), geometry (location, length, dip, and down-dip extent), sense of slip, segmentation (some segments may be more active than others), maximum magnitude (Mmax), and recurrence model (characteristic earthquake or maximum magnitude) are specified. For areal source zones, the parameters of interest are maximum magnitude, associated rate of activity, and recurrence model (e.g., exponentially truncated Gutenberg-Richter relationship, or just truncated exponential). The fault sources are primarily characterized using geological data, while the areal or background source zones are characterized using historical seismicity occurrence and magnitude data.
Many definitions exist for what constitutes an “active” or “potentially active” fault and hence what faults should be considered potential seismic sources. Simply put, most faults considered in a PSHA to be potential seismic sources are faults with evidence of Quaternary activity; i.e., faults that have documented or suspected evidence of displacement during roughly the last 1.6 million years. For most studies, all faults within approximately 50 km of the site are characterized, but for some sites, faults as far as 1000 km or more distant are included if they can have a significant impact on the hazard (such as large earthquakes originating on the Cascadia Subduction zone of western Washington, Oregon, and northern California, or the San Andreas fault in California). The U.S. Geological Survey (USGS), many state geological surveys, and various consulting companies have conducted studies of potentially active faults in the U.S. The USGS has produced catalogues describing the faults and other seismic sources used to develop the National Seismic Hazard Maps (e.g., the Quaternary Fault and Fold Database of the United States).
Seismic Sources for the CEUS In addition to the USGS seismic source catalogues (USGS, 2008), for the region designated the CEUS (United States east of the Rocky Mountains), a regional study was jointly conducted by USNRC, EPRI, and DOE during the period 2009-2011 to develop a comprehensive representation of seismic sources for nuclear plant seismic evaluation purposes. The results were published in USNRC (2012) and provide an acceptable source characterization model to use for seismic hazard studies.
Seismic Sources for the WUS In the Western United States (WUS), numerous studies have been conducted over the last 30 years or so that identify and characterize in one form or another most of the known or suspected Quaternary faults. For example, the U.S. Bureau of Reclamation has a large inventory of studies in the Western U.S. that include detailed seismic source characterizations. Much of this data has been compiled by the USGS and can be accessed at: http://earthquake.usgs.gov/hazards/qfaults/imsintro.php.
It should be emphasized that the USGS Quaternary fault compilation was done primarily to facilitate the development of the national seismic hazard maps, and many faults are not in the database, such as those that have low slip rates, or were characterized quite recently, or were characterized for private companies. Also, the quality of the data and level of study varies greatly for many faults. Finally, it also must be emphasized that for a critical facility, such as a dam, even faults with fairly low slip rates (~0.01 mm/yr) can be important if the fault is located close to the site and if the downstream consequences are significant. Therefore, in the WUS, development of seismic sources and the adequacy of the USGS National Seismic Hazard Map (USGS, 2008) should be determined on a site-specific basis.
5.7.1.2 Ground Motion Attenuation

DRAFT – 2013-06-21
Page 67
Ground-motion prediction equations (GMPEs) or attenuation relations relate the source characteristics of the earthquake and propagation path of the seismic waves to the ground motion at a site. The predicted ground motion is typically quantified in terms of a median value (a function of magnitude, distance, style of faulting, and other factors) and a probability density function of peak horizontal ground acceleration or spectral accelerations. GMPEs are statistical models developed by combining geophysical attenuation models with regression analysis of recorded strong motion databases. Ground motion parameters are typically expressed as functions of earthquake magnitude, distance from the rupture zone, the type of faulting, and site conditions. Because they are based on recorded strong motion data, GMPEs change with time as more strong motion data becomes available.
The state of the art in GMPEs for shallow crustal earthquakes is well-represented by relationships developed as part of the Next Generation Attenuation (NGA) Project sponsored by the Pacific Earthquake Engineering Research (PEER) Center Lifelines Program. The NGA models are based on an extensive database of strong ground motion recordings and were developed through the efforts of five selected attenuation relationship developer teams working in a highly interactive process with other researchers. These relationships have a substantially better scientific basis than earlier ground motion attenuation relationships. In order to model site conditions, most of the NGA ground motion attenuation relationships incorporate the input parameter VS30, which is the average shear-wave velocity in the upper 30 m at the site. Development of the database of strong motion recordings is discussed in Chiou et al. (2008) and the attenuation relationships are available on the PEER website: http://peer.berkeley.edu/products/rep_nga_models.html
In 2004, EPRI published a set of GMPEs for the CEUS, which was subsequently updated in 2006. A second update is scheduled to be released in 2015.
Staff Position:
• Ground motion prediction equations approved by the NRC for Recommendation 2.1 Seismic are acceptable for use in dam failure analysis for Recommendation 2.1 Flooding.
5.7.1.3 Site Response
Local site conditions can profoundly influence important characteristics of strong ground motion (e.g., amplitude, frequency content, direction). The extent of the influence depends upon the geometry and the material properties of subsurface materials, site topography, and the characteristics of the input motion. In particular, the characteristics of local soil deposits can have a significant impact on the ground motions experienced at the surface. Critical parameters that determine which frequencies of ground motion might experience significant amplification (or de-amplification) are the layering of soil and/or soft rock, the thicknesses of these layers, the initial shear modulus and damping of these layers, their densities, and the degree to which the shear modulus and damping change with increasing ground motion. The site response is typically addressed by developing amplification functions or amplification factors that relate the bedrock ground motions to motions at the ground surface. Methods to calculate possible site amplification are well-established, but at some sites the characterization of the subsurface may be limited.
It is well-known that topographic irregularities and alluvial basin geometry can have significant effects on ground motions (Kramer, 1996). Due to where they are typically sited, this effect should be considered in developing the site response for dams. In fact, the best

DRAFT – 2013-06-21
Page 68
known example of apparent topographic effects was observed at a dam site during the 1971 San Fernando earthquake (Trifunac and Hudson, 1971). Evaluation of these effects requires two- and in some cases three-dimensional analysis. At this time, only linear 2-D and 3D analyses are standard practice.
5.7.1.4 Development of Uniform Hazard Spectra
Uniform hazard spectra (UHS) are computed or developed from the seismic hazard curves. This is done by developing hazard curves (i.e. spectral acceleration vs. exceedance probability) for several vibration periods to define the response spectra. Then, for a given exceedance probability or return period, the ordinates are taken from the hazard curves for each spectral acceleration, and an “equal hazard” response spectrum is generated. Thus, the response spectra curves are generated for specified annual exceedance frequencies of interest.
5.7.1.5 Development of Acceleration Time-histories
For higher level studies, acceleration time histories are developed for the site that represent the seismic hazard at the return periods of interest. The selected ground motions are then used for dynamic analyses. A wavelet-based method is currently employed by Reclamation to produce acceleration time-histories through spectral matching to the 5% damping mean UHS at the return period of interest. Because the UHS calculated from the PSHA curves is only available for the horizontal component of the ground motion, the vertical-component response spectra used for spectral matching is found by scaling the UHS using estimated V/H ratios.
In addition to the response spectra, additional characteristics of the time history, such as phase spectra and strong shaking duration, are also needed to produce a time history using spectral matching. A suitable recording from an historic earthquake is used as the initial time history to provide the required characteristics for the spectral matching. This earthquake and the recording station should be of similar magnitude and distance as the earthquake event dominating the UHS. In some cases, the records from several different events should be used because of the differences in the ground motions produced by earthquakes with even similar magnitudes and distances. If there are no near-field strong ground motion recordings from historical earthquakes, synthetic accelerations generated by stochastic methods are used.
5.7.2 Fault Displacement Hazard Analysis
For some dam sites, the potential for surface fault displacement through the site or foundation is a concern. Two types of surface faulting are generally recognized: principal (or primary) and distributed (or secondary). Principal faulting occurs along the main fault plane (or planes) that is the locus of release of seismic energy. It basically accompanies the earthquake and at the surface, displacement is generally confined to a single narrow fault or a relatively narrow zone that is a few to several meters wide. Distributed, or secondary faulting, is displacement that occurs on a fault or fracture away from the primary rupture and can be quite spatially discontinuous. It may occur in response to an earthquake on another nearby fault (possibly due to ground shaking) or it may be due to a structural connection or linkage between the causative fault and the fault upon which the secondary displacement occurs. In either case, it can occur a few to several kilometers away from the causative fault. Distributed faulting can occur on a fault that is considered capable of principal surface
DRAFT – 2013-06-21
Page 69
rupture; however, distributed faulting displacement is typically less than that observed by primary faulting. For most dams, only primary fault displacement is considered.
Probabilistic fault displacement hazard analyses (PFDHA) can be performed in a manner analogous to that used for probabilistic ground motion. The results are represented by a hazard curve which shows annual occurrence of fault displacement values (i.e., the annual frequency of exceeding a specified amount of displacement). A recent example is the analysis conducted for Lauro Dam near Santa Barbara, California (Anderson and Ake, 2003). This analysis followed the methodology that was used for the proposed Yucca Mountain, Nevada nuclear waste repository (Stepp et al. 2001; Youngs et al., 2003).
5.8 Detailed Analysis of Seismic Capacity of the Dam
Once the earthquake ground motions or displacements have been determined, the impact they have on the dam and its appurtenances must be determined. The extent and type of analysis required for the seismic evaluation of a dam depends on the hazard potential classification, level of seismic loading, the site conditions, type and height of dam, construction methods, as-built as well as current material properties, and engineering judgment. Consistency should be maintained between the level of analysis and level of effort given to the development of seismotectonic data, the ground motion parameters, and the site investigation. For example, a highly refined structural analysis based on an assumed earthquake loading is not reasonable in most cases. Likewise, a highly refined structural analysis should use site-specific ground motions, not assumed values.
In general, it is the most cost-effective for seismic analyses to begin with the simplest conservative method appropriate to the problem. If the structure is judged able to resist the earthquake loading within certain safety margins from the initial analysis, then further analysis should not be necessary. If further studies are needed, they would be progressively more detailed and the structure evaluated accordingly. Regardless of the method of analysis, the final evaluation of the seismic safety of the dam will include engineering judgment and past experience, not just numerical results of the analyses.
In some cases, the analyses may indicate that the dam is either clearly safe or clearly unsafe. Frequently, however, judgments concerning the safety of the dam must take into account not only the results of the analyses but also the level of confidence that can be put in those analyses and underlying assumptions and, to some extent, the consequences of misjudging the level of uncertainty. Staff Positions
• Seismic capacity studies should consider seismic capacity for both the maximum normal operating pool level (i.e. top of active storage) and average pool level (i.e 50% exceedance duration pool level calculated using average daily water levels for the period of record). The average non-flood tailwater level should be used with both headwater conditions above.
5.8.1 Concrete Dams

DRAFT – 2013-06-21
Page 70
Concrete dams should be analyzed for the affects of ground shaking and surface displacements. Cracking in the dam as well as displacement of foundation materials, leading to sliding or overturning are common concerns.
5.8.1.1 Sliding and Overturning Stability
Concrete dams (gravity, arch, or buttress dam) and sites are very unique and should all be evaluated for stability under earthquake loading.
Excessive cracking is a safety concern for concrete gravity dams subjected to earthquakes, which can lead to potential instability of the dam from sliding or overturning. Sliding can be on an existing plane of weakness in the dam or foundation or along planes of weakness formed by excessive cracking of the concrete above or at the foundation-dam interface. For concrete dams, sliding instability is possible due to an earthquake-induced vibratory motion on a plane of weakness at, above, or below the foundation-dam interface.
For an arch dam, sliding instability is more likely to occur by failure of the abutment support because the arching effect provides additional resistance to sliding within the dam. In general, instability of gravity and arch dams caused by excessive cracking of the concrete is most likely to occur in the upper half of the dam.
Buttress dams also are particularly vulnerable to cross-valley shear motions that can result in tipping of the buttresses and loss of support for the reinforced concrete slab.
Of the two possible types of instability discussed above, historical experience shows that foundation (abutment) induced failure is often the chief source of concern for concrete dams. In contrast to the dam itself, the supporting medium consists of natural materials of varying composition, irregular joints, and planes of weakness. The strength of this medium is generally estimated from exploratory borings and tests on only a small fraction of the material present. Key zones of weakness are critical and often difficult to detect.
In the past psuedostatic methods were commonly use to analyze dam stability. However, given the widespread availability of structural dynamics software, pseudostatic methods are generally discouraged today and should only be used for screening from further consideration those dams where a seismic stability failure is highly improbable. An example of such a screening analysis is given in FEMA (2005):
FEMA (2005) states that for a concrete gravity dam on a rock foundation with no known structural deficiencies, such as significant cracks in the structure, major weak joints, or adversely oriented discontinuities in the foundation, stability during an earthquake loading based on previous case histories and/or analyses should be satisfactory if all the following conditions are satisfied:
• The dam is well-constructed (quality concrete and lift joints) and is in good condition. • Peak bedrock accelerations are 0.2g or less. • The resultant location for a gravity dam under static conditions is within the middle
1/3 of the base and the factor of safety against sliding is acceptable for static conditions.
Structures that fail to meet the prescribed pseudostatic stability requirements (i.e., sliding safety factors and resultant location) should be subjected to in-depth study using dynamic analyses to assess the demands placed on the dam and foundation during an earthquake.
DRAFT – 2013-06-21
Page 71
Dynamic time-history analyses are used to determine the displacements and stresses experienced by the dam and foundation. Evaluation of the results is used to determine if there is a risk of a stability failure. Staff Positions:
• Pseudostatic methods are generally discouraged from use in stability analysis of structures.
• Structures that fail to meet prescribed pseudostatic stability requirements (i.e., sliding safety factors and resultant location) should be subjected to in-depth study using dynamic analyses to assess the performance of the dam and foundation during an earthquake.
• Detailed evaluation of the seismic performance of a concrete dam should be performed using (as appropriate) linear-elastic response spectrum analysis, linear-elastic time-history analysis, or non-linear time-history methods. Guidance provided on these methods in FEMA Dam Safety Guidelines (FEMA, 2005) should be used to perform the evaluation.
5.8.1.2 Dynamic Analysis
Results of dynamic analyses are generally evaluated in terms of compressive and tensile strengths of the concrete. The compressive stresses resulting from the combination of static and earthquake loads usually remain below the dynamic strength of the concrete. However, since the mere occurrence of tensile stresses does not necessarily lead to failure, the significance of predicted tensile stresses is not evaluated as easily. The number and amplitudes of stress cycles that exceed the dynamic tensile strength are taken into account for this purpose in linear analysis.
To evaluate the effects of stresses that exceed the tensile strength, sound engineering judgment is required and should be based on the expected effects of nonlinear behavior and the past performance of dams under similar earthquake loadings. To estimate the extent of cracking, one must consider nonlinear behavior leading to stiffness degradation and energy absorption. Nonlinear behavior from cracking reduces the stiffness of the dam and shifts the dam’s response into other frequency ranges of the ground motion. The energy level of the earthquake corresponding to the frequency of the cracked structure may or may not be more severe than when uncracked. As a result, the peak values of tensile stress and the extent of tensile zones may increase or decrease, and large tensile stresses given by linear elastic analysis may or may not necessarily indicate an unsafe condition. They may, in fact, be “artifacts” of the analysis rather than real behavior.
A nonlinear analysis should be performed if the response of the dam would be influenced significantly by nonlinearity from material behavior or changes in geometry. For an arch dam, this might include 1) cantilever tensile stresses larger than the tensile strength of the concrete over significant areas of the dam; 2) a long duration earthquake; 3) opening and closing of contraction joints indicated by simultaneous arch tensions on the upstream and downstream faces; and 4) large displacements or distortions of the arch.
Staff Positions:

DRAFT – 2013-06-21
Page 72
• A nonlinear analysis should be performed if the response of the dam would be influenced significantly by nonlinearity from material behavior or changes in geometry.
• Detailed evaluation of the seismic performance of a concrete dam should be performed using (as appropriate) linear-elastic response spectrum analysis, linear-elastic time-history analysis, or non-linear time-history methods. Guidance provided on these methods in FEMA Dam Safety Guidelines (FEMA, 2005) should be used to perform the evaluation.
5.8.2 Embankment Dams
The most common concern for embankment dams is deformation and/or liquefaction of the embankment or foundation. These may fail the dam directly due to overtopping or indirectly due to cracking and subsequent internal erosion. The deformation may be due to surface displacement, but ground shaking is a more common concern.
If a dam is deformed by earthquake excitation or fault displacement, the deformations can cause cracks in the dam and/or disrupt internal filters, either of which could lead to failure of the dam by erosion. Cracks are most likely to occur at interfaces with concrete structures (e.g., spillway walls) or at abrupt changes in the embankment’s cross section. There is also evidence that shaking could precipitate piping even without formation of a crack if the dam is already on the verge of piping. The amount of deformation a dam can withstand without risk of failure by erosion through cracks depends on the materials in the dam and foundation, the details of internal zoning (filters, drains, and cutoff), the reservoir elevation at the time of the earthquake, and the nature and location of appurtenant structures. Should there be conduits through the embankment, deformation of the dam can rupture them or cause joints to separate, leading to erosive failure by either creating an unfiltered exit for seepage or exposing the embankment or foundation to full reservoir head where not intended. Erosion along intact conduits has also caused dam failures.
5.8.2.1 Deformation Analyses
Direct methods of assessing deformation model the design earthquake, the dam, and foundation to calculate the expected deformation. There are also indirect methods to predict the response of the embankment and foundation based on empirical observations. Post-earthquake stability analysis can, in a sense, also be considered an indirect prediction of deformation – if the post-earthquake factor of safety is high, the deformations should be limited to a few feet except under very severe loading. The magnitude of deformations is very dependent on the strengths of the materials involved. During strong shaking, permanent deformations (usually small) may occur simply because the dynamic stresses temporarily exceed the available strength. In saturated soils, there is frequently some loss of shearing resistance due to an increase in pore water pressure when shaken. This increases the dynamic deformations over what they would be with no strength loss. In very loose, contractive soils, the strength may become a small fraction of its static, drained value due to excess pore-water pressure (liquefaction). Very large deformations can result, driven by gravity even after the shaking ends. There is an intermediate condition known as "cyclic mobility," in which the shearing resistance is initially very low due to excess pore pressure, but increases with larger shear strains, helping to prevent gross instability but still permitting significant deformation.
DRAFT – 2013-06-21
Page 73
Deformation analyses can be made for three conditions: 1) liquefaction would not occur; 2) liquefaction may occur but instability would not; and 3) liquefaction may occur, resulting in instability. In the first two conditions, judgment is required to determine whether the predicted deformations along the critical failure surfaces are small enough that cracking of the embankment/foundation materials that could eventually cause a piping failure of the dam does not occur. A determination also must be made whether the post-earthquake sliding factors of safety and available freeboard are adequate to ensure the dam would not be overtopped and would be able to safely retain the reservoir. If there are no potentially liquefiable materials present, this can usually be done by the simple Newmark sliding-block approach. In situations where excess pore pressure could develop, it may be necessary to conduct more rigorous finite-element or finite-difference analyses.
If the results of post-earthquake sliding stability analyses for critical failure surfaces indicate a safety factor well above 1.0 (e.g., 1.25 or greater) using the strengths expected after the earthquake, experience from past earthquakes suggests that deformations will be small and the dam will perform satisfactorily (FEMA, 2005). Confidence in the safety of the dam decreases when the factor of safety against triggering of liquefaction is 1.0 or less and a post-earthquake sliding factor of safety less than or approaching 1.0 is calculated using residual shear strengths for materials assumed to be liquefied. In general, many analyses have shown that when a wedge or circular sliding surface has a low post-earthquake sliding factor of safety, the deformations on these sliding planes will be excessive. If these failure planes are critical to the overall integrity of the dam, deformations may lead to failure of the dam by overtopping or internal erosion.
FEMA (2005) provides a screening-level analysis for embankment dams similar to that discussed for concrete dams above. FEMA (2005) suggests that for a dam and foundation not subject to liquefaction, minor deformation may take place but should not lead to failure if all of the following conditions are satisfied:
• Dam and foundation materials are not subject to liquefaction and do not include loose soils or sensitive clays.
• The dam is well built and compacted to at least 95% of the laboratory maximum dry density (modified Proctor test), or to a relative density greater than 80%.
• The slopes of the dam are 3:1 (H:V) or flatter, and/or the phreatic line is well below the downstream slope of the embankment.
• The peak horizontal acceleration at the base of the embankment is no more than 0.2 g.
• The static factors of safety for all potential failure surfaces (other than shallow surficial slides) are greater than 1.5 under loading and pore-pressure conditions expected immediately prior to the earthquake.
• The freeboard at the time of the earthquake is at least 3% to 5% of the embankment height and not less than 3 feet (0.9 m). (Freeboard requirements to accommodate reservoir seiche waves or coseismic movement of faults at the dam site or in the reservoir must be considered as a separate issue.)
• There are no critical appurtenant features that would be harmed by small movements of the embankment, or that have the potential to cause cracks that would allow internal erosion.
If these conditions are not satisfied, more detailed study is required. This may include assessment of liquefaction potential, post-earthquake stability analysis, and/or deformation analysis.

DRAFT – 2013-06-21
Page 74
A comprehensive review of the factors to be considered in the earthquake resistance design of dams, as well as a review and commentary on the field performance of dams during earthquakes, can be found in Seed (1979). Regulatory Guide 1.198, “Procedures and Criteria for Assessing Seismic Soil Liquefaction at Nuclear Power Plants” (USNRC, 2003) provides guidance on acceptable methods for evaluating the potential for earthquake-induced instability of soils resulting from liquefaction and strength degradation.
Staff Positions:
• Detailed seismic evaluation of embankment dams should include the following (as appropriate): post-earthquake stability analysis, deformation analysis, and assessment of liquefaction potential.
• If there are no potentially liquefiable materials present, evaluation can usually be done by the Newmark sliding-block approach. In situations where excess pore pressure could develop, more rigorous finite-element or finite-difference analyses should be conducted.
• Embankment dams should be evaluated to ensure sufficient factors of safety against sliding of critical failure surfaces.
• Embankment dams should be evaluated to ensure sufficient factors of safety against triggering of liquefaction.
6. Other (Sunny Day) Failures
Dam failures not caused by a concurrent extreme flood or seismic event may arise from a variety of causes. These failures are often referred to as sunny day or fair weather failures. These dam failures may occur because of failures of embankment material, foundations, or appurtenances such as flood gates, valves, spillways, conduits, and other components. The possibility of these failures should be carefully evaluated to ensure that all plausible mechanisms for flooding from dam breaches and failures at and near a site are considered. American National Standards Institute/American Nuclear Society Standard 2.8-1992, “Determining Design Basis Flooding at Nuclear Power Plant Sites” (ANSI/ANS, 1992), lists the potential nonhydrologic and nonseismic causes for partial or complete dam failure. That list, with minor modifications, is:.
• Deterioration of concrete (e.g., weathering, cracking, chemical growth)
• Deterioration of embankment protection (e.g., grass cover, riprap, or soil cement)
• Excessive saturation of downstream face or toe of embankment. • Excessive embankment settlement. • Cracking of embankment due to uneven settlement. • Excessive pore pressure in structure, foundation, or abutment. • Excessive loading due to buildup of silt load against dam. • Excessive leakage through foundation. • Embankment slope failure. • Leakage along conduit in embankment. • Channels from tree roots or burrowing. • Landslide in reservoir.
More detailed discussion of failure modes by dam type is provided below.
DRAFT – 2013-06-21
Page 75
Staff Positions:
• Sunny-day failures cannot be screened out (see discussion in Section 1.4). • An exception to the preceding staff position is that dams failed due to hydrologic and
seismic events shown to have negligible impacts at the site do not require evaluation for the sunny-day scenario since the sunny-day scenario is bounded by the other two events. The level of effort required for evaluating sunny-day failure is typically lower since it only involves identifying the worst-case individual or cascading failure scenario.
• Sunny-day failures such as those listed above should be carefully evaluated to ensure that all plausible mechanisms for flooding from dam breaches and failures at and near a site are considered.
• A sunny day breach can be used to model piping failures for hydrologic, geologic, structural, seismic, and human-influenced failure modes.
6.1 Overview of Sunny Day Failures by Structure Type
6.1.1 Concrete Dams
Several potential failure initiators are common to all types of concrete dams. These include plugging of drains (leading to increased uplift pressures), gradual creep that reduces the shear strength on potential sliding surfaces, and degradation of the concrete from alkali-aggregate reaction, freeze-thaw, or sulfate attack.
For concrete gravity dams founded on rock, the leading cause of dam failures has been related to sliding on planes of weakness within the foundation, most typically weak clay or shale layers within sedimentary rock formations. For concrete gravity dams founded on alluvial soils, the leading cause of failure is piping or “blowout” of the soil material from beneath the dam. Failures have also occurred along weak lift joints within dams.
Historically, arch dam failures have resulted primarily from foundation deficiencies. The predominant mode of failure is sliding of large blocks (bounded by geologic discontinuities) within the foundation or abutments. Typically, these failures have been sudden, brittle, and have occurred on first-filling of the reservoir. Concrete arch dams that have performed well under normal operating conditions will likely continue to do so unless something changes. Changes could result from plugging of drains leading to an increase in foundation uplift pressures, possible gradual creep that reduces the shear strength on potential sliding surfaces, or degradation of the concrete from alkali-aggregate reaction, freeze-thaw deterioration, or sulfate attack. Some of these may be difficult to detect. A review of instrumentation results can be helpful. For example, if piezometers or uplift pressure gauges indicate a rise in pressures, and weirs indicate a reduction in drain flows, the drains may be plugging leading to higher uplift and potentially unstable conditions. If conditions appear to be changing, risk estimates are typically made for projected conditions as well as current conditions.
Because of high unit loads underneath the buttresses, concrete buttress dams are subject to failures initiated by weakness within the foundation. Such weakness may cause the foundation to undergo unacceptable settlement or shearing. Sliding on planes of weakness within the foundation may also occur. Concrete buttress dams founded on alluvial soils are subject to failure initiated by piping or “blowout” of the soil material from beneath the dam. Deformation of the abutment can also lead to failure since unforeseen movement in the
DRAFT – 2013-06-21
Page 76
abutment will induce stresses in a buttress that may not have been considered in its design. Particular attention must be paid to the quality and performance of the concrete in the face slab. Because of its relative thinness it cannot withstand excessive deterioration, pitting, or spalling that will decrease the strength of the slab. Exposure and corrosion of reinforcing steel can reduce the capacity of reinforced concrete elements.
6.1.2 Embankment Dams
Historically, the most common failure modes for embankment dams are initiated by or heavily influenced by various seepage-related internal erosion phenomena. Internal erosion phenomena are the predominant mechanism for “sunny day” (nonhydrologic, nonseismic) failures of embankment dams. The term internal erosion is used here as a generic term to describe erosion of particles by water passing through a body of soil. “Piping” is often used generically in the literature, but actually refers to a specific internal erosion mechanism. Several types of internal erosion have been observed in embankments.
Classical piping occurs when soil erosion begins at a seepage exit point, and erodes backwards, supporting a “pipe” or “roof” along the way. Progressive erosion can occur when the soil is not capable of sustaining a roof or a pipe. Soil particles are eroded and a temporary void grows until a roof can no longer be supported, at which time the void collapses. This mechanism is repeated progressively until the core is breached or the downstream slope is over-steepened to the point of instability. Suffosion or internal instability occurs when the finer particles of a soil are eroded through the coarser fraction of that soil, leaving behind a coarsened and more permeable soil skeleton. The loss of material can lead to voids and sink holes.
Scour occurs when tractive seepage forces along a surface (i.e. a crack within the soil, adjacent to a wall or conduit, or along the dam foundation contact) are sufficient to move soil particles into an unprotected area. Once this begins, a process similar to piping or seepage erosion could result.
Heave can occur where an impervious layer overlies more pervious material near the downstream toe of a dam. A buildup of pressure beneath the impervious layer can lead to high uplift forces capable of moving material from and breaching of the impervious layer. This in turn can lead to rapid development of piping or seepage erosion (unless the pressure is relieved to the point where the seepage velocities are insufficient to move soil particles). This is sometimes referred to as “blowout”, especially if it occurs in a local area.
The various internal erosion phenomena discussed above may affect the embankment (including spillway walls), the foundation or both. The zone of contact between earth materials and conduits through the embankment or its foundations and around drains is an area prone to internal erosion phenomena. More detailed discussion of internal erosion and piping for earthen dams is provided in USBR (2011).
6.2 Analysis of Sunny Day Failures
Analysis of sunny day failure can be organized into three basic steps:
1. Assessment of potential failure modes 2. Breach modeling 3. Flood wave routing
DRAFT – 2013-06-21
Page 77
Failure modes and assumptions regarding initial water surface elevation used in breach modeling and flood routing are discussed below. The details of breach modeling are discussed in Section 7 and details of flood routing are discussed in Section 9. Base flow conditions for a sunny day failure are typically ignored because of the small discharge and volume compared to that of a dam breach. As a general guidance, base flow can be ignored if the dam breach flow is two times greater than the base flow. Where base flow is considered, the discharge is typically estimated based on reported base flows through the dam’s outlet works or from stream gage records. Additional inflow (e.g. from a storm event) is not required when analyzing a sunny day breach.
6.2.1 Sunny Day Failure Modes
An essential element in analyzing sunny day failure is assessment of credible failure modes. Common sunny-day failure modes for various dam types are discussed in Section 6.1. That discussion is fairly comprehensive, but it is not meant to be exhaustive. The purpose of the discussion is to inform the process of identifying potential failure modes. In general, identifying potential failure modes will required thoroughly reading all relevant background information on a dam, including geology, design, analysis, construction, operations, dam safety evaluations, and performance monitoring documentation.
6.2.2 Initial Water Surface Elevation
Breaching should be assumed and breaching scenario(s) should be assessed, if sunny day failure modes cannot be ruled out. Section 7 discusses breach modeling in detail, but does not discuss assumptions regarding initial water surface elevations used in the breach modeling.
Staff Position:
• In view of the uncertainties involved in estimating reservoir levels that might reasonably be expected to prevail at the time of failure, the default starting water surface elevation used in flood routings for evaluation of overtopping should be the maximum normal pool elevation (i.e. top of active storage pool). Other starting water surface elevations may be used, with appropriate justification. Justification should be based on operating rules and operating history of the reservoir. The operating history used should be of sufficient length to support any conclusions drawn (e.g., 20 years or more). But consideration should be given to possible instances where the operating history and/or rules have been influenced by anomalous conditions such as drought.
DRAFT – 2013-06-21
Page 78
7. Dam Breach Modeling
The breach is the opening formed in a dam when it fails and the aim of breach analysis is estimation of the resulting reservoir outflow hydrograph. Modeling of the breach development process has typically been one of the greatest sources of uncertainty in dam failure analysis, and is especially important when the distance from the dam to the locations or populations of interest is small, and routing effects are minimized (Gee, 2008; Wahl 2004, 2010).
The simplest approach to breach modeling is to assume that the dam fails completely and instantaneously. While this assumption is convenient when applying simplified analytical techniques for analyzing dam-break flood waves, and is somewhat appropriate for concrete arch dams, it is not considered realistic for earthen dams and concrete gravity dams, which tend to fail partially and/or progressively. Concrete gravity dams tend to have a partial breach (as one or more monolith concrete sections are forced apart by the escaping water), although the time for breach formation is in the range of a few minutes. Earthen dams do not tend to fail completely, nor do they tend to fail instantaneously. Dam breach analysis of composite dams (dams that include both concrete and earthen sections) should consider the failure of the portion or portions of the dam that would produce the largest peak outflow.
7.1 Breach Modeling for Concrete Dams
In most cases where breach of a concrete dam is considered, one or more sections of the dam deemed most susceptible to failure (based on engineering analysis) are assumed to fail instantaneously. The breach size and shape are determined by considering the size and shape of the failed section(s), then a weir formula or hydraulic simulation software package is used to compute the outflow hydrograph and/or peak outflow.
Concrete gravity dams tend to have a partial breach as one or more monoliths sections formed during construction of the dam are forced apart and overturned by the escaping water. The time for breach formation depends on the number of monoliths that fail in succession, but is typically on the order of minutes. The challenge of modeling breach of concrete dams is in predicting the number of monoliths that may be displaced or fail. However, by using a dam-breach flood prediction model and making several applications of the model wherein the breach width parameter representing the combined lengths of assumed failed monoliths is varied in each application, the resulting reservoir water surface elevations can be used to indicate the extent of reduction of the loading pressures on the dam. Since the loading diminishes as the breach width increases, a limiting safe loading condition which would not cause further failure may be estimated (Fread, 2006).
Unlike concrete gravity dams, concrete arch dams tend to fail completely and are assumed to require only a few minutes for the breach formation. The shape of the breach is usually approximated as a rectangle, or a trapezoid. Buttress and multi-arch dams can be modeled in a similar fashion, where sections are assumed to fail completely.
7.2 Breach Modeling of Embankment Dams
For earthen dams, the failure process often begins when appreciable amounts of water flow over or around the dam face and begins to erode the face of the dam. In general, the most
DRAFT – 2013-06-21
Page 79
erosive flow occurs on the downstream slope, where the velocity is highest and where the slope makes it easier to dislodge particles and move them away.
On dams that have been overtopped by floods, severe erosion has often been observed to begin where sheet flow on the slope meets an obstacle, such as a structure, a large tree, or the groin, creating local turbulent flow. Erosion generally continues in the form of "headcutting," upstream progression of deep eroded channel(s) that can eventually reach the reservoir. Pavement on the crest may be of some value in slowing head cutting once the gullies reach the crest, but should not be expected to affect initiation.
For cohesive soils, the failure mechanism is typically headcut initiation and advance. A small headcut is typically formed near the toe of the dam and then advances upstream until the crest of the dam is breached. For cohesionless soils, the failure process typically initiates as a result of tractive stresses from the flow removing material from the downstream face, but then progresses as headcut advance once a surface irregularity is formed. Predicting whether breach initiation and formation will occur can be a complicated procedure. Several factors have been shown to be important:
• Depth and duration of overtopping • Potential concentration of overtopping flows at dam crest due to camber or low spots • Potential concentration of overtopping flows on the dam face, along the groins or at
the toe of the dam • Erosional resistance of materials on the downstream face and in the downstream
zones of the embankment • Whether the dam crest is paved • Whether a parapet wall is provided and the potential for the wall to fail before or after
the dam is overtopped
For embankment dams, the failure typically begins at a point on the top of the dam and expands in a generally trapezoidal shape. The water flow through the expanding breach acts as a weir; however, depending on conditions such as headwater and tailwater, various flow characteristics can be observed during a breach development including weir flow, converging flow, and channel flow.
Breach analysis for earthen and rockfill embankment dams is typically more complex than for other dam types. As mentioned above, failure of embankment dams is typically progressive. Failure progression differs for overtopping and piping failures (the two most common failure modes for earthen dams), as described below.
• In the case of overtopping, once a developing breach has been initiated, the discharging water will progressively erode the breach until either the reservoir water is depleted or the breach resists further erosion. Erosion processes typically result in the progressive widening and deepening of the breach. In some cases, the breach will deepen until the bedrock foundation or some other erosion resistant strata is encountered. At this point, the breach depth stays approximately constant while the breach continues to widen. The final breach shape is often modeled as trapezoidal (see Figure 21).
• Piping is the term used to describe an array of internal erosion failure modes that can be very different in their initial stages, but all cause the breach opening in the dam to initially form at some point below the top of the dam. As erosion proceeds, the "pipe" through the dam enlarges until the top of the dam collapses, or the breach
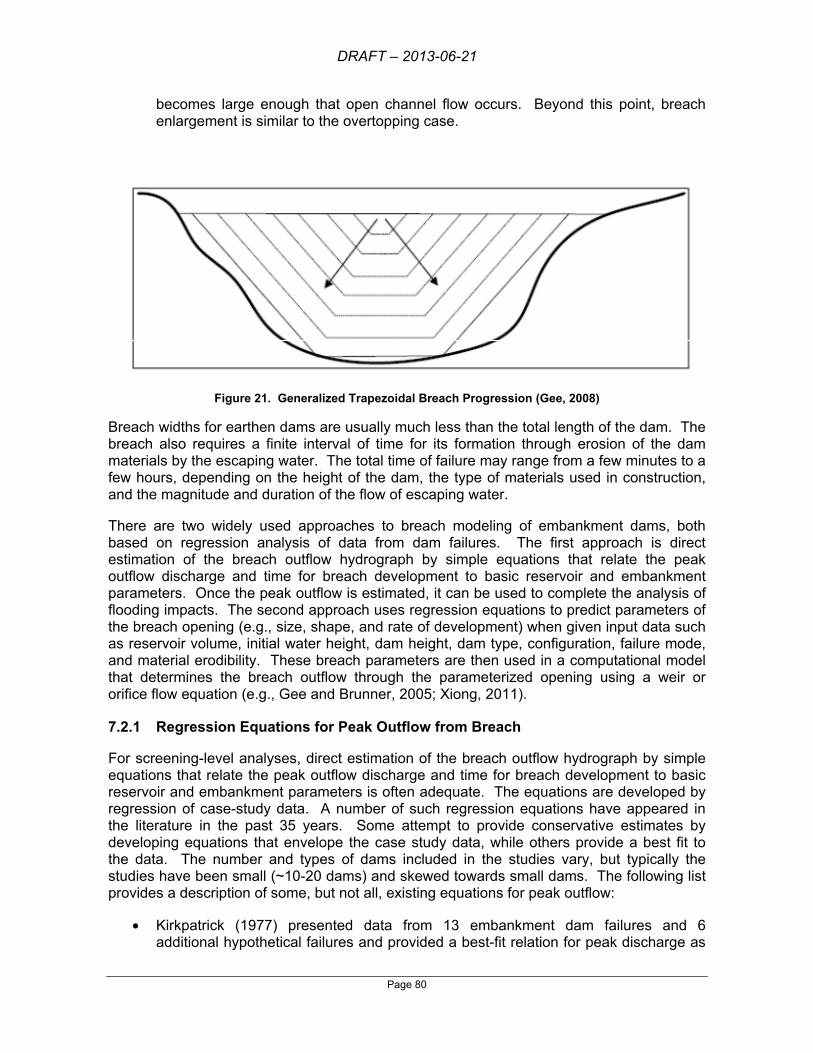
DRAFT – 2013-06-21
Page 80
becomes large enough that open channel flow occurs. Beyond this point, breach enlargement is similar to the overtopping case.
Figure 21. Generalized Trapezoidal Breach Progression (Gee, 2008)
Breach widths for earthen dams are usually much less than the total length of the dam. The breach also requires a finite interval of time for its formation through erosion of the dam materials by the escaping water. The total time of failure may range from a few minutes to a few hours, depending on the height of the dam, the type of materials used in construction, and the magnitude and duration of the flow of escaping water.
There are two widely used approaches to breach modeling of embankment dams, both based on regression analysis of data from dam failures. The first approach is direct estimation of the breach outflow hydrograph by simple equations that relate the peak outflow discharge and time for breach development to basic reservoir and embankment parameters. Once the peak outflow is estimated, it can be used to complete the analysis of flooding impacts. The second approach uses regression equations to predict parameters of the breach opening (e.g., size, shape, and rate of development) when given input data such as reservoir volume, initial water height, dam height, dam type, configuration, failure mode, and material erodibility. These breach parameters are then used in a computational model that determines the breach outflow through the parameterized opening using a weir or orifice flow equation (e.g., Gee and Brunner, 2005; Xiong, 2011).
7.2.1 Regression Equations for Peak Outflow from Breach
For screening-level analyses, direct estimation of the breach outflow hydrograph by simple equations that relate the peak outflow discharge and time for breach development to basic reservoir and embankment parameters is often adequate. The equations are developed by regression of case-study data. A number of such regression equations have appeared in the literature in the past 35 years. Some attempt to provide conservative estimates by developing equations that envelope the case study data, while others provide a best fit to the data. The number and types of dams included in the studies vary, but typically the studies have been small (~10-20 dams) and skewed towards small dams. The following list provides a description of some, but not all, existing equations for peak outflow:
• Kirkpatrick (1977) presented data from 13 embankment dam failures and 6 additional hypothetical failures and provided a best-fit relation for peak discharge as
DRAFT – 2013-06-21
Page 81
a function of depth of water behind the dam at failure. This study included data from the failure of one concrete gravity dam (St. Francis Dam, in California) because, at the time of the study, this dam was thought to have failed due to piping in the abutment. More recent studies have questioned that explanation.
• The Soil Conservation Service (SCS, 1981) used the 13 case studies by Kirkpatrick to develop a power law equation relating the peak dam failure outflow to the depth of water behind the dam at time of failure. This was meant to be an enveloping relation although three data points are slightly above the curve.
• USBR (1982) extended this work and proposed a similar relation for peak outflow using case study data from 21 dams. This study also proposed a relation for attenuation of the peak flow with distance downstream. USBR (1983) analyzed 6 case studies of dams with large storage-to height- ratios and proposed a modification to the USBR (1982) peak discharge equation which included reservoir storage as a parameter.
• Singh and Snorrason (1982,1984) used 10 real dam failures and 8 simulated failures to develop peak dam failure outflow as functions of dam height and reservoir storage.
• MacDonald and Langridge-Monopolis (1984) developed best-fit and envelope curves for peak outflow from studies of 42 breached earthfill dams.
• Costa (1985) developed envelope curves and best-fit regression equations for peak flow from 31 breached dams as functions of dam height, storage volume at time of failure and the product of these two parameters. Costa’s study included both constructed and natural dams, as well as the St. Francis Dam failure.
• Froehlich (1995a) developed a best-fit regression equation for peak discharge based on reservoir volume and head, based on 22 case studies. He also presented a procedure for determining confidence intervals for the estimates.
• Pierce et al. (2010) conducted a study that compares several of the equations described above to each other and to a database developed by the U.S. Bureau of Reclamation (USBR, 1998). This study provides insights into the degree of conservatism in the equations studied.
Staff Position:
• For screening-level analysis, use of simple equations that relate the peak outflow discharge to basic reservoir and embankment parameters is acceptable with adequate justification. The list above describes several available regression equations for peak outflow. Selection of candidate methods should consider the assumptions inherent in the models and their applicability to the dam failure scenario being considered. Sensitivity studies should be performed on a reasonable variation of input parameters, when applicable. If there are multiple applicable models, a study should be performed to evaluate the effect of model selection (and input parameter sensitivity, when applicable) on the results of the analysis. Justification for the chosen model and input parameters should be documented, including results of sensitivity studies.
7.2.2 Regression Equations for Breach Parameters
Regression equations have been developed to predict parameters of the breach opening (e.g., size, shape, and rate of development) when given input data such as reservoir volume, initial water height, dam height, dam type, configuration, failure mode, and material erodibility. These breach parameters are then used in a computational model that
DRAFT – 2013-06-21
Page 82
determines the breach outflow through the parameterized opening using a weir or orifice flow equation. Wahl (2010) suggests that one of the main advantages of using empirical parametric regression equations is that the user can exert some control over the breach parameters used in the model, and thus account for site-specific factors. A large number of relationships have been published in the last 35 years. Staff members of the U.S. Bureau of Reclamation, the U.S. Army Corps of Engineers, and others have compiled extensive reviews of the most widely used regression-based approaches for breach parameter estimation, including discussions of uncertainties in the methods [Gee, 2008; Wahl, 2004,2010; Washington State Department of Ecology (WSDE), 2007; Colorado Department of Natural Resources (CODNR), 2010].
The list below provides descriptions of some, but not all, of the available regression models for breach parameters:
• Johnson and Illes (1976) published a classification of failure configurations for earth-fill, gravity, and arch dams. The breach shape for earthen dams was described as varying from triangular to trapezoidal as the breach progressed.
• Singh and Snorrason (1982) conducted a study of 20 dam failures and noted that breach width was generally between two and five times the dam height. They also found that the breach formation time was generally 15 minutes to 1 hour and the maximum overtopping depth prior to failure (for overtopping failures) ranged from approximately 0.5 foot to 2 feet.
• Based on 42 dam failure case studies, MacDonald and Langridge-Monopolis (1984) proposed a “breach formation factor,” defined as the product of the volume of breach outflow and the depth of water above the dam. They related this factor to the volume of material eroded from the dam’s embankment. The amount of water to pass through the breach is not known before breach analysis occurs; however, the entire volume of the reservoir can be used as a starting estimate (Gee, 2008). Based on their study, MacDonald and Langridge-Monopolis also concluded that the breach can be assumed to be trapezoidal with a side slope of 0.5H:1V. The study further presented an envelope equation for the breach formation time for earthfill dams.
• Based on a study of 52 earthen embankment dam breaches, Singh and Scarlatos (1988) determined that the ratio of top and bottom breach widths ranged from 1.06 to 1.74, with an average value of 1.29. They also noted that the majority of breach formation times were less than 1.5 hours and most were less than 3 hours.
• In 1995, Froehlich developed equations for breach width and breach formation time based on a total of 63 case studies (Froehlich, 1995a). Froehlich suggested using a breach side slope factors of 1.4 for overtopping failures and 0.9 for other failure modes. Froehlich (2008) provided updated breach parameter equations based on data collected from 74 embankment dam failures. He also used the new equations and their uncertainties in a Monte Carlo simulation to estimate the degree of uncertainty in predictions (Froehlich, 2008).
• Xu and Zhang (2009) used a database of 182 earth and rockfill dam failure cases. A multiparameter nonlinear regression was used to develop empirical relationships between five breaching parameters (breach depth, breach top width, average breach width, peak outflow rate, and failure time) and five selected dam and reservoir control variables (dam height, reservoir shape coefficient, dam type, failure mode, and dam erodibility). A significant feature of this study is that nearly one-half of the 182 case studies addressed failure of dams higher than 15 m (a commonly used metric for large dams). However, the majority of these case studies are of dam
DRAFT – 2013-06-21
Page 83
failures in China, which have not been subject to independent review by the U.S. dam safety community. Another feature is that Xu and Zhang’s relations explicitly include erodibility of embankment soils. Their study showed that breach parameters are very sensitive to the selected erodibility index (dam erodibility was found to be the most important factor, influencing all five breaching parameters). Review of the Xu and Zhang paper by NRC staff has revealed several concerns. The Xu and Zhang paper does not provide clear criteria for selecting the erodibility index. Their paper also has an internally inconsistent treatment of breach formation time and time to failure, which leads to uncertainty in how these definitions were applied in the case studies supporting their regression analysis. In addition, discussions with staff from USBR and USACE indicate that the Xu and Zhang treatment of failure time is not consistent with how this parameter is applied in widely used hydraulic models (e.g., HEC-RAS). Use of the Xu and Zhang failure time could thus lead to invalid results. There is also concern that the Xu and Zhang relation for failure time may be biased in favor of longer times (Wahl, 2013; Brunner, 2013).
Staff Position:
• The state of practice in dam breach modeling shows a clear preference for regression-based approaches. The preferred approach uses regression equations to predict final parameters of the breach opening (.e.g. size, shape, time to fully develop) when given input data such as reservoir volume, initial water height, dam height, dam type, failure mode, and material erodibility.
• Based on discussions with technical experts at USACE and USBR, as discussed above, and the lack of independent review of the case studies for Chinese dam failures, there is concern about the use of breach parameters computed using Xu and Zhang (2009). Given the time necessary to conduct a sufficient review of the model in conjunction with other federal agencies, and the uncertainty regarding its ultimate acceptability, the NRC staff does not recommend use of the breach parameter model developed in this paper for the purposes of conducting the R2.1 hazard review. This position applies to Category 2 and 3 plants, while Category 1 sites that used the Xu and Zhang relationship (and submitted their R2.1 flood hazard reevaluation report in March 2013) will be reviewed on a case-by-case basis (see Section 1.2).
7.2.2.1 Uncertainty in Predicted Breach Parameters and Hydrographs
Predicting the reservoir outflow hydrograph remains a great source of uncertainty, especially for embankment dams in which dam failure is usually a complex progressive process that is difficult to model (Wahl, 2010). Since the scale of estimated consequences associated with a dam failure can be sensitive to the choice of breach parameters, careful consideration should be given to the selection of the proper method(s) of determining breach parameters and the associated uncertainty, not only with the parameters themselves, but of the overall result of the breach modeling efforts.
Numerous regression equations, summarized in the preceding sections, have been developed for peak discharge and breach parameters. The available equations vary widely depending on the analyst and the types of dam failures studied. Regression equations suffer from a lack of well-documented case study data as well as a high level of uncertainty
DRAFT – 2013-06-21
Page 84
in the data used to develop the equations. Approximately 75 percent of the dam failures used to develop the equations are less than 50 feet in height; therefore, these equations may not be very representative of dams greater than 50 feet in height. According to Wahl (2010), the best methods of breach width prediction are empirically derived parametric equations [e.g., USBR (1988); Von Thun & Gillette [1990], and Froehlich (1995a). These methods were found to have uncertainties of about ± one-third of an order of magnitude.
In general, predictions of the side slope of dam breach openings have a high uncertainty, although this is of secondary importance since breach outflows are relatively insensitive to the selection of side slopes. In the case studies used to develop most regression equations, observed final breach openings are generally sloped. However, based on laboratory and scale model studies, researchers believe that side slopes are nearly vertical while the breach is actively eroding and enlarging.
Predictions of breach formation time also have a very high uncertainty due to a lack of reliable case study data; many dams fail without eyewitnesses, and the problem of distinguishing between breach initiation and breach formation phases has likely tainted much of the data (USBR, 1998). An analysis by Wahl (2004) found that most of the empirically developed equations for predicting time of failure had uncertainties of about ±1 order of magnitude; the best predictions were obtained with the equation by Froehlich (1995b). Newer equations by Froehlich (2008) and Xu and Zhang (2009) which are based on more case studies and additional parameters (e.g., erodibility) may be marginally improved, but breach failure time predictions should still be considered highly uncertain.
7.2.2.2 Performing Sensitivity Analyses to Select Final Breach Parameters
With a wide range of methods available that can produce a wide range of results for breach width and breach formation time, a sensitivity analysis should be performed prior to selecting the final breach parameters. The sensitivity analysis should not be restricted to identifying the impact of varying the breach parameters on the peak discharge and breach hydrograph at the dam. It should also identify the effect of breach parameters on the calculated water surface elevations at locations of interest downstream from the dam. While a model may indicate that the stage and outflow at the dam vary greatly depending on the selected breach parameters, the effect on the stage, flow, and travel time to an area of interest downstream of the dam may be smaller due to routing effects (e.g., flood attenuation and floodplain hydraulics).
Significant engineering judgment must be exercised in interpreting breach parameter and/or breach peak flow results. The sensitivity analysis could involve using several widely used predictor equations to establish breach parameters. However, it should be noted that the importance attached to details of the breach model are highest for those sites that are closest to the dam. As the distance between the dam and the site of interest increases, the attenuation of the flood wave reduces the influence of the breach details. Sensitivity analysis can be used to study this effect.
Staff Positions:
• Because of the large uncertainties, inconsistencies and potential biases discussed above, one should not rely on a single method/equation. Instead, one should compare the results of several models judged to be appropriate. Provide justification
DRAFT – 2013-06-21
Page 85
for choice of candidate models and final parameter choices. Explicitly address model and parameter uncertainty as well as parameter sensitivity in final results.
• Studies have shown that failure time uncertainties can be quite large. Contributions to uncertainty include: 1) observations of failure time in case studies generally originate from non-professional eyewitness; and 2) lack of clear and consistent definition of failure time across (and sometimes within) studies. Therefore, licensees need to understand how failure time is defined in the relations they use and ensure that there is consistency with the way failure time will be used in their modeling of the breach formation process.
7.2.3 Physically-Based Combined Process Breach Models
Another approach to dam breach analysis for earthen dams is to use a combined process model that simulates specific erosion processes and the associated hydraulics of flow through the developing breach to yield a breach outflow hydrograph. These combined process models attempt to simulate the progression of a dam breach using sediment detachment and/or sediment transport equations to estimate erosion rates and soil mechanics relations to predict mass slope failures. Several models have been developed (e.g., Fread, 1991; Mohamed, 2002; Temple et al., 2006; Hanson et al. 2011; Visser et al. 2012; Wu, et al. 2010), but they are not nearly as widely used as the previously described regression approaches. The work required to develop site-specific parameters needed for application of these models is significant.
Staff Position:
• The state of practice in dam breach modeling shows a clear preference for regression-based approaches. However, use of physically-based breach modeling will be considered on a case-by-case basis. If used, the parameters describing erosion and hydraulic properties should be developed from site-specific studies. Generic values or values obtained from the literature are, in general, not sufficient. Uncertainty and sensitivity studies should be performed to evaluate the effect of model and input parameter selection on the results of the analysis. Justification for the selected model and input parameters should be provided, including documentation of uncertainty and sensitivity studies.
8. Levee Breach Modeling
The breaching process for levees can be quite different from that of earthen dams. The principal differences include: 1) breach sensitivity to upstream and downstream conditions; 2) dimensionality of the outflow; and 3) flow direction relative to the structure.
One of the most significant differences is the effect of the upstream and downstream water conditions. In a dam breaching event, the upstream reservoir water level drops and the breach outflow discharge increases to a peak as the breach enlarges; subsequently, the discharge decreases as water level decreases and storage volume in the reservoir is depleted. The dam breach size and outflow are thus usually limited by reservoir characteristics, and downstream tailwater conditions are generally of secondary importance. In a levee failure along a large lake, the water level drops minimally. The breach size and outflow continue to increase until the tailwater downstream from the breach rises to reduce hydraulic stresses on the breach opening below the threshold for continued erosion. Thus,
DRAFT – 2013-06-21
Page 86
downstream tailwater rise is much more important than for dams. Tailwater rise has a similar effect on a riverine levee breach, but upstream river inflow (and hence catchment size) also affects the breach size and outflow by sustaining the water level in the river. In addition,
Outflow from a dam breach often goes into a narrow valley and is often as a one-dimensional flow. However, outflow from a levee breach usually spreads into a relatively flat plain. The diverging flow as water inundates land behind the levee is essentially two-dimensional in nature. This two-dimensional flow can be important when the levee is close to the site. When the levee breach is distant from the site, simplified modeling approaches are more appropriate. In the case of a riverine levee breach, the upstream flow is parallel to the embankment, whereas in a dam breach, the upstream flow is more or less perpendicular to the embankment.
In a coastal context, the presence of waves in the incipient breach increases sediment mobilization and transport. The breach flow may be affected by the tidal cycle, and water conditions on both sides of the embankment. In addition, a barrier breach may be closed naturally by the sediments transported from adjacent beaches and shores attributable to littoral drift, or it may increase in size and become a new inlet or estuary
In contrast to earthen embankment dams, very few studies have been carried out to derive regression equations for levee breach parameters. The parametric dam breach models discussed above may not be strictly applicable to levee breaches because water conditions upstream and downstream from levee breaches may be very different from those at dam breaches.
Staff Positions:
• In general, levees should be assumed to fail when overtopped. The case for nonfailure must be developed using detailed engineering analysis supported by site-specific information, including material properties of the embankment and foundation soils, material properties of embankment protection (if any), levee condition, etc.
• Levees are generally not designed to withstand high water levels for long periods. However, there is no generally accepted method for predicting how long a levee will continue to function under high loading conditions. Therefore historical information is the best available basis for predicting levee performance. The historical information should be from levees that have similar design and construction as the levee being analyzed.
• Since there is no widely accepted method for modeling breach development in the case of levees, conservative assumptions regarding the extent of the breach and the failure time should be used.
• In general, inundation mapping of the NPP site from an onsite or nearby levee will require two-dimensional modeling.

DRAFT – 2013-06-21
Page 87
9. Flood Wave Routing
Regardless of the type of dam failure, the dam-break flood hydrographs represent dynamic, unsteady flow events. Therefore, a dynamic hydraulic model should generally be used to route the dam failure flood wave to the plant. Sensitivity of flood stage and water velocity estimates to reservoir levels, reservoir inflow conditions, and tailwater conditions before and after dam failure should be examined. Transport of sediment and debris by the flood waters should be considered. However, as discussed in Section 3, there may be situations where using a simplified approach is appropriate.
This section describes h y d r o l o g i c routing methods that are appropriate for use in modeling dam breach in hydrologic modeling software packages. Several commonly used methods are:
• Muskingum • Modified Puls (also known as storage routing) • Muskingum Cunge
Each of these models computes a downstream hydrograph, given an upstream hydrograph as a boundary condition. Each does so by solving the continuity equation and simplified version of the momentum equations.
The most important consideration in selecting a routing method is the nature of the flood wave exiting the reservoir. The flood wave will rise from a fairly low value, very quickly to a value much greater than the initial flow. The extremely large flows will definitely overflow the channel and enter the floodplain. Therefore, the routing method selected must be capable of nonlinear routing.
While some of the hydrologic routing methods include attenuation, none of them include acceleration. Acceleration can be a significant source of attenuation during a large floodwave in a flat channel. The attenuation by hydro log ic methods i s approximate. A hydraulic model may be necessary to accurately predict the attenuation.
9.1 Applicability and Limitations of Hydrologic Routing Models
Each routing model discussed above involves solving both the momentum and continuity equations. However, each omits or simplifies certain terms of those equations to arrive at a solution. To select a routing model, one must consider the routing method's assumptions and reject those models that fail to account for critical characteristics of the flow hydrographs and the channels through which they are routed. These include (but are not limited to) the effects discussed in the following subsections.
9 . 1 . 1 Backwater Effects
Tidal fluctuations, significant tributary inflows, dams, bridges, culverts, and channel constrictions can cause backwater effects. A flood wave that is subjected to the influences of backwater will be attenuated and delayed in time.
Practically, none of the hydrologic routing models will simulate channel flow well if the downstream conditions have a significant impact on upstream flows. The structure of methods is such that computations move from upstream watersheds and channels to
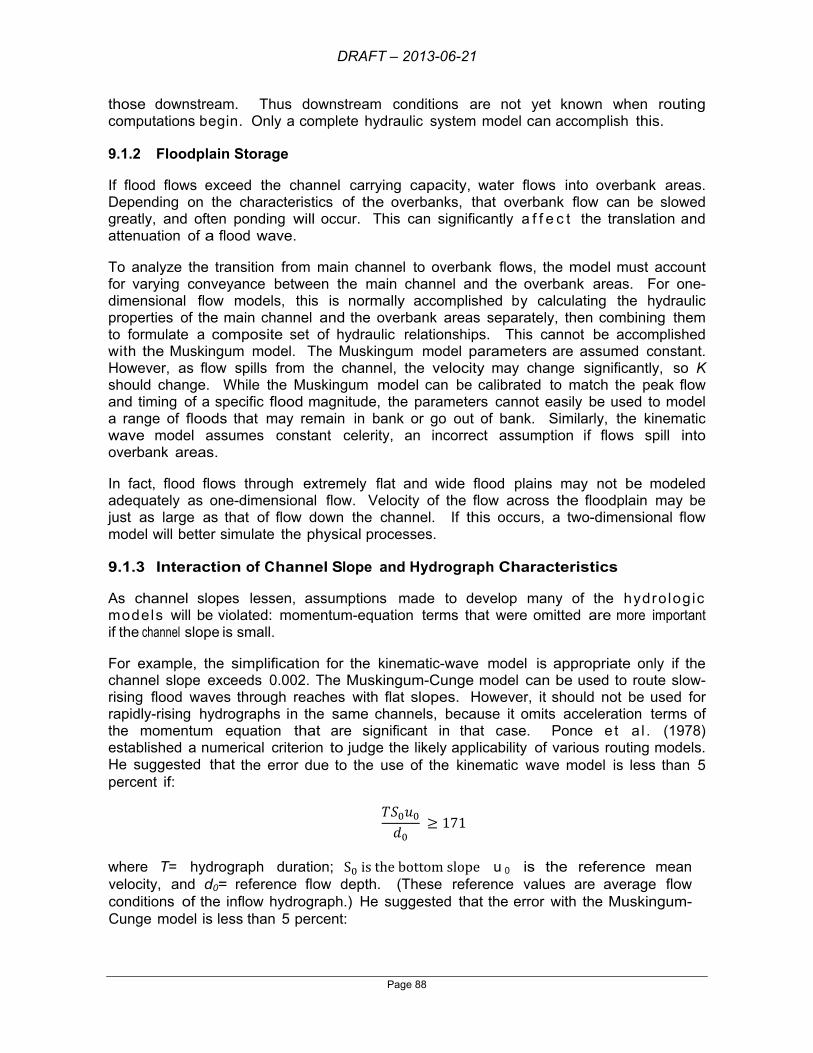
DRAFT – 2013-06-21
Page 88
those downstream. Thus downstream conditions are not yet known when routing computations begin. Only a complete hydraulic system model can accomplish this.
9.1.2 Floodplain Storage
If flood flows exceed the channel carrying capacity, water flows into overbank areas. Depending on the characteristics of the overbanks, that overbank flow can be slowed greatly, and often ponding will occur. This can significantly a f f e c t the translation and attenuation of a flood wave.
To analyze the transition from main channel to overbank flows, the model must account for varying conveyance between the main channel and the overbank areas. For one-dimensional flow models, this is normally accomplished by calculating the hydraulic properties of the main channel and the overbank areas separately, then combining them to formulate a composite set of hydraulic relationships. This cannot be accomplished with the Muskingum model. The Muskingum model parameters are assumed constant. However, as flow spills from the channel, the velocity may change significantly, so K should change. While the Muskingum model can be calibrated to match the peak flow and timing of a specific flood magnitude, the parameters cannot easily be used to model a range of floods that may remain in bank or go out of bank. Similarly, the kinematic wave model assumes constant celerity, an incorrect assumption if flows spill into overbank areas.
In fact, flood flows through extremely flat and wide flood plains may not be modeled adequately as one-dimensional flow. Velocity of the flow across the floodplain may be just as large as that of flow down the channel. If this occurs, a two-dimensional flow model will better simulate the physical processes.
9.1.3 Interaction of Channel Slope and Hydrograph Characteristics
As channel slopes lessen, assumptions made to develop many of the hydrologic models will be violated: momentum-equation terms that were omitted are more important if the channel slope is small.
For example, the simplification for the kinematic-wave model is appropriate only if the channel slope exceeds 0.002. The Muskingum-Cunge model can be used to route slow-rising flood waves through reaches with flat slopes. However, it should not be used for rapidly-rising hydrographs in the same channels, because it omits acceleration terms of the momentum equation that are significant in that case. Ponce e t a l . (1978) established a numerical criterion to judge the likely applicability of various routing models. He suggested that the error due to the use of the kinematic wave model is less than 5 percent if:
171
where T= hydrograph duration; S is the bottom slope u 0 is the reference mean velocity, and d0= reference flow depth. (These reference values are average flow conditions of the inflow hydrograph.) He suggested that the error with the Muskingum- Cunge model is less than 5 percent:

DRAFT – 2013-06-21
Page 89
30
where g = acceleration of gravity.
9.1.4 Configuration of Flow Networks
In a dendritic stream system, if the tributary flows or the main channel flows do not cause significant backwater at the confluence of the two streams, any of the hydraulic or hydrologic routing methods can be applied. However, if significant backwater does occur at confluences, then the models that can account for backwater must be applied. For full networks, where the flow divides and possibly changes direction during the event, none of the simplified models that are included in HEC-HMS should be used.
9.1.5 Occurrence of Subcritical and Supercritical Flow
During a flood, flow may shift between subcritical and supercritical regimes. If the supercritical flow reaches are short, this shift will not have a noticeable impact on the discharge hydrograph. However, if the supercritical-flow reaches are long, these should be identified and treated as separate routing reaches. If the shifts are frequent and unpredictable, then none of the simplified models are appropriate.
9.1.6 Availability of Calibration Data Sets
In general, if observed data are not available, the physically-based routing models will be easier to set up and apply with some confidence. Parameters such as the Muskingum X can be estimated, but the estimates can be verified only with observed flows. Thus these empirical models should be avoided if the watershed and channel are ungaged.
Staff Position
• The use of simplified hydrologic routing must justified and shown to be appropriate for use on a case by case basis.
• When available, records from the largest observed floods should be used to calibrate hydrologic and hydraulic models. Flood records from nearby hydrologically similar watersheds may also be useful.
• When flood records are not available, USGS regression equations for unguaged watersheds may be used to inform modeling.
9.2 Hydraulic Models
As stated above, hydraulic routing methods are preferred when routing flood waves from dam breach. Hydraulic routing provides more accuracy when modeling flood waves from dam breach because it includes terms that other methods neglect and therefore, it is not subject to the restrictions discussed above. Typically, a dynamic hydraulic model should generally be used to route the dam failure flood wave to the plant.
There are many readily available dynamic (unsteady flow) hydraulic models that have been used for dam breach outflow hydrograph computation and downstream routing. In general, the hydraulic routing methods are applicable to the dam breach flood wave routing analysis. Recent case studies of dam-break flood routing using widely used hydraulic models

DRAFT – 2013-06-21
Page 90
developed by Federal agencies are available in the hydraulic engineering literature. Models to route the flood can be one- or two-dimensional or can be a combination of both. In general, as the flood plain widens, one-dimensional analysis becomes less reliable. Accurate estimates of flood elevation in areas of changing topography and near large objects (i.e. buildings and other structures) in the flow field will typically require localized two-dimensional analysis, in areas of particular interest or sensitivity.
Staff Positions:
• For inundation mapping of the NPP site, two-dimensional models are generally preferred by the staff. However, use of one-dimensional models may be appropriate in some cases. Therefore use of one-dimensional models will be accepted on a case-by-case basis, with appropriate justification.
• Transport of sediment and debris by the flood waters should be considered. • Large uncertainty exists in relationships between water elevation and discharge
(rating curves), especially at high river discharges. Typically, observed data are extrapolated well beyond field-observed data when discussing dam breach scenarios. Some estimation of the likely variation in maximum water surface stage at the NPP site should be reported to account for this uncertainty in the rating curve.
9.3 Sediment Transport Modeling
Sediment transport effects such as erosion and sedimentation should be considered. Ignoring sediment deposition on or near the site may result in underestimates of water level elevations. Sediment accumulation in the UHS impoundment may also be a concern. Conversely, ignoring sediment erosion may mean that potentially dangerous scouring around structures is not analyzed. However, detailed guidance on sediment transport modeling is beyond the scope of this ISG. The reader should consult one or more standard references in this discipline (Yalin 1977, Julien 1998, Lick 2008). Some hydrologic and hydraulic modeling packages include sediment transport modules (e.g, HEC-RAS, SRH-1D, SRH-2D, FLO-2D). [Put in ref section]. In many cases, simplified conservative estimates for sediment transport, erosion and sedimentation may be used in lieu of detailed analysis.
DRAFT – 2013-06-21
Page 91
10. Terms and Definitions
Abutment. That part of the valley side against which the dam is constructed. An artificial abutment is sometimes constructed, as a concrete gravity section, to take the thrust of an arch dam where there is no suitable natural abutment. The left and right abutments of dams are defined with the observer viewing the dam looking in the downstream direction, unless otherwise indicated.
Appurtenant structure. Ancillary features of a dam such as outlets, spillways, power plants, tunnels, etc.
Attenuation. A decrease in amplitude of the seismic waves with distance due to geometric spreading, energy absorption, and scattering, or decrease in the amplitude of a flood wave due to channel geometry and energy loss.
Average reservoir level. The 50% exceedance duration pool level calculated using average daily water levels for the period of record.
Axis of dam. The vertical plane or curved surface, chosen by a designer, appearing as a line, in plan or in cross-section, to which the horizontal dimensions of the dam are referenced.
Base thickness. Also referred to as base width. The maximum thickness or width of the dam measured horizontally between upstream and downstream faces and normal to the axis of the dam, but excluding projections for outlets or other appurtenant structures.
Bedrock. Any sedimentary, igneous, or metamorphic material represented as a unit in geology; being a sound and solid mass, layer, or ledge of mineral matter; and with shear wave threshold velocities greater than 2500 feet/second.
Bedrock motion parameters. Numerical values representing vibratory ground motion, such as particle acceleration, velocity, and displacement, frequency content, predominant period, spectral intensity, and a duration that define a design earthquake. (These may also be used in a more general sense for ground motion.)
Body wave. Waves propagated in the interior of the earth, i.e., the compression (P) and shear (S) waves of an earthquake.
Borrow area. The area from which natural materials, such as rock, gravel or soil, used for construction purposes is excavated.
Breach. An opening through a dam that allows the uncontrolled draining of a reservoir. A controlled breach is a constructed opening. An uncontrolled breach is an unintentional opening allowing discharge from the reservoir. A breach is generally associated with the partial or total failure of the dam. A breach opening could be formed by many processes.
Channel. A general term for any natural or artificial facility for conveying water.
Compaction. Mechanical action that increases the density by reducing the voids in a material.
Conduit. A closed channel to convey water through, around, or under a dam.
DRAFT – 2013-06-21
Page 92
Construction joint. The interface between two successive placements or pours of concrete where bond, and not permanent separation, is intended.
Core. A zone of low permeability material in an embankment dam. The core is sometimes referred to as central core, inclined core, puddle clay core, rolled clay core, or impervious zone.
Core wall. A wall built of relatively impervious material, usually of concrete or asphaltic concrete in the body of an embankment dam to prevent seepage.
Crest length. The measured length of the dam along the crest or top of dam.
Crest of dam. See top of dam.
Critical damping. The minimum amount of damping that prevents free oscillatory vibration.
Cross section. An elevation view of a dam formed by passing a plane through the dam perpendicular to the axis.
Cutoff trench. A foundation excavation later to be filled with impervious material so as to limit seepage beneath a dam.
Cutoff wall. A wall of impervious material usually of concrete, asphaltic concrete, or steel sheet piling constructed in the foundation and abutments to reduce seepage beneath and adjacent to the dam.
Cyclic mobility. A phenomenon in which a cohesionless soil loses shear strength during earthquake ground vibrations and acquires a degree of mobility sufficient to permit intermittent movement up to several feet, as contrasted to liquefaction where continuous movements of several hundred feet are possible.
Dam. An artificial barrier that has the ability to impound water, wastewater, or any liquid-borne material, for the purpose of storage or control of water.
Ambursen dam. A buttress dam in which the upstream part is a relatively thin flat slab usually made of reinforced concrete.
Arch dam. A concrete, masonry, or timber dam with the alignment curved upstream so as to transmit the major part of the water load to the abutments.
Buttress dam. A dam consisting of a watertight part supported at intervals on the downstream side by a series of buttresses. Buttress dam can take many forms, such as a flat slab or massive head buttress.
Crib dam. A gravity dam built up of boxes, crossed timbers or gabions, filled with earth or rock.
Diversion dam. A dam built to divert water from a waterway or stream into a different watercourse.
Double curvature arch dam. An arch dam that is curved both vertically and horizontally.

DRAFT – 2013-06-21
Page 93
Earthen dam. An embankment dam in which more than 50% of the total volume is formed of compacted earth layers with soil particles generally smaller than 3-inch size.
Embankment dam. Any dam constructed of excavated natural materials, such as both earthfill and rockfill dams, or of industrial waste materials, such as a tailings dam.
Gravity dam. A dam constructed of concrete and/or masonry, which relies on its weight and internal strength for stability.
Hollow gravity dam. A dam constructed of concrete and/or masonry on the outside but having a hollow interior and relying on its weight for stability.
Hydraulic fill dam. An earth dam constructed of materials, often dredged, which are conveyed and placed by suspension in flowing water.
Masonry dam. Any dam constructed mainly of stone, brick, or concrete blocks pointed with mortar. A dam having only a masonry facing should not be referred to as a masonry dam.
Multiple arch dam. A buttress dam comprised of a series of arches for the upstream face.
Overflow dam. A dam designed to be overtopped.
Rock-fill dam. An embankment dam in which more than 50% of the total volume is comprised of compacted or dumped cobbles, boulders, rock fragments, or quarried rock generally larger than 3-inch size.
Roller compacted concrete dam. A concrete gravity dam constructed by the use of a dry mix concrete transported by conventional construction equipment and compacted by rolling, usually with vibratory rollers.
Rubble dam. A stone masonry dam in which the stones are unshaped or uncoursed.
Saddle dam. A subsidiary dam of any type constructed across a saddle or low point on the perimeter of a reservoir.
Dam failure. Catastrophic type of failure characterized by the sudden, rapid, and uncontrolled release of impounded water or the likelihood of such an uncontrolled release. It is recognized that there are lesser degrees of failure and that any malfunction or abnormality outside the design assumptions and parameters that adversely affect a dam's primary function of impounding water is properly considered a failure. These lesser degrees of failure can progressively lead to or heighten the risk of a catastrophic failure. They are, however, normally amenable to corrective action. Dams may be classified according to the broad level of importance in estimating the flooding hazard at the NPP site:
Inconsequential dam. A dam identified by federal or state agencies as having minimal or no adverse failure consequences beyond the owner’s property. A

DRAFT – 2013-06-21
Page 94
dam that can be shown to have minimal or no adverse downstream failure consequences.
Noncritical dams. A Dam or (or set of dams) that can be shown to have low flooding impacts at the NPP site (i.e., flood elevations below systems, structures and components important to safety) using simplified, conservative methods.
Potentially critical dam. A Dam or (or set of dams) that cannot be shown to have low flooding impacts at the NPP site (i.e., flood elevations below systems, structures and components important to safety) using simplified, conservative methods.
Critical dam. A Dam or (or set of dams) that is shown to have flooding impacts at the NPP site (i.e., flood elevations at or above systems, structures and components important to safety).
Damping. Resistance that reduces vibrations by energy absorption. There are different types of damping such as viscous, Coulomb, and geometric damping.
Damping ratio. The ratio of the actual damping to the critical damping.
Design water level. The maximum water elevation, including the flood surcharge, that a dam is designed to withstand.
Design wind. The most severe wind that is reasonably possible at a particular reservoir for generating wind setup and run-up. The determination will generally include the results of meteorologic studies that combine wind velocity, duration, direction and seasonal distribution characteristics in a realistic manner.
Deterministic methodology. A method in which the chance of occurrence of the variable involved is ignored and the method or model used is considered to follow a definite law of certainty, and not probability.
Dike. See saddle dam.
Drain, blanket. A layer of pervious material placed to facilitate drainage of the foundation and/or embankment.
Drain, chimney. A vertical or inclined layer of pervious material in an embankment to facilitate and control drainage of the embankment fill.
Drain, toe. A system of pipe and/or pervious material along the downstream toe of a dam used to collect seepage from the foundation and embankment and convey it to a free outlet.
Drainage area. The area that drains to a particular point on a river or stream.
Drainage curtain. A line of vertical wells or boreholes to facilitate drainage of the foundation and abutments and to reduce water pressure.
Drainage wells or relief wells. Vertical wells downstream of or in the downstream shell of an embankment dam to collect and control seepage through and under the dam. A line of such wells forms a drainage curtain.
DRAFT – 2013-06-21
Page 95
Duration of strong ground motion. The "bracketed duration" or the time interval between the first and last acceleration peaks that are equal to or greater than 0.05g.
Dynamic routing. Hydraulic flow routing based on the solution of the St.-Venant Equation(s) to compute the changes of discharge and stage with respect to time at various locations along a stream.
Earthquake. A sudden motion or trembling in the earth caused by the abrupt release of accumulated stress along a fault.
Earthquake, Maximum Credible (MCE). The earthquake(s) associated with specific seismotectonic structures, source areas, or provinces that would cause the most severe vibratory ground motion or foundation dislocation capable of being produced at the site under the currently known tectonic framework. It is determined by judgment based on all known regional and local geological and seismological data.
Earthquake, Maximum Design (MDE). A postulated seismic event, specified in terms of specific bedrock motion parameters at a given site, which is used to evaluate the seismic resistance of manmade structures or other features at the site.
Earthquake, Operating Basis (OBE). The earthquakes for which the structure is designed to resist and remain operational. It reflects the level of earthquake protection desired for operational or economic reasons and may be determined on a probabilistic basis considering the regional and local geology and seismology.
Earthquake, Safety Evaluation (SEE). The earthquake, expressed in terms of magnitude and closest distance from the dam site or in terms of the characteristics of the time history of free-field ground motions, for which the safety of the dam and critical structures associated with the dam are to be evaluated. In many cases, this earthquake will be the maximum credible earthquake to which the dam will be exposed. However, in other cases where the possible sources of ground motion are not easily apparent, it may be a motion with prescribed characteristics selected on the basis of a probabilistic assessment of the ground motions that may occur in the vicinity of the dam. To be considered safe, it should be demonstrated that the dam can withstand this level of earthquake shaking without release of water from the reservoir.
Earthquake, synthetic. Earthquake time history records developed from mathematical models that use white noise, filtered white noise, and stationary and non-stationary filtered white noise, or theoretical seismic source models of failure in the fault zone. (White noise is random energy containing all frequency components in equal proportions. Stationary white noise is random energy with statistical characteristics that do not vary with time.)
Emergency gate. A standby or reserve gate used only when the normal means of water control is not available for use.
Energy dissipator. A device constructed in a waterway to reduce the kinetic energy of fast flowing water.
Epicenter. The point on the earth's surface located vertically above the point where the first rupture and the first earthquake motion occur.
DRAFT – 2013-06-21
Page 96
Erosion. The wearing away of a surface (bank, streambed, embankment, or other surface) by floods, waves, wind, or any other natural process.
Failure. See Dam, Failure.
Failure mode. A potential failure mode is a physically plausible process for dam failure resulting from an existing inadequacy or defect related to a natural foundation condition, the dam or appurtenant structures design, the construction, the materials incorporated, the operations and maintenance, or aging process, which can lead to an uncontrolled release of the reservoir.
Fault. A fracture or fracture zone in the earth along which there has been displacement of the two sides relative to one another and which is parallel to the fracture.
Fault, active. A fault which, because of its present tectonic setting, can undergo movement from time to time in the immediate geologic future.
Fault, capable. An active fault that is judged capable of producing macroearthquakes and exhibits one or more of the following characteristics:
Movement at or near the ground surface at least once within the past 35,000 years.
Macroseismicity (3.5 magnitude or greater) instrumentally determined with records of sufficient precision to demonstrate a direct relationship with the fault.
A structural relationship to a capable fault such that movement on one fault could be reasonably expected to cause movement on the other.
Established patterns of microseismicity that define a fault, with historic macroseismicity that can reasonably be associated with the fault.
Fetch. The-straight-line distance across a body of water subject to wind forces. The fetch is one of the factors used in calculating wave heights in a reservoir.
Filter (filter zone). One or more layers of granular material graded (either naturally or by selection) so as to allow seepage through or within the layers while preventing the migration of material from adjacent zones.
Flashboards. Structural members of timber, concrete, or steel placed in channels or on the crest of a spillway to raise the reservoir water level but intended to be quickly removed, tripped, or fail in the event of a flood.
Flood. A temporary rise in water surface elevation resulting in inundation of areas not normally covered by water. Hypothetical floods may be expressed in terms of average probability of exceedance per year such as one-percent-chance-flood, or expressed as a fraction of the probable maximum flood or other reference flood.
Flood, Safety Evaluation (SEP). The largest flood for which the safety of a dam and appurtenant structure is to be evaluated.
Flood, Inflow Design (IDF). The flood flow above which the incremental increase in downstream water surface elevation due to failure of a dam or other water impounding structure is no longer considered to present an unacceptable threat to

DRAFT – 2013-06-21
Page 97
downstream life or property. The flood hydrograph used in the design of a dam and its appurtenant works particularly for sizing the spillway and outlet works and for determining maximum storage, height of dam, and freeboard requirements.
Flood, Probable Maximum (PMF). The flood that may be expected from the most severe combination of critical meteorologic and hydrologic conditions that are reasonably possible in the drainage basin under study.
Flood plain. An area adjoining a body of water or natural stream that may be covered by floodwater. Also, the downstream area that would be inundated or otherwise affected by the failure of a dam or by large flood flows. The area of the flood plain is generally delineated by a frequency (or size) of flood.
Flood routing. A process of determining progressively over time the amplitude of a flood wave as it moves past a dam or downstream to successive points along a river or stream.
Flood storage. The retention of water or delay of runoff either by planned operation, as in a reservoir, or by temporary filling of overflow areas, as in the progression of a flood wave through a natural stream channel.
Flume. An open channel constructed with masonry, concrete or steel of rectangular or U shaped cross section and designed for medium or high velocity flow. Also, a channel in which water is conveyed through a section of known size and shape for purposes of measurement.
Foundation. The portion of the valley floor that underlies and supports the dam structure.
Freeboard. Vertical distance between a specified stillwater (or other) reservoir surface elevation and the top of the dam, without camber.
Gallery. A passageway in the body of a dam used for inspection, foundation grouting, and/or drainage.
Gate. A movable water barrier for the control of water.
Bascule gate. See flap gate.
Bulkhead gate. A gate used either for temporary closure of a channel or conduit before dewatering it for inspection or maintenance or for closure against flowing water when the head difference is small, e.g., for diversion tunnel closure.
Crest gate (spillway gate). A gate on the crest of a spillway to control the discharge or reservoir water level.
Drum gate. A type of spillway gate consisting of a long hollow drum. The drum may be held in its raised position by the water pressure in a flotation chamber beneath the drum.
Emergency gate. A standby or auxiliary gate used when the normal means of water control is not available. Sometimes referred to as guard gate.
DRAFT – 2013-06-21
Page 98
Fixed wheel gate (fixed roller gate) (fixed axle gate). A gate having wheels or rollers mounted on the end posts of the gate. The wheels bear against rails fixed in side grooves or gate guides.
Flap gate. A gate hinged along one edge, usually either the top or bottom edge. Examples of bottom-hinged flap gates are tilting gates and fish belly gates so called from their shape in cross section.
Flood gate. A gate to control flood release from a reservoir.
Outlet gate. A gate controlling the flow of water through a reservoir outlet.
Radial gate (Tainter gate). A gate with a curved upstream plate and radial arms hinged to piers or other supporting structure.
Regulating gate (regulating valve). A gate or valve that operates under full pressure flow conditions to regulate the rate of discharge.
Roller drum gate. See drum gate.
Roller gate (stoney gate). A gate for large openings that bears on a train of rollers in each gate guide.
Skimmer gate. A gate at the spillway crest whose prime purpose is to control the release of debris and logs with a limited amount of water. It is usually a bottom hinged flap or Bascule gate.
Slide gate (sluice gate). A gate that can be opened or closed by sliding in supporting guides.
Gate chamber (valve chamber). A room from which a gate or valve can be operated, or sometimes in which the gate is located.
Hazard. A situation that creates the potential for adverse consequences such as loss of life, property damage, or other adverse impacts.
Hazard potential. The possible adverse incremental consequences that result from the
release of water or stored contents due to failure of the dam or misoperation of the dam or appurtenances. Impacts may be for a defined area downstream of a dam from flood waters released through spillways and outlet works of the dam or waters released by partial or complete failure of the dam. There may also be impacts for an area upstream of the dam from effects of backwater flooding or landslides around the reservoir perimeter.
Head, static. The vertical distance between two points in a fluid.
Head, velocity. The vertical distance that would statically result from the velocity of a moving fluid.
Headwater: The water immediately upstream from a dam. The water surface elevation varies due to fluctuations in inflow and the amount of water passed through the dam.

DRAFT – 2013-06-21
Page 99
Heel. The junction of the upstream face of a gravity or arch dam with the ground surface. For an embankment dam, the junction is referred to as the upstream toe of the dam.
Height, above ground. The maximum height from natural ground surface to the top of a dam.
Height, hydraulic. The vertical difference between the maximum design water level and the lowest point in the original streambed.
Height, structural. The vertical distance between the lowest point of the excavated foundation to the top of the dam.
Hydrograph, breach or dam failure. A flood hydrograph resulting from a dam breach.
Hydrograph, flood. A graph showing, for a given point on a stream, the discharge, height, or other characteristic of a flood with respect to time.
Hydrograph, unit. A hydrograph with a volume of one inch of runoff resulting from a storm of a specified duration and areal distribution. Hydrographs from other storms of the same duration and distribution are assumed to have the same time base but with ordinates of flow in proportion to the runoff volumes.
Hydrology. One of the earth sciences that encompasses the natural occurrence, distribution, movement, and properties of the waters of the earth and their environmental relationships.
Hydrometeorology. The study of the atmospheric and land-surface phases of the hydrologic cycle with emphasis on the interrelationships involved.
Hypocenter. The location where the slip responsible for an earthquake originates; the focus of an earthquake.
Inflow Design Flood (IDF). See Flood.
Intake. Placed at the beginning of an outlet-works waterway (power conduit, water supply conduit), the intake establishes the ultimate drawdown level of the reservoir by the position and size of its opening(s) to the outlet works. The intake may be vertical or inclined towers, drop inlets, or submerged, box-shaped structures. Intake elevations are determined by the head needed for discharge capacity, storage reservation to allow for siltation, the required amount and rate of withdrawal, and the desired extreme drawdown level.
Intensity, seismic. A numerical index describing the effects of an earthquake on man, manmade structures, or other features of the earth's surface.
Inundation map. A map showing areas that would be affected by flooding from releases from a dam’s reservoir. The flooding may be from either controlled or uncontrolled releases or as a result of a dam failure. A series of maps for a dam could show the incremental areas flooded by larger flood releases.
Landslide. The unplanned descent (movement) of a mass of earth or rock down a slope.
Leakage. Uncontrolled loss of water by flow through a hole or crack.
DRAFT – 2013-06-21
Page 100
Length of dam. The length along the top of the dam. This also includes the spillway, powerplant, navigation lock, fish pass, etc., where these form part of the length of the dam. If detached from the dam, these structures should not be included.
Lining. With reference to a canal, tunnel, shaft, or reservoir, a coating of asphaltic concrete, reinforced or unreinforced concrete, shotcrete, rubber or plastic to provide watertightness, prevent erosion, reduce friction, or support the periphery of the outlet pipe conduit.
Liquefaction. A condition whereby soil undergoes continued deformation at a constant low residual stress or with low residual resistance, due to the buildup and maintenance of high pore water pressures, which reduces the effective confining pressure to a very low value. Pore pressure buildup leading to liquefaction may be due either to static or cyclic stress applications and the possibility of its occurrence will depend on the void ratio or relative density of a cohesionless soil and the confining pressure.
Logboom. A chain of logs, drums, or pontoons secured end-to-end and floating on the surface of a reservoir so as to divert floating debris, trash, and logs.
Low level outlet (bottom outlet). An opening at a low level from a reservoir generally used for emptying or for scouring sediment and sometimes for irrigation releases.
Magnitude, Body Wave (mb). The magnitude of an earthquake measured as the common logarithm of the maximum displacement amplitude (microns) and period (seconds) of the body waves.
Magnitude, Richter or Local (ML). The magnitude of an earthquake measured as a common logarithm of the displacement amplitude, in microns, of a standard Wood-Anderson seismograph located on firm ground 100 km from the epicenter and having a magnification of 2800, a natural period 0.8 second, and a damping coefficient of 80 percent.
Magnitude, Surface Wave (Ms). The magnitude of an earthquake measured as the common logarithm of the resultant of the maximum mutually perpendicular horizontal displacement amplitudes, in microns, of the 20-second period surface waves.
Maximum flood control level. The highest elevation of the flood control storage.
Maximum wind. The most severe wind for generating waves that is reasonably possible at a particular reservoir. The determination will generally include results of meteorologic studies that combine wind velocity, duration, direction, fetch, and seasonal distribution characteristics in a realistic manner.
Meteorological homogeneity. Climates and orographic influences that are alike or similar.
Meteorology. The science that deals with the atmosphere and atmospheric phenomena, the study of weather, particularly storms and the rainfall they produce.
Minimum operating level. The lowest level to which the reservoir is drawn down under normal operating conditions. The lower limit of active storage.
Non-overflow dam (section). A dam or section of dam that is not designed to be overtopped.
DRAFT – 2013-06-21
Page 101
Orographic. Physical geography that pertains to mountains and to features directly connected with mountains and their general effect on storm path and generation of rainfall.
Outlet. An opening through which water can be freely discharged from a reservoir to the river for a particular purpose.
Outlet works. A dam appurtenance that provides release of water (generally controlled) from a reservoir.
Overflow dam (section). A section or portion of a dam designed to be overtopped.
Parapet wall. A solid wall built along the top of a dam (upstream or downstream edge) used for ornamentation, for safety of vehicles and pedestrians, or to prevent overtopping caused by wave runup.
Peak flow. The maximum instantaneous discharge that occurs during a flood. It is coincident with the peak of a flood hydrograph.
Pervious zone. A part of the cross section of an embankment dam comprising material of high permeability.
Phreatic surface. The free surface of water seeping at atmospheric pressure through soil or rock.
Piezometer. An instrument used for measure water levels or pore water pressures in embankments, foundations, abutments, soil, rock, or concrete.
Piping. The progressive development of internal erosion by seepage.
Predominant period. The period(s) at which maximum spectral amplitudes are shown on response spectra. Normally, acceleration response spectra are used to determine the predominant period(s) of the earthquake ground motion.
Probability. The likelihood of an event occurring.
Probable. Likely to occur; reasonably expected; realistic.
Probable Maximum Flood (PMF). See Flood.
Probable Maximum Precipitation (PMP). Theoretically, the greatest depth of precipitation for a given duration that is physically possible over a given size storm area at a particular geographical location during a certain time of the year.
Reservoir. A body of water impounded by a dam and in which water can be stored.
Reservoir regulation procedure (Rule Curve): The compilation of operating criteria, guidelines, and specifications that govern the storage and release function of a reservoir. It may also be referred to as operating rules, flood control diagram, or water control schedule. These are usually expressed in the form of graphs and tabulations, supplemented by concise specifications and are often incorporated in computer programs. In general, they indicate limiting rates of reservoir releases required or allowed during various seasons of the year to meet all functional objectives of the project.
DRAFT – 2013-06-21
Page 102
Reservoir rim. The boundary of the reservoir including all areas along the valley sides above and below the water surface elevation associated with the routing of the IDF.
Reservoir surface area. The area covered by a reservoir when filled to a specified level.
Response spectrum. A plot of the maximum values of acceleration, velocity, and/or displacement response of an infinite series of single-degree-of-freedom systems subjected to a time-history of earthquake ground motion. The maximum response values are expressed as a function of natural period for a given damping.
Scaling. An adjustment to an earthquake time-history or response spectrum where the amplitude of acceleration, velocity, and/or displacement is increased or decreased, usually without change to the frequency content of the ground motion.
Seepage. The internal movement of water that may take place through the dam, the foundation or the abutments.
Seiche. An oscillating wave in a reservoir caused by a landslide into the reservoir or earthquake-induced ground accelerations or fault offset or meteorological event.
Seismic Moment (Mo). A measure of the earthquake size containing information on the rigidity of the elastic medium in the source region, average dislocation, and area of faulting. It determines the amplitude of the long-period level of the spectrum of ground motion. It is calculated as:
Mo = Shear Modulus of Faulted Rock (Dynes/cm2) x Length of Fault Rupture Zone (cm) x Width of Fault (cm) x Displacement of Fault (cm)
Seismotectonic province. A geologic area characterized by similarity of geologic structure and tectonic and seismic history.
Seismotectonic source area(s). An area or areas of known or potential seismic activity that may lack a specific identifiable seismotectonic structure.
Seismotectonic structure. An identifiable dislocation or distortion within the earth's crust resulting from recent tectonic activity or revealed by seismologic or geologic evidence.
Sensitivity analysis. An analysis in which the relative importance of one or more of the variables thought to have an influence on the phenomenon under consideration is determined.
Settlement. The vertical downward movement of a structure or its foundation.
Significant wave height. Average height of the one-third highest individual waves. May be estimated from wind speed, fetch length, and wind duration
Slope. Inclination from the horizontal. Sometimes referred to as batter when measured from vertical.
Slope protection. The protection of a slope against wave action or erosion.
Sluice. An opening for releasing water from below the static head elevation.

DRAFT – 2013-06-21
Page 103
Smooth response spectrum. A response spectrum devoid of sharp peaks and valleys that specifies the amplitude of the spectral acceleration, velocity, and/or displacement to be used in the analyses of the structure.
Spectrum intensity. The integral of the pseudovelocity response spectrum taken over the range of structural vibration periods from 0.1 to 2.5 seconds.
Spillway. A structure over or through which flow is discharged from a reservoir. If the rate of flow is controlled by mechanical means, such as gates, it is considered a controlled spillway. If the geometry of the spillway is the only control, it is considered an uncontrolled spillway.
Spillway, auxiliary. Any secondary spillway that is designed to be operated infrequently, possibly in anticipation of some degree of structural damage or erosion to the spillway that would occur during operation.
Spillway, emergency. See Spillway, auxiliary.
Spillway, service. A spillway that is designed to provide continuous or frequent regulated or unregulated releases from a reservoir, without significant damage to either the dam or its appurtenant structures. This is also referred to as principal spillway.
Spillway capacity: The maximum spillway outflow that a dam can safely pass with the reservoir at its maximum level.
Spillway channel. An open channel or closed conduit conveying water from the spillway inlet downstream.
Spillway chute. A steeply sloping spillway channel that conveys discharges at super-critical velocities.
Spillway crest. The lowest level at which water can flow over or through the spillway.
Spillway Design Flood. See Flood, Inflow Design.
Spillway, fuse plug. A form of auxiliary spillway with an inlet controlled by a low embankment designed to be overtopped and washed away during an exceptionally large flood.
Spillway, shaft. A vertical or inclined shaft into which water spills and then is conveyed through, under, or around a dam by means of a conduit or tunnel. If the upper part of the shaft is splayed out and terminates in a circular horizontal weir, it is termed a bellmouth or morning glory spillway.
Stability. The condition of a structure or a mass of material when it is able to support the applied stress for a long time without suffering any significant deformation or movement that is not reversed by the release of the stress.
Stilling basin. A basin constructed to dissipate the energy of rapidly flowing water, e.g., from a spillway or outlet, and to protect the riverbed from erosion.
Stillwater level. The elevation that a water surface would assume if all wave actions were absent.

DRAFT – 2013-06-21
Page 104
Stoplogs. Large logs, timbers, or steel beams placed on top of each other with their ends held in guides on each side of a channel or conduit so as to provide a cheaper or more easily handled means of temporary closure than a bulkhead gate.
Storage. The retention of water or delay of runoff either by planned operation, as in a reservoir, or by temporary filling of overflow areas, as in the progression of a flood wave through a natural stream channel. Definitions of specific types of storage in reservoirs are:
Active storage. The volume of the reservoir that is available for some use such as power generation, irrigation, flood control, water supply, etc. The bottom elevation is the minimum operating level. The top elevation is the maximum normal operating level.
Dead storage. The storage that lies below the invert of the lowest outlet and that, therefore, cannot readily be withdrawn from the reservoir.
Flood surcharge. The storage volume between the top of the active storage and the design water level.
Inactive storage. The storage volume of a reservoir between the crest of the invert of the lowest outlet and the minimum operating level.
Live storage. The sum of the active-and the inactive storage.
Reservoir capacity. The sum of the dead and live storage of the reservoir.
Surcharge. The volume or space in a reservoir between the controlled retention water level and the maximum water level. Flood surcharge cannot be retained in the reservoir but will flow out of the reservoir until the controlled retention water level is reached.
Surface waves. Waves that travel along or near the surface and include Rayleigh (Sv) and Love (SH) Waves of an earthquake.
Tailwater. The water immediately downstream from a dam. The water surface elevation varies due to fluctuations in the outflow from the structures of a dam and due to downstream influences of other dams or structures. Tailwater monitoring is an important consideration because a failure of a dam will cause a rapid rise in the level of the tailwater.
Toe of the dam. The junction of the downstream slope or face of a dam with the ground surface; also referred to as the downstream toe. The junction of the upstream slope with ground surface is called the heel or the upstream toe.
Topographic map. A detailed graphic delineation (representation) of natural and man-made features of a region with particular emphasis on relative position and elevation.
Top thickness (top width). The thickness or width of a dam at the level of the top of dam (excluding corbels or parapets). In general, the term thickness is used for gravity and arch dams, and width is used for other dams.
Trashrack. A device located at an intake to prevent floating or submerged debris from entering the intake.
Tributary. A stream that flows into a larger stream or body of water
DRAFT – 2013-06-21
Page 105
Unit Hydrograph. See Hydrograph, unit.
Valve. A device fitted to a pipeline or orifice in which the closure member is either rotated or moved transversely or longitudinally in the waterway so as to control or stop the flow.
Watershed. The area drained by a river or river system or portion thereof. The watershed for a dam is the drainage area upstream of the dam.
Watershed divide. The divide or boundary between catchment areas (or drainage areas).
Wave protection. Riprap, concrete, or other armoring on the upstream face of an embankment dam to protect against scouring or erosion due to wave action.
Wave runup. Vertical height above the stillwater level to which water from a specific wave will run up the face of a structure or embankment.
Weir. A notch of regular form through which water flows.
Weir, broad-crested. An overflow structure on which the nappe is supported for an appreciable length in the direction of flow.
Weir, sharp-crested. A device for measuring the rate of flow of water. It generally consists of a rectangular, trapezoidal, triangular, or other shaped notch, located in a vertical, thin plate over which water flows. The height of water above the weir crest is used to determine the rate of flow.
Wind setup. The vertical rise in the stillwater level at the face of a structure or embankment caused by wind stresses on the surface of the water.

DRAFT – 2013-06-21
Page 106
11. References
Anderson, L.W., and Ake, J.P. (2003), Probabilistic Fault Displacement Hazard Analysis for Lauro Dam, Cachuma Project, California: Technical Memorandum No. D8330-2003-12, Bureau of Reclamation, Denver, Colorado, 19 p.
Annandale, G. W. (2006) Scour Technology: Mechanics and Engineering Practice, McGraw-Hill.
ANSI/ANS (1992), Determining Design Basis Flooding at Nuclear Power Plant Sites, ANSI/ANS Standard 2.8, American National Standards Institute/American Nuclear Society, La Grange Park, IL.
ASCE (2005a), Seismic Design Criteria for Structures, Systems, and Components in Nuclear Facilities, ASCE/SEI 43-05, American Society of Civil Engineers, Reston, VA.
ASCE (2010), Minimum Design Loads for Buildings and Other Structures, ASCE/SEI 7-10, American Society of Civil Engineers, Reston, VA.
Baecher, G. B., M. E. Paté, and R. De Neufville (1980), Risk of Dam Failure in Benefit-Cost Analysis, Water Resources Research, 16(3), 449-456.
British Dam Society (2103), British Dam Society Web Site, www.britishdams.org, Accessed April 7, 2013.
CADWR (2012), Urban Levee Design Criteria, State of California, Natural Resources Agency, Department of Water Resources, Sacramento, CA
Chiou, B., R. Darragh, N. Gregor, and W. Silva (2008), NGA Project Strong-Motion Database, Earthquake Spectra, 24(1), 23-44.
CODNR (2010), Guidelines for Dam Breach Analysis, State of Colorado, Department of Natural Resources, Division of Water Resources, Office of the State Engineer, Dam Safety Branch, Denver, CO.
Costa, John E. (1985), Floods from Dam Failures, Open-File Report 85-560, U.S. Department of Interior, Geological Survey, Denver, CO, 54 p.
EPRI (1989), “Probabilistic Seismic Hazard Evaluation at Nuclear Plant Sites in the Central and Eastern United States: Resolution of the Charleston Issue,” NP-6395-D, Electric Power Research Institute, April 1989.
FEMA (2004), Federal Guidelines for Dam Safety: Glossary of Terms, U.S. Department of Homeland Security, Federal Emergency Management Agency, Washington, D.C.
FEMA (2005), Federal Guidelines for Dam Safety: Earthquake Analyses and Design of Dams, U.S. Department of Homeland Security, Federal Emergency Management Agency, Washington, D.C.

DRAFT – 2013-06-21
Page 107
FEMA (2009), Dam Safety in the United States: A Progress Report on the National Dam Safety Program Fiscal Years 2006 and 2007, FEMA Report P-759, U.S. Department of Homeland Security, Federal Emergency Management Agency, Washington, D.C.
FEMA (2011), Coastal Construction Manual, FEMA Report P-55, U.S. Department of Homeland Security, Federal Emergency Management Agency, Washington, D.C.
FEMA (2012), Summary of Existing Guidelines for Hydrologic Safety of Dams, FEMA Report P-919, U.S. Department of Homeland Security, Federal Emergency Management Agency, Washington, D.C.
FERC (1991), Engineering Guidelines for the Evaluation of Hydropower Projects, Chapter 4: Embankment Dams, Federal Energy Regulatory Commission, Washington, DC.
FERC (1997), Engineering Guidelines for the Evaluation of Hydropower Projects, Chapter 10: Other Dams, Federal Energy Regulatory Commission, Washington, DC.
FERC (1999), Engineering Guidelines for the Evaluation of Hydropower Projects, Chapter 11: Arch Dams, Federal Energy Regulatory Commission, Washington, DC.
FERC (2002), Engineering Guidelines for the Evaluation of Hydropower Projects, Chapter 3: Gravity Dams, Federal Energy Regulatory Commission, Washington, DC.
Fread, D.L. (1991), BREACH: An Erosion Model for Earthen Dam Failures, U.S. Department of Commerce, National Oceanic and Atmospheric Administration, National Weather Service, Office of Hydrology, Hydrologic Research Laboratory: Washington, D.C.
Fread, D.L. (2006), Dam-Breach Floods, in ADSO Advanced Technical Seminar: “Dam Failure Analysis”, jointly sponsored by the U.S. Department of Homeland Security, Federal Emergency Management Agency, and the Association of State Dam Safety Officials, July 25-28, 2006, Burlington VT.
Froehlich, David C. (1995a), “Peak Outflow from Breached Embankment Dam,” Journal of Water Resources Planning and Management, 121(1), pp. 90-97.
Froehlich, David C., (1995b), “Embankment Dam Breach Parameters Revisited,” Water Resources Engineering, Proceedings of the 1995 ASCE Conference on Water Resources Engineering, San Antonio, Texas, August 14-18, 1995, pp. 887-891.
Froehlich, David C. (2008), “Embankment Breach Parameters and Their Uncertainties”, Journal of Hydraulic Engineering, 134(12), pp. 1708-1721.
Gee, D.M. (2008), Comparison of Dam Breach Parameter Estimators, U.S. Army Corps of Engineers Hydrologic Engineering Center, Davis, CA.
Gee, D.M. and G.W. Brunner (2005), Dam Break Flood Routing Using HEC-RAS and NWS-FLDWAV, ASCE World Water and Environmental Resources Congress: Impacts of Global Climate Change, May 15-19. 2005, Anchorage, Alaska
Hanson, G.J., Temple, D.M., Hunt, S.L., Tejral, R.D. (2011). Development and Characterization of Soil Material Parameters for Embankment Breach. Applied Engineering in Agriculture. 27(4):587-595.

DRAFT – 2013-06-21
Page 108
Hanson, G.J., Temple, D. M., Morris, M., Hassan, M., Cook, K. (2005), Simplified breach analysis model for homogeneous embankments: Part II, Parameter inputs and variable scale model comparisons, in Proceedings of 2005 the U.S. Society on Dams Annual Meeting and Conference. 2005: Salt Lake City, Utah
Johnson, F.A., and Illes, P. (1976), A Classification of Dam Failures, International Water Power and Dam Construction, December Issue, pp. 43-46.
Kirkpatrick, G. W. (1977), “Evaluation Guidelines for Spillway Adequacy,” The Evaluation of Dam Safety, Engineering Foundation Conference, Pacific Grove, California, ASCE, p. 395-414.
Kramer, S. L. (1996), Geotechnical Earthquake Engineering, Prentice-Hall.
MacDonald, Thomas C., and Jennifer Langridge-Monopolis (1984), “Breaching Characteristics of Dam Failures,” Journal of Hydraulic Engineering, vol. 110, no. 5, p. 567-586.
Mohamed, M.A.A. (2002), Embankment Breach Formation and Modelling Methods, Doctoral Dissertation, Open University: UK.
NAS (2012), Dam and Levee Safety and Community Resilience: A Vision for Future Practice, National Academy of Sciences, National Research Council, Washington, DC.
NERC (2012), Generation Availability Report, 2007-2011, North American Electric Reliability Corporation, http://www.nerc.com/pa/RAPA/gads/Pages/Reports.aspx, Accessed June 17, 2013.
National Park Service (2013), Discover Our Shared Heritage Travel Itinerary Bureau of Reclamation Historic Dams and Water Projects, http://www.nps.gov/nr/travel/ReclamationDamsAndWaterProjects/Bureau_of_Reclamation_Engineering_Achievements.html, Accessed April 7, 2013.
NCLS (2009), Recommendations for a National Levee Safety Program: A Report to Congress, National Committee on Levee Safety
NRCS (2009), WinDAM B: Quick Start Guide, U.S. Department of Agriculture, Natural Resources Conservation Service, Washington, DC.
NRCS (2011), WinDAM B Dam Overtopping Model, U.S. Department of Agriculture, Natural Resources Conservation Service, Washington, DC.
Pierce, M.W., Thorton, C.I. and Abt, S.R. (2010), “Predicting Peak Outflow from Breached Embankment Dams”, Prepared for: National Dam Safety Review Board Steering Committee on Dam Breach Equations, Colorado State University, Fort Collins, CO.
Ponce, V. M., R. M. Li, and D. B. Simons (1978), Applicability of Kinematic and Diffusion Models, ASCE Journal of the Hydraulics Division, 104(HY3), 355-360.
SCS (1981), Simplified Dam-Breach Routing Procedure, Technical Release No. 66 (Rev. 1), U.S. Department of Agriculture, Soil Conservation Service.
DRAFT – 2013-06-21
Page 109
SimScience (2013), SimScience Cracking Dams Web Site, http://www.simscience.org/cracks/advanced/butt_anat1.html, Acessed April 7, 2013.
Seed, H. B. (1979), “Considerations in the Earthquake-Resistant Design of Earth and Rockfill Dams”, 19th Rankine Lecture of the British Geotechnical Society, Geotechnique, XXIX(3), 215-263.
Singh Krishan P and Scarlatos (1988), Analysis of Gradual Earth-Dam failure, Journal of Hydraulic Engineering, Vol 114, No. 7 pp 21-42
Singh, Krishan P., and Snorrason, Arni (1982), Sensitivity of Outflow Peaks and Flood Stages to the Selection of Dam Breach Parameters and Simulation Models, SWS Contract Report 288, Illinois Department of Energy and Natural Resources, State Water Survey Division, Surface Water Section at the University of Illinois, 179 p.
Singh, Krishan P., and Snorrason, Arni (1984), “Sensitivity of Outflow Peaks and Flood Stages to the Selection of Dam Breach Parameters and Simulation Models,” Journal of Hydrology, vol. 68, p. 295-310.
Stepp, J. C., I. Wong, J. Whitney, R. Quittmeyer, N. Abrahamson, G. Toro, R. Youngs, K. Coppersmith, J. Savy, and T. Sullivan (2001), Probabilistic Seismic Hazard Analyses for Ground Motions and Fault Displacement at Yucca Mountain, Nevada, Earthquake Spectra, 17(1), 113-151.
Temple, D.M., Hanson, G. J., Neilsen, M. L., Cook, K. R. (2005), Simplified breach analysis model for homogeneous embankments: Part I, Background and model components, in Proceedings of the 2005 U.S. Society on Dams Annual Meeting and Conference, Salt Lake City, Utah.
Temple, D.M., Hanson, G.J., Neilsen, M.L. (2006), Windam-analysis of Overtopped Earth Embankment Dams. In: ASABE Annual International Meeting, July 9-12, 2006, Portland, Oregon. Paper No. 06-2105. 2006 CDROM.
USACE (1989), Retaining and Flood Walls, Engineer Manual 1110-2-2502, U.S. Army Corps of Engineers, Washington, D.C.
USACE (1994), Arch Dam Design, Engineer Manual 1110-2-2201, U.S. Army Corps of Engineers, Washington, D.C.
USACE (1995a), Gravity Dam Design, Engineer Manual 1110-2-2200, U.S. Army Corps of Engineers, Washington, D.C.
USACE (1995b), Seismic Design Provisions for Roller Compacted Concrete Dams, Engineer Pamphlet 1110-2-12, U.S. Army Corps of Engineers, Washington, D.C.
USACE (1995c), Earthquake Design and Evaluation for Civil Works Projects, Engineer Regulation 1110-2-1806, U.S. Army Corps of Engineers, Washington, D.C.
USACE (1995d), Flood Proofing Regulations, Engineer Pamphlet 1165-2-314, U.S. Army Corps of Engineers, Washington, D.C.

DRAFT – 2013-06-21
Page 110
USACE (2000), Design and Construction of Levees, Engineer Manual 1110-2-1913, U.S. Army Corps of Engineers, Washington, D.C.
USACE (2004), General Design and Construction Considerations for Earth and Rock-Fill Dams, Engineering Manual 1110-2-2300, U.S. Army Corps of Engineers, Washington, D.C.
USACE (2011a), Engineering and Design: Evaluation of I-Walls, Engineering Technical Letter 1110-2-575, U.S. Army Corps of Engineers, Washington, D.C.
USACE (2011b ), National Inventory of Dams Fact Sheet, U.S. Army Corps of Engineers, Army Geospatial Center, Alexandria, VA.
USACE (2011c), Safety of Dams – Policy and Procedures, Engineering Regulation 1110-2-1156, U.S. Army Corps of Engineers, Washington, D.C.
USBR (1976), Design of Gravity Dams, U.S. Department of Interior, Bureau of Reclamation, Denver, CO.
USBR (1977a), Design of Arch Dams, U.S. Department of Interior, Bureau of Reclamation, Denver, CO.
USBR (1977b), Design Criteria for Concrete Arch and Gravity Dams, Engineering Monograph No. 19, U.S. Department of Interior, Bureau of Reclamation, Denver, CO.
USBR (1982), Guidelines for Defining Inundated Areas Downstream from Bureau of Reclamation Dams, Reclamation Planning Instruction No. 82-11, June 15, 1982, U.S. Department of Interior, U.S. Bureau of Reclamation, Denver, CO
USBR (1983), Guidelines for Defining Inundated Areas Downstream from Bureau of Reclamation Dams, Reclamation Planning Instruction No. 83-05, April 6, 1983, U.S. Department of Interior, U.S. Bureau of Reclamation, Denver, CO.
USBR (1987), Design of Small Dams, U.S. Department of Interior, Bureau of Reclamation, Denver, CO.
USBR (1988), ACER Technical Memorandum No 11: Downstream Hazard Classification Guidelines, U.S. Department of Interior, Bureau of Reclamation, Denver, CO.
USBR (1998), Prediction of Embankment Dam Breach Parameters – A Literature Review and Needs Assessment, Report DSO-98-004, U.S. Department of Interior, Bureau of Reclamation, Denver, CO.
USBR (2011), Dam Safety Risk Analysis Best Practices Training Manual, Version 2.2, U.S. Department of Interior, Bureau of Reclamation, Denver, CO.
USCOLD (1999), Updated Guidelines for Selecting Seismic Parameters for Dam Projects, United States Committee on Large Dams, Denver, CO.
USGS (2008), Documentation for the 2008 Update of the United States National Seismic Hazard Maps, Open-File Report 2008–1128, U.S. Department of Interior, U.S. Geological Survey, Reston, VA.

DRAFT – 2013-06-21
Page 111
USNRC (1977), Design Basis Floods for Nuclear Power Plants, Regulatory Guide 1.59, Rev. 2, U.S. Nuclear Regulatory Commission, Washington, DC.
USNRC (2001), Technical Basis for Revision of Regulatory Guidance on Design Ground Motions: Hazard- and Risk-consistent Ground Motion Spectra Guidelines, NUREG/CR-6728, U.S. Nuclear Regulatory Commission, Washington, DC.
USNRC (2003), Procedures and Criteria for Assessing Seismic Soil Liquifaction at Nuclear Power Plant Sites, Regulatory Guide 1.198, U.S. Nuclear Regulatory Commission, Washington, DC.
USNRC (2007a), Review of Safety Analysis Reports for Nuclear Power Plants, NUREG-0800, U.S. Nuclear Regulatory Commission, Washington, DC.
USNRC (2007b), A Performance-Based Approach to Define the Site Specific Earthquake Ground Motion, Regulatory Guide 1.208, U.S. Nuclear Regulatory Commission, Washington, DC.
USNRC (2011), Design-Basis Flood Estimation for Site Characterization at Nuclear Power Plants in the United States of America, NUREG/CR-7046, Prepared by Pacific Northwest National Laboratory, U.S. Nuclear Regulatory Commission, Washington, DC.
USNRC (2012), Central and Eastern United States Seismic Source Characterization for Nuclear Facilities, NUREG-2115, U.S. Nuclear Regulatory Commission, Washington, DC.
Visser, K., Hanson, G.J., Temple, D., Neilsen, M. 2012. Earthern Embankment Overtopping Analysis using the WinDAM B Software. In: Dam Safety 2012. Proceedings of the Association of State Dam Safety Officials Annual Conference, September 16-20, 2012, Denver, CO. CDROM.
USSD (2006), Erosion of Unlined Spillways, United States Society on Dams, Denver, CO.
Von Thun, J. L., and Gillette, D. R. (1990), Guidance on Breach Parameters unpublished internal memorandum, U.S. Department of Interior, Bureau of Reclamation. Denver, Colorado.
Wahl, T.L. (2004), Uncertainty of Predictions of Embankment Dam Breach Parameters, Journal of Hydraulic Engineering, 130(5): p. 389-397.
Wahl, T.L. (2010), Dam Breach Modeling – An Overview of Analysis Methods, Parameters, Joint Federal Interagency Conference on Sedimentation and Hydrologic Modeling, June 27 - July 1, Las Vegas, NV
Wahl, T.L. (2013), Personal communication.
Wibowo, J.L., D.E. Yule, E. Villanueva, D.M. Temple, Earth and Rock Surface Spillway Erosion Risk Assessment, Alaska Rocks 2005, The 40th U.S. Symposium on Rock Mechanics (USRMS), June 25 - 29, 2005 , Anchorage, AK, American Rock Mechanics Association
DRAFT – 2013-06-21
Page 112
WSDE (2007), Dam Safety Guidelines Technical Note 1: Dam Break Inundation Analysis and Downstream Hazard Classification, Washington State Department of Ecology, Olympia, WA.
Wu, W. and S.S.Y. Wang (2010), An Introduction to the Latest Developments in Soil Erosion and Sediment Transport Modeling, in 11th International Symposium on River Sedimentation, September 6-9, 2010: Stellenbosch, South Africa.
Xiong, Y. (2011), A Dam Break Analysis Using HEC-RAS, Journal of Water Resource and Protection, 3: p. 370-379.
Xu, Y. and Zhang, L.M., 2009. Breaching parameters for earth and rockfill dams, Journal of Geotechnical and Geoenvironmental Engineering, vol. 135, no. 12, p. 1957-1970.
Youngs, R. R., et al. (2003), A Methodology for Probabilistic Fault Displacement Hazard Analysis (PFDHA), Earthquake Spectra, 19(1), 191-219.
Youssef, Tahani Fahim (2013), Heading-Up Structures Web Site, http://osp.mans.edu.eg/tahany/dams1.htm, Accessed April 7, 2013.