guidelines for data collection to measure sdg 4.7.4 and 4.7
TRANSCRIPT

Guidelines for Data Collection to Measure SDG 4.7.4 and 4.7.5
June 2021

1
UNESCO
The constitution of the United Nations Educational, Scientific and Cultural Organization (UNESCO) was adopted by 20 countries at the London Conference in November 1945 and entered into effect on 4 November 1946. The Organization currently has 195 Member States and 11 Associate Members.
The main objective of UNESCO is to contribute to peace and security in the world by promoting collaboration among nations through education, science, culture and communication in order to foster universal respect for justice, the rule of law, and the human rights and fundamental freedoms that are affirmed for the peoples of the world, without distinction of race, sex, language or religion, by the Charter of the United Nations.
To fulfil its mandate, UNESCO performs five principal functions: 1) prospective studies on education, science, culture and communication for tomorrow's world; 2) the advancement, transfer and sharing of knowledge through research, training and teaching activities; 3) standard-setting actions for the preparation and adoption of internal instruments and statutory recommendations; 4) expertise through technical cooperation to Member States for their development policies and projects; and 5) the exchange of specialized information.
UNESCO Institute for Statistics
The UNESCO Institute for Statistics (UIS) is the statistical office of UNESCO and is the UN depository for global statistics in the fields of education, science, technology and innovation, culture and communication. The UIS was established in 1999. It was created to improve UNESCO's statistical programme and to develop and deliver the timely, accurate and policy-relevant statistics needed in today’s increasingly complex and rapidly changing social, political and economic environments.
This paper was written by: Andres Sandoval-Hernandez (University of Bath), Maria Magdalena Isac (KU Leuven), Diego Carrasco (Pontificia Universidad Católica de Chile) and Daniel Miranda (Pontificia Universidad Católica de Chile).
Published in 2021 by:
UNESCO Institute for Statistics P.O. Box 6128, Succursale Centre-Ville Montreal, Quebec H3C 3J7 Canada Tel: +1 514-343-6880 Email: [email protected] http://www.uis.unesco.org Ref: UIS/2021/LO/IP/67
© UNESCO-UIS 2021
This publication is available in Open Access under the Attribution-ShareAlike 3.0 IGO (CC-BY-SA 3.0 IGO) license (http://creativecommons.org/licenses/by-sa/3.0/igo/). By using the content of this publication, the users accept to be bound by the terms of use of the UNESCO Open Access Repository (http://www.unesco.org/open-access/terms-use-ccbysa-en).
The designations employed and the presentation of material throughout this publication do not imply the expression of any opinion whatsoever on the part of UNESCO concerning the legal status of any country, territory, city or area or of its authorities or concerning the delimitation of its frontiers or boundaries.
The ideas and opinions expressed in this publication are those of the authors; they are not necessarily those of UNESCO and do not commit the Organization.

2
Short Summary
In an effort to promote robust and comparable measurements of SDG 4 in this Decade of Action as nations strive to meet education targets, the UIS has spearheaded a methodological program on learning outcomes. Drawing from the program designed and implemented by the UIS, the Guidelines for Data Collection to Measure SDG 4.7.4 and 4.7.5 is authored by Andres Sandoval-Hernandez, Maria Magdalena, Diego Carrasco and Daniel Miranda. The document provides guidance to apply a recently developed strategy to assess two indicators that embody tolerance, respect and sustainable development, namely:
• Indicator 4.7.4: Percentage of students in lower secondary education showing adequate understanding of issues relating to global citizenship and sustainability
• Indicator 4.7.5: Percentage of students in lower secondary education showing proficiency in knowledge of environmental science and geoscience
Following a thorough review and endorsement by the UIS’ Technical Cooperation Group on the Indicators for SDG 4-Education 2030 (TCG), the measurement strategy has since been applied to the last cycles of TIMSS, PISA and ICCS to produce scores to measure Indicators 4.7.4 and 4.7.5 for 60 countries. While this marks a significant achievement, it is important to acknowledge that two-thirds of UN members have yet to participate in these assessments. To promote wider participation among UN members, this document serves as a robust and easy-to-use set of guidelines offering detailed technical guidance for countries on how to collect the data necessary to produce the information to measure and monitor SDG Indicators 4.7.4 and 4.7.5. Notably, these guidelines will aid in the production of information that is comparable with that of the 60 countries for which this data already exists.
3
Table of Contents
1. National and international assessments .......................................................................... 10 What information is produced by educational assessments? ........................................................ 11 The main phases of an educational assessment .............................................................................. 11
2. Decisions to be made for the national assessment .......................................................... 13 Who should carry out the assessment? ............................................................................................. 13 What population will be assessed and how frequently? ................................................................. 15
The population to be assessed ....................................................................................................... 15
The frequency of the assessment ................................................................................................... 17
What are the cost components of an assessment? .......................................................................... 17 3. The assessment framework and instruments .................................................................. 19
Background: why is it being assessed? .............................................................................................. 19 Definition of concepts: what is being assessed? ............................................................................... 20 Operationalization of concepts: what precisely is being assessed? ............................................... 20
Assessment instruments: how is it being assessed? .................................................................... 22
4. Designing a manual for questionnaire administrators .................................................... 24 What is a manual for test administration? ........................................................................................ 24 What is this manual for? ....................................................................................................................... 24 What sections should be included? .................................................................................................... 25 Good practices ....................................................................................................................................... 27
5. The questionnaire administrator ....................................................................................... 28 Selection of test administrators .......................................................................................................... 28 Instructions ............................................................................................................................................ 30 Quality procedures ............................................................................................................................... 31 Check list and common problems ...................................................................................................... 32
6. Sampling, weighting, and variance estimation ................................................................. 35 Sampling procedures ............................................................................................................................ 35
Definition of the target population................................................................................................. 36
Coverage and exclusions ................................................................................................................. 36
Sample size requirements ............................................................................................................... 38
School sampling design.................................................................................................................... 39
Weighting ............................................................................................................................................... 43 Within-school participation requirements .................................................................................... 44
Weighting procedures ...................................................................................................................... 44
Procedures to calculate participation rates .................................................................................. 47
Estimation of sampling variance ......................................................................................................... 50

4
Specialized software ......................................................................................................................... 53
7. Logistics of the national assessment ................................................................................. 54 Staff recommendation and contacting schools ................................................................................ 54 Logistics in instrument checks and distribution ............................................................................... 57 Administration and common problems ............................................................................................. 58 Quality issues ......................................................................................................................................... 58
8. Data preparation .................................................................................................................. 61 Data cleaning ......................................................................................................................................... 61 Codebook ............................................................................................................................................... 63
What is a codebook? ......................................................................................................................... 63
Types of codebook ............................................................................................................................ 64
Elements of a codebook ................................................................................................................... 66
How to build a codebook ................................................................................................................. 67
9. Producing scores................................................................................................................... 69 From standards to responses ............................................................................................................. 69 From responses to scores .................................................................................................................... 70 Cleaning the data .................................................................................................................................. 70 Measurement model ............................................................................................................................ 71 Generating scores ................................................................................................................................. 73 From scores to classifications .............................................................................................................. 80
8. Using the results of the national assessment ................................................................... 86 References .............................................................................................................................................. 87 Appendix I-a. Instrument to collect information for SDG 4.7.4 ...................................................... 91 Appendix I-b. Instrument to collect information for SDG Indicator 4.7.5 ..................................... 98 Appendix I-c. Examples of cognitive items released from ICCS and TIMSS ................................ 101 Appendix II. Questionnaire items and parameters used to produce the scores to measure SDG 7.4.4 and 7.4.5 ..................................................................................................................................... 109 Appendix III. Annotated code for producing scores ....................................................................... 137
Classify scores ................................................................................................................................. 141

5
List of tables
Table 1. Implementing agency (IA): potential tasks and skills sets required..................................... 15 Table 2. Global Content Framework for SDG Indicators 4.7.4 and 4.7.5 ........................................... 21 Table 3. Core conceptual learning dimensions for SDG Indicators 4.74 and 4.7.5 .......................... 22 Table 4. Contents of the administration manual .................................................................................. 25 Table 5. Contents of a test administration manual (example from the Department of Education, Papua New Guinea) .................................................................................................................................. 26 Table 6. Advantages and disadvantages of using different actors as questionnaire administrators ..................................................................................................................................................................... 29 Table 7. Administration checklist: an example from the Philippines ................................................. 32 Table 8. Elements of a sampling frame for a national assessment .................................................... 41 Table 9. Main staff members involved in the logistics of the assessment and their functions ...... 55 Table 10. Example of a national assessment: school tracking form .................................................. 56 Table 11. Elements of a mapping exercise for SDG Indicator 4.7.4 on gender equality ................. 69 Table 12. Minimal example of the contents of a cleaned data set for gender equality .................. 71 Table 13. Variable recoding for gender equality items ........................................................................ 74 Table 14. R code to import cleaned data and recode the original responses of gender equality items ........................................................................................................................................................... 74 Table 15. R code to fit a partial credit model with fixed parameters over gender equality responses ..................................................................................................................................................................... 76 Table 16.Mplus code to generate IRT score for Colombia ICCS data years 2009 and 2016 ........... 78 Table 17. R code to retrieve the generated IRT scores and classify participants above and below the standard cut score .............................................................................................................................. 82 Table 18. R code to estimate the percentage of students meeting the SDG 4.7.4 gender equality (socio-emotional) indicator ...................................................................................................................... 83

6
List of figures
Figure 1. Phases of an educational assessment ................................................................................... 12 Figure 2. Distribution of responsibilities for a national assessment .................................................. 14 Figure 3. Example of student tracking form .......................................................................................... 31 Figure 4. Population coverage and exclusions rates (example from ICCS 2016) ............................. 37 Figure 5. School and student sample sizes (example from ICCS 2016) ............................................. 39 Figure 6. Systematic PPs sampling of schools (example from ICCS 2016) ........................................ 42 Figure 7. Unweighted participation rates (example from ICCS) .......................................................... 48 Figure 8. Weighted participation rates ................................................................................................... 48 Figure 9. Categories into which countries should be placed with respect to sampling participation ..................................................................................................................................................................... 50 Figure 10. Example of the computation of replicate weights from ICCS 2016 ................................. 52 Figure 11. Example of a test administration form ................................................................................ 59 Figure 12. Examples of questions addressed by quality control monitors in TIMSS ....................... 60 Figure 13. Example of a succinct codebook to indicate participant sex ............................................ 64 Figure 14. Example of data file embedded codebook for participants sex indicator displayed in R ..................................................................................................................................................................... 65 Figure 15. Example of a detailed codebook for participants’ sex indicator ...................................... 65 Figure 16. Example of an instrument embedded codebook for participants sex indicator ........... 65 Figure 17. Instrument embedded codebook for “Students Like Learning Science” ......................... 67 Figure 18. Spreadsheet codebook example of ICCS 2016 (selected fields) ....................................... 68 Figure 19. Instrument embedded codebook for “Students' attitudes toward gender rights”................. 72 Figure 20. Latent variable model for gender equality items ............................................................... 73 Figure 21. Item-person map for gender equality .................................................................................. 81

7
Abbreviations and Acronyms
ERCE Estudio Regional Comparativo y Explicativo (Regional Comparative and Explanatory Study)
ESD Education for Sustainable Development GAML Global Alliance to Monitor Learning GCED Global Citizenship and Education GEMR Global Education Monitoring Report IBE International Bureau of Education ICCS International Civic and Citizenship Education Study IEA International Association for the Evaluation of Education Achievement ILSA International Large-Scale Assessments ISCED International Standard Classification of Education JRR Jackknife repeated replication technique MOS Measure of size NC National Coordinator PASEC Programme d’analyse des systems éducatifs de la CONFEMEN (Programme of Analysis
of Education Systems of CONFEMEN) PIAAC Programme for the International Assessment of Adult Competencies PIRLS Progress in International Reading Literacy Study PISA Programme for International Student Assessment PPS Probability proportional to size PSU Primary sampling units RALSA R Analyzer for Large-Scale Assessments RAMSE Regional Assessment of Mathematics, Science, and English SACMEQ Southern and Eastern Africa Consortium for Monitoring Educational Quality SDS Senior district manager SEA-PLM Southeast Asia Primary Learning Metrics SES Socio-economic status SPSS Statistical Package for the Social Sciences STBA Student test booklet allocation TCG Technical Cooperation Group on the Indicators for SDG 4-Education 2030 TIMSS Trends in International Mathematics and Science Study UNESCO United Nations Educational, Scientific and Cultural Organization UIS UNESCO Institute for Statistics

8
Introduction
When the UN Member States adopted the 2030 Agenda and its 17 Sustainable Development Goals (SDGs), there was not much discussion about how these goals were going to be measured. With just under ten years left to achieve the SDGs, world leaders at the SDG Summit in September 2019 called for a Decade of Action and delivery for sustainable development. The Decade of Action calls for accelerating sustainable solutions to all the world’s biggest challenges – ranging from poverty and gender to climate change, inequality and improving the quality of education for all. So, deciding on and implementing a measurement strategy for all SDGs and their targets has become a pressing issue.
In this document we provide guidelines to apply a recently developed strategy for assessing two indicators that embody tolerance, respect and sustainable development:
• Indicator 4.7.4: Percentage of students in lower secondary education showing adequate understanding of issues relating to global citizenship and sustainability.
• Indicator 4.7.5: Percentage of students in lower secondary education showing proficiency in knowledge of environmental science and geoscience.
This measurement strategy is based on International Large-Scale Assessments (ILSAs) in education (Sandoval-Hernández, Isac, & Miranda, 2019; Sandoval-Hernández & Carrasco, 2020). ILSAs are a natural fit for assessing these particular thematic indicators because existing studies have already collected much of the relevant information. Studies like the Trends in International Mathematics and Science Study (TIMSS), the International Civic and Citizenship Education Study (ICCS) and the Programme for International Student Assessment (PISA) are well suited for providing a proxy measurement of Indicators 4.7.4 and 4.7.5. These ILSAs provide high coverage for the concepts considered in these indicators, incorporate them naturally in their frameworks, collect comparable data consistently (allowing long-term monitoring), and have unrivalled data quality assurance mechanisms in place (ensuring data accuracy, validity and comparability).
This measurement strategy has been reviewed and endorsed by the UNESCO Institute for Statistics’ (UIS) Technical Cooperation Group on the Indicators for SDG 4-Education 2030 (TCG), which is responsible for the development and maintenance of the thematic indicator framework for the follow-up and review of SDG 4. The strategy has already been applied to the last cycles of TIMSS, PISA and ICCS and allowed to produce scores to measure Indicators 4.7.4 and 4.7.5 for 60 countries. The scores are available on the UIS database. While having data to measure and monitor these indicators in 60 countries is a significant achievement, it is important to acknowledge that two-thirds of UN Member States do not participate in these studies.
For this reason, we have prepared this document to offer robust and easy-to-use guidelines. These include detailed technical guidelines for countries that have not participated in PISA, TIMSS or ICCS on collecting the data necessary to produce the information that will allow them to measure and monitor Indicators 4.7.4 and 4.7.5. More importantly, by following these guidelines countries will be able to produce information that is comparable with that of the 60 countries for which this data already exists.
These guidelines are based on two previous reports in which we propose (Sandoval-Hernández, Isac, & Miranda, 2019) and implement (Sandoval-Hernández & Carrasco, 2020) the measurement

9
strategy for Indicators 4.7.4 and 4.7.5; and on a number of materials that have been produced by different authors and organizations to introduce key concepts in the area of student assessment, review the evidence on their effectiveness, and provide practical insights to produce national assessments of educational achievement (e.g., Anderson & Morgan, 2008a; Greaney & Kellaghan, 2008, 2012; Kellaghan, Greaney, & Murray, 2009; Lietz, Cresswell, Rust, & Adams, 2017; Rutkowski, von Davier, & Rutkowski, 2014; Shiel & Cartwright, 2015). We also include relevant information from the technical manuals and user guides of TIMSS (Martin, von Davier, & Mullis, 2020), PISA (OECD, 2021) and ICCS (Wolfram Schulz, Carstens, Losito, & Fraillon, 2018), particularly the instruments or background questionnaires and their sampling strategy. When one of the chapters is mainly based on one or several of these documents, we indicate it, so the reader can consult those materials to obtain further details.
Apart from this introduction, these guidelines are organized around ten chapters (see Figure 1). In the first one, we define what a national assessment is, its main elements and discuss a list of the questions that the assessment described in these guidelines can answer. In the second, we present the decisions that have to be made in preparation for conducting a nationally representative assessment. In the third chapter, we introduce the assessment framework used by the measurement strategy for Indicators 4.7.4 and 4.7.5, and how this framework maps into the instruments of PISA, TIMSS and ICCS. Importantly, Chapter 3 also includes the instruments that countries would need to administer their national samples in order to obtain the scores to measure and monitor Indicators 4.7.4 and 4.7.5. Chapters 4 and 5 contain the procedures to be followed to produce a manual for the administration of the assessment, choosing the administrators and ensuring the quality of the data collected. The next chapter provides instructions for selecting a nationally representative sample of schools and students. Chapter 7 focuses on the logistics of the assessment and Chapter 8 on the preparation, validation and management of the data collected. Finally, the last two chapters introduce the procedures to produce the scores and present the results of the measurement strategy.

10
1. National and international assessments
National assessments are designed to describe the achievement of students in a curriculum area aggregated to provide an estimate of the achievement level in the education system as a whole at a particular age or grade level (Greaney & Kellaghan, 2008). International large-scale assessments (ILSAs) share the same objective, but their main characteristic is that the assessment is standardized to be conducted in more than one country, in a way that their results can be validly compared. Normally, these assessments involve the administration of achievement tests to a sample of students, usually focusing on a particular sector in the system (e.g., Grade 8 in TIMSS and ICCS or 15-year-old students in PISA). Teachers and others (for example, parents, principals, and students) are normally asked to provide background information, usually in questionnaires. When related to student achievement, this background information can provide insights about how achievement is related to factors such as family socioeconomic status, levels of teacher training, teachers’ attitudes toward curriculum areas, teacher knowledge, and availability of teaching and learning materials. Note that the guidelines provided in this document will focus not on the student achievement test but on the background questionnaires. More information about this point can be found in Chapter 3, where the assessment framework and the instruments of this measurement strategy are introduced.
To provide statistically valid results in sample based-assessments, a representative sample of schools (usually 150 to 200 schools) is drawn from each country, and a sample of students is randomly drawn from within each of the sampled schools, either by sampling entire classrooms or by sampling students across classrooms (usually using probabilities proportional to size). More details about the sampling strategy in (inter)national assessments can be found in Chapter 6. Although the best-known ILSAs feature a number of similarities, there are also some substantial differences that need to be considered when comparing the results for different education systems (see Rocher & Hastedt, 2020 for a detailed discussion on this point).
Differences also exist from country to country and from assessment to assessment. First, they differ in the frequency with which assessments are carried out. In some countries, an assessment is carried out every year, and in other systems, assessments are less frequent. PISA, for example, is implemented every three years, TIMSS every four years and ICCS in seven year cycles. Second, they differ in the agency that carries out an assessment. National assessments are normally carried out by the ministry of education or by a national research centre, a consortium of education bodies, a university, or an examination board. The two main organizations implementing global assessments are the International Association for the Evaluation of Education Achievement (IEA), which organizes studies like TIMSS, PIRLS and ICCS; and the Organisation for Economic Co-operation and Development (OECD) that conducts studies like PISA and PIAAC. There, however, other organizations conducting or supporting regional assessments, such as UNESCO’s ERCE in Latin America, UNICEF’s SEA-PLM in South-East Asia, SACMEQ in South-East Africa or PASEC in Francophone countries in West Africa. Third, participation by a school may be voluntary or may be mandated. When voluntary, non-participation of some schools will almost invariably bias the results and lead to an inaccurate reflection of achievement levels in the education system.

11
What information is produced by educational assessments?
Coming back to the similarities among assessments, according to Kellaghan and Greaney (2001, 2004), all educational assessments seek answers to one or more of the following questions:
• How well are students learning in the education system (with reference to general expectations, aims of the curriculum, preparation for further learning, or preparation for life)?
• Does evidence indicate particular strengths and weaknesses in students’ knowledge and skills?
• Do particular subgroups in the population perform poorly? Do disparities exist, for example, between the achievements of (a) boys and girls, (b) students in urban and rural locations, (c) students from different language or ethnic groups, or (d) students in different regions of the country?
• What factors are associated with student achievement? To what extent does achievement vary with characteristics of the learning environment (for example, school resources, teacher preparation and competence, and type of school) or with students’ home and community circumstances?
• Are government standards being met in the provision of resources (for example, textbooks, teacher qualifications, and other quality inputs)?
• Do the achievements of students change over time?
The guidelines contained in this document will produce information to address most of these questions. The assessment described here can produce information about the proportion of students in a given population who reach the targets suggested not by a curriculum but by SDG Indicators 4.7.4 and 4.7.5. Because our assessment framework disaggregates both indicators into specific targets, the assessment can also provide evidence of the strengths and weaknesses associated with each of them. The scales or scores used to measure each indicator can also be estimated for subgroups of the population (i.e., boys/girls, urban/rural, high/low SES) so information about disparities can also be obtained. Due to the systematic application of the ILSAs, it is also possible to have information to compare with other countries at different time points; and of course, the assessment we describe here can also be applied to the same cohort at different time points. This question may be of particular interest if education system reforms are being undertaken. It is important, however, to note that these guidelines refer only to the application of background questionnaires and not achievement tests. This is because the background questionnaires used in TIMSS, PISA and ICCS are publicly available on the websites of the respective organizations, while achievement tests are kept confidential for obvious reasons.
The main phases of an educational assessment
For educational assessments to produce high-quality information, they need to be of high quality, technically sound, have a comprehensive communication strategy and be useful for education policy. To achieve this aim, different authors and organizations consider different keys phases in the implementation of high-quality educational assessments. Lietz and colleagues (2017), for example, consider that there are 13 key phases, Greaney and Kellaghan (2008) consider 16, while

12
the IEA organizes its studies in 10 main steps (2017). All these categorizations include the same key phases and differ only in the way they are organized. Figure 1 shows a synthesis of these phases and the chapters of these guidelines where each is discussed.
Figure 1. Phases of an educational assessment

13
2. Decisions to be made for the national assessment
Who should carry out the assessment?
In each country, the ministry of education should preferably endorse the assessment by expressing an interest in monitoring the learning outcomes to be achieved under SDG thematic Indicators 4.7.4 and 4.7.5 and by giving an endorsement to the current measurement strategy.1 The ministry of education may appoint a national steering committee (NSC) to oversee the work and ensure that the achieved results can play a role in future policy making.
The composition of the NSC is at the discretion of the ministry and may vary from country to country depending on the power structure within the education system. The NSC may include representatives of the ministry as well as other stakeholders identified as target groups for the dissemination and use of results such as teachers, teacher trainers, school inspectors, curriculum personnel, student representatives, representatives of international and national NGOs etc. The NSC will provide overall guidance and oversee the work of an implementing agency (IA) that will be appointed by the ministry (when necessary, in consultation with other structures such as provincial authorities) to carry out the assessment.
The IA should be a team with proven technical expertise and credibility in organizing large-scale educational assessments. Various countries organizing national and international assessments often assign this responsibility to different types of groups. These can be, for example: a) a team set up within the ministry of education or a public examination agency supported by the ministry of education, b) an autonomous research team working in a university or research center, c) an autonomous international organization with experience in large-scale educational assessment (e.g., IEA, OECD), or d) a team set up within the ministry or an autonomous research team working in a university or research center, which receives the support of an autonomous international organization with experience in large-scale educational assessment. The decision often involves a reflection on several aspects such as the technical capacity of the IA, the credibility of the IA for different stakeholders, the costs components associated with each choice, and other administrative and political circumstances2.
1 See also: Sandoval-Hernandez, A., Isac, M.M. & Miranda, D. (2019); Sandoval-Hernandez, A. & Carrasco, D. (2020); and the UNESCO Institute for Statistics official data repository: http://data.uis.unesco.org/
2 For a detailed analysis of advantages and disadvantages of different categories of implementation agencies, please refer to Greaney, V., & Kellaghan, T. (2008, p. 26). Available from: https://openknowledge.worldbank.org/handle/10986/6904

14
Figure 2. Distribution of responsibilities for a national assessment
The IA will have the main responsibility in carrying out the assessment preferably under the guidance of the ministry of education via the NSC (see Figure 2). Given that the IA will have the main role in carrying out the assessment, the level of technical capacity should be the main criterion in deciding who should be given this responsibility. Table 1 presents a non-exhaustive list of the potential tasks and skills sets that are required to carry out the assessment and should be considered when judging the technical expertise of an IA.
Ministry of Education
•Expressing interest and commitment in monitoring the learning outcomes that should be achieved under SDG thematic Indicators 4.7.4 and 4.7.5.
•Providing policy guidance via the National Steering Committee (NSC).
National Steering Committee (NSC)
•Identifying and endorsing the purpose and rationale of the assessment.•(Potentially) selecting an implementing agency (IA) to conduct the assessment. •Providing overall guidance and overseeing the work of the implementing agency (IA).
Implementing Agency (IA)
•Main responsibility in carrying out all the elements of the assessment (see also Chapter 1 and Table 2.1).

15
Table 1. Implementing agency (IA): potential tasks and skills sets required
Potential tasks Required skills and experience
• Organizing staff, coordinating and scheduling activities, interacting with different stakeholders (e.g., policymakers, schools and teachers)
• Translating and adapting the assessment framework and questionnaires
• Developing manuals for questionnaire administration
• Providing training to test administrators
• Creating a sampling frame
• Contacting and coordinating work with schools
• Collecting data
• Data entry, data management and cleaning
• Statistical analyses (e.g., computing survey weights, producing estimates)
• Drafting and disseminating results for different audiences
• Strong managerial, financial and communication skills (especially from team leader)
• High knowledge of the theoretical framework guiding the assessment
• Good organizational skills
• High implementation and operational skills
• Experience in working with schools and young people
• Collaboration skills
• Advanced statistical and analytical competence in selecting samples, computing survey weights, preparing data files, producing estimates etc.
• Flexibility, openness to learning new methodological approaches
• Ability to communicate findings to different audiences
Source: Own elaboration, partially based on Greaney & Kellaghan (2008), p. 28-29.
What population will be assessed and how frequently?
The population to be assessed
In all national and international assessments, the population to be assessed should be determined by the aims of the assessment and the corresponding information needs. In this assessment, the aim is to collect the data necessary to produce the information that will allow each country to measure and monitor SDG Indicators 4.7.4 and 4.7.5 and compare this information with the outcomes of the 60 countries for which data already exists (see Chapter 1).

16
The population to be assessed is therefore defined by the current operationalization of Indicators 4.7.4 and 4.7.5 as endorsed by the UIS’ Technical Cooperation Group on the Indicators for SDG 4-Education 2030 (TCG) and published in the UIS official data repository (see: SDG / Goals 1 and 4 / SDG4 / Indicator 4.7.4 and Indicator 4.7.5): http://data.uis.unesco.org/):
• Indicator 4.7.4: Percentage of students in lower secondary education showing adequate understanding of issues relating to global citizenship and sustainability.
• Indicator 4.7.5: Percentage of students in lower secondary education showing proficiency in knowledge of environmental science and geoscience
The content of SDG Indicators 4.7.4 and 4.7.5 defines the population to be assessed as “students in lower secondary education”. Therefore, the assessment should focus on the education system (e.g., excluding out-of-school children) and target the population of lower secondary education students (i.e., students attending lower secondary education). Moreover, the operationalization of the indicators implies that the data to be collected should be used to provide information about the overall performance of the education system at the level of education under analysis (percentage of students in lower secondary education) and not to provide individual student results for each individual in the population. Furthermore, the data should be preferably collected at the end of lower secondary education to provide information regarding the two indicators (4.7.4 and 4.7.5) for the students completing lower secondary education. The most relevant definition of the target population for this assessment is the one employed by the IEA’s ICCS study: all students enrolled in the grade that represents eight years of schooling, counting from the first year of ISCED Level 1.3 For most countries the target grade will be Grade 8 or its national equivalent (see Chapter 6 for further details).
Given the aims of the assessment, their operationalization and the definition of the target population, it is not necessary to obtain data for each student in the population (e.g., census-based approaches). The inferences of interest can be obtained instead from a suitably designed high-quality sample of students (a sample-based approach; see also Chapter 1 and 6). The sample-based approach has a series of advantages. Factors that favor a sample-based approach include: substantially reduced costs in test and questionnaire administration, greater accuracy due to the increased possibility to monitor the quality of implementation, and less time for cleaning and managing data as well as for data analysis and reporting (Greaney & Kellaghan, 2008). Nevertheless, while a sample-based approach provides the means to carry out assessments in an affordable manner, considerable attention to detail is required in designing and selecting the samples.
In this document (see Chapter 6) we refer to a detailed example of a sample-based approach applied in international large-scale assessments. We particularly elaborate upon the sampling procedure used by IEA’s ICCS. ICCS provided the sources of data and information that was largely used to produce the scores of the countries for which data is already available4 (see also Chapter 9). If countries want to produce information that is comparable with that of the 60 countries for which this data already exist, it is advisable that they largely follow the same procedures as implemented in ICCS. In addition, ICCS complies with all requirements for sampling quality
3 ISCED stands for International Standard Classification of Education (UNESCO, 2011).
4 UNESCO Institute for Statistics official data repository (see: SDG / Goals 1 and 4 / SDG4 / Target 4.7.4 and Target 4.7.5): http://data.uis.unesco.org/

17
specified in the technical standards for IEA studies (Martin, Rust, & Adams, 1999). The reader is referred to Chapter 6 for an in-depth overview of the aspects that are crucial to reflect and decide upon when implementing the recommended sample-based approach including: a precise definition of the target population, an assessment of the population coverage, sample size requirements and sample design etc.
The frequency of the assessment
The frequency of international assessments tends to vary from study to study. PISA, for example, is implemented every three years, TIMSS every four years and ICCS uses seven-year cycles. The frequency of the assessment should also be determined by its aims. When the purpose of the assessment is to provide information on the performance of the education system on certain indicators (here defined by the content of SDG Indicators 4.7.4 and 4.7.5), one should take into account that education systems do not change rapidly. Excessively frequent assessments may fail to register any change and prove to be an unnecessary cost (see also Greaney & Kellaghan, 2008). Given the above and that the exercise should also enable countries to compare their performance on SDG Indicators 4.7.4 and 4.7.5 with that of the 60 countries for which this data already exists, it would be advisable to use four-to-seven year cycles and preferably align the assessments with the timeline of the ICCS, or eventually TIMSS, international assessments.
What are the cost components of an assessment?
The cost of an assessment will vary greatly from one country to another depending on the salary levels of personnel and the cost of different services (Greaney & Kellaghan, 2008). A realistic budget is nevertheless essential for the success of the assessment. At the beginning of the project, the different stakeholders (e.g., ministry of education) should assess the budget needs in consultation with assessment experts and financial decision makers from the ministry and/or the implementing agency.
Although no established formula exists, it can be useful to have an overview of the potential cost components based on the various phases of the project, the actors and the tasks involved. A non-exhaustive list tailored to the assessment proposed in this document may include the following components:
• National Steering Committee (NSC). Costs related to establishing the NSC and associated activities such as recruiting participants and organizing meetings.
• Implementing agency (IA). Costs related to eventual personnel needs and providing facilities and technical equipment.
• Designing the assessment framework and instruments/questionnaires. In the current case, this category of costs is greatly reduced due to the fact that an assessment framework is already developed and questionnaires are adapted from existing instruments (see Chapter 3). Nevertheless, budgetary provisions should be made for activities related to translating and adapting this framework and instruments to the specific language and context of each country. Personnel needs (experts), facilities and technical equipment required should be considered.
• Sampling procedures. Costs related to expert personnel responsible for creating the sampling frame and drawing the sample of schools and students (see also Chapter 6).

18
• Administration and data collection. Data collection is by far the most expensive component of any assessment. In some countries it may take up to 50% of the budget (Greaney & Kellaghan, 2008). It involves many tasks such as recruiting and training questionnaire administrators, designing questionnaire administrators’ manuals, designing, administering and retrieving the questionnaires (either in print or online) and ensuring efficient contact with schools (see also Chapters 4, 5 and 7).
• Data preparation, validation and management. Costs related to the production of codebooks, data management, verification and cleaning that must be handled by expert personnel with access to necessary equipment (see also Chapter 8).
• Data analysis and reporting. Costs related to computing and reporting different estimates (e.g., survey weights, indicator scores and thresholds) that must be handled by expert personnel with access to necessary equipment (see also Chapter 9).
• Reporting and follow-up activities. Costs related to the communication and dissemination of findings to different audiences such as the production of policy briefs or training for different stakeholders in interpreting and acting on the findings (see also Chapter 10).
When considering costs, countries may, if possible, also draw information from budgets developed for conducting other international assessments such as PISA, TIMSS or ICCS5 in their country or in countries with comparable conditions in terms of salary levels of personnel and price of different services. Nevertheless, it should be taken into account that the scope of the particular assessment proposed in this document is much smaller than the one of any of these surveys. The framework and instruments are already designed, and the content of the questionnaire is significantly shorter compared with the other assessments (see also Chapter 3). Therefore, the costs associated with this proposed assessment meant to measure and monitor SDG Indicators 4.7.4 and 4.7.5 will most likely be smaller.
5 For information related to the cost of the ICCS study please refer to: https://www.iea.nl/publications/international-study-participation-fees-iccs-2022

19
3. The assessment framework and instruments
Most educational assessments are directed at measuring a set of cognitive or non-cognitive outcomes that are important for providing information on the performance of the education system on certain indicators. In the current proposal, the assessment is designed to assess the performance of the education system on SDG Indicators 4.7.4 and 4.7.5. Similar to other national and international assessments, providing an appropriate assessment framework is extremely important. The assessment framework clarifies in detail what is being assessed, why it is being assessed, and how it is being assessed. The definition of concepts and their operationalization provides guidance to elaborate/select the assessment instruments and analyze and interpret the results. The assessment framework usually includes two main components: the purposes and the definition/s guiding the assessment and an operationalization of the main concepts, which is then used to elaborate a measurement strategy, design or select the appropriate assessment instruments and guide the interpretation of the findings.
In this document we aim to provide guidelines to apply a recently developed measurement strategy for assessing SDG Indicators 4.7.4 and 4.7.5 using information and guidance from ILSAs in education such as ICCS and TIMSS. In what follows, we discuss the main components of the assessment framework as elaborated in previous work and for the purpose of this document.
Background: why is it being assessed?
In September 2015, UN Members formally adopted the 2030 Agenda for Sustainable Development at the United Nations Sustainable Development Summit in New York. The Sustainable Development Goals (SDGs) are a call for action by all countries to promote prosperity while protecting the planet. They recognize that ending poverty must go hand-in-hand with strategies that build economic growth and address a range of social needs including education, health, social protection, and job opportunities while tackling climate change and environmental protection.
The Agenda 2030 contains 17 goals including a global education goal (SDG 4). SDG 4 establishes that by 2030 we have to “ensure inclusive and equitable quality education and promote lifelong learning opportunities for all” and has seven targets and three means of implementation. One of these targets, 4.7, refers to the knowledge and skills that are necessary for a sustainable future.
Target 4.7 By 2030, ensure that all learners acquire the knowledge and skills needed to promote sustainable development, including, among others, through education for sustainable development and sustainable lifestyles, human rights, gender equality, promotion of a culture of peace and non-violence, global citizenship and appreciation of cultural diversity and of culture’s contribution to sustainable development.
Among others, Target 4.7 includes the following two thematic outcome indicators:
4.7.4 Percentage of students in lower secondary education showing adequate understanding of issues relating to global citizenship and sustainability.
4.7.5 Percentage of students in lower secondary education showing proficiency in knowledge of environmental science and geoscience.
In this document, we aim to describe and implement a measurement strategy for these two thematic indicators (4.7.4 and 4.7.5) using data from International Large-Scale Assessments (ILSAs)

20
in education. To do so, we build on two reports6 previously published by the Global Alliance to Monitor Learning (GAML) describing a proposal of a measurement strategy for these two indicators (see also Sandoval-Hernández et al., 2019). These two reports establish a global content framework for Indicators 4.7.4 and 4.7.5 and carry out a mapping exercise to evaluate the extent to which the different concepts contained in the framework (i.e., categories and sub-categories) can be operationalized with the instruments and procedures of existing ILSAs.
The framework, measurement strategy and resulting data have been reviewed and endorsed by Technical Cooperation Group on the Indicators for SDG 4-Education 2030 (TCG), which is responsible for the development and maintenance of the thematic indicator framework for the follow-up and review of SDG 4. These materials are published in the UIS’ official data repository (see: SDG / Goals 1 and 4 / SDG4 / Target 4.7/4.7.4 and 4.7.5): http://data.uis.unesco.org/).
Definition of concepts: what is being assessed?
To arrive at definitions for Global Citizenship Education (GCED) and Education for Sustainable Development (ESD), we built on previous work conducted by the UIS and partially adopted the definitions and operationalization advanced in recent documents (e.g., Hoskins, 2016; IBE, 2016; Sandoval-Hernández & Miranda, 2018; UNESCO, 2012b, 2012a, 2013, 2014, 2015, 2017). Drawing on this body of literature we propose the following working definitions of GCED and ESD:
Global Citizenship Education (GCED) nurtures respect for all, building a sense of belonging to a common humanity and helping learners become responsible and active global citizens. GCED aims to empower learners to assume active roles to face and resolve global challenges and to become proactive contributors to a more peaceful, tolerant, and inclusive and secure world.
Education for Sustainable Development (ESD) empowers learners to take informed decisions and responsible actions for environmental integrity, economic viability and a just society, for present and future generations, while respecting cultural diversity. It is about lifelong learning and is an integral part of quality education.
Operationalization of concepts: what precisely is being assessed?
The operationalization of these concepts is based on the work of research teams of the International Bureau of Education (IBE) and the Global Education Monitoring Report (GEMR), which developed a coding scheme (IBE, 2016) to evaluate 78 national curricula for evidence of GCED and ESD content. The exercise involved several pilots, parallel coding with different coders encoding the same documents, and resulted in a scheme with seven categories in the knowledge dimension (see Table 2): Interconnectedness and Global Citizenship; Gender Equality; Peace, Non-violence and Human Security; Human Rights; Health and Well-being; Sustainable Development; and Environmental Science. Each of these categories was further divided into sub-categories and then operationalized using the items of ILSA instruments. The first six categories are considered for Indicator 4.7.4 and the last one for Indicator 4.7.5.
6 Proposal for a Measurement Strategy for Thematic Indicator 4.7.4 using ILSAs. Available here: http://gaml.uis.unesco.org/wp-content/uploads/sites/2/2019/08/GAML6-WD-7-Measuring-4.7.4-using-International-Large-Scale-Assessments-in-Education.pdf

21
Table 2. Global Content Framework for SDG Indicators 4.7.4 and 4.7.5: S
Category Sub-categoryGlobalizationGlobal/international citizen(ship), global culture/identity/communityGlobal-local thinking, local-global, think global act localMulticultural(ism)/intercultural(ism)Migration, immigration, mobility, movement of peopleGlobal competition/competitiveness/globally competitive/international competitivenessGlobal Inequalities/disparitiesGender equality / equality / parityEmpower(ment of) women/girls (female empowerment, encouraging female participation)Peace, peacebuildingAwareness of forms of abuse/harassment/violence (school-based violence/bullying, household-based violence, gender-based violence, child abuse/harassment, sexual abuse/harassment)Human rights, rights and responsibilities (children’s rights, cultural rights, indigenous rights, women’s rights, disability rights)Freedom (of expression, of speech, of press, of association/organization), civil libertiesSocial justiceDemocracy/democratic rule, democratic values/principlesPhysical health/activity/fitnessMental, emotional health, psychological healthHealthy lifestyle (nutrition, diet, cleanliness, hygiene, sanitation, clean water, being/staying healthy)Awareness of addictions (smoking, drugs, alcohol)Sexual and/or reproductive healthEconomic sustainability, sustainable growth, sustainable production/consumption, green economySocial sustainability (social cohesion re: sustainability)Environmental sustainability/environmentally sustainableClimate change (global warming, carbon emissions/footprint)Renewable energy, alternative energy (sources: solar, tidal, wind, wave, geothermal, biomass, etc.)Ecology, ecological sustainability (ecosystems, biodiversity, biosphere, ecology, loss of diversity)Waste management, recyclingPhysical systemsLiving systemsEarth and space systems
Environmental Science (geoscience)
Interconnectedness and Global Citizenship
Gender Equality
Peace, Non-violence and Human Security
Human Rights
Health and Well-being
Sustainable Development
Glo
bal C
itiz
ensh
ip E
duca
tion
(GCE
D)
Educ
atio
n fo
r Su
stai
nabl
e D
evel
opm
ent
(ESD
)
Source: Sandoval-Hernández, Isac & Miranda (2019)
Furthermore, drawing on a review of recent literature, we incorporated the three core dimensions proposed by the UIS to measure learning outcomes in GCED and ESD in this mapping exercise (UNESCO, 2015). These dimensions are interrelated and are presented in Table 3, each indicating the domain of learning they focus on (see Sandoval-Hernández et al., 2019 for further details).

22
Table 3. Core conceptual learning dimensions for SDG Indicators 4.74 and 4.7.5
Source: Adapted from Sandoval-Hernández, Isac & Miranda (2019)
Assessment instruments: how is it being assessed?
In previous work (Sandoval-Hernández & Carrasco, 2020; Sandoval-Hernández et al., 2019), we carried out a mapping exercise to evaluate the extent to which the different concepts contained in the global content framework (i.e., categories and sub-categories) described above can be operationalized with already existing instruments administered in ILSAs. This mapping exercise identified the IEA’s ICCS as the most valuable source of information for SGD Indicator 4.7.4. The IEA’s TIMSS was considered the most informative data source for Indicator 4.7.5, for which some aspects are covered by the OECD’s PISA. These studies were chosen due to their specific conceptual frameworks, which showed the highest coverage of the topics relevant to the two indicators and their potential to inform long-term monitoring. Two important observations included in these reports are that these ILSAs can provide high (but not total) coverage for Indicators 4.7.4 and 4.7.5, but they can only be considered as proxy measures; and that the resulting measures cover only part of the intended population: ICCS and TIMSS are representative for students in Grade 8 only, while PISA only offers representative information for 15-year-olds.
For the current document we will focus on the instruments selected from the ICCS and TIMSS7
studies that were used to produce the scores published in the UIS’ official data repository (http://data.uis.unesco.org/). Readers are however encouraged to consult our previous work (Sandoval-Hernández & Carrasco, 2020; Sandoval-Hernández et al., 2019) if interested in other potentially informative data sources such as PISA.
Appendix I-a and Appendix I-b contain the ICCS and TIMSS non-cognitive items used to operationalize and produce the scores to measure SDG Indicators 4.7.4 and 4.7.5. The items are presented and formatted as two separate instruments, one for each indicator. These instruments can be readily used by countries interested in participating in this initiative. Please note that although the non-cognitive items used to produce these instruments are publicly available, their copyright is owned by the IEA. We advise any parties interested in administering the instruments
7 Since cognitive items from ICCS and TIMSS are not publicly available, due to confidentiality issues the current guidelines only apply to the data collected using the background questionnaires.

23
included in Appendix I-a and Appendix I-b to contact the IEA to ensure that the use of the instruments comply with their intellectual property policy (see https://www.iea.nl/copyrightnotice for more information).
Cognitive items from ILSAs such as ICCS and TIMSS are not publicly available. For this reason, these guidelines do not include instruments to measure this component of the scores. Access to and permission to administer the cognitive items used in this measurement strategy in countries that have not participated in TIMSS and ICCS would need to need to be directly negotiated with the IEA. Nevertheless, for transparency purposes and in order to allow educators to use them as tools for formative assessment, each study cycle, the IEA releases some of the cognitive items used in their studies. Appendix I-c contains examples of cognitive items from ICCS and TIMSS released by IEA (for more information, see, Brese, Jung, Mirazchiyski, Schulz, & Zuehlke, 2011; Foy, Arora, & Stanco, 2013).
Appendix II includes an exhaustive list of the precise content of ICCS and TIMSS instruments used to tap into the different concepts, as well as their categories, sub-categories and model parameters (see Chapter 9).
Based on these instruments and on the available data, a series of measurement models using items from ICCS and TIMSS can be estimated in order to generate scores (i.e., percentage of students meeting the indicator) to measure each thematic indicator. Specifically, a score for the cognitive domain of each thematic indicator, and a series of scores for each of the socio-emotional and behavioural domains of the sub-categories for each indicator. Moreover, this information can also be used to identify proficiency levels of students based on each respective score. For an indepth overview of the required procedures the reader should consult Chapter 9.

24
4. Designing a manual for questionnaire administrators
A manual is required to guide the questionnaire or test administration, which must be standardized so that all students participate in the assessment under the same conditions. All recommendations presented in this chapter are based on four manuals that compile different aspects for this report (Anderson & Morgan, 2008a; Greaney & Kellaghan, 2012; Lietz et al., 2017; W. Schulz, Carstens, Losito, & Fraillon, 2018). In the remainder of this section, we answer some common questions related to the development of a manual for questionnaire administration, including what is a manual, what is it for, and the sections that it normally should include. We also list good practices from the experiences of various implementation agencies around the world.
What is a manual for test administration?
A manual for questionnaire or test administration is a document that describes the different steps and responsibilities that are needed for an educational assessment under standardized conditions for all students in a given sample. A good manual contains all necessary information and is easy to use. The information is logically ordered, instructions are clear and complete, and language is simple and direct. Bullet points, boxes, or tables will make the information easier to read.
In the interest of efficiency and to limit the number of documents test administrators have to carry, the key information related to timing, student preparation, packing and returning of tests and questionnaires, and instructions for administration should be included in one document: the test administration manual. Instructions that are read aloud to pupils should be in large, bold print. A person entrusted with training test administrators should go through the entire manual with at least a sample of test administrators prior to formal training of the selected administrators. No matter how well they claim to be qualified, test administrators should not be left to go through the manual on their own.
What is this manual for?
The main purpose of the manual is to specify the exact conditions under which a test must be conducted, including preparation requirements and procedures for ensuring test security. Students taking the assessment must work through the same practice questions and receive the same instructions about how to show their answers. All must be given the same amount of time to complete the questionnaire with the same degree of supervision.
Students’ performance on a national assessment should be a measure of their ability to answer the items without external support or to collect their opinions, feelings or beliefs. The students should understand what they have to do and how to show their answers, but they should not be given any other assistance or have access to any resources that are not a part of the assessment. Following the procedures laid down in an administration manual should help ensure that this will be the case.

25
What sections should be included?
The administration manual should provide information answering the questions in Table 4.
Table 4. Contents of the administration manual
Key question (sections) Examples
What is the test for?
Brief explanation of the purpose of the test and the way the data will be used.
Which tests are given, which students are tested, and when are they tested?
Details about which test, length of administration of each, which students, dates and times, required breaks or any flexibility option for the administration.
What test materials are needed?
List of all the test materials that are supplied, quantities per student, per teacher and per school (i.e., pencils, erasers).
How should the room be set up for the test?
Description of physical facilities needed and description of resources that must be removed/covered (i.e., number of desks, covering up posters with grammatical rules, etc.)
What preparation is required? Description of motivation for staff members, required information, instructions for booklet organization, organization of students, etc.
How should the test be conducted?
Description of procedures for booklet administration. For instance, registry of information, check procedure, practice questions administration, instructions for students, how long test must take, conditions for administration, rules for people allowed into the room, etc.
How should test materials be stored?
Procedures to ensure the security of test materials before, during, and after the test.
Who can be contacted for help?
Contact details for people who can assist with problems or provide additional information.
Source: Adapted from Anderson & Morgan (2008a)
As can be seen, the manual for test administrations must outline all details to ensure the standardization of the data collection procedures. Any additional information about the management and movement of materials in and out from schools could be included, depending on the needs of each administration agency.
Information about the general conditions of questionnaire administration and the preparation of questionnaire materials should be comprehensive but, at the same time, as brief as possible. Table 5 provides an example.

26
Table 5. Contents of a test administration manual (example from the Department of Education, Papua New Guinea)
Administration Manual Instructions Information for Teachers and Principals
In a national assessment, the following information appeared in a large font (Arial 14), taking up the entire opening page of the administration manual: Please read this Administration Handbook before your students do the test. Students must do this test over TWO DAYS. • The test is divided into four sessions. Students must do two sessions each day. • Students must have a break between each session. • Do not let students work through the whole test at once. Administration Rules • Teachers must supervise all sessions at all times. • Students must NOT take test booklets out of the classroom or work on them after the teacher has left. • Students must use the pencils with erasers on the end that have been supplied. • Students must not use any classroom materials, such as workbooks, dictionaries, or calculators, when they do the tests. • Students must not be helped with answering the questions. For example, if a student does not understand what to do, explain the practice questions again and tell him/her to try his/her best but do not give any further help. Test Security • The test materials must be STORED SECURELY AT ALL TIMES. • Student test booklets must NOT be copied for any purpose. • Students must NOT take test booklets home.
Information about the test materials should be concise and listed in a way that is easy to check. The following extract from a large-scale assessment in Papua New Guinea tells the head teacher or principal what materials have been sent to the school and how to find out which classes will participate in the test: Test Materials Your senior primary school inspector will tell you which classes in your school need to participate in this test. You should have received the following materials: • a cover letter for the head teacher • a student test booklet for each participating student • an administration handbook for each teacher administering the test • a teacher background questionnaire for each participating teacher • a pencil with an eraser on the end for each participating student If any materials are missing or you do not have enough materials, please contact your senior primary school inspector.
Source: Papua New Guinea Department of Education 2004.

27
Good practices
The manual should be used by the principal of schools (or head teacher) and the test administrator. The principal (or head teacher) needs the manual to ensure his or her school is appropriately prepared for the test administration. Test administrators need the manual to tell them exactly what they have to do to administer the test properly and when and how to do it.
For example, the principal should know enough about the test to encourage the staff and the students to support the test taking, and to motivate students to try their best. The head teacher (or principal) should have sufficient information to be able to organize the school and to make sure that the correct students are available at the required time, with the right materials; that they will have adequate space to take the test; and that test materials can be stored securely. The test administrator needs to check that sufficient test materials are available and that the correct students have been selected to take the test. They need to know what information to give students about the test, how to explain the practice questions, and how much time students have to do the tests. They also should know what security procedures to use for storing test materials.
There are some good practices recommended to ensure the usability of the manual:
• The manual should be prepared for tryout in the pretest or field test of the test items. Pretesting the manual will highlight any misunderstandings or ambiguities that require clarification or refinement in the final version. Because the pretest or field-test conditions should be as similar as possible to those of the final administration, the manual should be in as finished a form as possible at the time of the tryout.
• General instructions about the administration of the test can usually be written any time after the blueprints have been finalized. The blueprints should specify all the requirements about the number of tests and their length and about which students should take the test.
• During the pretest, the administrator should collect information such as the following to assist the test development manager in refining the final test:
o Whether students needed all the practice questions, whether there were enough practice questions, and whether explanations were sufficiently clear.
o Whether the test was the right length or too long, and approximately how many students finished more than 10 minutes early (if different forms are used in the same class, the administrator can compare the length of time students required for each form).
o Whether students appeared to be engaged by the test.
• The manual should be proofread to ensure instructions for test administration, practices, and conditions for the application are clear for all.

28
5. The questionnaire administrator
This section characterizes or defines the questionnaire or test administration process, including the selection of administrators, their instructions, quality assurance and a proposed check list for ensuring the successful completion of the process. The contents of this chapter are mainly adapted from Anderson and Morgan (2008b).
Selection of test administrators
People should be confident that the test was administered under standardized conditions. Test administrators must be widely regarded as trustworthy. The choice of test administrator depends on conditions in a country. In some countries, classroom teachers administer national assessment tests to their own students. More often than not, however, teachers other than those who teach the students who are taking the test, or individuals who are external to the school, are entrusted with this task. In some countries, data collection is contracted to a body that specializes in that activity. School inspectors may be ideal administrators in some countries but problematic in others. If the inspectors see test administration as an additional task that is outside their job description, that uses scarce resources, or that is of little interest to them, they may not be motivated to do the job properly. External administrators are used in some national assessments. Ideally, they are people who can follow instructions precisely, have the time and resources to do the task properly, and have no particular interest in the outcome of the test other than to administer it correctly. Some possible advantages and disadvantages of using personnel from different backgrounds are summarized in Table 6. It is, however, important to mention that providing clear guidelines and intensive training can help address any disadvantages that may exist.
Because faulty test administration tends to be the most common source of error in a national assessment, particular attention should be paid to selecting, training, and supervising test and questionnaire administrators. Above all, persons assigned this position should be trustworthy, responsible, and committed.

29
Table 6. Advantages and disadvantages of using different actors as questionnaire administrators
Category Advantages Disadvantages
Teachers
Are professionally qualified
May have difficulty unlearning usual practices (for example, helping students) and learning new ways of dealing with pupils
Are familiar with the children May feel they are also being assessed and may try to help the children (if their own class is being assessed)
May be less expensive than others, especially in terms of travel and subsistence
May be difficult and costly to organize and train
Are likely to be fluent in the area or local language
Inspectors and teacher trainers
Are likely to have classroom experience
Might be overly authoritarian
Will become involved as partners in the national assessment, which may give them an interest in the outcomes
Might be tempted to conduct inspection activities in addition to administering tests
Are likely to know the location of most schools
Are likely to be more costly than teachers
May feel they need not follow the detailed instructions in the manual
University students
Are readily available, especially during university vacations
May not be very reliable
Are likely to follow instructions May lack the authority required to deal with managers, principals, and others
Are more likely than others to withstand harsh travel conditions
Are difficult to hold accountable
Can often use a work opportunity May not be fluent in the local language
Are relatively inexpensive May not communicate a sense of respect and authority in front of students
Assessment or examination board personnel
Are professionally qualified May be too authoritarian, especially if they are used to supervising public exams
Are directly accountable to the appointing authority
May lack recent classroom experience and therefore not exude a sense of authority in front of students
Tend to be reliable May lack experience at the particular education level being tested
Are good at record keeping Are expensive to maintain in the field
Tend to consult before making major decisions
May not be fluent in the local language
Source: Greaney & Kellaghan, 2012

30
Instructions
The manual should distinguish between specific instructions that must be followed to the word from more general instructions that allow the administrator some scope to adapt them to the conditions in the class. Some relevant aspects for instructions are:
• The test administrator should not deviate from any specific instructions. Pretesting the manual should help identify any errors or ambiguities in the instructions.
• Test administrators should help students only to understand what they have to do and how to show their answers.
• If a student asks for help, the administrator should tell the student just to try his or her best. Test administrators should make clear that they cannot help students answer questions.
• In some tests, administrators may read the questions to students. The test administrator should read the whole test aloud to the class, slowly and distinctly, question by question, or read single questions as requested by the students.
• Administrators should ensure that students are aware of the time they have to do a test. Administrators must have a watch or clock.
• Administrators should quietly encourage students to attempt the whole test.
• Only materials that are specified in the manual are allowed in the room during test administration.
• The test administrator, students participating in the test, and possibly a supervisor should be the only people in the room during test administration. The head teacher or principal or other teachers should not be permitted to walk around the room. The test manager should be notified of unavoidable changes in test administration conditions.
• During the administration of the test, the administrator should collect information about any variations that occur in the conditions of administration for individual students.
• The national assessment team should ensure that each test administrator has, or has access to, a timing device to be used during test administration. The test administrator is responsible for ensuring that teachers do not help students and that students do not copy from each other or bring unauthorized materials into the room. School conditions will dictate seating arrangement options.
• The test administrator should check that desks are free of books and other materials prior to testing. National assessments that use more than one form of a test reduce the possibility of copying by requiring students seated near each other to take different versions of the test.
The test administrator should complete a student tracking form (See Figure 3 for an example), which is sent to schools with test booklets and questionnaires. Information from this form will be needed at the data cleaning and analysis stages (for example, in weighting data). Information recorded on the tracking form usually includes each student’s name, assigned identifier (ID)

31
number, date of birth, gender, and record of attendance at individual testing sessions and, where applicable, replacement sessions. If the testing requires more than one session, the student’s presence should be noted for each session.
Figure 3. Example of student tracking form
Source: Anderson and Morgan (2008a)
• The test administrator must ensure that all tests and questionnaires, used and unused, are kept secure and are returned to the national assessment center. This step is important because items, and in some instances, an entire test, might be used in a subsequent national assessment. If some teachers and students have prior access to those items, the credibility of the subsequent assessment would be undermined. The paper or rough notes used by students while doing the tests should also be returned to the national assessment office.
Quality procedures
For consistent administration of the testing process for all students, administrators should be selected for their suitability for the task. Next are listed some of the criteria for ensuring quality for test administrator:
• They should be fluent in the language in which the manual is written.
• They also should be committed to doing their task well.
School name: ________________________________________________________
School ID Class ID Class name Grade
Student name Student ID Date of Birth Excluded Session Replacement
session

32
• They should attend a training session that explains the purpose of the test and their role in its administration.
• They should understand why following instructions is important, and they should be given the opportunity to practice administering the test with fellow test administrators.
• They should have the opportunity to ask questions about the procedures outlined in the manual.
• If teachers are to administer the tests to their own students, the training must ensure that they understand the purpose of the test and are reassured that the data will not be used to judge them.
• They should understand the importance of not assisting students in answering questions.
• Administrators should be supervised for at least some of the time they administer the test. Supervising everyone may not be possible, but random checks of some administrators should be feasible.
• Administrators can also be asked to fill in and sign checklists of their tasks to help ensure that they have completed their job.
Check list and common problems
Details of what should be in the administrator’s checklist will vary, depending on who is administering the test and the procedures developed for tracking booklets and ensuring security. Table 7 provides an example of an administration checklist used in the Philippines. The idea is that the administrator checks every item to show that he or she completed it and signs the form at the end. A further example can be seen in Greaney and Kellaghan (2012).
Table 7. Administration checklist: an example from the Philippines
Name: Date:
Task Reference Time Completed
1. Complete the student test booklet allocation (STBA) form by inserting the test numbers in consecutive order and entering the students’ names in alphabetical order
STBA form
10 min
2. Administer teacher questionnaire Teacher questionnaire form 15 min
3. Complete feedback form Teacher feedback form 10 min
4. Distribute the allocated test to each student and mark absent against students not in attendance
STBA form
10 min

33
5. Read introduction from guidelines Administrator Guidelines, p. 7 5 min
6. Ask students to complete student details on front cover of test
Administrator Guidelines, p. 9
5 min
7. Check that every student has completed the required student details on front cover
10 min
8. Follow instructions for Session 1 Administrator Guidelines, pp. 11–13 60 min
9. For breaks, ask students to leave the room by row and to leave their test on their desks
15 min
10. Follow instructions for Session 2 Administrator Guidelines, pp. 15–17 60 min
11. For breaks, ask students to leave the room by row and to leave their test on their desks
15 min
12. Follow instructions for Session 3 Administrator Guidelines, pp. 19–21 70 min
13. Collect all test booklets and check off their return using the STBA form
STBA form 10 min
14. Account for all tests and make sure every test has been returned
STBA form 5 min
15. Dismiss class 2 min
16. Sign STBA form STBA form 2 min
17. Collect and pack all test materials in the box provided, including:
10 min
i. STBA form
ii. Teacher questionnaire
iii.Teacher feedback form
iv. All completed tests
v. All unused tests.
18. Securely store materials 10 min

34
19. Return materials to your senior district supervisor (SDS) for the Regional Assessment of Mathematics, Science, and English (RAMSE)
SDS RAMSE distribution form
Travel time
20. Return this completed checklist to your SDS
RAMSE administrative checklist 2 min.
Administrator signature _____________________________
Source: Anderson and Morgan (2008a).

35
6. Sampling, weighting, and variance estimation
The objective of many educational assessment programs is to obtain results at the student, school, and administrative unit level. Such assessments are normally used to make decisions about individual student progress through the education system or as a tool used in the evaluation of teachers and/or schools, and for this reason, are labelled as ‘high-stakes’. One of the main characteristics of these assessments is that every student in the population of interest participates in the assessment. In these circumstances, because every student participates (i.e., census), there is no sampling needed. Therefore, there are no issues of sample design and selection involved, and no issues related to the need to provide analysis weights. In this case, however, the goals of the study do not include the provision of individual student results for all the individuals in the population. Rather, the purpose is to make inferences about the whole population. This extends to interest in providing results for a wide variety of population subgroups, examining the distribution of the variables measured within and across these subgroups.
Given these goals, it is not necessary to obtain data for each student in the population. The inferences of interest can be obtained from a suitably designed and executed sample of students (Rust, 2014). This, of course, offers the potential to greatly reduce the cost and burden of this assessment. While sampling methods provide the means to carry out assessments in an affordable manner, considerable attention to detail is required in designing and selecting the samples. Furthermore, additional calculations are needed to produce the sampling weights and the variance estimation procedures (replicated weights) that are needed to produce the final estimates. These three topics are covered in this chapter.
Sampling procedures
In this assessment, the selection of high-quality samples is critically important. Students must be selected through the use of sound methods that produce accurate, precise, and internationally comparable estimates. Educational assessments use different methods and procedures, and a good review of the most common ones can be found in Rust (2017), Rust and colleagues (2014), and Dumais and Gough (2012b). In this assessment, however, we will follow the procedures used by IEA’s ICCS. We do so because the instruments that we will use to collect most of the information (see Chapter 3) and the data that we have used to produce the scores of the countries for which we already have information (see Chapter 9), are both from ICCS. In turn, ICCS followed all requirements for sampling quality specified in the technical standards for IEA studies (Martin et al., 1999).
This assessment will use a stratified two-stage probability design (see, for example, Lohr, 2010; Zuehlke, 2011). During the first stage, schools have to be sampled with probability proportional to the size of the schools (defined by the number of students in the schools). During the second stage, one intact class of target-grade students has to be randomly selected for the student survey. This section provides a description of this sampling design, addressing, in particular, the following issues:

36
• precise definition of the target population of students
• definition of the criteria to be used for exclusions
• sample size requirements
• sample design
• description of the information that has to be reported to ensure transparency (i.e., intended and achieved sample sizes)
Definition of the target population
For this and every assessment, it is crucial to clearly define the target population. This is particularly important when a sample is selected in each country as it may not be as readily evident whether the population coverage is comparable across countries as might be the case if all students in the population were selected. Rust (2014) provides the following example: “…suppose that there is a school included in the sample that has 300 full-time students in the population, and 15 part-time students. If all the students in the school are to be assessed, it will be readily apparent if those administering the assessment decide not to include any of the part-time students. But if a sample of 25 students is selected, and part-time students are omitted from the sampling frame, the fact that no part-time students end up being selected in the sample might not be noted (p, 120).” Following Rust (2014), we know that issues with population definition and coverage tend to concern relatively small groups in the population, but ones whose information may be very different from the rest of the population. So, on the one hand, their absence from the sample might not be noticed, while on the other hand, failure to cover them in the sampling procedure might induce an important bias in the analysis results.
As in ICCS, in this assessment the target population consists of all students enrolled in the grade that represents eight years of schooling, counting from the first year of ISCED Level 18, providing the mean age at the time of testing is at least 13.5 years. Students older than 17 years are not part of the target population.
For most countries, the target grade will be Grade 8 or its national equivalent. If the average age in Grade 8 is below 13.5 in a given country, because students generally start formal schooling at age five, the target grade can be changed to Grade 9. To ensure international comparability, the implementing agency will have to specify their country’s legal school entry age, the target grade, and an estimate of the mean age of the students in that grade.
Students who are not covered by the definition above will be regarded as “out of scope” (namely students in a different grade than the target grade). In the following sections, the term “students” is used to describe “students in the assessment target population”.
Coverage and exclusions
Population coverage
The assessment is intended to include all students covered by the target population definition. However, when absolutely necessary, countries could elect to remove larger groups of schools
8 ISCED stands for International Standard Classification of Education (UNESCO, 2011)

37
and/or students from the target population for political, operational, or administrative reasons. This removal of schools is referred to as reduced population coverage.
Student exclusions
For example, in most countries participating in ICCS, smaller groups of students had to be removed from the target population for practical reasons. These practical reasons included, for example, difficult test conditions or increased survey costs (Weber, 2018). Such removals are regarded as exclusions.
The overall exclusion rate consists of the school-level exclusion rate (which has to be calculated based on information provided by the implementing agency) and the weighted within-sample exclusion rate (students excluded for diverse reasons from sampled and participating schools). For the assessment to remain comparable, each country is required to keep the overall rate of excluded students below 5% of the target population.
If necessary, the implementing agency will have to define the groups of schools and/or students that will be excluded according to their respective national contexts. Following ICCS standards, within-sample exclusions could consist of students with physical or mental disabilities or students who could not speak the language of the questionnaire (e.g., students with less than one year of instruction in the test language). Any other types of within-sample student exclusions are not permitted. Examples of the exclusion categories used by countries participating in ICCS can be found in Appendix B (Characteristics of national samples) of its technical report (Schulz et al., 2018). An example from ICCS 2016 of how to report coverage and exclusions is in Figure 4.
Figure 4. Population coverage and exclusions rates (example from ICCS 2016)
Source: Shultz, et al. (2018)

38
Sample size requirements
The assessment sets some limits on intended sample sizes (the expected number of selected units) and achieved sample sizes (the actual number of units that participate in the study).
The overall goal of the student sample design is to achieve an effective sample size of at least 400 students. This means that the sample design should yield the same sampling precision as a hypothetical simple random sample of 400 students for the main variables of interest. Because students from the same schools tend to be more similar to one another than students from different schools, it is necessary to survey a far larger number of students than would be needed to achieve this goal.
In this assessment, the questionnaire scales reflecting knowledge, attitudes, and intentions related to Global Citizenship Education (GCED) and Education for Sustainable Development (ESD) were regarded as the main variables of interest. Given the international metric for these scales, the minimum requirements for sample precision were roughly equivalent to obtaining standard errors that did not exceed 5.0 score points for questionnaire scales.
For this assessment, it is requested that each participating country have a minimum intended school sample size of 150 selected schools. This means selecting at least one intact class from each school. Once non-participation of schools and students had been taken into account, these requirements are expected to result in an achieved student sample size of roughly 3,000 tested students. Countries with fewer than 150 eligible schools should include all schools in the assessment. In some cases, however, this minimum number of schools will need to be increased. For example, when the average class size in a country is so small that it is not possible to reach, through the selection of 150 schools, the student sample size requirement of 3,000 students. In such cases, the number of sampled schools should be increased accordingly.
Based on experience, it is expected that because of, for example, non-participation, school closures, inaccuracies in the school sampling frame, the achieved sample size of schools will be smaller than the intended sample size in most of the countries. This should not be a problem as long as the required sample size of 3,000 students is reached and/or the country in question meets the overall participation rate requirements.
In each sampled school, at least one classroom of the target grade has to be selected. In some countries, more than one classroom can be or will need to be selected. For example, in the following cases:
• when the total number of schools in a country is so small that the student sample size requirements cannot be met by selecting only one classroom per school;
• when selecting only one class will most likely result in large sampling weight fluctuations.
An example from ICCS 2016 of how to report school and student sample sizes is in Figure 5.

39
Figure 5. School and student sample sizes (example from ICCS 2016)
Source: Shultz, et al. (2018) A detailed description of the procedures used to arrive at this sample size and the overall participation rate requirements described here can be consulted in Rust (2014).
School sampling design
This assessment uses as its general approach a stratified two-stage probability sampling design, in which the schools are selected systematically with probability proportional to size (PPS) within each stratum. The following subsections outline this school sample design: stratification, sampling frame, school selection and within-school selection.
Stratification of schools
Strata are groups of units (schools in this case) that share some common characteristic (such as geographic region, urbanization level, or source of financing, e.g., public/private). Generally, stratification is used for the following reasons:
• to improve the efficiency of the sample design, as stratification variables are expected to be closely associated with the main variables of interest;
• to apply different sample designs, such as disproportionate sample allocations, to specific groups of schools (e.g., states or provinces);
• to ensure adequate representation of specific groups of interest of the target population in the sample (e.g., ethnic minorities).

40
Two different methods of stratification can be applied, one explicit, the other implicit.
• When explicit strata are used, the total sample of schools is apportioned to the explicit strata, and independent samples of schools have to be selected from each explicit stratum.
• When implicit strata are used, schools are sorted by the stratification variable(s) within the explicit strata.
The combined use of implicit strata and systematic sampling is a way of ensuring a proportional sample allocation of schools across all implicit strata. Each country may apply different stratification schemes according to their specific contexts. Examples of the stratification variables used by countries participating in ICCS can be found in the Appendix B of its technical report (Wolfram Schulz et al., 2018). Examples and explanations of how stratification is used in other educational assessments can be found in Rust, et al. (2017).
School sampling frame
To prepare the selection of a sample of schools, national centres need to compile a list of schools with students enrolled in the target grade. A comprehensive national list of all eligible schools is called a school sampling frame.
Ideally, a sampling frame is a comprehensive, complete, up-to-date list that includes the students of the defined target population and contains information that helps access the students. In the case of a national assessment, the availability of a list of all the students enrolled in the school grades of interest would allow the sampling team to pick a sample of students directly (Dumais & Gough, 2012b).
In many countries, however, such a complete and up-to-date list is impossible to obtain, even when the central public administration is in charge of the assessment. Such countries may have to resort to alternative sources of information or construct their own complete and up-to-date frame. For example, indirect access to a list of students may be achieved by first selecting schools and then their students. In effect, this means lists of students are required only for the schools selected to take part in the national assessment (idem).
In any case, sampling frames need to be carefully checked in order to ensure that they provide complete coverage of the target population and do not include incorrect entries, duplicate entries, or entries that referred to elements that were not part of the target population. The plausibility of the information can be verified against official statistics. Essential elements of a sampling frame are outlined in Table 8.

41
Table 8. Elements of a sampling frame for a national assessment
Element Description
Identification Each school must be clearly identified (for example, by name or school number).
Communication
The Implementing agency must have information to allow it to contact each school. Appropriate information might include postal addresses, telephone numbers, email, web page, etc. If such information is lacking, contact might have to be made by direct field visits, which require knowing the school’s physical location.
Classification
Classification information (i.e., stratification variables) must be included in the sampling frame (e.g., grouping of schools by geographic area, linguistic or cultural group, or public or private administration) for sampling, estimation, and/or reporting purposes.
Measure of size A measure of size (MOS) such as the number of students in the target grade or an adjacent grade.
Update The sampling frame should have details on when the information used to construct it was obtained or updated. This information will be necessary in the event that the national assessment is repeated.
Source: Adapted from Dumais and Gough (2012b)
School sample selection
In order to select the school samples, this assessment uses stratified probabilities proportional to size (PPS) systematic sampling. This method is common in most large-scale social surveys, and notably in most IEA surveys.
The process of selecting the school samples for a given country starts with the sorting of the school sampling frame. Within each explicit stratum, schools are sorted by implicit strata, and finally within each implicit stratum by MOS (alternately sorted in increasing and decreasing order).
Then a sample is selected from the sorted school sampling frame by engaging the following tasks:
• calculating a sampling interval in each explicit stratum, a process that involves dividing the total MOS in this stratum by the number of units to sample from that stratum;
• determining a random starting point in each explicit stratum, a step that decides the first sampled school in the explicit stratum;
• selecting the units by adding the sampling interval to the point of the random start and then subsequently to each new value every time a school was selected. Whenever the cumulated MOS equals or exceeds the corresponding value, the corresponding unit should be selected.

42
Figure 6. Systematic PPs sampling of schools (example from ICCS 2016)
Source: Shultz, et al. (2018) Note: A box represents a school in the sampling frame. Schools in the sampling frame are sorted in descending order by size. The height of the cells reflects the number of target-grade students in each school. A random start determines the second school in the list for selection, and a constant sampling interval determines the next two sampled schools. Sampled schools are shaded blue.
The selection has to be made using a systematic PPS sampling process within an explicit stratum (see Figure 5). In certain cases, however, it is expected that it will be needed to deviate from this general procedure. For example, if very small schools are selected with PPS, there is a risk of obtaining extremely large sampling weights for students from those schools. In order to prevent this, it is necessary to select small schools with equal selection probabilities. For this assessment, a school is regarded as small if the number of students enrolled in the target grade is lower than the number enrolled in a class of average size in the school’s explicit stratum. Conversely, technical problems arise whenever the MOS of a school is larger than the sampling interval. In this case, the sampling team should set the MOS of the school to the sampling interval, thereby ensuring that the school is selected with certainty but not more than once.
It is expected that most countries participating in this assessment will conduct a field trial (or pilot) of the instruments prior to the main data-collection phase. If a school is selected both for the field trial and for the main survey, this could cause response contamination and a drop in the participation rate for the main survey. Furthermore, the schools, or the teachers within the schools, might have been reluctant to participate in both the field trial and the main survey. Selecting the same school for both parts of the study should therefore be avoided whenever possible. This can be done, for example, by selecting the main survey sample and the field trial sample simultaneously.

43
Finally, the sampling team should select a sample of replacement schools at the same time that it selects the primary sample of schools. This should be done in order to maintain the sample size and reduce nonresponse bias in case of problems with school participation. Two replacement schools with similar characteristics should be assigned to each originally sampled school. The similarity can be secured by selecting those two schools adjacent to the sampled school in the sorted sampling frame. The first replacement school should be the one below the sampled school; the second replacement school should the one above. Schools that are part of the original sample should not be selected as replacement schools.
Within-school sampling selection
Within-school sampling constitutes the second stage of the sampling process. The use of software such as WinW3S can facilitate this process and ensure the random selection of classes within the sampled schools. However, within-school sampling can also be performed using standard statistical software (e.g., SPSS). Dumais & Gough (2012b) prepared a complete series of examples and exercises, including example data and software routines, to produce a sampling framework and select different types of samples common in educational assessments. The exercise, included in Exercise 8.8 is particularly relevant for the methods used in this assessment.
In any case, for the within-school sample, systematic random sampling is used to select one or more classes from each school that participates in the assessment. All participating schools have to be asked to list all their target-grade classes and to provide this list to the Implementing agency. The sampling team should then select the classes from these lists. Sampled classes should not be replaced or substituted.
This procedure is similar to the one used for systematic school sampling except that each class in a school has the same probability of being selected. In this way, each student in a participating school has the same selection probability because all students within sampled classes are selected for participation in the assessment.
Whenever a class is smaller than half of the average class size, it has to be grouped with one or more other classes prior to sample selection to form a so-called pseudo-class. This has to be done to avoid fluctuations in the total student sample size and to ensure efficient use of resources.
Weighting
As mentioned before, a major objective of this assessment is to obtain accurate, precise, and internationally comparable estimates of population characteristics. Several considerations have to be taken into account to achieve this goal. This section describes the weighting procedures, addressing, in particular, the following issues:
• the definition of what constitutes student participation and what constitutes the requirement for within-school participation within each sampled school;
• the description of the several sets of weights that have to be computed to ensure results based on the assessment data resemble those in the underlying target populations;
• the procedure to calculate the participation rates at each sampling stage and the minimum acceptable participation requirements (unweighted and weighted).

44
Within-school participation requirements
When the student response rate within a school is very low, the likelihood of biased results increases. One of the reasons is that low-performing students, in particular, tend to be more frequently absent from school than high-performing students (Weber, Tieck, & Savasci, 2018). Therefore, in this assessment, a required minimum student participation rate within each school is defined. This rate determines whether or not a school could be considered a “participant” in the assessment.
As explained before, in most participating countries, only one class per school will be selected for the assessment. In these countries, schools have to meet the following participation requirement:
• A sampled school is regarded as a “participating school” if, in its sampled class, at least 50% of its students participate in the student survey.
If a school did not meet this requirement, it has to be regarded as a non-participating school in the student survey. The non-participation of this school has an effect on the school participation rate, but the students from this school should not be included in the calculation of the overall student participation rate. This point is elaborated later in this section.
In some countries, the selected school sample will contain some schools where more than one classroom has to be selected (see the section on Sampling in this chapter). For these schools, the participation requirement has to be modified as follows:
• A sampled class is regarded as “participating class” if at least 50% of its students participate in the survey.
• A sampled school is regarded as “participating school” if all sampled classes participate in the survey.
Whenever there is an indication that the survey operation procedures in a school were not followed properly, the school must be regarded as a non-participant school. For example, if a school had not listed all their eligible classes for class sample selection, the corresponding student data from that school must not be included in the assessment database.
Weighting procedures
Estimation is a technique for producing information about a population of interest based on data gathered from a sample of that population. The first step in this estimation is to assign a weight to each sampled unit or each student, in this case. This weight can be thought of as the average number of students in the survey population that each sampled student represents and is determined by the student weight (Dumais & Gough, 2012c).
The student weight is a product of several weight components. Generally, it is possible to discriminate between two different types of weight components (Weber et al., 2018):
• Base weights reflect the selection probabilities of sampled units. At each level of sample selection, the base weight is the inverse of the selection probability of a sampled unit.
• Non-response adjustments aim to compensate the potential for bias due to non-participation of sampled units.

45
School base weight (WGTFAC1)
The first stage of sampling involves selecting schools in each country. The school base weight reflects the selection probabilities of this sampling step. When explicit stratification is used, the school samples are selected independently in each explicit stratum h, with h=1,…,H. If no explicit strata are formed, the entire country should be regarded as being one explicit stratum.
As explained above, each country should draw a systematic sample of schools with the selection probability of school i being proportional to its school size (PPS). The measure of school size Mhi is defined by the number of students in the assessment target grade. If schools are small (smaller than the average class size in the explicit stratum), the measure of size Mhi should be defined as the average size of all small schools in that stratum.
The school base weight is defined as the inverse of the school’s selection probability. So, for school 𝑖𝑖 in stratum ℎ, the school base weight, 𝑊𝑊𝑊𝑊𝑇𝑇𝑇𝑇𝑇𝑇𝑇𝑇1ℎ𝑖𝑖 , is given by:
𝑊𝑊𝑊𝑊𝑇𝑇𝑇𝑇𝑇𝑇𝑇𝑇1ℎ𝑖𝑖 =𝑀𝑀ℎ
𝑛𝑛ℎ𝑠𝑠 × 𝑀𝑀ℎ𝑖𝑖
where 𝑛𝑛ℎ𝑠𝑠 is the number of sampled schools in stratum ℎ, 𝑀𝑀ℎ is the total number of students enrolled in the schools of explicit stratum ℎ, and 𝑀𝑀ℎ𝑖𝑖 is the measure of the size of the selected school 𝑖𝑖.
School non-response adjustment (WGTADJ1S)
Because experience tells us that some schools will refuse to participate in the assessment or will have to be removed from the national dataset, the school base weights have to be adjusted to account for the sample size loss. Adjustments are calculated within non-response groups defined by the explicit strata. Within each explicit stratum, a school non-response adjustment, 𝑊𝑊𝑊𝑊𝑇𝑇𝑇𝑇𝑊𝑊𝑊𝑊1𝑆𝑆ℎ𝑖𝑖 , is calculated for each participating school 𝑖𝑖 in stratum ℎ as:
𝑊𝑊𝑊𝑊𝑇𝑇𝑇𝑇𝑊𝑊𝑊𝑊1𝑆𝑆ℎ𝑖𝑖 =𝑛𝑛ℎ𝑠𝑠,𝑒𝑒
𝑛𝑛ℎ𝑝𝑝−𝑠𝑠𝑠𝑠𝑠𝑠
where 𝑛𝑛ℎ𝑠𝑠,𝑒𝑒 is the number of sampled eligible schools and 𝑛𝑛ℎ
𝑝𝑝−𝑠𝑠𝑠𝑠𝑠𝑠 is the number of participating schools in the student survey in explicit stratum ℎ.
The number 𝑛𝑛ℎ𝑠𝑠,𝑒𝑒 in this section is not necessarily equal to 𝑛𝑛ℎ𝑠𝑠 in the preceding section, as 𝑛𝑛ℎ
𝑠𝑠,𝑒𝑒 is restricted to schools deemed as eligible to participate in the assessment. Because there is normally a lapse (sometimes more than one year) between the school sampling and the actual assessment, some selected schools may no longer be eligible for participation in the assessment. This happens, for example, when a school has recently closed, do not have target grade students at the time of the assessment, or has enrolled only excluded students. In these cases, the ineligible school must not be taken into account when calculating the non-response adjustment.

46
Class base weight (WGTFAC2S)
In each participating school, one or more classes has to be randomly selected. More specifically, this process involves a systematic random method with equal selection probabilities for each class. In this sampling step, the class base weight is the inverse of the selection probability. So, for each sampled class 𝑗𝑗, the class base weight, 𝑊𝑊𝑊𝑊𝑇𝑇𝑇𝑇𝑇𝑇𝑇𝑇2𝑆𝑆ℎ𝑖𝑖𝑖𝑖 , is given by:
𝑊𝑊𝑊𝑊𝑇𝑇𝑇𝑇𝑇𝑇𝑇𝑇2𝑆𝑆ℎ𝑖𝑖𝑖𝑖 =𝑇𝑇ℎ𝑖𝑖𝑐𝑐ℎ𝑖𝑖𝑠𝑠
where 𝑇𝑇ℎ𝑖𝑖 is the total number of classes with eligible students enrolled in the target grade and 𝑐𝑐ℎ𝑖𝑖𝑠𝑠 is the number of sampled classes in school 𝑖𝑖 in stratum ℎ.
Class non-response adjustment (WGTADJ2S)
In most cases, one class per school will be selected for the assessment. Thus, non-response at the class level is equivalent to non-response at the school level, and any adjustments for non-response will be conducted as described above. However, as discussed above, it is expected that in some cases, two classes will have to be selected in some of the schools. If one of the two classes does not participate, the entire school should be regarded as non-participating. As a consequence, the non-response adjustment will have to be also performed at the stratum level.
However, in situations where a census of schools is taken in a stratum, classes become the primary sampling units. In situations of class non-participation, a class weight adjustment has to be computed at the school level to correct for class non-response. The class weight adjustment, 𝑊𝑊𝑊𝑊𝑇𝑇𝑇𝑇𝑊𝑊𝑊𝑊2𝑆𝑆ℎ𝑖𝑖𝑖𝑖 , for each participating class 𝑗𝑗 is calculated as:
𝑊𝑊𝑊𝑊𝑇𝑇𝑇𝑇𝑊𝑊𝑊𝑊2𝑆𝑆ℎ𝑖𝑖𝑖𝑖 =𝑐𝑐ℎ𝑖𝑖𝑠𝑠
𝑐𝑐ℎ𝑖𝑖𝑝𝑝
where 𝑐𝑐ℎ𝑖𝑖𝑠𝑠 is the total number of sampled classes and 𝑐𝑐ℎ𝑖𝑖𝑝𝑝 is the total number of participating classes
in school 𝑖𝑖 in explicit stratum ℎ.
Student non-response adjustment (WGTADJ3S)
For all schools, the adjustment for student non-response inside each class for each participating student 𝑘𝑘, 𝑊𝑊𝑊𝑊𝑇𝑇𝑇𝑇𝑊𝑊𝑊𝑊3𝑆𝑆ℎ𝑖𝑖𝑖𝑖𝑖𝑖 , is calculated as follows:
𝑊𝑊𝑊𝑊𝑇𝑇𝑇𝑇𝑊𝑊𝑊𝑊3𝑆𝑆ℎ𝑖𝑖𝑖𝑖𝑖𝑖 =𝑠𝑠ℎ𝑖𝑖𝑖𝑖𝑒𝑒
𝑠𝑠ℎ𝑖𝑖𝑖𝑖𝑝𝑝
where 𝑠𝑠ℎ𝑖𝑖𝑖𝑖𝑒𝑒 is the number of eligible students and 𝑠𝑠ℎ𝑖𝑖𝑖𝑖𝑝𝑝 is the number of participating students in
class 𝑗𝑗 in school 𝑖𝑖 in stratum ℎ. In the context of student weight adjustment, students of the target population are regarded as eligible if they had not been excluded due to disabilities or language problems (see sampling section above) and if they have not left the sampled school after class sampling.
Final student weight (TOTWGTS)
The final student weight, 𝑇𝑇𝑇𝑇𝑇𝑇𝑊𝑊𝑊𝑊𝑇𝑇𝑆𝑆ℎ𝑖𝑖𝑖𝑖𝑖𝑖, of each student 𝑘𝑘 in class 𝑗𝑗 of school 𝑖𝑖 in stratum ℎ is the product of the five student-weight components:
𝑇𝑇𝑇𝑇𝑇𝑇𝑊𝑊𝑊𝑊𝑇𝑇𝑆𝑆ℎ𝑖𝑖𝑖𝑖𝑖𝑖 = 𝑊𝑊𝑊𝑊𝑇𝑇𝑇𝑇𝑇𝑇𝑇𝑇1ℎ𝑖𝑖 × 𝑊𝑊𝑊𝑊𝑇𝑇𝑇𝑇𝑊𝑊𝑊𝑊1𝑆𝑆ℎ𝑖𝑖 × 𝑊𝑊𝑊𝑊𝑇𝑇𝑇𝑇𝑇𝑇𝑇𝑇2𝑆𝑆ℎ𝑖𝑖𝑖𝑖 × 𝑊𝑊𝑊𝑊𝑇𝑇𝑇𝑇𝑊𝑊𝑊𝑊2𝑆𝑆ℎ𝑖𝑖𝑖𝑖 × 𝑊𝑊𝑊𝑊𝑇𝑇𝑇𝑇𝑊𝑊𝑊𝑊3𝑆𝑆ℎ𝑖𝑖𝑖𝑖𝑖𝑖
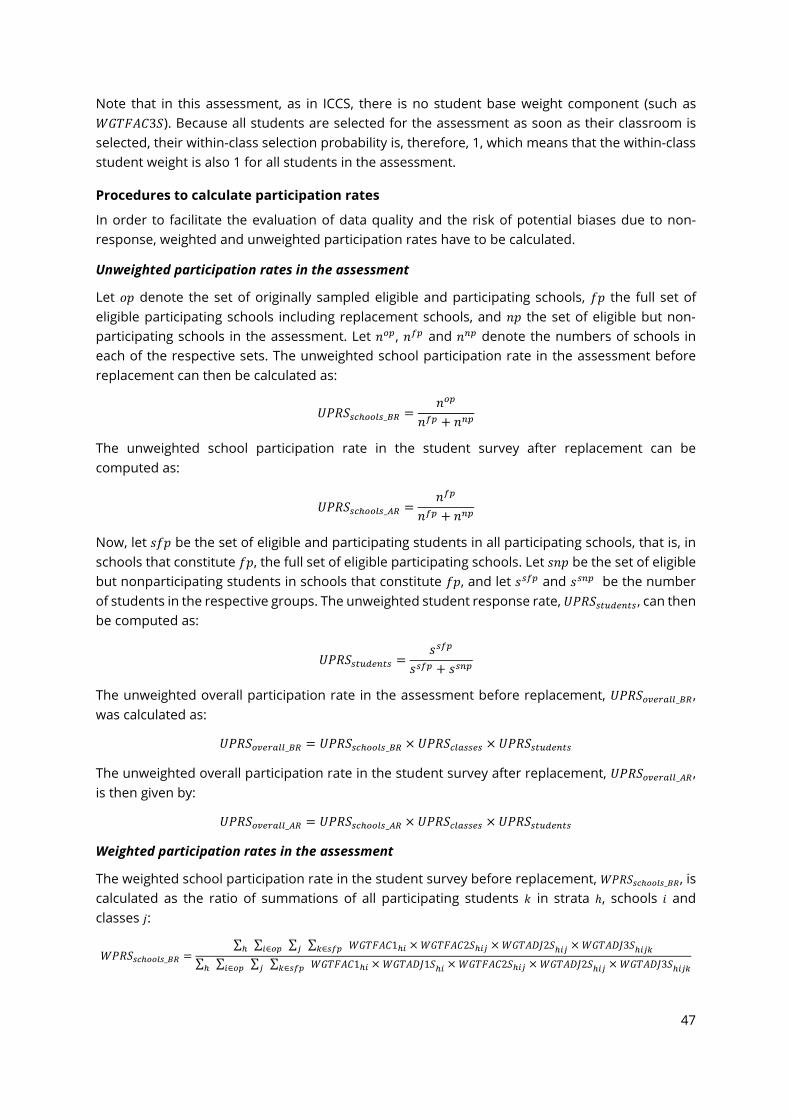
47
Note that in this assessment, as in ICCS, there is no student base weight component (such as 𝑊𝑊𝑊𝑊𝑇𝑇𝑇𝑇𝑇𝑇𝑇𝑇3𝑆𝑆). Because all students are selected for the assessment as soon as their classroom is selected, their within-class selection probability is, therefore, 1, which means that the within-class student weight is also 1 for all students in the assessment.
Procedures to calculate participation rates
In order to facilitate the evaluation of data quality and the risk of potential biases due to non-response, weighted and unweighted participation rates have to be calculated.
Unweighted participation rates in the assessment
Let 𝑜𝑜𝑜𝑜 denote the set of originally sampled eligible and participating schools, 𝑓𝑓𝑜𝑜 the full set of eligible participating schools including replacement schools, and 𝑛𝑛𝑜𝑜 the set of eligible but non-participating schools in the assessment. Let 𝑛𝑛𝑜𝑜𝑝𝑝, 𝑛𝑛𝑓𝑓𝑝𝑝 and 𝑛𝑛𝑛𝑛𝑝𝑝 denote the numbers of schools in each of the respective sets. The unweighted school participation rate in the assessment before replacement can then be calculated as:
𝑈𝑈𝑈𝑈𝑈𝑈𝑆𝑆𝑠𝑠𝑠𝑠ℎ𝑜𝑜𝑜𝑜𝑜𝑜𝑠𝑠_𝐵𝐵𝐵𝐵 =𝑛𝑛𝑜𝑜𝑝𝑝
𝑛𝑛𝑓𝑓𝑝𝑝 + 𝑛𝑛𝑛𝑛𝑝𝑝
The unweighted school participation rate in the student survey after replacement can be computed as:
𝑈𝑈𝑈𝑈𝑈𝑈𝑆𝑆𝑠𝑠𝑠𝑠ℎ𝑜𝑜𝑜𝑜𝑜𝑜𝑠𝑠_𝐴𝐴𝐵𝐵 =𝑛𝑛𝑓𝑓𝑝𝑝
𝑛𝑛𝑓𝑓𝑝𝑝 + 𝑛𝑛𝑛𝑛𝑝𝑝
Now, let 𝑠𝑠𝑓𝑓𝑜𝑜 be the set of eligible and participating students in all participating schools, that is, in schools that constitute 𝑓𝑓𝑜𝑜, the full set of eligible participating schools. Let 𝑠𝑠𝑛𝑛𝑜𝑜 be the set of eligible but nonparticipating students in schools that constitute 𝑓𝑓𝑜𝑜, and let 𝑠𝑠𝑠𝑠𝑓𝑓𝑝𝑝 and 𝑠𝑠𝑠𝑠𝑛𝑛𝑝𝑝 be the number of students in the respective groups. The unweighted student response rate, 𝑈𝑈𝑈𝑈𝑈𝑈𝑆𝑆𝑠𝑠𝑠𝑠𝑠𝑠𝑠𝑠𝑒𝑒𝑛𝑛𝑠𝑠𝑠𝑠, can then be computed as:
𝑈𝑈𝑈𝑈𝑈𝑈𝑆𝑆𝑠𝑠𝑠𝑠𝑠𝑠𝑠𝑠𝑒𝑒𝑛𝑛𝑠𝑠𝑠𝑠 =𝑠𝑠𝑠𝑠𝑓𝑓𝑝𝑝
𝑠𝑠𝑠𝑠𝑓𝑓𝑝𝑝 + 𝑠𝑠𝑠𝑠𝑛𝑛𝑝𝑝
The unweighted overall participation rate in the assessment before replacement, 𝑈𝑈𝑈𝑈𝑈𝑈𝑆𝑆𝑜𝑜𝑜𝑜𝑒𝑒𝑜𝑜𝑜𝑜𝑜𝑜𝑜𝑜_𝐵𝐵𝐵𝐵, was calculated as:
𝑈𝑈𝑈𝑈𝑈𝑈𝑆𝑆𝑜𝑜𝑜𝑜𝑒𝑒𝑜𝑜𝑜𝑜𝑜𝑜𝑜𝑜_𝐵𝐵𝐵𝐵 = 𝑈𝑈𝑈𝑈𝑈𝑈𝑆𝑆𝑠𝑠𝑠𝑠ℎ𝑜𝑜𝑜𝑜𝑜𝑜𝑠𝑠_𝐵𝐵𝐵𝐵 × 𝑈𝑈𝑈𝑈𝑈𝑈𝑆𝑆𝑠𝑠𝑜𝑜𝑜𝑜𝑠𝑠𝑠𝑠𝑒𝑒𝑠𝑠 × 𝑈𝑈𝑈𝑈𝑈𝑈𝑆𝑆𝑠𝑠𝑠𝑠𝑠𝑠𝑠𝑠𝑒𝑒𝑛𝑛𝑠𝑠𝑠𝑠
The unweighted overall participation rate in the student survey after replacement, 𝑈𝑈𝑈𝑈𝑈𝑈𝑆𝑆𝑜𝑜𝑜𝑜𝑒𝑒𝑜𝑜𝑜𝑜𝑜𝑜𝑜𝑜_𝐴𝐴𝐵𝐵, is then given by:
𝑈𝑈𝑈𝑈𝑈𝑈𝑆𝑆𝑜𝑜𝑜𝑜𝑒𝑒𝑜𝑜𝑜𝑜𝑜𝑜𝑜𝑜_𝐴𝐴𝐵𝐵 = 𝑈𝑈𝑈𝑈𝑈𝑈𝑆𝑆𝑠𝑠𝑠𝑠ℎ𝑜𝑜𝑜𝑜𝑜𝑜𝑠𝑠_𝐴𝐴𝐵𝐵 × 𝑈𝑈𝑈𝑈𝑈𝑈𝑆𝑆𝑠𝑠𝑜𝑜𝑜𝑜𝑠𝑠𝑠𝑠𝑒𝑒𝑠𝑠 × 𝑈𝑈𝑈𝑈𝑈𝑈𝑆𝑆𝑠𝑠𝑠𝑠𝑠𝑠𝑠𝑠𝑒𝑒𝑛𝑛𝑠𝑠𝑠𝑠
Weighted participation rates in the assessment
The weighted school participation rate in the student survey before replacement, 𝑊𝑊𝑈𝑈𝑈𝑈𝑆𝑆𝑠𝑠𝑠𝑠ℎ𝑜𝑜𝑜𝑜𝑜𝑜𝑠𝑠_𝐵𝐵𝐵𝐵, is calculated as the ratio of summations of all participating students 𝑘𝑘 in strata ℎ, schools 𝑖𝑖 and classes 𝑗𝑗:
𝑊𝑊𝑈𝑈𝑈𝑈𝑆𝑆𝑠𝑠𝑠𝑠ℎ𝑜𝑜𝑜𝑜𝑜𝑜𝑠𝑠_𝐵𝐵𝐵𝐵 =∑ ℎ ∑
𝑖𝑖∈𝑜𝑜𝑝𝑝 ∑ 𝑖𝑖 ∑
𝑖𝑖∈𝑠𝑠𝑓𝑓𝑝𝑝 𝑊𝑊𝑊𝑊𝑇𝑇𝑇𝑇𝑇𝑇𝑇𝑇1ℎ𝑖𝑖 × 𝑊𝑊𝑊𝑊𝑇𝑇𝑇𝑇𝑇𝑇𝑇𝑇2𝑆𝑆ℎ𝑖𝑖𝑖𝑖 × 𝑊𝑊𝑊𝑊𝑇𝑇𝑇𝑇𝑊𝑊𝑊𝑊2𝑆𝑆ℎ𝑖𝑖𝑖𝑖 × 𝑊𝑊𝑊𝑊𝑇𝑇𝑇𝑇𝑊𝑊𝑊𝑊3𝑆𝑆ℎ𝑖𝑖𝑖𝑖𝑖𝑖∑ ℎ ∑
𝑖𝑖∈𝑜𝑜𝑝𝑝 ∑ 𝑖𝑖 ∑
𝑖𝑖∈𝑠𝑠𝑓𝑓𝑝𝑝 𝑊𝑊𝑊𝑊𝑇𝑇𝑇𝑇𝑇𝑇𝑇𝑇1ℎ𝑖𝑖 × 𝑊𝑊𝑊𝑊𝑇𝑇𝑇𝑇𝑊𝑊𝑊𝑊1𝑆𝑆ℎ𝑖𝑖 × 𝑊𝑊𝑊𝑊𝑇𝑇𝑇𝑇𝑇𝑇𝑇𝑇2𝑆𝑆ℎ𝑖𝑖𝑖𝑖 × 𝑊𝑊𝑊𝑊𝑇𝑇𝑇𝑇𝑊𝑊𝑊𝑊2𝑆𝑆ℎ𝑖𝑖𝑖𝑖 × 𝑊𝑊𝑊𝑊𝑇𝑇𝑇𝑇𝑊𝑊𝑊𝑊3𝑆𝑆ℎ𝑖𝑖𝑖𝑖𝑖𝑖

48
Reporting participation rates
All countries conducting this assessment must use the procedures described above to calculate and report their unweighted and weighted participation rates for students and schools. Examples of how this information can be reported are in Figure 7 and Figure 8.
Figure 7. Unweighted participation rates (example from ICCS)
Source: Shultz, et al. (2018)
Figure 8. Weighted participation rates
Source: Shultz, et al. (2018)

49
Standards for sampling participation rates
Despite countries’ efforts to achieve participation rates of 100%, different levels of non-response are expected to occur. For this assessment, we recommend following the ICCS guidelines for reporting data for countries with less than full participation. Three categories for sampling participation are defined.
Countries grouped in Category 1 are the ones that meet the sampling requirements. Countries in Category 2 meet these requirements only after the inclusion of replacement schools. Countries in Category 3 are the ones that fail to meet the sample participation requirements. The descriptions of the criteria to include countries in the different categories are in Figure 9.
Reporting data
In those instances where a country conducting this assessment cannot be placed in participation Category 1, it is necessary to make readers or users of this information aware of the increased potential for bias.
Based on the sample participation categories, the assessment results must be reported in different ways:
• Category 1: Countries in this category should make their information public without annotations.
• Category 2: Countries in this category should include a note in every table or report clearly stating that the standards of participation rates have not been fully met and that the reported data should be interpreted with caution.
• Category 3: Countries in this category should include a note in every table or report clearly stating that the standards of participation rates have not been met and therefore the reported data cannot be considered to be representative of the population.
Dumais & Gough (2012c) prepared a complete series of examples and exercises, including example data and software routines, to estimate sampling weights under a two-stage sampling design, as well as how to calculate the non-response adjustments described above. The exercises, 14.2, 14.4 and 14.6 are particularly relevant for the methods used in this assessment.

50
Figure 9. Categories into which countries should be placed with respect to sampling participation
Category 1: Satisfactory sampling participation rate without the use of replacement schools.
A country was in this category if:
• It had an unweighted school response rate without replacement of at least 85% (after rounding to the nearest whole percentage point) and an unweighted student response rate (after rounding) of at least 85%.
or
• A weighted school response rate without replacement of at least 85% (after rounding to the nearest whole percentage point) and a weighted student response rate (after rounding) of at least 85%.
or
• The product of the (unrounded) weighted school response rate without replacement and the (unrounded) weighted student response rate was at least 75% (after rounding to the nearest whole percentage point).
Category 2: Satisfactory sampling participation rate only when replacement schools were included.
A country was in this category if:
• It failed to meet the requirements for Category 1 but has either an unweighted or weighted school response rate without replacement of at least 50% (after rounding to the nearest whole percentage point).
and had either
• An unweighted school response rate with replacement of at least 85% (after rounding to the nearest whole percentage point) and an unweighted student response rate (after rounding) of at least 85%.
or
• A weighted school response rate with replacement of at least 85% (after rounding to nearest whole percentage point) and a weighted student response rate (after rounding) of at least 85%.
or
• The product of the (unrounded) weighted school response rate with replacement and the (unrounded) weighted student response rate was at least 75% (after rounding to the nearest whole percentage point).
Category 3: Unacceptable sampling response rate even when replacement schools are included.
If a country did not meet the requirements for Category 1 or Category 2 but could provide documentation showing that they had complied with ICCS sampling procedures, it was placed in Category 3.
Source: Shultz, et al. (2018)
Estimation of sampling variance
As mentioned before, this assessment employs two-stage cluster sampling procedures to obtain the student sample. During the first stage, schools are sampled from a sampling frame with a probability proportional to their size. During the second stage, intact classrooms are randomly sampled within schools. Cluster or two-stage sampling techniques permit an efficient and economic data collection process. However, because these samples are not simple random

51
samples, it is not appropriate to apply the usual formulae for obtaining standard errors reflecting sampling error for population estimates.
Replication techniques offer tools that can be used to estimate the correct sampling variance on population estimates (E. Gonzalez & Foy, 2000; Wolter, 1985). For this assessment, following the technical procedures of ICCS (see Wolfram Schulz, Ainley, & Fraillon, 2011; Wolfram Schulz et al., 2018), we use the jackknife repeated replication technique (JRR) to compute standard errors for population means, percentages, and any other population statistic.
In general terms, the JRR method for stratified samples requires pairing primary sampling units (PSUs) – in this assessment, schools – into pseudo-strata. Because the assignment of schools to these ‘sampling zones’ needs to be consistent with the sampling frame from which they were sampled, Implementation agencies should construct sampling zones within explicit strata. When faced with occurrences of an odd number of schools within an explicit stratum or the sampling frame, the remaining school has to be randomly divided into two halves, thereby forming a sampling zone of two ‘quasi-schools’.
Given the sampling design described here, each of the countries participating in the assessment has to have up to 75 sampling zones. In countries where for any reason are larger numbers of schools, some schools have to be combined into bigger ‘pseudo-schools’ in order to keep the total number to 75.
Within each of the sampling zones, one school is randomly assigned a value of 2 and the other school a value of 0. This is known as the replicate indicator. For each of the 75 sampling zones, replicate weights are then computed. The replicate weights are obtained by multiplying the student sampling weights by the jackknife indicators once only for each sampling zone. This means that for each replicate weight, one of the paired schools has a contribution of zero, the second a double contribution, and all other schools remain the same.
This process results in a weight being added to the data file for each jackknife replicate. Thus, within one sampling zone at a time, each element of one PSU receives a double weight and each element of the other PSU receives a zero weight. This procedure can be illustrated by a simple example featuring 24 students from six different schools (A−F) paired into three sampling zones (see Figure 10).

52
Figure 10. Example of the computation of replicate weights from ICCS 2016
Source: Shultz, et al. (2018) For each country sample, 75 replicate weights have to be computed regardless of the number of sampling zones. In countries with fewer sampling zones, the remaining replicate weights must be made equal to the original sampling weight, so they do not contribute to the sampling variance estimate.
Estimating the sampling variance for a statistic, μ, involves computing it once with the sampling weights for the original sample and then with each of the 75 replication weights separately. The sampling variance 𝑆𝑆𝑆𝑆μ estimate is computed using the formula:
𝑆𝑆𝑆𝑆μ = � [μ𝑖𝑖 − μ𝑠𝑠] 275
𝑖𝑖=1
where μ𝑠𝑠 is the statistic μ estimated for the population through the use of the original sampling weights and μ𝑖𝑖 is the same statistic estimated by using the weights for the 𝑖𝑖𝑠𝑠ℎ of 75 jackknife replicates. The standard error 𝑆𝑆𝑆𝑆μ for statistic μ, which reflects the uncertainty of the estimate due to sampling, is computed as:
𝑆𝑆𝑆𝑆𝜇𝜇 = �𝑆𝑆𝑆𝑆𝜇𝜇

53
Specialized software
The computation of sampling variance using jackknife replication can be obtained for any statistic, including means, percentages, standard deviations, correlations, regression coefficients, and mean differences. Standard statistical software does not always include procedures for replication techniques, however, there are several pieces of software that have been specially developed for these kinds of statistical procedures. Below, there are some examples of different pieces of software that are well documented and which documentation includes examples and exercises:
IEA IDB Analyzer
IEA IDB Analyzer (IEA, 2019) is a plug-in for the Statistical Package for the Social Sciences (IBM, 2015) and SAS (SAS, 2012) that allows the user to combine and analyse data from IEA’s large-scale assessments. The application can be downloaded at https://www.iea.nl/data-tools/tools
Replicates
Replicates (ACER, 2018) is an add-in component running under SPSS and offers a number of features for applying different replication methods when estimating sampling and imputation variance. The application can be downloaded from https://iccs.acer.org/ICCS2016reports
WesVar
WesVar (Brick, Morganstein, & Valliant, 2000) is a computer programme developed by Westat that allow users to compute estimates, replicate variance estimates, and to import and export data to creating weights, generating statistics, and obtaining regression output with survey data with complex sample and assessment designs. The application can be downloaded from https://www.westat.com/capability/information-technology/wesvar
Intsvy (R)
Intsvy (Caro & Biecek, 2017) is an R package that provides tools for importing, merging, analysing and visualizing data from international assessment studies (TIMSS, PIRLS, PISA, ICILS, and PIAAC). It can be downloaded at https://cran.r-project.org/web/packages/intsvy/index.html Learning resources and video tutorials can be found at https://www.youtube.com/channel/UCyykJxYbj_WGIZH5AttwyjQ
RALSA (R)
The R Analyzer for Large-Scale Assessments (RALSA) (Mirazchiyski, 2021) is an R package for preparation and analysis of data from large-scale assessments and surveys which use complex sampling and assessment design. RALSA is a free of charge and open-source software, it works on any system which can run a full installation of R. In addition to the traditional command-line R interface, RALSA has a Graphical User Interface that can be used in any web browser. The user guide and learning materials can be accessed at http://ralsa.ineri.org/
Dumais & Gough (2012a) also prepared a complete series of examples and exercises, including example data and software routines, to estimate replicate weights Jackknife variance estimation, as well as how to calculate mean differences while considering a complex sample design. The exercises, 14.2, 14.4 and 14.6 are particularly relevant for the methods used in this assessment.

54
7. Logistics of the national assessment
The coordination of national logistics determines, to a large extent, the success of the assessment. The potential needs of the staff, the procedures for contacting schools, the availability of facilities, and the distribution of the instruments are all relevant. Most of the information included in this chapter is adapted from Howie and Acana (2012).
Staff recommendation and contacting schools
Considering that national assessments aim to provide valid information about educational achievement or the opinions of the students in the target population about specific topics, the decisions regarding the personnel who will carry out the assessment and the facilities they will need, are crucial. All sorts of problems can be anticipated if personnel are not competent or if facilities are inadequate.
As a general principle, not only should personnel have specialist skills, they should also be committed and open-minded, attentive to detail, and willing to put in additional hours beyond the normal workday. From the point of view of technical adequacy and efficiency, these attributes are more important than seniority within a government department or within an academic institution.
This section describes the role of typical staff members9 (for example, the national coordinator) as well as the roles of additional personnel, such as test administrators, who will be required to carry out the assessment. A list of the personnel considered here, and a description of their main functions are listed in Table 9.
9 There are other staff members that could be involved at different stages, for example, item writers, test administrators, statisticians, data managers, designers, translators, data entry personnel, data recorders, tests scorers, among others.

55
Table 9. Main staff members involved in the logistics of the assessment and their functions
Staff member Description and main functions
National research coordinator Should give general direction and provide leadership throughout the planning and implementation stages of the national assessment. Should be respected within the education community, should have access to key education stakeholders and to the main sources of funding, should be familiar with concepts in education and measurement. He or she should be able to see the “big picture.”
Assistant National Coordinator (NC)
May be required depending on the structure of the education system, the scope of the assessment, the time demands on the NC, and the availability of funding. The assistant NC should have many of the attributes required of the NC and should support and serve as a substitute for the NC when necessary.
Regional Coordinator In large countries with regional administrative systems, the national assessment team should consider appointing regional coordinators to organize testing and to liaise with schools and test administrators. Such coordinators would be responsible for allocating and delivering materials to the test administrators and should check the contents of boxes coming from the central office.
School liaison person The school liaison person or school coordinator could be a teacher or guidance counselor in a school, but he or she should not be teaching students selected for the assessment. Frequently, the school principal serves in this role. The school liaison person serves as a contact point in schools for the national assessment team and helps ensure that school personnel are aware of the assessment. This staff member is the key for coordination with administrators and other participants, such as parents or teacher (when they participate).
Test administrators Include the distribution of the student test instruments according to the student tracking forms, the supervision of test sessions, ensuring that the timing of the test sessions was correct, and recording student participation. In some countries, classroom teachers administer national assessment tests to their own students. More often than not, however, teachers other than those who teach the students who are taking the test or individuals who are external to the school are entrusted with this task. In some countries, data collection is contracted to a body that specializes in that activity. Potential administrators should have the following characteristics:
• Good organizational and communication skills
• Experience working in schools
• Reliability, and ability and willingness to follow instructions precisely
Source: Adapted from Howie and Acana (2012)

56
The national coordinator should inform schools that he or she has been selected for the national assessment as soon as possible10. If required, the permission of the ministry of education or regional education authority should be obtained before schools are contacted. When schools are contacted and invited to participate, they should be asked to acknowledge receipt of the invitation. The school should be asked to appoint a contact person, school liaison person, or coordinator for the assessment. The national assessment team should strive to ensure that it establishes and maintains a good rapport with local education authorities, if it exists. The national assessment team should keep an updated list or tracking form of participating schools to help monitor fieldwork progress. The form will provide information on schools, such as school name, size, and contact information (see Table 10 as an example).
Additionally, there are several facilities such as space, equipment and or tools for staff members, that are relevant in the administration of a national assessment. For instance, space for meetings, access to rooms, space for organizing and storing materials, technological tools for different activities involved in the assessment (phones, computers, internet, software etc).
Table 10. Example of a national assessment: school tracking form
Priority of
Schoola
School ID
Name, address, phone
number of school
Name and phone
number of school
coordinator
School size
Status (participant
or non-participant)
Date materials
sent
Date materials received
Date of testing
1
1
1
1
1
1
1
2
2
2
2
2
Source: Adapted from Anderson & Morgan (2008a) Note: Schools selected from the sample are priority 1. Replacement schools are priority 2.
10 Insofar as possible, after schools have been selected, they should not be changed or replaced. Despite the best efforts of a national assessment team, however, some school replacements may be necessary. Should the need to replace schools be anticipated, that possibility should be discussed with the sampling statistician so that adequate sampling procedures are implemented, and replacement schools are properly selected. Under no circumstances should the selection of replacement schools be left to the discretion of the test administrator or local school official.

57
Logistics in instrument checks and distribution
The national coordinator or his or her appointee should check the quality of all tests, questionnaires, and manuals to ensure the following:
• Spelling and typographical errors are removed.
• Font size in test booklets is sufficiently large. Large font sizes are particularly important for young children.
• Adequate spacing is used between lines of text.
• Diagrams are simple and clear. Where possible, they should be on the same page as the relevant text.
A qualified data entry person who is familiar with computer packages such as Microsoft Office should type tests, questionnaires, and other materials. Likewise, cost-saving measures that should be considered at this stage include the following:
• Preparing test booklets to fit on an even number of pages.
• Careful proofreading, especially of final drafts, which can help prevent reprinting of test booklets necessitated by serious typographical or graphical errors.
• Giving the printer adequate time to print tests and questionnaires to avoid paying overtime rates when the assignment has to be completed over a relatively short time or when the printer has other priorities.
At least three people should independently proofread final drafts of all the materials used in a national assessment. When print runs are ordered, additional copies should be requested for each school package in anticipation of the need for replacement schools and of some spoilage.
Effective national assessment team leaders plan thoroughly and well in advance of the administration of the assessment in schools. They also tend to delegate responsibility while retaining overall control of the preparation process through quality control measures, in particular spot-checking the work of others.
A set of packing procedures should be established and documented. A packing checklist is required. National assessment staff members should sign and date the appropriate boxes in the “Packed” and “Returned” columns in the packing check- list. The school liaison person is expected to do the same in the boxes in the “Received” columns after checking the material sent from the national assessment office.
Local circumstances will determine the most appropriate and cost- effective method of delivering and collecting materials for the national assessment. In some instances, materials are delivered to central offices that are secure (for example, district education or local government offices), and test administrators collect them using public transportation. In other cases, where secure and reliable delivery systems exist, materials are delivered to test administrators’ homes. Sometimes, teams of administrators travel together in a van and are dropped off with the necessary materials at schools.
In some national assessments, test administration is carried out at the same time in all schools, usually over one or two days. In others, test administrators travel from school to school over a

58
short period. In the latter case, care has to be taken to maintain the security of test materials and to ensure that test related information is not exchanged between schools.
Administration and common problems
Problems associated with administering a national assessment tend to vary from country to country in both nature and magnitude. The more serious the problem, the more it undermines the entire national assessment enterprise. From the outset, the national assessment team should ensure that the sampled schools are in fact the ones in which students are being assessed. Some teams have discovered “ghost” (bogus) schools after using national data sources for sampling purposes. The test administrator and the school liaison person should establish that the pupils who take the tests are in fact the pupils who were selected for participation.
Other problems that have been identified in the administration of national assessments are:
• date of testing clashing with a school event
• pupils completing the first section of the test and leaving school before the second section
• teachers and students arriving late
• teachers, and even the principal, insisting on remaining in the class while students are taking the test
• lack of adequate seating arrangements for test taking
• failure to stick to time limits
• test administrator or others giving assistance to students
• copying by students
High levels of participation are required in a national assessment to provide valid information on student achievement in the education system. IEA studies, for example, require a participation rate of at least 85% for both schools and students or a combined rate (the product of school and student participation) of 75%. IEA also sets the upper limit of exclusions (on grounds such as school remoteness and disability) at 5% of the desired target population (see Chapter 6 for more details on participation rates). In an effort to improve the level of school cooperation, replacement sessions could be held at a later date for students who were absent for the initial assessment session. Experience suggests that students and schools tend to cooperate more fully when they realize that the test administrators would keep returning until all selected students have been tested.
Quality issues
To monitor the quality of test administration, the test administrator should complete a test or questionnaire administration form (Figure 11) after work in an individual school has been completed. The form will provide a record of the extent to which proper administrative procedures were followed.

59
Figure 11. Example of a test administration form
Source: Howie and Acana (2012) To check further if testing has been carried out following prescribed procedures, many national assessments appoint a small number of quality control monitors to make unannounced visits to schools. Although all test administrators should know that a possibility exists that they will be monitored, in practice, usually only 10% to 20% of schools are visited. Quality control personnel should be familiar with the purpose of the national assessment, the sampling design and its significance, the roles of the school coordinator and test administrator, the content of tests and questionnaires, and the classroom observation record. They should be briefed on how to conduct school visits without disrupting the actual assessment. Monitors should complete a form on administrative and other conditions in each school visited. Examples of the activities for which information is recorded in the form used for TIMSS (Trends in International Mathematics and Science Study) are provided in.
Complete one form per testing session.
Name of test administrator: _________________________________________________
School ID: __________________________________________________________________
School name: _______________________________________________________________
Class name: _________________________________________________________________
School liaison person: _________________________________________________________
Original testing session: _______________________________________________________
Replacement testing session (if applicable): ______________________________________
Date of testing: _______________________________________________________________
Time of testing
Start time End time Details
Administration of test materials
Testing session 1
Testing session 2
Testing session 3
Testing session 4

60
Figure 12. Examples of questions addressed by quality control monitors in TIMSS
Source: Howie and Acana (2012)
1. Preliminary activities of the test administrator
Did the test administrator verify adequate supplies of test booklets? Were all the seals intact on the test booklets prior to distribution?
Was there adequate seating space for the students to work without distraction?
Did the administrator have a stopwatch or timer?
Did the test administrator have an adequate supply of pencils and other materials?
2. Test session activities
Did the test administrator follow the test administrator’s script exactly in (a) preparing the students, (b) distributing materials, and (c) beginning testing?
Did the test administrator record attendance correctly? Did testing time equal the time allowed?
Did the test administrator collect test booklets one at a time from the students?
3. General impressions
During the testing session, did the test administrator walk around the room to ensure that students were working on the correct section of the test and behaving properly?
In your opinion, did the test administrator address students’ questions appropriately?
Did you see any evidence of students attempting to cheat on the tests (for example, by copying from a neighbor)?
4. Interview with the school coordinator
Did you receive the correct shipment of items? Was the national coordinator responsive to your questions or concerns?
Were you able to collect completed teacher questionnaires before test administration?
Were you satisfied with the accommodation (testing room) for the testing? Do you anticipate that makeup sessions will be required at your school?
Did students receive any special instruction, motivational talk, or incentive to prepare them for the assessment?
Were students given any opportunity to practice questions like those in the test before the testing session?

61
8. Data preparation
In this chapter, we refer to data preparation for all the steps required from the data entry process to the generation of the data release for inquiry. Here, the objective is to minimize any possible error that may distort the collected responses when these are stored in digital format for further use (Falk Brese & Cockle, 2017).
Data cleaning
Data cleaning encompasses all data related process from data importation to the data release. The purposes of these different tasks are to turn the raw data from the collected responses into useable data files for inquiry. Brese & Cockle (Falk Brese & Cockle, 2017) enlist the following common steps implemented in large scale studies:
• Import data
• Structure Checks
• Values Ranges
• Identification (ID) checks
• Linkage checks
• Background checks
• Merge scores and weights
• Export
Import data. Import data refers to the process of taking the files generated during the data entry process and turn these into actionable files within a statistical software (e.g., SAS, SPSS, STATA, R). In studies where data collection occurs via a web platform, or other forms of software, instead of a paper-based survey, responses do not come from a data entry process. Yet, the generated data files from these applications would still need to be imported to a statistical software to proceed with the data cleaning process. As such, data importation is the step where raw data that contains participants responses and measures are turned into analyzable files.
Structure checks. These checks refer to the structural features of the expected data. For example, the received data should conform to available codeplans. These codeplans are brief documents that are used during the data entry process. These documents specified how responses are coded by data clerks, to “entry” participants responses to the instrument using certain values. In these codeplans all coded responses are enlisted. Thus, the imported file should have a specific number of columns that represent each expected variable. A common problem during structure checks is the importation of data that contains text field or text strings. Most of the standard files format separate data fields (i.e., variables) using spaces, tabs, “,” or “;”, representing different columns. However, if typed responses contain spaces, “,” or “;” data importation may incur in errors, by miss-representing the expected columns per response. Structural problems during data importation might be spotted in the structure checks phase.

62
Values ranges. Following the codeplans, all collected responses after a study should have a specific range of valid values. Any other value outside these ranges could be deemed invalid, following an agreed codeplan between the data entry step and the data preparation step. During these checks, is expected that the data entry is the result of a systematic and documented process. Thus, for example, if the data entry process is managed by two different data centres or data entry teams, these should have followed the same codeplan. In essence, that each team typed the same value, for the same response, over the same item and questions. During the values ranges check, any deviation should be identified, amended and documented. Numeric typos attributed to data clerks’ errors are expected to be identified in this step. Systematic errors attributed to software features, from studies using software applications to collect response are also expected to be picked up in this step.
ID checks. Single application studies assume a participant provides answers only once in a study. Thus, a common convention is that participants appear in a data record only once, and no participant ID can be repeated. ID checks consist of making sure the previous convention is fulfilled. A common scenario in studies where paper and online participation is open for participants, a participant could appear twice in the raw data response records (Falk Brese & Cockle, 2017). In these cases, one of the records should be selected, and document which one was selected (e.g., the earliest participation), and avoid the unnecessary duplication of a case.
Linkage checks. Multi-actor studies include different participants related to each other by some structure. In the case of large-scale studies in education, the most common example of these relations is the linkage of the school principal, teachers, and students to their respective school. The linkage checks refer to the process of assuring all linkages are complete, consistent and logically correct. This process assures that information from different sources, including participant responses and other records, can be put together into an analyzable data table.
Background checks. This step assures the consistency of information from participants. For example, a student may give his or her age and sex in a context questionnaire in the study. However, the same study may have sociodemographic records from all participants where the same information is also present. During this step of the data cleaning, it is possible to opt the information retrieved using the sociodemographic records if these are deemed more reliable. Likewise, if answers from two different questions should present certain consistency, this expected consistency can be evaluated and amended if necessary. For example, an immigrant student could indicate his or her age in one question and number of years in the country in another question. The second typed response should be a smaller numeric value than the first. During this stage these inconsistencies should be resolved by clarifying if they are the result of data entry error, or a typo from the participant. During this stage, if an inconsistency is not resolved and kept in the data file, documentation should be provided so users of the release data know they were allowed.
Merge scores and weights. Large scale studies often include the preparation of survey weights, and the generation of scores to summarize responses to test and scales. These types of data are often handled separately from participants responses. In this step, these records are added to the data response file. Any unexpected inconsistency between the list of cases with survey design, the list of cases with scores and the list of cases with responses should be identified and documented. For example, a student may present valid responses to all instruments. Yet, the school which the student attends may have been dropped from the study due to low rate of participation. As such,

63
the student record does not present survey weights or scores. Thus, the merge of records is expected to establish the valid list of cases of the study, and which records (if any) were discarded.
Export. Release data is generated at this stage, containing only variables for inquiry. Any other variable generated during the data cleaning process is erased or removed.
Data cleaning steps might be done iteratively (Falk Brese & Cockle, 2017) until the expected data consistency is reached. In summary, the data cleaning process includes all the actions necessary to turn the raw data of collected responses into analyzable data files. Additionally, this process includes the task of amending or excluding participant records not sufficiently consistent or reliable for the purpose of the study. Thus, the data cleaning process also establishes the valid responses and list of cases for further use.
It is recommended that all data cleaning should be conducted following a reproducible process. This ensures that all changes to the raw data are documented, and repeated if necessary. In practice, such a process can be implemented using reproducible research practices and literal programming in a statistical environment (Baumer, Cetinkaya-Rundel, Bray, Loi, & Horton, 2014).
Codebook
What is a codebook?
Codebooks are a technical documentation that allow users to interpret stored data. Codebooks should accompany data files, so the stored values can be used to import data in statistical software, produce interpretable results such as descriptive analysis, and model-based results. In essence, these documents act as a dictionary regarding what a value in a data file means. As such, an exhaustive codebook can have as many entries as variables a data file has (Gebhardt & Berezner, 2017). In general, in large scale assessment studies this documentation can be found in three different sources: codebooks are partially embedded in the release public data files, in the technical report from the study and in its user guide. The relevance of codebooks lies in their role of conveying information for the interpretation of the stored data.
Codebooks are generated before data is collected, and when data is released for inquiry. When responses are being collected a codebook allows users to match items and participant responses. This documentation allows users to distinguish between expected values, and non-expected values, thus aiding data validation and data cleaning procedures. For example, if a question presents a response space of two categories in the final application, coded as 1 and 2 in the data entry process, then all values different from the coded values can be deemed invalid to represent participant responses (Gebhardt & Berezner, 2017). Codebooks from the production stage may contain more coded events than participants responses, such as “not reached” and “not administered” items, containing process information (Provasnik, 2021). This type of documentation generated during the production stage and data entry are also called “codeplans” (Falk Brese & Cockle, 2017). The purpose of the documents is to aid the data entry process. In contrast, codebooks for released data may contain a selection of the coded values. That is, they may contain only the coded values for each valid participant response while excluding other coded events used in the data validation and data cleaning process. The present section of this guideline is focused on codebooks for data files released for inquiry.

64
Types of codebook
Codebooks are built in different formats and styles. Some codebooks are very succinct, containing just enough information regarding what variables constitute an indicator. Other codebooks are much more detailed, including how original responses are recoded to generate an interpretable score in a certain way. A different style of codebook is instrument embedded. These codebooks contain less information regarding how original responses are recoded yet are very explicit regarding the instrument the participants interact with to produce responses. And finally, codebook documentation can be presented as data file embedded codebooks. This latter type of codebook contains information similar to its previous counterparts but is stored in the release data file from the study. In the following section, we include examples of these different types of codebooks.
A simple example of these different types of codebooks can be illustrated using participants’ sex. Participants’ sex is often coded with two values: one and two. To register participants’ sex, they are asked a closed-form question with a two-option response space. The following figures are examples of how participants’ sex is documented in a succinct codebook, data file embedded codebook, detailed codebook, and with an instrument embedded codebook. For illustration purposes, we will use participants’ sex from an ICCS 2016 study.
Succinct codebooks are often generated using statistical programs (e.g., SAS, SPSS, STATA), and will consist of a table that includes the names of the variable, the label of a variable, and its response values.
Figure 13. Example of a succinct codebook to indicate participant sex
Source: ICCS 2009 public data file (Köhler, Weber, Brese, Schulz, & Carstens, 2018, p. 276)
Embedded codebooks are metadata that come in the study data files. To access this metadata, data files need to be opened in statistical software (e.g., SAS, SPSS, STATA, R) that handles labelled vectors. That is software that can read and embed metadata onto data tables. The following example corresponds to an output in R, to get codebook documentation of participants’ sex from ICCS 2016 data files.

65
Figure 14. Example of data file embedded codebook for participants sex indicator displayed in R
Source: ICCS 2016 public data, see https://www.iea.nl/index.php/data-tools/repository/iccs
The detailed codebook contains the same information as the previous formats, while also including the primary question, from which the variable is generated, and the operation used to create it.
Figure 15. Example of a detailed codebook for participants’ sex indicator
Source: International student questionnaire from ICCS 2016 (Köhler et al., 2018, p. 276) Finally, the instrument embedded codebook includes the values for each response, overlayed on top of a representation of the instrument the participants interact with to generate their responses.
Figure 16. Example of an instrument embedded codebook for participants sex indicator
Source: International student questionnaire from ICCS 2019 (Köhler et al., 2018)

66
Elements of a codebook
To illustrate the main elements of a codebook we use “Students Like Science” scale from TIMSS 2019 Technical report (Yin & Fishbein, 2020, p. 16.259). In particular, its instrument embedded codebook. In the following figure, we highlight the elements of interest: a) the names of the variables in the public data file, that contains participants responses; b) the question frame that precedes each item; c) the items participants interacted with to produce responses; d) the response space the participants used to indicate their responses; e) the values used to code participants responses, and f) if any of the items were reverse coded before score generation.
The variable names are the names of the columns in the public data file that contains the responses of participants from the context questionnaire of TIMSS 2019 study. The variables used to generate the “Students Like Learning Science” scores are BSBS22A, BSBS22B, BSBS22C, BSBS22D, BSBS22E, BSBS22F, BSBS22G, BSBS22H, and BSBS22I. Each of these variables contains the responses to the respective items from the “Students Like Learning Science”. For example, the variable BSBS22A stores participants responses to the item “I enjoy learning science”. This item has four response categories: “Agree a lot”, “Agree a little”, “Disagree a little” and “Disagree a lot”. Each of these categories was coded with the response values 1, 2, 3 and 4, thus a higher number indicates a higher degree of disagreement. The question frame that precedes the item is “How much do you agree with these statements about learning science”.
In the present guidelines, we favour this type of codebook documentation, because with this information a secondary user has all the information needed to implement a scoring process. Thus, the recommended elements of information for codebooks of multi-item instruments are a) variable names; b) frame; c) items; d) response space; e) response values; and f) reverse flags. The recommended elements assures that users have all the necessary information to interpret the collected responses from a study, generate scores, and produce results.

67
Figure 17. Instrument embedded codebook for “Students Like Learning Science”
Source: Chapter 16: Creating context questionnaire scales TIMSS 2019 (Yin & Fishbein, 2020)
How to build a codebook
A study that collected responses to measure an SDG target, would benefit from the generation of data embedded codebooks and instrument embedded codebook, at the least. The first codebook ensures that users of the data file can access metadata to interpret what each value means in the shared data of the study. The second codebook ensures that users of the study data files have enough information for many purposes, including the generation of scores for assessing SDG targets.
Data embedded codebooks can be generated using statistical software. Statistical software such as SAS, SPSS, STATA and R have commands to include metadata onto data tables and save this information into their data files. However, before building a codebook in a statistical package, most often researchers and analysts may create spreadsheets containing the basic information of the data file, for each variable. The basic elements contained in these spreadsheets are variable name, variable label, value labels including missing coded responses (Wu, Tam, & Jen, 2016a, p. 65). For every variable contained in the data file generated for use, a row should be included to document its basic properties: name, label, type, values.

68
Figure 18. Spreadsheet codebook example of ICCS 2016 (selected fields)
Source: ICCS 2016 public data, see https://www.iea.nl/index.php/data-tools/repository/iccs, see ICCS2016MS_Codebook.xlsx Instrument embedded codebooks are a friendlier form of documentation that can aid data inquiry. These codebooks serve the purposes of making it easier for users to find the name of a variable once it is matched to the test or question survey that generate its responses. We recommend generating these codebooks so users of the study data files are aware of items that belong to a scale, its reverse items, and what participants interacted with to generate responses. To generate these documents, word processors and a copy of the study instrument are needed, so response values and variable names can be overlaid on top of the instrument in question. One limitation of instrument embedded codebook should be noted. these latter documents are not designed to store information about study process variables such as students ID, country codes, stratification variables, survey weights among other variables. These later process variables need to be documented in the succinct codebook, in a spreadsheet for example.
Very complete examples of these documents can be consulted in the ICCS 2016 User guide (Köhler et al., 2018), the TIMSS 2019 technical report (Martin et al., 2020) and the PISA 2018 website11.
11 https://www.oecd.org/pisa/data/2018database/
https://webfs.oecd.org/pisa2018/PISA2018_CODEBOOK.xlsx

69
9. Producing scores
From standards to responses
Proposing scores to assess SDG thematic Indicators 4.7.4 and 4.7.5 using large scale assessment data, requires the identification of available measures that can represent these indicators. Sandoval-Hernández et al. (Sandoval-Hernández et al., 2019) contains a mapping exercise where SDG 4.7.4 and SDG 4.7.5 indicators were mapped onto available measures from different large scale assessment studies including TIMSS, PISA and ICCS. The present sections describe what users can do to retrieve responses from large scale assessment studies, for the purposes of assessing SDG 4.7.4 and SDG 4.7.5 indicators, once a mapping exercise is available.
The product of a mapping exercise links the conceptual definition of an SDG indicator to an available measure of a large-scale assessment study. In doing so, the mapping exercise constitutes a measurement argument, where a conceptual definition is said to be measurable by a certain instrument. Consequently, the mapping exercise links an indicator from a framework with a construct, which is measured in a certain way, within a study. Thus, three elements are in place: the indicator’s conceptual definition, the identified measure from a study, and the target construct.
In these guidelines, we take as an example the socio-emotional dimension of the SDG 4.7.4 gender equality indicator, operationalized with the measure of “students' attitudes toward gender rights” from ICCS 2016 (Sandoval-Hernández & Carrasco, 2020). This operationalization implies that SDG 4.7.5 of gender equality can be assessed with a measure of gender equality endorsement. In particular, the measure of “students' attitudes toward gender rights” includes items that refer to gender equality endorsement (Miranda & Castillo, 2018), but also some items that resemble hostile sexism (Napier, Thorisdottir, & Jost, 2010). “Men and women should have equal opportunities to take part in government” is an example of an item from the first type, while “women should stay out of politics” is an item example of the second type. Taken together, the collective response to the instrument “students' attitudes toward gender rights”, can be used to assess the SDG 4.7.5 gender equality indicator.
The model parameters and other information necessary to produce all the other scores necessary to measure SDG 4.7.4 and 4.7.5 using data collected ad hoc for this measurement strategy are included in Appendix II.
Table 11. Elements of a mapping exercise for SDG Indicator 4.7.4 on gender equality Target 4.7.4 component Conceptual definition Construct Instrument
Gender Equality General concept definition: To have a sense of belonging to a common humanity, sharing values and responsibilities, empathy, solidarity and respect for differences and diversity.
Component concept definition: To endorse and support equal rights among men and women.
Endorsement of Gender equality
Students' attitudes toward gender rights

70
From responses to scores
Once the data collection phase of the assessment is completed, a scoring process can be undertaken. The elements required to implement a scoring process are the cleaned data, the codebooks, and the parameters of the measurement model. In the following section, we describe each of these elements and review an example of how to implement this process.
The cleaned data refers to a data table that has a collection of responses. This data table contains only the participants that conform to the study design, that is the list of valid cases that represent the target population. Likewise, for the scoring process, only the valid responses to the instruments are required. Therefore, process event coded responses are all removed or separated (e.g., omitted, non-valid responses). This allows fitting the measurement model onto the collected responses to generate the scores.
Codebooks are technical documentation that acts as a counterpart of a mapping exercise. In the present guidelines, we described different types. For this step is important to have available the data file embedded codebook for quick consultation, and the instrument embedded codebook. This latter codebook aids the scoring process to clearly identify items expected responses, and the target construct. In codebooks, we store the specific variables used to generate a score that represents a construct. In the present framework, constructs are theory dependent entities, that refer to a dimension of empirical variation within a defined population (Cronbach & Meehl, 1955). This definition encompasses low inference constructs such as participants age and sex, and high inference constructs such as “students’ enjoyment of science learning experience” or “students’ support for equal rights among men and women”. SDG indicators are closer to this latter category of constructs. Codebooks guide secondary users regarding what variables they would need to retrieve out of a release data file, to represent a construct, to represent an SDG indicator.
The parameters of a measurement model refer to the expected location of an item within the distribution of responses to an instrument. These parameters are used to represent the expected proportion of response to a category, over a multi-item instrument. With these parameters and a measurement model, a pattern of response from a participant can receive a score. These scores are then used to distinguish between participants who are above or below a standard.
In the following sections we develop an example for SDG 4.7.4, in particular to its component of gender equality.
Cleaning the data
The following table depicts a cleaned data example. This is a minimal example, where only the response variables to the instrument of interest are retrieved, including the study design sampling variables. The first variable is “COUNTRY”. This variable uses the Alpha 312 code to distinguish between countries. For example, in this nomenclature, Canada is “CAN”, Italy is “ITA” and Mexico is “MEX”. This conforms to a standard way to code country names. Then, ‘id_k’, ‘id_j’, and ‘id_i’ are unique numeric codes for country, schools and participants. These variables help to identify cases and join the present records with other data sources. `strata`, `cluster` and `wt` are sampling design variables necessary to implement variance correction methods such as Jackknife, Balance Replicated or Taylor Series Linearization (Heeringa, West, & Berglund, 2009). `ws` is re-scaled
12 A full list of this nomenclature can be found in ISO 3166-1 alpha-3 Wikipedia entry: https://en.wikipedia.org/wiki/ISO_3166-1_alpha-3

71
survey weight, scaled so the sum of the survey weights sums to 1000 at the population level (E. J. Gonzalez, 2012).
Table 12. Minimal example of the contents of a cleaned data set for gender equality Variable Labels
COUNTRY country in alpha 3 code
id_k unique country id
id_j unique school id
id_i unique student id
strata unique strata id
cluster primary sampling unit for variance estimation
wt weight, total weight for students
ws weight, senate weight up to 1000 cases
IS3G24A Rights and Responsibilities/Roles women and men/Men and women should have equal opportunities to take part in government
IS3G24B Rights and Responsibilities/Roles women and men/Men and women should have the same rights in every way
IS3G24C Rights and Responsibilities/Roles women and men/Women should stay out of politics
IS3G24D Rights and Responsibilities/Roles women and men/Not many jobs available, men should have more right to a job than women
IS3G24E Rights and Responsibilities/Roles women and men/Men and women should get equal pay when they are doing the same jobs
IS3G24F Rights and Responsibilities/Roles women and men/Men are better qualified to be political leaders than women
Measurement model
The measurement model fitted to generate scores for the gender equality indicator is the partial credit model (Masters, 2016). Its application to assess the SDG 4.7.4 and SDG 4.7.5 indicators is described in Sandoval-Hernández & Carrasco (Sandoval-Hernández & Carrasco, 2020), and here we reproduce its main contents. The partial credit model allows us to generate item and person parameter for items with two or more categories. Formally, this model can be described as follows (Wu, Tam, & Jen, 2016b):
𝑈𝑈𝑃𝑃(𝑌𝑌𝑖𝑖𝑝𝑝 = 𝑗𝑗|𝜃𝜃𝑝𝑝) = exp∑ (𝜃𝜃𝑝𝑝 − 𝛿𝛿𝑖𝑖𝑖𝑖)𝑖𝑖
𝑖𝑖=0
∑ 𝑒𝑒𝑒𝑒𝑜𝑜∑ (𝜃𝜃𝑝𝑝 − 𝛿𝛿𝑖𝑖𝑖𝑖)ℎ𝑖𝑖=0
𝑚𝑚𝑖𝑖ℎ=0
In this model, the probability of answering an item (𝑌𝑌𝑖𝑖𝑝𝑝), with a category of response 0, 1, 2, …, 𝑚𝑚𝑖𝑖 by a person p, depends on the propensity of the response of the person p (𝜃𝜃𝑝𝑝). For the first category of response, there is a constraint: ∑ �𝜃𝜃𝑝𝑝 − 𝛿𝛿𝑖𝑖𝑖𝑖� = 1.0
𝑖𝑖=0 Thus, for the first category of response, the numerator in equation 1 is 1. The item parameters 𝛿𝛿𝑖𝑖𝑖𝑖 needed are one less the number of response categories for each item. Therefore, if all items are dichotomous a single 𝛿𝛿 parameter is
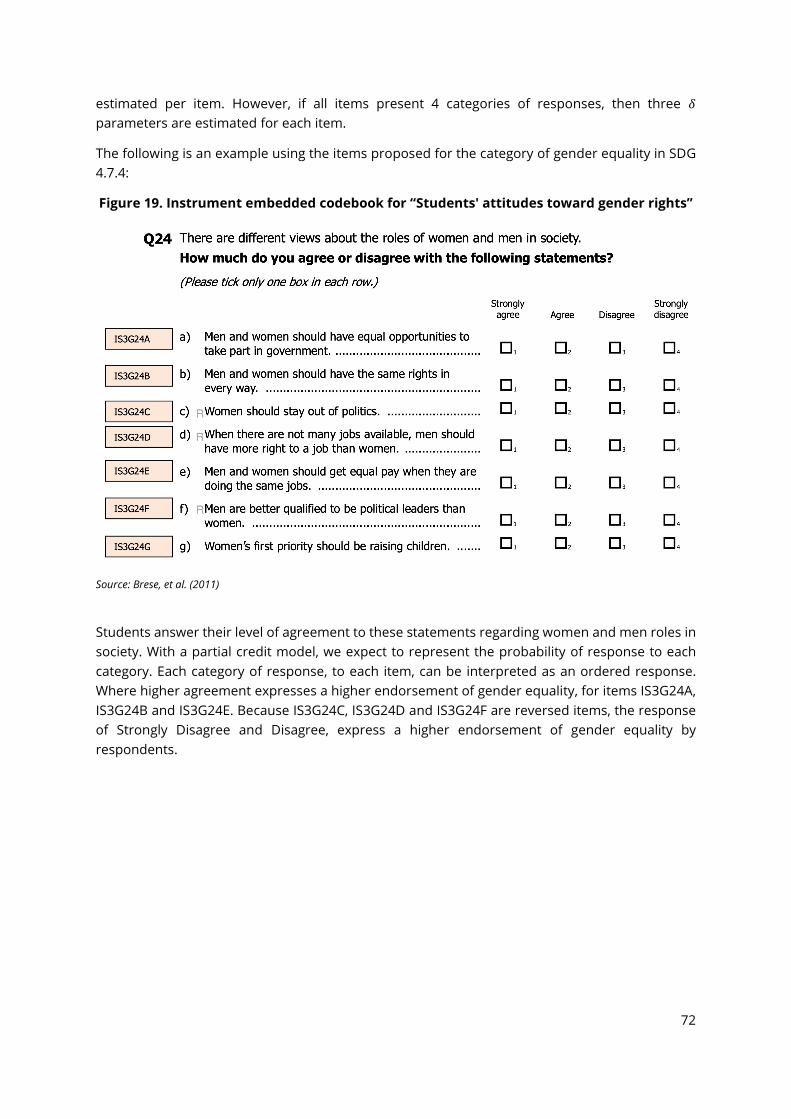
72
estimated per item. However, if all items present 4 categories of responses, then three 𝛿𝛿 parameters are estimated for each item.
The following is an example using the items proposed for the category of gender equality in SDG 4.7.4:
Figure 19. Instrument embedded codebook for “Students' attitudes toward gender rights”
Source: Brese, et al. (2011)
Students answer their level of agreement to these statements regarding women and men roles in society. With a partial credit model, we expect to represent the probability of response to each category. Each category of response, to each item, can be interpreted as an ordered response. Where higher agreement expresses a higher endorsement of gender equality, for items IS3G24A, IS3G24B and IS3G24E. Because IS3G24C, IS3G24D and IS3G24F are reversed items, the response of Strongly Disagree and Disagree, express a higher endorsement of gender equality by respondents.

73
Using these items, we can represent the partial credit model as a latent variable model, with the following diagram:
Figure 20. Latent variable model for gender equality items
Source: Sandoval-Hernandez & Carrasco (2020)
In this diagram (see Figure 20), the term 𝜃𝜃𝑝𝑝 represents the propensity of participants providing a category of response of a higher value. To ensure this interpretation, all responses are recoded from 0 to 3, where higher values imply higher endorsement of gender equality to each item. The terms 𝛿𝛿1𝑖𝑖−𝛿𝛿6𝑖𝑖, represent the step parameters in the partial credit model (Wu et al., 2016b). These parameters represent where the two item characteristic curves intersect (Masters, 2016). That is, if we create a plot, where the probability of response is in the y-axis, and the logit parameters are positioned in the x-axis, then the probability function of an item response is depicted as a curve. These curves would cross to the next category of response, and the 𝛿𝛿1𝑖𝑖−𝛿𝛿6𝑖𝑖 demarks these points in the logit scale. Using numerical methods, these parameters can be converted into cumulative probabilities, 𝛾𝛾1𝑖𝑖−𝛾𝛾6𝑖𝑖, , also called Thurstonian thresholds, to build item-person maps (Wu et al., 2016b). We use the term 𝜁𝜁𝑝𝑝 to represents the variance of 𝜃𝜃𝑝𝑝, which is freely estimated in this model specification, and we leave 𝜃𝜃𝑝𝑝, with a latent mean of zero. Parameters 𝜆𝜆1−𝜆𝜆6 are constrained to 1, to conform to a partial credit. In the following section we fit the partial credit onto a set of responses to illustrate how to generate the scores.
Generating scores
Two elements are required to generate scores: cleaned data and model parameters. For illustration purposes, in the present example we will generate the item response theory scores over the responses from students from Colombia. In particular, we will use the cleaned data from

74
ICCS 2009 (Wolfram Schulz et al., 2011) and ICCS 2016 (W. Schulz et al., 2018), thus generating scores for two different periods on the same scale. The procedures are illustrated using R (R Development Core Team, 2011) and Mplus (Muthén & Muthén, 2017).
First, the cleaned data set is prepared for analysis. This entails importing the data and recoding the item responses so higher values express a higher level of the attribute being measured. In this case, we need to be sure a higher agreement is coded with higher values for items expressing higher support for gender equality. And conversely, reverse items should be coded in such a way that higher agreement received lower values. We show the expected recoding scheme in Table 13.
Table 13. Variable recoding for gender equality items Reverse Original
variable Coded values Recoded
variable Recoded values
IS3G24A Strongly agree 0 1 2 3 Strongly disagree ge01 Strongly disagree 0 1 2 3 Strongly agree
IS3G24B Strongly agree 0 1 2 3 Strongly disagree ge02 Strongly disagree 0 1 2 3 Strongly agree
R IS3G24C Strongly agree 0 1 2 3 Strongly disagree ge04 Strongly disagree 0 1 2 3 Strongly agree
IS3G24D Strongly agree 0 1 2 3 Strongly disagree ge03 Strongly agree 0 1 2 3 Strongly disagree
R IS3G24E Strongly agree 0 1 2 3 Strongly disagree ge05 Strongly agree 0 1 2 3 Strongly disagree
R IS3G24F Strongly agree 0 1 2 3 Strongly disagree ge06 Strongly agree 0 1 2 3 Strongly disagree
In the following code shown in Table 14, we first import the cleaned data of ‘gender equality’ from Colombia. The files 'data_gen_16_col.sav' and 'data_gen_09_col.sav', contains the students’ responses from ICCS 2016 and ICCS 2009 respectively, from Colombia13. Because this is a minimal example, the content of these files is only the sample design variables and the responses to the ‘students' attitudes toward gender rights’ instrument.
Table 14. R code to import cleaned data and recode the original responses of gender equality items
R code Description
# ----------------------------------------------------------
# prepare data for mplus
# ----------------------------------------------------------
#------------------------------------------------
# import data
#------------------------------------------------
data_gen_16_col <- haven::read_sav('data_gen_16_col.sav')
data_gen_09_col <- haven::read_sav('data_gen_09_col.sav')
We first import the cleaned data, stored as SPSS files.
13 See the information to obtain the data and code to reproduce this example at the end of this chapter.

75
#------------------------------------------------
# recoding functions
#------------------------------------------------
# higher category of response, more agreement
rec_1 <- function(x){
dplyr::case_when(
x == 4 ~ 0, # Strongly Disagree
x == 3 ~ 1, # Disagree
x == 2 ~ 2, # Agree
x == 1 ~ 3, # Strongly Agree
TRUE ~ as.numeric(x))
}
# reverse items, higher response category more attribute
rec_2 <- function(x){
dplyr::case_when(
x == 4 ~ 3, # Strongly Disagree
x == 3 ~ 2, # Disagree
x == 2 ~ 1, # Agree
x == 1 ~ 0, # Strongly Agree
TRUE ~ as.numeric(x))
}
#------------------------------------------------
# recode original variables
#------------------------------------------------
items_16_col <- data_gen_16_col %>%
mutate(ge01 = rec_1(IS3G24A)) %>%
mutate(ge02 = rec_1(IS3G24B)) %>%
mutate(ge03 = rec_1(IS3G24E)) %>%
mutate(ge04 = rec_2(IS3G24C)) %>%
mutate(ge05 = rec_2(IS3G24D)) %>%
mutate(ge06 = rec_2(IS3G24F)) %>%
dplyr::select(id_i,
ge01, ge02, ge03, ge04, ge05, ge06
)
We create a couple of functions to recode the original responses, so a higher agreement is coded with higher values. Complementary, reverse items that are coded with a scheme where higher value express less agreement.
There are several ways to recode variables. The presented form is just one, among many other ways to recode variables within a statistical software.
We recode each original response. We first recode all the items where a high agreement receives a higher value. And then, we recode the reverse items.

76
items_09_col <- data_gen_09_col %>%
mutate(ge01 = rec_1(IS2P24A)) %>%
mutate(ge02 = rec_1(IS2P24B)) %>%
mutate(ge03 = rec_1(IS2P24E)) %>%
mutate(ge04 = rec_2(IS2P24C)) %>%
mutate(ge05 = rec_2(IS2P24D)) %>%
mutate(ge06 = rec_2(IS2P24F)) %>%
dplyr::select(id_i,
ge01, ge02, ge03, ge04, ge05, ge06
)
Now, we have a data table with the recoded responses, and with a unique case identifier ‘id_i’. With this simplified table we can generate realizations of 𝜃𝜃𝑝𝑝. The following code uses the library MplusAutomation (Hallquist & Wiley, 2018), so with a few steps, we can fit the partial credit model and produce IRT scores (see Table 15).
Table 15. R code to fit a partial credit model with fixed parameters over gender equality responses
R code Description
#------------------------------------------------
# fit PCM model on Colombia ICCS 2016
#------------------------------------------------
library(MplusAutomation)
pcm_16_col <- mplusObject(
MODEL = '
!lambda
eta by ge01@1;
eta by ge02@1;
eta by ge03@1;
eta by ge04@1;
eta by ge05@1;
eta by ge06@1;
!delta
In this model specification, the lambda parameters are fixed to one.
These are the delta parameters. These are retrieved from Sandoval-Hernández & Carrasco (2020). The delta parameters for all other scales included in this measurement strategy are in Appendix II.

77
!latent mean
[eta@0];
!variance
',
ANALYSIS = '
TYPE = GENERAL;
ESTIMATOR = MLR;
',
VARIABLE = '
IDVARIABLE = id_i;
CATEGORICAL =
ge01 (gpcm)
ge02 (gpcm)
ge03 (gpcm)
ge04 (gpcm)
ge05 (gpcm)
ge06 (gpcm)
',
OUTPUT ='
This line of code fixes the latent mean of the model.
The present line fixes the variance of the term 𝜃𝜃𝑝𝑝. It expresses the term 𝜁𝜁𝑝𝑝 from the latent variable model of the partial credit model.
This line is necessary so Mplus save the realizations of 𝜃𝜃𝑝𝑝 associated with a unique case identifier. We will use this variable to later add sampling variables.
These lines are necessary so Mplus fits a partial credit model. The term `gpcm` specifies that we will be using adjacent category logits to model the observed responses.
This is the name of the file, ` gen_16_col_eap.dat` that stores the IRT scores, alongside the unique identifier `id_i`, and the item responses. Here we include the name of the object that contains the prepared data table with the recoded responses, with the argument ` rdata = items_16_col `. Additionally, the

78
STAND
CINTERVAL
RESIDUAL
;
',
SAVEDATA ='
FILE = gen_16_col_eap.dat;
SAVE = FSCORES;
',
rdata = items_16_col) %>%
mplusModeler(.,
modelout = 'gen_16_col.inp',
run = 1L,
writeData = 'always',
hashfilename = FALSE)
argument `modelout = 'gen_16_col.inp' `specifies the name of the Mplus file generated to fit the present model.
Once the previous code is run and finished, the results of the fitted model will be stored in the object ` pcm_16_col`. We proceed similarly, using de data from Colombia 2009, and generate also the object ` pcm_09_col`. With the previous R code two Mplus files will be generated, one for the data from 2016 and one for the data from 2009, respectively. Each of these files can be re-run using Mplus and reproduce the results. However, this is redundant for the current example, because the objects ` pcm_16_col`. And ` pcm_09_col` contains all the information we need to estimate (see Table 16).
Table 16. Mplus code to generate IRT score for Colombia ICCS data years 2009 and 2016
Code for 2009 data Code for 2016 data
DATA:
FILE = "gen_09_col.dat";
VARIABLE:
NAMES = id_i ge01 ge02 ge03 ge04 ge05 ge06;
MISSING=.;
IDVARIABLE = id_i;
CATEGORICAL =
ge01 (gpcm)
ge02 (gpcm)
ge03 (gpcm)
ge04 (gpcm)
ge05 (gpcm)
DATA:
FILE = "gen_16_col.dat";
VARIABLE:
NAMES = id_i ge01 ge02 ge03 ge04 ge05 ge06;
MISSING=.;
IDVARIABLE = id_i;
CATEGORICAL =
ge01 (gpcm)
ge02 (gpcm)
ge03 (gpcm)
ge04 (gpcm)
ge05 (gpcm)

79
ge06 (gpcm)
ANALYSIS:
TYPE = GENERAL;
ESTIMATOR = MLR;
MODEL:
!lambda
eta by ge01@1;
eta by ge02@1;
eta by ge03@1;
eta by ge04@1;
eta by ge05@1;
eta by ge06@1;
!delta
!latent mean
[eta@0];
!variance
ge06 (gpcm)
ANALYSIS:
TYPE = GENERAL;
ESTIMATOR = MLR;
MODEL:
!lambda
eta by ge01@1;
eta by ge02@1;
eta by ge03@1;
eta by ge04@1;
eta by ge05@1;
eta by ge06@1;
!delta
!latent mean
[eta@0];
!variance
OUTPUT:

80
OUTPUT:
STAND
CINTERVAL
RESIDUAL
;
SAVEDATA:
FILE = gen_09_col_eap.dat;
SAVE = FSCORES;
STAND
CINTERVAL
RESIDUAL
;
SAVEDATA:
FILE = gen_16_col_eap.dat;
SAVE = FSCORES;
The code presented in this section does not produce estimates. All model estimates are fixed with the model parameters obtained by fitting the response model over the pooled sample of countries participating in ICCS 2016 (Sandoval-Hernández & Carrasco, 2020). In essence, the previous code is only producing 𝜃𝜃𝑝𝑝 realizations.
From scores to classifications
To classify participants by those reaching the expected standard we use item-person maps (Desjardings & Bulut, 2018; Wilson & Draney, 2002), and choose a particular cut score. The proposed cut score for reaching the standard of gender equality is located at the highest category of response, after item ge06. In numeric terms, this threshold is close to zero (threshold = 0.082). We depict this cut score location using the following item-person map (Sandoval-Hernández & Carrasco, 2020).

81
Figure 21. Item-person map for gender equality
Source: Sandoval-Hernandez & Carrasco (2020)
The following lines of code retrieve the IRT generated scores produced in the previous step and classify all from those above and below the chosen cut score.
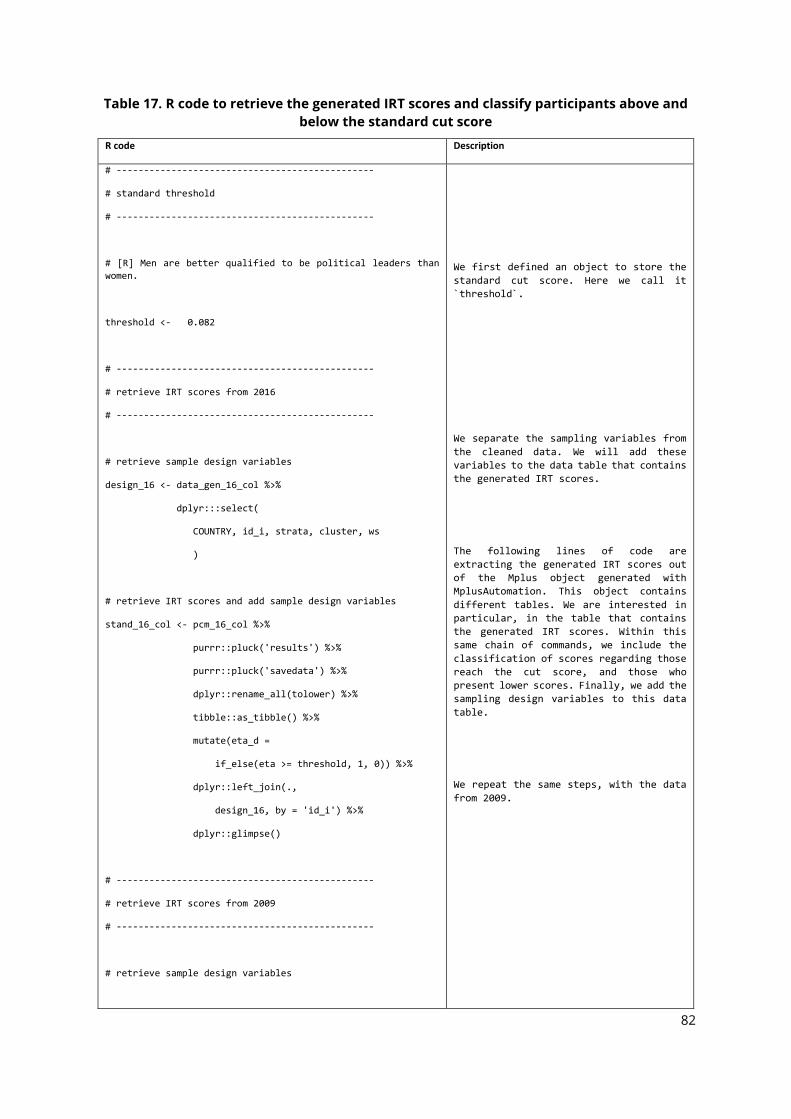
82
Table 17. R code to retrieve the generated IRT scores and classify participants above and below the standard cut score
R code Description
# -----------------------------------------------
# standard threshold
# -----------------------------------------------
# [R] Men are better qualified to be political leaders than women.
threshold <- 0.082
# -----------------------------------------------
# retrieve IRT scores from 2016
# -----------------------------------------------
# retrieve sample design variables
design_16 <- data_gen_16_col %>%
dplyr:::select(
COUNTRY, id_i, strata, cluster, ws
)
# retrieve IRT scores and add sample design variables
stand_16_col <- pcm_16_col %>%
purrr::pluck('results') %>%
purrr::pluck('savedata') %>%
dplyr::rename_all(tolower) %>%
tibble::as_tibble() %>%
mutate(eta_d =
if_else(eta >= threshold, 1, 0)) %>%
dplyr::left_join(.,
design_16, by = 'id_i') %>%
dplyr::glimpse()
# -----------------------------------------------
# retrieve IRT scores from 2009
# -----------------------------------------------
# retrieve sample design variables
We first defined an object to store the standard cut score. Here we call it `threshold`.
We separate the sampling variables from the cleaned data. We will add these variables to the data table that contains the generated IRT scores.
The following lines of code are extracting the generated IRT scores out of the Mplus object generated with MplusAutomation. This object contains different tables. We are interested in particular, in the table that contains the generated IRT scores. Within this same chain of commands, we include the classification of scores regarding those reach the cut score, and those who present lower scores. Finally, we add the sampling design variables to this data table.
We repeat the same steps, with the data from 2009.

83
design_09 <- data_gen_09_col %>%
dplyr:::select(
COUNTRY, id_i, strata, cluster, ws
)
# retrieve IRT scores and add sample design variables
stand_09_col <- pcm_09_col %>%
purrr::pluck('results') %>%
purrr::pluck('savedata') %>%
dplyr::rename_all(tolower) %>%
tibble::as_tibble() %>%
mutate(eta_d =
if_else(eta >= threshold, 1, 0)) %>%
dplyr::left_join(.,
design_09, by = 'id_i') %>%
dplyr::glimpse()
Once we have retrieved the IRT score from each participant and classify each between those who reach the cut score and those who do not, we can estimate the percentage of students reaching the standard. For this purpose, we make use of the sampling design variables and use Taylor Series Linearization to estimate the variance of the parameters. We use the stratum, and primary sampling units’ indicators (‘strata’, and ‘cluster’).
Table 18. R code to estimate the percentage of students meeting the SDG 4.7.4 gender equality (socio-emotional) indicator
R code Description
# -----------------------------------------------------------
# population estimates
# -----------------------------------------------------------
#------------------------------------------------
# options for lonely psu
#------------------------------------------------
library(survey)
options(survey.lonely.psu = "certainty")
#------------------------------------------------
# create survey object
The following lines of code are used to estimate the percentage of students reaching the SDG 4.7.4 Gender Equality standard.
We first specify that for cases in which there is a single school within a stratum, this should be treated with certainty. In this way, strata with a lonely primary sampling unit do not contribute to variance estimation.
In the next section, we are creating the survey objects. We specify what is the
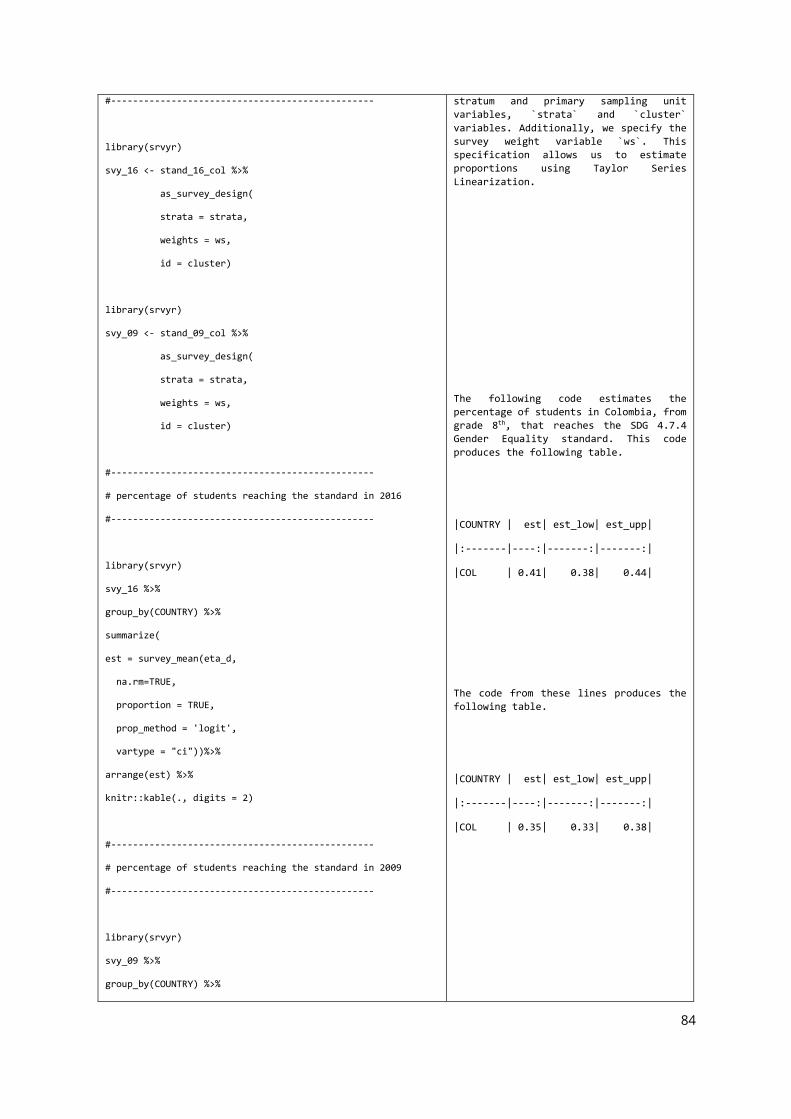
84
#------------------------------------------------
library(srvyr)
svy_16 <- stand_16_col %>%
as_survey_design(
strata = strata,
weights = ws,
id = cluster)
library(srvyr)
svy_09 <- stand_09_col %>%
as_survey_design(
strata = strata,
weights = ws,
id = cluster)
#------------------------------------------------
# percentage of students reaching the standard in 2016
#------------------------------------------------
library(srvyr)
svy_16 %>%
group_by(COUNTRY) %>%
summarize(
est = survey_mean(eta_d,
na.rm=TRUE,
proportion = TRUE,
prop_method = 'logit',
vartype = "ci"))%>%
arrange(est) %>%
knitr::kable(., digits = 2)
#------------------------------------------------
# percentage of students reaching the standard in 2009
#------------------------------------------------
library(srvyr)
svy_09 %>%
group_by(COUNTRY) %>%
stratum and primary sampling unit variables, `strata` and `cluster` variables. Additionally, we specify the survey weight variable `ws`. This specification allows us to estimate proportions using Taylor Series Linearization.
The following code estimates the percentage of students in Colombia, from grade 8th, that reaches the SDG 4.7.4 Gender Equality standard. This code produces the following table.
|COUNTRY | est| est_low| est_upp|
|:-------|----:|-------:|-------:|
|COL | 0.41| 0.38| 0.44|
The code from these lines produces the following table.
|COUNTRY | est| est_low| est_upp|
|:-------|----:|-------:|-------:|
|COL | 0.35| 0.33| 0.38|

85
summarize(
est = survey_mean(eta_d,
na.rm=TRUE,
proportion = TRUE,
prop_method = 'logit',
vartype = "ci"))%>%
arrange(est) %>%
knitr::kable(., digits = 2)
In the present example, we reproduce the results reported for Colombia in Sandoval-Hernández & Carrasco (Sandoval-Hernández & Carrasco, 2020). Using data from ICCS 2016, we observed that 41% (CI95[38%, 44%]) of students in Colombia reach the SDG 4.7.4 gender equality (socio-emotional) standard. Applying the same procedures, we observed that 35% (CI95[33%, 48%]) of students reach the expected standard in ICCS 2009. Thus, we observed there is an increase between 2009 to 2016 in the percentage of students reaching the standard of interest14.
All the materials (i.e., datasets and R code) needed to reproduce this example can be downloaded here: https://www.dropbox.com/sh/g6f06f67hepnod0/AAANcd184MYgh8Bc6gZ7BR5Xa?dl=0.
The text version of the R and MPlus annotated code can be found in Appendix III.
14 The present comparison is possible, because the IRT scores generated for ICCS 2016 and ICCS 2009 data are on the same scale, using the same mode parameters. Nevertheless, it should be noted this comparison is assuming there is longitudinal invariance for the present measures. This latter assumption that can be assess, yet is out of the scope of the present guidelines.

86
8. Using the results of the national assessment
We have compiled in this document a set of guidelines for countries to implement a national assessment that allows them to produce information for measuring and monitoring SDG 4.7.4 and 4.7.5. This includes all the major phases that national and international assessments incorporate, such as deciding who will carry out the assessment, the objectives of the assessment, the definition of the population to be assessed, the development of the assessment framework, logistic considerations for the data collection (e.g., development of manuals), sampling, weighting and variance estimation procedures, data preparation and management (e.g., scoring) and reporting the results of the assessment.
We have also provided detailed instructions on how to conduct all these phases of the assessment and have provided examples and exercises to facilitate the tasks for implementation agencies. We have focused on state-of-the-art procedures that need to be followed in order to ensure that the data produced by the assessment exercise are of high quality and address the concerns of policymakers, decision-makers, and other potential users of the information.
These Guidelines are intended primarily for the teams within the designated implementation agencies who are responsible for conducting a national assessment exercise.
As readers make their way through these Guidelines, it will become evident that the successful implementation of a national assessment exercise is a complex task that requires considerable knowledge, skill, and resources. A good quality implementation of these Guidelines will increase the confidence of policymakers and other stakeholders in the validity of the information produced. It also can increase the likelihood that the results of the national assessment will be used to develop education plans and programmes.

87
References ACER. (2018). Replicates. Melbourne: ACER.
Anderson, P., & Morgan, G. (2008a). Developing Tests and Questionnaires for a National Assessment of Educational Achievement. Washington, D.C.: World Bank.
Anderson, P., & Morgan, G. (2008b). The test administrator. In P. Anderson & G. Morgan (Eds.), Developing Tests and Questionnaires for a National Assessment of Educational Achievement. Washington, D.C.: World Bank.
Baumer, B., Cetinkaya-Rundel, M., Bray, A., Loi, L., & Horton, N. J. (2014). R Markdown: Integrating A Reproducible Analysis Tool into Introductory Statistics. Technology Innovations in Statistics Education, 8(1), 20.
Brese, F., Jung, M., Mirazchiyski, P., Schulz, W., & Zuehlke, O. (2011). ICCS 2009 User Guide for the International Database. Amsterdam, the Netherlands: International Association for the Evaluation of Educational Achievement (IEA).
Brese, Falk, & Cockle, M. (2017). Data Management Procedures. In P. Lietz, J. C. Cresswell, K. F. Rust, & R. J. Adams (Eds.), Implementation of Large-Scale Education Assessments (pp. 253–275). Chichester, UK: John Wiley & Sons, Ltd. https://doi.org/10.1002/9781118762462.ch10
Brick, M. J., Morganstein, D., & Valliant, R. (2000). WesVar. Rockville, MD: Westat. Retrieved from https://www.westat.com/capability/information-technology/wesvar
Caro, D., & Biecek, P. (2017). intsvy: An R package for analyzing international large-scale assessment data. Journal of Statistical Software, 81(7), 1–44. Retrieved from https://www.jstatsoft.org/article/view/v081i07/v81i07.pdf
Cronbach, L. J., & Meehl, P. E. (1955). Construct validity in psychological tests. Psychological Bulletin, 52(4), 281–302. https://doi.org/10.1037/h0040957
Desjardings, C. D., & Bulut, O. (2018). Handbook of Educational Measurement and Psychometrics Using R. Boca Raton, FL: CRC Press, Taylor & Francis Group.
Dumais, J., & Gough, H. (2012a). Computing estimates and their sampling errors from complex samples. In V. Greaney & T. Kellaghan (Eds.), Implementing a National Assessment of Educational Achievement. Washington, D.C.: World Bank.
Dumais, J., & Gough, H. (2012b). School sampling methodology. In V. Greaney & T. Kellaghan (Eds.), Implementing a National Assessment of Educational Achievement. Chichester, UK: World Bank.
Dumais, J., & Gough, H. (2012c). Weighting, Estimation, and Sampling Error. In V. Greaney & T. Kellaghan (Eds.), Implementing a National Assessment of Educational Achievement2. Washington, D.C.: World Bank.
Foy, P., Arora, A., & Stanco, G. M. (2013). TIMSS 2011 User Guide for the International Database. Amsterdam: International Association for the Evaluation of Educational Achievement.
Gebhardt, E., & Berezner, A. (2017). Database Production for Large-Scale Educational Assessments. In P. Lietz, J. C. Cresswell, K. F. Rust, & R. J. Adams (Eds.), Implementation of Large-Scale Education Assessments (pp. 411–423). Chichester, UK: John Wiley & Sons, Ltd. https://doi.org/10.1002/9781118762462.ch16
Gonzalez, E., & Foy, P. (2000). Estimation of sampling variance. In M. O. Martin, K. D. Gregory, & S. E. Semler (Eds.), TIMSS 1999: Technical report. Chestnut Hill, MA: Boston College.
Gonzalez, E. J. (2012). Rescaling sampling weights and selecting mini-samples from large-scale assessment databases. IERI Monograph Series Issues and Methodologies in Large-Scale Assessments, 5, 115–134.
Greaney, V., & Kellaghan, T. (2008). Assessing National Achievement Levels in Education. Washington, D.C.: World Bank. Retrieved from https://openknowledge.worldbank.org/handle/10986/6904

88
Greaney, V., & Kellaghan, T. (2012). Implementing a National Assessment of Educational Achievement. Washington, D.C.: World Bank. https://doi.org/10.1596/978-0-8213-8589-0
Hallquist, M. N., & Wiley, J. F. (2018). MplusAutomation: An R Package for Facilitating Large-Scale Latent Variable Analyses in Mplus. Structural Equation Modeling: A Multidisciplinary Journal, 25(4), 621–638. https://doi.org/10.1080/10705511.2017.1402334
Heeringa, S. G., West, B., & Berglund, P. A. (2009). Applied Survey Data Analysis. Boca Raton, London, New York: Taylor & Francis Group.
Hoskins, B. (2016). Towards the development of an international module for assessing learning in Global Citizenship Education (GCE) and Education for Sustainable Development (ESD): A critical review of current measurement strategies. Background paper prepared for the 2016 Gl. Paris. Retrieved from https://www.gcedclearinghouse.org/sites/default/files/resources/245620e.pdf
Howie, S., & Acana, S. (2012). Preparation for adminsitration in schools. In V. Greaney & T. Kelly (Eds.), Implementing a National Assessment of Educational Achievement. Washington, D.C.: World Bank.
IBE. (2016). Global Monitoring of Target 4.7: Themes in National Curriculum Frameworks. Background paper prepared for the 2016 Global Education Monitoring Report. Paris. Retrieved from https://www.oneplanetnetwork.org/sites/default/files/491245629eng.pdf
IBM. (2015). IBM SPSS statistics for windows. Armonk: IBM Corp.
IEA. (2017). IEA Studies in Ten Steps. Germany: Youtube. Retrieved from https://www.youtube.com/watch?v=bTAr5HX3W-Q
IEA. (2019). Help Manual for the IEA IDB Analyzer (Version 4.0). Hamburg, Germany.
Kellaghan, T., & Greaney, V. (2001). Using Assessment to Improve the Quality of Education. Paris: International Institute for Educational Planning.
Kellaghan, T., & Greaney, V. (2004). Assessing Student Learning in Africa. Washington, D.C.: World Bank.
Kellaghan, T., Greaney, V., & Murray, T. S. (2009). Using the Results of a National Assessment of Educational Achievement. Washington, D.C.: World Bank.
Köhler, H., Weber, S., Brese, F., Schulz, W., & Carstens, R. (2018). ICCS 2016 User Guide for the International Database. (H. Köhler, S. Weber, F. Brese, W. Schulz, & R. Carstens, Eds.). Amsterdam, The Netherlands: International Association for the Evaluation of Educational Achievement (IEA).
Lietz, P., Cresswell, J., Rust, K., & Adams, R. (2017). Implementation of large-scale education assessments. Chichester, UK: Wiley.
Lohr, S. (2010). Sampling: Design and Analysis (2nd ed.). Pacific Grove, CA: Duxbury Press.
Martin, M. O., Rust, K. F., & Adams, R. (1999). Technical standards for IEA studies. Amsterdam: International Association for the Evaluation of Educational Achievement (IEA).
Martin, M. O., von Davier, M., & Mullis, I. V. S. (2020). Methods and Procedures: TIMSS 2019 Technical Report. Amsterdam: TIMSS & PIRLS International Study Center and International Association for the Evaluation of Educational Achievement (IEA).
Masters, G. N. (2016). Partial Credit Model. In W. J. van der Linden (Ed.), Handbook of Item Response Theory. Volume One. Models (pp. 109–126). Boca Raton, FL, US: CRC Press.
Miranda, D., & Castillo, J. C. (2018). Measurement Model and Invariance Testing of Scales Measuring Egalitarian Values in ICCS 2009. In A. Sandoval-Hernández, M. M. Isac, & D. Miranda (Eds.) (Vol. 4, pp. 19–31). Cham: Springer International Publishing. https://doi.org/10.1007/978-3-319-78692-6_3
Mirazchiyski, P. (2021). R Analyzer for Large-Scale Assessments (RALSA). Ljubljana: INERI.
Muthén, L. K., & Muthén, B. O. (2017). Mplus User’s Guide. Los Angeles, CA: Muthén & Muthén.
89
Napier, J. L., Thorisdottir, H., & Jost, J. T. (2010). The joy of sexism? A multinational investigation of hostile and benevolent justifications for gender inequality and their relations to subjective well-being. Sex Roles, 62(7–8), 405–419. https://doi.org/10.1007/s11199-009-9712-7
OECD. (2021). PISA 2018 Technical Report. Paris: OECD Publishing. Retrieved from https://www.oecd.org/pisa/data/pisa2018technicalreport/
Provasnik, S. (2021). Process data, the new frontier for assessment development: rich new soil or a quixotic quest? Large-Scale Assessments in Education, 9(1), 1–17. https://doi.org/10.1186/s40536-020-00092-z
R Development Core Team. (2011). R: A language and environment for statistical computing. Vienna, Austria: R Foundation for Statistical Computing.
Rocher, T., & Hastedt, D. (2020). International large-scale assessments in education: a brief guide. IEA Compass: Briefs in Education, (10). Retrieved from https://www.iea.nl/sites/default/files/2020-09/2020.09.01_ISLAs in education-a brief guide Compass 10.pdf
Rust, K. F. (2014). Sampling, Weighting, and Variance Estimation in International Large-Scale Assessments. In L. Rutkowski, M. von Davier, & D. Rutkowski (Eds.), Handbook of International Large-Scale Assessment Background.Technical Issues, and Methods of Data Analysis. Boca Raton, London, New York: CRC Press.
Rust, K. F., Krawchuk, S., & Monseur, C. (2017). Sample Design, Weighting, and Calculation of Sampling Variance. In P. Lietz, J. Cresswell, K. Rust, & R. Adams (Eds.), Implementation of Large-Scale Education Assessments. Chichester, UK: Wiley.
Rutkowski, L., von Davier, M., & Rutkowski, D. (2014). Handbook of International Large-Scale Assessment. Boca Raton: CRC Press.
Sandoval-Hernández, A., & Carrasco, D. (2020). A Measurement Strategy for SDG Thematic Indicators 4.7.4 and 4.7.5 Using International Large Scale Assessments in Education. Montreal: UNESCO Institute for statistics. Retrieved from http://tcg.uis.unesco.org/wp-content/uploads/sites/4/2020/06/Measurement-Strategy-for-474-and-475-using-ILSA_20200625.pdf
Sandoval-Hernández, A., Isac, M. M., & Miranda, D. (2019). Proposal of a Measurement Strategy for SDG Global Indicator 4.7.1 and Thematic Indicators 4.7.4 and 4.7.5 using International Large-Scale Assessments in Education. Montreal: UNESCO Institute for statistics. Retrieved from http://gaml.uis.unesco.org/wp-content/uploads/sites/2/2019/08/GAML6-REF-9-measurement-strategy-for-4.7.1-4.7.4-4.7.5.pdf
Sandoval-Hernández, A., & Miranda, D. (2018). Exploring ICCS 2016 to measure progress toward target 4.7. Background paper prepared for the 2019 Global Education Monitoring Report. Paris. Retrieved from https://www.gcedclearinghouse.org/sites/default/files/resources/190369eng.pdf
SAS. (2012). SAS System for Windows (Version 9.4). Cary, NC: SAS Institute.
Schulz, W., Carstens, R., Losito, B., & Fraillon, J. (2018). ICCS 2016 technical report. Amsterdam, the Netherlands: International Association for the Evaluation of Educational Achievement.
Schulz, Wolfram, Ainley, J., & Fraillon, J. (2011). ICCS 2009 technical report. Amsterdam: International Association for the Evaluation of Educational Achievement (IEA).
Schulz, Wolfram, Carstens, R., Losito, B., & Fraillon, J. (2018). ICCS 2016 Technical Report. Amsterdam: The International Association for the Evaluation of Educational Achievement (IEA).
Shiel, G., & Cartwright, F. (2015). Analyzing Data from a National Assessment of Educational Achievement. Washington, D.C.: World Bank.
UNESCO. (2011). International standard classification of education: ISCED 2011. Montreal: UNESCO Institute for statistics.
UNESCO. (2012a). Education for Sustainable Development Sourcebook. Paris: UNESCO.

90
UNESCO. (2012b). Exploring Sustainable Development: a Multiple-Perspective Approach. Paris: UNESCO.
UNESCO. (2013). Global Citizenship Education: An Emerging Perspective, Outcome document of the Technical Consultation on Global Citizenship Education. Paris. Retrieved from https://unesdoc.unesco.org/ark:/48223/pf0000224115.locale=en
UNESCO. (2014). Global Citizenship Education, Preparing Learners for the 21st Century. Paris|: UNESCO.
UNESCO. (2015). Global Citizenship Education, Topics and Learning Objectives. Paris: UNESCO. Retrieved from https://unesdoc.unesco.org/ark:/48223/pf0000232993
UNESCO. (2017). Measurement Strategy for SDG Target 4.7: Proposal by GAML Task Force 4.7. Global Alliance for Monitoring Learning. Madrid. Retrieved from http://uis.unesco.org/sites/default/files/documents/gaml4-measurement-strategy-sdgtarget4.7.pdf. %0D
Weber, S. (2018). Sampling design and implementation. In Wolfram Schulz, B. Losito, R. Carstens, & J. Fraillon (Eds.), ICCS 2016 technical report. Amsterdam: International Association for the Evaluation of Educational Achievement (IEA).
Weber, S., Tieck, S., & Savasci, D. (2018). Weighting procedures. In Wolfram Schulz, R. Carstens, B. Losito, & J. Fraillon (Eds.), ICCS 2016 technical report. Amsterdam: International Association for the Evaluation of Educational Achievement (IEA).
Wilson, M., & Draney, K. (2002). A Technique for Setting Standards and Maintaining Them over Time. Measurement and Multivariate Analysis, 325–332. https://doi.org/10.1007/978-4-431-65955-6_35
Wolter, K. M. (1985). Introduction to variance estimation. New York, NY: Springer.
Wu, M., Tam, H. P., & Jen, T.-H. (2016a). Educational Measurement for Applied Researchers. Singapore: Springer Singapore. https://doi.org/10.1007/978-981-10-3302-5
Wu, M., Tam, H. P., & Jen, T.-H. (2016b). Partial Credit Model. In Educational Measurement for Applied Researchers (pp. 159–185). Singapore: Springer Singapore. https://doi.org/10.1007/978-981-10-3302-5_9
Yin, L., & Fishbein, B. (2020). Creating and interpreting the TIMSS 2019 Context Questionnaire Scales. In M. O. Martin, M. Von Davier, & I. V. S. Mullis (Eds.), Methods and Procedures: TIMSS 2019 Technical Report. Chestnut Hill, MA USA: TIMSS & PIRLS International Study Center, Lynch School of Education and Human Development, Boston College and International Association for the Evaluation of Educational Achievement (IEA).
Zuehlke, O. (2011). Sampling design and implementation. In Wolfram Schulz, J. Ainley, & J. Fraillon (Eds.), ICCS 2009 technical report. Amsterdam: International Association for the Evaluation of Educational Achievement (IEA).

91
Appendix I-a. Instrument to collect information for SDG 4.7.4
Questionnaire to collect data to measure SDG Indicator 4.7.4
Percentage of students in lower secondary education showing adequate understanding of issues relating to global citizenship and sustainability.
Student questionnaire
[National Project information]
[Placeholder for identification label]
[Logo]

92
<SAMPLE TEXT OF THE INTRODUCTION TO THE STUDENT QUESTIONNAIRE>
In this questionnaire you will find questions about:
• You, your home and your family
• Your views on various political or social issues related to global citizenship and sustainability
Please read each question carefully and answer as accurately as you can. In this questionnaire, you will answer all questions by ticking a box.
If you make a mistake when ticking a box, cross out or erase your mistake and mark the correct box.
In this questionnaire, there are no right or wrong answers. Your answers should be
the ones that are best for you.
You may ask for help if you do not understand something or if you are not sure how to answer a question.
Your answers will be combined with others to make totals and averages in which no individual can be identified. All your answers will be kept confidential.
THANK YOU VERY MUCH FOR YOUR COOPERATION!
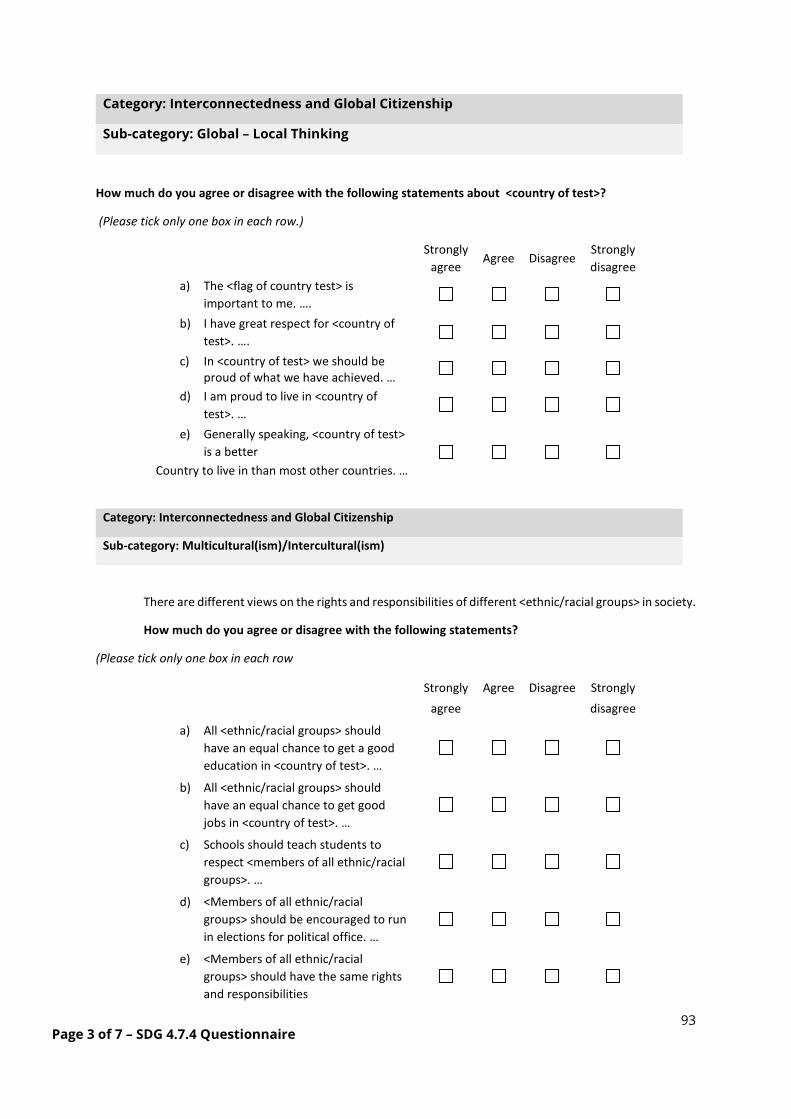
93
Page 3 of 7 – SDG 4.7.4 Questionnaire
Category: Interconnectedness and Global Citizenship
Sub-category: Global – Local Thinking
How much do you agree or disagree with the following statements about <country of test>?
(Please tick only one box in each row.)
Strongly
agree Agree Disagree
Strongly disagree
a) The <flag of country test> is important to me. ….
b) I have great respect for <country of test>. ….
c) In <country of test> we should be proud of what we have achieved. …
d) I am proud to live in <country of test>. …
e) Generally speaking, <country of test> is a better
Country to live in than most other countries. …
Category: Interconnectedness and Global Citizenship
Sub-category: Multicultural(ism)/Intercultural(ism)
There are different views on the rights and responsibilities of different <ethnic/racial groups> in society.
How much do you agree or disagree with the following statements?
(Please tick only one box in each row
Strongly agree
Agree Disagree Strongly disagree
a) All <ethnic/racial groups> should have an equal chance to get a good education in <country of test>. …
b) All <ethnic/racial groups> should have an equal chance to get good jobs in <country of test>. …
c) Schools should teach students to respect <members of all ethnic/racial groups>. …
d) <Members of all ethnic/racial groups> should be encouraged to run in elections for political office. …
e) <Members of all ethnic/racial groups> should have the same rights and responsibilities

94
Page 4 of 7 – SDG 4.7.4 Questionnaire
Category: Gender Equality
Sub-category: Gender Equality/ Parity
There are different views about the roles of women and men in society.
How much do you agree or disagree with the following statements?
(Please tick only one box in each row)
Strongly agree
Agree Disagree Strongly disagree
a) Men and women should have equal opportunities to take part in government. …
b) Men and women should have the same rights in every way. …
c) Women should stay out of politics. … d) When there are not many jobs
available, men should have more right to a job than women. …
e) Men and women should get equal pay when doing the same jobs. …
f) Men are more qualified to be political leaders than women. …
Category: Peace, Non-violence and Human Security
Sub-category: Awareness of forms of abuse/ harassment/ violence (school-based violence, bullying, household-based violence, gender-based violence, child abuse/harassment, sexual abuse/ harassment)
During the last three months, how often did you experience the following situations at your school?
(Please tick only one box in each row
Not at all Once 2 to 4 times
5 times or more
a) A student called you by an offensive nickname. …
b) A student said things about you to make others laugh. …
c) A student threatened to hurt you. … d) You were physically attacked by another
student. …
e) A student broke something belonging to you on purpose. …
f) A student posted offensive pictures or text about you on the Internet. …

95
Page 5 of 7 – SDG 4.7.4 Questionnaire
Category: Sustainable Development
Sub-category: Social Sustainability
Listed below are different ways adults can take an active part in society.
When you are an adult, what do you think you will do?
(Please tick only one box in each row
I would certainly, do
this
I would Probably do
this
I would probably
not do this
I would certainly not
do this
a) Make personal efforts to help the environment (e.g., through saving water) ...
b) Vote in <state province elections>. …
c) Vote in European elections. …
To what extent do you think the following issues are a threat to the world’s future?
(Please tick only one box in each row.)
To a large extent
To a moderate
extent
To a small extent
Not at all
a) Pollution
b) Energy shortages
c) Global financial crisis
d) Crime
e) Water shortages
f) Violent conflict
g) Poverty
h) Food shortages
i) Climate change
j) Unemployment

96
Page 6 of 7 – SDG 4.7.4 Questionnaire
Category: Human Rights
Sub-category: Democracy/democratic rule, democratic values/principles
Below is a list of things that may happen in a democratic country. Some of them may be good for and strengthen democracy, some may be bad and weaken democracy, while others are neither good nor bad for democracy.
Which of the following situations do you think would be good, neither good nor bad, or bad for democracy?
(Please tick only one box in each row)
Good for democracy
Neither good nor bad for democracy
Bad for democracy
a) Political leaders give government jobs to their family members. …
b) One company or the government owns all newspapers in a country. …
c) People are allowed to publicly criticize the government. …
d) All adult citizens have the right to elect their political leaders. …
e) People are able to protest if they think a law is unfair. …
f) The police have the right to hold people suspected of threatening national security in jail without trial. …
g) Differences in income between poor and rich people are small. …
h) The government influences decisions by courts of justice. …
i) All <ethnic/racial> groups in the country have the same rights. …

97
Page 7 of 7 – SDG 4.7.4 Questionnaire
Category: Human Rights
Sub-category: Freedom (of expression, of speech, of press, of association/organization), civil liberties
How important are the following behaviours for being a good adult citizen?
(Please tick only one box in each row.
Very important
Quite important
Not very important
Not important
at all a) Participating in peaceful protests
against laws believed to be unjust. …
b) Participating in activities to benefits people in <local community>. …
c) Taking part in activities promoting human rights. …
d) Taking part in activities to protect the environment. …

98
Appendix I-b. Instrument to collect information for SDG Indicator 4.7.5
Questionnaire to collect data to measure SDG Indicator 4.7 Percentage of students in lower secondary education showing proficiency in knowledge of environmental science and geoscience.
Student questionnaire
[National Project information]
[Placeholder for identification label]
[Logo]

99
Page 2 of 3 – SDG 4.7.5 Questionnaire
<SAMPLE TEXT OF THE INTRODUCTION TO THE STUDENT QUESTIONNAIRE>
In this questionnaire you will find questions about:
You, your home and your family.
Your views on various political or social issues related to global citizenship and sustainability.
Please read each question carefully and answer as accurately as you can. In this questionnaire, you will answer all questions by ticking a box.
If you make a mistake when ticking a box, cross out or erase your mistake and mark the correct box.
In this questionnaire, there are no right or wrong answers. Your answers should be
the ones that are best for you.
You may ask for help if you do not understand something or if you are not sure how to answer a question.
Your answers will be combined with others to make totals and averages in which no individual can be identified. All your answers will be kept confidential.
THANK YOU VERY MUCH FOR YOUR COOPERATION!
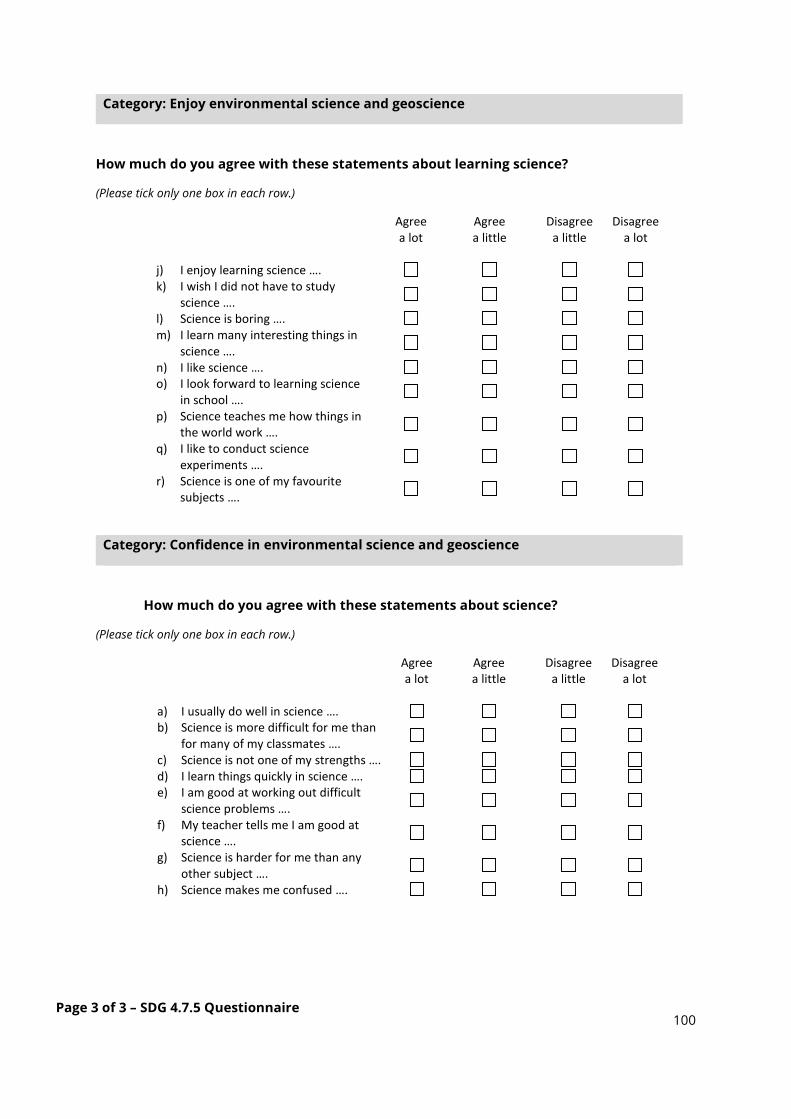
100
Page 3 of 3 – SDG 4.7.5 Questionnaire
Category: Enjoy environmental science and geoscience
How much do you agree with these statements about learning science?
(Please tick only one box in each row.)
Agree a lot
Agree a little
Disagree a little
Disagree a lot
j) I enjoy learning science …. k) I wish I did not have to study
science ….
l) Science is boring …. m) I learn many interesting things in
science ….
n) I like science …. o) I look forward to learning science
in school ….
p) Science teaches me how things in the world work ….
q) I like to conduct science experiments ….
r) Science is one of my favourite subjects ….
Category: Confidence in environmental science and geoscience
How much do you agree with these statements about science?
(Please tick only one box in each row.)
Agree a lot
Agree a little
Disagree a little
Disagree a lot
a) I usually do well in science …. b) Science is more difficult for me than
for many of my classmates ….
c) Science is not one of my strengths …. d) I learn things quickly in science …. e) I am good at working out difficult
science problems ….
f) My teacher tells me I am good at science ….
g) Science is harder for me than any other subject ….
h) Science makes me confused ….

101
Appendix I-c. Examples of cognitive items released from ICCS and TIMSS
Overview
This Annex contains examples of items used in the International Civic and Citizenship Study (ICCS) 2009 and the Trends in Mathematics and Science Study (2011) main surveys. These items have been released by the International Association for the Evaluation of Educational Achievement (IEA). More information about the characteristics of the released items and item release policy can be found in the Assessment Framework of ICCS (Brese, Jung, Mirazchiyski, Schulz, & Zuehlke, 2011) and TIMSS (Foy, Arora, & Stanco, 2013), respectively.
These items are copyright protected by IEA. They are not to be used for commercial purposes without express permission from the IEA
The released items are presented in the same order as they appeared in their respective clusters. Each item is presented on a separate page with summary information for that item.

102
ICCS Example of released item 1
Source: Brese, Jung, Mirazchiyski, Schulz, & Zuehlke, 2011, page 7.

103
ICCS Example of released item 2
Source: Brese, Jung, Mirazchiyski, Schulz, & Zuehlke, 2011, page 8.

104
ICCS Example of released item 3
Source: Brese, Jung, Mirazchiyski, Schulz, & Zuehlke, 2011, page 11.

105
ICCS Example of released item 3 – Scoring guide
Source: Brese, Jung, Mirazchiyski, Schulz, & Zuehlke, 2011, page 12.

106
TIMSS Example of released item 1
Source: Foy, Arora, & Stanco, 2013, page 135.

107
TIMSS Example of released item 2
Source: Foy, Arora, & Stanco, 2013, page 22.

108
TIMSS Example of released item 3
Source: Foy, Arora, & Stanco, 2013, page 137.

109
Appendix II. Questionnaire items and parameters used to produce the scores to measure SDG 7.4.4 and 7.4.5
Contents
Indicator 4.7.5 (cognitive items) .................................................................................................. 110
Indicator 4.7.5 Environmental Science (socio-emotional items) ............................................ 110
Indicator 4.7.5 Environmental Science (behavioural items) .................................................... 110
Indicator 4.7.4 (cognitive items) .................................................................................................. 113
Indicator 4.7.4 Multicultural(ism) or intercultural(ism) (socio-emotional items) ............... 116
Indicator 4.7.4 Multicultural(ism) or intercultural(ism) (socio-emotional items) ............... 116
Indicator 4.7.4 Gender Equality (socio-emotional items) ........................................................ 120
Indicator 4.7.4 Peace, Non-violence and Human Security (behavioural items) ................... 123
Indicator 4.7.4 Freedom (of expression, of speech, of press, of association/organization) (socio-emotional items) ................................................................................................................. 123
Indicator 4.7.4 Social Justice (socio-emotional items) ............................................................. 126
Indicator 4.7.4 Sustainable Development (socio-emotional and behavioural items) ......... 129

110
Indicator 4.7.5 (cognitive items)
COGNITIVE
Source: Trends in International Mathematics and Science Study (TIMSS 2015)
Items are not public
Indicator 4.7.5 Environmental Science (socio-emotional items)
NON-COGNITIVE
Source: Trends in International Mathematics and Science Study (TIMSS 2015), Student questionnaire.
Sub-category: Enjoy environmental science and geoscience
Item variable codes
Note: [R] = are reverse score items. sm1-sm9 = variable names assigned to the responses to these items.

111
Item person map
Measurement model parameters
Term Element Estimate mplus_code
lambda SM1 1 THETA BY SM1@1;
lambda SM2 1 THETA BY SM2@1;
lambda SM3 1 THETA BY SM3@1;
lambda SM4 1 THETA BY SM4@1;
lambda SM5 1 THETA BY SM5@1;
lambda SM6 1 THETA BY SM6@1;
lambda SM7 1 THETA BY SM7@1;

112
lambda SM8 1 THETA BY SM8@1;
lambda SM9 1 THETA BY SM9@1;
alpha THETA 0 [THETA@0];
delta SM1$1 -2.59 [[email protected]];
delta SM1$2 -2.095 [[email protected]];
delta SM1$3 -0.033 [[email protected]];
delta SM2$1 -2.052 [[email protected]];
delta SM2$2 -0.893 [[email protected]];
delta SM2$3 0.287 [[email protected]];
delta SM3$1 -2.341 [[email protected]];
delta SM3$2 -0.944 [[email protected]];
delta SM3$3 0.377 [[email protected]];
delta SM4$1 -2.87 [[email protected]];
delta SM4$2 -2.474 [[email protected]];
delta SM4$3 -0.518 [[email protected]];
delta SM5$1 -2.461 [[email protected]];
delta SM5$2 -1.781 [[email protected]];
delta SM5$3 -0.015 [[email protected]];
delta SM6$1 -2.426 [[email protected]];
delta SM6$2 -1.094 [[email protected]];
delta SM6$3 0.497 [[email protected]];
delta SM7$1 -3.019 [[email protected]];
delta SM7$2 -2.705 [[email protected]];
delta SM7$3 -0.568 [[email protected]];
delta SM8$1 -2.863 [[email protected]];
delta SM8$2 -2.582 [[email protected]];
delta SM8$3 -0.958 [[email protected]];
delta SM9$1 -2.041 [[email protected]];
delta SM9$2 -0.977 [[email protected]];
delta SM9$3 0.298 [[email protected]];
zeta THETA 3.331 [email protected];
threshold 0.663

113
Indicator 4.7.5 Environmental Science (behavioural items)
NON-COGNITIVE
Source: Trends in International Mathematics and Science Study (TIMSS 2015), Student questionnaire.
Sub-category: Confidence in environmental science and geoscience
Item variable codes
Note: [R] = are reverse score items. sc1-sc8 = variable names assigned to the responses to these items.

114
Item person map
Measurement model parameters
Term Element Estimate mplus_code
lambda SC1 1 THETA BY SC1@1;
lambda SC2 1 THETA BY SC2@1;
lambda SC3 1 THETA BY SC3@1;
lambda SC4 1 THETA BY SC4@1;
lambda SC5 1 THETA BY SC5@1;
lambda SC6 1 THETA BY SC6@1;
lambda SC7 1 THETA BY SC7@1;
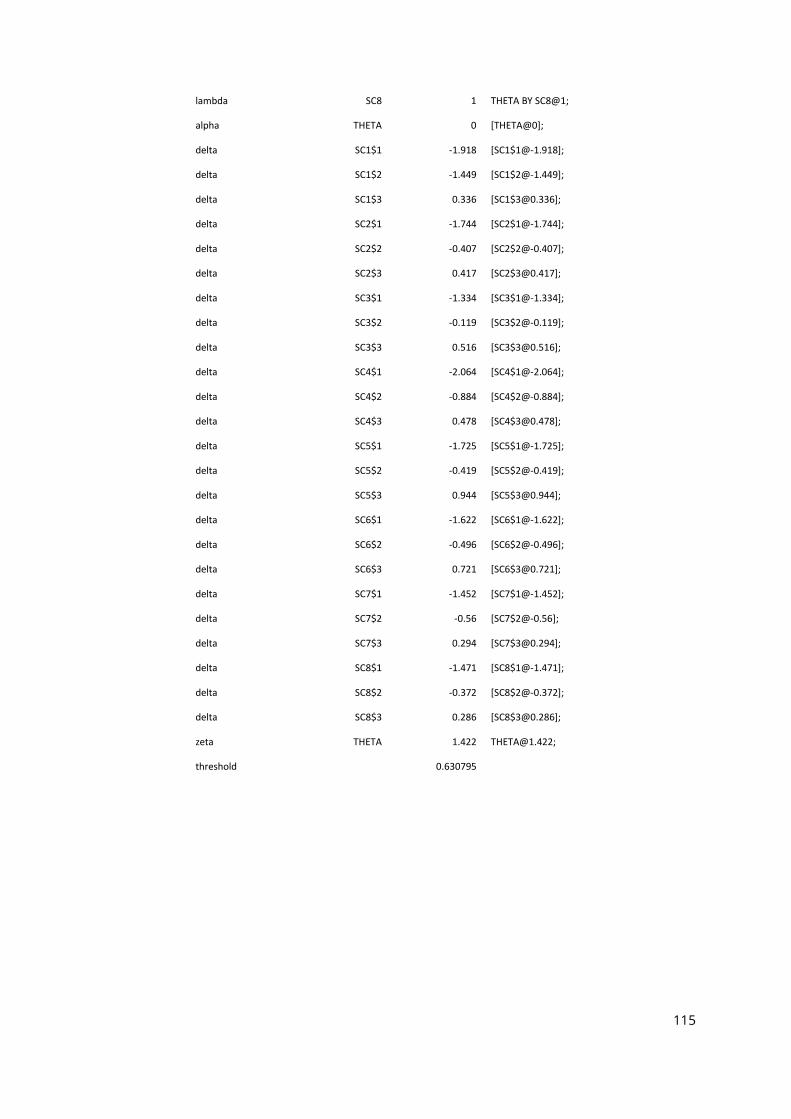
115
lambda SC8 1 THETA BY SC8@1;
alpha THETA 0 [THETA@0];
delta SC1$1 -1.918 [[email protected]];
delta SC1$2 -1.449 [[email protected]];
delta SC1$3 0.336 [[email protected]];
delta SC2$1 -1.744 [[email protected]];
delta SC2$2 -0.407 [[email protected]];
delta SC2$3 0.417 [[email protected]];
delta SC3$1 -1.334 [[email protected]];
delta SC3$2 -0.119 [[email protected]];
delta SC3$3 0.516 [[email protected]];
delta SC4$1 -2.064 [[email protected]];
delta SC4$2 -0.884 [[email protected]];
delta SC4$3 0.478 [[email protected]];
delta SC5$1 -1.725 [[email protected]];
delta SC5$2 -0.419 [[email protected]];
delta SC5$3 0.944 [[email protected]];
delta SC6$1 -1.622 [[email protected]];
delta SC6$2 -0.496 [[email protected]];
delta SC6$3 0.721 [[email protected]];
delta SC7$1 -1.452 [[email protected]];
delta SC7$2 -0.56 [[email protected]];
delta SC7$3 0.294 [[email protected]];
delta SC8$1 -1.471 [[email protected]];
delta SC8$2 -0.372 [[email protected]];
delta SC8$3 0.286 [[email protected]];
zeta THETA 1.422 [email protected];
threshold 0.630795

116
Indicator 4.7.4 (cognitive items)
COGNITIVE
Source: International Civic and Citizenship Study (ICCS 2016)
Items are not public
Indicator 4.7.4 Multicultural(ism) or intercultural(ism) (socio-emotional items)
NON-COGNITIVE
Source: International Civic and Citizenship Study (ICCS 2016), Student questionnaire.
Category: Interconnectedness and Global Citizenship
Sub-category: Global – Local Thinking

117
Indicator 4.7.4 Multicultural(ism) or intercultural(ism) (socio-emotional items)
NON-COGNITIVE
Source: International Civic and Citizenship Study (ICCS 2016), Student questionnaire.
Category: Interconnectedness and Global Citizenship
Sub-category: Multicultural(ism)/Intercultural(ism)
Item variable codes
Note: Variables names in the left side of each of the items are the original names present in public data files from ICCS 2016. In the right-hand side, we include the names et01-et05 to refer to the recoded responses analyzed in the present document. These responses were recoded so higher value expresses a higher presence of the self-reported attribute.

118
Item person map
Measurement model parameters
Term Element Estimate mplus_code
lambda ET01 1 THETA BY ET01@1;
lambda ET02 1 THETA BY ET02@1;
lambda ET03 1 THETA BY ET03@1;

119
lambda ET04 1 THETA BY ET04@1;
lambda ET05 1 THETA BY ET05@1;
alpha THETA 0 [THETA@0];
delta ET01$1 -4.939 [[email protected]];
delta ET01$2 -4.838 [[email protected]];
delta ET01$3 -0.974 [[email protected]];
delta ET02$1 -5.262 [[email protected]];
delta ET02$2 -4.293 [[email protected]];
delta ET02$3 -0.633 [[email protected]];
delta ET03$1 -5.144 [[email protected]];
delta ET03$2 -4.026 [[email protected]];
delta ET03$3 -0.778 [[email protected]];
delta ET04$1 -4.471 [[email protected]];
delta ET04$2 -2.164 [[email protected]];
delta ET04$3 1.303 [[email protected]];
delta ET05$1 -4.637 [[email protected]];
delta ET05$2 -4.185 [[email protected]];
delta ET05$3 -0.79 [[email protected]];
zeta THETA 5.223 [email protected];
threshold
1.33

120
Indicator 4.7.4 Gender equality (socio-emotional items)
NON-COGNITIVE
Source: International Civic and Citizenship Study (ICCS 2016), Student questionnaire.
Category: Gender Equality
Sub-category: Gender Equality/ Parity
Item variable codes
Note: Variables names in the left side of each of the items are the original names present in public data files from ICCS 2016. In the right-hand side, we include the names ge01-ge06 to referred to the recoded responses analyzed in the present document. These responses were recoded so higher value expresses a higher presence of the self-reported attribute. As such, items ge04, ge05 and ge06 are reverse code items, where higher values indicate a higher endorsement of gender equality.

121
Item person map

122
Measurement model parameters
Term Element Estimate mplus_code
lambda GE01 1 THETA BY GE01@1;
lambda GE02 1 THETA BY GE02@1;
lambda GE03 1 THETA BY GE03@1;
lambda GE04 1 THETA BY GE04@1;
lambda GE05 1 THETA BY GE05@1;
lambda GE06 1 THETA BY GE06@1;
alpha THETA 0 [THETA@0];
delta GE01$1 -3.53 [[email protected]];
delta GE01$2 -3.941 [[email protected]];
delta GE01$3 -1.744 [[email protected]];
delta GE02$1 -3.96 [[email protected]];
delta GE02$2 -3.141 [[email protected]];
delta GE02$3 -1.59 [[email protected]];
delta GE03$1 -3.22 [[email protected]];
delta GE03$2 -2.926 [[email protected]];
delta GE03$3 -1.56 [[email protected]];
delta GE04$1 -2.386 [[email protected]];
delta GE04$2 -2.437 [[email protected]];
delta GE04$3 -0.705 [[email protected]];
delta GE05$1 -2.201 [[email protected]];
delta GE05$2 -1.876 [[email protected]];
delta GE05$3 -0.392 [[email protected]];
delta GE06$1 -2.304 [[email protected]];
delta GE06$2 -1.804 [[email protected]];
delta GE06$3 -0.071 [[email protected]];
zeta THETA 2.782 [email protected];
threshold
0.082

123
Indicator 4.7.4 Peace, Non-violence and Human Security (behavioural items)
NON-COGNITIVE
Source: International Civic and Citizenship Study (ICCS 2016), Student questionnaire.
Category: Peace, Non-violence and Human Security
Sub-category: Awareness of forms of abuse/ harassment/ violence (school-based violence, bullying, household-based violence, gender-based violence, child abuse/harassment, sexual abuse/ harassment)
Item variable codes
Note: Variables names in the left side of each of the items are the original names present in public data files from ICCS 2016. In the right-hand side, we include the names ab01-ab06 to referred rename variables generated for this report. These responses are coded as higher values expressing a higher frequency of bullying experiences.

124
Item person map

125
Measurement model parameters
Term Element Estimate mplus_code
lambda AB01 1 THETA BY AB01@1;
lambda AB02 1 THETA BY AB02@1;
lambda AB03 1 THETA BY AB03@1;
lambda AB04 1 THETA BY AB04@1;
lambda AB05 1 THETA BY AB05@1;
lambda AB06 1 THETA BY AB06@1;
alpha THETA 0 [THETA@0];
delta AB01$1 0.298 [[email protected]];
delta AB01$2 1.02 [[email protected]];
delta AB01$3 1.239 [[email protected]];
delta AB02$1 0.184 [[email protected]];
delta AB02$2 0.935 [[email protected]];
delta AB02$3 1.672 [[email protected]];
delta AB03$1 2.36 [[email protected]];
delta AB03$2 2.108 [[email protected]];
delta AB03$3 2.441 [[email protected]];
delta AB04$1 2.449 [[email protected]];
delta AB04$2 2.315 [[email protected]];
delta AB04$3 2.511 [[email protected]];
delta AB05$1 2.069 [[email protected]];
delta AB05$2 2.648 [[email protected]];
delta AB05$3 2.848 [[email protected]];
delta AB06$1 3.184 [[email protected]];
delta AB06$2 2.68 [[email protected]];
delta AB06$3 2.853 [[email protected]];
zeta THETA 1.733 [email protected];
threshold
-0.148

126
Indicator 4.7.4 Freedom (of expression, of speech, of press, of association/organisation) (socio-emotional items)
NON-COGNITIVE
Source: International Civic and Citizenship Study (ICCS 2016), Student questionnaire.
Category: Human Rights
Sub-category: Freedom (of expression, of speech, of press, of association/organization), civil liberties
Item variable codes
Note: Variables names in the left side of each of the items are the original names present in public data files from ICCS 2016. In the right-hand side, we include the names td01-td09 to referred to the recoded responses analyzed in the present document. These responses were recoded so higher value expresses what is good for democracy. Items td06-td09 are reverse coded items, thus, for these items, higher values express what is bad for democracy.

127
Response profile plot

128
Measurement model parameters
Term Element Estimate mplus_code
Class 1 = Complex %C#1%
delta td01$1 -0.33334 [[email protected]];
delta td02$1 -2.59099 [[email protected]];
delta td03$1 -1.40968 [[email protected]];
delta td04$1 0.02147 [[email protected] ];
delta td05$1 -1.53639 [[email protected]];
delta td06$1 -1.17551 [[email protected]];
delta td07$1 -1.51024 [[email protected]];
delta td08$1 0.16618 [[email protected] ];
delta td09$1 -0.71816 [[email protected]];
Class 2 = Minimalist %C#2%
delta td01$1 0.51025 [[email protected] ];
delta td02$1 -2.01460 [[email protected]];
delta td03$1 -1.00153 [[email protected]];
delta td04$1 0.58917 [[email protected] ];
delta td05$1 -1.04513 [[email protected]];
delta td06$1 1.53009 [[email protected] ];
delta td07$1 0.66028 [[email protected] ];
delta td08$1 0.94356 [[email protected] ];
delta td09$1 1.84940 [[email protected] ];
Class 3 = Limited %C#3%
delta td01$1 2.09976 [[email protected] ];
delta td02$1 0.46165 [[email protected] ];
delta td03$1 1.40219 [[email protected] ];
delta td04$1 1.94310 [[email protected] ];
delta td05$1 1.26562 [[email protected] ];
delta td06$1 1.20480 [[email protected] ];
delta td07$1 1.04318 [[email protected] ];
delta td08$1 1.18445 [[email protected] ];
delta td09$1 1.49832 [[email protected] ];
Note: These are the obtained parameters with a multigroup latent class model fitted in Mplus 8.5 following the structurally homogenous model specification, with 24 countries and regions as known classes, and fitting three latent classes to the selected items (Entropy = .90).

129
Indicator 4.7.4 Social Justice (socio-emotional items)
NON-COGNITIVE
Source: International Civic and Citizenship Study (ICCS 2016), Student questionnaire.
Category: Human Rights
Sub-category: Social justice
Item variable codes
Note: Variables names in the left side of each of the items are the original names present in public data files from ICCS 2016. In the right-hand side, we include the names cn01-cn04 to refer to the recoded responses analyzed in the present document. These responses were recoded so higher value expresses a higher presence of the self-reported attribute.

130
Item person map

131
Measurement model parameters
Term Element Estimate mplus_code
lambda CN01 1 THETA BY CN01@1;
lambda CN02 1 THETA BY CN02@1;
lambda CN03 1 THETA BY CN03@1;
lambda CN04 1 THETA BY CN04@1;
alpha THETA 0 [THETA@0];
delta CN01$1 -2.855 [[email protected]];
delta CN01$2 -0.668 [[email protected]];
delta CN01$3 1.335 [[email protected]];
delta CN02$1 -3.901 [[email protected]];
delta CN02$2 -2.028 [[email protected]];
delta CN02$3 0.775 [[email protected]];
delta CN03$1 -3.986 [[email protected]];
delta CN03$2 -2.16 [[email protected]];
delta CN03$3 0.442 [[email protected]];
delta CN04$1 -3.877 [[email protected]];
delta CN04$2 -2.285 [[email protected]];
delta CN04$3 0.195 [[email protected]];
zeta THETA 2.661 [email protected];
threshold -0.68

132
Indicator 4.7.4 Sustainable Development (socio-emotional and behavioural items)
NON-COGNITIVE
Source: International Civic and Citizenship Study (ICCS 2016), Student questionnaire.
Category: Sustainable Development
Sub-category: Social Sustainability
Item variable codes

133
Note: Variables names in the left side of each of the items are the original names present in public data files from ICCS 2016. In the right-hand side, we include the names ft01-ft11 to refer to the recoded responses analyzed in the present document. These responses were recoded so higher value expresses a higher presence of the intended attribute
Item person map

134
Measurement model parameters
Term Element Estimate mplus_code
lambda FT01 1 THETA BY FT01@1;
lambda FT02 1 THETA BY FT02@1;
lambda FT03 1 THETA BY FT03@1;
lambda FT04 1 THETA BY FT04@1;
lambda FT05 1 THETA BY FT05@1;
lambda FT06 1 THETA BY FT06@1;
lambda FT07 1 THETA BY FT07@1;
lambda FT08 1 THETA BY FT08@1;
lambda FT09 1 THETA BY FT09@1;
lambda FT10 1 THETA BY FT10@1;
lambda FT11 1 THETA BY FT11@1;
alpha THETA 0 [THETA@0];
delta FT01$1 -2.9 [[email protected]];
delta FT01$2 -2.767 [[email protected]];
delta FT01$3 -1.536 [[email protected]];
delta FT02$1 -2.971 [[email protected]];
delta FT02$2 -1.871 [[email protected]];
delta FT02$3 0.098 [[email protected]];

135
delta FT03$1 -3.231 [[email protected]];
delta FT03$2 -1.68 [[email protected]];
delta FT03$3 0.122 [[email protected]];
delta FT04$1 -2.952 [[email protected]];
delta FT04$2 -1.539 [[email protected]];
delta FT04$3 -0.291 [[email protected]];
delta FT05$1 -2.332 [[email protected]];
delta FT05$2 -1.463 [[email protected]];
delta FT05$3 -1.18 [[email protected]];
delta FT06$1 -3.023 [[email protected]];
delta FT06$2 -1.573 [[email protected]];
delta FT06$3 -0.074 [[email protected]];
delta FT07$1 -2.918 [[email protected]];
delta FT07$2 -1.708 [[email protected]];
delta FT07$3 -0.4 [[email protected]];
delta FT08$1 -2.511 [[email protected]];
delta FT08$2 -1.64 [[email protected]];
delta FT08$3 -0.946 [[email protected]];
delta FT09$1 -2.848 [[email protected]];
delta FT09$2 -1.588 [[email protected]];

136
delta FT09$3 -0.652 [[email protected]];
delta FT10$1 -2.876 [[email protected]];
delta FT10$2 -1.479 [[email protected]];
delta FT10$3 0.215 [[email protected]];
delta FT11$1 -3.043 [[email protected]];
delta FT11$2 -2.248 [[email protected]];
delta FT11$3 -0.086 [[email protected]];
zeta THETA 1.302 [email protected];
threshold 0.017

137
Appendix III. Annotated code for producing scores
R and Mplus code
Import data
# ----------------------------------------------------------------------------- # prepare data for mplus # ----------------------------------------------------------------------------- #------------------------------------------------ # import data #------------------------------------------------ data_gen_16_col <- haven::read_sav('data_gen_16_col.sav') data_gen_09_col <- haven::read_sav('data_gen_09_col.sav')
Recode data
# ----------------------------------------------------------------------------- # recode data # ----------------------------------------------------------------------------- #------------------------------------------------ # recoding functions #------------------------------------------------ # higher category of response, more agreement rec_1 <- function(x){ dplyr::case_when( x == 4 ~ 0, # Strongly Disagree x == 3 ~ 1, # Disagree x == 2 ~ 2, # Agree x == 1 ~ 3, # Strongly Agree TRUE ~ as.numeric(x)) } # reverse items, higher response category more attribute rec_2 <- function(x){ dplyr::case_when( x == 4 ~ 3, # Strongly Disagree x == 3 ~ 2, # Disagree x == 2 ~ 1, # Agree x == 1 ~ 0, # Strongly Agree TRUE ~ as.numeric(x)) } #------------------------------------------------ # recode original variables

138
#------------------------------------------------ items_16_col <- data_gen_16_col %>% mutate(ge01 = rec_1(IS3G24A)) %>% mutate(ge02 = rec_1(IS3G24B)) %>% mutate(ge03 = rec_1(IS3G24E)) %>% mutate(ge04 = rec_2(IS3G24C)) %>% mutate(ge05 = rec_2(IS3G24D)) %>% mutate(ge06 = rec_2(IS3G24F)) %>% dplyr::select(id_i, ge01, ge02, ge03, ge04, ge05, ge06 ) items_09_col <- data_gen_09_col %>% mutate(ge01 = rec_1(IS2P24A)) %>% mutate(ge02 = rec_1(IS2P24B)) %>% mutate(ge03 = rec_1(IS2P24E)) %>% mutate(ge04 = rec_2(IS2P24C)) %>% mutate(ge05 = rec_2(IS2P24D)) %>% mutate(ge06 = rec_2(IS2P24F)) %>% dplyr::select(id_i, ge01, ge02, ge03, ge04, ge05, ge06 )
Recode data
# ----------------------------------------------------------------------------- # produce scores # ----------------------------------------------------------------------------- #------------------------------------------------ # fit pcm over Colombia 2016 #------------------------------------------------ library(MplusAutomation) pcm_16_col <- mplusObject( MODEL = ' !lambda eta by ge01@1; eta by ge02@1; eta by ge03@1; eta by ge04@1; eta by ge05@1; eta by ge06@1;
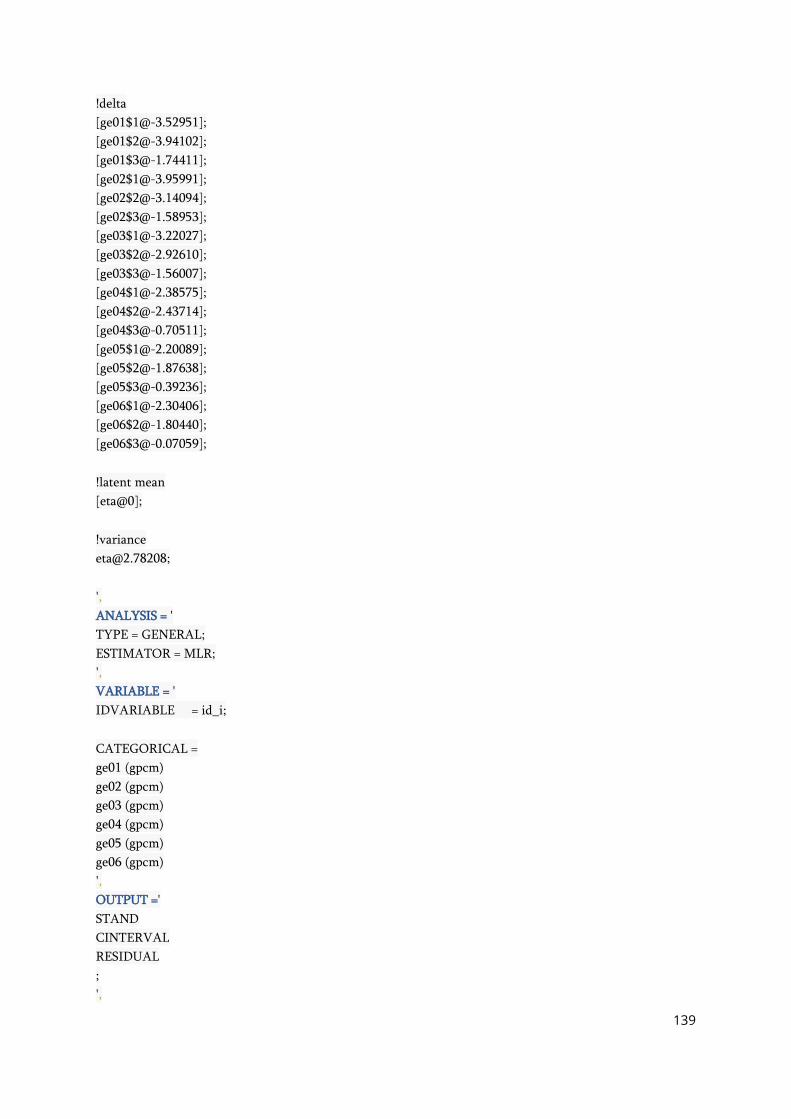
139
!delta [[email protected]]; [[email protected]]; [[email protected]]; [[email protected]]; [[email protected]]; [[email protected]]; [[email protected]]; [[email protected]]; [[email protected]]; [[email protected]]; [[email protected]]; [[email protected]]; [[email protected]]; [[email protected]]; [[email protected]]; [[email protected]]; [[email protected]]; [[email protected]]; !latent mean [eta@0]; !variance [email protected]; ', ANALYSIS = ' TYPE = GENERAL; ESTIMATOR = MLR; ', VARIABLE = ' IDVARIABLE = id_i; CATEGORICAL = ge01 (gpcm) ge02 (gpcm) ge03 (gpcm) ge04 (gpcm) ge05 (gpcm) ge06 (gpcm) ', OUTPUT =' STAND CINTERVAL RESIDUAL ; ',

140
SAVEDATA =' FILE = gen_16_col_eap.dat; SAVE = FSCORES; ', rdata = items_16_col) %>% mplusModeler(., modelout = 'gen_16_col.inp', run = 1L, writeData = 'always', hashfilename = FALSE)
#------------------------------------------------ # fit pcm over Colombia 2009 #------------------------------------------------ library(MplusAutomation) pcm_09_col <- mplusObject( MODEL = ' !lambda eta by ge01@1; eta by ge02@1; eta by ge03@1; eta by ge04@1; eta by ge05@1; eta by ge06@1; !delta [[email protected]]; [[email protected]]; [[email protected]]; [[email protected]]; [[email protected]]; [[email protected]]; [[email protected]]; [[email protected]]; [[email protected]]; [[email protected]]; [[email protected]]; [[email protected]]; [[email protected]]; [[email protected]]; [[email protected]]; [[email protected]]; [[email protected]]; [[email protected]];

141
!latent mean [eta@0]; !variance [email protected]; ', ANALYSIS = ' TYPE = GENERAL; ESTIMATOR = MLR; ', VARIABLE = ' IDVARIABLE = id_i; CATEGORICAL = ge01 (gpcm) ge02 (gpcm) ge03 (gpcm) ge04 (gpcm) ge05 (gpcm) ge06 (gpcm) ', OUTPUT =' STAND CINTERVAL RESIDUAL ; ', SAVEDATA =' FILE = gen_09_col_eap.dat; SAVE = FSCORES; ', rdata = items_09_col) %>% mplusModeler(., modelout = 'gen_09_col.inp', run = 1L, writeData = 'always', hashfilename = FALSE)
Classify scores
# ----------------------------------------------------------------------------- # classify between reach and not reach # ----------------------------------------------------------------------------- # ----------------------------------------------- # standard threshold # -----------------------------------------------

142
# [R] Men are better qualified to be political leaders than women. threshold <- 0.082 # ----------------------------------------------- # retrieve IRT scores from 2016 # ----------------------------------------------- # retrieve sample design variables design_16 <- data_gen_16_col %>% dplyr:::select( COUNTRY, id_i, strata, cluster, ws ) # retrieve IRT scores and add sample design variables stand_16_col <- pcm_16_col %>% purrr::pluck('results') %>% purrr::pluck('savedata') %>% dplyr::rename_all(tolower) %>% tibble::as_tibble() %>% mutate(eta_d = if_else(eta >= threshold, 1, 0)) %>% dplyr::left_join(., design_16, by = 'id_i') %>% dplyr::glimpse()
## Rows: 5,511 ## Columns: 14 ## $ ge01 <dbl> NA, 3, 3, 3, 2, 3, 1, 3, 2, 2, 1, 3, 2, 3, 3, 2, 2, 3, 3, 3, … ## $ ge02 <dbl> 3, 3, 1, 3, 2, 3, 0, 3, 2, 3, 1, 3, 3, 1, 2, 3, 2, 3, 3, 3, 2… ## $ ge03 <dbl> NA, 3, 3, 1, 2, 2, 2, 2, 2, 3, 1, 3, 3, 1, 3, 2, 3, 2, 1, 3, … ## $ ge04 <dbl> NA, 1, 1, 2, 2, 2, 1, 2, 1, 3, 1, 3, 3, 3, 2, 2, 2, 2, 2, 3, … ## $ ge05 <dbl> NA, 1, 0, NA, 3, 1, 1, 2, 1, 2, 0, 1, 1, 3, 0, 2, 2, 2, 2, 1,… ## $ ge06 <dbl> NA, 1, 0, 2, 3, 2, 1, 1, 2, 3, 2, 2, 1, 3, 2, 2, 2, 2, 2, 3, … ## $ eta <dbl> 0.56, -1.34, -2.31, -1.09, -0.72, -1.05, -2.77, -1.05, -1.85,… ## $ eta_se <dbl> 1.41, 0.53, 0.48, 0.62, 0.60, 0.56, 0.48, 0.56, 0.49, 0.74, 0… ## $ id_i <dbl> 10979, 10980, 10981, 10982, 10983, 10984, 10985, 10986, 10987… ## $ eta_d <dbl> 1, 0, 0, 0, 0, 0, 0, 0, 0, 1, 0, 0, 0, 0, 0, 0, 0, 0, 0, 1, 0… ## $ COUNTRY <chr> "COL", "COL", "COL", "COL", "COL", "COL", "COL", "COL", "COL"… ## $ strata <dbl> 432, 432, 432, 432, 432, 432, 432, 432, 449, 449, 449, 449, 4… ## $ cluster <dbl+lbl> 4320, 4320, 4320, 4320, 4320, 4320, 4320, 4320, 4490, 449… ## $ ws <dbl> 0.4, 0.4, 0.4, 0.4, 0.4, 0.4, 0.4, 0.4, 0.2, 0.2, 0.2, 0.2, 0…
# ----------------------------------------------- # retrieve IRT scores from 2009 # -----------------------------------------------

143
# retrieve sample design variables design_09 <- data_gen_09_col %>% dplyr:::select( COUNTRY, id_i, strata, cluster, ws ) # retrieve IRT scores and add sample design variables stand_09_col <- pcm_09_col %>% purrr::pluck('results') %>% purrr::pluck('savedata') %>% dplyr::rename_all(tolower) %>% tibble::as_tibble() %>% mutate(eta_d = if_else(eta >= threshold, 1, 0)) %>% dplyr::left_join(., design_09, by = 'id_i') %>% dplyr::glimpse()
## Rows: 6,070 ## Columns: 14 ## $ ge01 <dbl> 3, 3, 2, 3, 3, 3, 3, 3, 3, 3, 3, 3, 3, 3, 3, 3, 3, 3, 3, 3, 3… ## $ ge02 <dbl> 3, 3, 2, 3, 3, 3, 3, 3, 3, 3, 3, 3, 3, 3, 3, 3, 3, 3, 3, 3, 3… ## $ ge03 <dbl> 3, 3, 2, 3, 3, 3, 1, 2, 3, 2, 3, 3, 3, 3, 3, 3, 3, 3, 3, 3, 3… ## $ ge04 <dbl> 3, 3, 2, 3, 3, 3, 2, 3, 3, 3, 2, 3, 3, 3, 3, 2, 3, 3, 3, 3, 2… ## $ ge05 <dbl> 3, 3, 2, 2, 3, 2, 2, 3, 3, 1, 3, NA, 3, 3, 3, 3, 3, 3, 3, 3, … ## $ ge06 <dbl> 3, 3, 2, 2, 3, 3, 2, 3, 3, 3, 3, 3, 3, 3, 3, 2, 0, 3, 3, 3, 2… ## $ eta <dbl> 1.78, 1.78, -1.34, 0.16, 1.78, 0.81, -1.05, 0.81, 1.78, -0.33… ## $ eta_se <dbl> 1.10, 1.10, 0.53, 0.74, 1.10, 0.88, 0.56, 0.88, 1.10, 0.66, 0… ## $ id_i <dbl> 17727, 17728, 17729, 17730, 17731, 17732, 17733, 17734, 17735… ## $ eta_d <dbl> 1, 1, 0, 1, 1, 1, 0, 1, 1, 0, 1, 1, 1, 1, 1, 1, 0, 1, 1, 1, 0… ## $ COUNTRY <chr> "COL", "COL", "COL", "COL", "COL", "COL", "COL", "COL", "COL"… ## $ strata <dbl> 501, 501, 501, 501, 501, 501, 501, 501, 501, 501, 501, 501, 5… ## $ cluster <dbl> 5010, 5010, 5010, 5010, 5010, 5010, 5010, 5010, 5010, 5010, 5… ## $ ws <dbl> 0.062, 0.062, 0.062, 0.062, 0.062, 0.062, 0.062, 0.062, 0.062…

144
Percentage reaching standard
# ----------------------------------------------------------------------------- # population estimates # ----------------------------------------------------------------------------- #------------------------------------------------ # options for lonely psu #------------------------------------------------ library(survey) options(survey.lonely.psu = "certainty") #------------------------------------------------ # create survey object #------------------------------------------------ library(srvyr) svy_16 <- stand_16_col %>% as_survey_design( strata = strata, weights = ws, id = cluster) library(srvyr) svy_09 <- stand_09_col %>% as_survey_design( strata = strata, weights = ws, id = cluster) #------------------------------------------------ # percentage of students reaching the standard in 2016 #------------------------------------------------ library(srvyr) svy_16 %>% group_by(COUNTRY) %>% summarize( est = survey_mean(eta_d, na.rm=TRUE, proportion = TRUE, prop_method = 'logit', vartype = "ci"))%>% arrange(est) %>% knitr::kable(., digits = 2)

145
COUNTRY est est_low est_upp
COL 0.41 0.38 0.44
#------------------------------------------------ # percentage of students reaching the standard in 2009 #------------------------------------------------ library(srvyr) svy_09 %>% group_by(COUNTRY) %>% summarize( est = survey_mean(eta_d, na.rm=TRUE, proportion = TRUE, prop_method = 'logit', vartype = "ci"))%>% arrange(est) %>% knitr::kable(., digits = 2)
COUNTRY est est_low est_upp
COL 0.35 0.33 0.38