gunfire location and surveillance system · gunfire location and surveillance system ... project...
TRANSCRIPT

Gunfire Location and Surveillance System
Group 3
Denis Alvarado BSCpE
Zayd Babamir BSEE Christian Kon BSEE Luis Salazar BSCpE
i
TABLE OF CONTENTS
1. Executive Summary __________________________________________________1
2. Project Description ___________________________________________________ 2
2.1 Objectives ______________________________________________________________ 2
2.2 Requirements ___________________________________________________________ 3
2.3 Specifications ___________________________________________________________ 3
3. Research ___________________________________________________________ 5
3.1 Existing Products ________________________________________________________ 5 3.1.1 Thales ______________________________________________________________________ 5
3.1.2 ShotSpotter __________________________________________________________________ 6
3.1.3 SWATS _____________________________________________________________________ 8
3.1.4 Boomerang __________________________________________________________________ 9
3.1.5 SENTRI ____________________________________________________________________ 10
3.2 Multilateration _________________________________________________________ 11 3.2.1 2D Multilateration ____________________________________________________________ 11
3.2.2 3D Multilateration ____________________________________________________________ 14
3.3 Triangulation __________________________________________________________ 15 3.3.1 2D Triangulation _____________________________________________________________ 17
3.3.2 3D Triangulation _____________________________________________________________ 18
3.4 Signal Reproduction _____________________________________________________ 22
3.5 Gunshot Acoustic Properties ______________________________________________ 24
3.6 Wavelet vs Fourier ______________________________________________________ 38
3.7 Initial Hardware Choices _________________________________________________ 44 3.1.1 Main Board Design ___________________________________________________________ 44
3.1.2 Processor ___________________________________________________________________ 46
3.1.3 Memory/RAM _______________________________________________________________ 47
3.1.4 Bluetooth ___________________________________________________________________ 49
3.1.5 GPS _______________________________________________________________________ 50
3.1.6 Backup Power Battery Size _____________________________________________________ 51
3.1.7 Backup Battery Power Souce ___________________________________________________ 54
4. Hardware Design ___________________________________________________ 57
4.1 Initial Embedded Board Design ___________________________________________ 57 4.1.1 BeagleBone Black Microcontroller Model _________________________________________ 57
4.1.2 Processor ___________________________________________________________________ 59
4.1.3 RAM Module Configuration ____________________________________________________ 66
4.1.4 DC Power Configuration _______________________________________________________ 70
4.1.5 Peripheral Inputs/Outputs ______________________________________________________ 71
4.2 Initial Sound Capture Subsystem __________________________________________ 76 4.2.1 Microphone _________________________________________________________________ 76
4.2.2 Microphone Array ____________________________________________________________ 80
4.2.3 Amplifier ___________________________________________________________________ 81
4.2.4 Analog to Digital Converter ____________________________________________________ 85
4.2.5 FPGA ______________________________________________________________________ 90
ii
4.2.6 DPSRAM Audio Buffer _______________________________________________________ 92
4.3 Initial Power Subsystem _________________________________________________ 97 4.3.1 Primary Power _______________________________________________________________ 97
4.3.2 Secondary Power _____________________________________________________________ 97
4.3.3 Power Switching _____________________________________________________________ 99
4.4 Current Hardware Design _______________________________________________ 100 4.4.1 Audio Capture ______________________________________________________________ 101
4.4.2 Data Processing _____________________________________________________________ 101
4.4.3 Power _____________________________________________________________________ 102
5. Software Design ___________________________________________________ 103
5.1 Initial Embedded Board Design __________________________________________ 103
5.2 Linux ________________________________________________________________ 106
5.3 Gunshot Recognition Algorithm __________________________________________ 106
5.4 Location Algorithm ____________________________________________________ 107
6. Project Prototype Construction ______________________________________ 112
6.1 Hardware ____________________________________________________________ 112 6.1.1 Initial Design _______________________________________________________________ 112
6.1.2 Current Design _____________________________________________________________ 113
6.2 Software______________________________________________________________ 113
7. Fabrication and Testing _____________________________________________ 114
7.1 Hardware ____________________________________________________________ 114 7.1.1 Initial Design _______________________________________________________________ 114
7.1.2 Current Design _____________________________________________________________ 115
7.2 Software______________________________________________________________ 116 7.2.1 Initial Design _______________________________________________________________ 116
7.2.2 Current Design _____________________________________________________________ 117
8. Design Summary and Conclusion _____________________________________ 118
9. Administration Content _____________________________________________ 119
9.1 Budget and Funding ____________________________________________________ 119
9.2 Planning and Milestones ________________________________________________ 120
9.3 Management Style _____________________________________________________ 121
9.4 Division of Labour _____________________________________________________ 123
Acknoweldgements ________________________________________________________ 124
Appendix A ______________________________________________________________ 125
Appendix B ______________________________________________________________ 128
1
Chapter 1 Executive Summary
With the recent high profile mass shootings that have flooded the news, firearm safety and response has unfortunately become a pressing issue and serious subject of public safety. No matter the political standpoint of any individual, both pro- and anti-gun advocates can agree that any new technology to make a firefight safer and shorter for innocent bystanders is a good implementation. Currently, banks and many government entities are equipped with panic buttons that employees can trigger when danger arises. Although these are useful tools, the human factor is still present in triggering that alarm, and there is room for life-threatening instances in that time.
Furthermore, not all entities, institutions, or businesses have such systems in place making themselves more vulnerable to gun crime. Additionally, alarms can provide only limited information to incoming law enforcement agents. The location of a threat provides a better picture of events as they unfold. Lastly, on many occasions where video recording is not in use, forensic investigators have the difficult task of calculating and recording where they believe all gunshots were fired after a crime. These current issues motivated our team of engineers to create the Gunshot Location And Surveillance System, GLASS.
GLASS addresses these issues by providing accurate detailed information of gun fire events in a timely manner, as they occur. In the case of a power outage, GLASS is solar powered, with a backup battery to provide energy grid independence. On receiving a gunfire signal, GLASS triangulates the source’s position using triangulation, characterizes the firearm being used, and then alerts a separate device with the pertinent information. .
2
Chapter 2 Project Description
2.1 Objectives
GLASS (Gunfire Location and Surveillance System) is a modular security alarm system that is designed to greatly increase the safety of innocents during a criminal shooting. GLASS is also a self-sustaining unit that generates and stores its own power source in case of particular, emergency situations.
In the primary module, GLASS monitors for the specific audio traces that are unique to gunshots and immediately sends an alarm to local law enforcement and institution security (if applicable). Although bystanders may still call for emergency help, GLASS provides an almost instantaneous response to alert authorities promoting swifter law enforcement arrival and bystander safety.
The secondary module of GLASS triangulates at least the relative position, if not the exact position of where the firearm(s) is(are) discharged and records the position on a digital schematic of the institution in which it is installed. Considering that the microphones utilized in GLASS may not be installed in every room of an institution, the system provides a relative position of the gunshots if a shooting were to occur in a room not fully equipped with GLASS microphones. GLASS also records a timestamp associated with each location where a round is being fired.
Considering that GLASS is a modular system, one where features can easily be added, it may perform other functions. These functions include real-time updates to mobile devices with gunfire locations and depending on whether or not an institution has electronic door locking mechanisms, the possibility of GLASS “leading” a criminal to a predesignated area away from innocent bystanders by locking and unlocking particular doors.
On the internal level, GLASS is self-sustaining both in power and implementation. In case of power failure to the institution, GLASS powers itself during the day with photovoltaic solar panels which also charges a backup battery for the evening time. The battery can be integrated into the institutions power grid to guarantee a full charge at all times. GLASS is also designed to be “hands-free” in terms of implementation. Once configured and installed, GLASS requires no additional interaction from the institution implementing it. This self-sustainability makes GLASS easy to utilize, free to power, and secure.
3
2.2 Requirements
For utilization of at least the internal, first, and secondary levels of GLASS the following are the minimum requirements:
● Four microphones for monitoring and location triangulation ● Data processing unit for audio input and alarm/location marking output ● Digital schematic of room where GLASS is installed ● Secondary Android enabled device to receive communications from
GLASS ● Photovoltaic solar panel ● Battery backup ● Audio, phone, and power wiring
2.3 Specifications
Through the speakers, GLASS constantly monitors the audio signals for three conditions to be met which are specific to gunshots recording continuously to a buffer. The first condition that needs to be met is a decibel level. After an adequate amount of time a portion of the buffer is sent to the processing unit to process and check the recorded data for all gunfire remaining gunfire conditions. All firearms (except those equipped with suppressors) produce a level of 140 dB when fired. The general range for a gunshot discharge is between 140-180 dB. Once this first condition is met, most other sound originators are ruled out out but GLASS checks two more conditions. The second audible trace GLASS monitors for is the peak frequency caused by the gunpowder explosion within the chamber of the firearm. This second condition allows GLASS to record what caliber weapon is being fired since different calibers produce specific peak frequencies. The last condition the audio record must meet is proof of the subsonic frequency the round makes as it flies through the air. The last condition guarantees that an actual firearm was discharged not a recording.
Once all three audio conditions are met, GLASS automatically either sends an emergency message or calls law enforcement with information detailing the location of shooting and the details recorded, and calculated by the system.. Glass then uses sound recognition software to match the weapon type.
As the emergency call is being made, GLASS continues tracking and recording all locations and time instants where a firearm is discharged. This positioning is calculated by a triangulation method utilizing at least three microphones. The three microphones record the analog signal where it is then converted into a digital signal which the data processing unit will run the GLASS triangulation program to locate the gunshot relative to the particular GLASS node.

4
The data processing unit is comprised of an ARM processor mounted on a custom designed board running a Linux OS with a GLASS software interface, a data storage drive, a power supply, integrated memory, and a network adapter for communication. Each microphone has its own single core microprocessor to quickly analyze and process the initial discharge. This data is then forwarded to the main processing unit described above for locations processing and mapping. Area schematics are preloaded into the system where GLASS tracks gunfire locations and timestamps on digital copies.
5
Chapter 3
Research
3.1 Existing Products
Several products similar to what we are trying to do already exist in the marketplace, but they are very expensive and limited to the public. The US Army is has been the pioneer in this invention. The use of gunfire locator in recently wars where US has been involved has saved many lives already. For that reason, we think is good idea to implement this invention and make it affordable for most of the population. Similar, some police stations already count with this device and its use has contributed to response and arrives to crime scenes faster; as a result, the number of people killed has decreased. Again the main purpose of GLASS is to detect shooting and save lives. Some of products that detect gunshots are described as follows:
3.1.1 – THALES
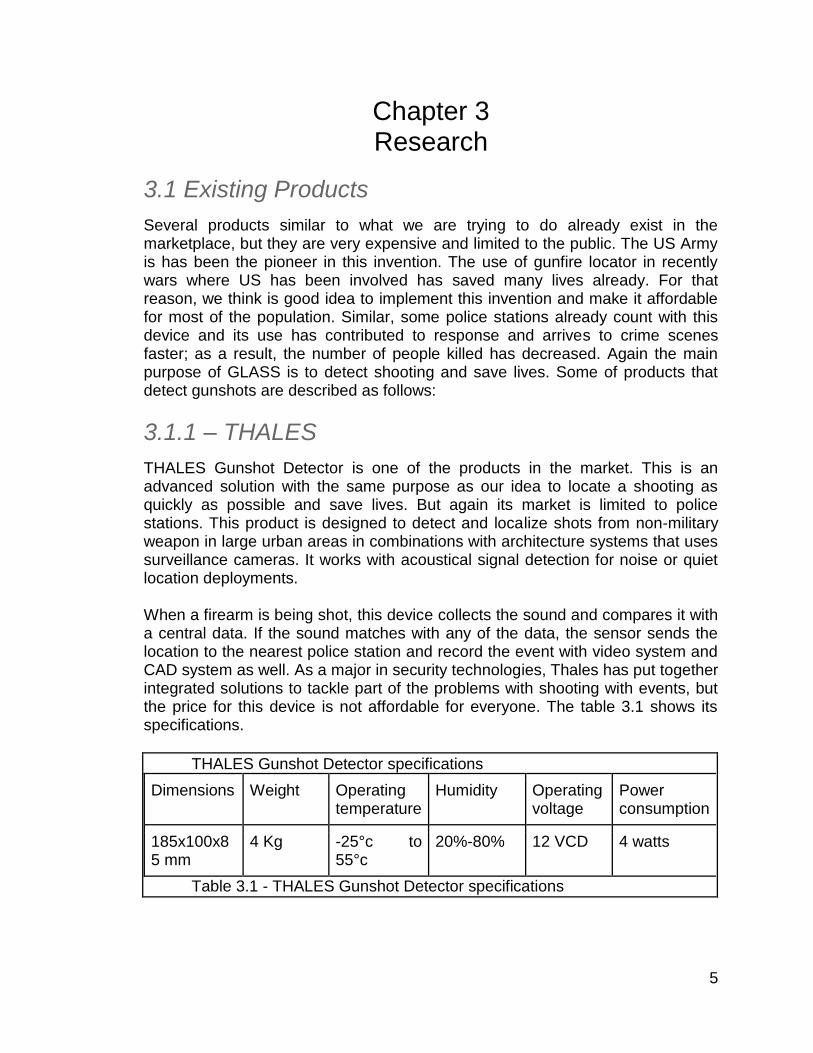
THALES Gunshot Detector is one of the products in the market. This is an advanced solution with the same purpose as our idea to locate a shooting as quickly as possible and save lives. But again its market is limited to police stations. This product is designed to detect and localize shots from non-military weapon in large urban areas in combinations with architecture systems that uses surveillance cameras. It works with acoustical signal detection for noise or quiet location deployments. When a firearm is being shot, this device collects the sound and compares it with a central data. If the sound matches with any of the data, the sensor sends the location to the nearest police station and record the event with video system and CAD system as well. As a major in security technologies, Thales has put together integrated solutions to tackle part of the problems with shooting with events, but the price for this device is not affordable for everyone. The table 3.1 shows its specifications.
THALES Gunshot Detector specifications
Dimensions Weight Operating temperature
Humidity Operating voltage
Power consumption
185x100x85 mm
4 Kg -25°c to 55°c
20%-80% 12 VCD 4 watts
Table 3.1 - THALES Gunshot Detector specifications
6
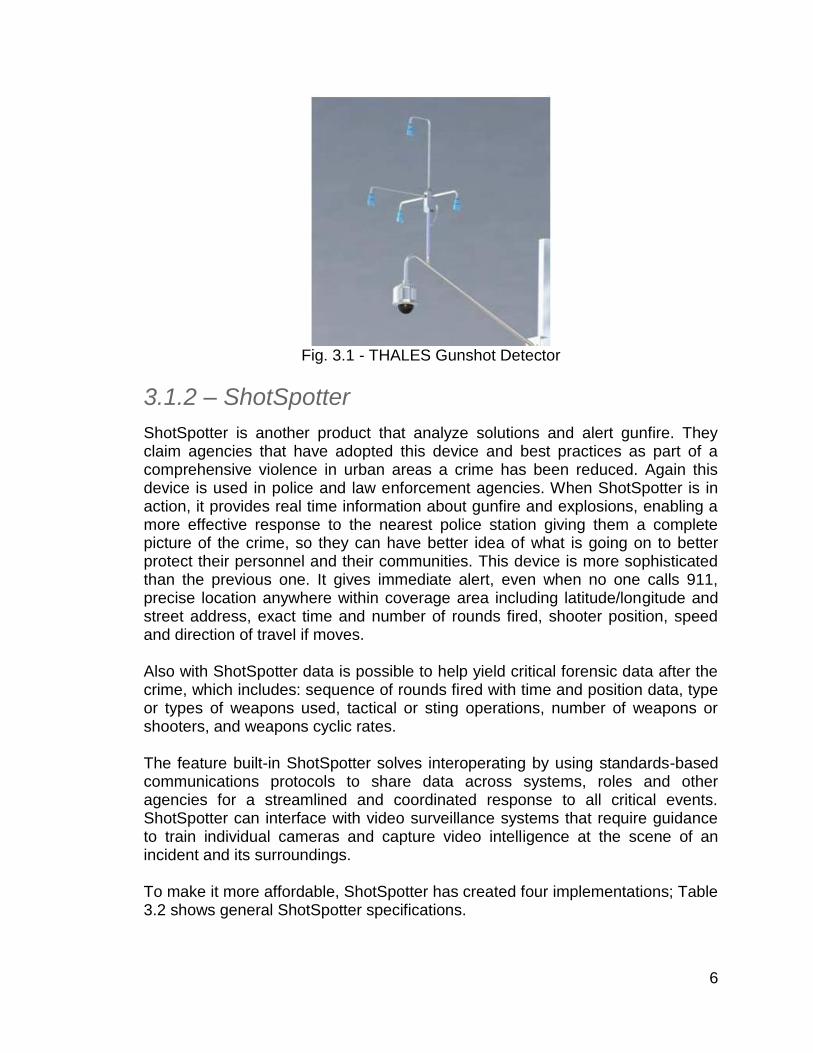
Fig. 3.1 - THALES Gunshot Detector
3.1.2 – ShotSpotter
ShotSpotter is another product that analyze solutions and alert gunfire. They claim agencies that have adopted this device and best practices as part of a comprehensive violence in urban areas a crime has been reduced. Again this device is used in police and law enforcement agencies. When ShotSpotter is in action, it provides real time information about gunfire and explosions, enabling a more effective response to the nearest police station giving them a complete picture of the crime, so they can have better idea of what is going on to better protect their personnel and their communities. This device is more sophisticated than the previous one. It gives immediate alert, even when no one calls 911, precise location anywhere within coverage area including latitude/longitude and street address, exact time and number of rounds fired, shooter position, speed and direction of travel if moves.
Also with ShotSpotter data is possible to help yield critical forensic data after the crime, which includes: sequence of rounds fired with time and position data, type or types of weapons used, tactical or sting operations, number of weapons or shooters, and weapons cyclic rates. The feature built-in ShotSpotter solves interoperating by using standards-based communications protocols to share data across systems, roles and other agencies for a streamlined and coordinated response to all critical events. ShotSpotter can interface with video surveillance systems that require guidance to train individual cameras and capture video intelligence at the scene of an incident and its surroundings. To make it more affordable, ShotSpotter has created four implementations; Table 3.2 shows general ShotSpotter specifications.
7
Shot Spotter Flex, it is the most powerful and cheaper effective gunfire alert and analysis service available that provides comprehensive, real time gunshot detection and location for any safety agency. ShotSpotter Flex delivers all the critical incident and forensic data agencies need to do their jobs more effectively:
● Real-time alerts for outdoor gunfire in coverage areas ● Precise location anywhere within the coverage area including
latitude/longitude and street address ● Direction and speed of travel of one or more shooters ● Exact time of each shot and potential number of shooters ● Comprehensive database of incident history and data ● Round-by-round post-incident forensic analysis to support investigators
and prosecutors ShotSpotter Onsite, it is designed for agencies that require more control of on-premise solutions and delivers the same intelligence, response, safety and advantages including:
● Real-time alerts for outdoor gunfire in coverage areas ● Precise location anywhere within the coverage area including
latitude/longitude and street address ● Direction and speed of travel of one or more shooters ● Exact time of each shot and potential number of shooters ● Comprehensive database of incident history and data ● Round-by-round post-incident forensic analysis to support investigators
and prosecutors
ShotSpotter SpecialOps, it gives the ability to check targeted areas for short-term and temporary operations to proactively enhance security against possible threats and allow quick reaction to crimes. It uses pre-loaded software and wireless sensors to allow simplified setup for coverage of small areas. It is designed to enhance protection for:
● VIP and dignitary events ● Special event security ● Tactical or sting operations ● Area security ● Serial or active shooter scenarios
ShotSpotter Security, it is the most complex of the four systems. It capable of protecting buildings, borders and other public and private infrastructures from terrorist or criminal attacks. It provides alerts security personnel to attacks from firearms and explosions instantly and allows them to take intelligent actions immediately. As the other four systems, it can be configured to integrate with
8
video surveillance system and enhance their functionality. Key benefits of ShotSpotter Security include:
● Real-time delivery of precise, geo-referenced incident alerts ● Instantly makes incident audio and data available to personnel ● Interoperable with critical public safety and security technologies ● Capable of alerting multiple agencies for coordinated response
ShotSpotter
Application framework
Display Operating system
Processor Memory Internet bandwidth
Silverlight XGS & SXGS
Microsoft 1.6 GHz 1 GB 256 kbps
Table 3.2 - ShotSpotter Gunshot Detector specifications
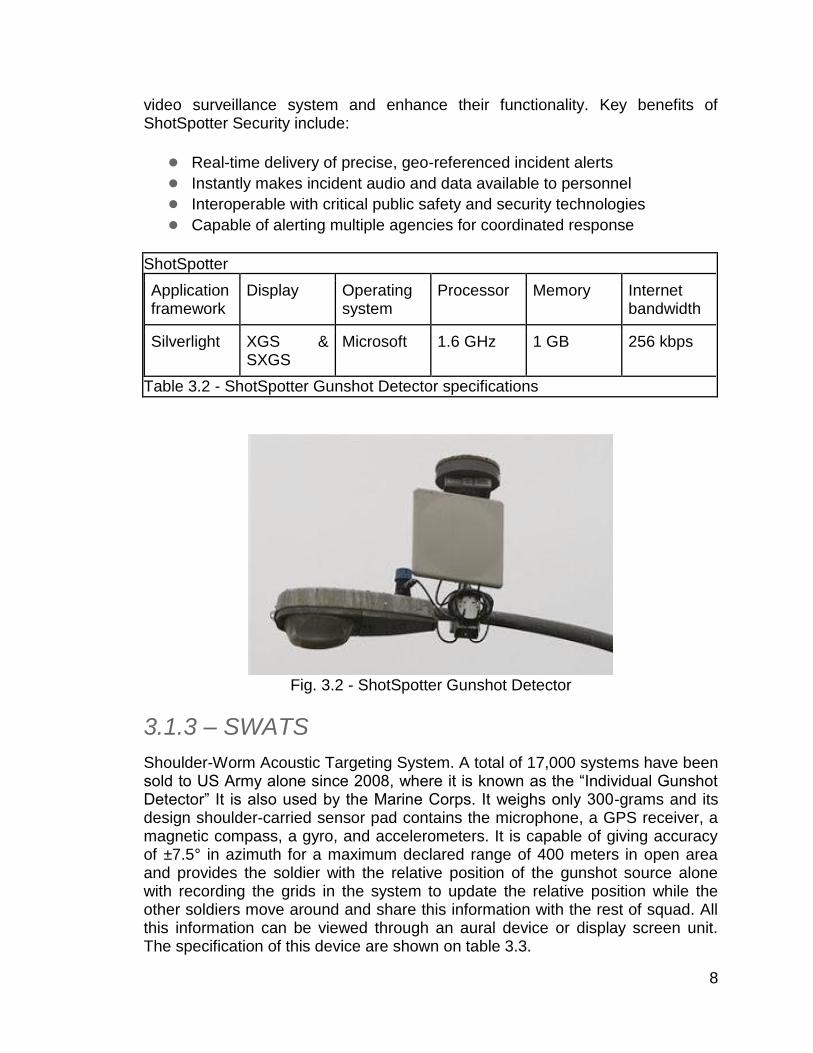
Fig. 3.2 - ShotSpotter Gunshot Detector
3.1.3 – SWATS
Shoulder-Worm Acoustic Targeting System. A total of 17,000 systems have been sold to US Army alone since 2008, where it is known as the “Individual Gunshot Detector” It is also used by the Marine Corps. It weighs only 300-grams and its design shoulder-carried sensor pad contains the microphone, a GPS receiver, a magnetic compass, a gyro, and accelerometers. It is capable of giving accuracy of ±7.5° in azimuth for a maximum declared range of 400 meters in open area and provides the soldier with the relative position of the gunshot source alone with recording the grids in the system to update the relative position while the other soldiers move around and share this information with the rest of squad. All this information can be viewed through an aural device or display screen unit. The specification of this device are shown on table 3.3.
9
SWATS
Dimensions Weight Operating temperature
Humidity Storage temperature
Power consumption
3x3x0.75 in 1 lb -20°c to 60°c
5%-95% -20°c to 70°c
1 watt
Table 3.3 - SWATS Gunshot Detector specifications
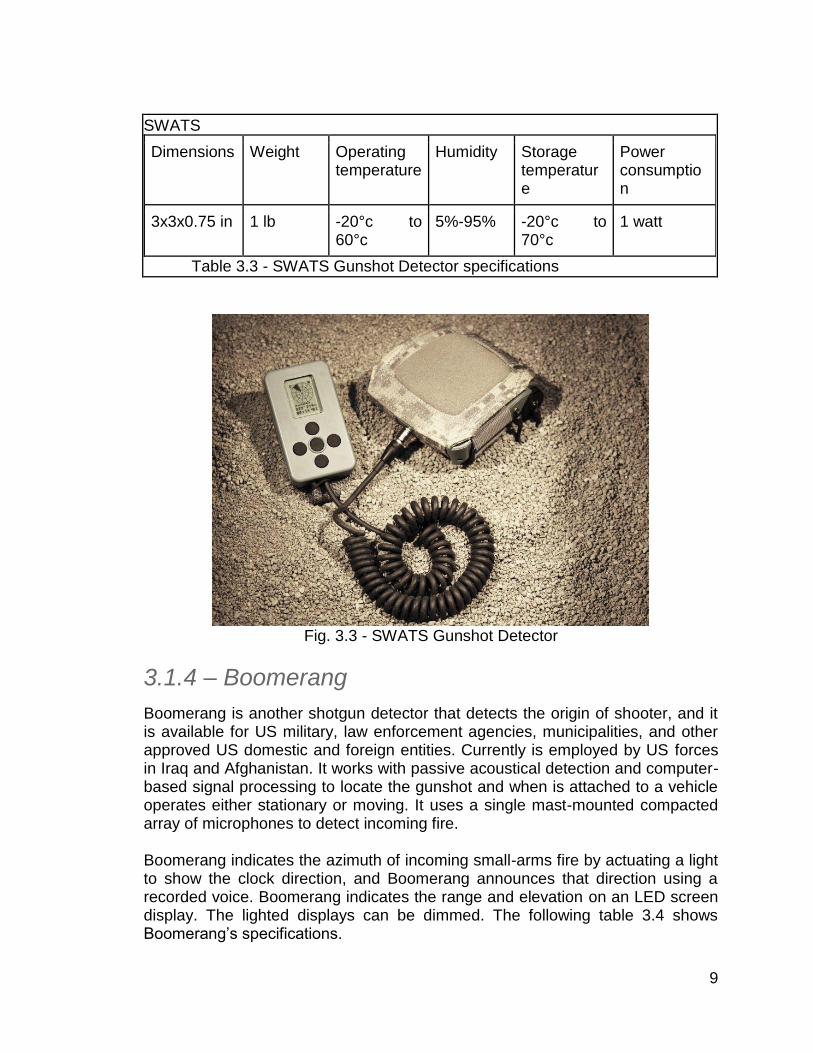
Fig. 3.3 - SWATS Gunshot Detector
3.1.4 – Boomerang
Boomerang is another shotgun detector that detects the origin of shooter, and it is available for US military, law enforcement agencies, municipalities, and other approved US domestic and foreign entities. Currently is employed by US forces in Iraq and Afghanistan. It works with passive acoustical detection and computer-based signal processing to locate the gunshot and when is attached to a vehicle operates either stationary or moving. It uses a single mast-mounted compacted array of microphones to detect incoming fire. Boomerang indicates the azimuth of incoming small-arms fire by actuating a light to show the clock direction, and Boomerang announces that direction using a recorded voice. Boomerang indicates the range and elevation on an LED screen display. The lighted displays can be dimmed. The following table 3.4 shows Boomerang’s specifications.

10
Boomerang
Dimensions Weight Operating temperature
Storage temperature
Operating voltage
Power consumption
7.25Wx4.75Hx 3.25D in
15 lb 0°c to 50°c -40°c to 71°c
9-30 V dc 25 watts
Table 3.4 - Boomerang Gunshot Detector specifications
Fig. 3.4 - Boomerang Gunshot Detector
3.1.5 – SENTRI
SENTRI, It is a product developed by Safety Dynamics specialized in the use of small sensor to recognize and locate threats, and it is currently selling and supporting to law enforcements agencies. The system recognizes gunshots and expositions and sends the signal to cameras which can locate the source of the event. The patent developed by the laboratory of Neural Dynamics at the University of Southern California is the core of the acoustic recognition capability and is based on neurobiological principles of brain signal processing similar to human brain. It is capable of recognizing an acoustical signal even in the presence of high noise. SENTRI is part of a network of surveillance cameras which listen for gunshot and provides to police stations with the ability to use its audio during crime scenes. Table 3.5 shows SENTRI’s specifications.
11
SENTRI
Dimensions Memory Operating temperature
Operating frequency
Operating voltage
Sampling rate
8.25x4.25x1.25 in
16 MB SDRAM
0°c to 70°c 225 Mhz +12,-12, +5 V
500 Khz per channel
Table 3.5 - SENTRI Gunshot Detector specifications
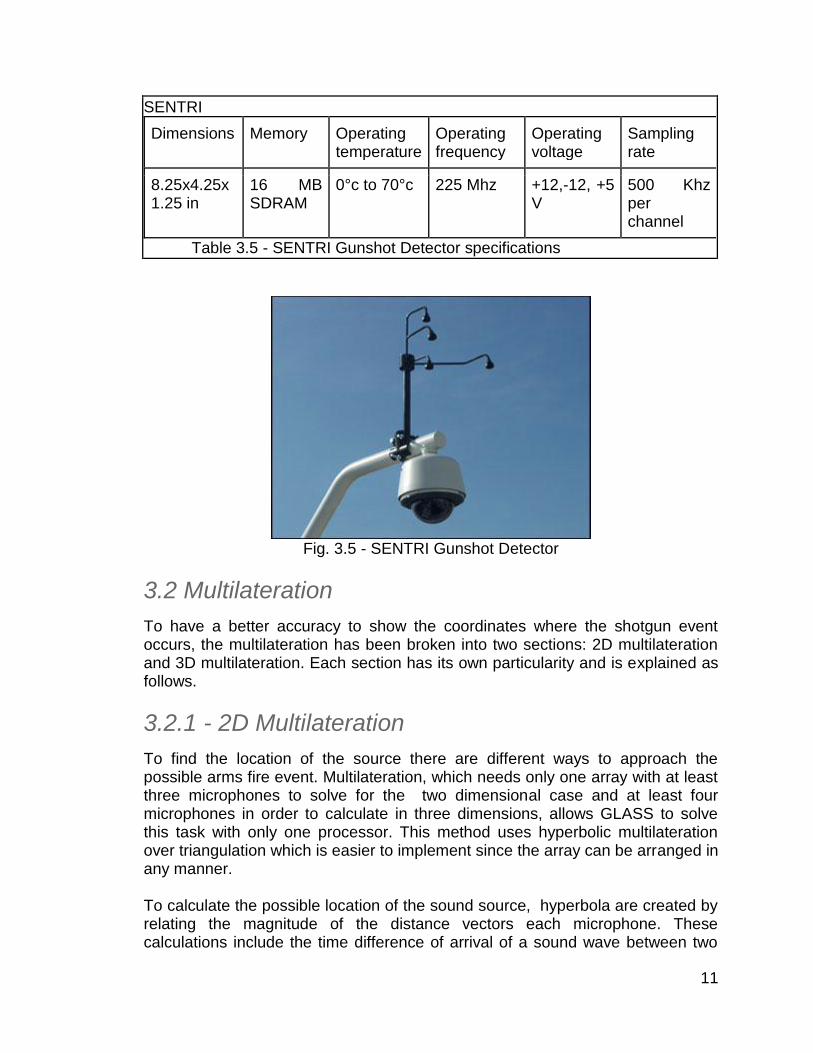
Fig. 3.5 - SENTRI Gunshot Detector
3.2 Multilateration
To have a better accuracy to show the coordinates where the shotgun event occurs, the multilateration has been broken into two sections: 2D multilateration and 3D multilateration. Each section has its own particularity and is explained as follows.
3.2.1 - 2D Multilateration
To find the location of the source there are different ways to approach the possible arms fire event. Multilateration, which needs only one array with at least three microphones to solve for the two dimensional case and at least four microphones in order to calculate in three dimensions, allows GLASS to solve this task with only one processor. This method uses hyperbolic multilateration over triangulation which is easier to implement since the array can be arranged in any manner.
To calculate the possible location of the sound source, hyperbola are created by relating the magnitude of the distance vectors each microphone. These calculations include the time difference of arrival of a sound wave between two
12
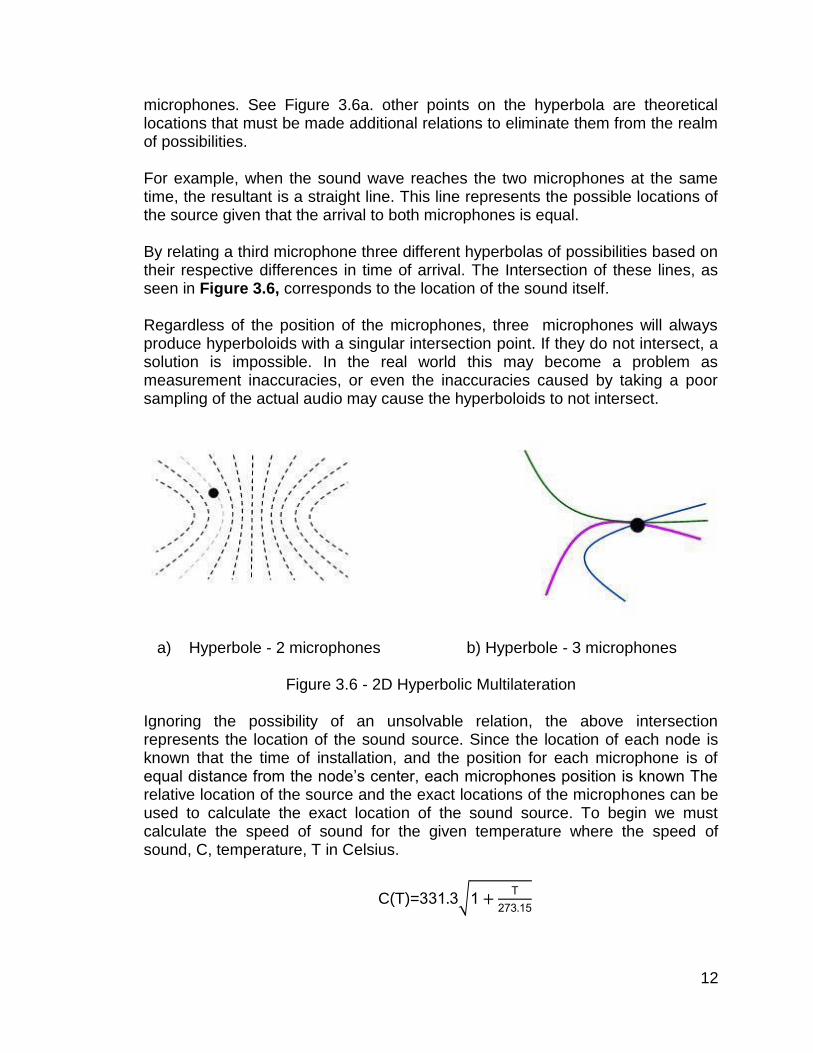
microphones. See Figure 3.6a. other points on the hyperbola are theoretical locations that must be made additional relations to eliminate them from the realm of possibilities. For example, when the sound wave reaches the two microphones at the same time, the resultant is a straight line. This line represents the possible locations of the source given that the arrival to both microphones is equal.
By relating a third microphone three different hyperbolas of possibilities based on their respective differences in time of arrival. The Intersection of these lines, as seen in Figure 3.6, corresponds to the location of the sound itself. Regardless of the position of the microphones, three microphones will always produce hyperboloids with a singular intersection point. If they do not intersect, a solution is impossible. In the real world this may become a problem as measurement inaccuracies, or even the inaccuracies caused by taking a poor sampling of the actual audio may cause the hyperboloids to not intersect.
a) Hyperbole - 2 microphones b) Hyperbole - 3 microphones
Figure 3.6 - 2D Hyperbolic Multilateration Ignoring the possibility of an unsolvable relation, the above intersection represents the location of the sound source. Since the location of each node is known that the time of installation, and the position for each microphone is of equal distance from the node’s center, each microphones position is known The relative location of the source and the exact locations of the microphones can be used to calculate the exact location of the sound source. To begin we must calculate the speed of sound for the given temperature where the speed of sound, C, temperature, T in Celsius.
C(T)=331 3√1 T
273 15
13
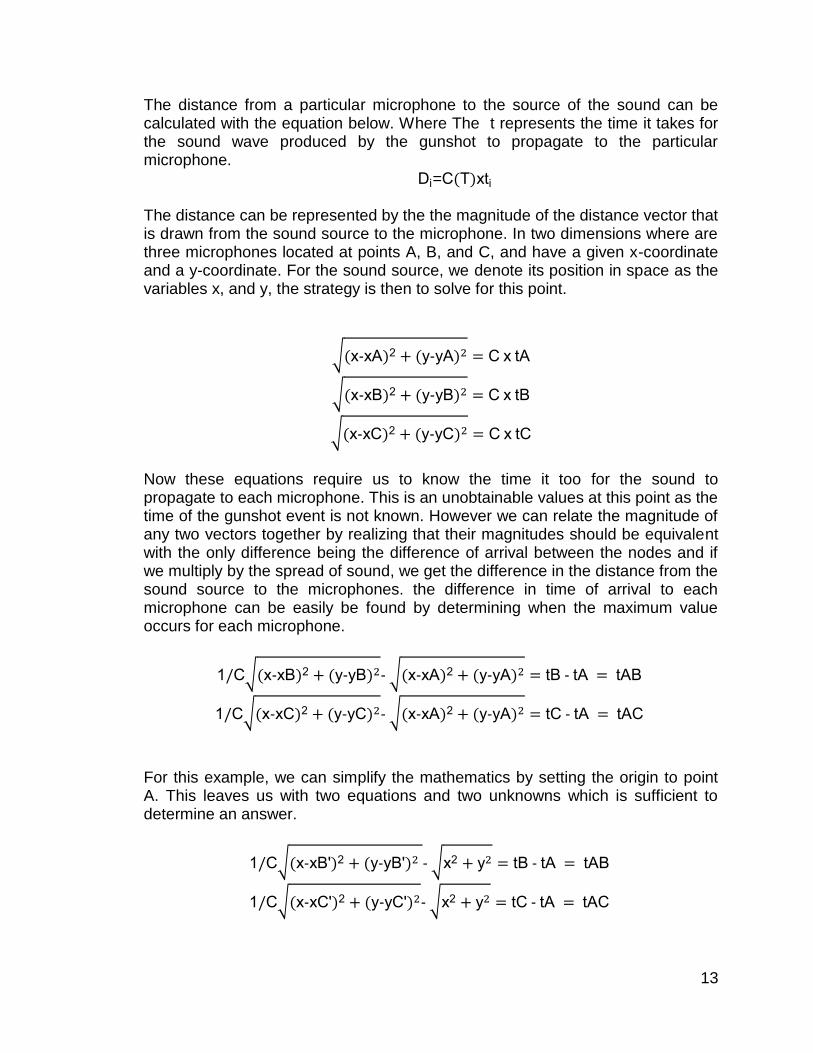
The distance from a particular microphone to the source of the sound can be calculated with the equation below. Where The t represents the time it takes for the sound wave produced by the gunshot to propagate to the particular microphone.
Di=C T xti
The distance can be represented by the the magnitude of the distance vector that is drawn from the sound source to the microphone. In two dimensions where are three microphones located at points A, B, and C, and have a given x-coordinate and a y-coordinate. For the sound source, we denote its position in space as the variables x, and y, the strategy is then to solve for this point.
√ x xA 2 y yA C x tA
√ x xB 2 y yB C x tB
√ x xC 2 y yC C x tC
Now these equations require us to know the time it too for the sound to propagate to each microphone. This is an unobtainable values at this point as the time of the gunshot event is not known. However we can relate the magnitude of any two vectors together by realizing that their magnitudes should be equivalent with the only difference being the difference of arrival between the nodes and if we multiply by the spread of sound, we get the difference in the distance from the sound source to the microphones. the difference in time of arrival to each microphone can be easily be found by determining when the maximum value occurs for each microphone.
1 C√ x xB 2 y yB √ x xA 2 y yA tB tA tAB
1 C√ x xC 2 y yC √ x xA 2 y yA tC tA tAC
For this example, we can simplify the mathematics by setting the origin to point A. This leaves us with two equations and two unknowns which is sufficient to determine an answer.
1 C√ x xB 2 y yB √x2 y tB tA tAB
1 C√ x xC 2 y yC √x2 y tC tA tAC
14
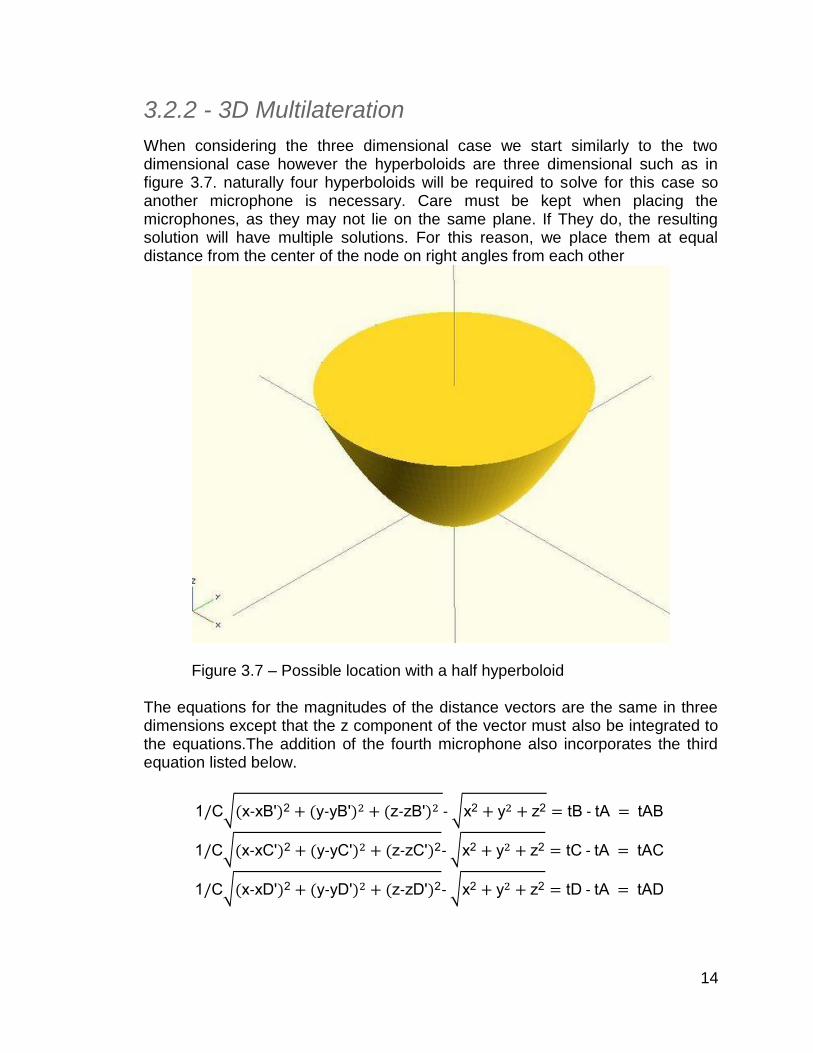
3.2.2 - 3D Multilateration
When considering the three dimensional case we start similarly to the two dimensional case however the hyperboloids are three dimensional such as in figure 3.7. naturally four hyperboloids will be required to solve for this case so another microphone is necessary. Care must be kept when placing the microphones, as they may not lie on the same plane. If They do, the resulting solution will have multiple solutions. For this reason, we place them at equal distance from the center of the node on right angles from each other
Figure 3.7 – Possible location with a half hyperboloid
The equations for the magnitudes of the distance vectors are the same in three dimensions except that the z component of the vector must also be integrated to the equations.The addition of the fourth microphone also incorporates the third equation listed below.
1 C√ x xB 2 y yB z zB √x2 y z2 tB tA tAB
1 C√ x xC 2 y yC z zC 2 √x2 y z2 tC tA tAC
1 C√ x xD 2 y yD z zD 2 √x2 y z2 tD tA tAD

15
The use of multilateration to find the sound location has also carries some possible errors. Any discrepancies due to the position of the microphone or timing as it relates to the arrival to each microphone can cause the system of equation to become unsolvable.
3.3 Triangulation Triangulation uses the fundamentals of euclidean trigonometry to determine the position of an object. Given that the speed of sound is constant for a given temperature, the delay between two nodes receiving the same sound can thereby be determined. Then, by incorporating another node, a direction can be obtained the resulting vector is sufficient to place the origin of the sound.
Every time a firearm is shot generates two distinct impulse sounds: the muzzle blast and the shockwave. See figure 3.8. The muzzle blast is the result of the rapid discharge of the propellant and the fast combustion generated when the unburned part of the propellant mixes with air outside the muzzle, and the origin of this impulse is measured from the weapon right after the shot. In the other hand, the shock wave is created by the trajectory of the bullet travelling through the air, similar to the waves created by aircraft during a flight.
From the weapon to the microphone array, the muzzle blast wave originates from a point source (the muzzle), and it propagates spherically from its origin at the speed of sound. For that reason, it can be detected from anywhere around the firing position. The muzzle blast wave propagation is directly toward the microphone array without any obstructions during the path.
Similar to the triangular wave formed by a boat on the surface of the water, the shock wave creates a cone. The tip of the cones travels along the line of fire at the speed of the bullet, but the acoustic wave from that propagates perpendicular to the shock wave front at the speed of sound. See figure 3.8.
Fig. 3.8- Impulse sounds at low angle of fire
16
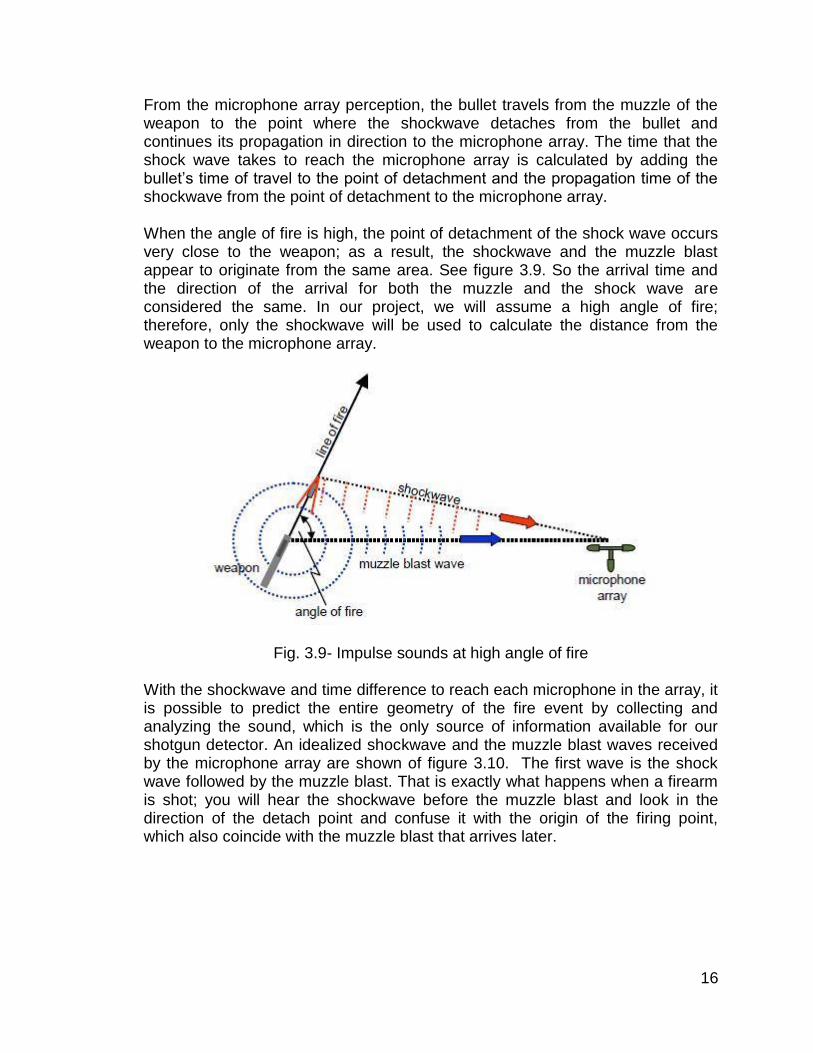
From the microphone array perception, the bullet travels from the muzzle of the weapon to the point where the shockwave detaches from the bullet and continues its propagation in direction to the microphone array. The time that the shock wave takes to reach the microphone array is calculated by adding the bullet’s time of travel to the point of detachment and the propagation time of the shockwave from the point of detachment to the microphone array. When the angle of fire is high, the point of detachment of the shock wave occurs very close to the weapon; as a result, the shockwave and the muzzle blast appear to originate from the same area. See figure 3.9. So the arrival time and the direction of the arrival for both the muzzle and the shock wave are considered the same. In our project, we will assume a high angle of fire; therefore, only the shockwave will be used to calculate the distance from the weapon to the microphone array.
Fig. 3.9- Impulse sounds at high angle of fire
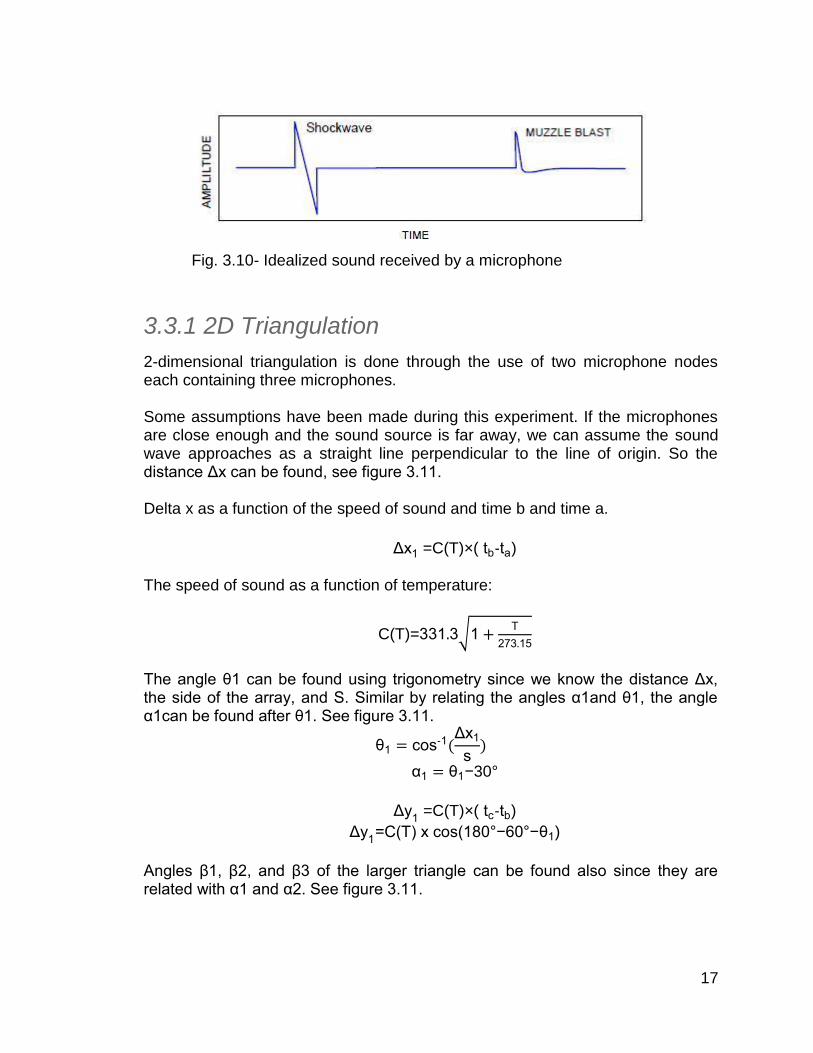
With the shockwave and time difference to reach each microphone in the array, it is possible to predict the entire geometry of the fire event by collecting and analyzing the sound, which is the only source of information available for our shotgun detector. An idealized shockwave and the muzzle blast waves received by the microphone array are shown of figure 3.10. The first wave is the shock wave followed by the muzzle blast. That is exactly what happens when a firearm is shot; you will hear the shockwave before the muzzle blast and look in the direction of the detach point and confuse it with the origin of the firing point, which also coincide with the muzzle blast that arrives later.
17
Fig. 3.10- Idealized sound received by a microphone
3.3.1 2D Triangulation
2-dimensional triangulation is done through the use of two microphone nodes each containing three microphones.
Some assumptions have been made during this experiment. If the microphones are close enough and the sound source is far away, we can assume the sound wave approaches as a straight line perpendicular to the line of origin. So the distance Δx can be found, see figure 3.11.
Delta x as a function of the speed of sound and time b and time a.
Δx1 =C(T)×( tb-ta)
The speed of sound as a function of temperature:
C(T)=331 3√1 T
273 15
The angle θ1 can be found using trigonometry since we know the distance Δx, the side of the array, and S. Similar by relating the angles α1and θ1, the angle α1can be found after θ1. See figure 3.11.
θ1 cos 1 Δx1
s
α1 θ1−30°
Δy1
=C(T)×( tc-tb)
Δy1
=C(T) x cos(180°−60°−θ1)
Angles β1, β2, and β3 of the larger triangle can be found also since they are related with α1 and α2. See figure 3.11.
18
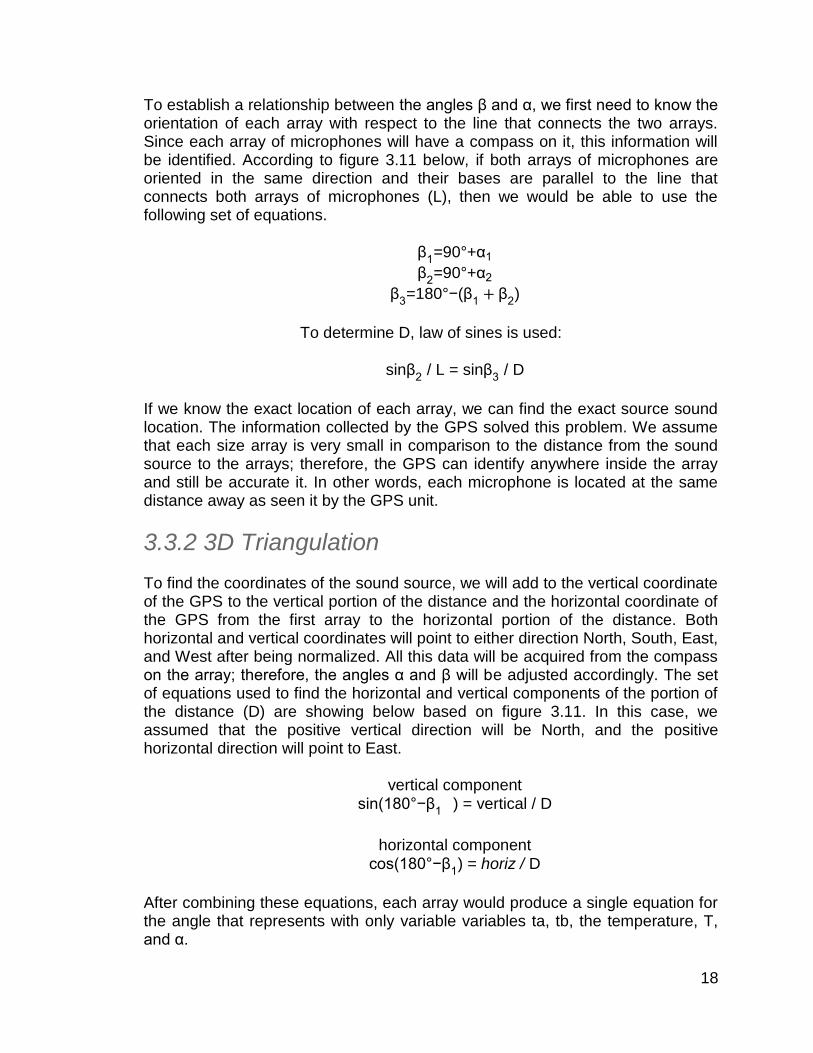
To establish a relationship between the angles β and α, we first need to know the orientation of each array with respect to the line that connects the two arrays. Since each array of microphones will have a compass on it, this information will be identified. According to figure 3.11 below, if both arrays of microphones are oriented in the same direction and their bases are parallel to the line that connects both arrays of microphones (L), then we would be able to use the following set of equations.
β1=90°+α1
β2=90°+α2
β3=180°−(β
1 β
2)
To determine D, law of sines is used:
sinβ
2 / L = sinβ
3 / D
If we know the exact location of each array, we can find the exact source sound location. The information collected by the GPS solved this problem. We assume that each size array is very small in comparison to the distance from the sound source to the arrays; therefore, the GPS can identify anywhere inside the array and still be accurate it. In other words, each microphone is located at the same distance away as seen it by the GPS unit.
3.3.2 3D Triangulation
To find the coordinates of the sound source, we will add to the vertical coordinate of the GPS to the vertical portion of the distance and the horizontal coordinate of the GPS from the first array to the horizontal portion of the distance. Both horizontal and vertical coordinates will point to either direction North, South, East, and West after being normalized. All this data will be acquired from the compass on the array; therefore, the angles α and β will be adjusted accordingly. The set of equations used to find the horizontal and vertical components of the portion of the distance (D) are showing below based on figure 3.11. In this case, we assumed that the positive vertical direction will be North, and the positive horizontal direction will point to East.
vertical component sin(180°−β
1) = vertical / D
horizontal component
cos(180°−β1) = horiz / D
After combining these equations, each array would produce a single equation for the angle that represents with only variable variables ta, tb, the temperature, T, and α.
19
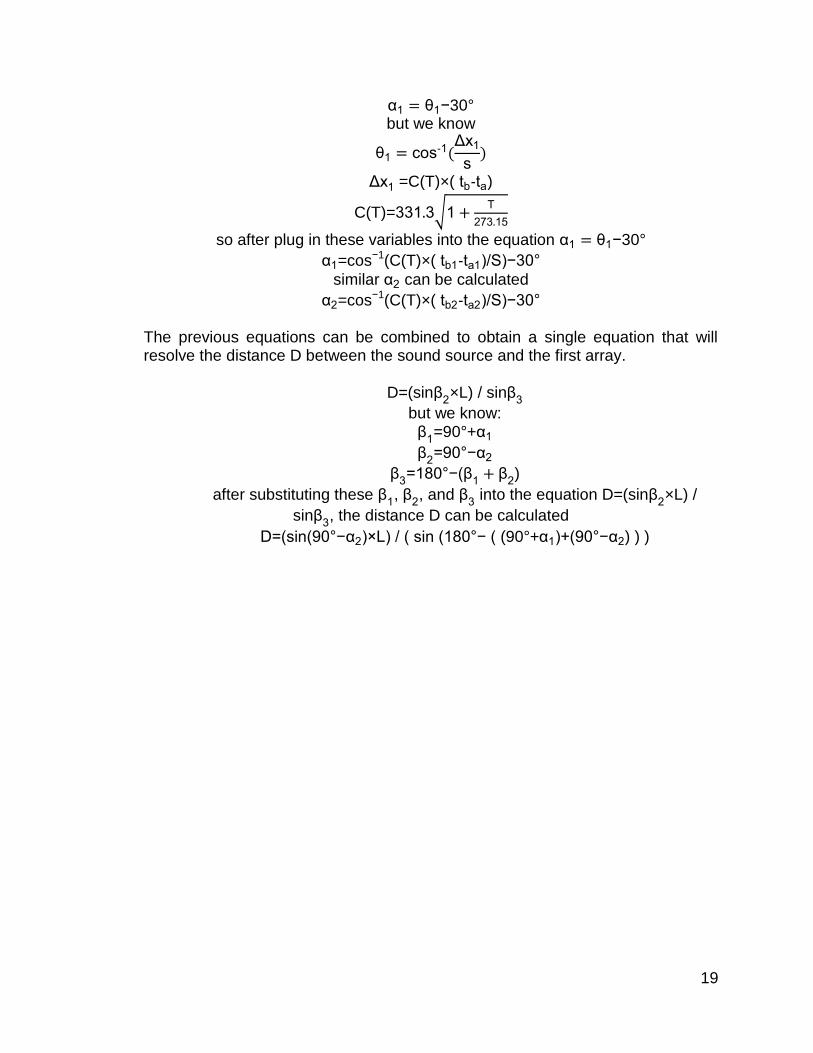
α1 θ1−30° but we know
θ1 cos 1 Δx1
s
Δx1 =C(T)×( tb-ta)
C(T)=331 3√1 T
273 15
so after plug in these variables into the equation α1 θ1−30°
α1=cos−1(C(T)×( tb1-ta1)/S)−30°
similar α2 can be calculated
α2=cos−1(C(T)×( tb2-ta2)/S)−30° The previous equations can be combined to obtain a single equation that will resolve the distance D between the sound source and the first array.
D=(sinβ2×L) / sinβ
3
but we know: β
1=90°+α1
β2
=90°−α2
β3
=180°−(β1 β
2)
after substituting these β1, β
2, and β
3 into the equation D=(sinβ
2×L) /
sinβ3, the distance D can be calculated
D=(sin(90°−α2)×L) / ( sin (180°− ( (90°+α1)+(90°−α2) ) )
20
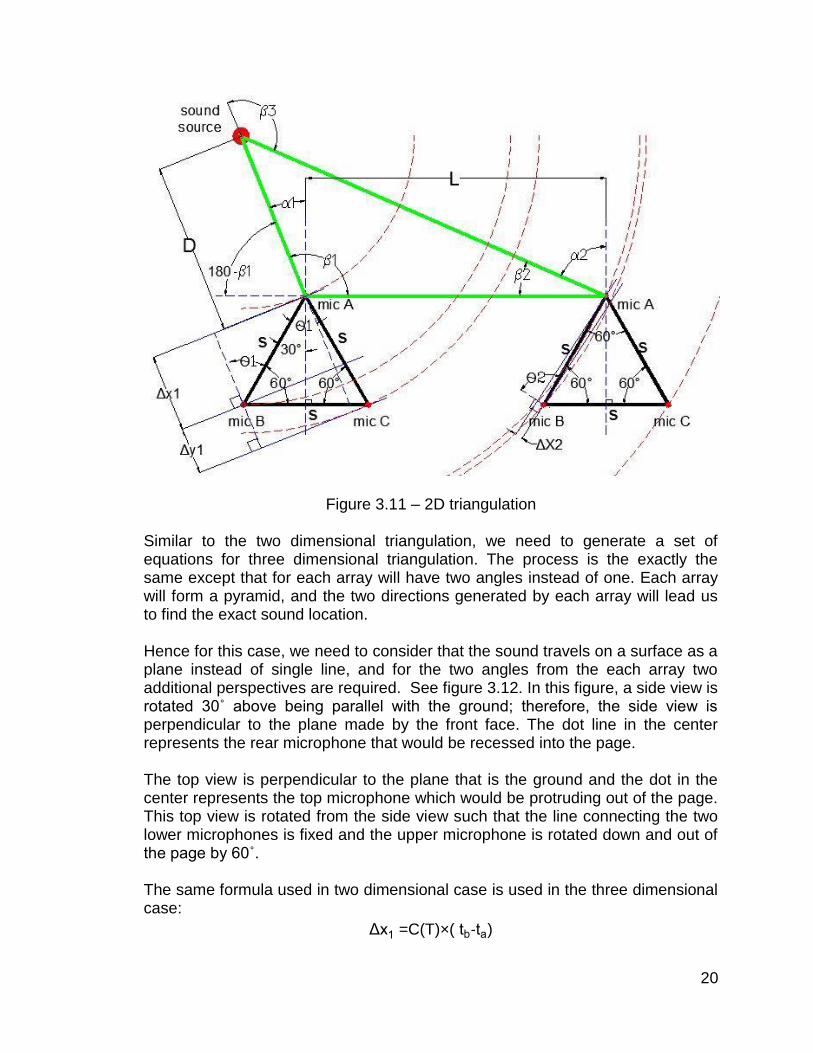
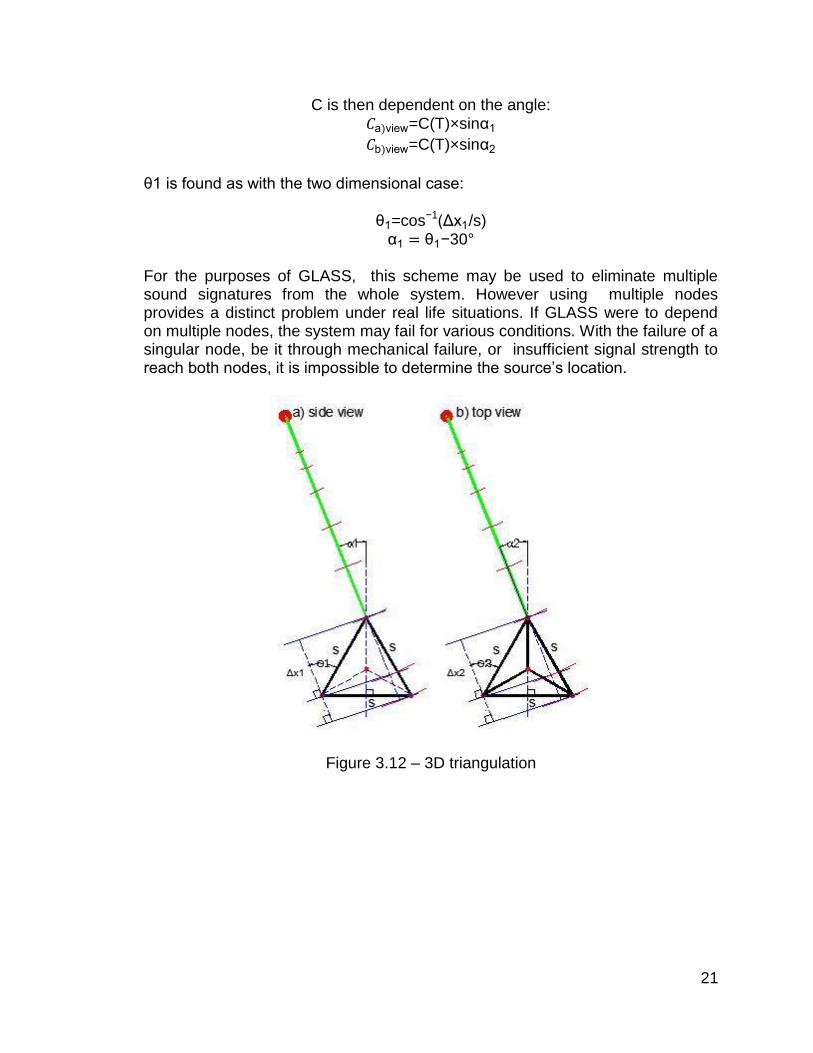
Figure 3.11 – 2D triangulation Similar to the two dimensional triangulation, we need to generate a set of equations for three dimensional triangulation. The process is the exactly the same except that for each array will have two angles instead of one. Each array will form a pyramid, and the two directions generated by each array will lead us to find the exact sound location. Hence for this case, we need to consider that the sound travels on a surface as a plane instead of single line, and for the two angles from the each array two additional perspectives are required. See figure 3.12. In this figure, a side view is rotated 30˚ above being parallel with the ground; therefore, the side view is perpendicular to the plane made by the front face. The dot line in the center represents the rear microphone that would be recessed into the page. The top view is perpendicular to the plane that is the ground and the dot in the center represents the top microphone which would be protruding out of the page. This top view is rotated from the side view such that the line connecting the two lower microphones is fixed and the upper microphone is rotated down and out of the page by 60˚. The same formula used in two dimensional case is used in the three dimensional case:
Δx1 =C(T)×( tb-ta)
21
C is then dependent on the angle: a view=C(T)×sinα1
b view=C(T)×sinα2
θ1 is found as with the two dimensional case:
θ1=cos−1(Δx1/s) α1 θ1−30°
For the purposes of GLASS, this scheme may be used to eliminate multiple sound signatures from the whole system. However using multiple nodes provides a distinct problem under real life situations. If GLASS were to depend on multiple nodes, the system may fail for various conditions. With the failure of a singular node, be it through mechanical failure, or insufficient signal strength to reach both nodes, it is impossible to determine the source’s location.
Figure 3.12 – 3D triangulation
22
3.4 Signal Reproduction
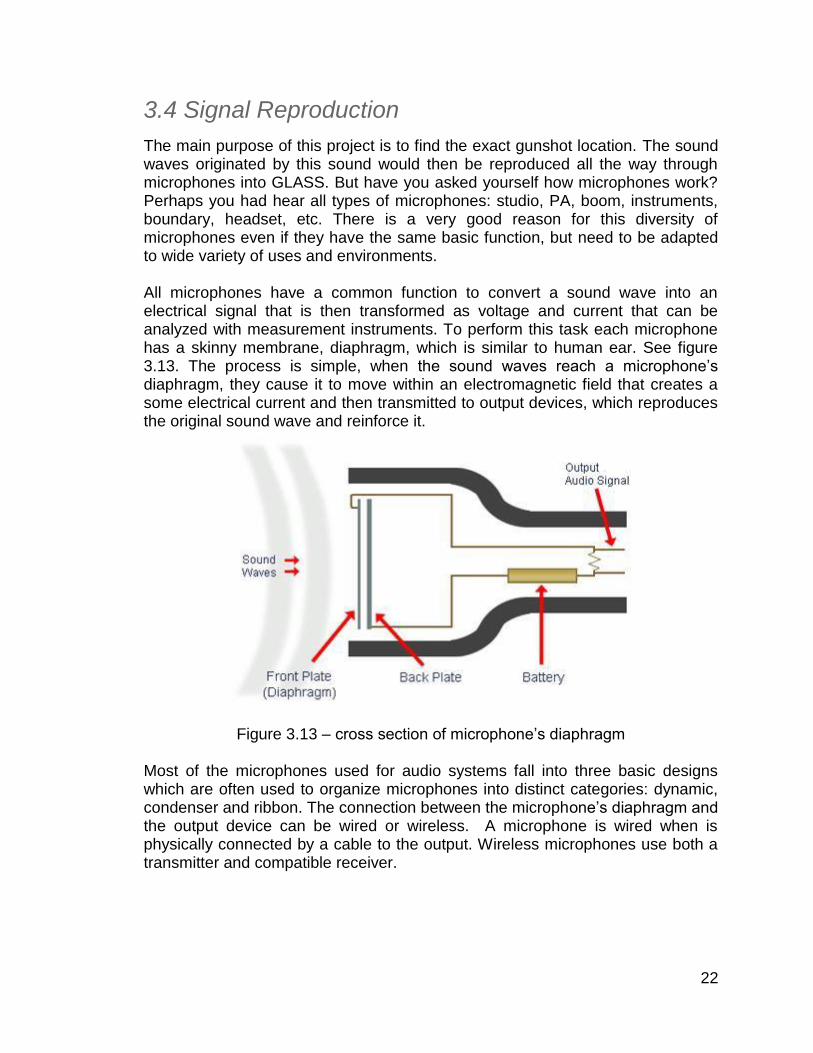
The main purpose of this project is to find the exact gunshot location. The sound waves originated by this sound would then be reproduced all the way through microphones into GLASS. But have you asked yourself how microphones work? Perhaps you had hear all types of microphones: studio, PA, boom, instruments, boundary, headset, etc. There is a very good reason for this diversity of microphones even if they have the same basic function, but need to be adapted to wide variety of uses and environments. All microphones have a common function to convert a sound wave into an electrical signal that is then transformed as voltage and current that can be analyzed with measurement instruments. To perform this task each microphone has a skinny membrane, diaphragm, which is similar to human ear. See figure 3.13. The process is simple, when the sound waves reach a microphone’s diaphragm, they cause it to move within an electromagnetic field that creates a some electrical current and then transmitted to output devices, which reproduces the original sound wave and reinforce it.
Figure 3.13 – cross section of microphone’s diaphragm Most of the microphones used for audio systems fall into three basic designs which are often used to organize microphones into distinct categories: dynamic, condenser and ribbon. The connection between the microphone’s diaphragm and the output device can be wired or wireless. A microphone is wired when is physically connected by a cable to the output. Wireless microphones use both a transmitter and compatible receiver.
23
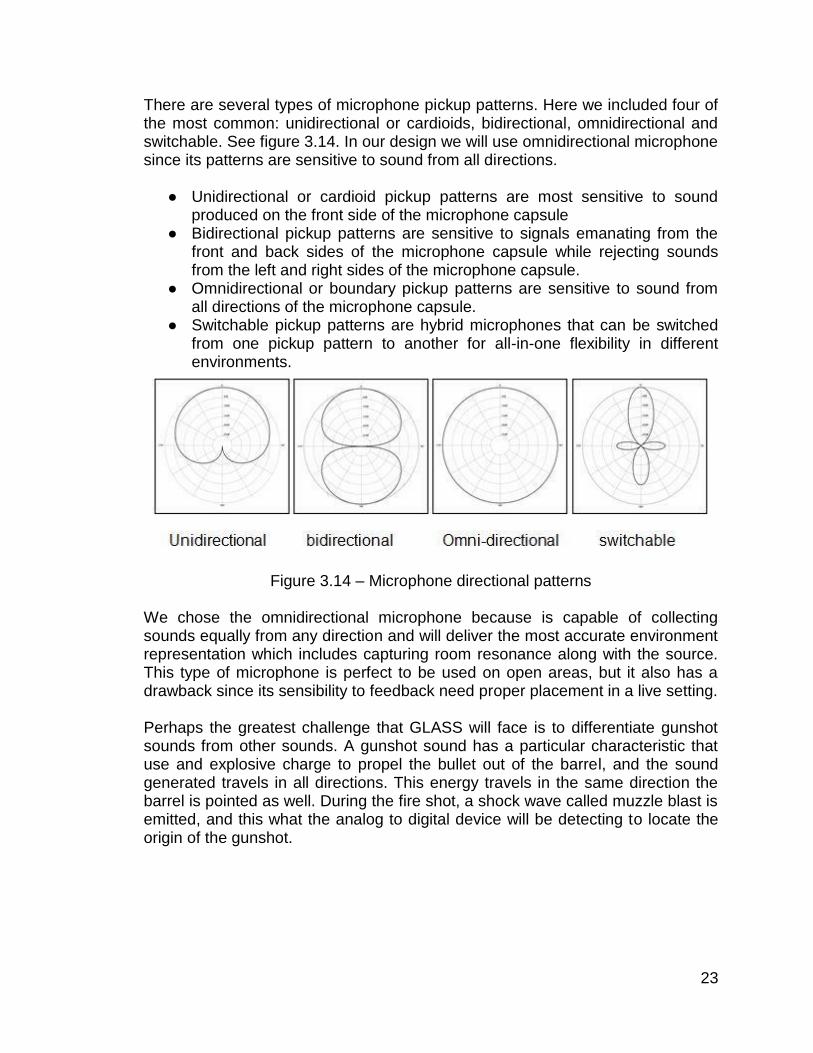
There are several types of microphone pickup patterns. Here we included four of the most common: unidirectional or cardioids, bidirectional, omnidirectional and switchable. See figure 3.14. In our design we will use omnidirectional microphone since its patterns are sensitive to sound from all directions.
● Unidirectional or cardioid pickup patterns are most sensitive to sound produced on the front side of the microphone capsule
● Bidirectional pickup patterns are sensitive to signals emanating from the front and back sides of the microphone capsule while rejecting sounds from the left and right sides of the microphone capsule.
● Omnidirectional or boundary pickup patterns are sensitive to sound from all directions of the microphone capsule.
● Switchable pickup patterns are hybrid microphones that can be switched from one pickup pattern to another for all-in-one flexibility in different environments.
Figure 3.14 – Microphone directional patterns We chose the omnidirectional microphone because is capable of collecting sounds equally from any direction and will deliver the most accurate environment representation which includes capturing room resonance along with the source. This type of microphone is perfect to be used on open areas, but it also has a drawback since its sensibility to feedback need proper placement in a live setting. Perhaps the greatest challenge that GLASS will face is to differentiate gunshot sounds from other sounds. A gunshot sound has a particular characteristic that use and explosive charge to propel the bullet out of the barrel, and the sound generated travels in all directions. This energy travels in the same direction the barrel is pointed as well. During the fire shot, a shock wave called muzzle blast is emitted, and this what the analog to digital device will be detecting to locate the origin of the gunshot.

24
3.5 Gunshot Acoustic Properties
To build sensing algorithms that can detect a gunshot by sound, the nature of gunshots must first be understood. A gunshot has a few properties that make it a unique sound. For one, gunshots are extremely loud; there is seldom a gun (even small caliber guns) that has a noise level less than 130 dB. This loud “bang” is the noise associated with the actual combustion of the propellant within the firearm’s cartridge. Essentially an explosion occurs within the firing chamber of the gun producing this loud noise. A secondary noise is created after the firearm discharge in which the bullet travel produces a sonic “crack” that is due to the fast rate of travel of the actual projectile. In this section some time and frequency analysis is done on a few audio samples of gunshots in order to explore the acoustic qualities of various types of firearms. The first firearm sound sample examined is a Ruger LCR:
Ruger LCR
Firearm Type Revolver
Caliber .38 Special
Barrel Length 1.875”
Construction Materials Polymer fire control, aluminum frame, steel cylinder
Figure 3.15 - Ruger LCR .38 Special
The audio sample was taken in an open area but with a large hill at the end of the shooting area as a backstop. The sample contains the recording of one single discharge of the Ruger LCR. Of note is that revolvers are notorious for the loud gunshots due to there being a gap between the cylinder in which the cartridge is contained and the actual frame of the gun, as opposed to traditional pistols in which the “breech” of the firearm is all enclosed form the environment. As such in the time domain signal of the gunshot an increase in amplitude can be
25
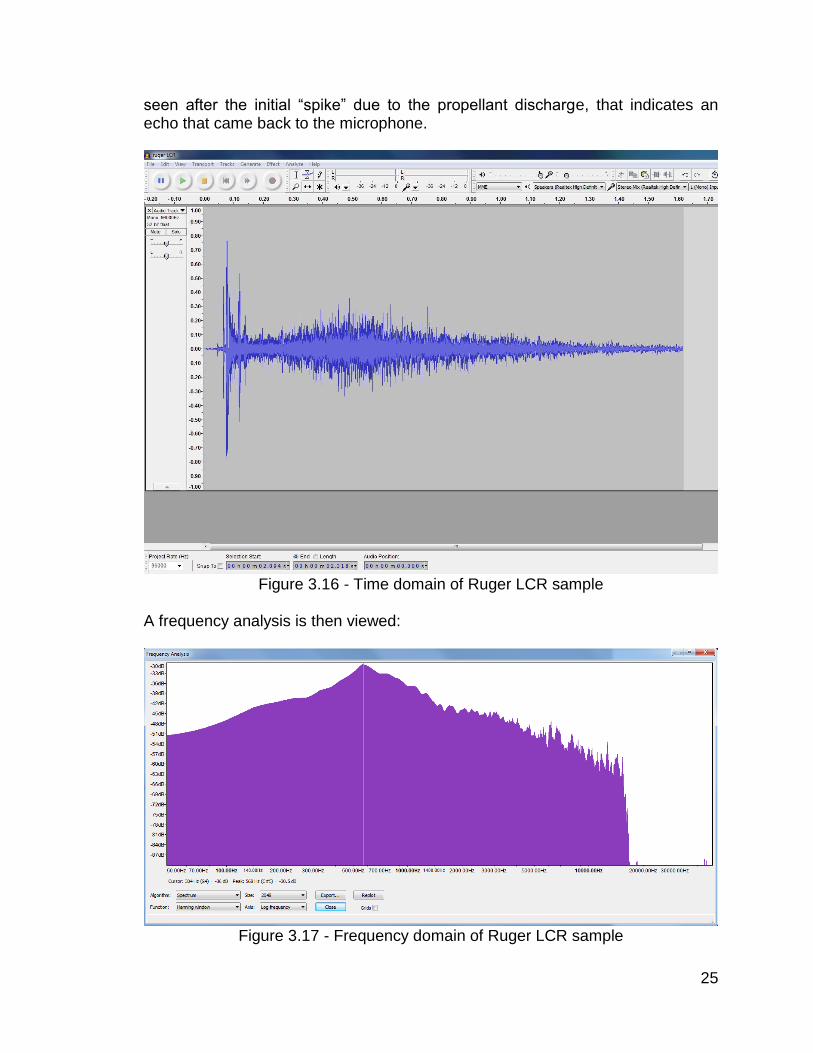
seen after the initial “spike” due to the propellant discharge, that indicates an echo that came back to the microphone.
Figure 3.16 - Time domain of Ruger LCR sample
A frequency analysis is then viewed:
Figure 3.17 - Frequency domain of Ruger LCR sample
26
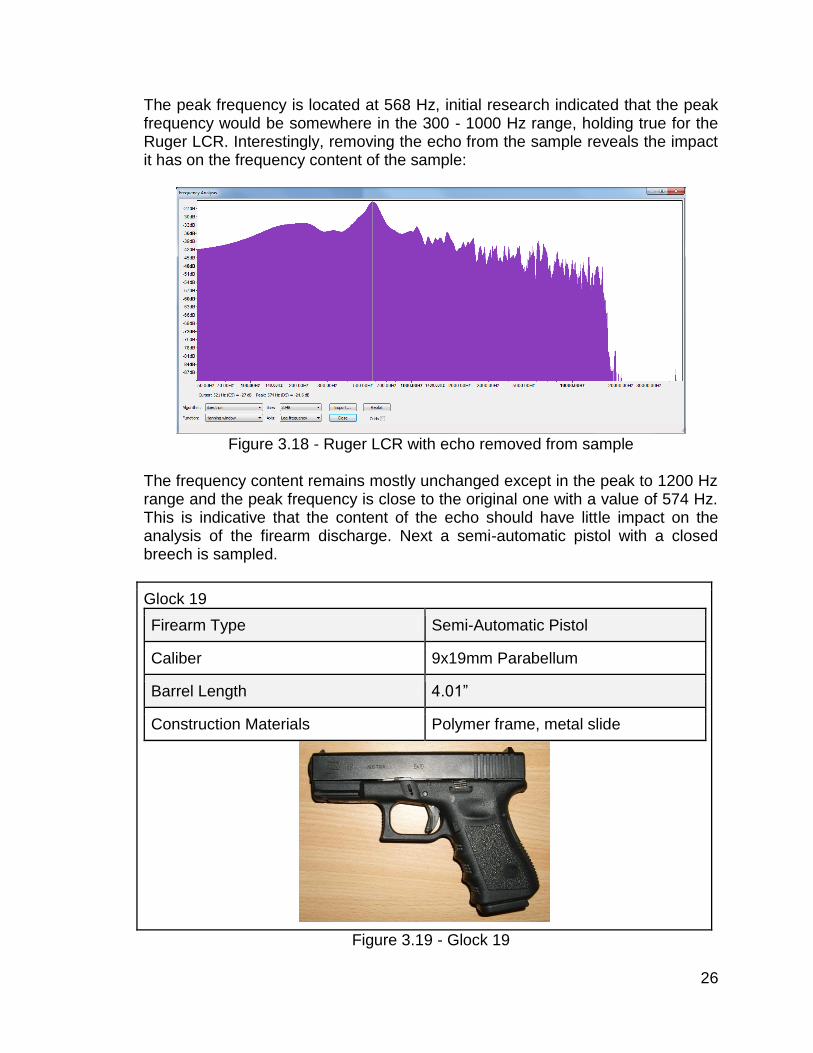
The peak frequency is located at 568 Hz, initial research indicated that the peak frequency would be somewhere in the 300 - 1000 Hz range, holding true for the Ruger LCR. Interestingly, removing the echo from the sample reveals the impact it has on the frequency content of the sample:
Figure 3.18 - Ruger LCR with echo removed from sample
The frequency content remains mostly unchanged except in the peak to 1200 Hz range and the peak frequency is close to the original one with a value of 574 Hz. This is indicative that the content of the echo should have little impact on the analysis of the firearm discharge. Next a semi-automatic pistol with a closed breech is sampled.
Glock 19
Firearm Type Semi-Automatic Pistol
Caliber 9x19mm Parabellum
Barrel Length 4.01”
Construction Materials Polymer frame, metal slide
Figure 3.19 - Glock 19
27
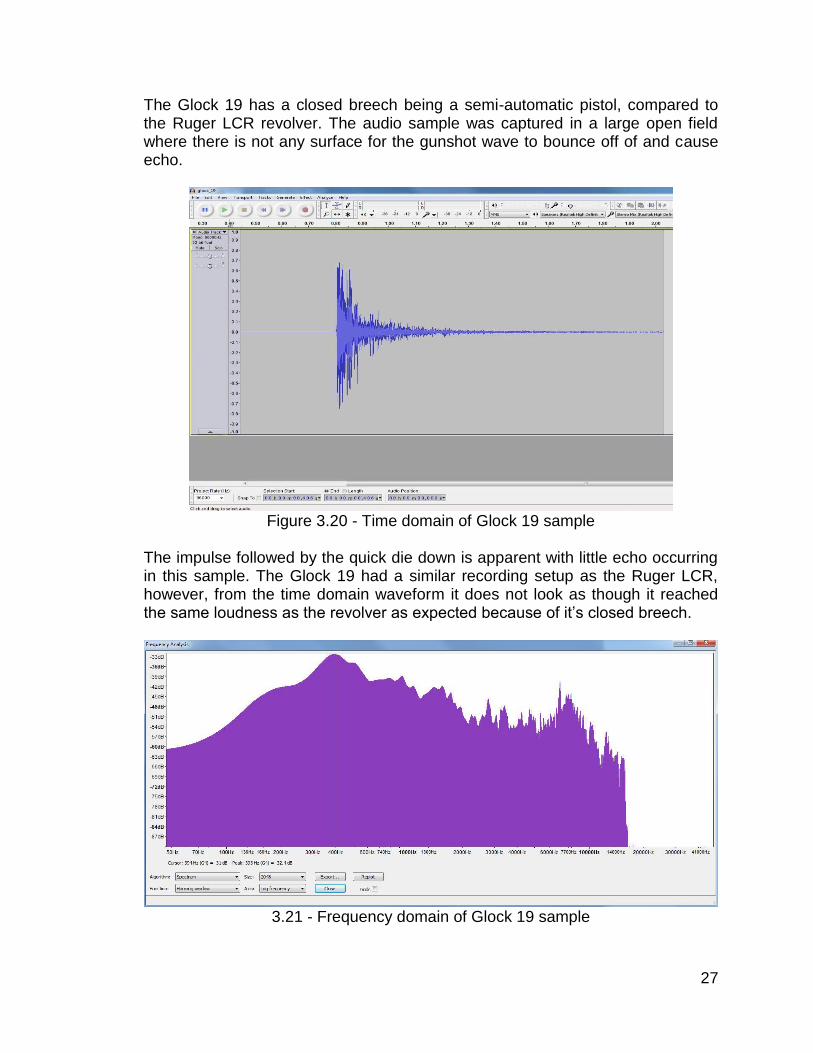
The Glock 19 has a closed breech being a semi-automatic pistol, compared to the Ruger LCR revolver. The audio sample was captured in a large open field where there is not any surface for the gunshot wave to bounce off of and cause echo.
Figure 3.20 - Time domain of Glock 19 sample
The impulse followed by the quick die down is apparent with little echo occurring in this sample. The Glock 19 had a similar recording setup as the Ruger LCR, however, from the time domain waveform it does not look as though it reached the same loudness as the revolver as expected because of it’s closed breech.
3.21 - Frequency domain of Glock 19 sample
28
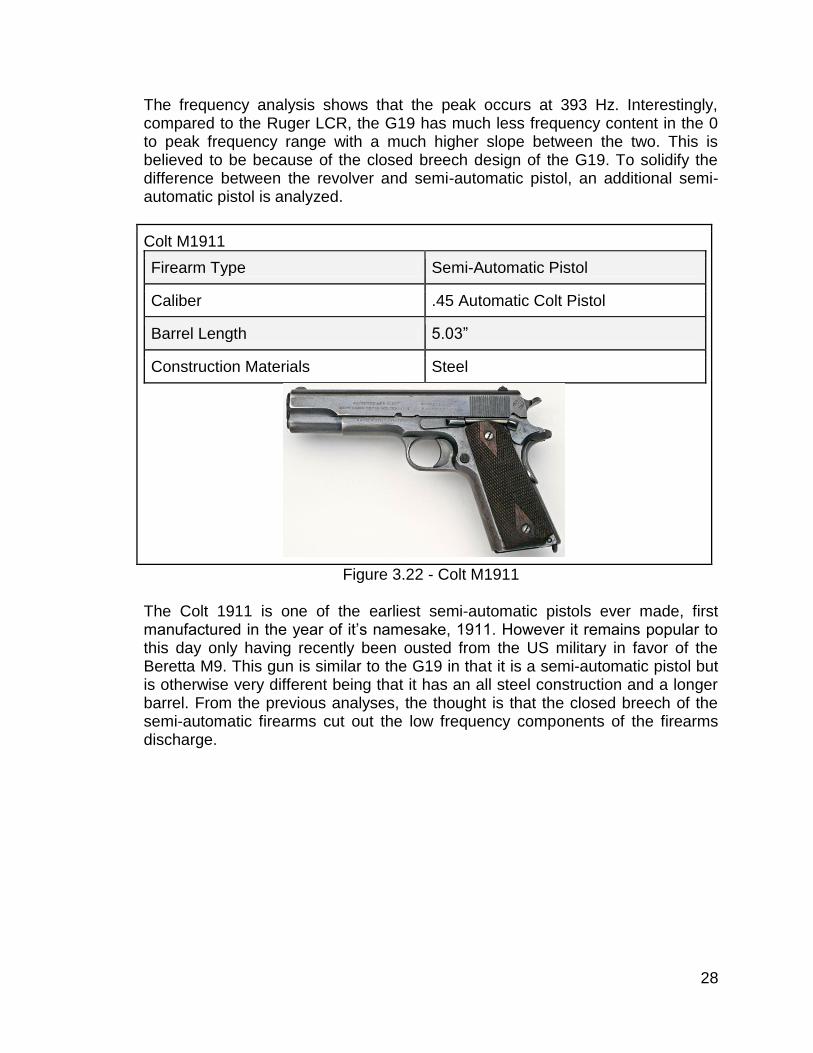
The frequency analysis shows that the peak occurs at 393 Hz. Interestingly, compared to the Ruger LCR, the G19 has much less frequency content in the 0 to peak frequency range with a much higher slope between the two. This is believed to be because of the closed breech design of the G19. To solidify the difference between the revolver and semi-automatic pistol, an additional semi-automatic pistol is analyzed.
Colt M1911
Firearm Type Semi-Automatic Pistol
Caliber .45 Automatic Colt Pistol
Barrel Length 5.03”
Construction Materials Steel
Figure 3.22 - Colt M1911 The Colt 1911 is one of the earliest semi-automatic pistols ever made, first manufactured in the year of it’s namesake, 1911. However it remains popular to this day only having recently been ousted from the US military in favor of the Beretta M9. This gun is similar to the G19 in that it is a semi-automatic pistol but is otherwise very different being that it has an all steel construction and a longer barrel. From the previous analyses, the thought is that the closed breech of the semi-automatic firearms cut out the low frequency components of the firearms discharge.
29
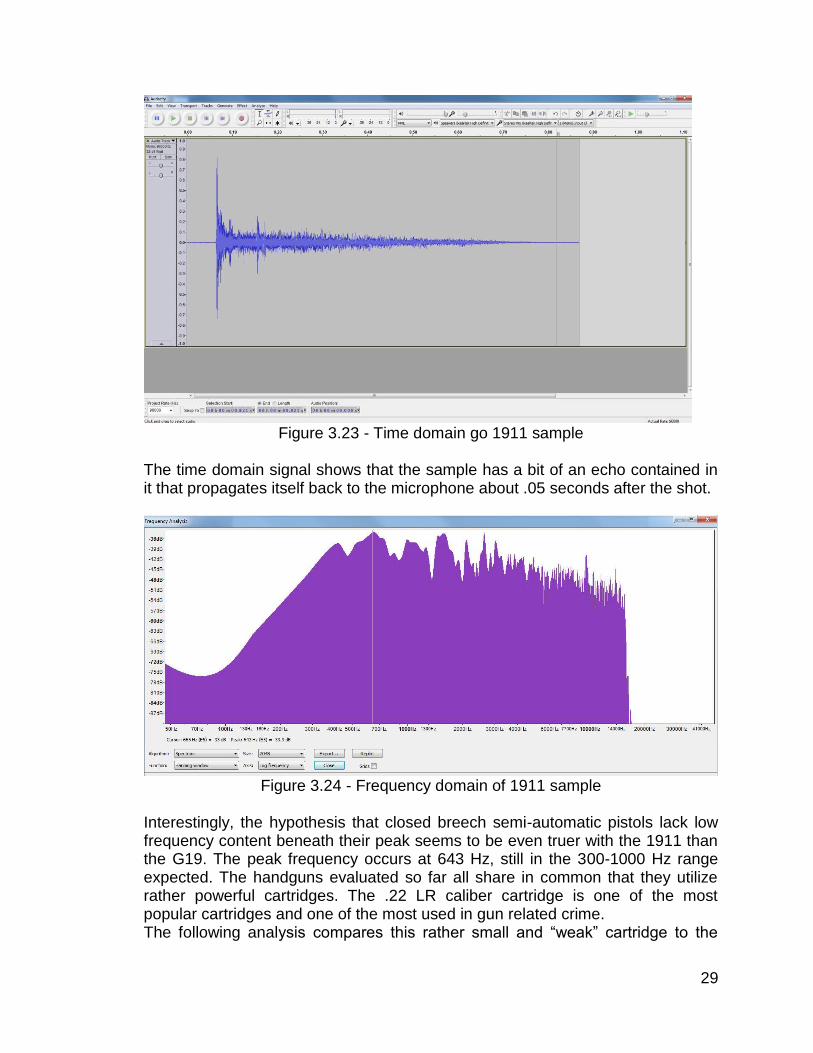
Figure 3.23 - Time domain go 1911 sample
The time domain signal shows that the sample has a bit of an echo contained in it that propagates itself back to the microphone about .05 seconds after the shot.
Figure 3.24 - Frequency domain of 1911 sample
Interestingly, the hypothesis that closed breech semi-automatic pistols lack low frequency content beneath their peak seems to be even truer with the 1911 than the G19. The peak frequency occurs at 643 Hz, still in the 300-1000 Hz range expected. The handguns evaluated so far all share in common that they utilize rather powerful cartridges. The .22 LR caliber cartridge is one of the most popular cartridges and one of the most used in gun related crime. The following analysis compares this rather small and “weak” cartridge to the
30
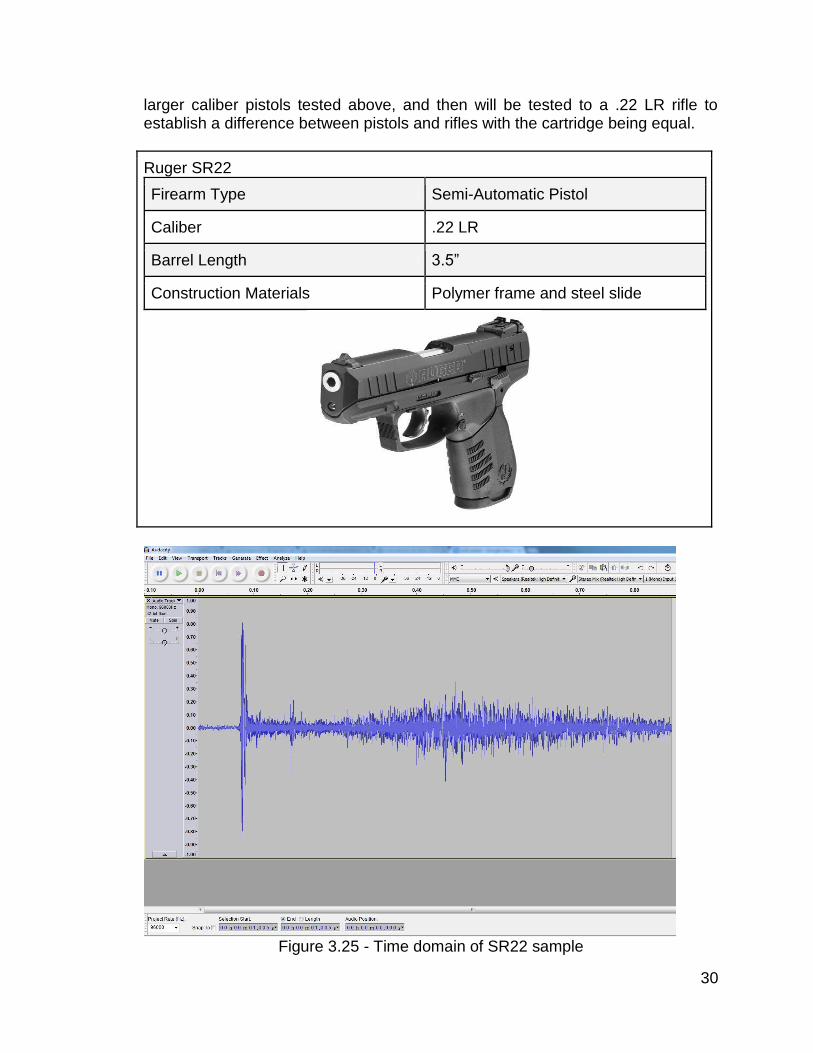
larger caliber pistols tested above, and then will be tested to a .22 LR rifle to establish a difference between pistols and rifles with the cartridge being equal.
Ruger SR22
Firearm Type Semi-Automatic Pistol
Caliber .22 LR
Barrel Length 3.5”
Construction Materials Polymer frame and steel slide
Figure 3.25 - Time domain of SR22 sample
31
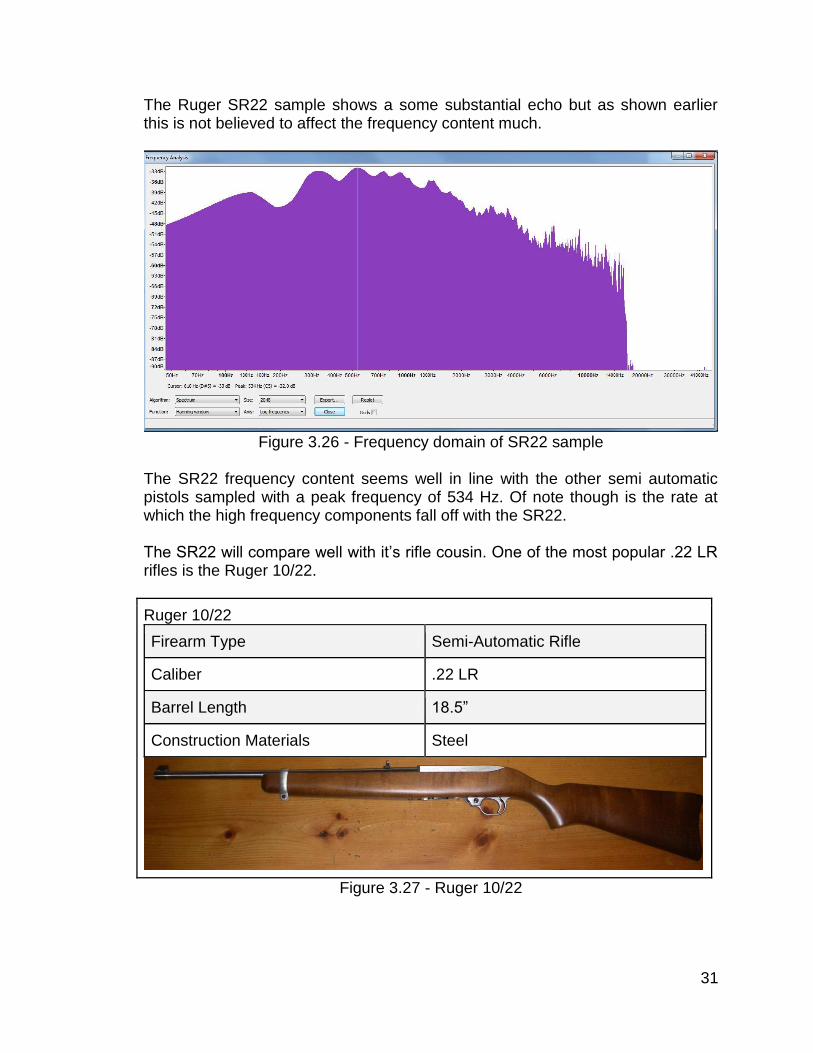
The Ruger SR22 sample shows a some substantial echo but as shown earlier this is not believed to affect the frequency content much.
Figure 3.26 - Frequency domain of SR22 sample
The SR22 frequency content seems well in line with the other semi automatic pistols sampled with a peak frequency of 534 Hz. Of note though is the rate at which the high frequency components fall off with the SR22. The SR22 will compare well with it’s rifle cousin. One of the most popular .22 LR rifles is the Ruger 10/22.
Ruger 10/22
Firearm Type Semi-Automatic Rifle
Caliber .22 LR
Barrel Length 18.5”
Construction Materials Steel
Figure 3.27 - Ruger 10/22
32
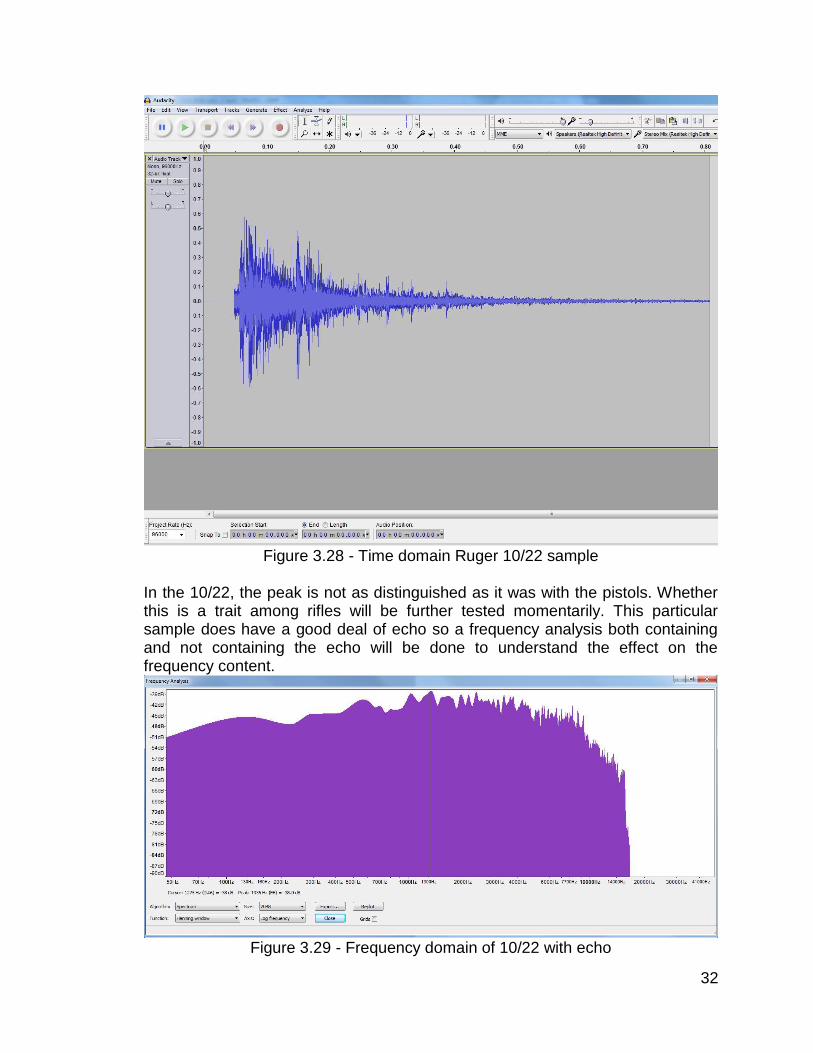
Figure 3.28 - Time domain Ruger 10/22 sample
In the 10/22, the peak is not as distinguished as it was with the pistols. Whether this is a trait among rifles will be further tested momentarily. This particular sample does have a good deal of echo so a frequency analysis both containing and not containing the echo will be done to understand the effect on the frequency content.
Figure 3.29 - Frequency domain of 10/22 with echo
33
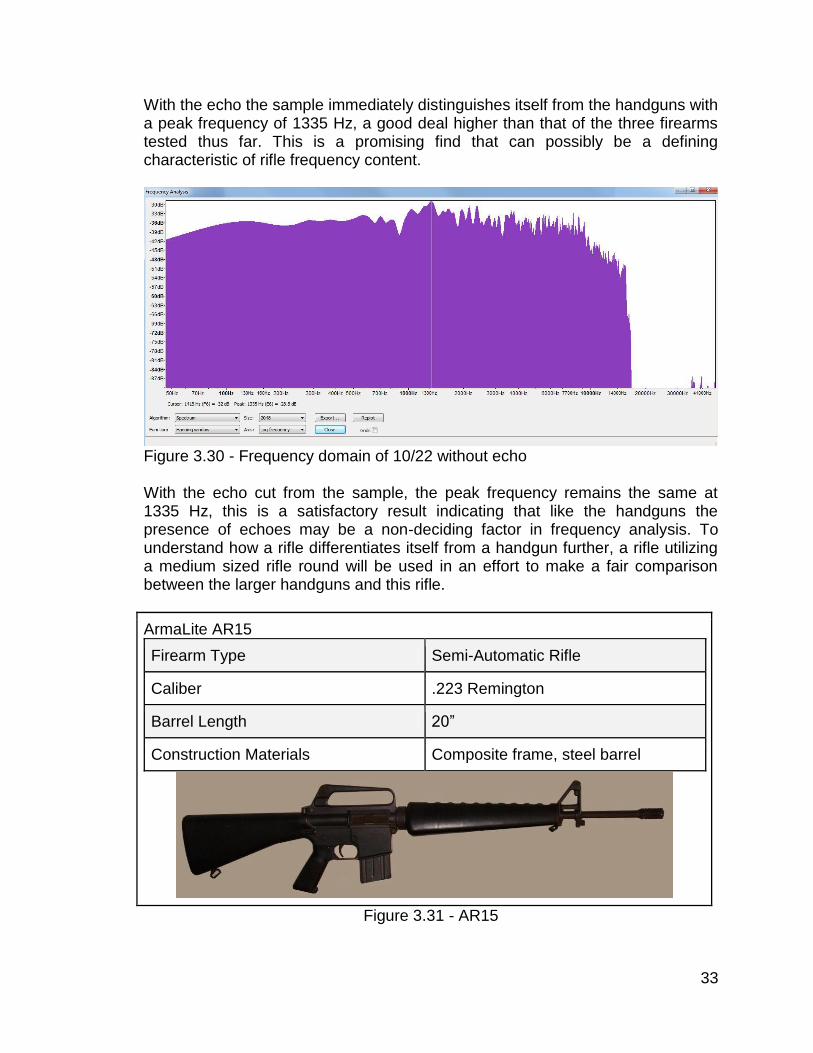
With the echo the sample immediately distinguishes itself from the handguns with a peak frequency of 1335 Hz, a good deal higher than that of the three firearms tested thus far. This is a promising find that can possibly be a defining characteristic of rifle frequency content.
Figure 3.30 - Frequency domain of 10/22 without echo With the echo cut from the sample, the peak frequency remains the same at 1335 Hz, this is a satisfactory result indicating that like the handguns the presence of echoes may be a non-deciding factor in frequency analysis. To understand how a rifle differentiates itself from a handgun further, a rifle utilizing a medium sized rifle round will be used in an effort to make a fair comparison between the larger handguns and this rifle.
ArmaLite AR15
Firearm Type Semi-Automatic Rifle
Caliber .223 Remington
Barrel Length 20”
Construction Materials Composite frame, steel barrel
Figure 3.31 - AR15
34
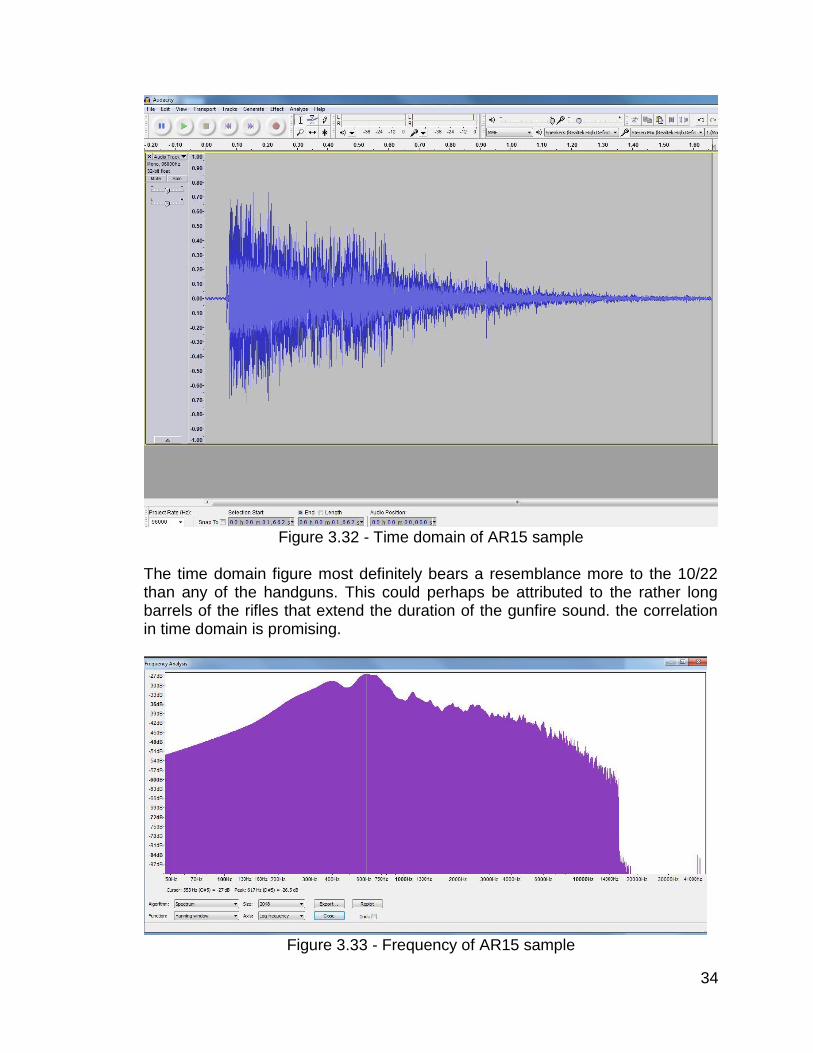
Figure 3.32 - Time domain of AR15 sample
The time domain figure most definitely bears a resemblance more to the 10/22 than any of the handguns. This could perhaps be attributed to the rather long barrels of the rifles that extend the duration of the gunfire sound. the correlation in time domain is promising.
Figure 3.33 - Frequency of AR15 sample
35
The frequency analysis however does not bear the similarities hoped for. Like the handguns, the peak frequency is in the first 1 KHz band at 617 Hz. The frequency content of this sample shows quite a similarity to the handguns tested earlier. Given that the cartridges of the AR15 are not too far in size from the handguns tested, naturally the next firearm to sample is a large caliber rifle.
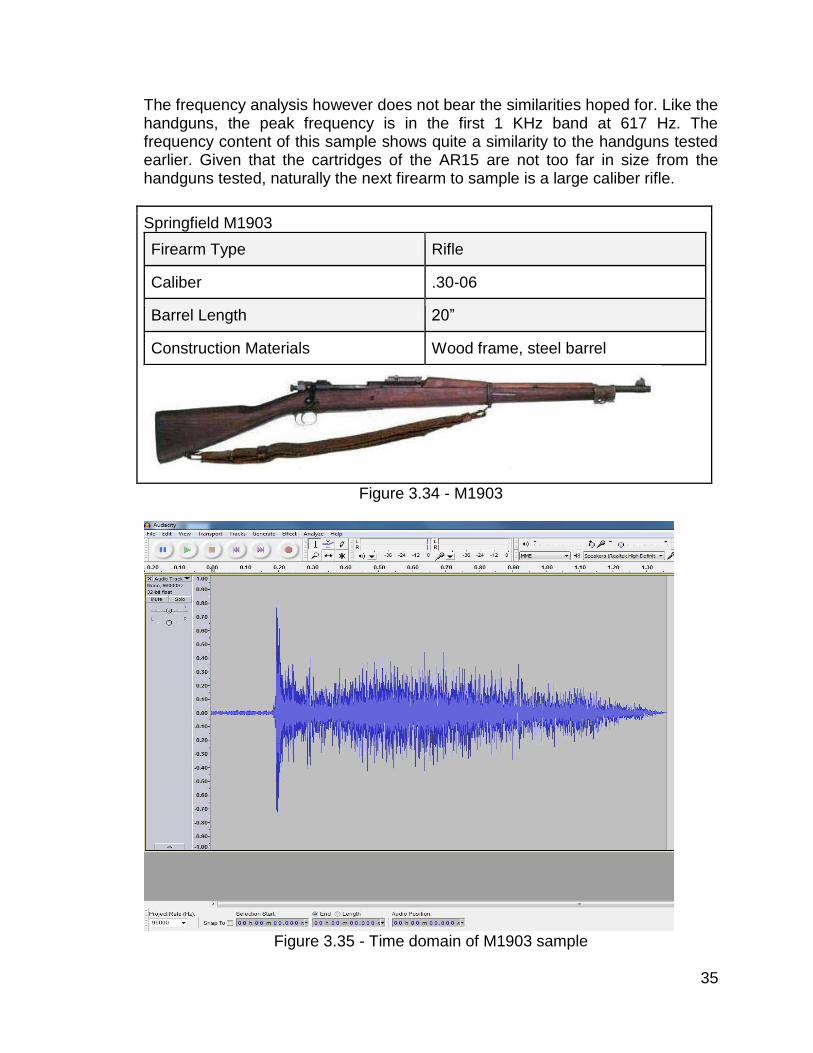
Springfield M1903
Firearm Type Rifle
Caliber .30-06
Barrel Length 20”
Construction Materials Wood frame, steel barrel
Figure 3.34 - M1903
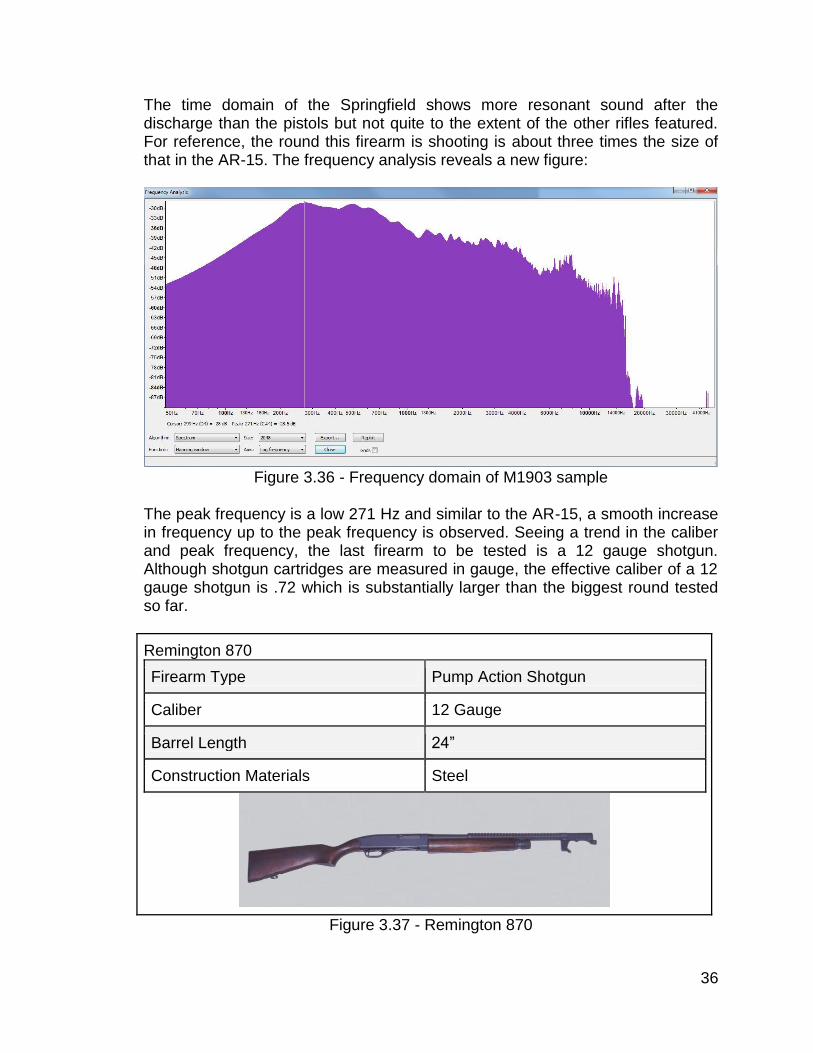
Figure 3.35 - Time domain of M1903 sample
36
The time domain of the Springfield shows more resonant sound after the discharge than the pistols but not quite to the extent of the other rifles featured. For reference, the round this firearm is shooting is about three times the size of that in the AR-15. The frequency analysis reveals a new figure:
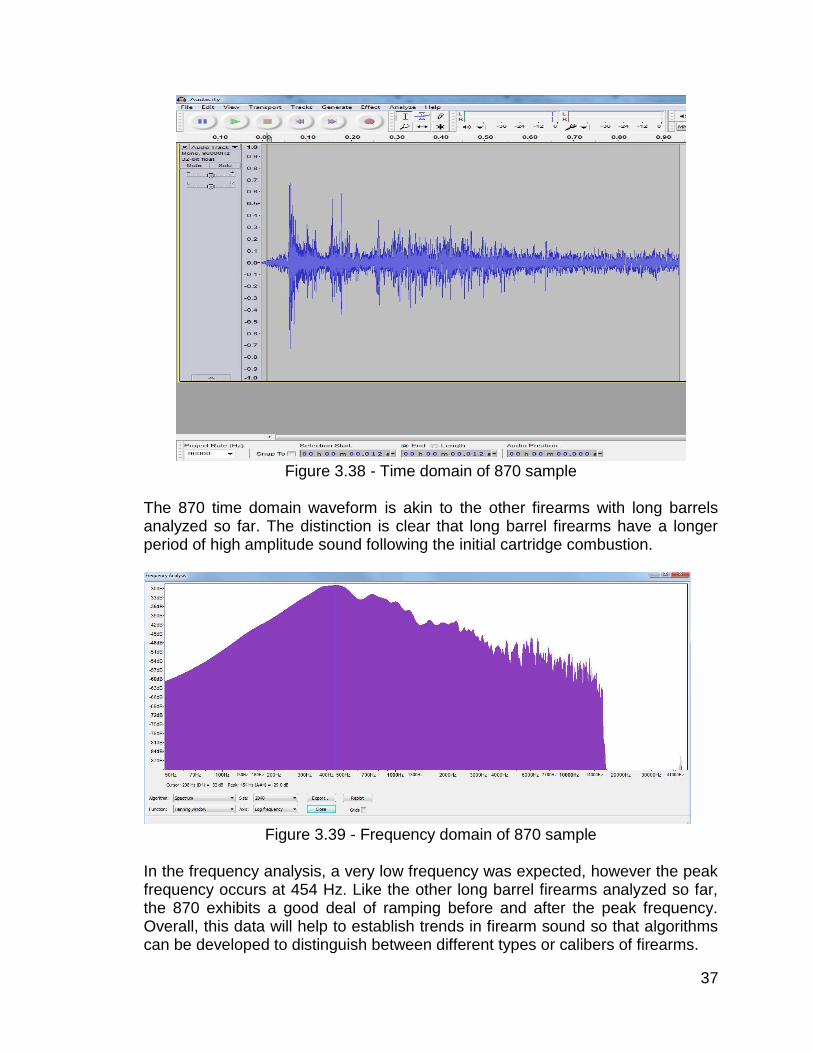
Figure 3.36 - Frequency domain of M1903 sample
The peak frequency is a low 271 Hz and similar to the AR-15, a smooth increase in frequency up to the peak frequency is observed. Seeing a trend in the caliber and peak frequency, the last firearm to be tested is a 12 gauge shotgun. Although shotgun cartridges are measured in gauge, the effective caliber of a 12 gauge shotgun is .72 which is substantially larger than the biggest round tested so far.
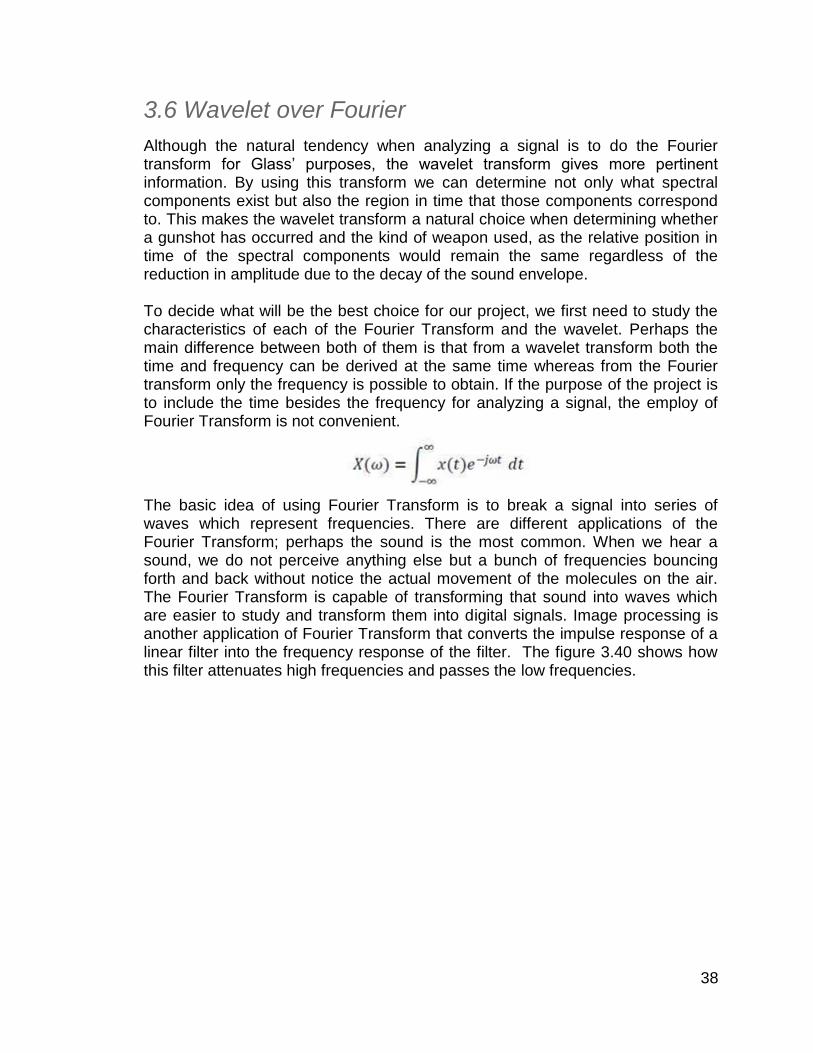
Remington 870
Firearm Type Pump Action Shotgun
Caliber 12 Gauge
Barrel Length 24”
Construction Materials Steel
Figure 3.37 - Remington 870
37
Figure 3.38 - Time domain of 870 sample
The 870 time domain waveform is akin to the other firearms with long barrels analyzed so far. The distinction is clear that long barrel firearms have a longer period of high amplitude sound following the initial cartridge combustion.
Figure 3.39 - Frequency domain of 870 sample
In the frequency analysis, a very low frequency was expected, however the peak frequency occurs at 454 Hz. Like the other long barrel firearms analyzed so far, the 870 exhibits a good deal of ramping before and after the peak frequency. Overall, this data will help to establish trends in firearm sound so that algorithms can be developed to distinguish between different types or calibers of firearms.
38
3.6 Wavelet over Fourier
Although the natural tendency when analyzing a signal is to do the Fourier transform for Glass’ purposes, the wavelet transform gives more pertinent information. By using this transform we can determine not only what spectral components exist but also the region in time that those components correspond to. This makes the wavelet transform a natural choice when determining whether a gunshot has occurred and the kind of weapon used, as the relative position in time of the spectral components would remain the same regardless of the reduction in amplitude due to the decay of the sound envelope. To decide what will be the best choice for our project, we first need to study the characteristics of each of the Fourier Transform and the wavelet. Perhaps the main difference between both of them is that from a wavelet transform both the time and frequency can be derived at the same time whereas from the Fourier transform only the frequency is possible to obtain. If the purpose of the project is to include the time besides the frequency for analyzing a signal, the employ of Fourier Transform is not convenient.
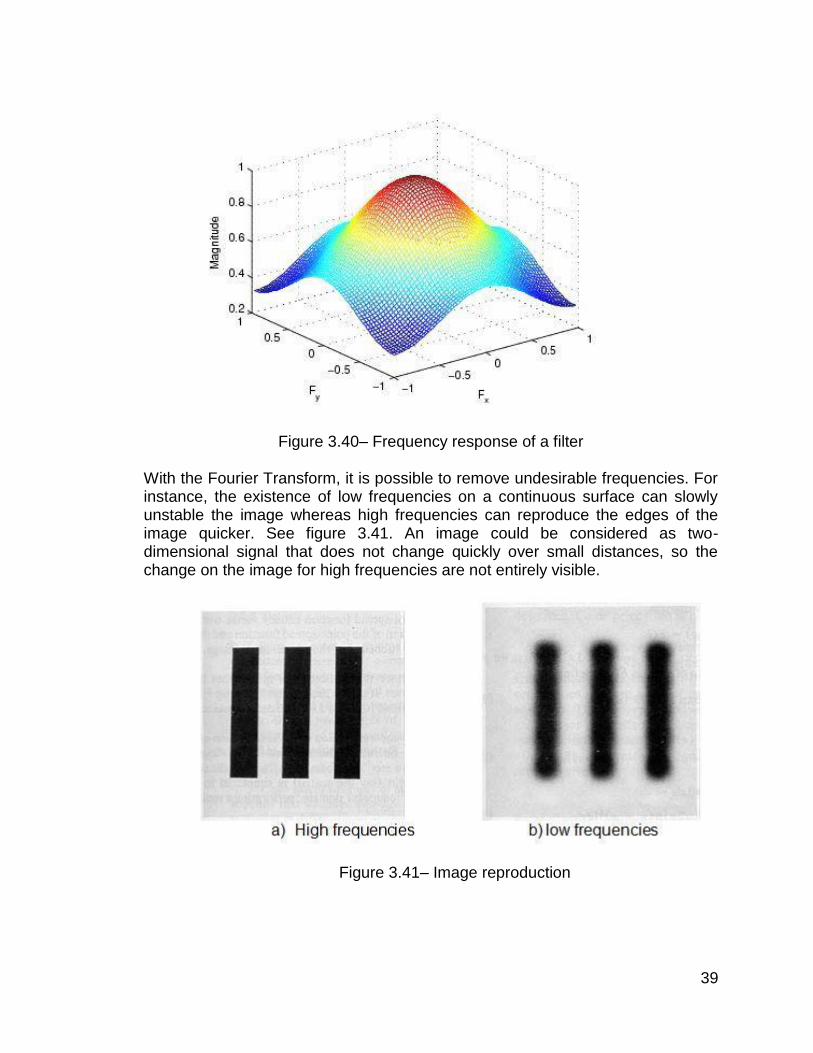
The basic idea of using Fourier Transform is to break a signal into series of waves which represent frequencies. There are different applications of the Fourier Transform; perhaps the sound is the most common. When we hear a sound, we do not perceive anything else but a bunch of frequencies bouncing forth and back without notice the actual movement of the molecules on the air. The Fourier Transform is capable of transforming that sound into waves which are easier to study and transform them into digital signals. Image processing is another application of Fourier Transform that converts the impulse response of a linear filter into the frequency response of the filter. The figure 3.40 shows how this filter attenuates high frequencies and passes the low frequencies.
39
Figure 3.40– Frequency response of a filter
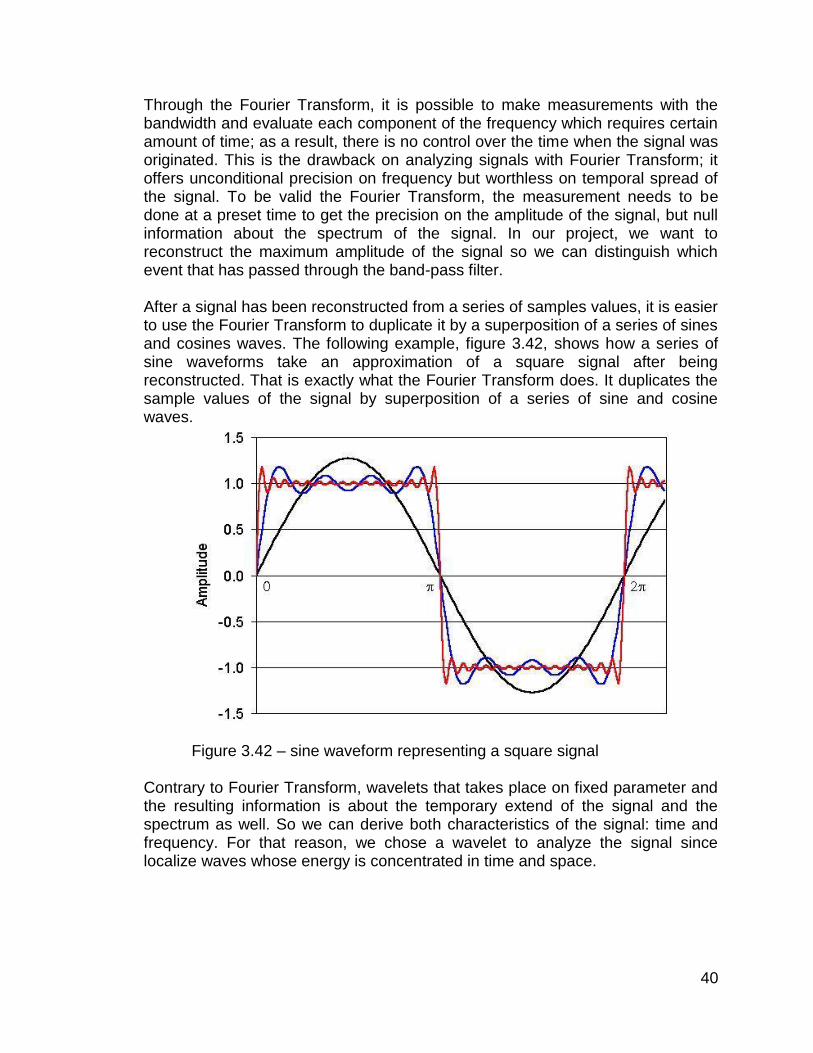
With the Fourier Transform, it is possible to remove undesirable frequencies. For instance, the existence of low frequencies on a continuous surface can slowly unstable the image whereas high frequencies can reproduce the edges of the image quicker. See figure 3.41. An image could be considered as two-dimensional signal that does not change quickly over small distances, so the change on the image for high frequencies are not entirely visible.
Figure 3.41– Image reproduction
40
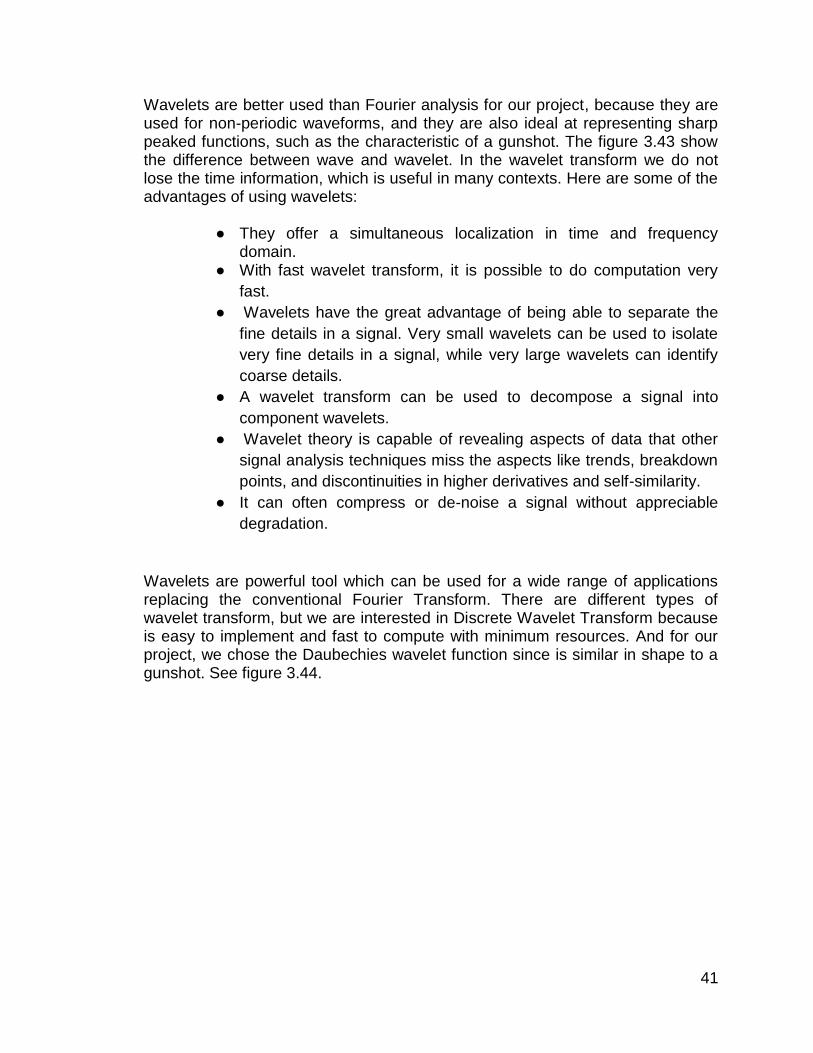
Through the Fourier Transform, it is possible to make measurements with the bandwidth and evaluate each component of the frequency which requires certain amount of time; as a result, there is no control over the time when the signal was originated. This is the drawback on analyzing signals with Fourier Transform; it offers unconditional precision on frequency but worthless on temporal spread of the signal. To be valid the Fourier Transform, the measurement needs to be done at a preset time to get the precision on the amplitude of the signal, but null information about the spectrum of the signal. In our project, we want to reconstruct the maximum amplitude of the signal so we can distinguish which event that has passed through the band-pass filter. After a signal has been reconstructed from a series of samples values, it is easier to use the Fourier Transform to duplicate it by a superposition of a series of sines and cosines waves. The following example, figure 3.42, shows how a series of sine waveforms take an approximation of a square signal after being reconstructed. That is exactly what the Fourier Transform does. It duplicates the sample values of the signal by superposition of a series of sine and cosine waves.
Figure 3.42 – sine waveform representing a square signal
Contrary to Fourier Transform, wavelets that takes place on fixed parameter and the resulting information is about the temporary extend of the signal and the spectrum as well. So we can derive both characteristics of the signal: time and frequency. For that reason, we chose a wavelet to analyze the signal since localize waves whose energy is concentrated in time and space.
41
Wavelets are better used than Fourier analysis for our project, because they are used for non-periodic waveforms, and they are also ideal at representing sharp peaked functions, such as the characteristic of a gunshot. The figure 3.43 show the difference between wave and wavelet. In the wavelet transform we do not lose the time information, which is useful in many contexts. Here are some of the advantages of using wavelets:
● They offer a simultaneous localization in time and frequency domain.
● With fast wavelet transform, it is possible to do computation very
fast.
● Wavelets have the great advantage of being able to separate the
fine details in a signal. Very small wavelets can be used to isolate
very fine details in a signal, while very large wavelets can identify
coarse details.
● A wavelet transform can be used to decompose a signal into
component wavelets.
● Wavelet theory is capable of revealing aspects of data that other
signal analysis techniques miss the aspects like trends, breakdown
points, and discontinuities in higher derivatives and self-similarity.
● It can often compress or de-noise a signal without appreciable
degradation.
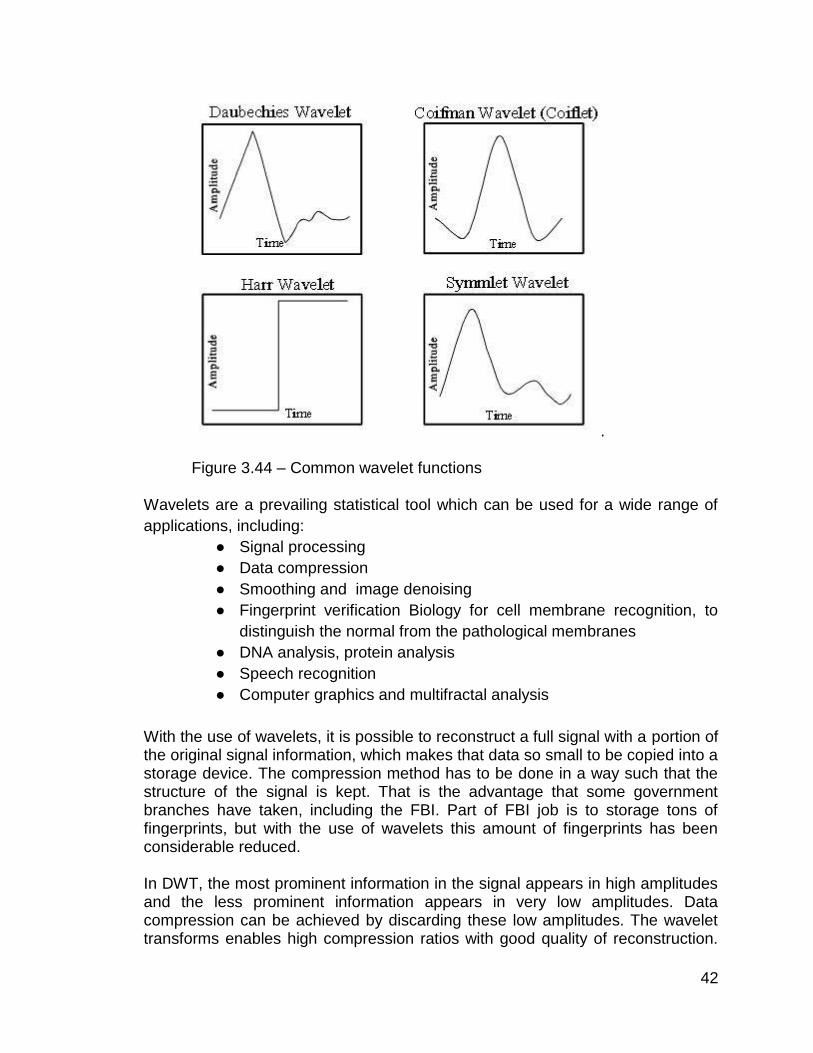
Wavelets are powerful tool which can be used for a wide range of applications replacing the conventional Fourier Transform. There are different types of wavelet transform, but we are interested in Discrete Wavelet Transform because is easy to implement and fast to compute with minimum resources. And for our project, we chose the Daubechies wavelet function since is similar in shape to a gunshot. See figure 3.44.
42
. Figure 3.44 – Common wavelet functions
Wavelets are a prevailing statistical tool which can be used for a wide range of
applications, including:
● Signal processing
● Data compression
● Smoothing and image denoising
● Fingerprint verification Biology for cell membrane recognition, to
distinguish the normal from the pathological membranes
● DNA analysis, protein analysis
● Speech recognition
● Computer graphics and multifractal analysis
With the use of wavelets, it is possible to reconstruct a full signal with a portion of the original signal information, which makes that data so small to be copied into a storage device. The compression method has to be done in a way such that the structure of the signal is kept. That is the advantage that some government branches have taken, including the FBI. Part of FBI job is to storage tons of fingerprints, but with the use of wavelets this amount of fingerprints has been considerable reduced. In DWT, the most prominent information in the signal appears in high amplitudes and the less prominent information appears in very low amplitudes. Data compression can be achieved by discarding these low amplitudes. The wavelet transforms enables high compression ratios with good quality of reconstruction.
43
At present, the application of wavelets for image compression is one the hottest areas of research.
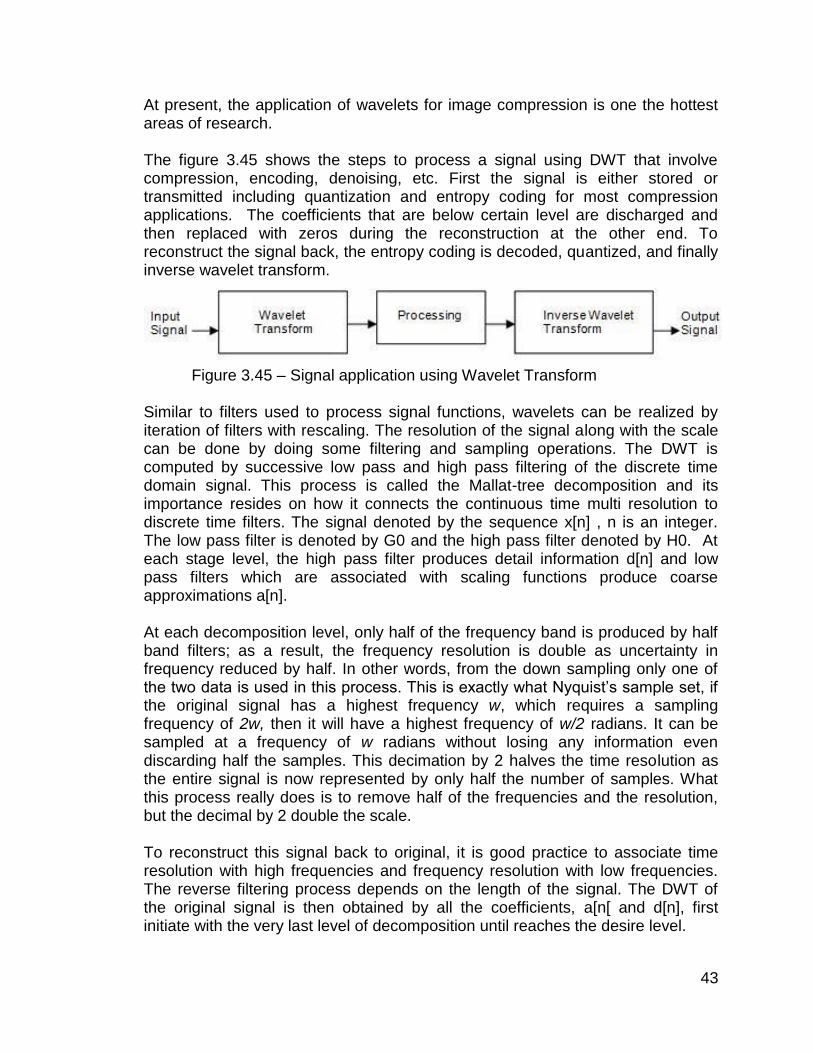
The figure 3.45 shows the steps to process a signal using DWT that involve compression, encoding, denoising, etc. First the signal is either stored or transmitted including quantization and entropy coding for most compression applications. The coefficients that are below certain level are discharged and then replaced with zeros during the reconstruction at the other end. To reconstruct the signal back, the entropy coding is decoded, quantized, and finally inverse wavelet transform.
Figure 3.45 – Signal application using Wavelet Transform
Similar to filters used to process signal functions, wavelets can be realized by iteration of filters with rescaling. The resolution of the signal along with the scale can be done by doing some filtering and sampling operations. The DWT is computed by successive low pass and high pass filtering of the discrete time domain signal. This process is called the Mallat-tree decomposition and its importance resides on how it connects the continuous time multi resolution to discrete time filters. The signal denoted by the sequence x[n] , n is an integer. The low pass filter is denoted by G0 and the high pass filter denoted by H0. At each stage level, the high pass filter produces detail information d[n] and low pass filters which are associated with scaling functions produce coarse approximations a[n]. At each decomposition level, only half of the frequency band is produced by half band filters; as a result, the frequency resolution is double as uncertainty in frequency reduced by half. In other words, from the down sampling only one of the two data is used in this process. This is exactly what Nyquist’s sample set, if the original signal has a highest frequency w, which requires a sampling frequency of 2w, then it will have a highest frequency of w/2 radians. It can be sampled at a frequency of w radians without losing any information even discarding half the samples. This decimation by 2 halves the time resolution as the entire signal is now represented by only half the number of samples. What this process really does is to remove half of the frequencies and the resolution, but the decimal by 2 double the scale. To reconstruct this signal back to original, it is good practice to associate time resolution with high frequencies and frequency resolution with low frequencies. The reverse filtering process depends on the length of the signal. The DWT of the original signal is then obtained by all the coefficients, a[n[ and d[n], first initiate with the very last level of decomposition until reaches the desire level.
44
The reconstruction process really is the reverse of the decomposition process. The coefficients at every level are upsampled by two on low and high pass synthesis filters and then added together. The process stops until reaches the same number of levels as the decomposition process. Similar to decomposition, the Mallat algorithm works perfectly if both the analysis filters G0 and H0 are exchanged with the synthesis filters G1 and H1.
3.7 Initial Hardware Choices
In order for GLASS to achieve its goals special attention was paid to the hardware requirements of the system. Glass is composed of a main board where an embedded computer running Linux processes data and sends out alerts as is deemed necessary, a GPS module, a Bluetooth transmitter and an Audio capture system. In this chapter GLASS’ GPS, Bluetooth and mainboard are detailed as to their hardware specifications and the choices made.
3.7.1 - Main Board Design
There were many different printed circuit board designs to model the GLASS main board off of. With the broad types and amount of data needed to be processed in such short periods of time, there were quite a few parameters to take into consideration when searching for a development board to model the GLASS design after. The different models currently in production that were considered for GLASS are the Raspberry Pi, Pandaboard ES, and Beagleboard BeagleBone Black.
The Raspberry Pi device was considered first for GLASS due to its small physical size, is low power, and low cost. There were many specifications that the Raspberry Pi devices have which originally made it a promising choice for GLASS. The physical dimensions of the board measure 8.6cm x 5.4cm x 1.5cm making it ideal for GLASS’ portable design goal. The Raspberry Pi runs a Linux operating system with customizable embedded software options. Lastly, the Raspberry Pi does have the peripherals GLASS wished to utilize. Unfortunately, with further research, the Raspberry Pi lost its place within GLASS project because it simply was not broad enough a tool to base the GLASS circuit board design. The input pins are limited and not capable of receiving the amount of audio signals from the microphone array necessary for gunshot triangulation, the processor and RAM were much too slow for the data processing speeds needed, and the overall design would not accept additional RAM. The next device considered was the Pandaboard ES. Compared to the Raspberry Pi, the Pandaboard ES is powerhouse in performance. The Pandaboard ES utilizes the dual-core 1.2 GHz ARM® ARM® Cortex™A9 processor, 1 GB of DDR2 RAM, full 1080p video encoding/decoding, and multiple expansion headers. Although the Pandaboard ES did have the correct processor needed for GLASS, as well as the necessary peripherals, the design
45
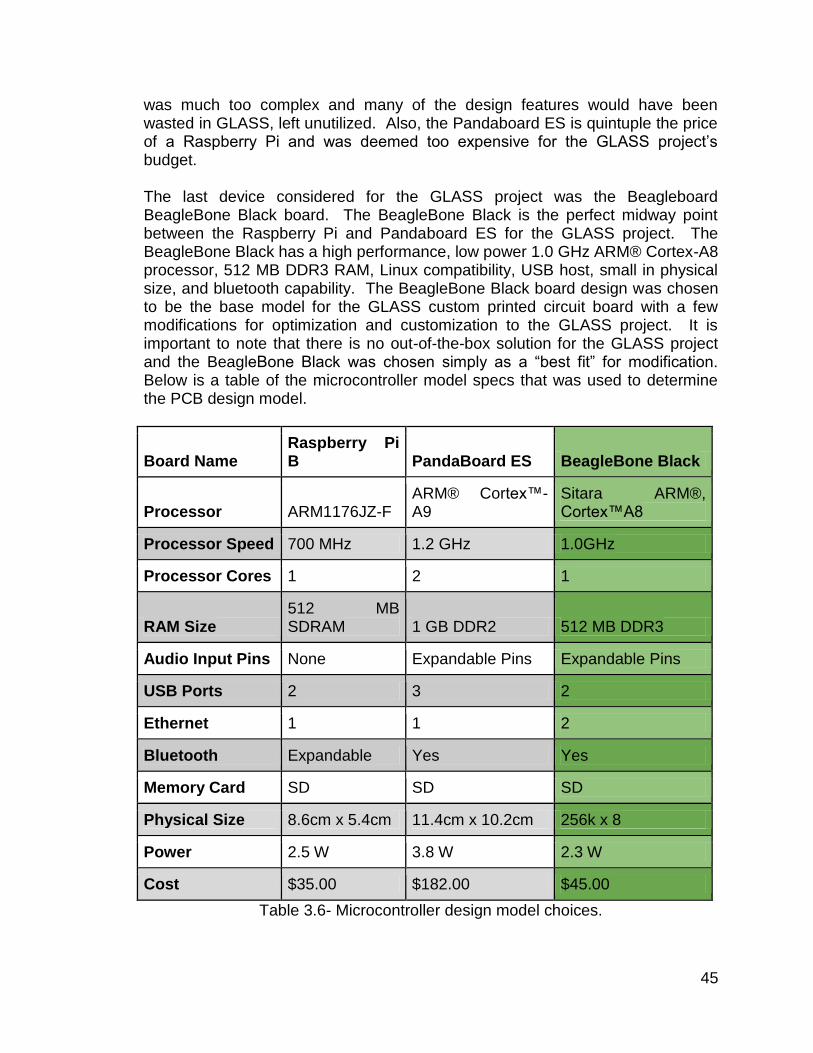
was much too complex and many of the design features would have been wasted in GLASS, left unutilized. Also, the Pandaboard ES is quintuple the price of a Raspberry Pi and was deemed too expensive for the GLASS project’s budget. The last device considered for the GLASS project was the Beagleboard BeagleBone Black board. The BeagleBone Black is the perfect midway point between the Raspberry Pi and Pandaboard ES for the GLASS project. The BeagleBone Black has a high performance, low power 1.0 GHz ARM® Cortex-A8 processor, 512 MB DDR3 RAM, Linux compatibility, USB host, small in physical size, and bluetooth capability. The BeagleBone Black board design was chosen to be the base model for the GLASS custom printed circuit board with a few modifications for optimization and customization to the GLASS project. It is important to note that there is no out-of-the-box solution for the GLASS project and the BeagleBone Black was chosen simply as a “best fit” for modification. Below is a table of the microcontroller model specs that was used to determine the PCB design model.
Board Name Raspberry Pi B PandaBoard ES BeagleBone Black
Processor ARM1176JZ-F ARM® Cortex™-A9
Sitara ARM®, Cortex™A8
Processor Speed 700 MHz 1.2 GHz 1.0GHz
Processor Cores 1 2 1
RAM Size 512 MB SDRAM 1 GB DDR2 512 MB DDR3
Audio Input Pins None Expandable Pins Expandable Pins
USB Ports 2 3 2
Ethernet 1 1 2
Bluetooth Expandable Yes Yes
Memory Card SD SD SD
Physical Size 8.6cm x 5.4cm 11.4cm x 10.2cm 256k x 8
Power 2.5 W 3.8 W 2.3 W
Cost $35.00 $182.00 $45.00
Table 3.6- Microcontroller design model choices.
46
3.7.2 - Processor
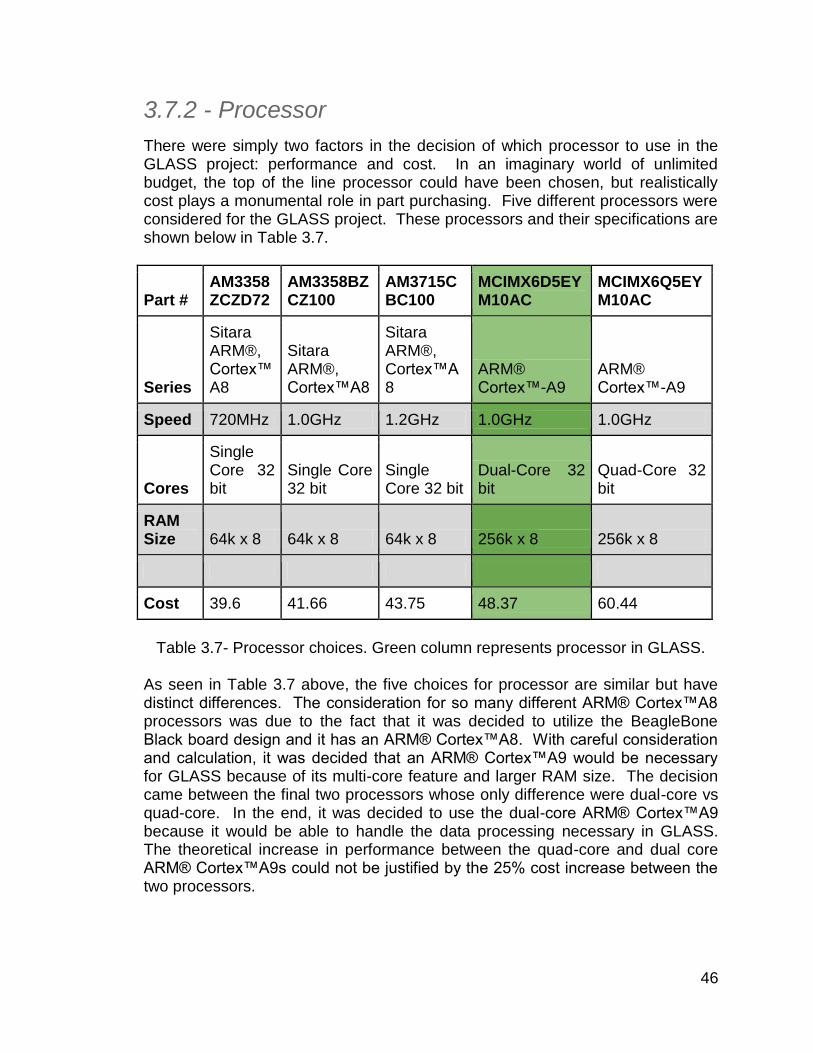
There were simply two factors in the decision of which processor to use in the GLASS project: performance and cost. In an imaginary world of unlimited budget, the top of the line processor could have been chosen, but realistically cost plays a monumental role in part purchasing. Five different processors were considered for the GLASS project. These processors and their specifications are shown below in Table 3.7.
Part # AM3358ZCZD72
AM3358BZCZ100
AM3715CBC100
MCIMX6D5EYM10AC
MCIMX6Q5EYM10AC
Series
Sitara ARM®, Cortex™A8
Sitara ARM®, Cortex™A8
Sitara ARM®, Cortex™A8
ARM® Cortex™-A9
ARM® Cortex™-A9
Speed 720MHz 1.0GHz 1.2GHz 1.0GHz 1.0GHz
Cores
Single Core 32 bit
Single Core 32 bit
Single Core 32 bit
Dual-Core 32 bit
Quad-Core 32 bit
RAM Size 64k x 8 64k x 8 64k x 8 256k x 8 256k x 8
Cost 39.6 41.66 43.75 48.37 60.44
Table 3.7- Processor choices. Green column represents processor in GLASS.
As seen in Table 3.7 above, the five choices for processor are similar but have distinct differences. The consideration for so many different ARM® Cortex™A8 processors was due to the fact that it was decided to utilize the BeagleBone Black board design and it has an ARM® Cortex™A8. With careful consideration and calculation, it was decided that an ARM® Cortex™A9 would be necessary for GLASS because of its multi-core feature and larger RAM size. The decision came between the final two processors whose only difference were dual-core vs quad-core. In the end, it was decided to use the dual-core ARM® Cortex™A9 because it would be able to handle the data processing necessary in GLASS. The theoretical increase in performance between the quad-core and dual core ARM® Cortex™A9s could not be justified by the 25% cost increase between the two processors.
47
3.7.3 - Memory/RAM
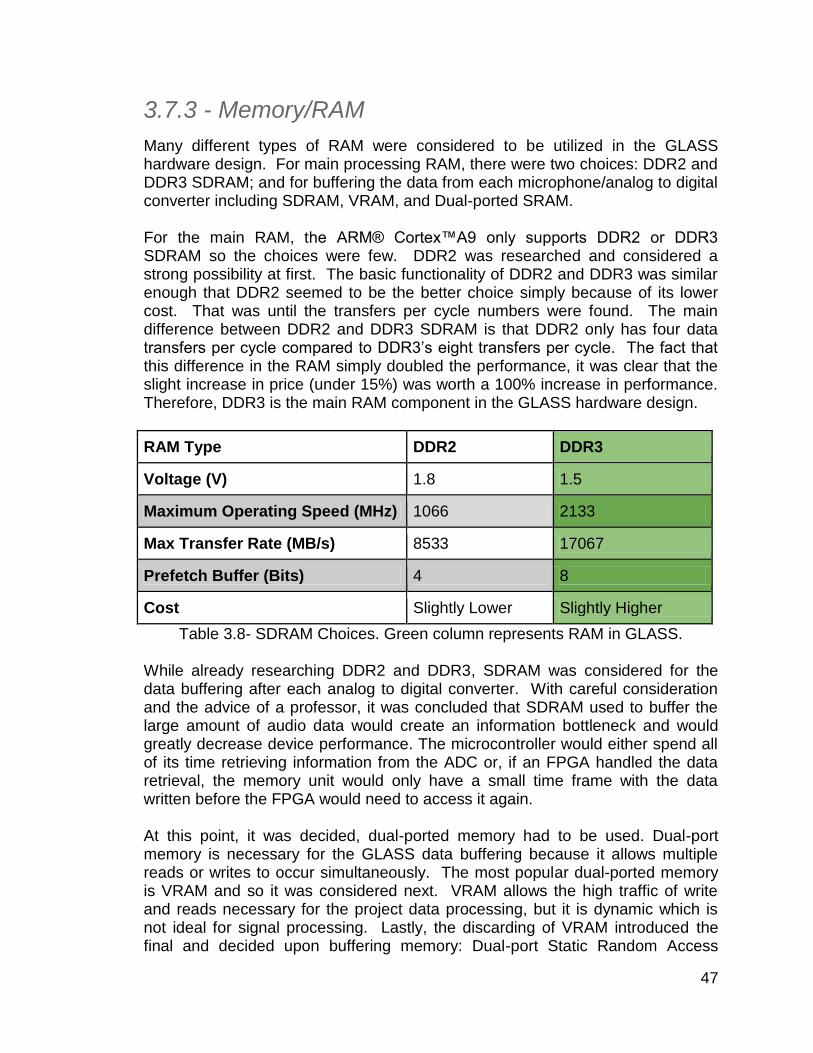
Many different types of RAM were considered to be utilized in the GLASS hardware design. For main processing RAM, there were two choices: DDR2 and DDR3 SDRAM; and for buffering the data from each microphone/analog to digital converter including SDRAM, VRAM, and Dual-ported SRAM. For the main RAM, the ARM® Cortex™A9 only supports DDR2 or DDR3 SDRAM so the choices were few. DDR2 was researched and considered a strong possibility at first. The basic functionality of DDR2 and DDR3 was similar enough that DDR2 seemed to be the better choice simply because of its lower cost. That was until the transfers per cycle numbers were found. The main difference between DDR2 and DDR3 SDRAM is that DDR2 only has four data transfers per cycle compared to DDR3’s eight transfers per cycle. The fact that this difference in the RAM simply doubled the performance, it was clear that the slight increase in price (under 15%) was worth a 100% increase in performance. Therefore, DDR3 is the main RAM component in the GLASS hardware design.
RAM Type DDR2 DDR3
Voltage (V) 1.8 1.5
Maximum Operating Speed (MHz) 1066 2133
Max Transfer Rate (MB/s) 8533 17067
Prefetch Buffer (Bits) 4 8
Cost Slightly Lower Slightly Higher
Table 3.8- SDRAM Choices. Green column represents RAM in GLASS. While already researching DDR2 and DDR3, SDRAM was considered for the data buffering after each analog to digital converter. With careful consideration and the advice of a professor, it was concluded that SDRAM used to buffer the large amount of audio data would create an information bottleneck and would greatly decrease device performance. The microcontroller would either spend all of its time retrieving information from the ADC or, if an FPGA handled the data retrieval, the memory unit would only have a small time frame with the data written before the FPGA would need to access it again.
At this point, it was decided, dual-ported memory had to be used. Dual-port memory is necessary for the GLASS data buffering because it allows multiple reads or writes to occur simultaneously. The most popular dual-ported memory is VRAM and so it was considered next. VRAM allows the high traffic of write and reads necessary for the project data processing, but it is dynamic which is not ideal for signal processing. Lastly, the discarding of VRAM introduced the final and decided upon buffering memory: Dual-port Static Random Access
48
Memory (DPRAM or DPSRAM). This memory provides the stable buffering necessary for signal processing while allowing the processor to access the memory while data is still being written to the memory at the same time.
49
3.7.4 - Bluetooth
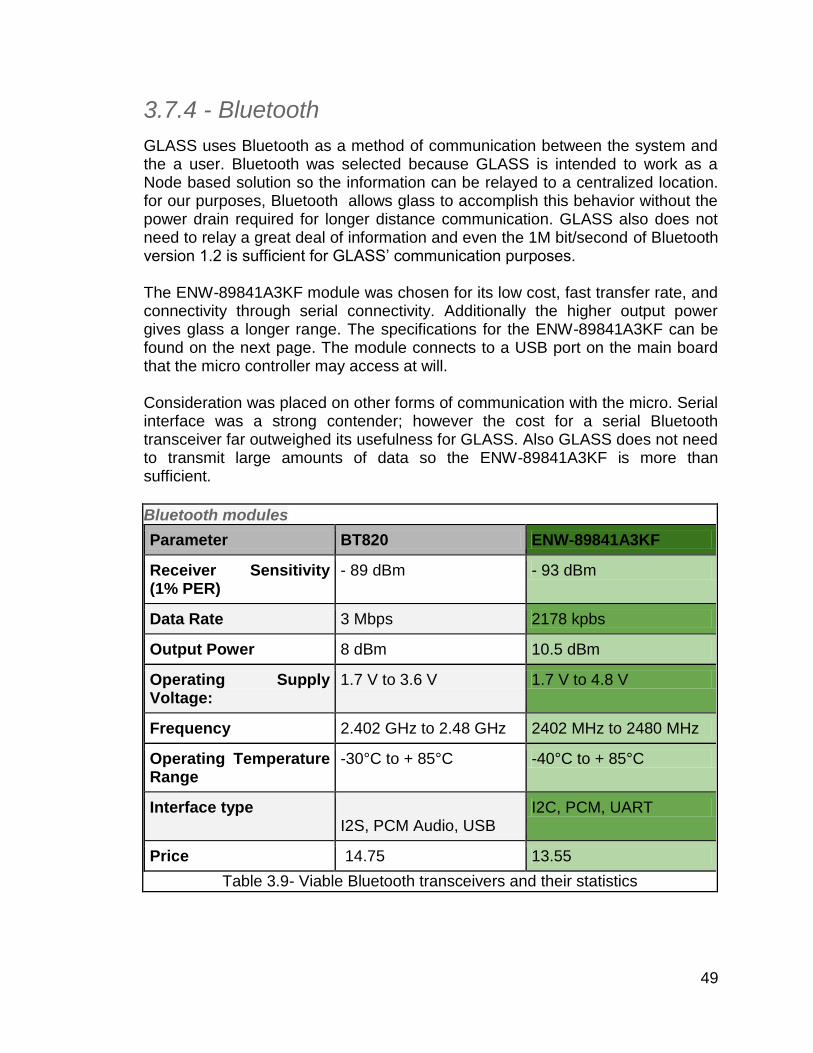
GLASS uses Bluetooth as a method of communication between the system and the a user. Bluetooth was selected because GLASS is intended to work as a Node based solution so the information can be relayed to a centralized location. for our purposes, Bluetooth allows glass to accomplish this behavior without the power drain required for longer distance communication. GLASS also does not need to relay a great deal of information and even the 1M bit/second of Bluetooth version 1.2 is sufficient for GLASS’ communication purposes. The ENW-89841A3KF module was chosen for its low cost, fast transfer rate, and connectivity through serial connectivity. Additionally the higher output power gives glass a longer range. The specifications for the ENW-89841A3KF can be found on the next page. The module connects to a USB port on the main board that the micro controller may access at will. Consideration was placed on other forms of communication with the micro. Serial interface was a strong contender; however the cost for a serial Bluetooth transceiver far outweighed its usefulness for GLASS. Also GLASS does not need to transmit large amounts of data so the ENW-89841A3KF is more than sufficient.
Bluetooth modules
Parameter BT820 ENW-89841A3KF
Receiver Sensitivity (1% PER)
- 89 dBm - 93 dBm
Data Rate 3 Mbps 2178 kpbs
Output Power 8 dBm 10.5 dBm
Operating Supply Voltage:
1.7 V to 3.6 V 1.7 V to 4.8 V
Frequency 2.402 GHz to 2.48 GHz 2402 MHz to 2480 MHz
Operating Temperature Range
-30°C to + 85°C -40°C to + 85°C
Interface type I2S, PCM Audio, USB
I2C, PCM, UART
Price 14.75 13.55
Table 3.9- Viable Bluetooth transceivers and their statistics
50
3.7.5 - GPS
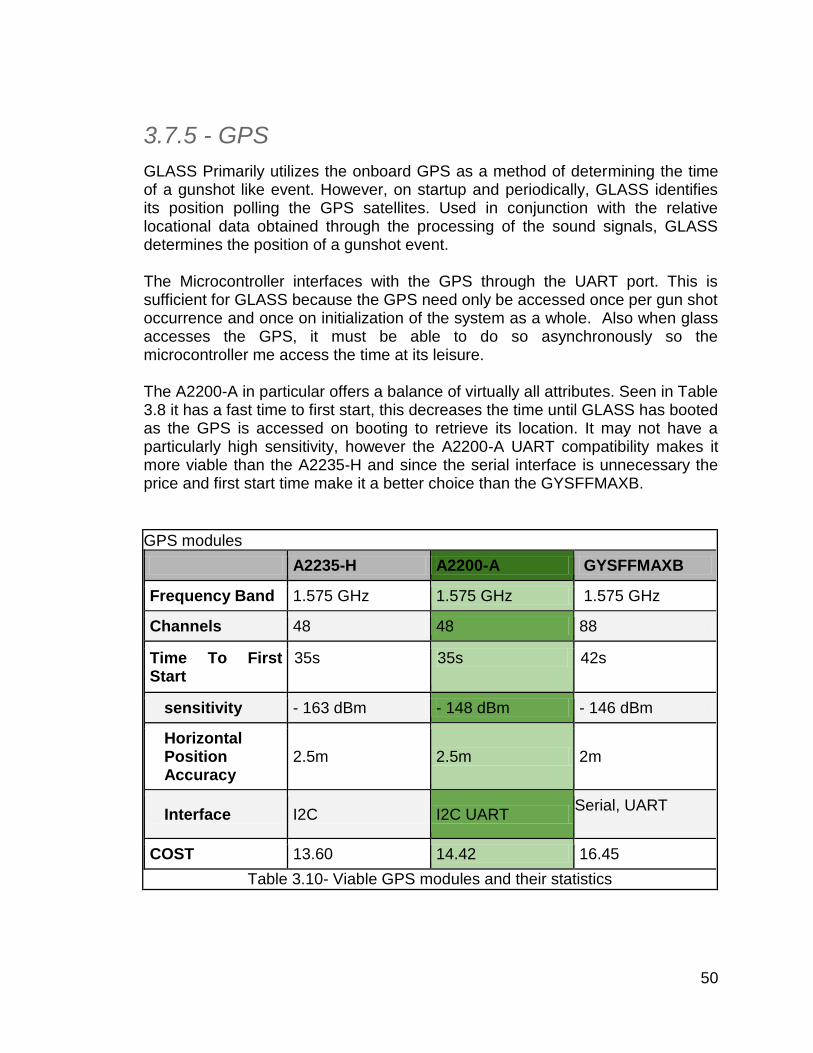
GLASS Primarily utilizes the onboard GPS as a method of determining the time of a gunshot like event. However, on startup and periodically, GLASS identifies its position polling the GPS satellites. Used in conjunction with the relative locational data obtained through the processing of the sound signals, GLASS determines the position of a gunshot event. The Microcontroller interfaces with the GPS through the UART port. This is sufficient for GLASS because the GPS need only be accessed once per gun shot occurrence and once on initialization of the system as a whole. Also when glass accesses the GPS, it must be able to do so asynchronously so the microcontroller me access the time at its leisure. The A2200-A in particular offers a balance of virtually all attributes. Seen in Table 3.8 it has a fast time to first start, this decreases the time until GLASS has booted as the GPS is accessed on booting to retrieve its location. It may not have a particularly high sensitivity, however the A2200-A UART compatibility makes it more viable than the A2235-H and since the serial interface is unnecessary the price and first start time make it a better choice than the GYSFFMAXB.
GPS modules
A2235-H A2200-A GYSFFMAXB
Frequency Band 1.575 GHz 1.575 GHz 1.575 GHz
Channels 48 48 88
Time To First Start
35s 35s 42s
sensitivity - 163 dBm - 148 dBm - 146 dBm
Horizontal Position Accuracy
2.5m 2.5m 2m
Interface I2C I2C UART Serial, UART
COST 13.60 14.42 16.45
Table 3.10- Viable GPS modules and their statistics
51
3.7.6 - Backup Power Battery Size
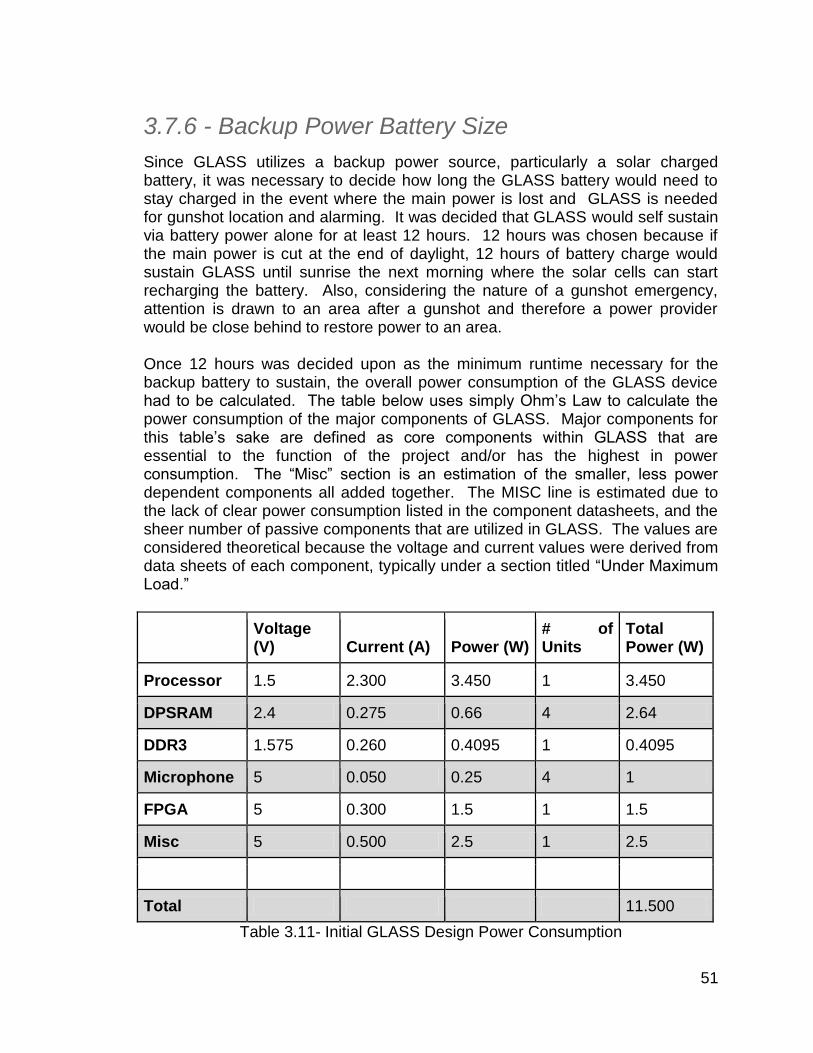
Since GLASS utilizes a backup power source, particularly a solar charged battery, it was necessary to decide how long the GLASS battery would need to stay charged in the event where the main power is lost and GLASS is needed for gunshot location and alarming. It was decided that GLASS would self sustain via battery power alone for at least 12 hours. 12 hours was chosen because if the main power is cut at the end of daylight, 12 hours of battery charge would sustain GLASS until sunrise the next morning where the solar cells can start recharging the battery. Also, considering the nature of a gunshot emergency, attention is drawn to an area after a gunshot and therefore a power provider would be close behind to restore power to an area. Once 12 hours was decided upon as the minimum runtime necessary for the backup battery to sustain, the overall power consumption of the GLASS device had to be calculated. The table below uses simply Ohm’s Law to calculate the power consumption of the major components of GLASS. Major components for this table’s sake are defined as core components within GLASS that are essential to the function of the project and/or has the highest in power consumption. The “Misc” section is an estimation of the smaller, less power dependent components all added together. The MISC line is estimated due to the lack of clear power consumption listed in the component datasheets, and the sheer number of passive components that are utilized in GLASS. The values are considered theoretical because the voltage and current values were derived from data sheets of each component, typically under a section titled “Under Maximum Load.”
Voltage (V) Current (A) Power (W)
# of Units
Total Power (W)
Processor 1.5 2.300 3.450 1 3.450
DPSRAM 2.4 0.275 0.66 4 2.64
DDR3 1.575 0.260 0.4095 1 0.4095
Microphone 5 0.050 0.25 4 1
FPGA 5 0.300 1.5 1 1.5
Misc 5 0.500 2.5 1 2.5
Total 11.500
Table 3.11- Initial GLASS Design Power Consumption
52
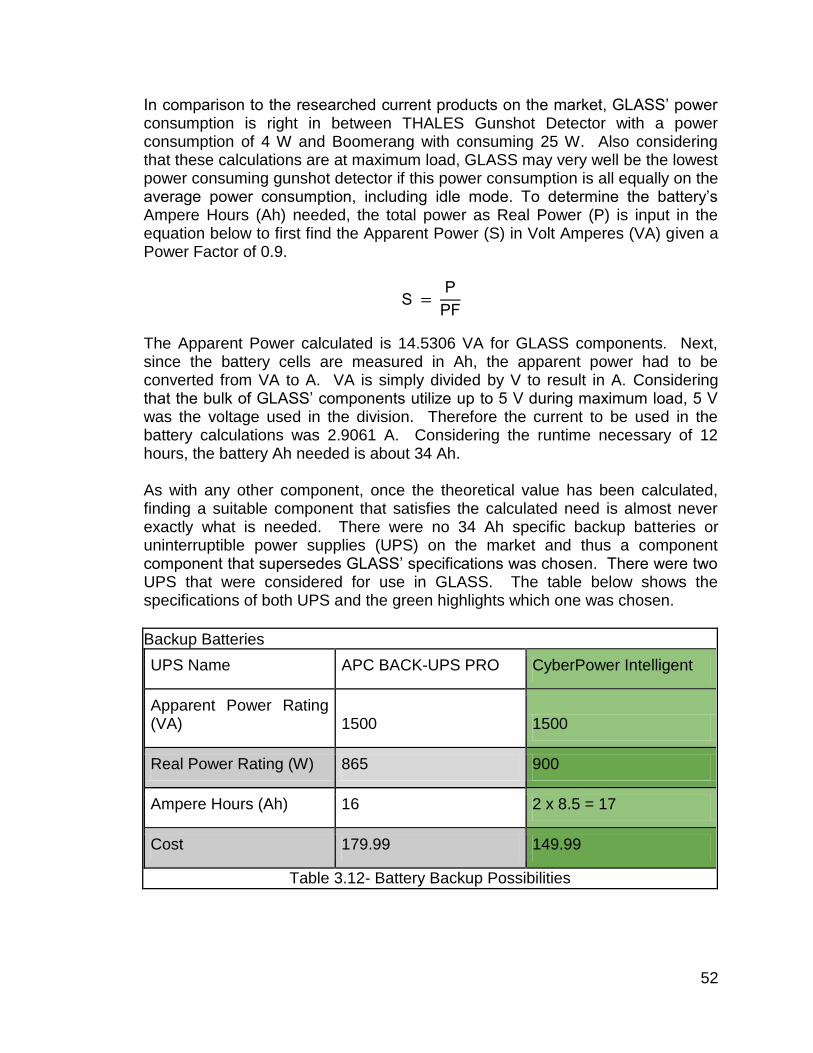
In comparison to the researched current products on the market, GLASS’ power consumption is right in between THALES Gunshot Detector with a power consumption of 4 W and Boomerang with consuming 25 W. Also considering that these calculations are at maximum load, GLASS may very well be the lowest power consuming gunshot detector if this power consumption is all equally on the average power consumption, including idle mode. To determine the battery’s Ampere Hours (Ah) needed, the total power as Real Power (P) is input in the equation below to first find the Apparent Power (S) in Volt Amperes (VA) given a Power Factor of 0.9.
S P
PF
The Apparent Power calculated is 14.5306 VA for GLASS components. Next, since the battery cells are measured in Ah, the apparent power had to be converted from VA to A. VA is simply divided by V to result in A. Considering that the bulk of GLASS’ components utilize up to 5 V during maximum load, 5 V was the voltage used in the division. Therefore the current to be used in the battery calculations was 2.9061 A. Considering the runtime necessary of 12 hours, the battery Ah needed is about 34 Ah. As with any other component, once the theoretical value has been calculated, finding a suitable component that satisfies the calculated need is almost never exactly what is needed. There were no 34 Ah specific backup batteries or uninterruptible power supplies (UPS) on the market and thus a component component that supersedes GLASS’ specifications was chosen. There were two UPS that were considered for use in GLASS. The table below shows the specifications of both UPS and the green highlights which one was chosen.
Backup Batteries
UPS Name APC BACK-UPS PRO CyberPower Intelligent
Apparent Power Rating (VA) 1500 1500
Real Power Rating (W) 865 900
Ampere Hours (Ah) 16 2 x 8.5 = 17
Cost 179.99 149.99
Table 3.12- Battery Backup Possibilities
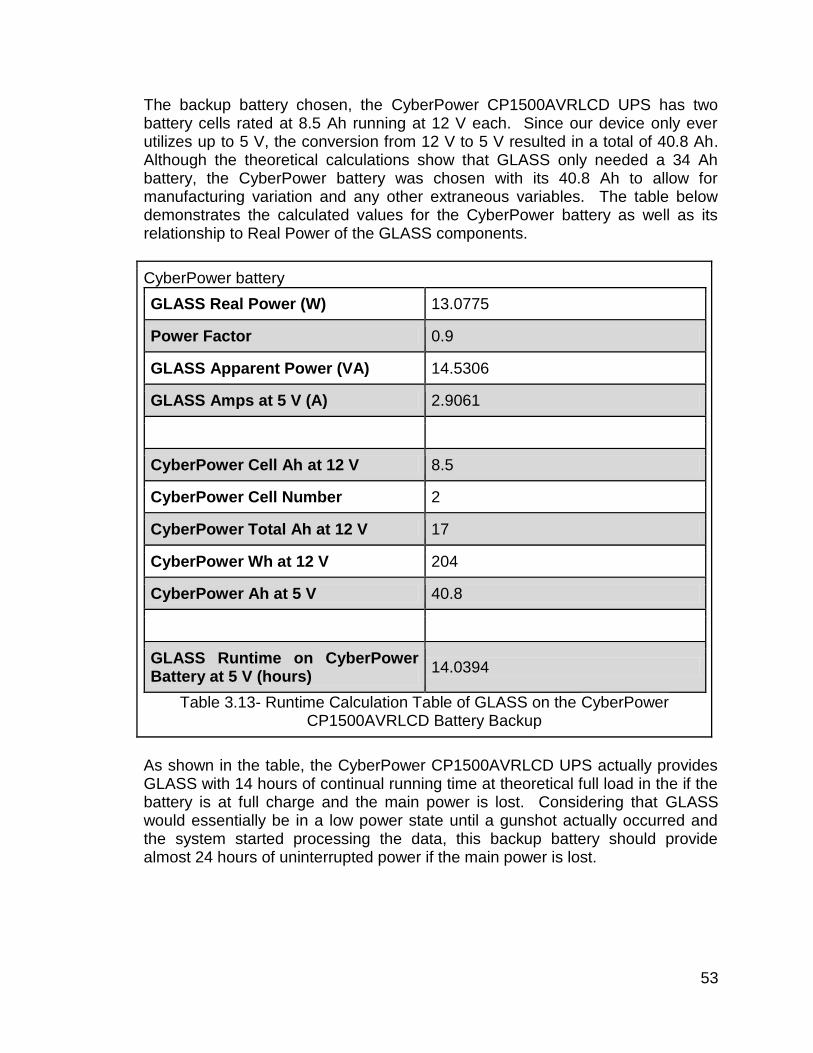
53
The backup battery chosen, the CyberPower CP1500AVRLCD UPS has two battery cells rated at 8.5 Ah running at 12 V each. Since our device only ever utilizes up to 5 V, the conversion from 12 V to 5 V resulted in a total of 40.8 Ah. Although the theoretical calculations show that GLASS only needed a 34 Ah battery, the CyberPower battery was chosen with its 40.8 Ah to allow for manufacturing variation and any other extraneous variables. The table below demonstrates the calculated values for the CyberPower battery as well as its relationship to Real Power of the GLASS components.
CyberPower battery
GLASS Real Power (W) 13.0775
Power Factor 0.9
GLASS Apparent Power (VA) 14.5306
GLASS Amps at 5 V (A) 2.9061
CyberPower Cell Ah at 12 V 8.5
CyberPower Cell Number 2
CyberPower Total Ah at 12 V 17
CyberPower Wh at 12 V 204
CyberPower Ah at 5 V 40.8
GLASS Runtime on CyberPower Battery at 5 V (hours)
14.0394
Table 3.13- Runtime Calculation Table of GLASS on the CyberPower CP1500AVRLCD Battery Backup
As shown in the table, the CyberPower CP1500AVRLCD UPS actually provides GLASS with 14 hours of continual running time at theoretical full load in the if the battery is at full charge and the main power is lost. Considering that GLASS would essentially be in a low power state until a gunshot actually occurred and the system started processing the data, this backup battery should provide almost 24 hours of uninterrupted power if the main power is lost.
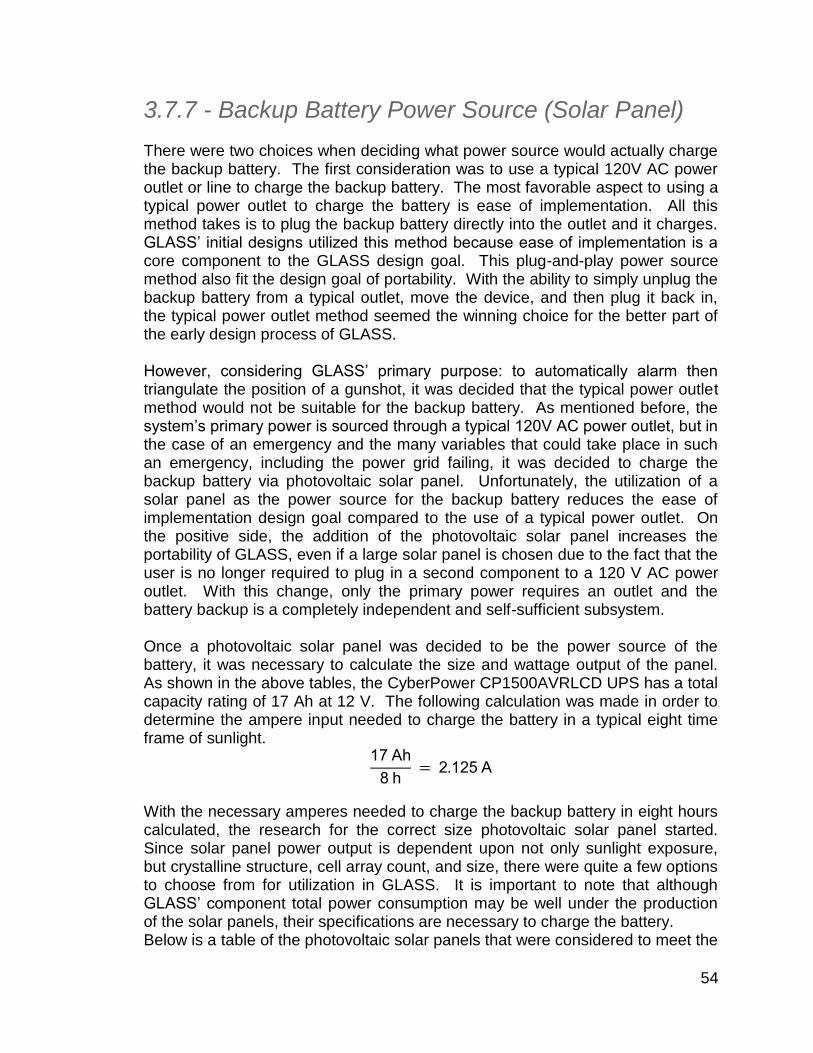
54
3.7.7 - Backup Battery Power Source (Solar Panel)
There were two choices when deciding what power source would actually charge the backup battery. The first consideration was to use a typical 120V AC power outlet or line to charge the backup battery. The most favorable aspect to using a typical power outlet to charge the battery is ease of implementation. All this method takes is to plug the backup battery directly into the outlet and it charges. GLASS’ initial designs utilized this method because ease of implementation is a core component to the GLASS design goal. This plug-and-play power source method also fit the design goal of portability. With the ability to simply unplug the backup battery from a typical outlet, move the device, and then plug it back in, the typical power outlet method seemed the winning choice for the better part of the early design process of GLASS. However, considering GLASS’ primary purpose: to automatically alarm then triangulate the position of a gunshot, it was decided that the typical power outlet method would not be suitable for the backup battery. As mentioned before, the system’s primary power is sourced through a typical 120V AC power outlet, but in the case of an emergency and the many variables that could take place in such an emergency, including the power grid failing, it was decided to charge the backup battery via photovoltaic solar panel. Unfortunately, the utilization of a solar panel as the power source for the backup battery reduces the ease of implementation design goal compared to the use of a typical power outlet. On the positive side, the addition of the photovoltaic solar panel increases the portability of GLASS, even if a large solar panel is chosen due to the fact that the user is no longer required to plug in a second component to a 120 V AC power outlet. With this change, only the primary power requires an outlet and the battery backup is a completely independent and self-sufficient subsystem. Once a photovoltaic solar panel was decided to be the power source of the battery, it was necessary to calculate the size and wattage output of the panel. As shown in the above tables, the CyberPower CP1500AVRLCD UPS has a total capacity rating of 17 Ah at 12 V. The following calculation was made in order to determine the ampere input needed to charge the battery in a typical eight time frame of sunlight.
17 Ah
8 h 2 125 A
With the necessary amperes needed to charge the backup battery in eight hours calculated, the research for the correct size photovoltaic solar panel started. Since solar panel power output is dependent upon not only sunlight exposure, but crystalline structure, cell array count, and size, there were quite a few options to choose from for utilization in GLASS. It is important to note that although GLASS’ component total power consumption may be well under the production of the solar panels, their specifications are necessary to charge the battery. Below is a table of the photovoltaic solar panels that were considered to meet the
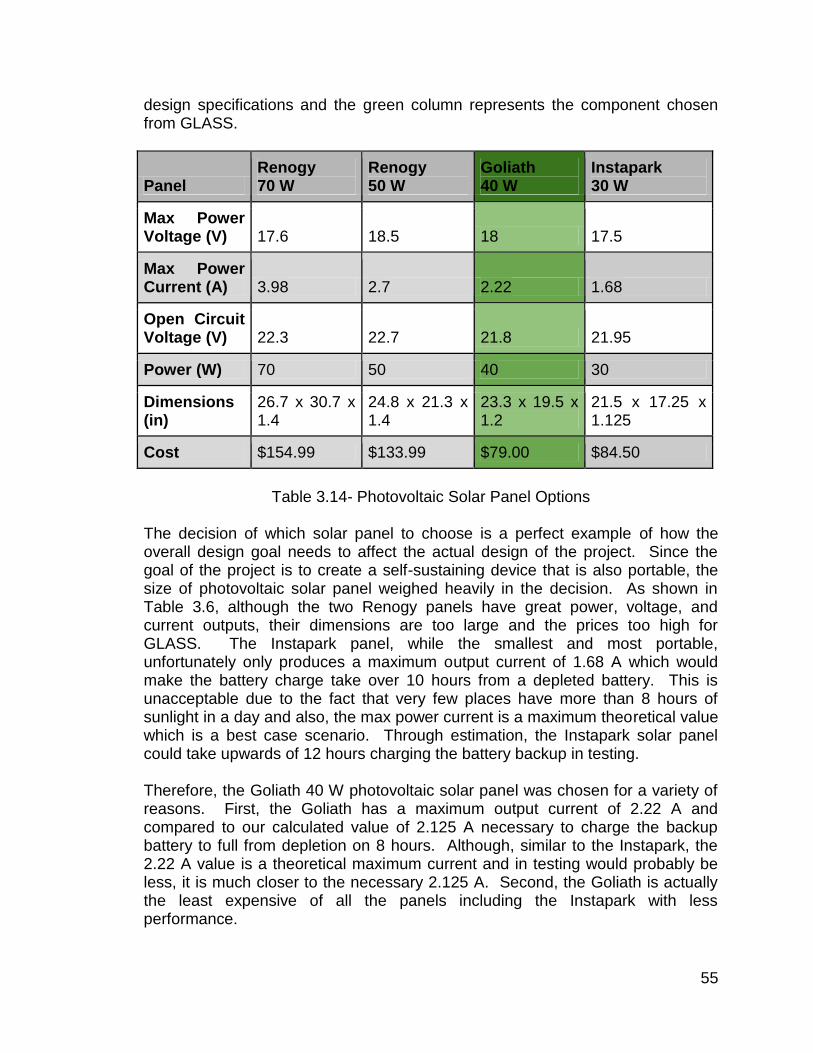
55
design specifications and the green column represents the component chosen from GLASS.
Panel Renogy 70 W
Renogy 50 W
Goliath 40 W
Instapark 30 W
Max Power Voltage (V) 17.6 18.5 18 17.5
Max Power Current (A) 3.98 2.7 2.22 1.68
Open Circuit Voltage (V) 22.3 22.7 21.8 21.95
Power (W) 70 50 40 30
Dimensions (in)
26.7 x 30.7 x 1.4
24.8 x 21.3 x 1.4
23.3 x 19.5 x 1.2
21.5 x 17.25 x 1.125
Cost $154.99 $133.99 $79.00 $84.50
Table 3.14- Photovoltaic Solar Panel Options
The decision of which solar panel to choose is a perfect example of how the overall design goal needs to affect the actual design of the project. Since the goal of the project is to create a self-sustaining device that is also portable, the size of photovoltaic solar panel weighed heavily in the decision. As shown in Table 3.6, although the two Renogy panels have great power, voltage, and current outputs, their dimensions are too large and the prices too high for GLASS. The Instapark panel, while the smallest and most portable, unfortunately only produces a maximum output current of 1.68 A which would make the battery charge take over 10 hours from a depleted battery. This is unacceptable due to the fact that very few places have more than 8 hours of sunlight in a day and also, the max power current is a maximum theoretical value which is a best case scenario. Through estimation, the Instapark solar panel could take upwards of 12 hours charging the battery backup in testing. Therefore, the Goliath 40 W photovoltaic solar panel was chosen for a variety of reasons. First, the Goliath has a maximum output current of 2.22 A and compared to our calculated value of 2.125 A necessary to charge the backup battery to full from depletion on 8 hours. Although, similar to the Instapark, the 2.22 A value is a theoretical maximum current and in testing would probably be less, it is much closer to the necessary 2.125 A. Second, the Goliath is actually the least expensive of all the panels including the Instapark with less performance.
56
The Renogy 50 W was the top choice until the Goliath was found because it had a better maximum power current, but the price difference between the Goliath and Renogy 50 W did not justify the performance difference: a 69.6% increase in price for a 21.6% increase in maximum power current. Lastly, the Goliath is a great compromise between the smaller more portable Instapark and the larger Renogy panels for portability. All of these factors made the Goliath the perfect choice for utilization within GLASS.
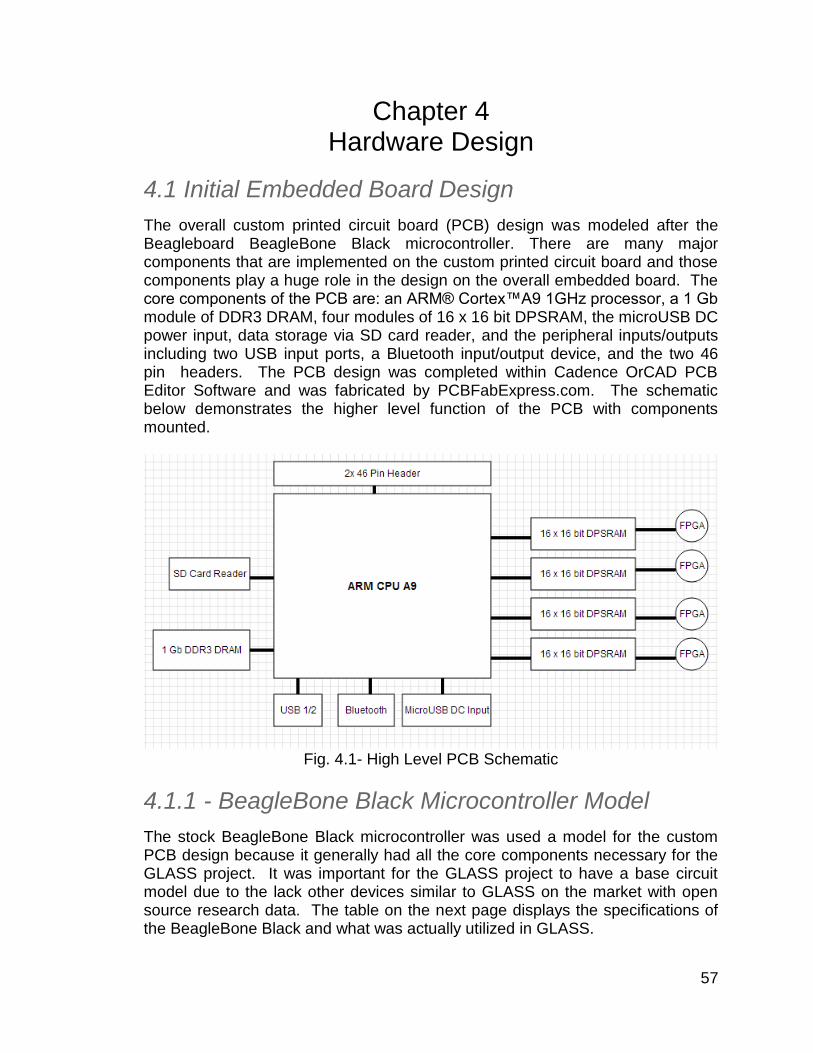
57
Chapter 4
Hardware Design
4.1 Initial Embedded Board Design
The overall custom printed circuit board (PCB) design was modeled after the Beagleboard BeagleBone Black microcontroller. There are many major components that are implemented on the custom printed circuit board and those components play a huge role in the design on the overall embedded board. The core components of the PCB are: an ARM® Cortex™A9 1GHz processor, a 1 Gb module of DDR3 DRAM, four modules of 16 x 16 bit DPSRAM, the microUSB DC power input, data storage via SD card reader, and the peripheral inputs/outputs including two USB input ports, a Bluetooth input/output device, and the two 46 pin headers. The PCB design was completed within Cadence OrCAD PCB Editor Software and was fabricated by PCBFabExpress.com. The schematic below demonstrates the higher level function of the PCB with components mounted.
Fig. 4.1- High Level PCB Schematic
4.1.1 - BeagleBone Black Microcontroller Model
The stock BeagleBone Black microcontroller was used a model for the custom PCB design because it generally had all the core components necessary for the GLASS project. It was important for the GLASS project to have a base circuit model due to the lack other devices similar to GLASS on the market with open source research data. The table on the next page displays the specifications of the BeagleBone Black and what was actually utilized in GLASS.
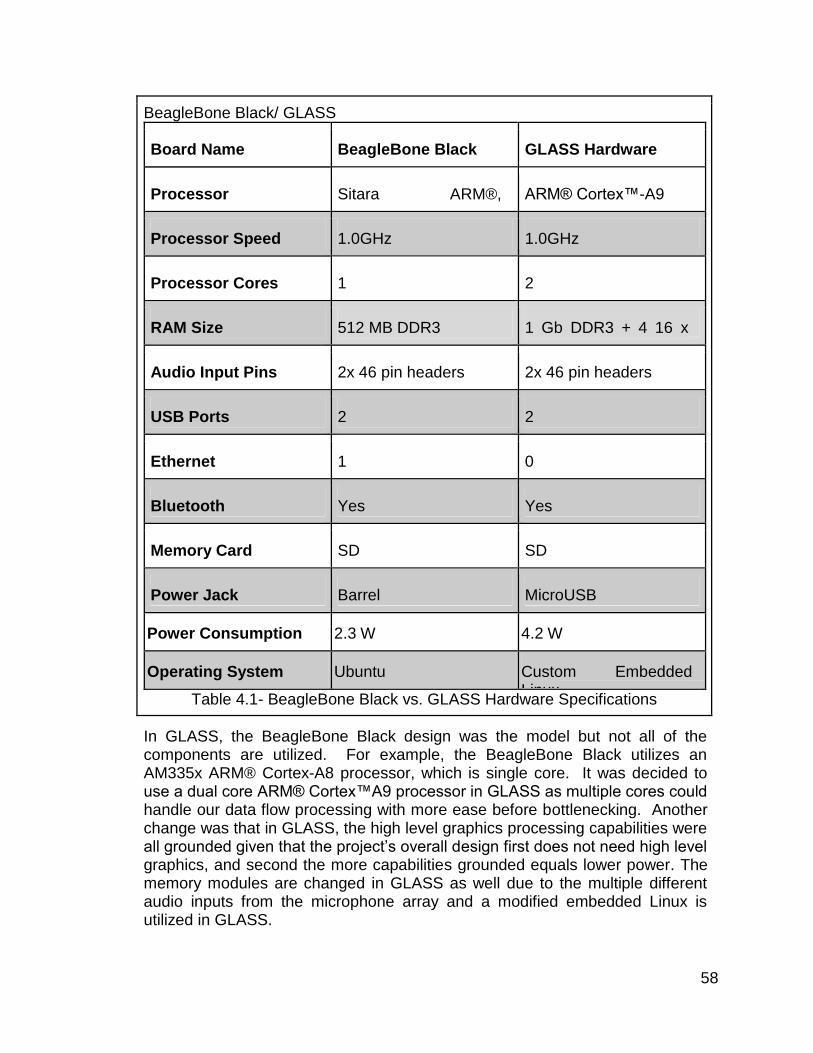
58
BeagleBone Black/ GLASS
Board Name BeagleBone Black GLASS Hardware
Processor Sitara ARM®, Cortex™A8
ARM® Cortex™-A9
Processor Speed 1.0GHz 1.0GHz
Processor Cores 1 2
RAM Size 512 MB DDR3 1 Gb DDR3 + 4 16 x 16 bit DPSRAM Modules
Audio Input Pins 2x 46 pin headers 2x 46 pin headers
USB Ports 2 2
Ethernet 1 0
Bluetooth Yes Yes
Memory Card SD SD
Power Jack Barrel MicroUSB
Power Consumption 2.3 W 4.2 W
Operating System Ubuntu Custom Embedded Linux
Table 4.1- BeagleBone Black vs. GLASS Hardware Specifications
In GLASS, the BeagleBone Black design was the model but not all of the components are utilized. For example, the BeagleBone Black utilizes an AM335x ARM® Cortex-A8 processor, which is single core. It was decided to use a dual core ARM® Cortex™A9 processor in GLASS as multiple cores could handle our data flow processing with more ease before bottlenecking. Another change was that in GLASS, the high level graphics processing capabilities were all grounded given that the project’s overall design first does not need high level graphics, and second the more capabilities grounded equals lower power. The memory modules are changed in GLASS as well due to the multiple different audio inputs from the microphone array and a modified embedded Linux is utilized in GLASS.
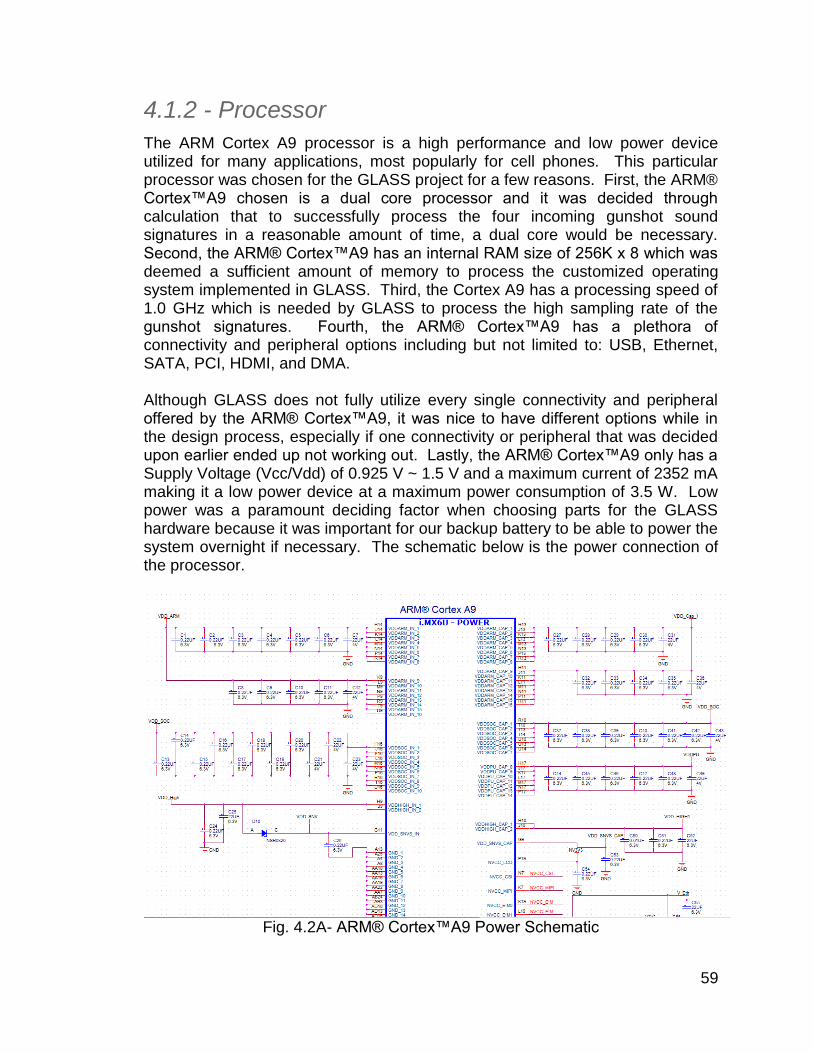
59
4.1.2 - Processor
The ARM Cortex A9 processor is a high performance and low power device utilized for many applications, most popularly for cell phones. This particular processor was chosen for the GLASS project for a few reasons. First, the ARM® Cortex™A9 chosen is a dual core processor and it was decided through calculation that to successfully process the four incoming gunshot sound signatures in a reasonable amount of time, a dual core would be necessary. Second, the ARM® Cortex™A9 has an internal RAM size of 256K x 8 which was deemed a sufficient amount of memory to process the customized operating system implemented in GLASS. Third, the Cortex A9 has a processing speed of 1.0 GHz which is needed by GLASS to process the high sampling rate of the gunshot signatures. Fourth, the ARM® Cortex™A9 has a plethora of connectivity and peripheral options including but not limited to: USB, Ethernet, SATA, PCI, HDMI, and DMA. Although GLASS does not fully utilize every single connectivity and peripheral offered by the ARM® Cortex™A9, it was nice to have different options while in the design process, especially if one connectivity or peripheral that was decided upon earlier ended up not working out. Lastly, the ARM® Cortex™A9 only has a Supply Voltage (Vcc/Vdd) of 0.925 V ~ 1.5 V and a maximum current of 2352 mA making it a low power device at a maximum power consumption of 3.5 W. Low power was a paramount deciding factor when choosing parts for the GLASS hardware because it was important for our backup battery to be able to power the system overnight if necessary. The schematic below is the power connection of the processor.
Fig. 4.2A- ARM® Cortex™A9 Power Schematic
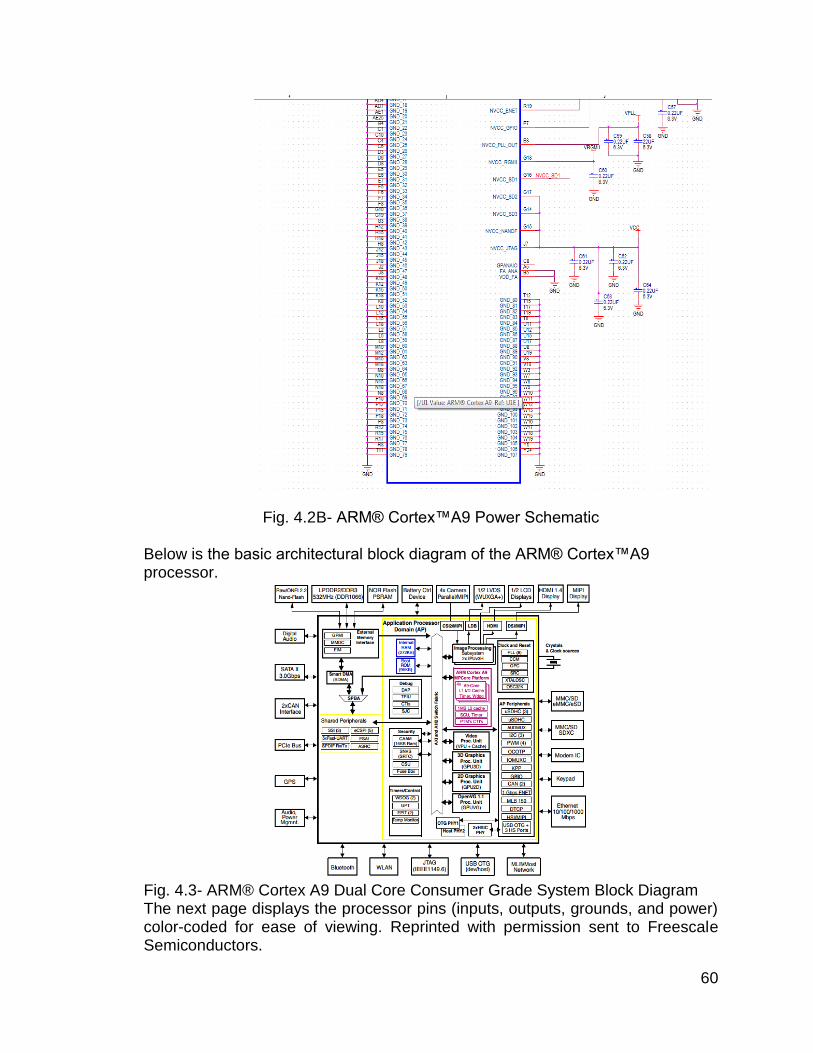
60
Fig. 4.2B- ARM® Cortex™A9 Power Schematic Below is the basic architectural block diagram of the ARM® Cortex™A9 processor.
Fig. 4.3- ARM® Cortex A9 Dual Core Consumer Grade System Block Diagram The next page displays the processor pins (inputs, outputs, grounds, and power) color-coded for ease of viewing. Reprinted with permission sent to Freescale Semiconductors.
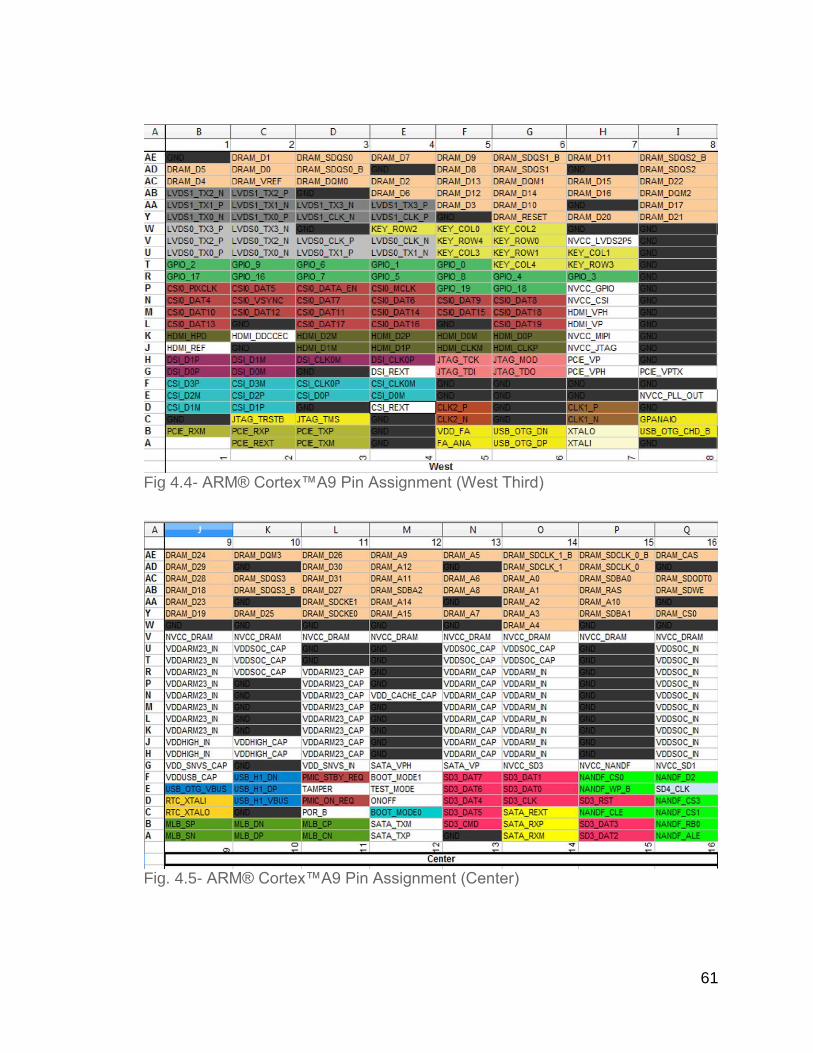
61
Fig 4.4- ARM® Cortex™A9 Pin Assignment (West Third)
Fig. 4.5- ARM® Cortex™A9 Pin Assignment (Center)
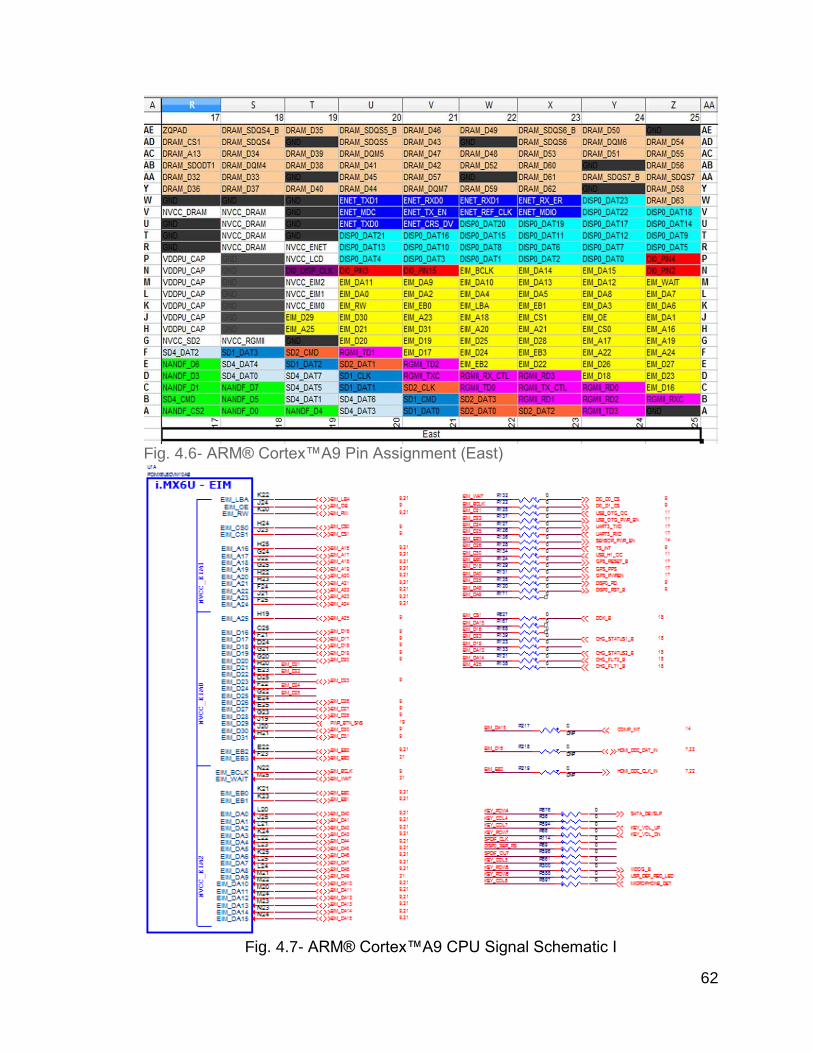
62
Fig. 4.6- ARM® Cortex™A9 Pin Assignment (East)
Fig. 4.7- ARM® Cortex™A9 CPU Signal Schematic I
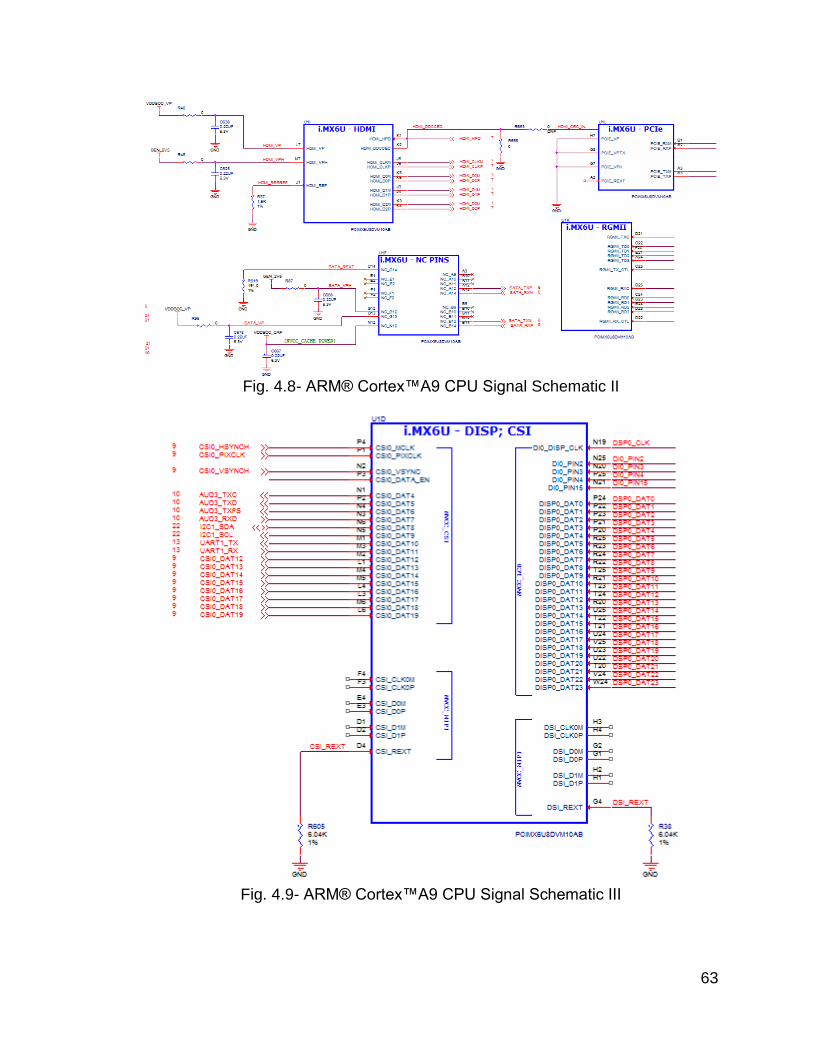
63
Fig. 4.8- ARM® Cortex™A9 CPU Signal Schematic II
Fig. 4.9- ARM® Cortex™A9 CPU Signal Schematic III
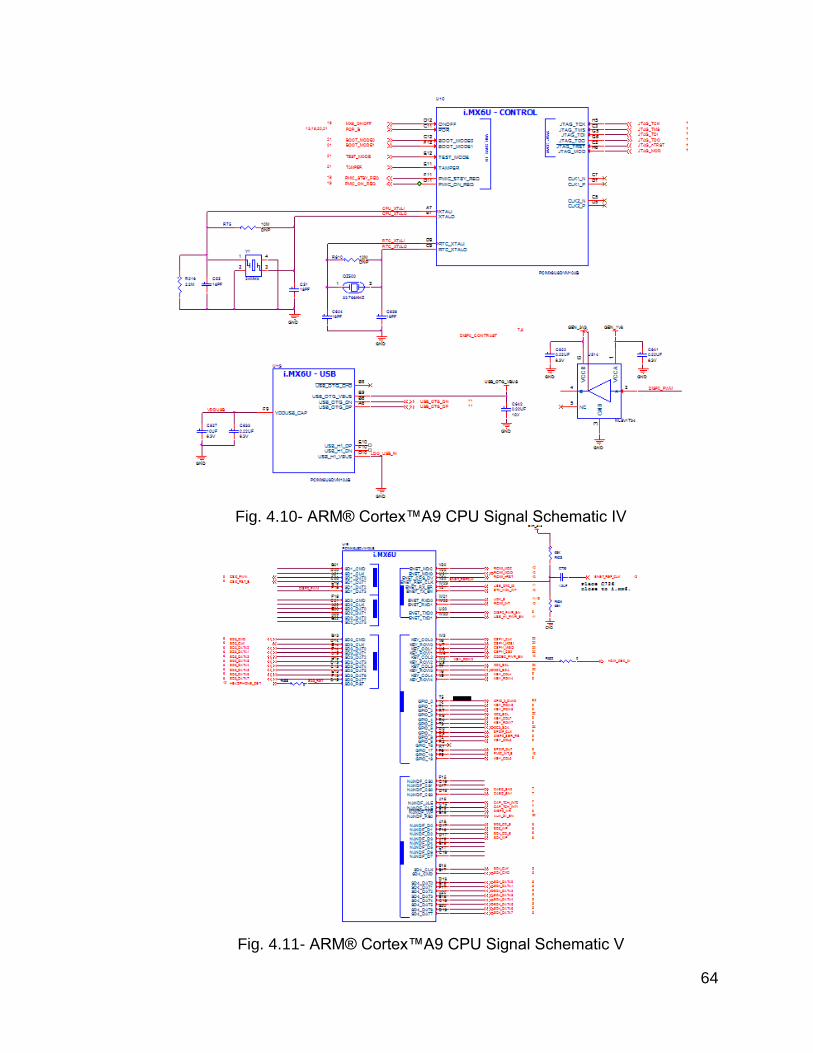
64
Fig. 4.10- ARM® Cortex™A9 CPU Signal Schematic IV
Fig. 4.11- ARM® Cortex™A9 CPU Signal Schematic V
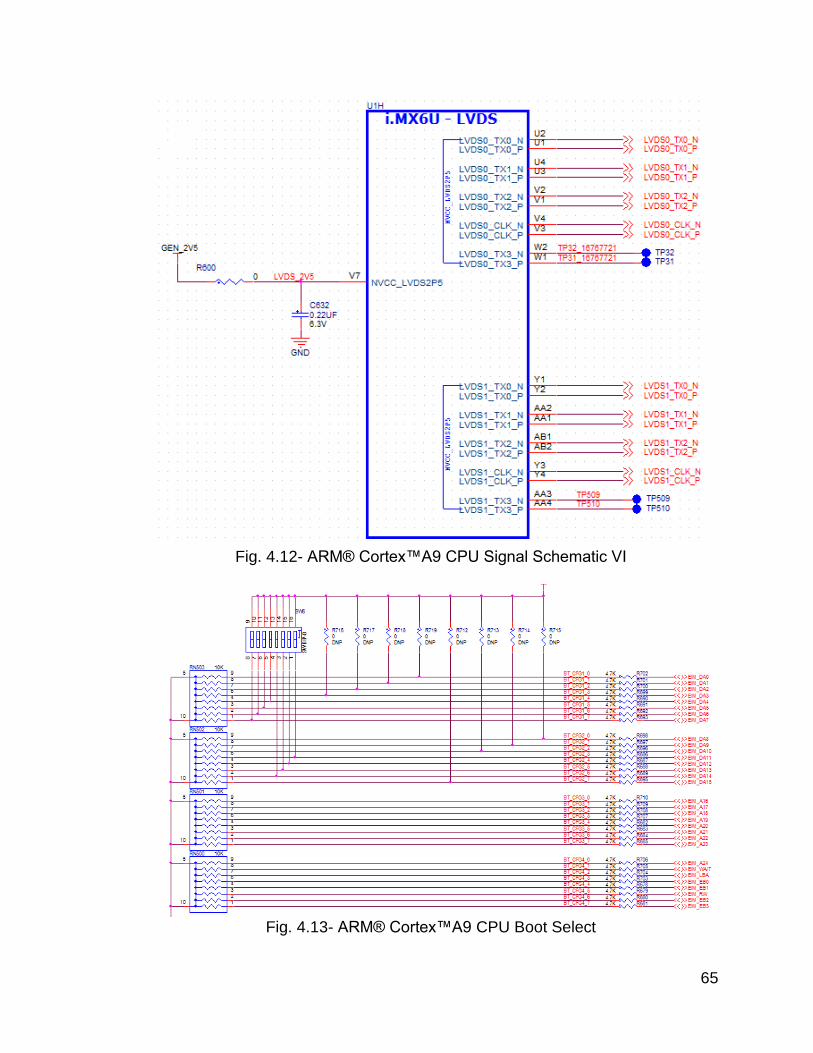
65
Fig. 4.12- ARM® Cortex™A9 CPU Signal Schematic VI
Fig. 4.13- ARM® Cortex™A9 CPU Boot Select
66
4.1.3 - RAM Module Configuration
The RAM utilized in GLASS is unique to the project due to the high sampling rate and sheer size of data processing power necessary for a computer to sample, store, and analyze gunshot audio signals from multiple sources. For this reason, the embedded hardware design utilizes a total of five RAM modules running in parallel in addition to the onboard RAM in the ARM® Cortex™A9 processor. The first RAM module is a single chip of 1 gb DDR3 SDRAM specifically utilized by the ARM® Cortex™A9 processor for calculations, operating system resources, and GLASS software resources. This module is similar to any other typical computing system that has a processor and memory. The following three pages display the ARM® Cortex™A9 processor connections to the 1 Gb DDR3 SDRAM which is split into four quadrants for visualization ease. The other four RAM modules are necessary for the read-write cycles of the audio signal processing. These RAM modules are Dual-Port RAM (DPRAM). DPRAM allows different reads and writes to occur simultaneously rather than one at a time, therefore preventing a data flow bottleneck. The fact that GLASS utilizes multiple audio data inputs, the data flow bottleneck would grow exponentially with each new data input which could possibly crash the whole system.
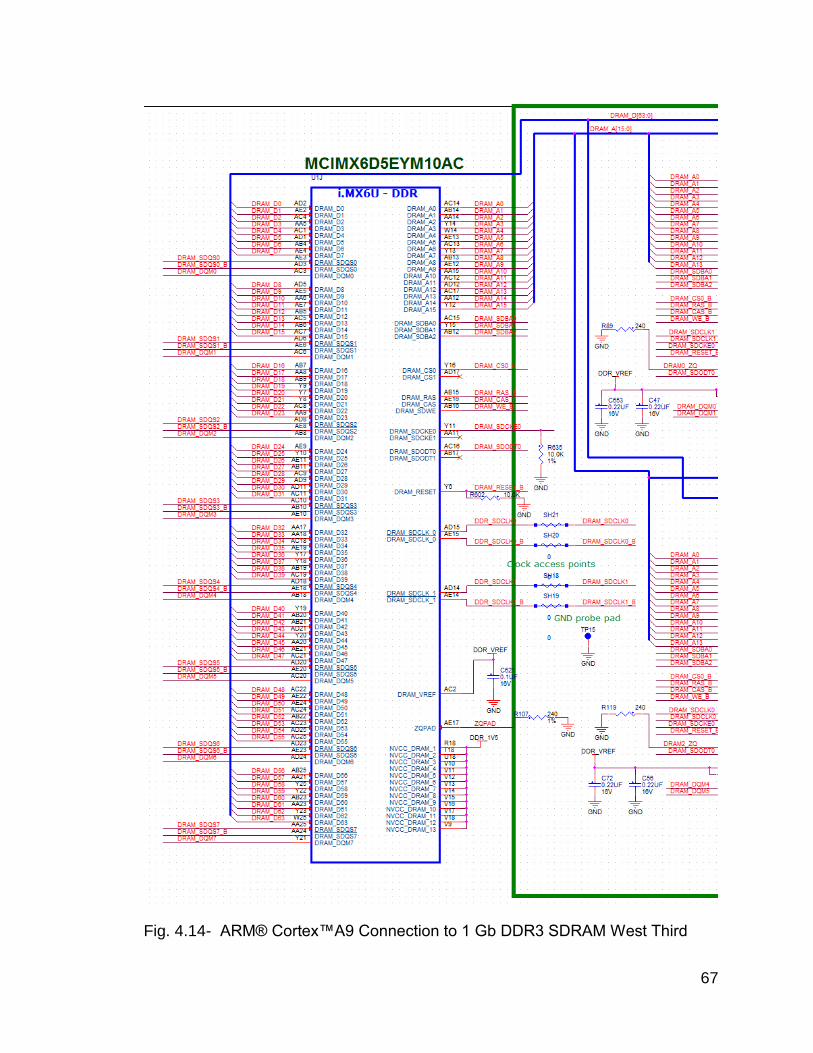
67
Fig. 4.14- ARM® Cortex™A9 Connection to 1 Gb DDR3 SDRAM West Third
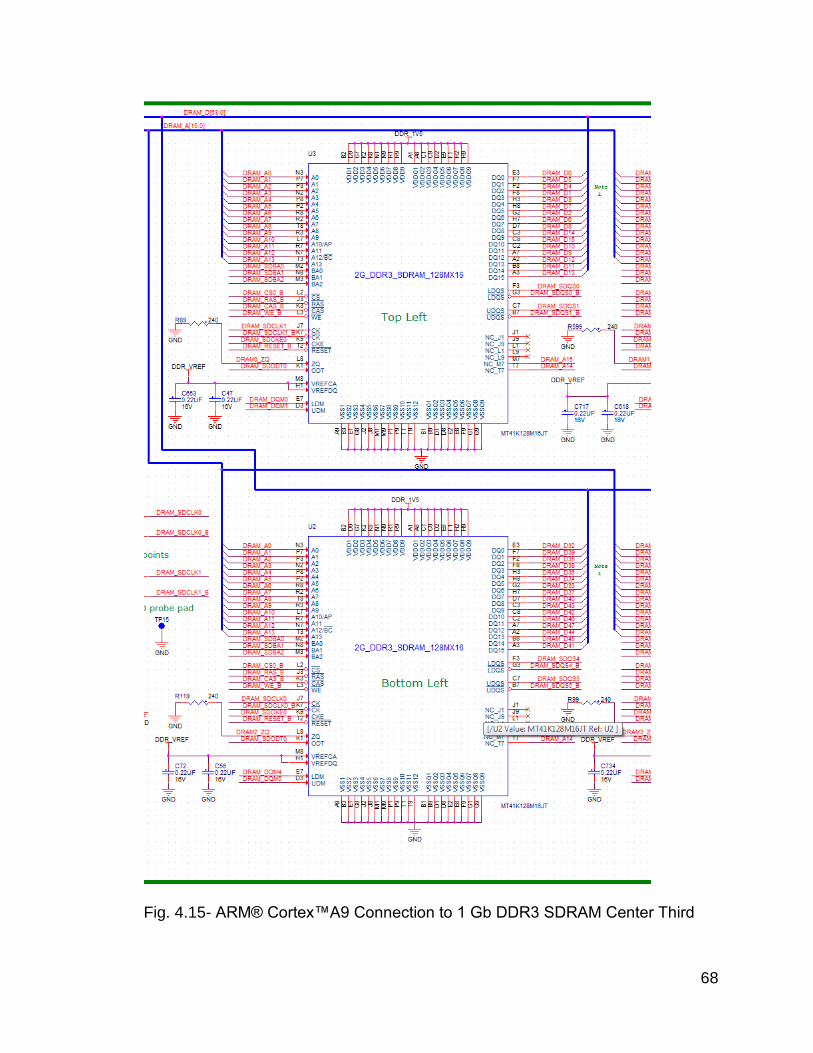
68
Fig. 4.15- ARM® Cortex™A9 Connection to 1 Gb DDR3 SDRAM Center Third
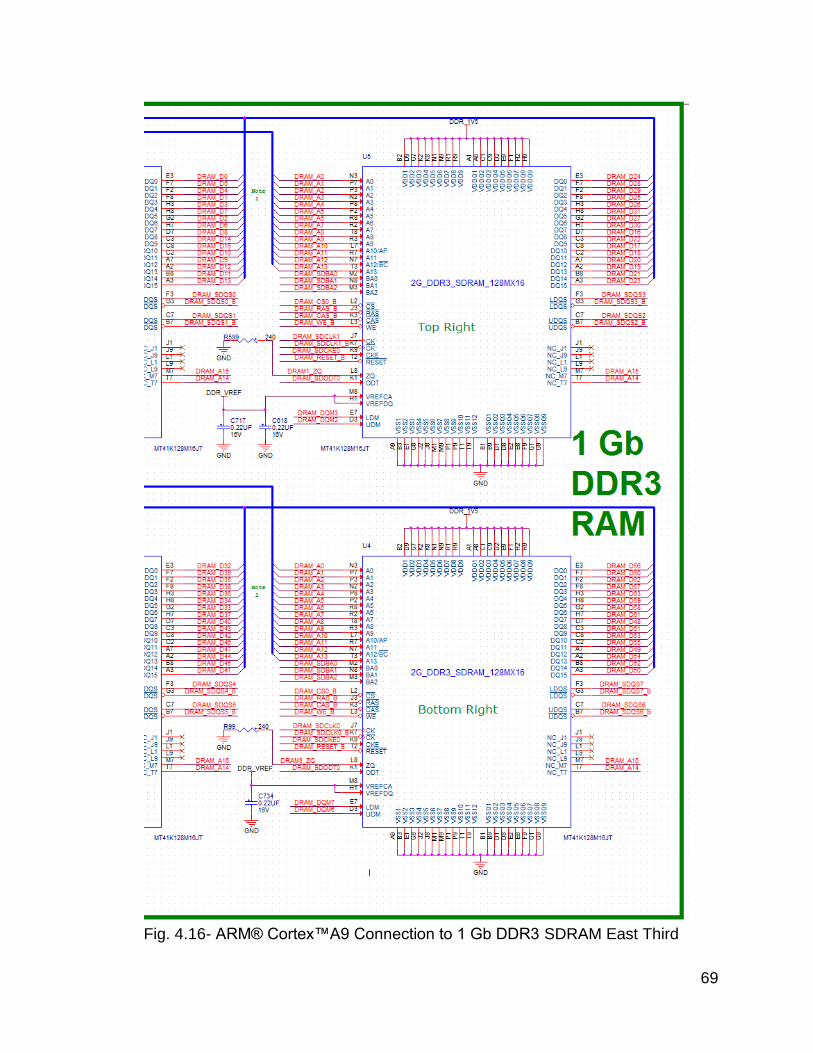
69
Fig. 4.16- ARM® Cortex™A9 Connection to 1 Gb DDR3 SDRAM East Third
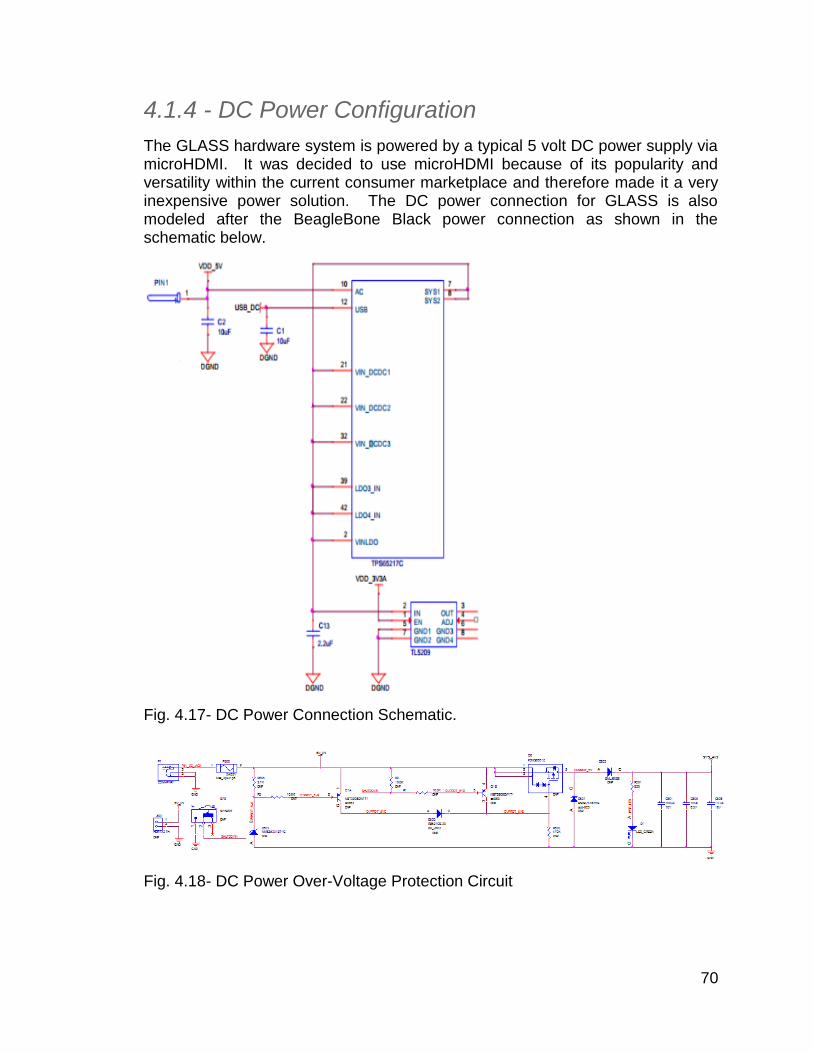
70
4.1.4 - DC Power Configuration
The GLASS hardware system is powered by a typical 5 volt DC power supply via microHDMI. It was decided to use microHDMI because of its popularity and versatility within the current consumer marketplace and therefore made it a very inexpensive power solution. The DC power connection for GLASS is also modeled after the BeagleBone Black power connection as shown in the schematic below.
Fig. 4.17- DC Power Connection Schematic.
Fig. 4.18- DC Power Over-Voltage Protection Circuit
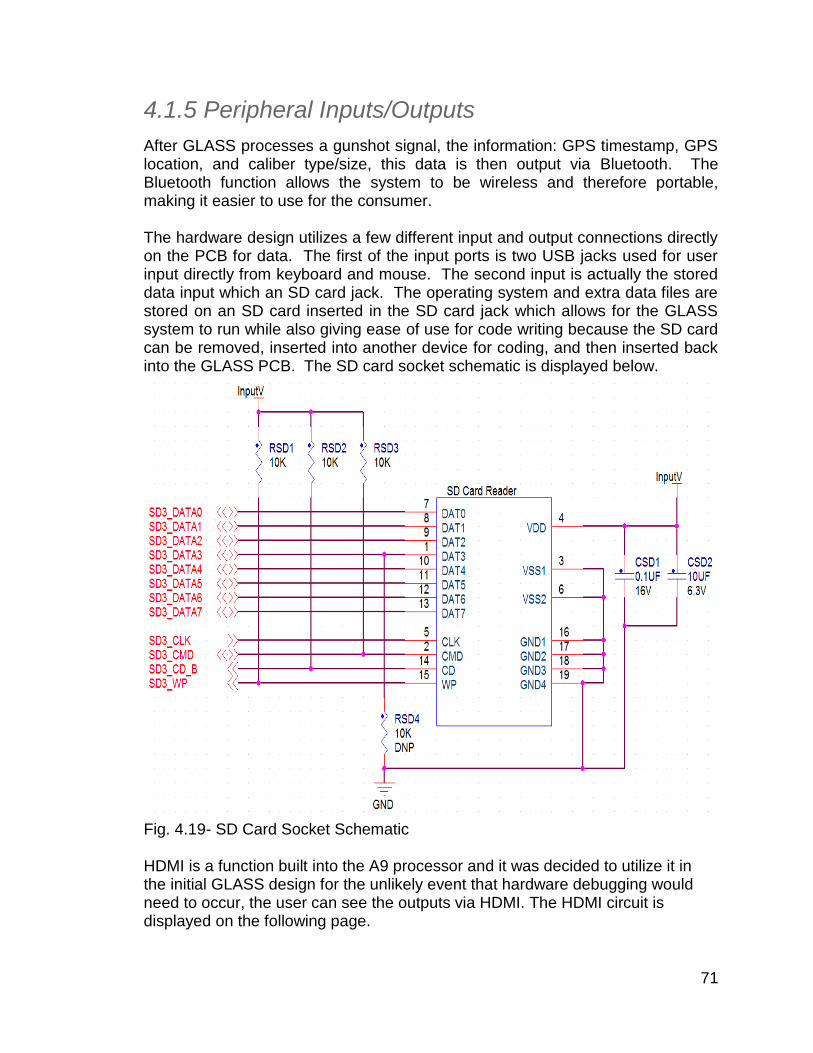
71
4.1.5 Peripheral Inputs/Outputs
After GLASS processes a gunshot signal, the information: GPS timestamp, GPS location, and caliber type/size, this data is then output via Bluetooth. The Bluetooth function allows the system to be wireless and therefore portable, making it easier to use for the consumer. The hardware design utilizes a few different input and output connections directly on the PCB for data. The first of the input ports is two USB jacks used for user input directly from keyboard and mouse. The second input is actually the stored data input which an SD card jack. The operating system and extra data files are stored on an SD card inserted in the SD card jack which allows for the GLASS system to run while also giving ease of use for code writing because the SD card can be removed, inserted into another device for coding, and then inserted back into the GLASS PCB. The SD card socket schematic is displayed below.
Fig. 4.19- SD Card Socket Schematic HDMI is a function built into the A9 processor and it was decided to utilize it in the initial GLASS design for the unlikely event that hardware debugging would need to occur, the user can see the outputs via HDMI. The HDMI circuit is displayed on the following page.
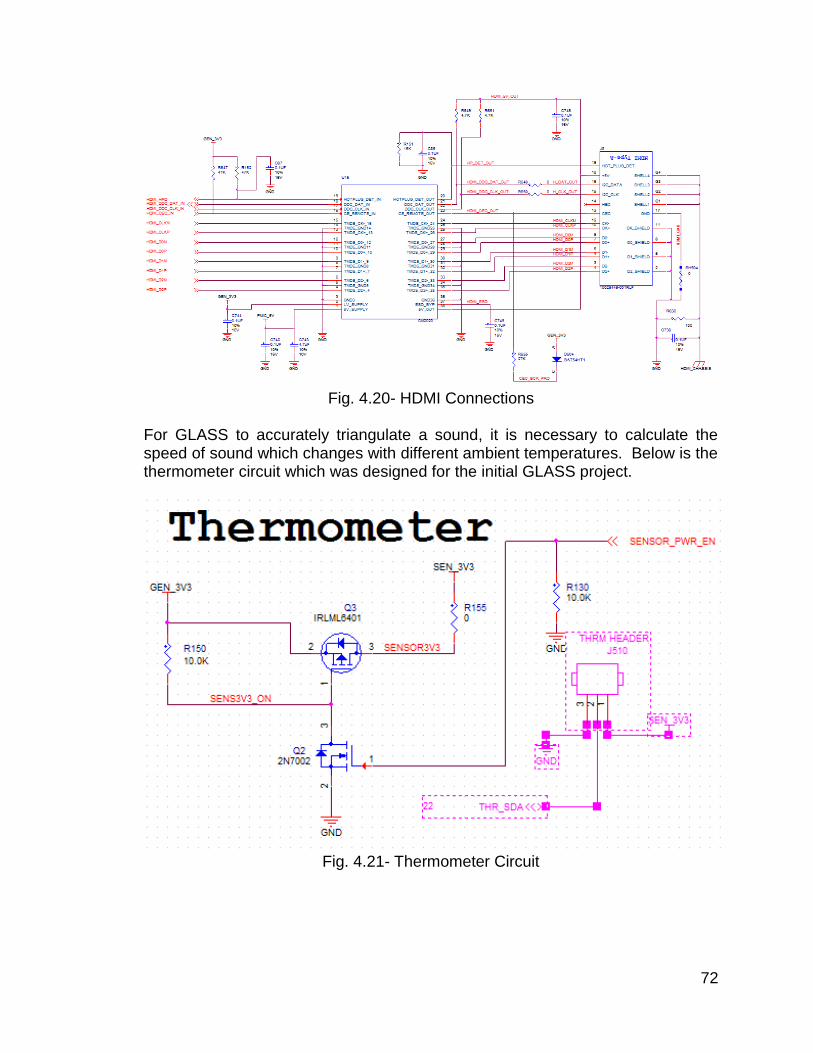
72
Fig. 4.20- HDMI Connections
For GLASS to accurately triangulate a sound, it is necessary to calculate the speed of sound which changes with different ambient temperatures. Below is the thermometer circuit which was designed for the initial GLASS project.
Fig. 4.21- Thermometer Circuit
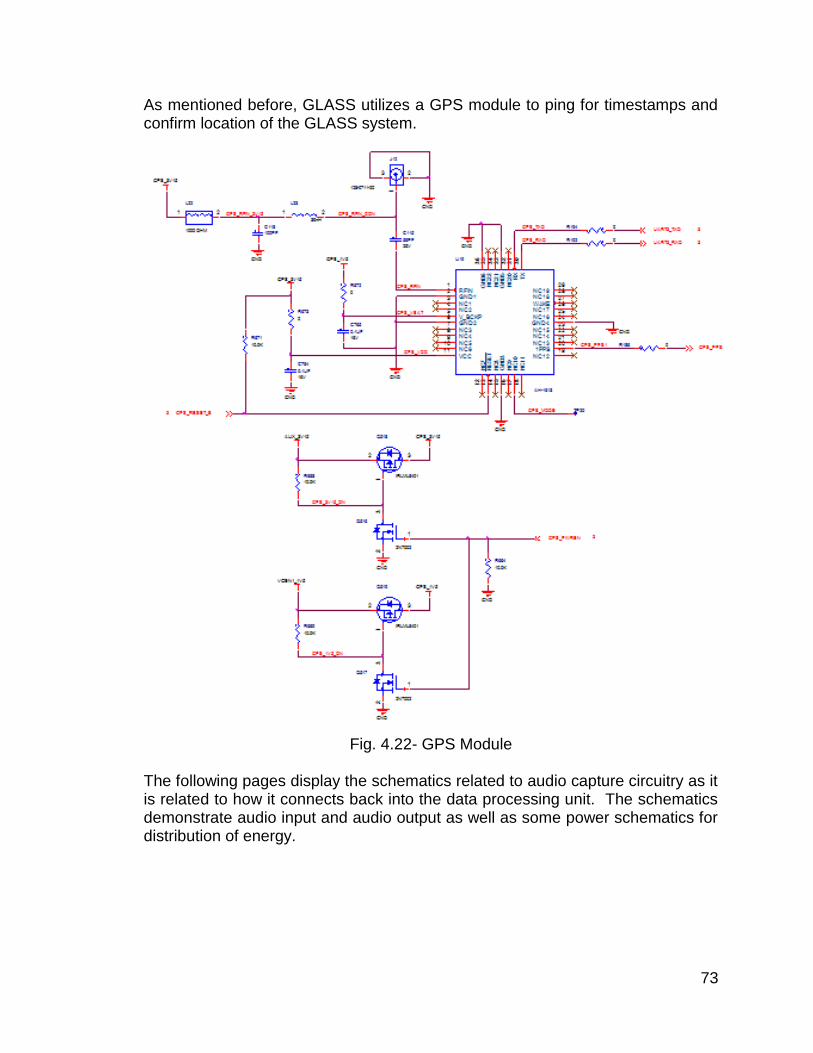
73
As mentioned before, GLASS utilizes a GPS module to ping for timestamps and confirm location of the GLASS system.
Fig. 4.22- GPS Module
The following pages display the schematics related to audio capture circuitry as it is related to how it connects back into the data processing unit. The schematics demonstrate audio input and audio output as well as some power schematics for distribution of energy.
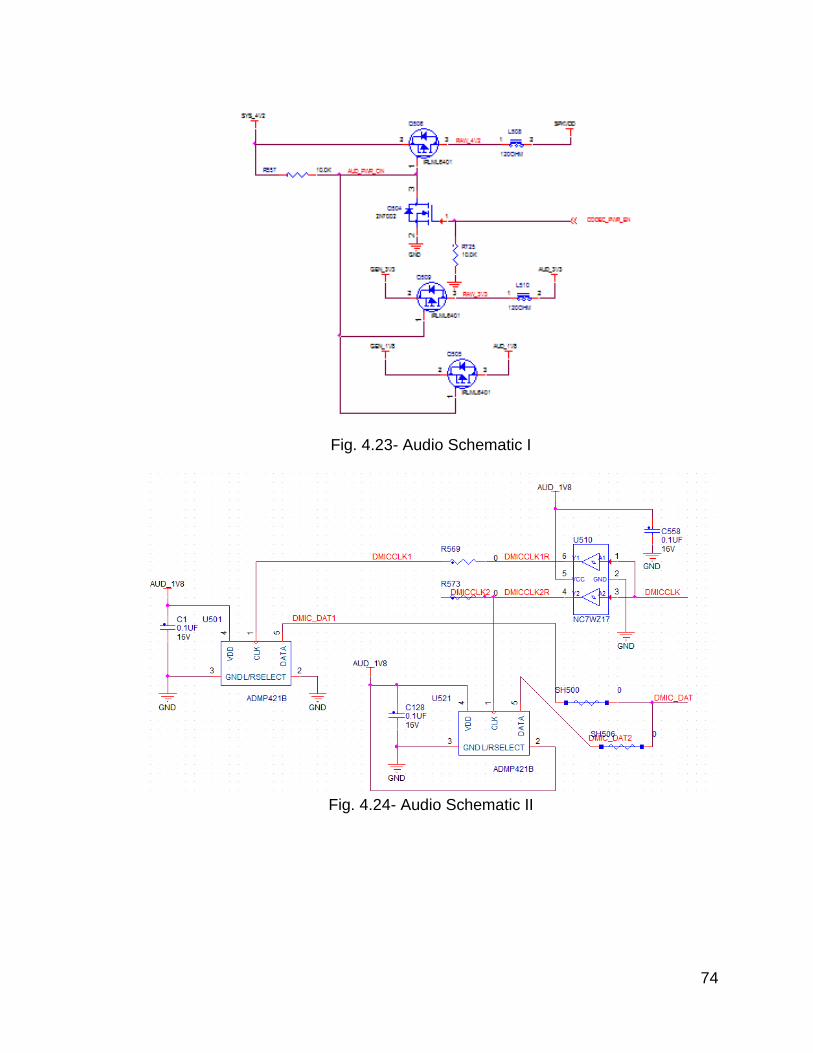
74
Fig. 4.23- Audio Schematic I
Fig. 4.24- Audio Schematic II
75
Fig. 4.25- Audio Schematic III
76
4.2 Initial Sound Capture Subsystem
The sound capture subsystem plays a pivotal role in our project given that we are relying on the sound of firearms to be the mechanism of the recognition of a firearm discharge and also to be the variable by which we triangulate the location of the firearm discharge event. The sound capture subsystem begins with it’s microphones. A carefully arranged array of 4 microphones will constantly sense or “hear” the environment around it. The microphones themselves offer very little in the way of signal strength so the signal of the microphones outputs are amplified through the use of an operational amplifier based noninverting differential amplifying circuit. The output of the amplifier is not usable in it’s analog form though however. An analog to digital converter receives this signal and digitizes it to be in a processable format. The analog to digital converter is thereby connected to an FPGA. The analog to digital converter has a serial bitstream output and it is the task of the FPGA to sort through these bits and store them into a special block of dual port static random access memory that will hold the data. The FPGA will have an SPI interface with the analog to digital converter to receive the bit stream and will have address lines and data lines connected to the blocks of dual port SRAM. Ultimately the FPGA frees up the processor from performing this task reserving some processing power for our algorithms. Overall the sound capture subsystem senses, amplifies, digitizes, and stores the real world data from our microphones so that the processor may have access to this data.
4.2.1 – Microphone
There was no shortage of selection in choosing a microphone. The first decision to be made was whether a digital or analog microphone should be used. Digital microphones are commonly of the MEMS type. While intuitively we wanted to pick a digital microphone given the heavy amount of digital signal processing that will be involved with the project and the ease of connecting such a microphone to our system, a few realizations were made that excluded the possibility of using a digital microphone. On average, most of the digital microphones that were researched showed inherently average or poor audio characteristics (in relation to our requirements). Compared to analog microphones, most of the digital microphones with a few exceptions did not have as good a frequency range, frequency response, nor sensitivity properties. The only category in which the digital microphones were evenly matched in with analog microphone devices was in signal to noise ratio. An example is shown from the specs of the SPM1437HM4H-B:
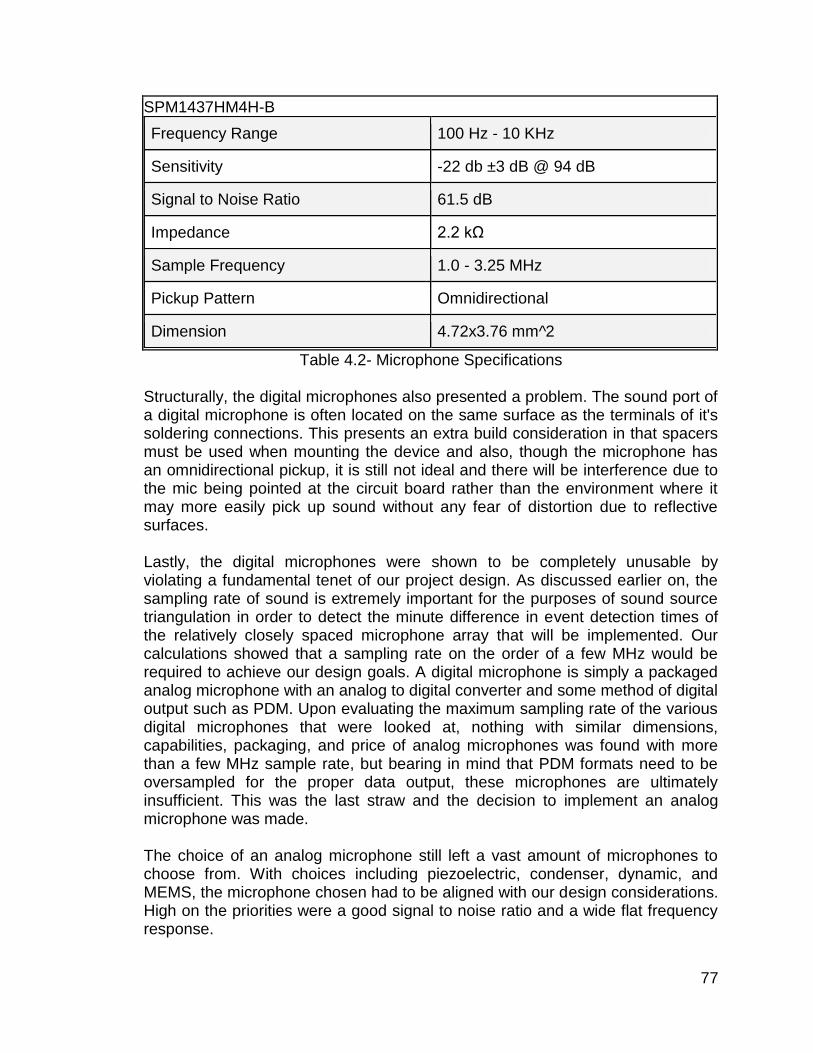
77
SPM1437HM4H-B
Frequency Range 100 Hz - 10 KHz
Sensitivity -22 db ±3 dB @ 94 dB
Signal to Noise Ratio 61.5 dB
Impedance 2.2 kΩ
Sample Frequency 1.0 - 3.25 MHz
Pickup Pattern Omnidirectional
Dimension 4.72x3.76 mm^2
Table 4.2- Microphone Specifications Structurally, the digital microphones also presented a problem. The sound port of a digital microphone is often located on the same surface as the terminals of it's soldering connections. This presents an extra build consideration in that spacers must be used when mounting the device and also, though the microphone has an omnidirectional pickup, it is still not ideal and there will be interference due to the mic being pointed at the circuit board rather than the environment where it may more easily pick up sound without any fear of distortion due to reflective surfaces. Lastly, the digital microphones were shown to be completely unusable by violating a fundamental tenet of our project design. As discussed earlier on, the sampling rate of sound is extremely important for the purposes of sound source triangulation in order to detect the minute difference in event detection times of the relatively closely spaced microphone array that will be implemented. Our calculations showed that a sampling rate on the order of a few MHz would be required to achieve our design goals. A digital microphone is simply a packaged analog microphone with an analog to digital converter and some method of digital output such as PDM. Upon evaluating the maximum sampling rate of the various digital microphones that were looked at, nothing with similar dimensions, capabilities, packaging, and price of analog microphones was found with more than a few MHz sample rate, but bearing in mind that PDM formats need to be oversampled for the proper data output, these microphones are ultimately insufficient. This was the last straw and the decision to implement an analog microphone was made. The choice of an analog microphone still left a vast amount of microphones to choose from. With choices including piezoelectric, condenser, dynamic, and MEMS, the microphone chosen had to be aligned with our design considerations. High on the priorities were a good signal to noise ratio and a wide flat frequency response.
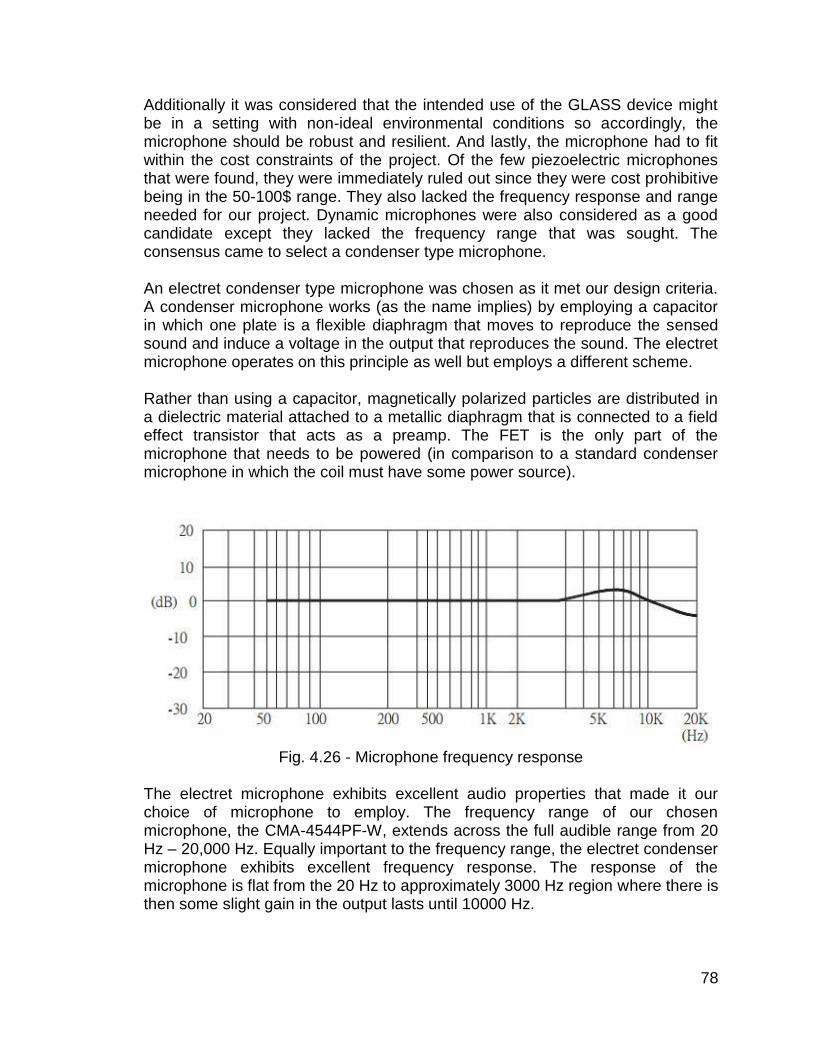
78
Additionally it was considered that the intended use of the GLASS device might be in a setting with non-ideal environmental conditions so accordingly, the microphone should be robust and resilient. And lastly, the microphone had to fit within the cost constraints of the project. Of the few piezoelectric microphones that were found, they were immediately ruled out since they were cost prohibitive being in the 50-100$ range. They also lacked the frequency response and range needed for our project. Dynamic microphones were also considered as a good candidate except they lacked the frequency range that was sought. The consensus came to select a condenser type microphone. An electret condenser type microphone was chosen as it met our design criteria. A condenser microphone works (as the name implies) by employing a capacitor in which one plate is a flexible diaphragm that moves to reproduce the sensed sound and induce a voltage in the output that reproduces the sound. The electret microphone operates on this principle as well but employs a different scheme. Rather than using a capacitor, magnetically polarized particles are distributed in a dielectric material attached to a metallic diaphragm that is connected to a field effect transistor that acts as a preamp. The FET is the only part of the microphone that needs to be powered (in comparison to a standard condenser microphone in which the coil must have some power source).
Fig. 4.26 - Microphone frequency response
The electret microphone exhibits excellent audio properties that made it our choice of microphone to employ. The frequency range of our chosen microphone, the CMA-4544PF-W, extends across the full audible range from 20 Hz – 20,000 Hz. Equally important to the frequency range, the electret condenser microphone exhibits excellent frequency response. The response of the microphone is flat from the 20 Hz to approximately 3000 Hz region where there is then some slight gain in the output lasts until 10000 Hz.

79
The gain then rolls off until 20,000 Hz which is the half power frequency of the microphone. The microphone seems to be very well designed given these specifications of the frequency response. The microphone also sports a good signal to noise ratio of 60 dB.
CMA-4544PF-W
Frequency Range 20 Hz - 20 KHz
Sensitivity -44 db ±2 dB @ 94 dB
Signal to Noise Ratio 60 dB
Impedance 2.2 kΩ
Voltage 3 - 10 V
Pickup Pattern Omnidirectional
Dimension 9.7x4.5 mm^2
Table 4.3- Condenser Microphone Specifications
Electret condenser microphones are also known for their durability since they are enclosed in a metal capsule which further solidified itself as our microphone of choice. Given the simplistic design of the microphone, we expect it to perform well in a variety of operating environments making it ideal for our project. Perhaps as a result of the efficient design the microphone is very affordable at a price of $0.96 cents per unit.
The actual circuit model is shown below in which a capacitor connected to the gate of a JFET represents the microphone. A 12 V rail with resistor is tied to the drain line of the JFET to turn it on and a DC block capacitor is placed at the output to allow the AC microphone signal to pass through.
Fig. 4.27- JFET Circuit Model
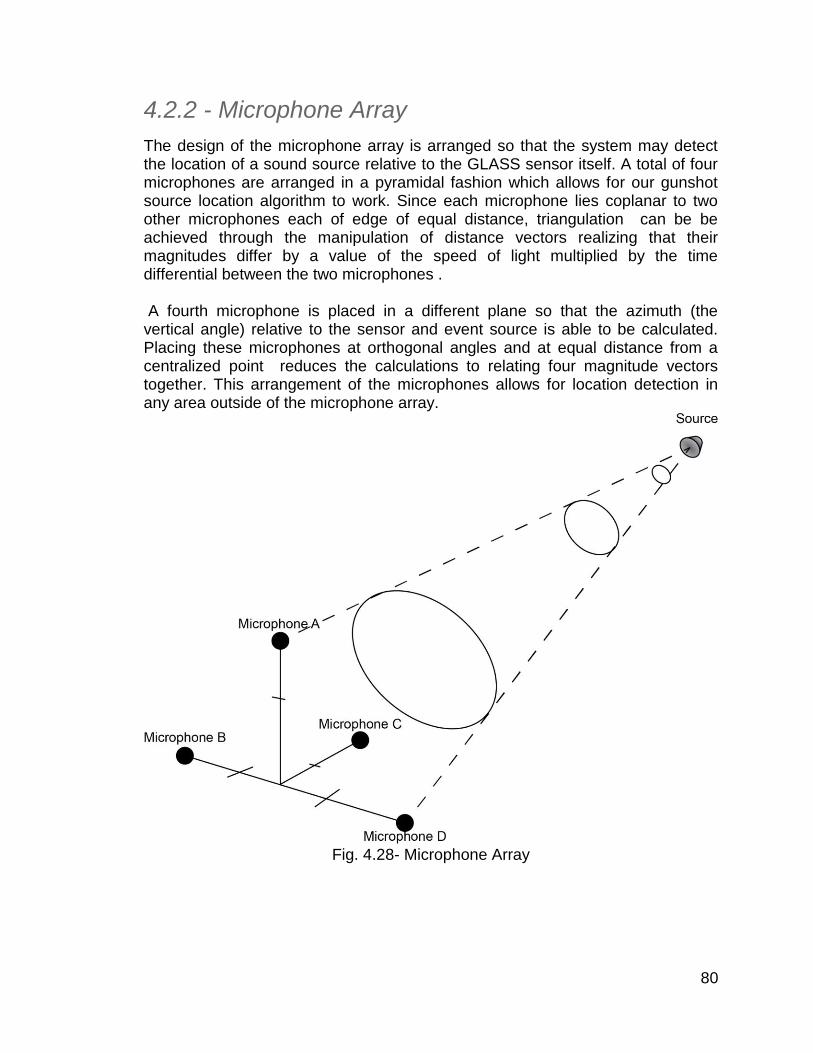
80
4.2.2 - Microphone Array
The design of the microphone array is arranged so that the system may detect the location of a sound source relative to the GLASS sensor itself. A total of four microphones are arranged in a pyramidal fashion which allows for our gunshot source location algorithm to work. Since each microphone lies coplanar to two other microphones each of edge of equal distance, triangulation can be be achieved through the manipulation of distance vectors realizing that their magnitudes differ by a value of the speed of light multiplied by the time differential between the two microphones . A fourth microphone is placed in a different plane so that the azimuth (the vertical angle) relative to the sensor and event source is able to be calculated. Placing these microphones at orthogonal angles and at equal distance from a centralized point reduces the calculations to relating four magnitude vectors together. This arrangement of the microphones allows for location detection in any area outside of the microphone array.
Fig. 4.28- Microphone Array
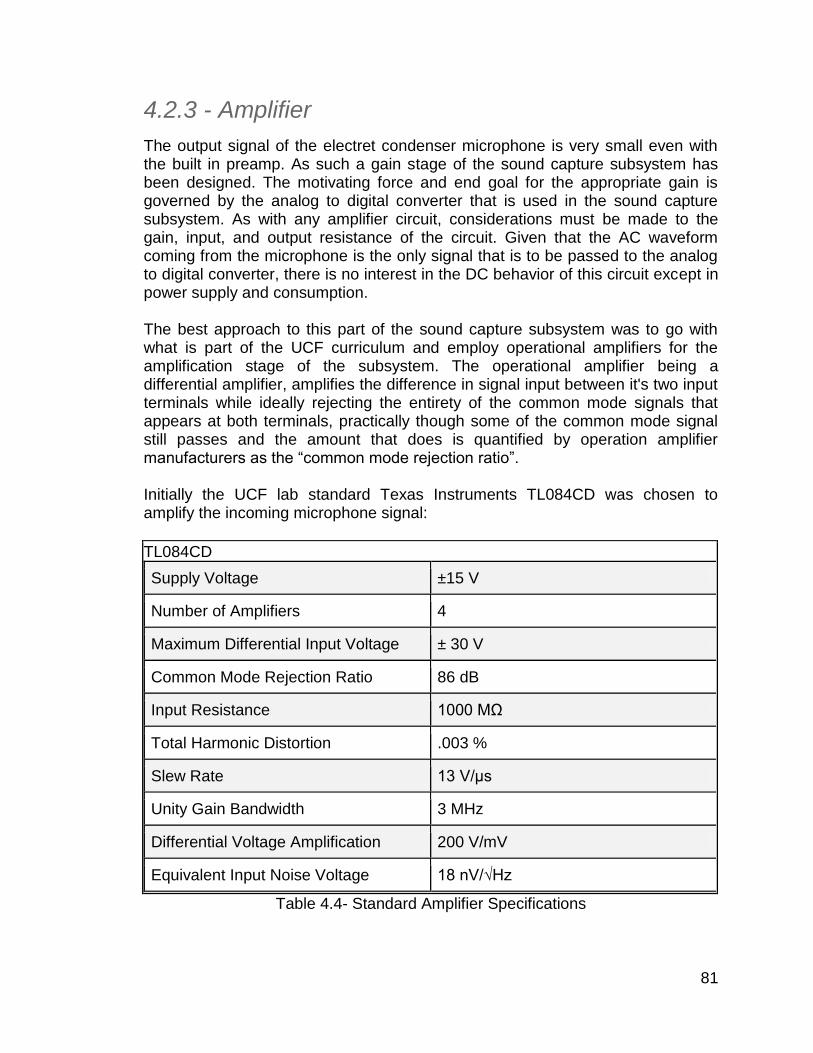
81
4.2.3 - Amplifier
The output signal of the electret condenser microphone is very small even with the built in preamp. As such a gain stage of the sound capture subsystem has been designed. The motivating force and end goal for the appropriate gain is governed by the analog to digital converter that is used in the sound capture subsystem. As with any amplifier circuit, considerations must be made to the gain, input, and output resistance of the circuit. Given that the AC waveform coming from the microphone is the only signal that is to be passed to the analog to digital converter, there is no interest in the DC behavior of this circuit except in power supply and consumption. The best approach to this part of the sound capture subsystem was to go with what is part of the UCF curriculum and employ operational amplifiers for the amplification stage of the subsystem. The operational amplifier being a differential amplifier, amplifies the difference in signal input between it's two input terminals while ideally rejecting the entirety of the common mode signals that appears at both terminals, practically though some of the common mode signal still passes and the amount that does is quantified by operation amplifier manufacturers as the “common mode rejection ratio”. Initially the UCF lab standard Texas Instruments TL084CD was chosen to amplify the incoming microphone signal:
TL084CD
Supply Voltage ±15 V
Number of Amplifiers 4
Maximum Differential Input Voltage ± 30 V
Common Mode Rejection Ratio 86 dB
Input Resistance 1000 MΩ
Total Harmonic Distortion .003 %
Slew Rate 13 V/μs
Unity Gain Bandwidth 3 MHz
Differential Voltage Amplification 200 V/mV
Equivalent Input Noise Voltage 18 nV/√Hz
Table 4.4- Standard Amplifier Specifications
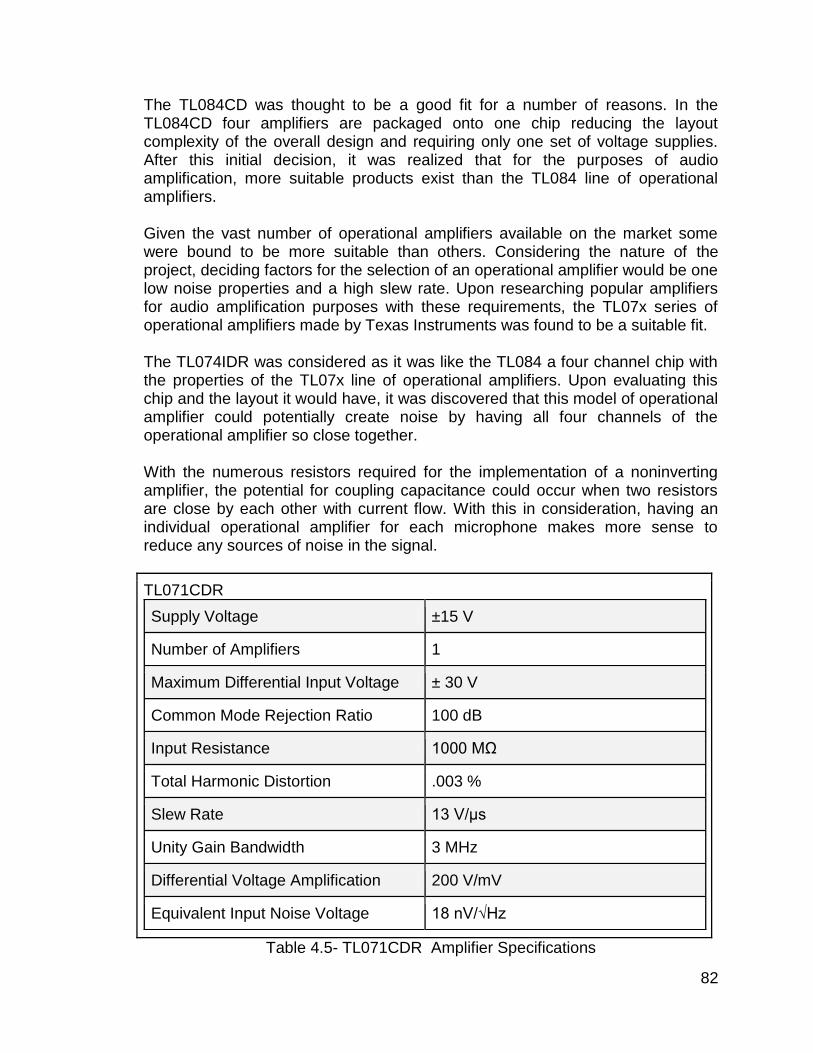
82
The TL084CD was thought to be a good fit for a number of reasons. In the TL084CD four amplifiers are packaged onto one chip reducing the layout complexity of the overall design and requiring only one set of voltage supplies. After this initial decision, it was realized that for the purposes of audio amplification, more suitable products exist than the TL084 line of operational amplifiers.
Given the vast number of operational amplifiers available on the market some were bound to be more suitable than others. Considering the nature of the project, deciding factors for the selection of an operational amplifier would be one low noise properties and a high slew rate. Upon researching popular amplifiers for audio amplification purposes with these requirements, the TL07x series of operational amplifiers made by Texas Instruments was found to be a suitable fit. The TL074IDR was considered as it was like the TL084 a four channel chip with the properties of the TL07x line of operational amplifiers. Upon evaluating this chip and the layout it would have, it was discovered that this model of operational amplifier could potentially create noise by having all four channels of the operational amplifier so close together. With the numerous resistors required for the implementation of a noninverting amplifier, the potential for coupling capacitance could occur when two resistors are close by each other with current flow. With this in consideration, having an individual operational amplifier for each microphone makes more sense to reduce any sources of noise in the signal.
TL071CDR
Supply Voltage ±15 V
Number of Amplifiers 1
Maximum Differential Input Voltage ± 30 V
Common Mode Rejection Ratio 100 dB
Input Resistance 1000 MΩ
Total Harmonic Distortion .003 %
Slew Rate 13 V/μs
Unity Gain Bandwidth 3 MHz
Differential Voltage Amplification 200 V/mV
Equivalent Input Noise Voltage 18 nV/√Hz
Table 4.5- TL071CDR Amplifier Specifications
83
So finally, GLASS will make use of the Texas Instruments TL071CDR operational amplifier. The TL071CDR has a very high common mode rejection ratio, low total harmonic distortion, and is low noise making it ideal for our application. The basic non-inverting feedback operational amplifier topology has a gain of
However as gain is increased distortion and other effects become apparent so multiple stages of op-amps are used in the GLASS amplifying circuit. This also makes impedance matching easier so the desired input and output resistances can be achieved in stages along with the gain rather than balancing these figures with one operation amplifier circuit albeit at the expense of cost and space on the final device. A two stage operational amplifier network was created that is connected to each microphone. The electret microphones have an output impedance of 2 kΩ so the input impedance of the operational amplifier is matched to 2 kΩ for maximum power transfer. The microphone preamp output will have an output of 10 mV to -10 mV that must be stepped up to 1.5 V pk. There must therefore be a gain of 150. The first amplifier stage gives a gain of 15:
The second amplifier achieves a gain of 10:
The overall gain thus becomes 150 giving the desired gain in order to drive the analog to digital converter.
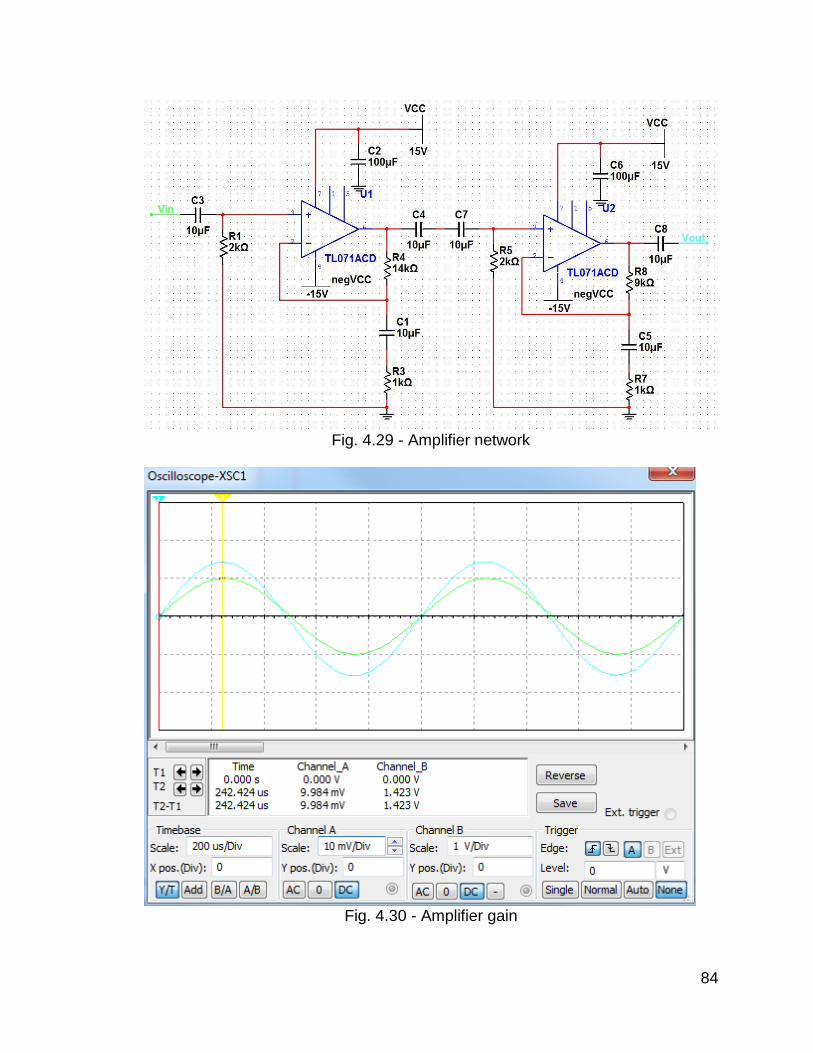
84
Fig. 4.29 - Amplifier network
Fig. 4.30 - Amplifier gain
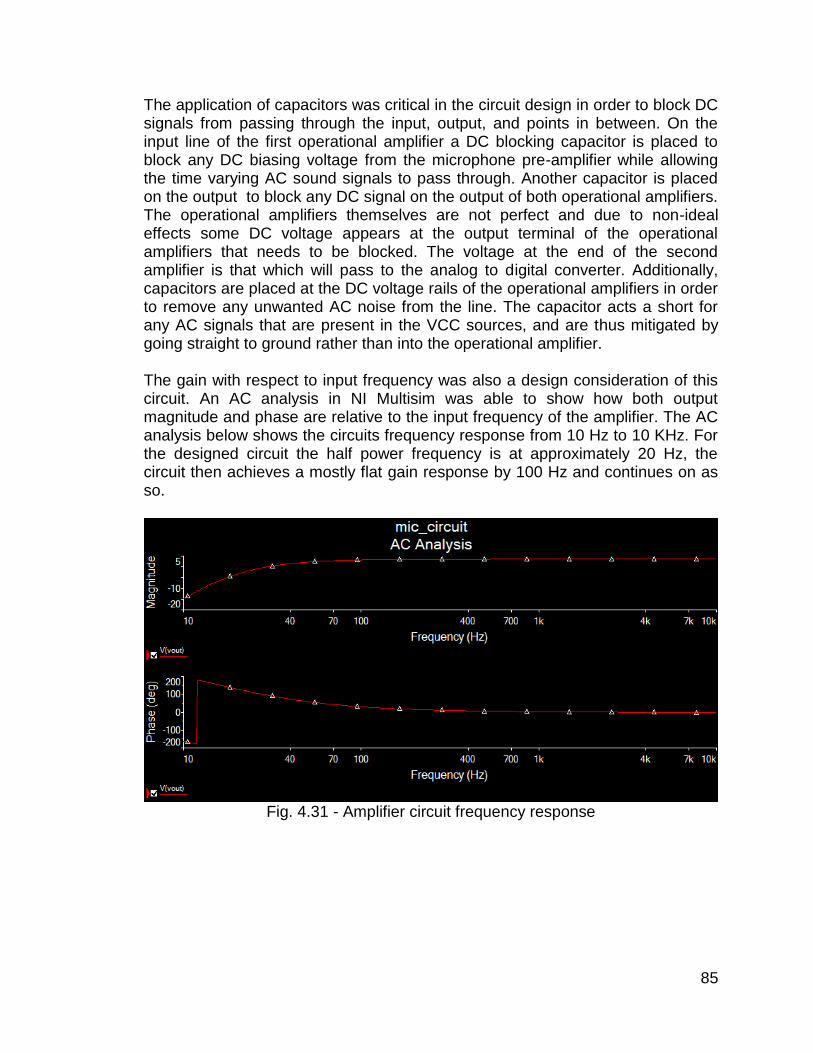
85
The application of capacitors was critical in the circuit design in order to block DC signals from passing through the input, output, and points in between. On the input line of the first operational amplifier a DC blocking capacitor is placed to block any DC biasing voltage from the microphone pre-amplifier while allowing the time varying AC sound signals to pass through. Another capacitor is placed on the output to block any DC signal on the output of both operational amplifiers. The operational amplifiers themselves are not perfect and due to non-ideal effects some DC voltage appears at the output terminal of the operational amplifiers that needs to be blocked. The voltage at the end of the second amplifier is that which will pass to the analog to digital converter. Additionally, capacitors are placed at the DC voltage rails of the operational amplifiers in order to remove any unwanted AC noise from the line. The capacitor acts a short for any AC signals that are present in the VCC sources, and are thus mitigated by going straight to ground rather than into the operational amplifier. The gain with respect to input frequency was also a design consideration of this circuit. An AC analysis in NI Multisim was able to show how both output magnitude and phase are relative to the input frequency of the amplifier. The AC analysis below shows the circuits frequency response from 10 Hz to 10 KHz. For the designed circuit the half power frequency is at approximately 20 Hz, the circuit then achieves a mostly flat gain response by 100 Hz and continues on as so.
Fig. 4.31 - Amplifier circuit frequency response
86
4.2.4 - Analog to Digital Converter The analog to digital converter is the bridge between our real world and the one within any kind of digital system, having applications in audio, video, motor control, and numerous other categories. An analog to digital converter effectively samples an input and then holds that value for one period of the sampling frequency to include it in it's digital output. One important aspect of an analog to digital converter is the length of the sampling period. This period determines the sampling rate frequency at which it can sample and convert the analog input. Another aspect of the analog to digital converter is the input method. Integrated circuit analog to digital converters often operate in extremely noisy environments. Whether in an embedded system or a computer, other components of the system will introduce noise to the signal the analog to digital converter is receiving. The case being such, a solution is presented by using a differentially driven input. Just as with the gain process of the operational amplifier mentioned earlier, the analog to digital converter employs the same technique to mitigate the noise present in the sampled signal. Yet another important aspect of the analog to digital converter is it's output mode. Having a digital bit output, the analog to digital converter has many schemes to output it's data to the appropriate device. The output formats of the analog to digital converter can be in either a parallel or serial format. The parallel output analog to digital converters behave quite similarly to random access memory in their storage and output of data. They often contain registers synchronized to a clock line that controls the data output of the device so that the data may be triggered and latched by the device accessing it. This parallel mode offers the advantage of quickly accessing the data as every bit of the output word is accessed at the same time. However it suffers the disadvantage of complexity and size as many lines must be tied between the analog to digital and controlling device. The alternative is a serialized output. Rather than reinventing the wheel, serial outputs often follow a well established serial communication scheme. These include SPI, QSPI, LVDS, and I2C among others. Each standard having it's own attributes that may be important to the designers product. The process of selecting an analog to digital converter proved to be an arduous task. With so many options the designer can often feel bewildered how to select the one appropriate for the needs of the project. Initially it was thought the sampling rate of the analog to digital converter needed to be very high on the order of tens of MHz. Few products existed at this speed and were quite expensive. The first device considered was the Integrated Device Technology ADC1210S065HN/C1:5.
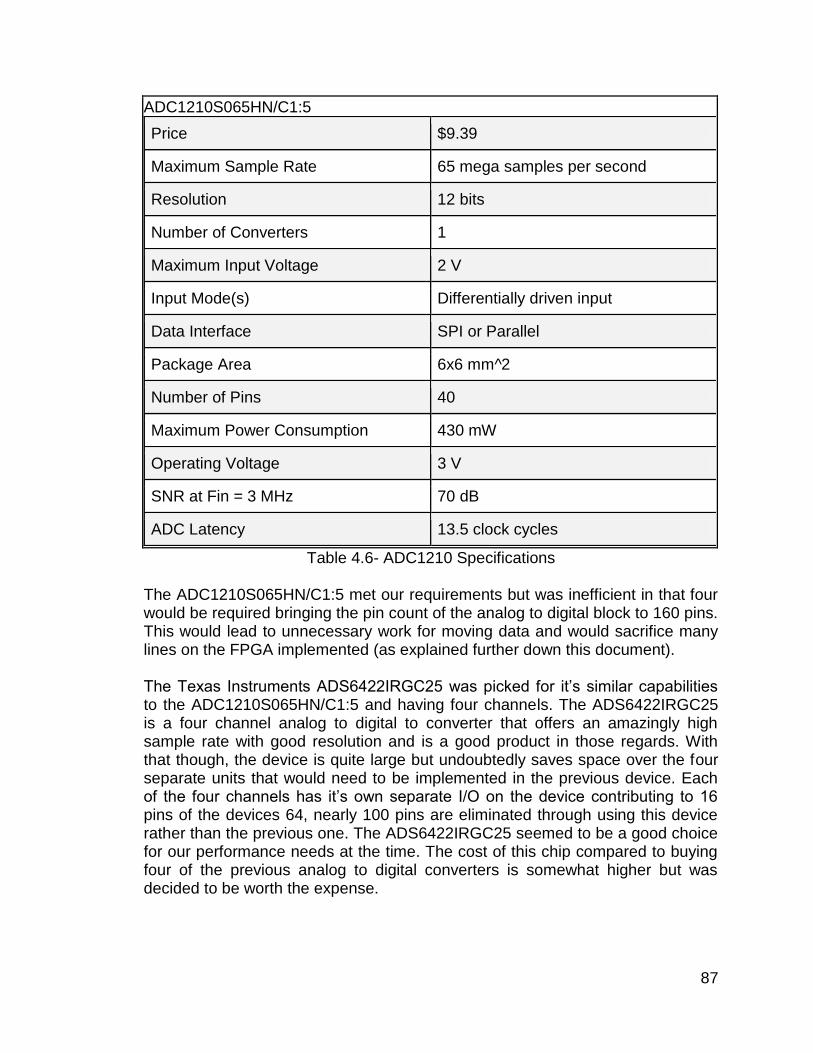
87
ADC1210S065HN/C1:5
Price $9.39
Maximum Sample Rate 65 mega samples per second
Resolution 12 bits
Number of Converters 1
Maximum Input Voltage 2 V
Input Mode(s) Differentially driven input
Data Interface SPI or Parallel
Package Area 6x6 mm^2
Number of Pins 40
Maximum Power Consumption 430 mW
Operating Voltage 3 V
SNR at Fin = 3 MHz 70 dB
ADC Latency 13.5 clock cycles
Table 4.6- ADC1210 Specifications The ADC1210S065HN/C1:5 met our requirements but was inefficient in that four would be required bringing the pin count of the analog to digital block to 160 pins. This would lead to unnecessary work for moving data and would sacrifice many lines on the FPGA implemented (as explained further down this document). The Texas Instruments ADS6422IRGC25 was picked for it’s similar capabilities to the ADC1210S065HN/C1:5 and having four channels. The ADS6422IRGC25 is a four channel analog to digital to converter that offers an amazingly high sample rate with good resolution and is a good product in those regards. With that though, the device is quite large but undoubtedly saves space over the four separate units that would need to be implemented in the previous device. Each of the four channels has it’s own separate I/O on the device contributing to 16 pins of the devices 64, nearly 100 pins are eliminated through using this device rather than the previous one. The ADS6422IRGC25 seemed to be a good choice for our performance needs at the time. The cost of this chip compared to buying four of the previous analog to digital converters is somewhat higher but was decided to be worth the expense.
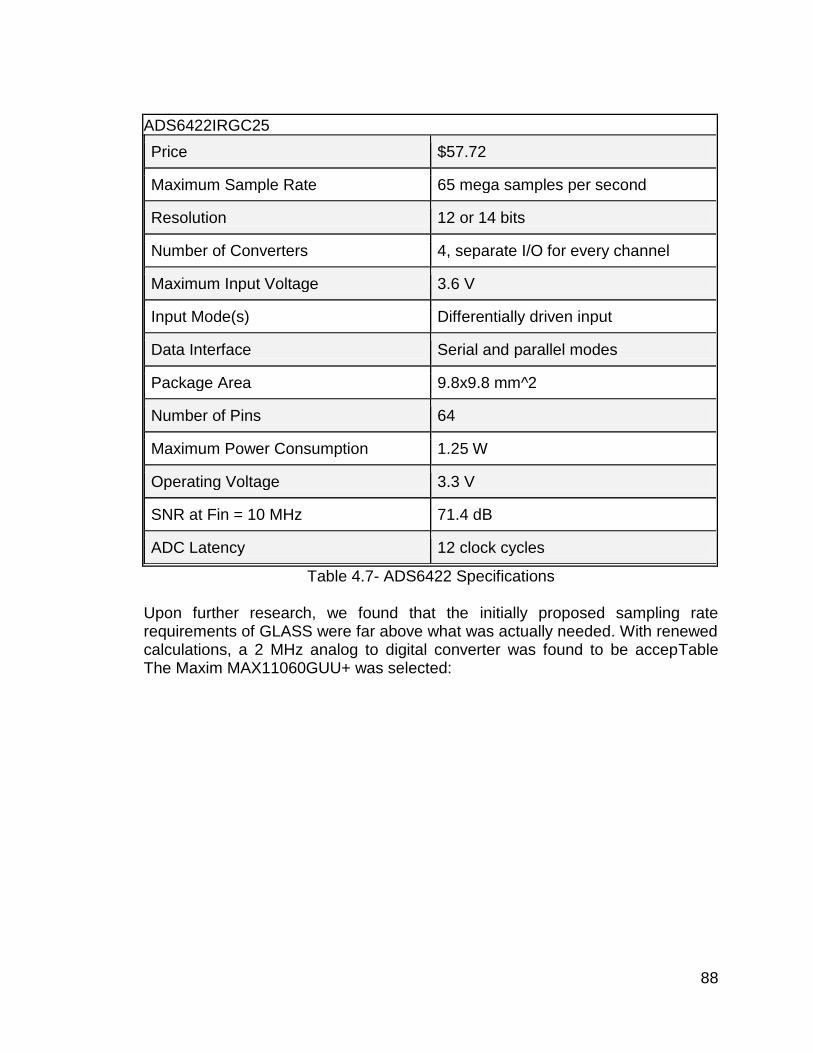
88
ADS6422IRGC25
Price $57.72
Maximum Sample Rate 65 mega samples per second
Resolution 12 or 14 bits
Number of Converters 4, separate I/O for every channel
Maximum Input Voltage 3.6 V
Input Mode(s) Differentially driven input
Data Interface Serial and parallel modes
Package Area 9.8x9.8 mm^2
Number of Pins 64
Maximum Power Consumption 1.25 W
Operating Voltage 3.3 V
SNR at Fin = 10 MHz 71.4 dB
ADC Latency 12 clock cycles
Table 4.7- ADS6422 Specifications Upon further research, we found that the initially proposed sampling rate requirements of GLASS were far above what was actually needed. With renewed calculations, a 2 MHz analog to digital converter was found to be accepTable The Maxim MAX11060GUU+ was selected:
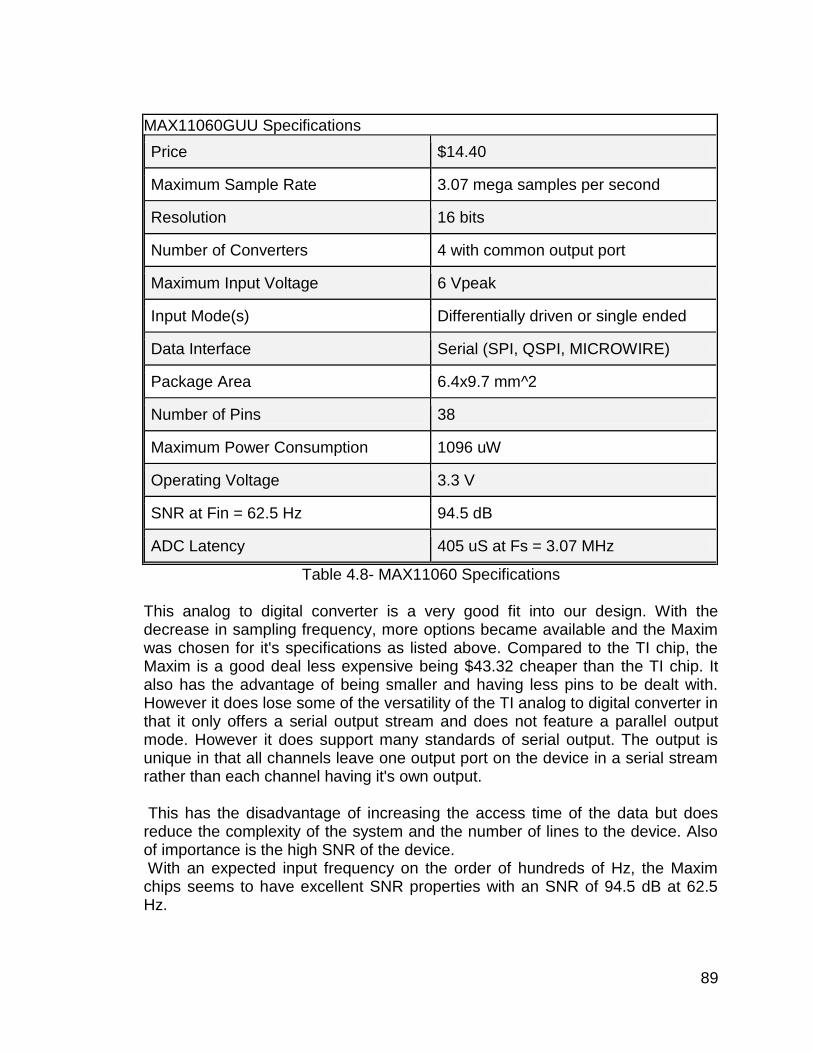
89
MAX11060GUU Specifications
Price $14.40
Maximum Sample Rate 3.07 mega samples per second
Resolution 16 bits
Number of Converters 4 with common output port
Maximum Input Voltage 6 Vpeak
Input Mode(s) Differentially driven or single ended
Data Interface Serial (SPI, QSPI, MICROWIRE)
Package Area 6.4x9.7 mm^2
Number of Pins 38
Maximum Power Consumption 1096 uW
Operating Voltage 3.3 V
SNR at Fin = 62.5 Hz 94.5 dB
ADC Latency 405 uS at Fs = 3.07 MHz
Table 4.8- MAX11060 Specifications This analog to digital converter is a very good fit into our design. With the decrease in sampling frequency, more options became available and the Maxim was chosen for it's specifications as listed above. Compared to the TI chip, the Maxim is a good deal less expensive being $43.32 cheaper than the TI chip. It also has the advantage of being smaller and having less pins to be dealt with. However it does lose some of the versatility of the TI analog to digital converter in that it only offers a serial output stream and does not feature a parallel output mode. However it does support many standards of serial output. The output is unique in that all channels leave one output port on the device in a serial stream rather than each channel having it's own output. This has the disadvantage of increasing the access time of the data but does reduce the complexity of the system and the number of lines to the device. Also of importance is the high SNR of the device. With an expected input frequency on the order of hundreds of Hz, the Maxim chips seems to have excellent SNR properties with an SNR of 94.5 dB at 62.5 Hz.
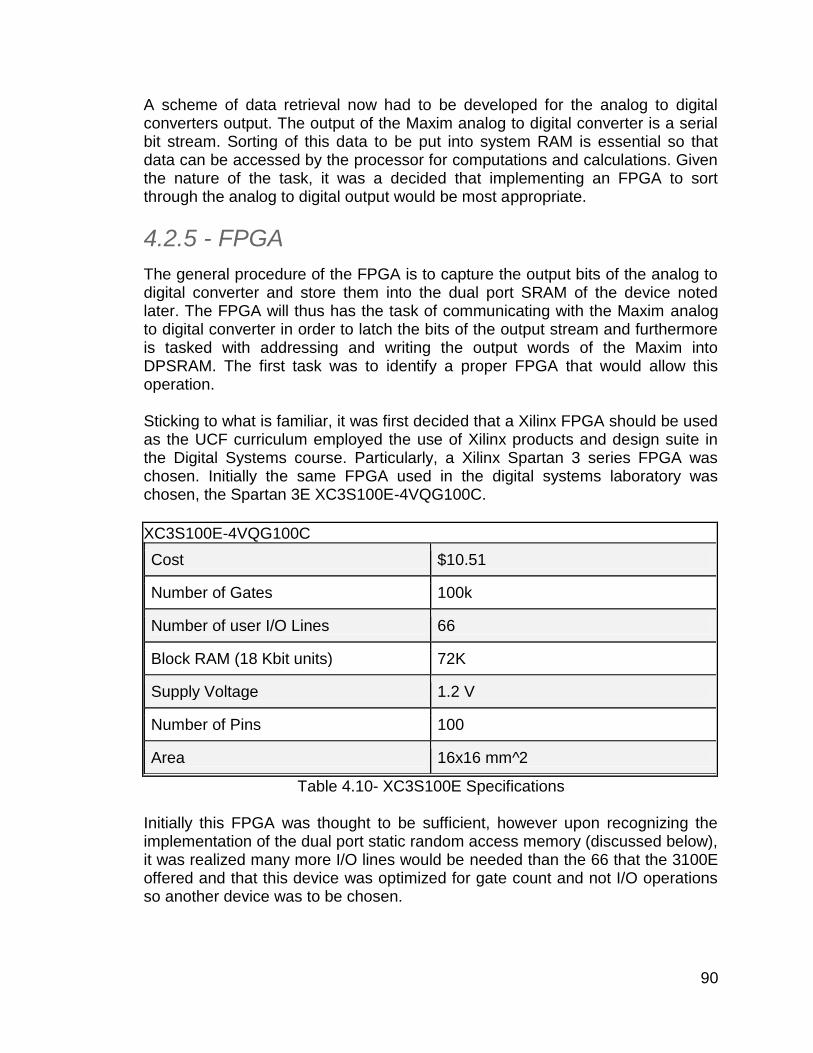
90
A scheme of data retrieval now had to be developed for the analog to digital converters output. The output of the Maxim analog to digital converter is a serial bit stream. Sorting of this data to be put into system RAM is essential so that data can be accessed by the processor for computations and calculations. Given the nature of the task, it was a decided that implementing an FPGA to sort through the analog to digital output would be most appropriate.
4.2.5 - FPGA
The general procedure of the FPGA is to capture the output bits of the analog to digital converter and store them into the dual port SRAM of the device noted later. The FPGA will thus has the task of communicating with the Maxim analog to digital converter in order to latch the bits of the output stream and furthermore is tasked with addressing and writing the output words of the Maxim into DPSRAM. The first task was to identify a proper FPGA that would allow this operation. Sticking to what is familiar, it was first decided that a Xilinx FPGA should be used as the UCF curriculum employed the use of Xilinx products and design suite in the Digital Systems course. Particularly, a Xilinx Spartan 3 series FPGA was chosen. Initially the same FPGA used in the digital systems laboratory was chosen, the Spartan 3E XC3S100E-4VQG100C.
XC3S100E-4VQG100C
Cost $10.51
Number of Gates 100k
Number of user I/O Lines 66
Block RAM (18 Kbit units) 72K
Supply Voltage 1.2 V
Number of Pins 100
Area 16x16 mm^2
Table 4.10- XC3S100E Specifications Initially this FPGA was thought to be sufficient, however upon recognizing the implementation of the dual port static random access memory (discussed below), it was realized many more I/O lines would be needed than the 66 that the 3100E offered and that this device was optimized for gate count and not I/O operations so another device was to be chosen.
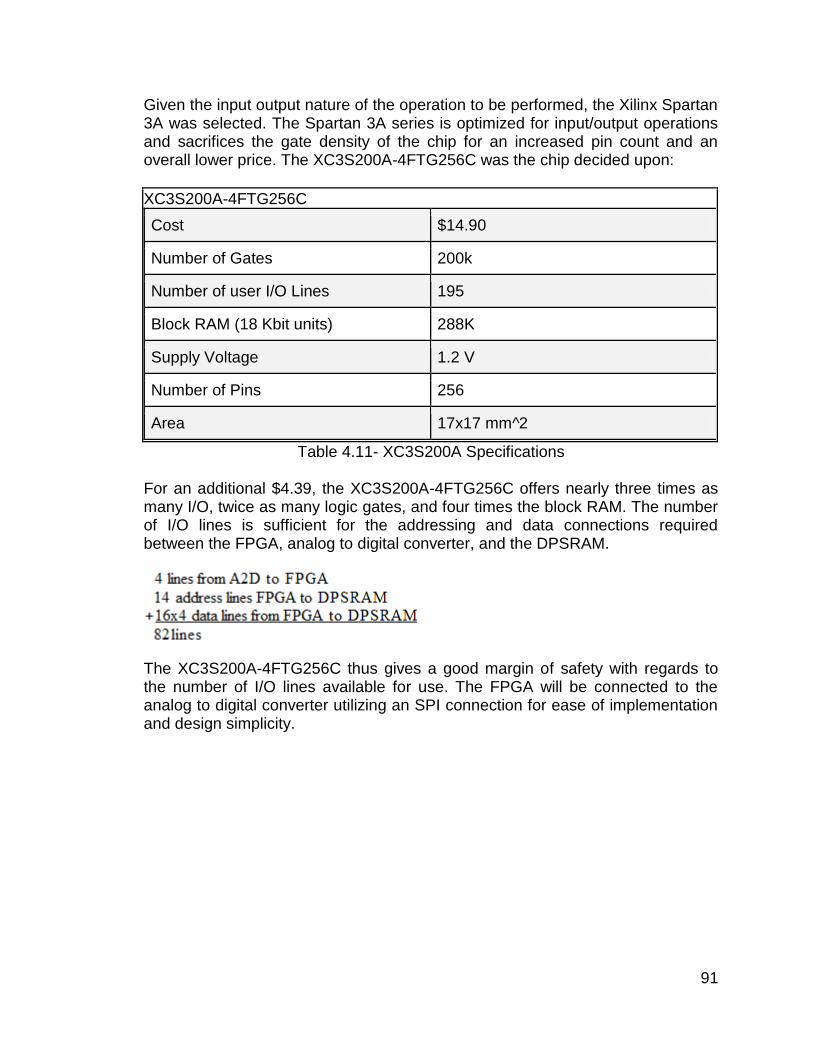
91
Given the input output nature of the operation to be performed, the Xilinx Spartan 3A was selected. The Spartan 3A series is optimized for input/output operations and sacrifices the gate density of the chip for an increased pin count and an overall lower price. The XC3S200A-4FTG256C was the chip decided upon:
XC3S200A-4FTG256C
Cost $14.90
Number of Gates 200k
Number of user I/O Lines 195
Block RAM (18 Kbit units) 288K
Supply Voltage 1.2 V
Number of Pins 256
Area 17x17 mm^2
Table 4.11- XC3S200A Specifications For an additional $4.39, the XC3S200A-4FTG256C offers nearly three times as many I/O, twice as many logic gates, and four times the block RAM. The number of I/O lines is sufficient for the addressing and data connections required between the FPGA, analog to digital converter, and the DPSRAM.
The XC3S200A-4FTG256C thus gives a good margin of safety with regards to the number of I/O lines available for use. The FPGA will be connected to the analog to digital converter utilizing an SPI connection for ease of implementation and design simplicity.
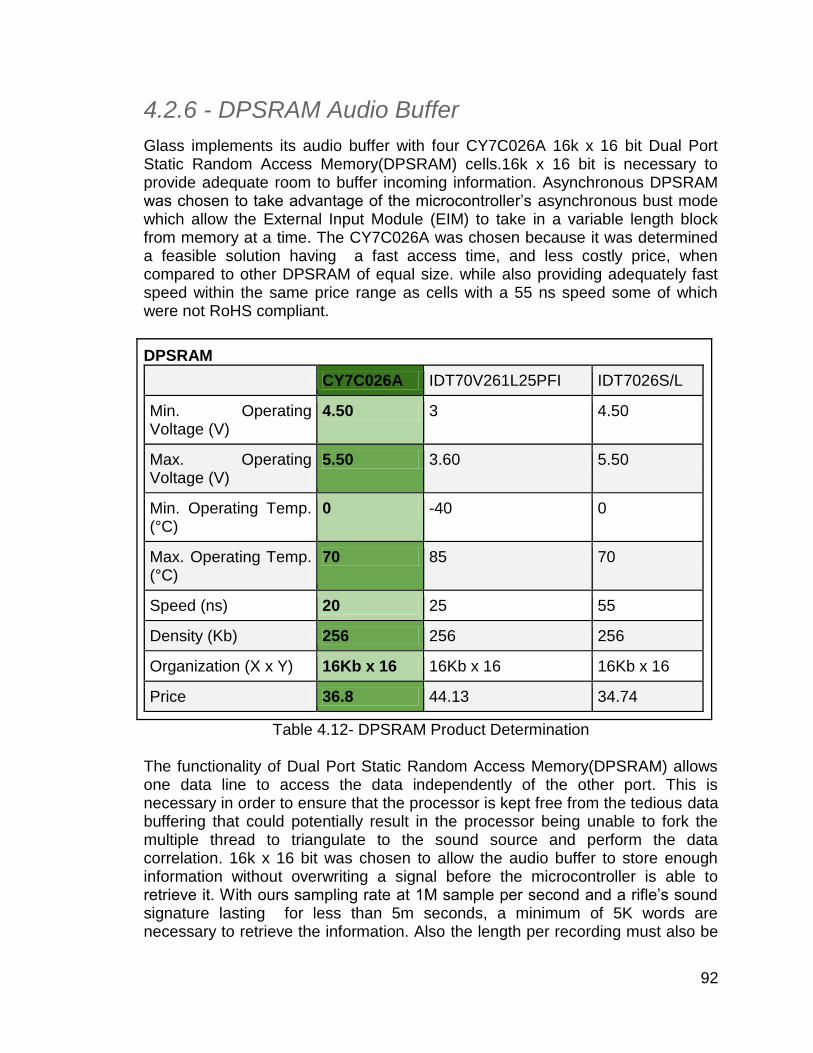
92
4.2.6 - DPSRAM Audio Buffer
Glass implements its audio buffer with four CY7C026A 16k x 16 bit Dual Port Static Random Access Memory(DPSRAM) cells.16k x 16 bit is necessary to provide adequate room to buffer incoming information. Asynchronous DPSRAM was chosen to take advantage of the microcontroller’s asynchronous bust mode which allow the External Input Module (EIM) to take in a variable length block from memory at a time. The CY7C026A was chosen because it was determined a feasible solution having a fast access time, and less costly price, when compared to other DPSRAM of equal size. while also providing adequately fast speed within the same price range as cells with a 55 ns speed some of which were not RoHS compliant.
DPSRAM
CY7C026A IDT70V261L25PFI IDT7026S/L
Min. Operating Voltage (V)
4.50 3 4.50
Max. Operating Voltage (V)
5.50 3.60 5.50
Min. Operating Temp. (°C)
0 -40 0
Max. Operating Temp. (°C)
70 85 70
Speed (ns) 20 25 55
Density (Kb) 256 256 256
Organization (X x Y) 16Kb x 16 16Kb x 16 16Kb x 16
Price 36.8 44.13 34.74
Table 4.12- DPSRAM Product Determination The functionality of Dual Port Static Random Access Memory(DPSRAM) allows one data line to access the data independently of the other port. This is necessary in order to ensure that the processor is kept free from the tedious data buffering that could potentially result in the processor being unable to fork the multiple thread to triangulate to the sound source and perform the data correlation. 16k x 16 bit was chosen to allow the audio buffer to store enough information without overwriting a signal before the microcontroller is able to retrieve it. With ours sampling rate at 1M sample per second and a rifle’s sound signature lasting for less than 5m seconds, a minimum of 5K words are necessary to retrieve the information. Also the length per recording must also be
93
kept low to accommodate the speed of automatic weapons fire. A minigun, for instance fires a round every 10m seconds. If GLASS continues to grab information for longer than that period. Multiple sound event will be treated as part of the same source and will cause problems when attempting to correlate with the sampled audio signals. GLASS processes information through a time frame of 5 ms. With a16K word buffer depth and 1 M samples per second the buffer will be filled in 16ms. The CY7C026A has an access time of 20ns meaning the absolute maximum access rate of 50MHz. The microcontroller must access this data four times; twice because there are 64 bits of data and 32 data lines and twice again to access the semaphores. This means the microcontroller may access the data at a rate no more than 12.5MHz, which is sufficient to ensure the buffer is built at a slower rate than the microcontroller reads it. At 12.5 MHz the buffer will be read
in no less than .400ms + 5k writes to DDRAM at 10662
3M T/s=.4047ms. The
microcontroller is alerted after 5ms though it may receive the when pinging the FPGA after 4.6ms. Within this time range the buffer has sufficient time to fill without the microcontroller passing the write point. During this period the processor has 400k cycles will have passed per core.
The address lines for the input side are controlled by the Field Programmable Gate Array (FPGA) and are equivalent for each buffer allowing simultaneous writes by the FPGA and reads by the EIM. On every sample received by the Analog to Digital Converter (ADC) the FPGA buffers the input serialized bitstream until it has 16 bits per microphone. Then the FPGA writes to each cell of DPSRAM its corresponding 16 bits. The address register is then incremented by one. When a value with sufficient amplitude is sampled this address is stored in a register to be given to the microcontroller. Periodically the microcontroller pings the FPGA to determine if sufficient data has been buffered. Once this condition is met, the FPGA will output a valid address in the buffer’s memory. GLASS’ processor Interfaces with this buffer via the EIM. On a read the address bus makes it possible to address 128M words of external memory from four separate devices sources. GLASS currently uses only 32k words of data which results in 64k words for the audio buffer which is used in order to read the semaphores of each memory address the DPSRAM device must utilize the least significant bit of the address bus as the identifier for the semaphore. Therefore it may be expanded to include additional microphones or other input devices for the same device. These other 127.936 M words are where, in memory, reside the other signals which the correlation algorithm uses for the recognition of a gunshot. Interfacing with the EIM can be seen in Figure 1 and Figure 2 on the following pages. Although additional memory can be allocated to the same device as the audio buffers, it is better to separate them by device type. The memory holding the recorded signals is connected in the same manner as the DPSRAM featured
94
below, however one exception exists for the Chip Enable(EC) flag. DPSRAM has the characteristic that in order to read or write to the semaphore flags for each address the CE flag must be high(chip is off) and the semaphore flag must be low. For this reason the DPSRAM must include a two to one multiplexer to switch between the the CE flag and the least significant bit of the address line. Without this mux when the device is turned off it will still output the semaphore flag for whatever is on the address line given that the address is odd. For regular SRAM this kind of behavior result in the chip being disabled when performing a read to odd memory locations.
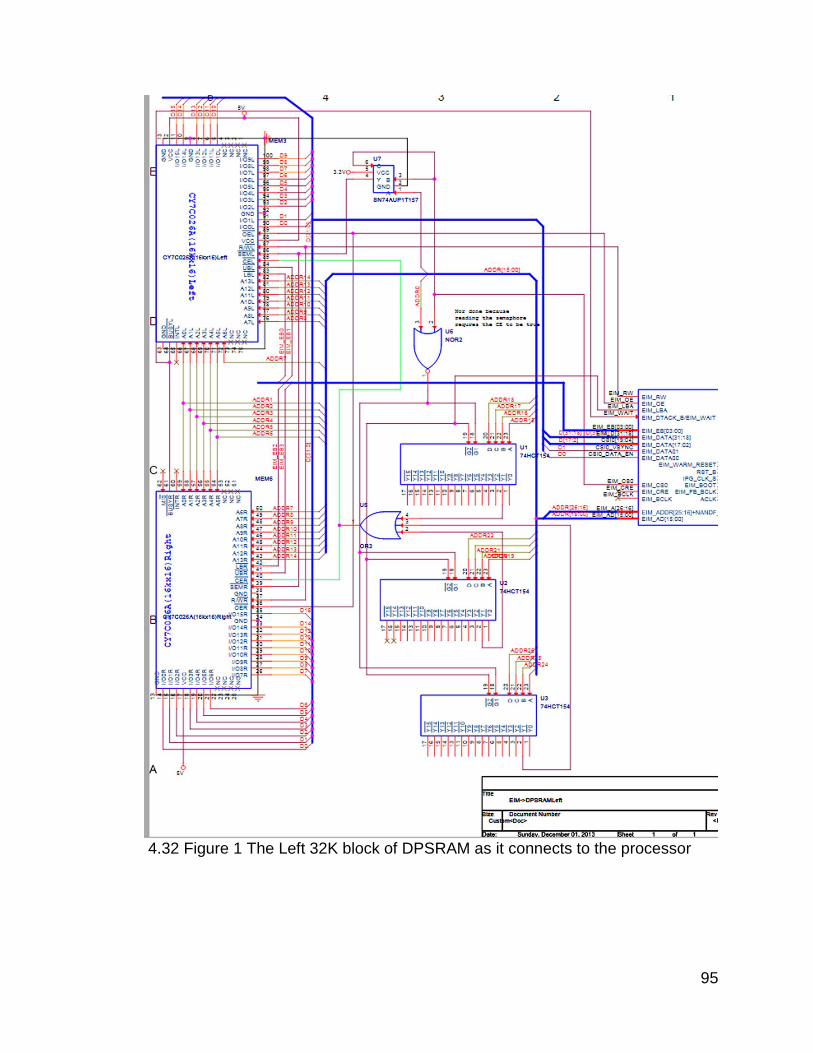
95
4.32 Figure 1 The Left 32K block of DPSRAM as it connects to the processor
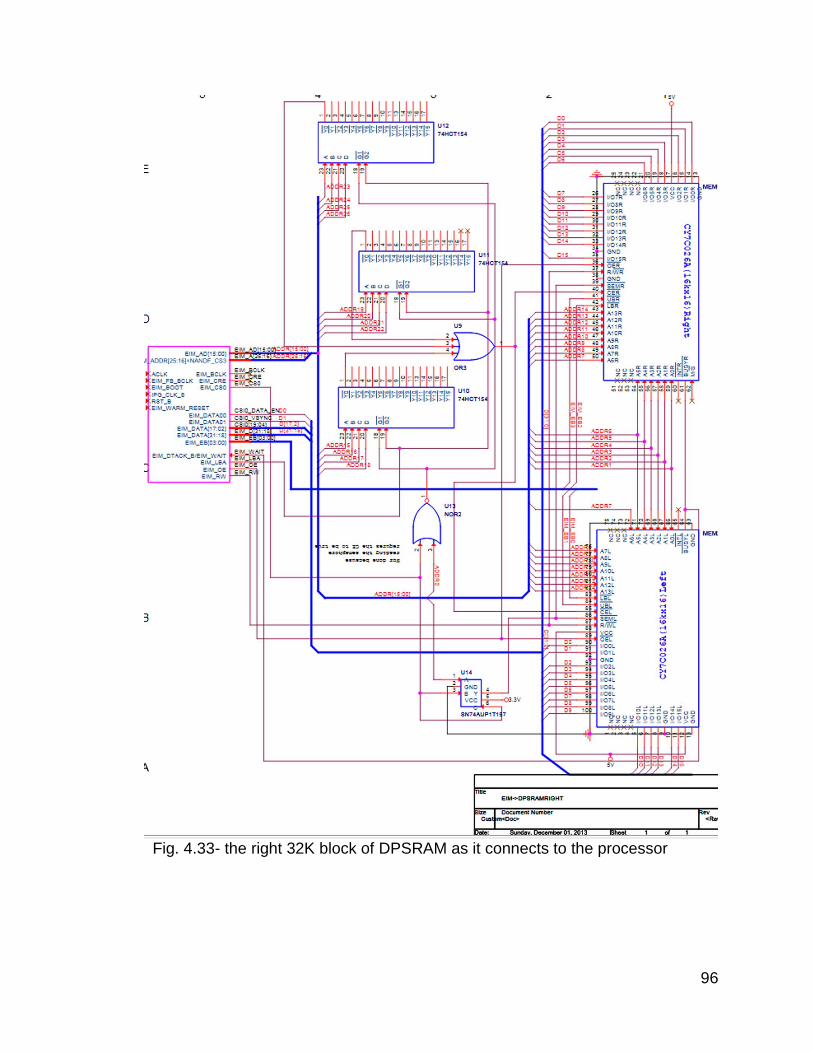
96
Fig. 4.33- the right 32K block of DPSRAM as it connects to the processor
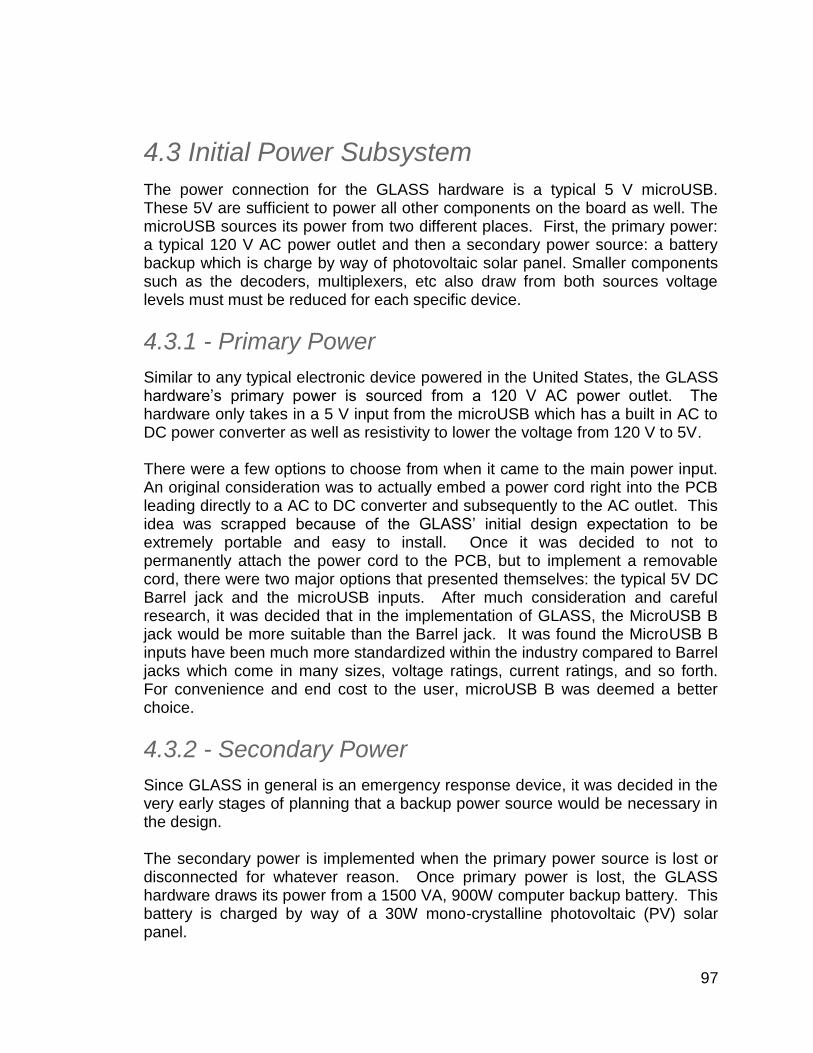
97
4.3 Initial Power Subsystem
The power connection for the GLASS hardware is a typical 5 V microUSB. These 5V are sufficient to power all other components on the board as well. The microUSB sources its power from two different places. First, the primary power: a typical 120 V AC power outlet and then a secondary power source: a battery backup which is charge by way of photovoltaic solar panel. Smaller components such as the decoders, multiplexers, etc also draw from both sources voltage levels must must be reduced for each specific device.
4.3.1 - Primary Power
Similar to any typical electronic device powered in the United States, the GLASS hardware’s primary power is sourced from a 120 V AC power outlet. The hardware only takes in a 5 V input from the microUSB which has a built in AC to DC power converter as well as resistivity to lower the voltage from 120 V to 5V. There were a few options to choose from when it came to the main power input. An original consideration was to actually embed a power cord right into the PCB leading directly to a AC to DC converter and subsequently to the AC outlet. This idea was scrapped because of the GLASS’ initial design expectation to be extremely portable and easy to install. Once it was decided to not to permanently attach the power cord to the PCB, but to implement a removable cord, there were two major options that presented themselves: the typical 5V DC Barrel jack and the microUSB inputs. After much consideration and careful research, it was decided that in the implementation of GLASS, the MicroUSB B jack would be more suitable than the Barrel jack. It was found the MicroUSB B inputs have been much more standardized within the industry compared to Barrel jacks which come in many sizes, voltage ratings, current ratings, and so forth. For convenience and end cost to the user, microUSB B was deemed a better choice.
4.3.2 - Secondary Power
Since GLASS in general is an emergency response device, it was decided in the very early stages of planning that a backup power source would be necessary in the design. The secondary power is implemented when the primary power source is lost or disconnected for whatever reason. Once primary power is lost, the GLASS hardware draws its power from a 1500 VA, 900W computer backup battery. This battery is charged by way of a 30W mono-crystalline photovoltaic (PV) solar panel.
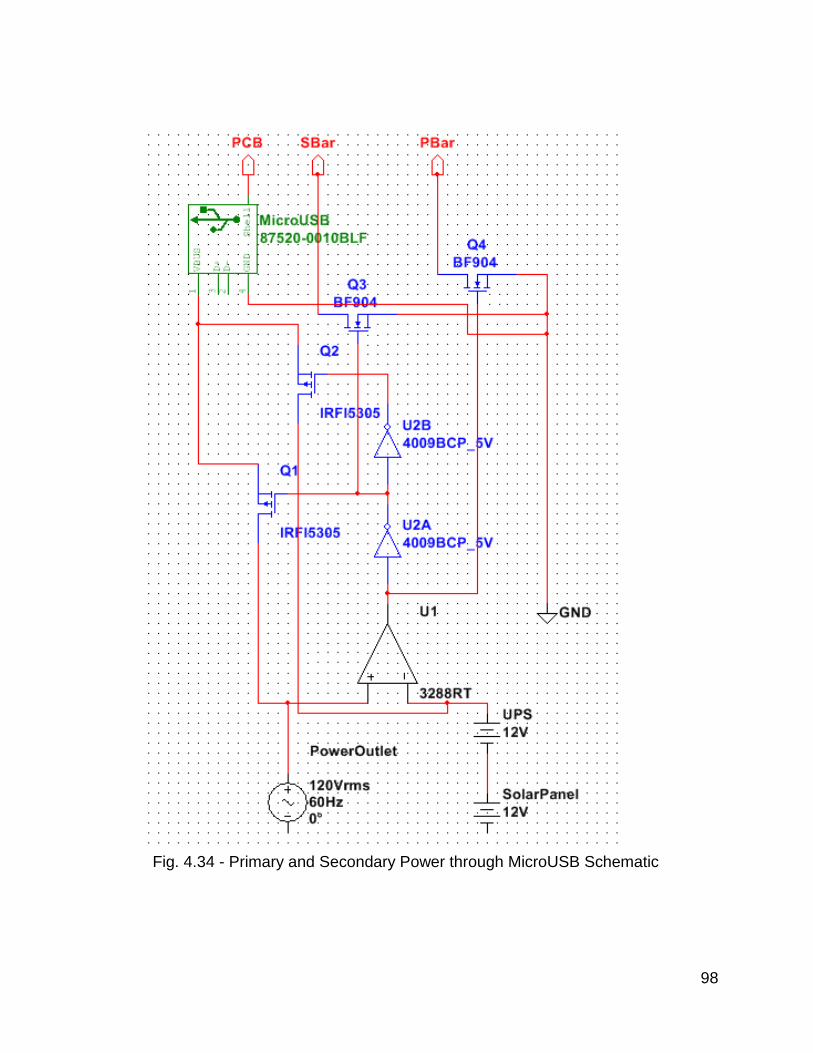
98
Fig. 4.34 - Primary and Secondary Power through MicroUSB Schematic
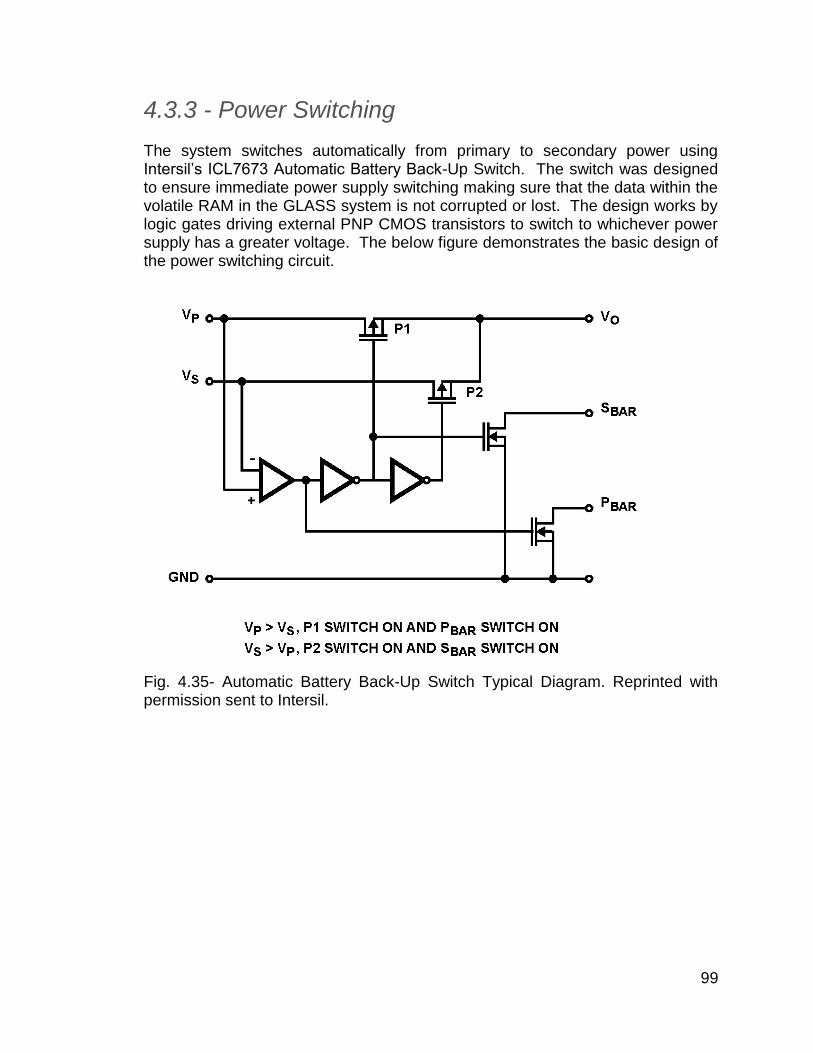
99
4.3.3 - Power Switching
The system switches automatically from primary to secondary power using Intersil’s ICL7673 Automatic Battery Back-Up Switch. The switch was designed to ensure immediate power supply switching making sure that the data within the volatile RAM in the GLASS system is not corrupted or lost. The design works by logic gates driving external PNP CMOS transistors to switch to whichever power supply has a greater voltage. The below figure demonstrates the basic design of the power switching circuit.
Fig. 4.35- Automatic Battery Back-Up Switch Typical Diagram. Reprinted with permission sent to Intersil.
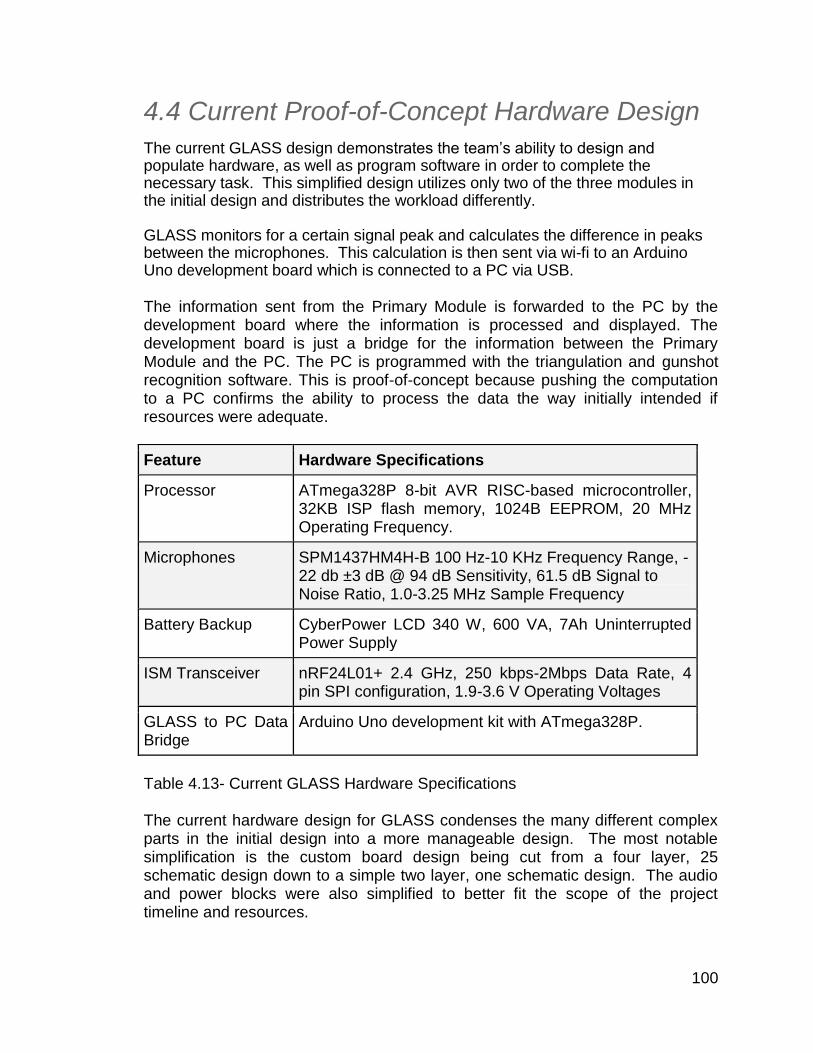
100
4.4 Current Proof-of-Concept Hardware Design
The current GLASS design demonstrates the team’s ability to design and populate hardware, as well as program software in order to complete the necessary task. This simplified design utilizes only two of the three modules in the initial design and distributes the workload differently. GLASS monitors for a certain signal peak and calculates the difference in peaks between the microphones. This calculation is then sent via wi-fi to an Arduino Uno development board which is connected to a PC via USB. The information sent from the Primary Module is forwarded to the PC by the development board where the information is processed and displayed. The development board is just a bridge for the information between the Primary Module and the PC. The PC is programmed with the triangulation and gunshot recognition software. This is proof-of-concept because pushing the computation to a PC confirms the ability to process the data the way initially intended if resources were adequate.
Feature Hardware Specifications
Processor ATmega328P 8-bit AVR RISC-based microcontroller, 32KB ISP flash memory, 1024B EEPROM, 20 MHz Operating Frequency.
Microphones SPM1437HM4H-B 100 Hz-10 KHz Frequency Range, -22 db ±3 dB @ 94 dB Sensitivity, 61.5 dB Signal to Noise Ratio, 1.0-3.25 MHz Sample Frequency
Battery Backup CyberPower LCD 340 W, 600 VA, 7Ah Uninterrupted Power Supply
ISM Transceiver nRF24L01+ 2.4 GHz, 250 kbps-2Mbps Data Rate, 4 pin SPI configuration, 1.9-3.6 V Operating Voltages
GLASS to PC Data Bridge
Arduino Uno development kit with ATmega328P.
Table 4.13- Current GLASS Hardware Specifications The current hardware design for GLASS condenses the many different complex parts in the initial design into a more manageable design. The most notable simplification is the custom board design being cut from a four layer, 25 schematic design down to a simple two layer, one schematic design. The audio and power blocks were also simplified to better fit the scope of the project timeline and resources.
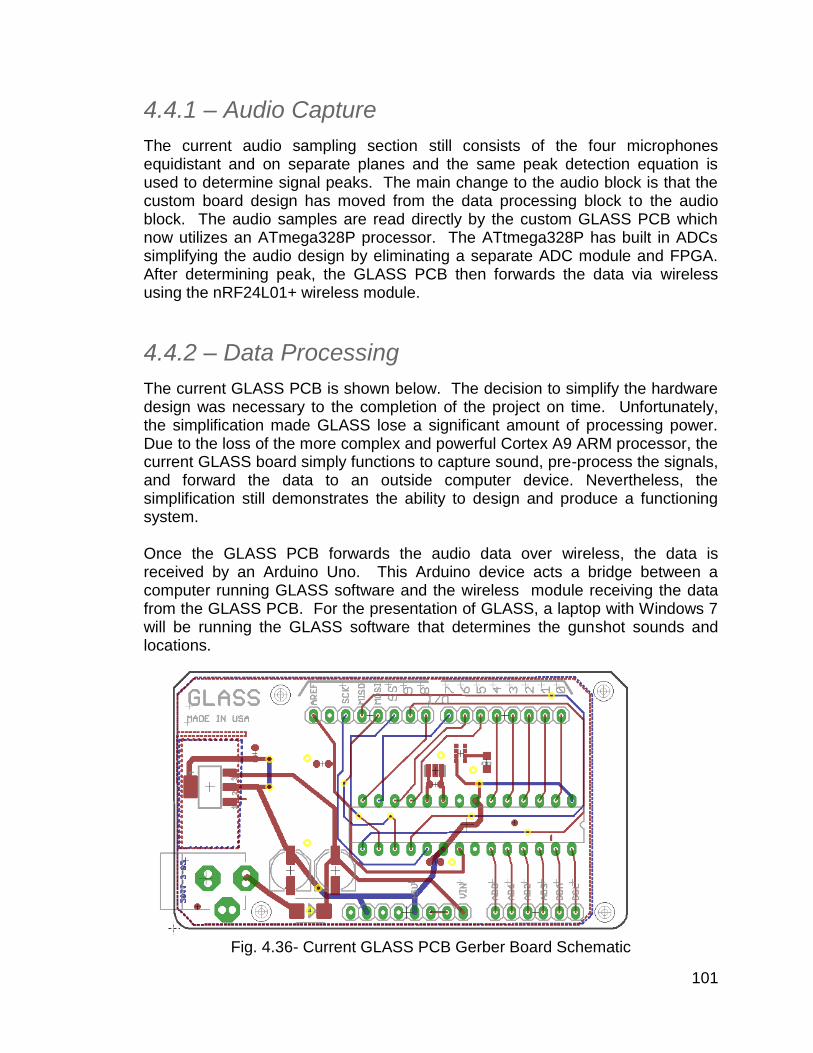
101
4.4.1 – Audio Capture
The current audio sampling section still consists of the four microphones equidistant and on separate planes and the same peak detection equation is used to determine signal peaks. The main change to the audio block is that the custom board design has moved from the data processing block to the audio block. The audio samples are read directly by the custom GLASS PCB which now utilizes an ATmega328P processor. The ATtmega328P has built in ADCs simplifying the audio design by eliminating a separate ADC module and FPGA. After determining peak, the GLASS PCB then forwards the data via wireless using the nRF24L01+ wireless module.
4.4.2 – Data Processing
The current GLASS PCB is shown below. The decision to simplify the hardware design was necessary to the completion of the project on time. Unfortunately, the simplification made GLASS lose a significant amount of processing power. Due to the loss of the more complex and powerful Cortex A9 ARM processor, the current GLASS board simply functions to capture sound, pre-process the signals, and forward the data to an outside computer device. Nevertheless, the simplification still demonstrates the ability to design and produce a functioning system. Once the GLASS PCB forwards the audio data over wireless, the data is received by an Arduino Uno. This Arduino device acts a bridge between a computer running GLASS software and the wireless module receiving the data from the GLASS PCB. For the presentation of GLASS, a laptop with Windows 7 will be running the GLASS software that determines the gunshot sounds and locations.
Fig. 4.36- Current GLASS PCB Gerber Board Schematic
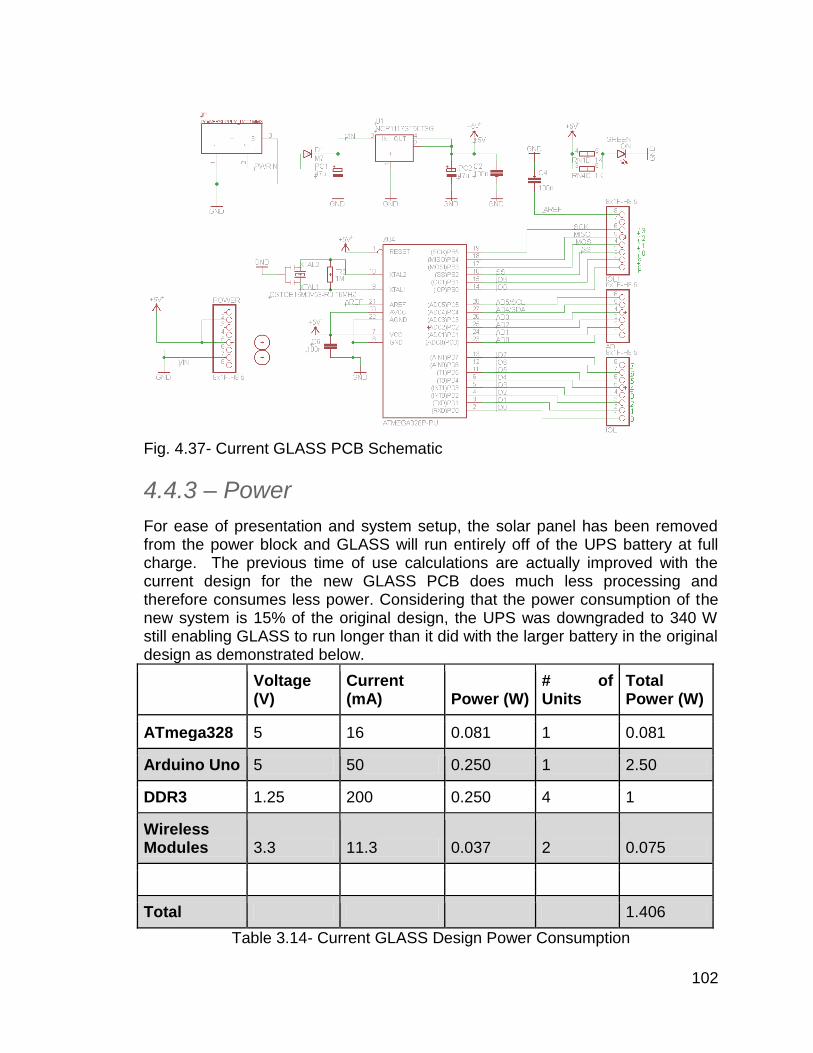
102
Fig. 4.37- Current GLASS PCB Schematic
4.4.3 – Power
For ease of presentation and system setup, the solar panel has been removed from the power block and GLASS will run entirely off of the UPS battery at full charge. The previous time of use calculations are actually improved with the current design for the new GLASS PCB does much less processing and therefore consumes less power. Considering that the power consumption of the new system is 15% of the original design, the UPS was downgraded to 340 W still enabling GLASS to run longer than it did with the larger battery in the original design as demonstrated below.
Voltage (V)
Current (mA) Power (W)
# of Units
Total Power (W)
ATmega328 5 16 0.081 1 0.081
Arduino Uno 5 50 0.250 1 2.50
DDR3 1.25 200 0.250 4 1
Wireless Modules 3.3 11.3 0.037 2 0.075
Total 1.406
Table 3.14- Current GLASS Design Power Consumption
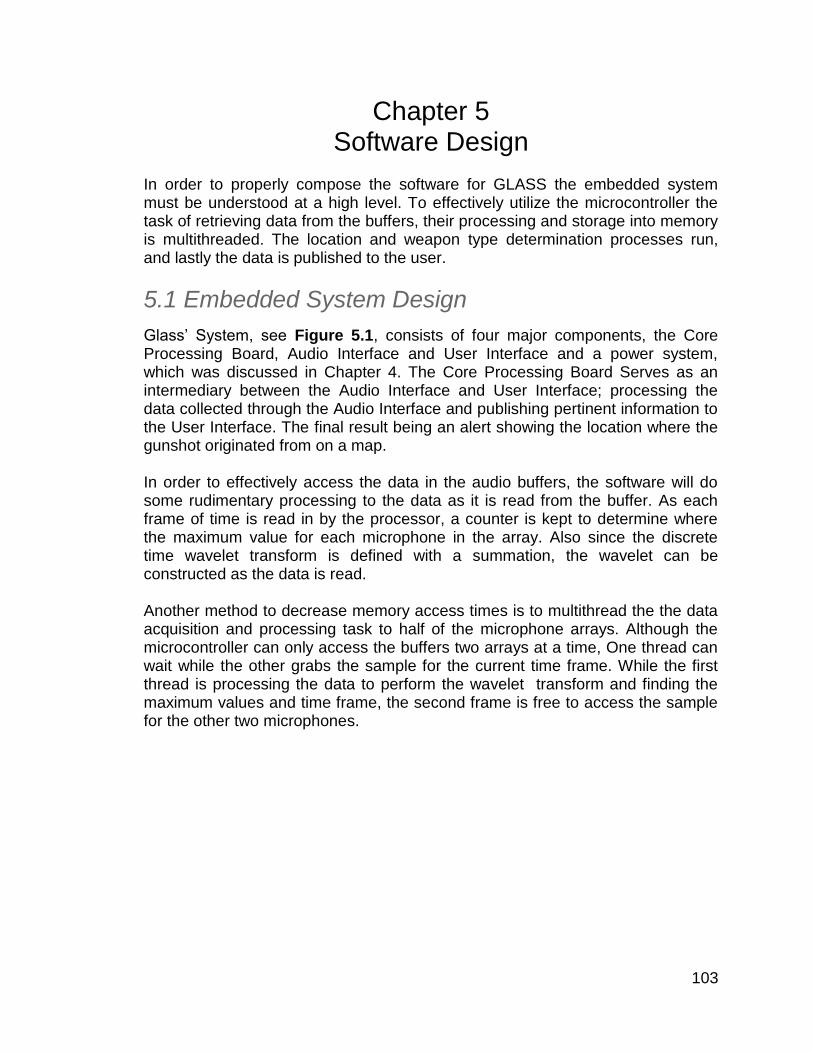
103
Chapter 5 Software Design
In order to properly compose the software for GLASS the embedded system must be understood at a high level. To effectively utilize the microcontroller the task of retrieving data from the buffers, their processing and storage into memory is multithreaded. The location and weapon type determination processes run, and lastly the data is published to the user.
5.1 Embedded System Design
Glass’ System, see Figure 5.1, consists of four major components, the Core Processing Board, Audio Interface and User Interface and a power system, which was discussed in Chapter 4. The Core Processing Board Serves as an intermediary between the Audio Interface and User Interface; processing the data collected through the Audio Interface and publishing pertinent information to the User Interface. The final result being an alert showing the location where the gunshot originated from on a map. In order to effectively access the data in the audio buffers, the software will do some rudimentary processing to the data as it is read from the buffer. As each frame of time is read in by the processor, a counter is kept to determine where the maximum value for each microphone in the array. Also since the discrete time wavelet transform is defined with a summation, the wavelet can be constructed as the data is read. Another method to decrease memory access times is to multithread the the data acquisition and processing task to half of the microphone arrays. Although the microcontroller can only access the buffers two arrays at a time, One thread can wait while the other grabs the sample for the current time frame. While the first thread is processing the data to perform the wavelet transform and finding the maximum values and time frame, the second frame is free to access the sample for the other two microphones.
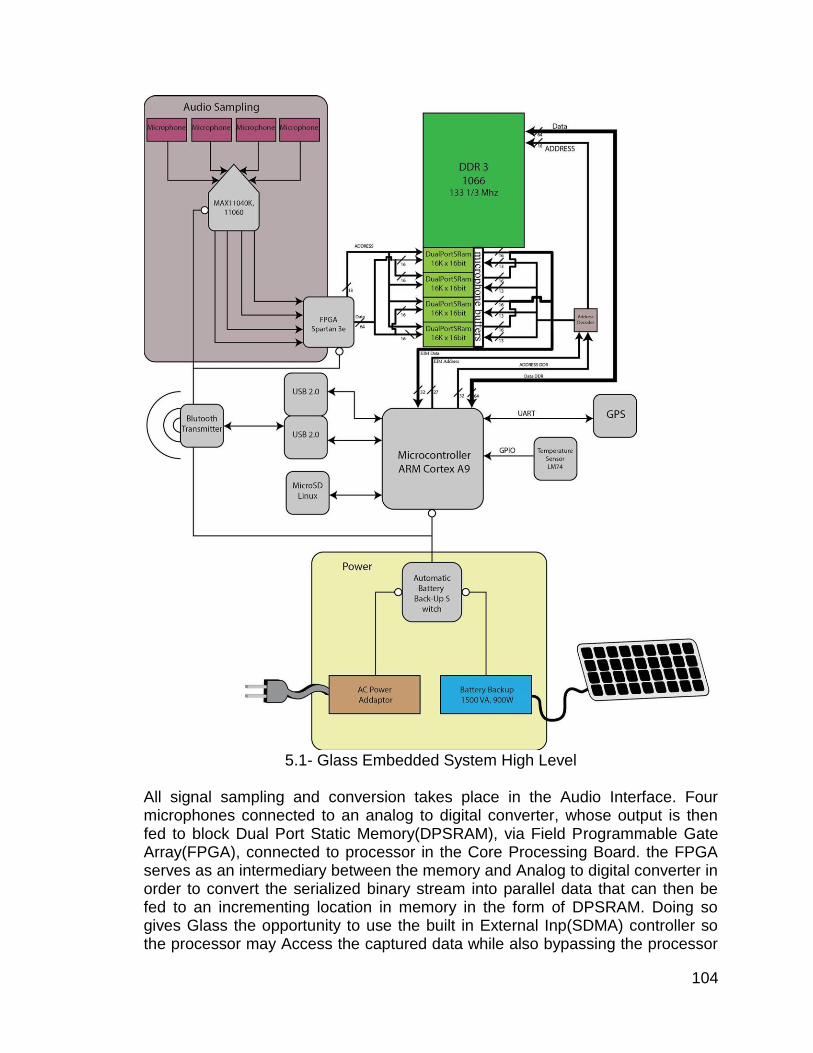
104
5.1- Glass Embedded System High Level
All signal sampling and conversion takes place in the Audio Interface. Four microphones connected to an analog to digital converter, whose output is then fed to block Dual Port Static Memory(DPSRAM), via Field Programmable Gate Array(FPGA), connected to processor in the Core Processing Board. the FPGA serves as an intermediary between the memory and Analog to digital converter in order to convert the serialized binary stream into parallel data that can then be fed to an incrementing location in memory in the form of DPSRAM. Doing so gives Glass the opportunity to use the built in External Inp(SDMA) controller so the processor may Access the captured data while also bypassing the processor
105
to freeing it to take care of other tasks. An interrupt is sent to the Core Processing Board when a signal of sufficient amplitude is received at which point execution of the Gunshot Recognition and the Triangulation algorithms commences.
In the Core Processing Board the microcontroller runs Linux in low power mode, monitoring power consumption. Upon receipt of the interrupt from the Audio Interface, the operation system forks to create threads for both the Gunshot Recognition and the Triangulation algorithms. After processing the data, the system communicates with an Android device, sending it pertinent information, including date, time, and a vector from the node that received the Gunshot event. Its processor is an dual core ARM cortex A9 micro controller with a clock speed of 1GHz.
Since the time between the echo and main signal increases, Glass’s processor will only need to retrieve the first 5 milliseconds of data amounting to 5K samples of 16 bits (two zeroes included in msb)across four microphones each, resulting in 320 kbits of data or 80 kBytes. considering our processor has a 32 bit data bus that leaves 20k words to be transferred for each gunshot event. This Is achieved by pairing two of the microphones to each address location in memory. The data line is then shared by half of the 32 bits for each buffer meaning that for each sample data must be read by the processor twice.
The buffers are 16k deep this means that once an address with sufficient amplitude is sampled Glass has 15 milliseconds until the first data point will be rewritten. As glass has a Dual Core 1GHz processor The best we can hope for is that 32M cycles will have happened at this point. The User Interface (UI), hosted on an Android device communicates with the Core Processing Board via Bluetooth. Bluetooth was chosen as the transmission medium because GLASS is intended to be installed in or around buildings where GLASS would have access to relaying devices within range so that it must not send long range transmissions to offsite locations. Instead the UI is intended to filter out duplicate signals, when other nodes are in range, and forward information through reliable connections. Upon receipt of a message, the UI displays an alert allowing the user to check the interface for the received information. On entering the application, the user sees a map of the area near the node that transmitted the message and the location in which the event occurred relative to the node. The event is given a date and time and which weapon corresponded to the event. Communication with the UI is unidirectional and changes to the device must be made through the system directly.
106
5.2 Linux
Linux was chosen as the operating system for Glass due to Its portability and large development and support base. Access to the source code for the operating system allows Linux to be modified to our custom hardware, and adapt existing drivers to meet Glass’ needs. Specifically the Ubuntu as it is already configured for the Beaglebone Black. Ubuntu also has a large support base and is a popular distribution of Linux. Unlike Android, Ubuntu can easily have components modified or outright removed. Android may be optimizing many common mobile related applications, GLASS does not utilize a majority of these, rendering embedded Linux a more viable option.
On system start GLASS boot from processor ROM. It is then loads the operating system and begins operation. Upon receiving the interrupt Linux will drop into Kernel mode and execute a function to place the relevant data in memory to be processed later. Then the operating system will switch back to user mode and fork two threads; one for the gunshot recognition and another for the location detection.
Lastly the process for sending the information to the user interface runs as a thread sleeping until awoken by the termination of both threads. This thread establishes communication with an Android enabled device. Then packets are sent via Bluetooth containing the time, location and calculated armament type. The User Interface on the Android device then displays the pertinent information.
5.3 Gunshot Recognition Algorithm
The first concern in the gunshot algorithm is to normalize the input signal. With varying distances and angles from the microphone array, the likelihood that the sample levels match any recorded data is unlikely. Using the wavelet Transform on the data gives Glass the ability to find the low frequency components associated with gunfire. Also the wavelet transform shows the amount of time each frequency component occupies on the signal which helps to determine when a gunshot is between two different weapon types which may be considered closer.
Special care must be taken to remove the echoes which have a larger effect on the signal. As the distance from the microphone array increases the decibel level of the echoes grows relative to the magnitude obtained from the original signal. This is due to the non linear growth of the of the distance traveled by the sound C->A and echoes,C->B->A see Figure1. Also the distance in arrival between the two signals decreases because the length of side c becomes more and more trivial, making the normalized echo amplitude closer to the amplitude of the direct signal.
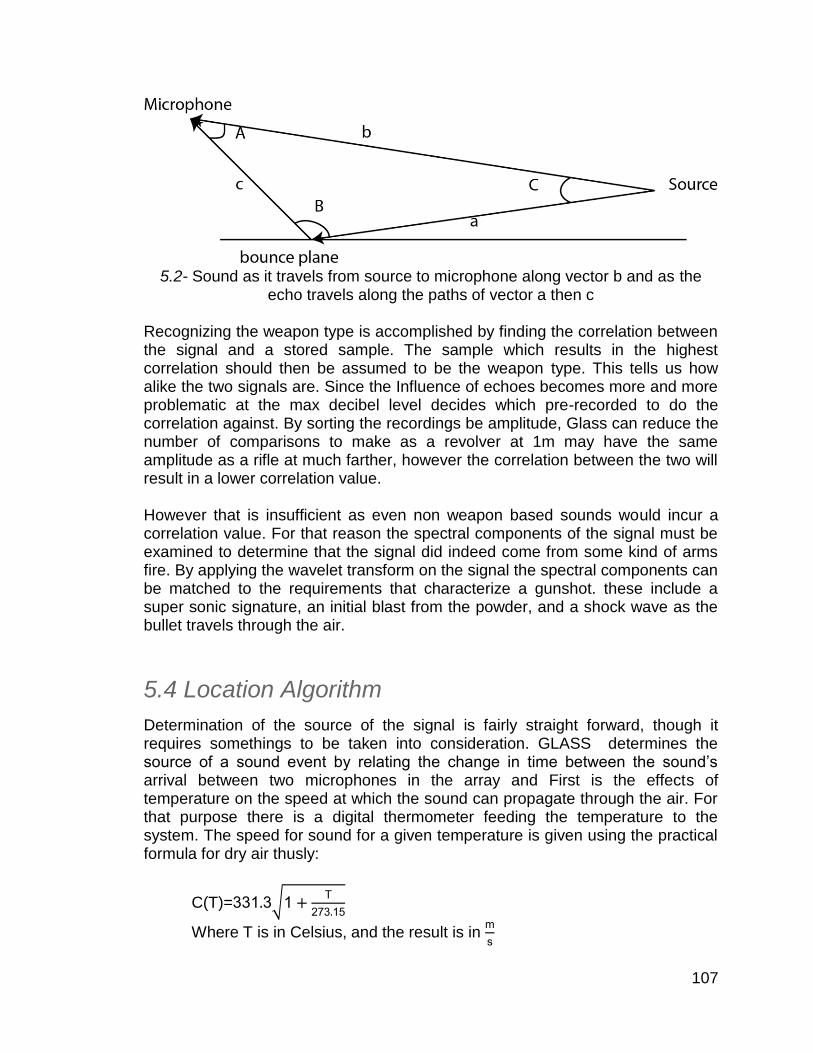
107
5.2- Sound as it travels from source to microphone along vector b and as the
echo travels along the paths of vector a then c Recognizing the weapon type is accomplished by finding the correlation between the signal and a stored sample. The sample which results in the highest correlation should then be assumed to be the weapon type. This tells us how alike the two signals are. Since the Influence of echoes becomes more and more problematic at the max decibel level decides which pre-recorded to do the correlation against. By sorting the recordings be amplitude, Glass can reduce the number of comparisons to make as a revolver at 1m may have the same amplitude as a rifle at much farther, however the correlation between the two will result in a lower correlation value.
However that is insufficient as even non weapon based sounds would incur a correlation value. For that reason the spectral components of the signal must be examined to determine that the signal did indeed come from some kind of arms fire. By applying the wavelet transform on the signal the spectral components can be matched to the requirements that characterize a gunshot. these include a super sonic signature, an initial blast from the powder, and a shock wave as the bullet travels through the air.
5.4 Location Algorithm
Determination of the source of the signal is fairly straight forward, though it requires somethings to be taken into consideration. GLASS determines the source of a sound event by relating the change in time between the sound’s arrival between two microphones in the array and First is the effects of temperature on the speed at which the sound can propagate through the air. For that purpose there is a digital thermometer feeding the temperature to the system. The speed for sound for a given temperature is given using the practical formula for dry air thusly:
C(T)=331 3√1 T
273 15
Where T is in Celsius, and the result is in m
s
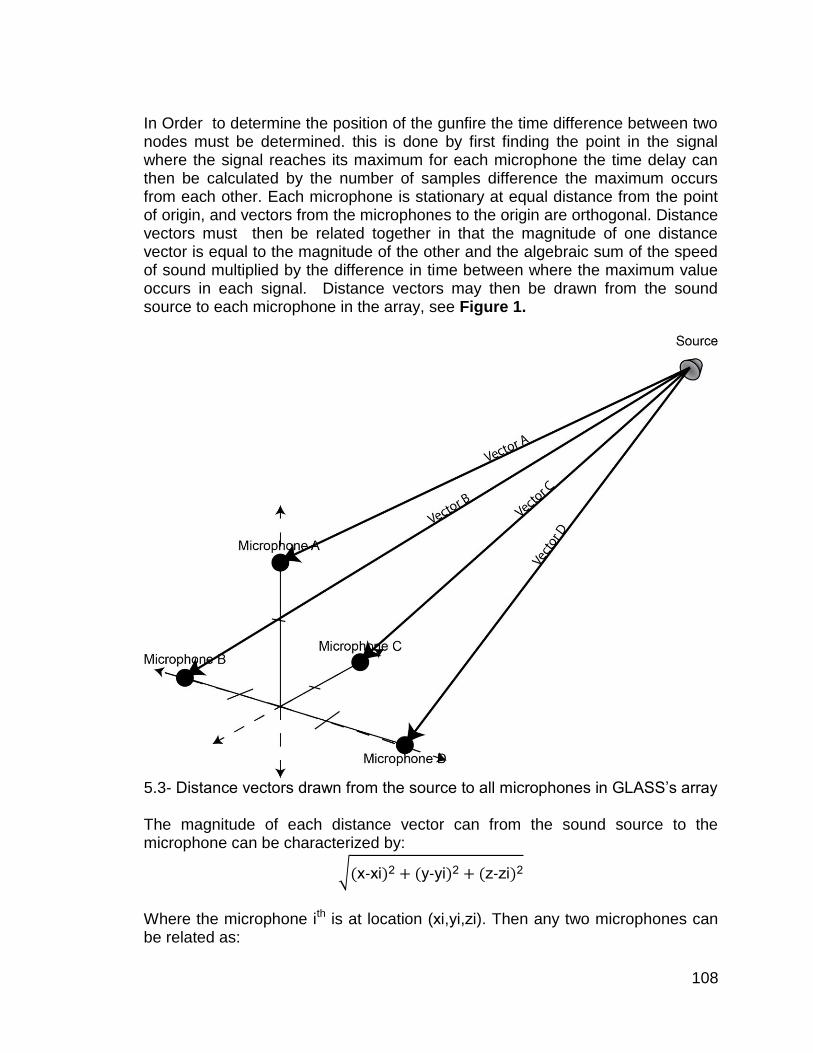
108
In Order to determine the position of the gunfire the time difference between two nodes must be determined. this is done by first finding the point in the signal where the signal reaches its maximum for each microphone the time delay can then be calculated by the number of samples difference the maximum occurs from each other. Each microphone is stationary at equal distance from the point of origin, and vectors from the microphones to the origin are orthogonal. Distance vectors must then be related together in that the magnitude of one distance vector is equal to the magnitude of the other and the algebraic sum of the speed of sound multiplied by the difference in time between where the maximum value occurs in each signal. Distance vectors may then be drawn from the sound source to each microphone in the array, see Figure 1.
5.3- Distance vectors drawn from the source to all microphones in GLASS’s array The magnitude of each distance vector can from the sound source to the microphone can be characterized by:
√ x xi 2 y yi 2 z zi 2
Where the microphone ith is at location (xi,yi,zi). Then any two microphones can be related as:
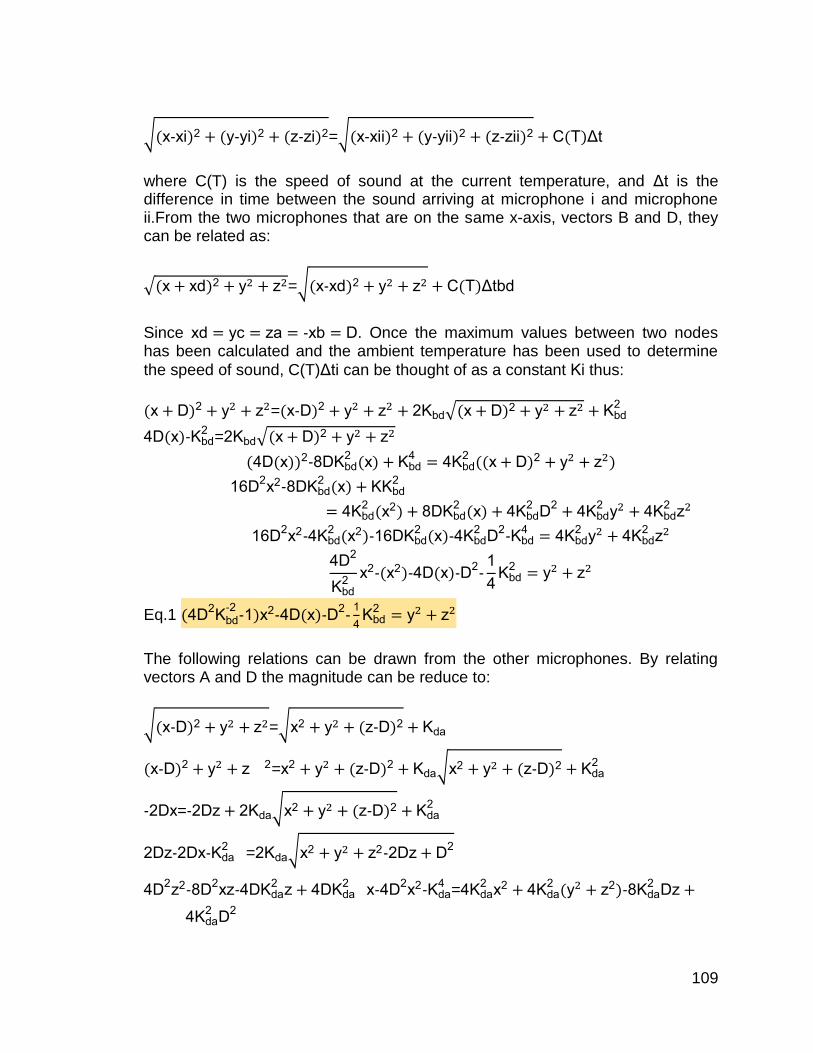
109
√ x-xi 2 y-yi 2 z-zi 2=√ x-xii 2 y-yii 2 z-zii 2 C T Δt
where C(T) is the speed of sound at the current temperature, and Δt is the difference in time between the sound arriving at microphone i and microphone ii.From the two microphones that are on the same x-axis, vectors B and D, they can be related as:
√ x xd 2 y z =√ x-xd 2 y z C T Δtbd
Since xd yc za -xb D. Once the maximum values between two nodes has been calculated and the ambient temperature has been used to determine
the speed of sound, C(T)Δti can be thought of as a constant Ki thus:
x D 2 y z = x-D 2 y z 2Kbd√ x D 2 y z Kbd2
4D x -Kbd2
=2Kbd√ x D 2 y z
4D x 2 8DKbd2 x Kbd
4 4Kbd2 x D 2 y z
16D2
x2 8DKbd2 x KKbd
2
4Kbd2 x2 8DKbd
2 x 4Kbd2
D2 4Kbd
2y 4Kbd
2z
16D2
x2 4Kbd2 x2 16DKbd
2 x 4Kbd2
D2 Kbd
4 4Kbd2
y 4Kbd2
z
4D2
Kbd2
x2 x2 4D x D2 1
4Kbd
2 y z
Eq.1 4D2
Kbd-2
-1 x2-4D x -D2-
1
4Kbd
2 y z
The following relations can be drawn from the other microphones. By relating vectors A and D the magnitude can be reduce to:
√ x-D 2 y z =√x2 y z-D 2 Kda
x-D 2 y z 2=x2 y z-D 2 Kda√x2 y z-D 2 Kda2
-2Dx=-2Dz 2Kda√x2 y z-D 2 Kda2
2Dz-2Dx-Kda2
=2Kda√x2 y z2-2Dz D
2
4D2
z2-8D2
xz-4DKda2
z 4DKda2
x-4D2
x2-Kda4
=4Kda2
x2 4Kda2 y z2 -8Kda
2Dz
4Kda2
D2
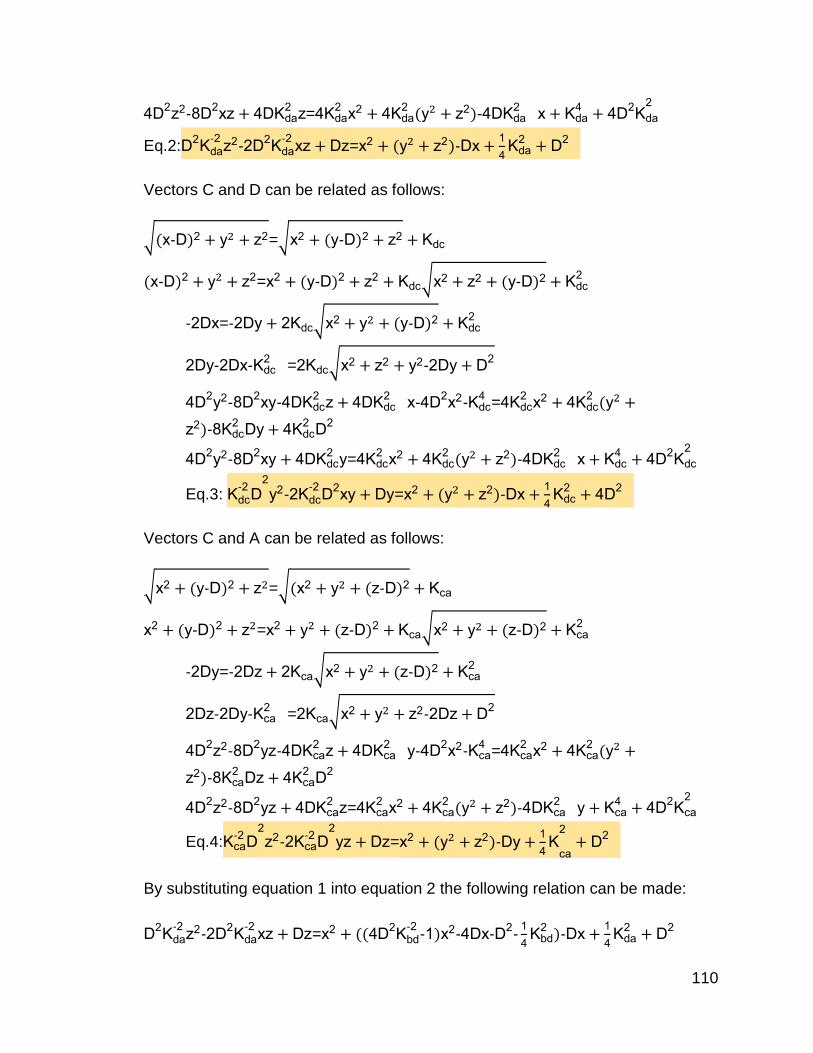
110
4D2
z2-8D2
xz 4DKda2
z=4Kda2
x2 4Kda2 y z2 -4DKda
2x Kda
4 4D
2Kda
2
Eq.2:D2
Kda-2
z2-2D2
Kda-2
xz Dz=x2 y z2 -Dx 1
4Kda
2 D2
Vectors C and D can be related as follows:
√ x-D 2 y z2=√x2 y-D 2 z2 Kdc
x-D 2 y z2=x2 y-D 2 z2 Kdc√x2 z2 y-D 2 Kdc2
-2Dx=-2Dy 2Kdc√x2 y y-D 2 Kdc2
2Dy-2Dx-Kdc2
=2Kdc√x2 z2 y2-2Dy D
2
4D2
y2-8D2
xy-4DKdc2
z 4DKdc2
x-4D2
x2-Kdc4
=4Kdc2
x2 4Kdc2 y
z2 -8Kdc2
Dy 4Kdc2
D2
4D2
y2-8D2
xy 4DKdc2
y=4Kdc2
x2 4Kdc2 y z2 -4DKdc
2x Kdc
4 4D2
Kdc
2
Eq.3: Kdc-2
D2
y2-2Kdc-2
D2
xy Dy=x2 y z2 -Dx 1
4Kdc
2 4D2
Vectors C and A can be related as follows:
√x2 y-D 2 z =√ x2 y z-D 2 Kca
x2 y-D 2 z =x2 y z-D 2 Kca√x2 y z-D 2 Kca2
-2Dy=-2Dz 2Kca√x2 y z-D 2 Kca2
2Dz-2Dy-Kca2
=2Kca√x2 y z2-2Dz D
2
4D2
z2-8D2
yz-4DKca2
z 4DKca2
y-4D2
x2-Kca4
=4Kca2
x2 4Kca2 y
z2 -8Kca2
Dz 4Kca2
D2
4D2
z2-8D2
yz 4DKca2
z=4Kca2
x2 4Kca2 y z2 -4DKca
2y Kca
4 4D2
Kca
2
Eq.4:Kca-2
D2
z2-2Kca-2
D2
yz Dz=x2 y z2 -Dy 1
4K
ca
2
D2
By substituting equation 1 into equation 2 the following relation can be made:
D2
Kda-2
z2-2D2
Kda-2
xz Dz=x2 4D2
Kbd-2
-1 x2-4Dx-D2-
1
4Kbd
2 -Dx 1
4Kda
2 D2

111
Eq.5:D2
Kda-2
z2 D-2D2
Kda-2
x z=4D2
Kbd-2
x2-5Dx-1
4Kbd
2 1
4Kda
2
By substituting equation 1 into equation 3 the following relation can be made:
D2
Kdc-2
y2-2D2
Kdc-2
xy Dy=x2 4D2
Kbd-2
-1 x2-4Dx-D2-
1
4Kbd
2 -Dx 1
4Kdc
2 D2
Eq.6:D2
Kdc-2
y2 D-2D2
Kdc-2
x y=4D2
Kbd-2
x2-5Dx-1
4Kbd
2 1
4Kdc
2
Subtracting equation 5 from equation 6:
D2
Kdc-2
y2 D-2D2
Kdc-2
x y-D2
Kda-2
z2- D-2D2
Kda-2
x z=4D2
Kbd-2
x2-5Dx-1
4Kbd
2
1
4Kdc
2 -4D2
Kbd-2
x2 5Dx 1
4Kbd
2 -1
4Kda
2
Eq.7:D2
Kdc-2
y2 D-2D2
Kdc-2
x y-D2
Kda-2
z2- D-2D2
Kda-2
x z=1
4Kdc
2 -1
4Kda
2
With these equations we may construct the paraboloids necessary to solve for a given sound source. Then the point is calculated and stored to be sent to the user interface by a separate thread.
112
Chapter 6
Project Prototype Construction
6.1 Hardware
6.1.1 – Initial Design
The initial hardware prototype will be built on a circuit breadboard in multiple sections. The purpose of prototyping in sections is to eliminate time wasting troubleshooting on a much larger circuit if the entire design was prototyped at once. This way, if there is a problem with a single component in a subsystem, the problem can be resolved quicker within the subsystem prototype. The first section to be built as a prototype is the power system. The PCB integrated power system will be prototyped with the primary to secondary power switch connected to the primary power source, a 120 V AC outlet. Measurements will be taken entering and exiting the power source switch to ensure that the proper amount of power is traveling completely through the switch. Also, the power output of the PCB power circuit will be tested to ensure the voltage and current are safe and consistent for the rest of the electronics in GLASS. Since the secondary power source is a photovoltaic solar panel feeding a backup battery which were both purchased whole, no prototype will be made and they will be tested in the testing stage. The primary power system prototype is to ensure that the system will actually receive at least the main power source. Next, the audio capture subsystem section: microphones, operational amplifiers, and analog to digital converters will be all combined in a circuit that will feed a data stream to the FPGA. The output of each stage will be monitored to ensure the data is consistently being read and initially processed through the FPGA. This section of the prototype may prove to be problematic due to the multiple microphones all having to be read by their respective analog to digital converters and then fed one at a time to the FPGA. After the audio section is prototyped, the four DPSRAM modules will be added to the audio section connecting the four bit streams to their respective DPSRAM module. The output of each DPSRAM will be monitored to verify that each bitstream is being buffered into the memory. Seperately, the ARM processor, DDR3 DRAM module, and peripheral ports will all be prototyped on the breadboard to confirm that the connections are valid. Once this is done, the audio section with the additional DPSRAM and primary power circuit will be connected to the processor and the entire circuit will be tested to see in the processor actually receives the audio data.
113
6.1.2 – Current Design
The current design was prototyped in sections similar to the initial design. The microphone circuits were built on breadboards and the inputs/outputs were checked for accuracy. The PCB was more difficult to prototype with the many more connections needed for the ATmega328 processor. It was done by placing the Atmega328 on a breadboard and programming the processor using a circuit topology demonstrated by the Arduino website.
6.2 Software
The algorithms for the location and gunshot recognition will first be developed in matlab using a prerecorded sound. Once the mathematical tasks are complete, they will be integrated into the GLASS system as C++ code. The operating system will be configured on a separate computer and placed into the board on an SD card. The system will then boot from this SD card. Once the algorithms have been prototyped and found working, they will be integrated to work on a linux run virtual machine. The primary tasks for this stage of design is to tune the multithreading and process creation aspects of the system to ensure that the microcontroller can performs the parallel data processing required on the actual hardware. Also the Bluetooth and GPS will have their drivers developed in this mode.
After the Virtual Machine mode of our development is completed, the software will be ported to a Beaglebone Black for debugging under an ARM system. Although GLASS does not run on a Beaglebone Black, the similarities in their microcontrollers and fact that GLASS’ general system hardware design is modeled after the Beaglebone, makes it a logical choice to prototype all software on. Since the Beaglebone shares a similar processor to ours, and our basic PCB layout is modeled after it, This will be the portion where the device specific bugs should occur. The major concern at this stage is that the code written in an Intel architecture works after it is placed in its ARM system. Naturally this stage requires the user interface to be virtually completed and only testing of the communication between the system and the Android device should remain. This phase also Includes the early tests of communicating with the Android device as the GPS will be connected for the first time.
Lastly the software is loaded onto the GLASS architecture. at this point there should be only minor bug due to the difference between the microcontrollers. Afterwards comes the tests and trials of the system on the “field.” Field testing includes reproducing sound signals from a speaker and determine if the source location is correct. Testing in this phase will be developed in more depth in the next chapter.
114
Chapter 7 Fabrication and Testing
7.1 Hardware
7.1.1 Initial Design
After the prototype is successful and the design schematics are finalized, the custom PCB design will be sent to PCBFabExpress.com for fabrication. PCBFabExpress.com will take the finished PCB schematics and combine the multi-layered design and produce a physical board. Once the PCB is returned to the GLASS group, all of the PCB destined parts from prototyping will be mounted on the PCB with the use of a plate soldering tool. The processor, five modules of RAM, USB ports, bluetooth, power circuit, SD card input, microUSB power input, and input and output pins will all be embedded onto the PCB at this point. Once the PCB is fabricated and all the necessary components are mounted onto the board, the primary power system will will be connected to the board via microUSB port. The board will be tested for general functionality by powering it on and running at least the embedded linux operating system through the SD card. After the primary power system is confirmed operating successful, the secondary power system will be tested. First, the photovoltaic solar panel will be tested and the output voltage and current will be measured to confirm the correct values are being produced. Next, the solar panel will be connected to depleted backup battery UPS and the pair will be tested to confirm that the panel can fully charge the battery from depletion in eight hours of less as calculated in the research portion of this project. The battery’s output voltage and current will finally be tested to ensure that values are safe for the electronics on the PCB. Lastly, the secondary power system will be connected to the rest of the system through the automatic power switch and the power switch will be tested. The power switch will be tested by having the PCB run the custom OS will in the middle of idling, the main power is pulled. If there is no interruption in power to the system, the switch is deemed suiTable Continuing, the audio section will be connected from the FPGA to the data pins which lead directly to the DPSRAM. It will also be connected to the power system. Next, an audio signal will be sent through the microphones and the entire circuit will be tested to see if the processor receives the audio data from each and every microphone with minimal distortion. Finally, the system will be connected to the wireless bluetooth output. The bluetooth output will first be tested for simple function to ensure that a bluetooth signal is being sent successfully to another bluetooth device successfully. After, the audio signals will be sent into the microphone array, and once the GLASS software is running, if correctly implemented, the bluetooth will transmit the time,

115
location, and caliber of a gunshot to another bluetooth device that will feed the data via wireless internet to the GLASS Android application where the data is displayed. The bluetooth device that connects to the internet will be tested simply on the basis if it will read in a bluetooth signal and transfer it to the internet.
7.1.2 Current Design
First, the audio/microphone circuits were designed and soldered onto perfboards. Each microphone was tested first by attaching the output of the microphones to an oscilloscope where the waveforms were viewed. Once each microphone was confirmed working the PCB was populated. The GLASS PCB required large and small component population using both hand soldering and hot plate soldering. PCB soldering is demonstrated in Fig. 7.1 below. Each lead on the PCB was electrically tested to insure the correct voltage values. The PCB was then mounted inside of a birdhouse to represent how inconspicuous GLASS can be. The microphone array was mounted on the roof of the birdhouse.
Fig. 7.1- Hand Soldering GLASS PCB
Lastly, the wireless module used to communicate between the GLASS board and the PC Arduino bridge was wired to the GLASS board and mounted to the birdhouse as well.
116
7.2 Software
7.2.1– Initial Design
Although the software does not technically get fabricated, its development must evolve as the fabrication of the system continues. While the first prototype is being constructed, the first algorithms must be adapted to fit the final architecture and then tested to ensure compatibility. Although the compiler will be able to translate the c/c++ code to assembly, Linux will not know where in memory the custom components reside, and it must therefore, be adapted to the to the new architecture by modifying source code. Testing for the software must occur at each stage of development. When the Triangulation, and correlation algorithms are completing development, there will be a phase of theoretical testing where prerecorded inputs are fed to the algorithms to determine the reliability of the code. Special care must be taken to replicate signals as they would appear During this testing phase the communication with the Android device will also be experimented with, so that the application on the Android device can be tested and finalized. Once the prototype has been completed, the software must be made to conform to the hardware of the GLASS system. This is a two step process beginning with making the software run on the Beaglebone Black, to make the conversion to an ARM environment, and then onto the hardware itself. The latter half of this stage will be the most difficult because it will be the first opportunity to interface with the DPSRAM and the four inputs for the microphones. We may begin to see timing issues arise for the hardware resulting in changing the the rate at which the microController accesses the buffers The final move to the actual hardware should Involve few actual alterations to the software. The primary objective at this stage is to optimize the code to GLASS’ architecture. When the move is made onto the final board connections between components will shorten and may result in faster access times. This is also when the field testing of GLASS commences. Multiple tests at varying ranges and locations must be performed and this will be the first attempt to compensate for such real world variables such as ambient noise, varying temperatures and the introduction of echos.
117
6.2.2 – Current Design
Considering that the hardware specifications have been simplified, the current design is only using two types of coding languages: C and C++. With the GLASS PCB replacing the FPGA and ADCs in the audio block, it functions as the audio listener and data transfer system. The GLASS board uses a modified C programming compiled by Arduino software. This code listens for audio signatures, captures them, and then transfers the data over Wi-fi to a secondary Arduino connected to the PC. The secondary Arduino functions as a bridge between the Wi-fi. The code utilizes the same peak detection algorithm as previously mentioned in the initial design and the Wi-fi link is a simple data transfer protocol. In the current design, the main processing was moved from the GLASS board to a main computer to handle the triangulation and gunshot recognition software. Also, the Android app/device was removed and the computer is used for data reviewing. The GLASS software is coded in an object oriented C++ language and compiled in Microsoft Visual Studio. The first thing the software does is create a data link between the computer and the Arduino Uno via USB. The computer pulls the audio data being sent from the GLASS board to the Arduino and brings it into the GLASS software for processing. The software itself processes the data the exact same way that the initial design section describes, using the same algorithms, equations, and theory. The only difference is between the initial and current designs on this process is where the processing is occurring.
After the location and gunshot are determined, the software then reports the data on the computer screen for viewing. A timestamp from the computer is associated with each gunshot and the location is output in relative terms to the location of the GLASS microphone setup.
118
Chapter 8 Design Summary and Conclusion
GLASS is a system designed to locate, recognize, and alert gunshots. The project has undergone a massive redesign for testing and presentation purposes due to a restriction of resources. The initial design stands as a consumer end product and the current design demonstrates a proof-of-concept for the original design. The initial design composed of two systems working together to process information to be published to a user interface on a separate device. Audio is sampled through a microphone array then the analog signal is converted into digital before being buffered by four modules of DPSRAM via FPGA. The processing occurs on a custom PCB running a dual core ARM® Cortex™A9. The processed data is then sent to an Android enabled device for viewing via Bluetooth. The current design utilizes a custom PCB with an ATmega328 which listens and forwards audio data via Wireless communication to a computer which will process the data in the same fashion the original GLASS board would. The output data is viewable on the computer in which does the processing in the current design as well rather than an Android device. In the processing phase of both designs, when a sample of sufficient amplitude is received it processes the information as necessary to run the location and correlation algorithms. Then the correlation and location algorithms are run to determine the weapon type and the location where the gunshot came from. The hardware for the main board was initially modeled after the BeagleBone Black. This design utilized a main power source, a typical 120 V AC power outlet and a secondary power source, an uninterrupted power supply battery charged by a 30 W photovoltaic solar panel. The peripherals included GPS, Bluetooth transceiver, USB, and an audio buffer. This design was not put into production because of resource constraints and the current proof-of-concept design was implemented.
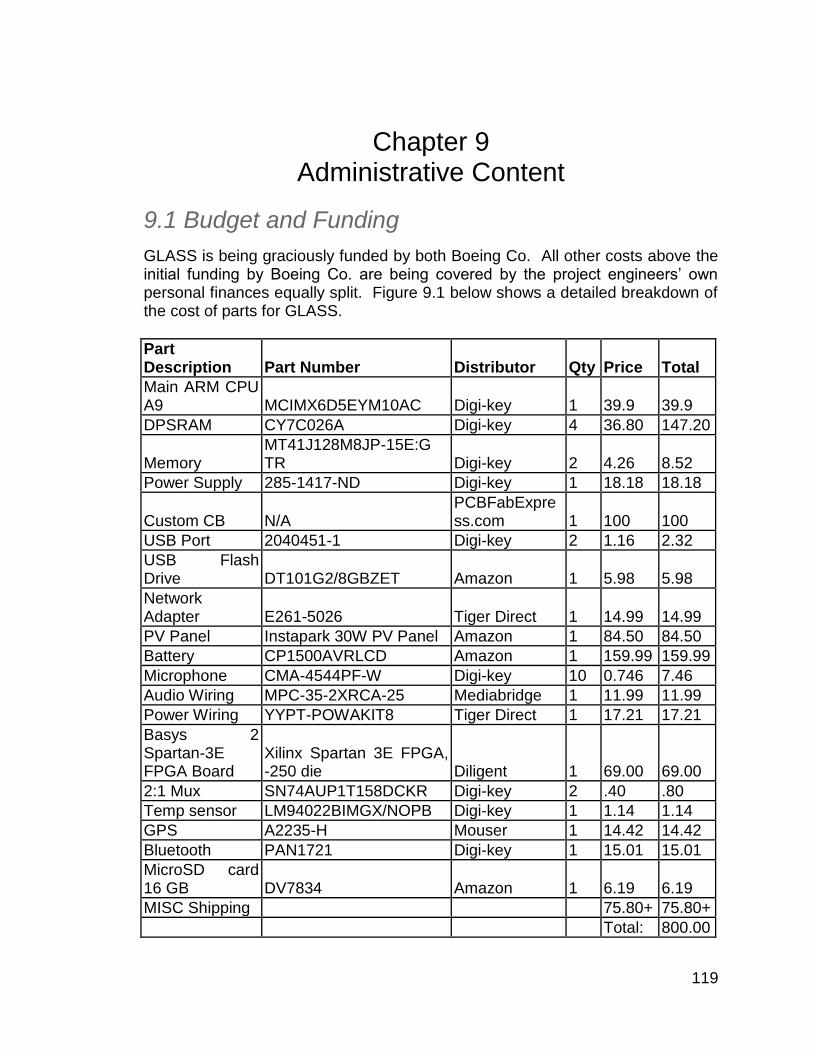
119
Chapter 9
Administrative Content
9.1 Budget and Funding
GLASS is being graciously funded by both Boeing Co. All other costs above the initial funding by Boeing Co. are being covered by the project engineers’ own personal finances equally split. Figure 9.1 below shows a detailed breakdown of the cost of parts for GLASS.
Part Description Part Number Distributor Qty Price Total
Main ARM CPU A9 MCIMX6D5EYM10AC Digi-key 1 39.9 39.9
DPSRAM CY7C026A Digi-key 4 36.80 147.20
Memory MT41J128M8JP-15E:G TR Digi-key 2 4.26 8.52
Power Supply 285-1417-ND Digi-key 1 18.18 18.18
Custom CB N/A PCBFabExpress.com 1 100 100
USB Port 2040451-1 Digi-key 2 1.16 2.32
USB Flash Drive DT101G2/8GBZET Amazon 1 5.98 5.98
Network Adapter E261-5026 Tiger Direct 1 14.99 14.99
PV Panel Instapark 30W PV Panel Amazon 1 84.50 84.50
Battery CP1500AVRLCD Amazon 1 159.99 159.99
Microphone CMA-4544PF-W Digi-key 10 0.746 7.46
Audio Wiring MPC-35-2XRCA-25 Mediabridge 1 11.99 11.99
Power Wiring YYPT-POWAKIT8 Tiger Direct 1 17.21 17.21
Basys 2 Spartan-3E FPGA Board
Xilinx Spartan 3E FPGA, -250 die Diligent 1 69.00 69.00
2:1 Mux SN74AUP1T158DCKR Digi-key 2 .40 .80
Temp sensor LM94022BIMGX/NOPB Digi-key 1 1.14 1.14
GPS A2235-H Mouser 1 14.42 14.42
Bluetooth PAN1721 Digi-key 1 15.01 15.01
MicroSD card 16 GB DV7834 Amazon 1 6.19 6.19
MISC Shipping 75.80+ 75.80+
Total: 800.00
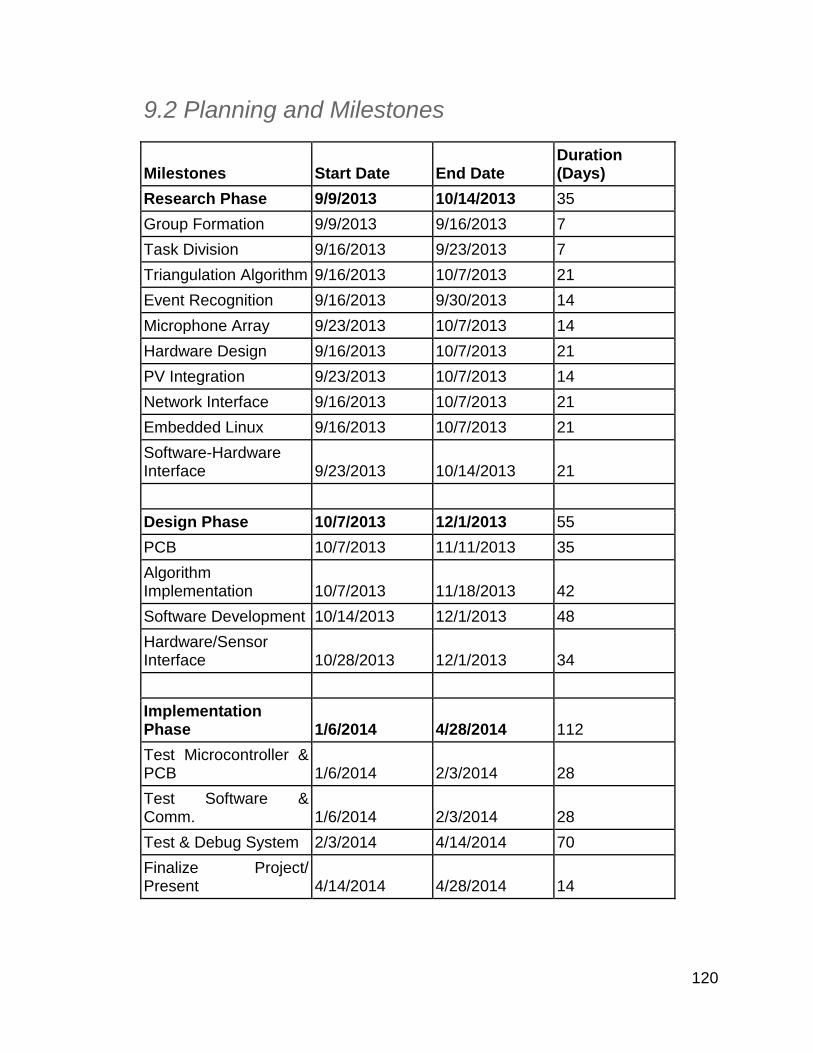
120
9.2 Planning and Milestones
Milestones Start Date End Date Duration (Days)
Research Phase 9/9/2013 10/14/2013 35
Group Formation 9/9/2013 9/16/2013 7
Task Division 9/16/2013 9/23/2013 7
Triangulation Algorithm 9/16/2013 10/7/2013 21
Event Recognition 9/16/2013 9/30/2013 14
Microphone Array 9/23/2013 10/7/2013 14
Hardware Design 9/16/2013 10/7/2013 21
PV Integration 9/23/2013 10/7/2013 14
Network Interface 9/16/2013 10/7/2013 21
Embedded Linux 9/16/2013 10/7/2013 21
Software-Hardware Interface 9/23/2013 10/14/2013 21
Design Phase 10/7/2013 12/1/2013 55
PCB 10/7/2013 11/11/2013 35
Algorithm Implementation 10/7/2013 11/18/2013 42
Software Development 10/14/2013 12/1/2013 48
Hardware/Sensor Interface 10/28/2013 12/1/2013 34
Implementation Phase 1/6/2014 4/28/2014 112
Test Microcontroller & PCB 1/6/2014 2/3/2014 28
Test Software & Comm. 1/6/2014 2/3/2014 28
Test & Debug System 2/3/2014 4/14/2014 70
Finalize Project/ Present 4/14/2014 4/28/2014 14
121
9.3 Management Style
The GLASS project utilized a hybrid of Agile and Democratic management styles. It was decided early in the project team formation that there would be no single member managing every other team members’ work. However as the project progressed, the team members have formed divisions of expertise as the tasks with interrelated components gained in complexity. For example if a portion of the project interrelates two disparate components through a central component, the team member who works on that part of the subsystem must be kept aware of the other two. Starting with the creation of the project topic, the team’s engineers had Round Table Meetings to discuss and informally vote on which project topics were good and which were subpar. This democratic process continued through the division of labour process where the team shared their strengths and weaknesses, and the project tasks were quickly assigned. Some members shared strengths and therefore some of the project tasks were split equally. The democratic management style worked very well with a team size this small and there was never any long term productivity freezes due to disagreeing team members. After the project topic was decided and division of labour completed the project research and design phase was loosely based on SCRUM management. SCRUM management is defined by Forbes as having the following ten characteristics:
1. Organize work in short cycles. 2. The management does not interrupt the team during a work cycle. 3. The team reports to the client, not the manager. 4. The team estimates how much time work will take. 5. The team decides how much work it can do in an iteration. 6. The team decides how to do the work in the iteration. 7. The team measures its own performance. 8. Define work goals before each cycle starts. 9. Define work goals through user stories. 10. Systematically remove impediments.
GLASS’ team of engineers met as a whole at least biweekly to brainstorm, discuss, plan, design, and asses past, current, and future work. In general, no member of the team interrupted another team member’s work cycle playing a managerial role (2). Although, there was no client, the team reported to itself and not to a manager (3) and measured its performance at each meeting (7). As shown in Figure 3.2, the Milestone table, the work loads were organized in short work cycles (1), decided how much time the work would take (4), how much work to do in each iteration (5), and defined work goals before each cycle (8). Each member of the team decided how to do his work or worked with another
122
team member for splitting work (6). Each team member discussed their efforts since the last meeting (9) and through team member support, the group quickly dissipated any problems that occurred. The Democratic SCRUM management style definitely worked well for Team GLASS as it produced reliable and consistent work flow and results. The collaboration continued as each team member’s results started to be recorded. To keep track of the data, all member files were kept in a shared Google Docs folder where each team member could make comments on documents, update data, and type reports real time. So although the team only met biweekly, with the real time collaboration on GoogleDocs, the team met multiple times a week.
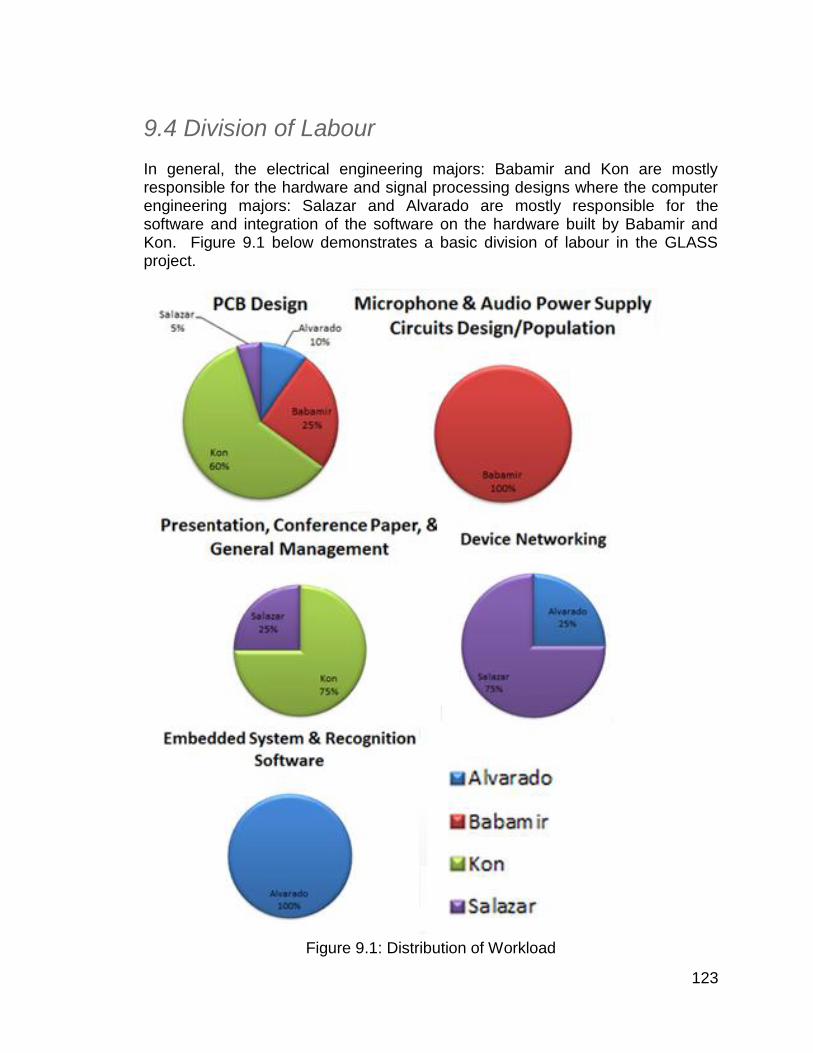
123
9.4 Division of Labour
In general, the electrical engineering majors: Babamir and Kon are mostly responsible for the hardware and signal processing designs where the computer engineering majors: Salazar and Alvarado are mostly responsible for the software and integration of the software on the hardware built by Babamir and Kon. Figure 9.1 below demonstrates a basic division of labour in the GLASS project.
Figure 9.1: Distribution of Workload

124
Acknowledgments
At the beginning of this project, it was clear that the financial burden would not be light due to the large amount of components required and the complex technology needed to implement the GLASS design. Therefore, we would first like to thank our main financial sponsor, The Boeing Company for funding GLASS. Boeing has allotted financial support for projects in the categories of homeland and cyber security. The GLASS team would like to extend our gratitude to Sunstone Circuits for providing our hardware designers with priceless advice on printed circuit board design as well as providing us with a discount on all of our printed circuit boards through their sponsorship program. Christian Kon would personally like to thank Erik Torell from Sunstone Circuits for aiding with a double check of the GLASS board schematic. Third, we thank Maxim Integrated for sending us samples of components essential to our initial design as well as providing us with countless resources on audio signal processing related to their products and great customer service. Next, we appreciate all of the professors that guided and mentored us to success in this project. And we are very gracious to NRA Licensed Instructor and Range Safety Officer John Caballero for not only providing us with sponsored range time at the Central Florida Rifle and Pistol Club, but for also challenging our designers with great mentoring on sound and waveform analysis relating to firearm sound analysis and identification. Lastly, we extend our thanks and love to our families and friends for dealing with many sleepless nights, bad moods, and events missed necessary for GLASS to succeed.
Sponsored By
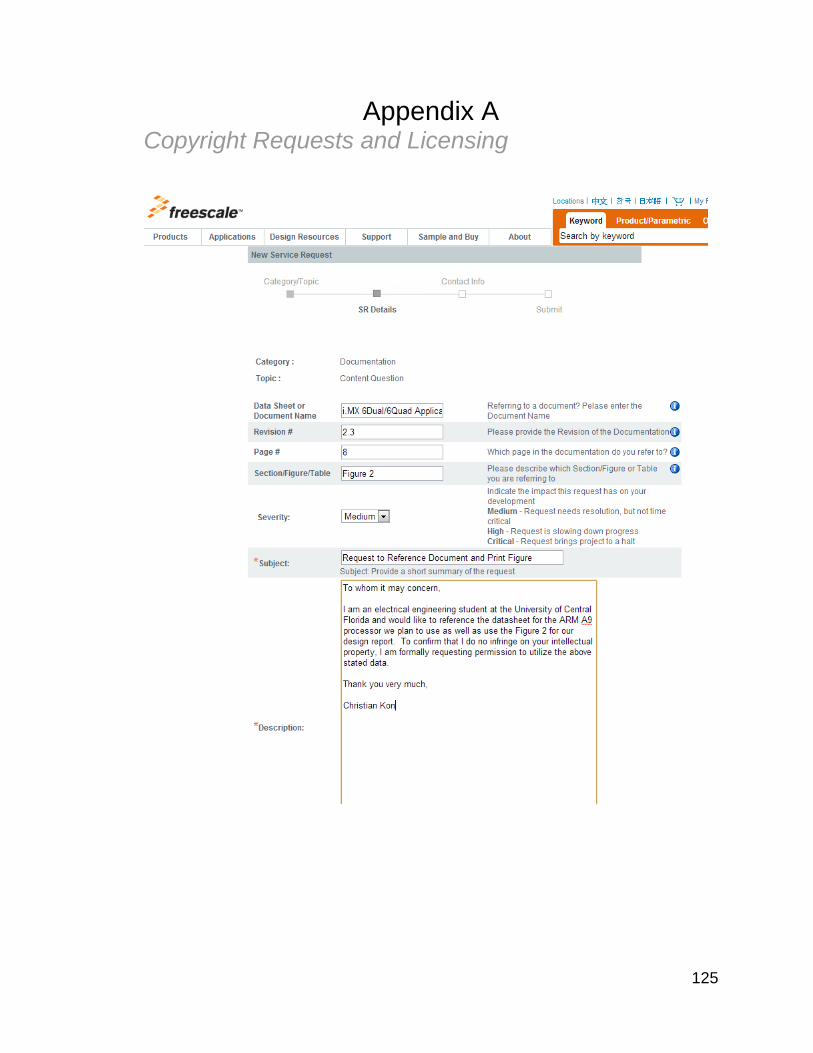
125
Appendix A
Copyright Requests and Licensing
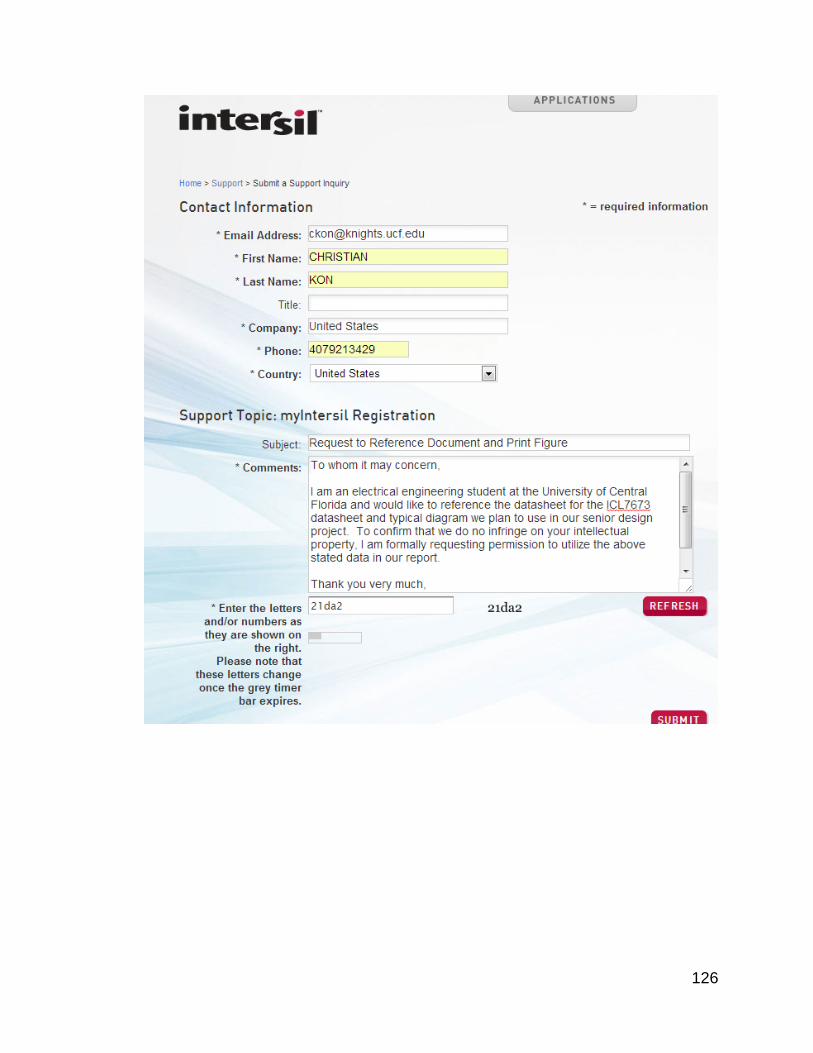
126

127
Figure 3.15, credited to the author “Jephthai” who has released it under Creative Commons Attribution 3.0. http://commons.wikimedia.org/wiki/File:Ruger-LCR-38-sp-front-quarter.jpg Figure 3.19, credited to the author “Vladmir Dudak” who has released it under Creative Commons Attribution 3.0. http://en.wikipedia.org/wiki/File:GLOCK_19.JPG Figure 3.22, credited to the author “Sam Lisker” who has released it under Creative Commons Attribution-Share Alike 3.0. http://commons.wikimedia.org/wiki/File:Colt_Model_of_1911_U.S._Army_b.jpg Figure 3.27, credited to the author “Dictouray” who has released it under Creative Commons Attribution-Share Alike 3.0. http://en.wikipedia.org/wiki/File:Ruger-1022.jpg Figure 3.31, credited to the author “Steelerdon” who has released it under Creative Commons Attribution 3.0. http://en.wikipedia.org/wiki/File:1973_Colt_AR15_SP1.jpg Figure 3.34, image is part of the public domain. http://en.wikipedia.org/wiki/File:Rifle_Springfield_M1903.jpg Figure 3.37, image is part of the public domain. http://commons.wikimedia.org/wiki/File:Remington_M870_12_Gauge.jpg
128
Appendix B
Works Cited
[1] “Shotgun detector”. Armada.ch. Web. http://www.armada.ch/gunfire-location-system-acoustic-gunshot-detection-systems/ [2] “Gunshot locater system”. Wired. Web. http://www.wired.com/dangerroom/2010/03/military-helicopters-may-get-gunshot-location-system/ [3] “Gunshot locater system”. Bbn. Web. http://bbn.com/boomerang [4] “Gunshot locater system”. Bbn. Web. http://bbn.com/boomerang [5] “How a microphone works”. Audiolinks. Web. https://microphones.audiolinks.com/microphones.shtml [6] “How wavelets work”. Tscm. Web. http://www.tscm.com/wavelet.pdf [7] “Audio shotgun detection”. Colostate.edu. Web. http://digitool.library.colostate.edu///exlibris/dtl/d3_1/apache_media/L2V4bGlicmlzL2R0bC9kM18xL2FwYWNoZV9tZWRpYS8xNzUzODI=.pdf [8] Donzier, A., Cadavid, S., Small arm fire acoustic detection and localization systems: gunfire detection system, Proc. SPIE Vol. 5778, p. 245–253, Jun 2005.