hands-on planning: evaluating planners · evaluating planners-100 0 100 200 300 400 500 600 700 800...
TRANSCRIPT

Hands-on planning: Evaluating plannersICAPS 2013 Summer School. Perugia, Italy
Sergio Jimenez Celorrio Carlos Linares Lopez
Planning and Learning GroupUniversidad Carlos III de Madrid
June, 7, 2013

Evaluating planners
Which planner should I buy?

Evaluating plannersPlanner Total
lama-2011 216.33
fdss-1 202.08fdss-2 196.00fd-autotune-1 185.09roamer 181.47fd-autotune-2 178.15forkuniform 177.91probe 177.14arvand 165.07lama-2008 163.33lamar 159.20randward 141.43brt 116.01dae-yahsp 101.83cbp2 98.34
yahsp2 94.97
yahsp2-mt 94.14cbp 85.43lprpgp 67.07madagascar-p 65.93popf2 59.88madagascar 51.98cpt4 47.85satplanlm-c 29.96sharaabi 20.52acoplan 19.33acoplan2 19.09
Table: Final scores sequential satisficing track IPC-2011.

Evaluating planners
-100
0
100
200
300
400
500
600
700
800
900
1000
0 2 4 6 8 10 12 14 16 18 20
secs
problem
lama-2011yahsp2
Figure: Time first solution Transport domain sequential satisficing track IPC-2011.

Planning task
Which planner should I buy?
• Which planning task do I need to solve?
• Under which conditions?

Outline
1 Planning task
2 Evaluation setup
3 IPC Evaluation
4 Statistical Tests
5 Evaluation reports
6 Homework
Planning task
Which planner should I buy?
• which planning task do I need to solve?• how do states, actions and plans look like?

Planning task
A
B
1 2 3 4 5
D
E
CG
Figure: Reaching D2 starting from A5 with actions →,←, ↑, ↓ .

Planning task
A
B
1 2 3 4 5
D
E
C
G
Figure: Reaching D2 starting from A5 with actions →,←, ↑, ↓ .

Planning task
+
optimal
plannin
g,
best pla
n
satis
ficing
plannin
g,
good
plan
solv
abili
ty
any
plan
overs
ubcrip
tion,
plan
only
achiev
ing
apar
t
ofth
ego
als
-

Planning task
A
D
E
C
B
1 2 3 4 5
G
Figure: Partially observable states.

Planning task
A
D
E
C
B
1 2 3 4 5
G
Figure: Non-deterministic actions.

Planning task
+
Strong
solu
tion,
safe
plan
Wea
kso
lutio
n,
may
achiev
eth
ego
als
-

Planning task
Different planning task according to different
• States and Actions• Resources, time, uncertainty
• Plans• Satisfaction and optimization requirements

Planning task
Which planner should I buy?
• which planning task do I need to solve?• Planning model• Performance metric• Benchmark

Planning task
+
optimal
plannin
g,
best pla
n
satis
ficing
plannin
g,
good
plan
solv
abili
ty
any
plan
overs
ubcrip
tion,
plan
only
achiev
ing
apar
t
ofth
ego
als
-

Planning task
Planning performance metrics quantify the achievement ofscientific/engineering requirements.

Planning task
Different metrics used in planning (they are not exclusive)
• IPC metrics,• Number of solved problems• Time first solution plan• Plan length or plan make-span• Plan quality, IPC-2008 and IPC-2011 [Linares et al., 2013]
• other planning metrics,• flexibility [Nguyen and Kambhampati, 2001]
• stability [Fox et al., 2006]
• diversity [Nguyen et al., 2012b]
• other desired planning requirements,• justified actions [Haslum, 2012]
• agents decoupling [Brafman and Domshlak, 2013]
• . . .

Evaluating planners
0
50
100
150
200
250
0 2 4 6 8 10 12 14 16 18 20
cost
problem
last solutionfirst solution
Figure: Cost of the first and last solutions found by lama-2011, Openstacks domainsequential satisficing track IPC-2011.
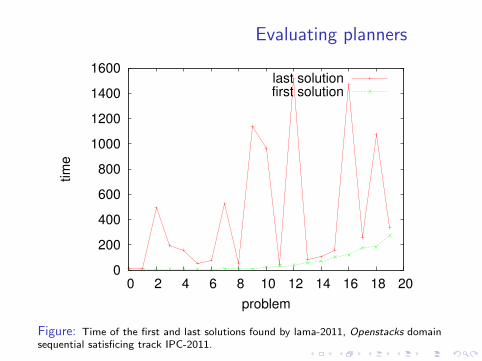
Evaluating planners
0
200
400
600
800
1000
1200
1400
1600
0 2 4 6 8 10 12 14 16 18 20
tim
e
problem
last solutionfirst solution
Figure: Time of the first and last solutions found by lama-2011, Openstacks domainsequential satisficing track IPC-2011.

Planning task
Which planner should I buy?
• which planning task do I need to solve?• Planning model• Performance metric• Benchmark

Planning task
Benchmarks that verify the achievement of thescientific/engineering requirements
• Overall performance
• Stress tests, specific challenges

Planning task
Figure: The spanner domain from the learning part of the IPC-2011. The workermust pick up the wrenches and tight the nuts. Challenging for planners based on the’delete lists’ relaxation since wrenches get broken after one use and the worker cannotcomeback.

Summary
Which planner should I buy?
• which planning task do I need to solve?• Planning model• Performance metric• Benchmark

Outline
1 Planning task
2 Evaluation setup
3 IPC Evaluation
4 Statistical Tests
5 Evaluation reports
6 Homework

Evaluation setup
Which planner should I buy?
• Which planning task do I need to solve?
• Under which setup? [Howe and Dahlman, 2002]

Evaluation setup
Evaluation setup
• Score function
• Computational resources
• Domains/problems

Evaluation setup
Different metrics used in planning (they are not exclusive)
• IPC metrics• Number of solved problems• Time first solution plan• Plan length or plan make-span• Plan quality, IPC-2008 and IPC-2011 [Linares et al., 2013]
• other planning metrics,• flexibility [Nguyen and Kambhampati, 2001]
• stability [Fox et al., 2006]
• diversity [Nguyen et al., 2012b]
• and more desired requirements,• justified actions [Haslum, 2012]
• agent decoupling [Brafman and Domshlak, 2013]
• . . .

Evaluation setupPlanner Total
lama-2011 216.33fdss-1 202.08fdss-2 196.00fd-autotune-1 185.09roamer 181.47fd-autotune-2 178.15forkuniform 177.91
probe 177.14
arvand 165.07lama-2008 163.33lamar 159.20randward 141.43brt 116.01dae-yahsp 101.83cbp2 98.34yahsp2 94.97yahsp2-mt 94.14cbp 85.43lprpgp 67.07madagascar-p 65.93popf2 59.88madagascar 51.98cpt4 47.85satplanlm-c 29.96sharaabi 20.52acoplan 19.33acoplan2 19.09
Planner Total
lama-2011 250.00
probe 233.00
fdss-2 233.00fdss-1 232.00fd-autotune-1 223.00roamer 213.00forkuniform 207.00lamar 195.00fd-autotune-2 193.00arvand 190.00lama-2008 188.00randward 184.00brt 157.00yahsp2 138.00yahsp2-mt 137.00cbp2 135.00cbp 123.00dae-yahsp 120.00lprpgp 118.00madagascar-p 88.00popf2 81.00madagascar 67.00cpt4 52.00sharaabi 33.00satplanlm-c 32.00acoplan2 20.00acoplan 20.00
Table: Quality and Coverage rankings of the sequential satisficing track IPC-2011.

Evaluation setupPlanner Total
lama-2011 216.33fdss-1 202.08fdss-2 196.00fd-autotune-1 185.09roamer 181.47fd-autotune-2 178.15forkuniform 177.91probe 177.14arvand 165.07lama-2008 163.33
lamar 159.20
randward 141.43brt 116.01dae-yahsp 101.83cbp2 98.34yahsp2 94.97yahsp2-mt 94.14cbp 85.43lprpgp 67.07madagascar-p 65.93popf2 59.88madagascar 51.98cpt4 47.85satplanlm-c 29.96sharaabi 20.52acoplan 19.33acoplan2 19.09
Planner Total
lama-2011 155.21probe 154.63fdss-2 137.22fd-autotune-1 129.51roamer 118.81
lamar 115.54
forkuniform 113.62fd-autotune-2 103.79randward 102.06yahsp2-mt 101.96lama-2008 101.66fdss-1 99.57yahsp2 99.40madagascar-p 77.71arvand 77.39brt 74.31lprpgp 72.62cbp2 59.92cbp 56.84daeyahsp 48.73madagascar 48.52popf2 41.93cpt4 32.41satplanlm-c 16.58sharaabi 13.91acoplan 9.05acoplan2 8.12
Table: Quality and Time rankings of the sequential satisficing track IPC-2011.

Evaluation setup
Quality score for satisficing planners (IPC-2008 and 2011)
• Q(planner , problem) = BestCost(problem)BestCost(planner ,problem)
• Q(planner) =∑
i Q(planner , i)
• BestCost(problem) must be the optimal on the contrary theranking computed with this score can be altered

Evaluation setup
PlannerA PlannerB Optimal
000 10 20 10001 20 40 5002 100 60 60003 110 80 80mean 60 50median 60 50
Table: Quality of best plans found for problems 000-003.
without optimal solutions Q(PlannerA)>Q(PlannerB)
Q(PlannerA) = ( 1010 ) + ( 20
20 ) + ( 60100 ) + ( 80
110 ) = 3.327
Q(PlannerB) = ( 1020 ) + ( 20
40 ) + ( 6060 ) + ( 80
80 ) = 3
with optimal solutions Q(PlannerA)<Q(PlannerB)
Q(PlannerA) = ( 1010 ) + ( 5
20 ) + ( 60100 ) + ( 80
110 ) = 2.577
Q(PlannerB) = ( 1020 ) + ( 5
40 ) + ( 6060 ) + ( 80
80 ) = 2.625

Evaluation setup
Evaluation setup
• Score function
• Computational resources
• Domains/problems

Evaluation setup
20
40
60
80
100
120
140
160
180
200
220
1 10 100 1000 10000
pro
ble
m s
olv
ed
secs
fdss-2lamar
Figure: Evolution of coverage over time, sequential satisficing track IPC-2011.

Evaluation setup
0
2
4
6
8
10
12
14
16
18
20
1 10 100 1000 10000
score
secs
lama-2011probe
Figure: Evolution of the IPC score over time at the openstacks domain sequentialsatisficing track IPC-2011.

Evaluation setup
planner Time failures Memory failures Unexpected failurescpt4 176 0 56gamer 65 39 26lmfork 123 8 1fd-autotune 111 3 –lmcut 110 3 –forkinit 87 33 2selmax 100 9 2
fdss-1 95 0 –
fdss-2 3 78 17iforkinit 58 71 7bjolp 29 81 19merge-and-shrink 4 76 31
Table: Number of time, memory and unexpected failures at the sequential optimaltrack of the IPC-2011.

Evaluation setup
domain solved
visitall 20.00transport 20.00woodworking 19.00scanalyzer 17.00
pegsol 15.00
parcprinter 13.00barman 12.00nomystery 10.00floortile 8.00
parking 3.00
tidybot 0.00elevators 0.00openstacks 0.00sokoban 0.00total 137.00
domain solved
visitall 20.00transport 20.00woodworking 19.00scanalyzer 19.00
parking 18.00
barman 15.00parcprinter 13.00
pegsol 12.00
nomystery 12.00floortile 7.00tidybot 0.00elevators 0.00openstacks 0.00sokoban 0.00total 155.00
Table: Problems solved by yahsp2-mt at the sequential satisficing track and at thesequential multicore track (4 cores) IPC-2011.

Evaluation setup
Evaluation setup
• Score function
• Computational resources
• Domains/problems

Evaluation setupplanner nomystery elevators floortile total
fd-autotune-2 18.36 16.17 8.87 43.40arvand 18.97 11.22 3.00 33.19forkuniform 10.45 18.01 4.02 32.48fdss-2 11.21 14.50 6.60 32.31fdss-1 11.26 12.52 5.30 29.08fd-autotune-1 9.50 11.04 5.46 26.00
lama-2011 9.92 10.28 5.49 25.69
roamer 9.67 13.61 2.38 25.65brt 5.75 13.84 2.82 22.41lamar 11.46 7.34 2.36 21.15lama-2008 11.44 4.94 2.07 18.45probe 5.90 8.24 2.83 16.98cpt4 15.00 0.00 0.00 15.00randward 8.55 4.29 2.00 14.84daeyahsp 9.67 0.00 4.39 14.06madagascar-p 13.93 0.00 0.00 13.93yahsp2-mt 9.61 0.00 4.08 13.69popf2 8.22 4.73 0.67 13.61madagascar 12.98 0.00 0.00 12.98lprpgp 7.26 4.56 1.09 12.90cbp2 4.00 7.34 0.00 11.34yahsp2 6.70 0.00 3.29 9.99cbp 4.00 4.86 0.00 8.86satplanlm-c 3.00 0.00 0.00 3.00sharaabi 0.00 0.56 0.00 0.56acoplan 0.00 0.00 0.00 0.00total 236.79 168.04 66.73
Table: Score in a biased selection of domains from the seq-sat track IPC-2011.

Planning task
Beyond syntax, structural information affects planning performance
• Classical planning [Hoffmann, 2005]
• goals dependencies, dead-ends,. . .

Evaluating planners
-100
0
100
200
300
400
500
600
700
800
900
1000
0 2 4 6 8 10 12 14 16 18 20
secs
problem
lama-2011yahsp2
Figure: Time first solution Transport domain sequential satisficing track IPC-2011.
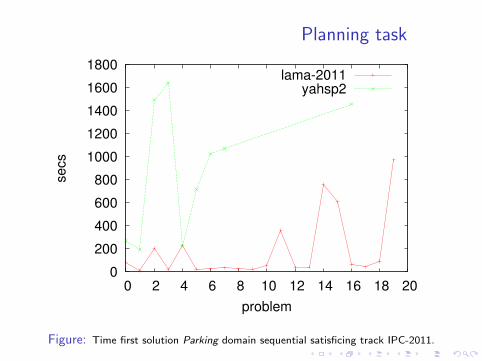
Planning task
0
200
400
600
800
1000
1200
1400
1600
1800
0 2 4 6 8 10 12 14 16 18 20
se
cs
problem
lama-2011yahsp2
Figure: Time first solution Parking domain sequential satisficing track IPC-2011.

Evaluation setuplama-2011 yahsp2
000 1.00 0.56001 1.00 0.65002 1.00 0.54003 1.00 0.56004 1.00 0.86005 1.00 0.58006 1.00 0.72007 1.00 0.60
008 1.00 ∅
009 1.00 ∅
010 1.00 ∅
011 1.00 ∅
012 1.00 ∅
013 1.00 ∅
014 1.00 ∅
015 1.00 ∅016 1.00 0.60
017 1.00 ∅
018 1.00 ∅
019 1.00 ∅total 20.00 5.66
Table: Score in the problems from the parking domain of the seq-sat track IPC-2011.

Planning task
Beyond syntax, structural information affects planning performance
• Classical planning [Hoffmann, 2005]
• goals dependencies, dead-ends
• Temporal planning [Cushing et al., 2007]
• Required concurrency

Planning task
planner pegsol crewp parking ostacks elevat. ftile mcellar sokoban storage pprinter t&o tms total
dae-yahsp 19.67 19.95 18.92 20.00 14.46 7.96 0.00 4.55 17.06 3.58 0.00 0.00 126.16yahsp2-mt 17.77 15.93 15.44 12.18 11.73 9.54 0.00 11.83 8.86 7.85 0.00 0.00 111.14popf2 18.61 20.00 17.98 15.19 2.20 0.00 19.99 2.63 0.00 0.00 9.00 5.00 110.60yahsp2 16.96 15.97 13.44 12.74 11.35 7.78 0.00 11.14 2.74 6.85 0.00 0.00 98.97lmtd 19.95 0.00 0.00 0.00 7.73 5.00 15.00 0.00 0.00 0.00 10.07 0.00 57.75cpt4 18.67 7.00 0.00 0.00 0.00 13.74 0.00 0.00 0.00 5.00 0.00 0.00 44.41sharaabi 0.00 0.00 0.00 0.00 0.00 0.00 0.00 0.00 0.00 0.00 0.00 0.00 0.00tlp-gp 0.00 0.00 0.00 0.00 0.00 0.00 0.00 0.00 0.00 0.00 0.00 0.00 0.00total 111.63 78.85 65.79 60.11 47.48 44.03 34.99 30.15 28.66 23.29 19.07 5.00
Table: Final scores temporal satisficing track IPC-2011.

Summary
Which planner should I buy?
• Planning task• Planning model• Performance metric• Benchmark
• Evaluation setup• Score function• Computational resources• Domains/problems

Evaluating planners
IPC-style experiments is a tradition [Hoffmann, 2011]
1 Run IPC benchmarks (unless you run all, run the most recent ones)
2 Time-out is 30 minutes
3 VALidate solutions [Howey et al., 2004]
4 Compare to the most recent IPC winner (using IPC score)

Outline
1 Planning task
2 Evaluation setup
3 IPC Evaluation
4 Statistical Tests
5 Evaluation reports
6 Homework
IPC Evaluation
• Well-defined planning tasks
• Well-defined evaluation setup
• Available open-source tools

IPC Evaluation
IPC-1998 (McDermott)- PDDL 1.0: Introduction of Standard Language- STRIPS/ADL Planning
IPC-2000 (Bacchus)- Hand-Coded Track
IPC-2002 (Fox & Long)- PDDL 2.1: Temporal Modelling- Temporal Track- Last Hand-Coded Track- VAL Automated Plan Validator
IPC-2004 (Hoffmann & Edelkamp)- PDDL 2.2: Timed Initial Literals & Axioms- Optimal Track
IPC-2006 (Gerevini, Saetti, Haslum & Dimopoulos)- PDDL 3.0: Preferences (preferences track)- Shift of focus to Plan Quality Metrics
IPC-2008 (Do, Helmert & Refanidis)- New Formally Defined Scoring Metrics- PDDL 3.1: Object Fluents & Action Costs - Preferences Becomes Net Benefit Track
IPC-2008: Uncertainty (Buffet & Bryce) - Fully Observable Non-Deterministic Track IPC-2008: Learning
(Fern, Khardon & Tepalli) - PDDL 1.0 Strips Domains - Learn to Find Plans Faster
IPC-2011: Uncertainty (Sanner & Yoon) - RDDL (Compilation to PPDDL Provided) - Partially-Observable Probabilistic Track (POMDP)
IPC-2011: Learning (Jiménez, Coles & Coles) - Quality and Time Metrics - Pareto Dominance Criterion
IPC-2011 (Linares, Olaya & Jiménez)-Multi-Core Track
IPC-2006: Uncertainty (Bonet & Givan) - Non-Observable Non-Deterministic Track (Conformant)
Only 1 EntrantCancelled
Classical (Satisficing)Hand-CodedTemporalOptimalPreferences/Net BenefitMDPLearningMulti-CoreConformantFully Observable Non-D.
Tracks
History of the International Planning Competition
IPC-2013
1
3
5
7
2
4
6
ICKEPS-2005(Barták &
McCluskey)
ICKEPS-2007(Edelkamp & Frank)
ICKEPS-2009(Barták, Fratini & McCluskey)
ICKEPS-2012(Vaquero & Fratini)
Knowledge EngineeringIPC-2004: Uncertainty (Littman & Younes)- PPDDL- Fully Observable Probabilistic Track (MDP)
POMDP
No 2011Orga-niser

IPC Evaluation
Well-defined planning tasks,
• separation of• domain-dependent and domain-independent planning
[Bacchus, 2001, Long and Fox, 2003a]
• optimal and satisfycing planning[Hoffmann and Edelkamp, 2005]
• plan-cost and makespan optimizationhttp://raos-ruminations.blogspot.com
• 4 separated tracks at the IPC-2011• seq-sat, seq-opt, seq-mco, tempo-sat
http://www.plg.inf.uc3m.es/ipc2011-deterministic/

IPC Evaluation
. . . but there is a multitude of different planning tasks notaddressed at IPC [Kambhampati, 2011]
Figure: .
IPC Evaluation
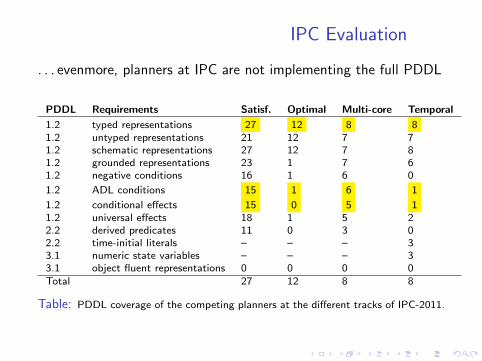
. . . evenmore, planners at IPC are not implementing the full PDDL
PDDL Requirements Satisf. Optimal Multi-core Temporal
1.2 typed representations 27 12 8 81.2 untyped representations 21 12 7 71.2 schematic representations 27 12 7 81.2 grounded representations 23 1 7 61.2 negative conditions 16 1 6 0
1.2 ADL conditions 15 1 6 1
1.2 conditional effects 15 0 5 11.2 universal effects 18 1 5 22.2 derived predicates 11 0 3 02.2 time-initial literals – – – 33.1 numeric state variables – – – 33.1 object fluent representations 0 0 0 0Total 27 12 8 8
Table: PDDL coverage of the competing planners at the different tracks of IPC-2011.

IPC Evaluation
. . . skipping interesting domains
Domain Authors RemarksCrisp Ron Petrick and Required conditional-effects and
Alexander Koller quantified-preconditions which were notsupported by most of participant planners
Market Amanda Coles and Required numeric preconditions which wereAndrew Coles not supported by most of participant planners
Contingent Domains Guy Shani A collection of contingent planningdomains compiled into classical planning.Required conditional-effects andquantified-preconditions which were notsupported by most of participant planners
Table: Interesting domains out of IPC-2011, more info can be found athttp://www.plg.inf.uc3m.es/ipc2011-deterministic/NonUsedDomains.

IPC Evaluation
From virtue to vice
• The IPC is a standard evaluation for a set of planning tasksbut not for anything else
• time-line based planning• model-lite planning• continuous planning• . . .

IPC Evaluation
The expressiveness vs performance tension
• There is a lack of expressive planners at the IPC
• Classical planners can be used for further planning tasks[Nebel, 2000, Keyder and Geffner, 2009, Palacios and Geffner, 2009,
Nguyen et al., 2012a]

IPC Evaluation
• Well-defined planning tasks
• Well-defined evaluation setup
• Available open-source tools

IPC Evaluation
Well-defined evaluation setup
• Score
• Computational resources
• Domains/Problems

IPC Evaluation
Once again there are interesting challenges out of the IPCevaluation setup,
• planning with small time bounds (videogames, robotics)
• efficient preprocessing (large logistics problems)
• using the Graphics Processing Unit (GPU) [Sulewski et al., 2011]
• using external memory [Edelkamp et al., 2007]
• . . .

IPC Evaluation
From virtue to vice,
• the IPC is not an analysis of the current state-of-the-art butinfluences the shape of state-of-the-art planners
• planners perform well on past IPC benchmarks• proliferation of portfolios and auto-tuned planners• planners tuned for the IPC evaluation setup

IPC Evaluation
• Well-defined planning tasks
• Well-defined evaluation setup
• Available open-source tools

IPC Evaluation
Available open-source tools to
• VALidate plans and reported metrics [Howey et al., 2004]
• share domains/problems/results
• run IPC-style experiments
• inspect results
• rank planners according to different metrics
• perform statistical tests

Summary
• Well defined evaluations
• Useful open-source software
• IPC evaluates a few interesting challenges not all of them

Outline
1 Planning task
2 Evaluation setup
3 IPC Evaluation
4 Statistical Tests
5 Evaluation reports
6 Homework

Statistical Tests
The need of statistical tests (I)
• Overall, we have to assess on the performance of incompletealgorithms!
• where there are a number of different metrics
• First-order statistical measures such as the mean, median arenot sufficient (see Joerg Hoffman, Evaluating planningalgorithms)
• Even if you accompany of second-order statistical measuressuch as the variance, they are still incomplete —butadmittedly better informed

Statistical Tests
The need of statistical tests (II)
• Example: toss a coin ten times, observe eight heads. Is thecoin fair (i.e., what is its long run behavior?) and what is yourresidual uncertainty?
• You say, ”If the coin were fair, then eight or more heads ispretty unlikely, so I think the coin isnt fair”
• Like proof by contradiction: Assert the opposite (the coin isfair) show that the sample result (≤ 8 heads) has lowprobability p, reject the assertion, with residual uncertaintyrelated to p
• Estimate p with a sampling distribution

Statistical Tests
Statistical Tests in planning [Linares Lopez et al., 2013]
• Parametric vs non-parametric
• Data: nominal/categorical, (discrete/continuous)dichotomous, ordinal, interval or ratio
• Purposes:
• Coverage: Binomial Test• Time, memory and cost
• Paired or related samples: Wilcoxon signed-rank test• Unrelated or non-paired samples: Mann-Whitney U Test
• Ranking : Spearman rank-order correlation coefficient rs
• Available under many languages including Python and R

Statistical Tests
General procedure [Corder and Foreman, 2009]
1 State the Null (H0) and Research Hypothesis
2 Set the level of risk α
3 Choose the appropriate test
4 Compute the test statistic
5 Determine the value needed for rejection of the NullHypothesis
6 Compare the obtained value to the critical value
7 Interpret the results
8 Report the results

Statistical Tests
Binomial Test:
• It is an exact two-tailed sign test used with dichotomous data
• It provides statistical significance of the Null Hypothesis thatboth categories are equally likely to occur
• This test was selected by Hoffmann andNebel [Hoffmann and Nebel, 2001] to provide statisticalevidence that their planner, ff, performed significantly betterwith some collections of enhancements than with others
• Use it in ablation studies or to analyze coverage
Statistical Tests
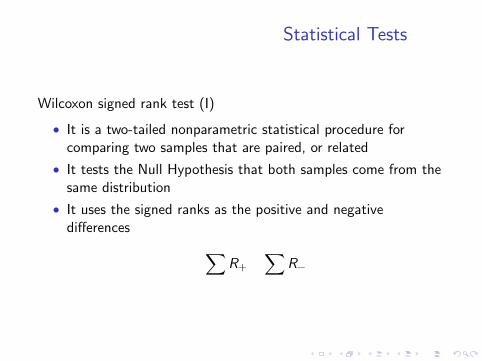
Wilcoxon signed rank test (I)
• It is a two-tailed nonparametric statistical procedure forcomparing two samples that are paired, or related
• It tests the Null Hypothesis that both samples come from thesame distribution
• It uses the signed ranks as the positive and negativedifferences ∑
R+
∑R−
Wilcoxon signed rank test (II)
• It has been already used to compare the performance ofplanners with respect to speed and quality in the analysis ofresults of the third and fifth International Planning Compe-titions [Long and Fox, 2003b, Gerevini et al., 2009]
• Use it to compare the performance of two different plannerswith regard to the same set of planning instances
Statistical Tests
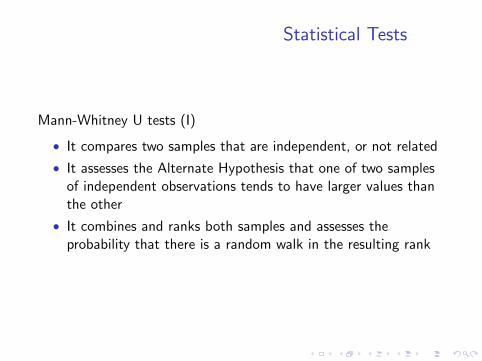
Mann-Whitney U tests (I)
• It compares two samples that are independent, or not related
• It assesses the Alternate Hypothesis that one of two samplesof independent observations tends to have larger values thanthe other
• It combines and ranks both samples and assesses theprobability that there is a random walk in the resulting rank

Statistical Tests
Mann-Whitney U tests (II)
• Use it to compare performance of a planner with regard toproblems in different domains

Statistical Tests
Spearman rank-order correlation coefficient (I)
• It measures the relationship between two variables on anordinal scale of measurement
• It tests the Null Hypothesis that the samples are not correlated
• It uses the following formula in the absence of ties
rs = 1−6∑
D2i
n(n2 − 1)

Statistical Tests
Spearman rank-order correlation coefficient (II)
• or use the following formula in the presence of ties
rs =(n3 − n)− 6
∑D2
i − (Tx + Ty )/2√(n3 − n)2 − (Tx + Ty )(n3 − n) + Tx Ty
• Use it to compare different rankings (e. g., according todifferent metrics)

Outline
1 Planning task
2 Evaluation setup
3 IPC Evaluation
4 Statistical Tests
5 Evaluation reports
6 Homework

Evaluating planners
It’s about understanding the worldNot about “my apple flies faster than yours”
Jorg Hoffmann(ICAPS 2011 Summer School)
We fail more often because we solve the wrong problemthan because we get the wrong solution to the rightproblem
Russell Ackoff

Evaluation reports
Controlling complexity is the essence of computerprogramming
Brian KerniganCreate simple (hopefully beautiful) and easy to understood views
of your data . . .
Simplicity does not precede complexity, but follows it
Alan Perlis. . . it will help you understand the complex
Beauty is the ultimate defense against complexity
David Galernter

Evaluation reports
Sequential Satisficing track: Results
pegsol
scanlz
parcprt
openst
nomys
tidybot
woodw
sokoban
trnsprt
visitall
elevat
parking
barman
flrtile
lama-2011fdss-1fdss-2fd-auto-1roamerfd-auto-2forkuniformprobearvandlama-2008lamarrandwardbrtcbp2daeyahspyahsp2yahsp2-mtcbplprpgpmadag-ppopf2madagcpt4satplm-csharaabiacoplanacoplan2
Evaluation reports
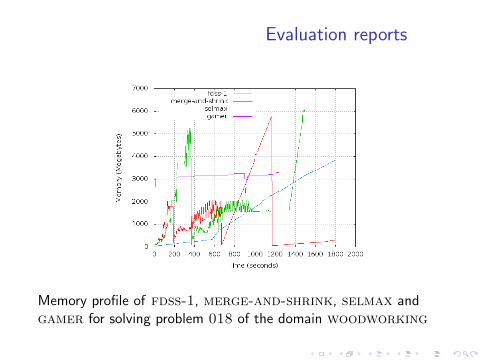
Memory profile of fdss-1, merge-and-shrink, selmax andgamer for solving problem 018 of the domain woodworking

Evaluation reports
Time (in seconds) when each solution file was generated and thevalue of the metric of the plans found by arvandherd andayalsoplan in problem 010 of the domain openstacks of thesequential multi-core track

Evaluation reports
• Failures: time, memory and unexplained
• Performance comparison
• Fixed-time comparisons: total order (ranking) vs. partial order• Comparisons over time: probability distributions and score
landscapes
• Comparing performance improvement

Evaluation reports
• Failures: time, memory and unexplained
• Performance comparison
• Fixed-time comparisons: total order (ranking) vs. partial order• Comparisons over time: probability distributions and score
landscapes
• Comparing performance improvement

Evaluation reports
. . . but the devil is in the details!
Jorg Hoffmann(ICAPS 2011 Summer School)
Beware of the man who won’t be bothered with details
William Feather, Sr.

Evaluation reports
lama-2011 fdss-1 fdss-2 fd-autotune-1 roamer
Score 216.33 202.08 196.00 185.09 181.47Solved 250 232 233 223 213Success ratio 89.28% 82.85% 83.21% 79.64% 76.07%
fd-autotune-2 forkuniform probe arvand lama-2008
Score 178.15 177.91 177.14 165.07 163.33Solved 193 207 233 190 188Success ratio 68.92% 73.92% 83.21% 67.85% 67.14%
lamar randward brt cbp2 dae yahsp
Score 159.20 141.43 116.01 98.34 95.23Solved 195 184 157 135 110Success ratio 69.64% 65.71% 56.07% 42.85% 39.28%
yahsp2 yahsp2-mt cbp lprpgp madagascar-p
Score 94.97 90.95 85.43 67.07 65.93
Solved 138 132 123 118 88
Success ratio 49.28% 47.14% 43.92% 42.14% 31.42%
popf2 madagascar cpt4 satplanlm-c sharaabi
Score 59.88 51.98 47.85 29.96 20.52
Solved 81 67 52 32 33
Success ratio 28.92% 23.92% 18.57% 11.42% 11.78%
. . .

Evaluation reports
What happened to Mp? (I)
domain oknumsolved numtimefails nummemfails numunexfails
barman 0 20 0 0
elevators 0 0 0 2
floortile 0 0 0 20nomystery 15 1 0 4
openstacks 0 10 0 10parcprinter 20 0 0 0
parking 0 20 0 0pegsol 20 0 0 0
scanalyzer 18 0 0 2
sokoban 2 18 0 0tidybot 10 2 0 8
transport 2 11 2 5visitall 0 20 0 0
woodworking 1 0 0 0

Evaluation reports
What happened to Mp? (& II)
domain numsolved oknumsolved numtimefails nummemfails numunexfails
barman 0 0 20 0 0
elevators 18 0 0 0 2
floortile 0 0 0 0 20
nomystery 15 15 1 0 4openstacks 0 0 10 0 10parcprinter 20 20 0 0 0
parking 0 0 20 0 0pegsol 20 20 0 0 0
scanalyzer 18 18 0 0 2sokoban 2 2 18 0 0tidybot 10 10 2 0 8
transport 2 2 11 2 5visitall 0 0 20 0 0
woodworking 20 1 0 0 0

Evaluation reports
There was a bug!
Domain M Mp
barman 0 / 0 0 / 0
elevators 1 / 0 19 / 0
floortile 20 / 0 20 / 0nomystery 15 /17 15 /15
openstacks 0 / 0 0 / 0parcprinter 20 /20 20 /20
parking 0 / 0 0 / 0pegsol 17 /17 20 /20
scanalyzer 12 /11 18 /18
sokoban 0 / 0 2 / 2tidybot 0 / 1 12 /10
transport 0 / 0 2 / 2visitall 0 / 0 0 / 0
woodworking 20 / 1 20 / 1
Total 105/67 148/88

Evaluation reports
• Failures: time, memory and unexplained
• Performance comparison
• Fixed-time comparisons: total order (ranking) vs. partial order• Comparisons over time: probability distributions and score
landscapes
• Comparing performance improvement

Evaluation reports
lama-2011 fdss-1 fdss-2 fd-autotune-1 roamer
Score 216.33 202.08 196.00 185.09 181.47
Solved 250 232 233 223 213
Success ratio 89.28% 82.85% 83.21% 79.64% 76.07%
fd-autotune-2 forkuniform probe arvand lama-2008
Score 178.15 177.91 177.14 165.07 163.33
Solved 193 207 233 190 188
Success ratio 68.92% 73.92% 83.21% 67.85% 67.14%
. . .

Evaluation reports
lama-2011 fdss-1 fdss-2 fd-autotune-1 roamer
Score 216.33 202.08 196.00 185.09 181.47
Coverage 250 232 233 223 213
Time 155.27 99.63 137.26 129.59 118.81
QT 207.98 163.73 180.79 172.65 170.38
fd-autotune-2 forkuniform probe arvand lama-2008
Score 178.15 177.91 177.14 165.07 163.33
Coverage 193 207 233 190 188
Time 103.84 113.67 154.74 77.46 101.76
QT 151.96 158.11 185.35 137.74 151.98
. . .

Evaluation reports
• Be concise!
• Formulate a hypothesis:
H0: Score is correlated with the other metrics
• and choose a confidence level:
α = 0.999
• In this case, the Spearman rank-order correlation coefficient rs
will test this hypothesis —without assuming any underlyingdistribution

Evaluation reports
Coverage Time QT
Score 0.9740.000
0.8930.000
0.9690.000
Coverage 0.9450.000
0.9920.000
Time 0.9560.000
The Spearman rank-order correlation coefficient rs is shown aboveand the two-tailed significance p is shown below.
The hypothesis is accepted!

Evaluation reports
arvandherd ayalsoplan phsff roamer-p yahsp2-mt
Score 227.07 159.95 130.59 129.06 118.58
Solved 236 184 163 140 153
Success ratio 84.28% 65.71% 58.21% 50.0% 54.64%
madagascar-p madagascar acoplan
Score 66.44 52.00 17.62Solved 88 67 18Success ratio 31.42% 23.92% 6.42%
Official results of the IPC 2011 sequential multi-core track
Evaluation reports
Loot at raw data! Not only at summaries!
Jorg Hoffmann(ICAPS 2011 Summer School)
Be aware there might be automated means to do it!
The enjoyment of one’s tools is an essential ingredient ofsuccessful work
Donald E. Knuth

Evaluation reports
Partial order of theperformance of planners in thesequential multi-core track interms of successfully solvedproblems according to theBinomial test with p = 0.5.The statistical significance is99.9%

Evaluation reports
Partial order of theperformance of planners inthe sequential multi-coretrack in terms of qualityaccording to the Wilcoxonsigned-rank test.The statistical significance is99.9%

Evaluation reports
• Failures: time, memory and unexplained
• Performance comparison
• Fixed-time comparisons: total order (ranking) vs. partial order• Comparisons over time: probability distributions and score
landscapes
• Comparing performance improvement

Evaluation reports
A PhD student (you!) and your PhD advisor are having adiscussion about two algorithms:
- I used 61 problems from the Blocksworld domain. The firstalgorithm solves 51 problems and the second one solves 58. Soit seems that the second algorithm is better
- Better for what?- Well, I was assuming coverage- Hmmm, . . . , that’s unclear but what about time?- Oh, no prob, I also realized that the second algorithm is faster- Really?- Well ...

Evaluation reports
Cut-offs (such as time) may bias the sample!
Jorg Hoffmann(ICAPS 2011 Summer School)

Evaluation reports
Definition
Consider a heuristic algorithm A for solving a finite and known setof problems in the planning domain D, and let P(RT A,D ≤ t)denote the probability that A finds a solution for one of theseinstances in time less or equal than t. The Run-Time Distribution(or RTD, for short) of A on D is the probability distribution of therandom variable RT A,D, which is characterized by the Run-TimeDistribution function rtd : R+ 7→ [0, 1] defined asrtd(t) = P(RT A,D ≤ t)
Used since 2005 but very scarcely [Haslum et al., 2005]

Evaluation reports
So it seems that belowt = 0.2 seconds, EHC issignificantly more effectiveand though EKBFS (5) isbetter in the long-term, theyare more or less equivalentagain around t = 10Clearly, EKBFS (5) has betteroverall coverage than EHC

Evaluation reports
Evolution of the metric quality over time for the first six plannersof the sequential satisficing track of the seventh InternationalPlanning Competition

Evaluation reports
• Failures: time, memory and unexplained
• Performance comparison
• Fixed-time comparisons: total order (ranking) vs. partial order• Comparisons over time: probability distributions and score
landscapes
• Comparing performance improvement

Evaluation reports
Planner Base performance DSK performance
A 10 15B 5 10
Delta performance = (DSK performance − Base performance) isclearly insufficient
Branching is easy. Merging is hard
Eric Sink

Evaluation reports
Comparing performance improvement
• There are cases where one is interested in two- (or multi-)variate analysis
• This need arises often in the learning and multi-core tracks,but also in others
• It is relevant, for example, to consider representational issuessuch as the impact of macro-actions and entanglements
One alternative are ablation studies (see Joerg Hoffman,Evaluating planning algorithms)

Evaluation reports
Definition
qt computes for each planner and task a tuple (Q,T ) where Qstands for the quality of the best solution found by the sameplanner and T is the time it took for the planner to find it. Next,it awards each planner with a score that equals the number oftuples it pareto-dominates
Definition
(Q,T ) is said to pareto-dominate (Q ′,T ′) if and only if Q ≤ Q ′
and T ≤ T ′

Evaluation reports
planner pegsol crwpln prking opstcks elvtrs flrtle matchc skban storage prcprnt t&o tms total
dae yahsp 19.67 19.95 18.92 20.00 14.46 7.96 0.00 4.55 17.06 3.58 0.00 0.00 126.16yahsp2-mt 17.77 15.93 15.44 12.18 11.73 9.54 0.00 11.83 8.86 7.85 0.00 0.00 111.14popf2 18.61 20.00 17.98 15.19 2.20 0.00 19.99 2.63 0.00 0.00 9.00 5.00 110.60yahsp2 16.96 15.97 13.44 12.74 11.35 7.78 0.00 11.14 2.74 6.85 0.00 0.00 98.97
total 111.63 78.85 65.79 60.11 47.48 44.03 34.99 30.15 28.66 23.29 19.07 5.00 Quality
planner pegsol crwpln prking opstcks elvtrs flrtle matchc skban storage prcprnt t&o tms total
yahsp2-mt 16.63 18.43 19.00 19.00 18.61 11.95 0.00 11.00 12.00 8.00 0.00 0.00 134.62yahsp2 15.97 18.27 20.00 17.44 18.42 9.78 0.00 4.50 10.43 7.00 0.00 0.00 121.80dae yahsp 17.17 19.03 19.80 16.84 13.87 8.33 0.00 17.93 4.07 3.86 0.00 0.00 120.89popf2 16.42 19.60 19.80 17.78 2.60 0.00 20.00 0.00 1.98 0.00 9.00 5.00 112.17
total 100.48 82.13 78.60 71.06 61.64 49.15 35.00 33.43 28.48 23.86 20.71 5.00 QT
planner pegsol crwpln prking opstcks elvtrs flrtle matchc skban storage prcprnt t&o tms total
yahsp2-mt 19.68 20.00 19.00 18.85 15.69 12.17 10.83 0.00 12.00 8.00 0.00 0.00 136.23yahsp2 20.00 18.35 20.00 18.99 18.70 9.62 4.32 0.00 7.72 7.00 0.00 0.00 124.69popf2 16.35 15.43 11.36 9.24 1.26 0.00 0.00 20.00 1.67 0.00 9.00 5.00 89.31dae yahsp 17.80 15.49 5.19 5.90 4.66 4.07 13.64 0.00 2.21 2.70 0.00 0.00 71.65
total 107.19 75.76 55.56 52.98 43.56 43.11 28.79 27.16 23.60 21.95 16.85 5.00 Time

Evaluation reports · Summary
• Analyze source of failures
• Look at your data, identify the right problem
• Make a hypothesis (as a positive statement)
• Use one in your toolbox: Identify a suitable report
• Use summaries, but dig also into raw data
• Does it solve your question? If not, start again
• If yes, do the answer post additional questions? If yes, startagain
• If not, start again anyway!

Evaluation reports · Summary
To err is human, but to really foul things up you need acomputer
Paul Ehrlich
. . . and also the other way round!
Computer science is no more about computers thanastronomy is about telescopes
Edsger W. Dijkstra
Do good implementations, but get rid of improving your resultswith technical tricks

Evaluation reports · Summary
In general you [become successful] not by knowing whatthe experts know but by learning what they think isbeneath them
George Gilder
Imitate others but do not do the same thing!Remember, it is about understanding the world!

Evaluation reports · Summary
Somewhere, something incredible is waiting to be known
Carl SaganOverall, be curious!

Outline
1 Planning task
2 Evaluation setup
3 IPC Evaluation
4 Statistical Tests
5 Evaluation reports
6 Homework

Homework
Questions
1 (seq-opt) Report the number of memory, time andunexplained failures of every entrant
2 (tempo-sat) How many problems were solved by yahsp2 andhow many were valid? Show the results per domain
3 (seq-sat) How long did it take fdss-1 to find the first and lastsolution in each problem of the domain transport?
4 (seq-opt) Show the final score of every entrant according tothe official metric of the IPC 2011
5 (seq-mco) Show the progress of coverage for the plannersarvandherd and ayalsoplan
Homework
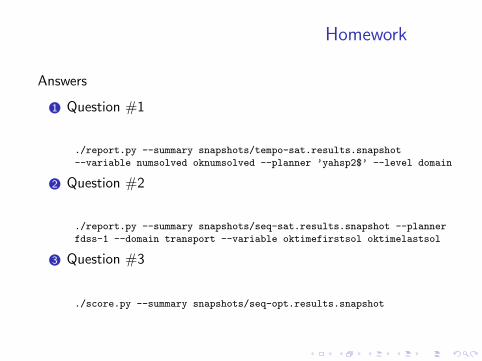
Answers
1 Question #1
./report.py --summary snapshots/tempo-sat.results.snapshot
--variable numsolved oknumsolved --planner ’yahsp2$’ --level domain
2 Question #2
./report.py --summary snapshots/seq-sat.results.snapshot --planner
fdss-1 --domain transport --variable oktimefirstsol oktimelastsol
3 Question #3
./score.py --summary snapshots/seq-opt.results.snapshot

Homework
Challenges
1 (tempo-sat) Which planner (among those solving at least 1problem) show the highest ratio of invalid plan solution files?What domains were harder for that planner?
2 (seq-mco) In what domain do arvandherd achieves fullcoverage faster?
3 (seq-sat) Create a figure that shows the difference betweenthe best and worst plan quality found by fdss-2 as a functionof the time to find them in domain openstacks
4 (tempo-sat) Show the progress of plan cost and plan length ofall the solutions found by yahsp2-mt in problem 003 ofdomain crewplanning
5 (seq-opt) Compare the results of a statistical test on planquality with α = 0.005 and α = 0.001

Bibliography I
Bacchus, F. (2001).AIPS 2000 planning competition: The fifth international conference on artificialintelligence planning and scheduling systems.AI Magazine, 22(3):47–56.
Brafman, R. I. and Domshlak, C. (2013).On the complexity of planning for agent teams and its implications for singleagent planning.Artif. Intell., 198:52–71.
Corder, G. W. and Foreman, D. I. (2009).Nonparametric Statistics for Non-Statisticians.John Wiley & Sons, New Jersey, United States.
Cushing, W., Kambhampati, S., Mausam, and Weld, D. S. (2007).When is temporal planning really temporal?In Proceedings of the 20th international joint conference on Artifical intelligence,IJCAI’07, pages 1852–1859.
Edelkamp, S., Jabbar, S., and Bonet, B. (2007).External memory value iteration.In Proceedings of the Seventeenth International Conference on AutomatedPlanning and Scheduling, ICAPS 2007, pages 128–135.

Bibliography II
Fox, M., Gerevini, A., Long, D., and Serina, I. (2006).Plan stability: Replanning versus plan repair.In In Proc. ICAPS, pages 212–221. AAAI Press.
Gerevini, A. E., Haslum, P., Long, D., Saetti, A., and Dimopoulos, Y. (2009).Deterministic planning in the fifth international planning competition: PDDL3and experimental evaluation of the planners.Artificial Intelligence, 173(5-6):619–668.
Haslum, P. (2012).Narrative planning: Compilations to classical planning.J. Artif. Intell. Res. (JAIR), 44:383–395.
Haslum, P., Bonet, B., and Geffner, H. (2005).New admissible heuristics for domain-independent planning.In Proceedings of the Twentieth National Conference on Artificial Intelligence(AAAI-05), pages 1163–1168, Pittsburgh, United States.
Hoffmann, J. (2005).Where ”ignoring delete lists” works: Local search topology in planningbenchmarks.Journal of Artificial Intelligence Research, 24:685–758.

Bibliography III
Hoffmann, J. (2011).Evaluating planning algorithms, or: How to count sheep?ACAI Summer School on Automated Planning and Scheduling, ICAPS 2011.
Hoffmann, J. and Edelkamp, S. (2005).The deterministic part of IPC-4: An overview.J. Artif. Intell. Res. (JAIR), 24:519–579.
Hoffmann, J. and Nebel, B. (2001).The FF planning system: Fast plan generation through heuristic search.Journal of Artificial Intelligence Research, 14:253–302.
Howe, A. E. and Dahlman, E. (2002).A critical assessment of benchmark comparison in planning.J. Artif. Intell. Res. (JAIR), 17:1–3.
Howey, R., Long, D., and Fox, M. (2004).VAL: Automatic plan validation, continuous effects and mixed initiative planningusing PDDL.In The Sixteenth IEEE International Conference on Tools with ArtificialIntelligence (ICTAI-2004), pages 294–301, Boca Raton, Florida, United States.

Bibliography IV
Kambhampati, S. (2011).Back to the future of planning.ACAI Summer School on Automated Planning and Scheduling, ICAPS 2011.
Keyder, E. and Geffner, H. (2009).Soft goals can be compiled away.Journal of Artificial Intelligence Research, 36:547–556.
Linares, C., Jimnez, S., and Helmert, M. (2013).Automating the evaluation of planning systems.AI Communications.
Linares Lopez, C., Jimenez, S., and Helmert, M. (2013).Automating the evaluation of planning systems.AI Communications.
Long, D. and Fox, M. (2003a).The 3rd international planning competition: Results and analysis.J. Artif. Intell. Res. (JAIR), 20:1–59.
Long, D. and Fox, M. (2003b).The 3rd international planning competition: Results and analysis.Journal of Artificial Intelligence Research, 20:1–59.

Bibliography V
Nebel, B. (2000).Logic-based artificial intelligence.chapter On the expressive power of planning formalisms, pages 469–488.
Nguyen, H.-K., Tran, D.-V., Son, T. C., and Pontelli, E. (2012a).On computing conformant plans using classical planners: Agenerate-and-complete approach.pages 190–198, Sao Paulo, Brazil. AAAI.
Nguyen, T. A., Do, M. B., Gerevini, A., Serina, I., Srivastava, B., andKambhampati, S. (2012b).Generating diverse plans to handle unknown and partially known userpreferences.Artif. Intell., 190:1–31.
Nguyen, X. and Kambhampati, S. (2001).Reviving partial order planning.In International Joint Conference on Artificial Intelligence, pages 459–466.
Palacios, H. and Geffner, H. (2009).Compiling uncertainty away in conformant planning problems with boundedwidth.J. Artif. Intell. Res. (JAIR), 35:623–675.

Bibliography VI
Sulewski, D., Edelkamp, S., and Kissmann, P. (2011).Exploiting the computational power of the graphics card: Optimal state spaceplanning on the GPU.pages 242–249, Freiburg, Germany.