harris county mental health jail diversion program - … county mental health jail diversion program...
TRANSCRIPT

Harris County
Mental Health Jail Diversion Program
Outcomes Report on the Homeless Population
August 23, 2017

1
ACKNOWLEDGEMENTS
The outcomes report was prepared by Nancy Carrasco, Program Analyst for the Mental Health Jail
Diversion Program (MHJDP), who was responsible for the collection of the data and information
about the program and sample population. Meghan Lyons, Grant Budget Manager for the MHJDP,
provided the program costs associated with housing assistance.
A special thanks to Scott Hickey, Ph.D., Director of Outcomes Management for the Harris Center,
and Juan Castaneda, 1185 Outcomes Analyst for the Harris Center, for their contributions in preparing
the draft outcomes report. Additional assistance provided by Dorothy Morgan, Ph.D., contractor and
member of the evaluation team, who contributed to the final revisions of the statistical analyses and
respective summaries and appendices.

2
ABOUT THE PROGRAM
The Mental Health Jail Diversion Program (MHJDP) is a collaborative service model for health and human services and criminal justice that incorporates integrated health and behavioral health, housing, treatment of co-occurring disorders, and criminogenic risk. It applies the principles of Critical Time Intervention (CTI), an evidence-based practice of intensive case management. This time-limited approach supports continuity of care and community integration for individuals with co-occurring disorders, homelessness, and criminal justice involvement. Services include: 1) intensive clinical case management with low caseloads; 2) multilevel residential services which include group homes, 24-hour supervised congregate care and extended stay hotels; 3) integrated health which includes the coordination of services between behavioral health and medical providers, mental health, and substance use services which can be obtained through inpatient hospitalization, group homes and intensive outpatient treatment; 4) benefits acquisition utilizing SOAR which includes assistance with applications for Medicaid, SSI and SSDI; 5) rehabilitation services which involve skills training for independent living, employment, substance use/mental health recovery and criminogenic risk; 6) peer support provided by individuals with criminal justice lived experience and substance/mental health recovery; and 7) basic needs assistance.
The service approach applies CTI principles and gives participants access to the above mentioned services during the first weeks following release from jail or program enrollment. As participants improve, they step-down from intensive case management to lower levels of care. A Housing First approach is used for individuals that meet the Housing and Urban Development (HUD) criteria1 for Permanent Supportive Housing (PSH). PSH is an evidence-based practice used to help individuals with disabilities find permanent housing options to facilitate independent living and obligations to tenancy, such as paying rent. A component of the practice is linking people to long-term health care, mental health and/or substance use treatment options that will facilitate retention of an independent living structure. The MHJDP has contracts with temporary housing and substance use treatment providers. Temporary and emergency housing assistance is offered through group homes, residential programs and extended stay hotels. Residential and day treatment programs are available for participants with co-occurring disorders. Enrolled participants can be referred from the jail or from the community. Service providers help determine which program is most appropriate based on client choice and clinical need. To ensure continuity of care, they remain in contact with participants throughout the housing and treatment processes.
The Harris Center was contracted to serve as the primary provider of mental health services. The Harris Center is the local mental health and intellectual/developmental disability authority for Harris County. Psychiatric services such as medication management and psychiatric consultation are provided through adult mental health clinics. The Harris Center is responsible for the Jail-Based, Community-Based, and CTI Teams. All teams are comprised of a Clinical Team Leader (CTL), Licensed Practitioners of the Healing Arts (LPHAs), Licensed Chemical Dependency Counselors (LCDCs), Case Managers, and Peer Support Specialists. The Jail Team provides screening and assessment services as well as specialized interventions, including co-occurring disorders treatment, group and individual therapy, evidence-based interventions for criminogenic risk factors, as well as intensive case management and peer support services.
1 HUD criteria for chronic homelessness includes four or more episodes of homelessness within the past three years or one or more current consecutive years of homelessness. In addition, the individual must have a disabling condition which makes daily activities difficult (e.g., medical, psychological, substance use) and prevents them from holding a job.
3
The CTI Team implements the CTI model with fidelity. The Community Team provides intensive services in various geographic areas and community locations in Harris County. Both community teams provide the same services as the Jail Team with the addition of benefits acquisition provided by Consumer Benefits Case Managers trained in SSI/SSDI Outreach, Access, and Recovery (SOAR), and transportation and medication management services provided by Psychiatric Technicians.
Healthcare for the Homeless-Houston (HHH) is the subcontractor to the Harris Center in conjunction with SEARCH Homeless Services and is responsible for the PSH team. HHH provides medical and dental care, case management, and substance use counseling for individuals who are homeless. Primary care and behavioral health services are provided by a team comprised of a Family Medicine Physician, Telepsychiatry, and a Registered Nurse, with support from a Medical Case Manager. Other key staff include a data entry clerk, Community Health Workers, and an onsite Registered Nurse.
SEARCH is a local provider who works to engage, stabilize, educate, employ and house individuals who are homeless. They also provide behavioral health services to this population. The PSH component is comprised of two teams which consist of a Team Leader and Case Managers. One team is supported by a Peer Recovery Support Specialist.
Individuals can be screened, assessed, and enrolled by one of the three Harris Center teams as well as the HHH/SEARCH PSH Team. Individuals are then assigned to one of the following community treatment teams based on the criteria below:
1) PSH Team: Individuals who meet the HUD criteria, obtain mandated records and documentation, are approved by the apartment complex, and are deemed ready for independent living;
2) CTI Team: Individuals who have a TRAS2 score of 25+ and/or are identified as chronically homeless but ineligible for PSH or are literally homeless; and
3) Community Team: Individuals who do not meet the criteria for the CTI or PSH Teams.
INTRODUCTION
The Corporation for Supportive Housing (CSH) asked the County Judge’s Office (CJO) to analyze criminal justice outcomes and housing costs for homeless participants in the MHJDP. The key questions for this analysis are as follows:
1. Are there significant differences in criminal justice recidivism for chronically homeless participants who received PSH, chronically homeless participants who did not receive PSH, and literally homeless participants?
2. What are the housing costs associated with each type of homeless participant?
SAMPLE POPULATION
Admission criteria for enrollment in the MHJDP includes: 1) a history of 3 or more bookings in the previous 2 years; 2) diagnosis of schizophrenia, bipolar disorder, major depression, or post-traumatic stress disorder; 3) moderate (16-23) to high (24+) TRAS score; and 4) absence of exclusionary
2 The Texas Risk Assessment System (TRAS) was developed by the University of Cincinnati and is a validated tool for assessing criminogenic risk the likelihood of future crimes by adult offenders. It is utilized statewide by the Community Supervision and Corrections Department.
4
offenses such as a history of homicide, arson, and manufacturing/delivery of methamphetamine, current felony DWI, sex offenses (evaluated on case by case basis depending on severity of offense), or registered sex offenders. In order to provide an evaluation of participant outcomes for this project, we selected participants who met the following criteria: 1) Enrolled in the program prior to June 1, 2016, and 2) Identified as being homeless at the time of enrollment or during the enrollment period. Re-enrolled clients were excluded to avoid having to account for breaks in service. Total enrollments numbered 443. Two PSH clients who were in the program during the specified timeframe have been since deceased thus not included in the evaluation. The sample size numbered 319 (72.3%) of which 202 (63%) clients were assigned to the Harris Center teams and 117 (37%) to the HHH/SEARCH PSH Team. All clients identified as chronically homeless have been on the PSH caseload at one time; however, some may have transferred to the Harris Center later if they were denied by the PSH housing provider upon re-booking. Of the sample population, 92 (29%) were chronically homeless with PSH, 25 (8%) were chronically homeless without PSH, and 202 (63%) were literally homeless. About 212 (66%) received some form of housing assistance (i.e., PSH, emergency, or temporary housing), while 107 (34%) did not receive housing.
METHODOLOGY
To compare criminal justice recidivism for homeless program participants, we analyzed the following
metrics:
Average number of bookings and total jail days
1 year prior to enrollment
During enrollment (or treatment)
1 year after treatment
Average number of misdemeanors and felonies
1 year prior to enrollment
During enrollment
1 year after treatment
Types of offenses
1 year prior to enrollment
During enrollment
1 year after treatment
The treatment period is the time from when an individual is enrolled in the program to the point of discharge, or as of May 31, 2017, if currently enrolled. There is an undetermined amount of time a person is enrolled in the program before entering PSH, however, that person can receive services in the interim by one of the three community treatment teams, as well as the jail team, if enrolled while incarcerated. The majority of PSH clients have been served by the Harris Center prior to transferring to the PSH Team. Table 1 outlines the length of time in the program for each population group.

5
Table 1. Length of Stay in Program by Homeless Population
Length of Stay in Program
Population Min Days Average Days Max Days
Chronic Homeless - PSH 75 573 944
Chronic Homeless - No PSH 5 230 907
Literally Homeless 2 280 884
Total 2 360 944
The bookings data was extracted on August 4, 2017. Length of stay for calculating jail days for clients currently in jail run through August 1, 2017. For the following analyses, bookings were observed 365 days prior to the enrollment date for the pre-enrollment period and 365 days after the treatment period for the post-treatment period; the total number of bookings was calculated for each client across all time periods. Total jail days was calculated for each booking then summed for each client across all time periods. For example, if John Smith was in jail three times before enrollment and spent 2 days in jail each time, that is 6 total jail days. So "average total jail days" is the average of this number across all participants.
Length of stay for calculating housing days for clients currently in housing (any type) run through May
31, 2017. To understand housing costs, we examined the following metrics:
Total and average number of days in Housing associated with each type of housing assistance (i.e., PSH, emergency housing, and temporary housing) and homeless population
Total and average number of days for overall housing assistance Analysis for this report was prepared using Excel and R’s (3.3.1, R Core Team, 2016) dplyr package for data munging, R’s lme4 package for mixed effects modeling, and ggplot2 package for data visualization Table summaries were imported into Microsoft® Excel to construct visualizations. Proportions and group categorical differences were statistically analyzed with Pearson’s chi-square approach. Changes across time were tested using paired t-tests and mixed-effects linear modeling.
RESULTS
RECIDIVISM (FOR CHRONIC AND LITERAL HOMELESS CLIENT POPULATIONS)
Overall, there were statistically significant reductions in bookings and jail days for all homeless groups. On average, there was a reduction of 1.6 bookings (t=16.3, p < 0.001) and 83 jail days (t=15.4, p < 0.001) between one-year pre-enrollment and one-year post-treatment periods. Table 2 summarizes these improvements by homeless group and housing assistance.
For chronically homeless individuals with PSH, the average number of bookings dropped from 2 at 1 year pre-enrollment to almost 0 at 1 year post-treatment. For chronically homeless individuals without PSH, those without housing assistance experienced a reduction from 3 to 2 bookings, while those with housing assistance experienced a greater reduction from 3 to 1 booking. For literally homeless individuals, those with and without housing assistance experienced a reduction from 2 to 1 booking.
For chronically homeless individuals with PSH, the average number of total jail days dropped from about 83 days at 1 year pre-enrollment to 4 days at 1 year post-treatment. For chronically homeless individuals without PSH, those without housing assistance experienced a reduction from 121 to 103 average total jail days, while those with housing assistance experienced a much greater reduction from

6
136 to 43 days. For literally homeless individuals, those without housing assistance experienced a reduction from 122 to 29 average total jail days, while those with housing assistance experienced a reduction from 126 to 42 days.
Table 2. Average Number of Bookings and Jail Days by Housing Assistance and Homeless Population
No Housing Assistance Housing Assistance Provided
Population Pre Enrollment During Treatment Post Treatment Pre Enrollment During Treatment Post Treatment
Chronic Homeless - PSH
Bookings - - - 2.2 1.5 0.3
Jail Days - - - 82.7 74.3 4.0
Chronic Homeless – No PSH
Bookings 2.8 0.8 2.3 3.2 2.2 1.3
Jail Days 121.2 60.6 103.2 135.7 93.8 43.4
Literally Homeless
Bookings 2.4 0.7 0.8 2.4 1.4 0.9
Jail Days 122.2 46.6 28.7 126.4 89.9 42.1
All groups experienced statistically significant decreases in the average number of bookings and total jail days over time. However, the differences between groups was not significant. Detailed results from mixed models for bookings and jail days can be found in Appendix C.
There were differences between the trajectory of change in the average number of bookings and jail days by housing assistance provision (Figures 1 and 2). For individuals that did not receive housing assistance, bookings and jail days generally increased again after treatment but stayed under pre-enrollment levels. While this apparent interaction between housing assistance and time is not statistically significant, it may be substantively significant enough to monitor as the program continues.
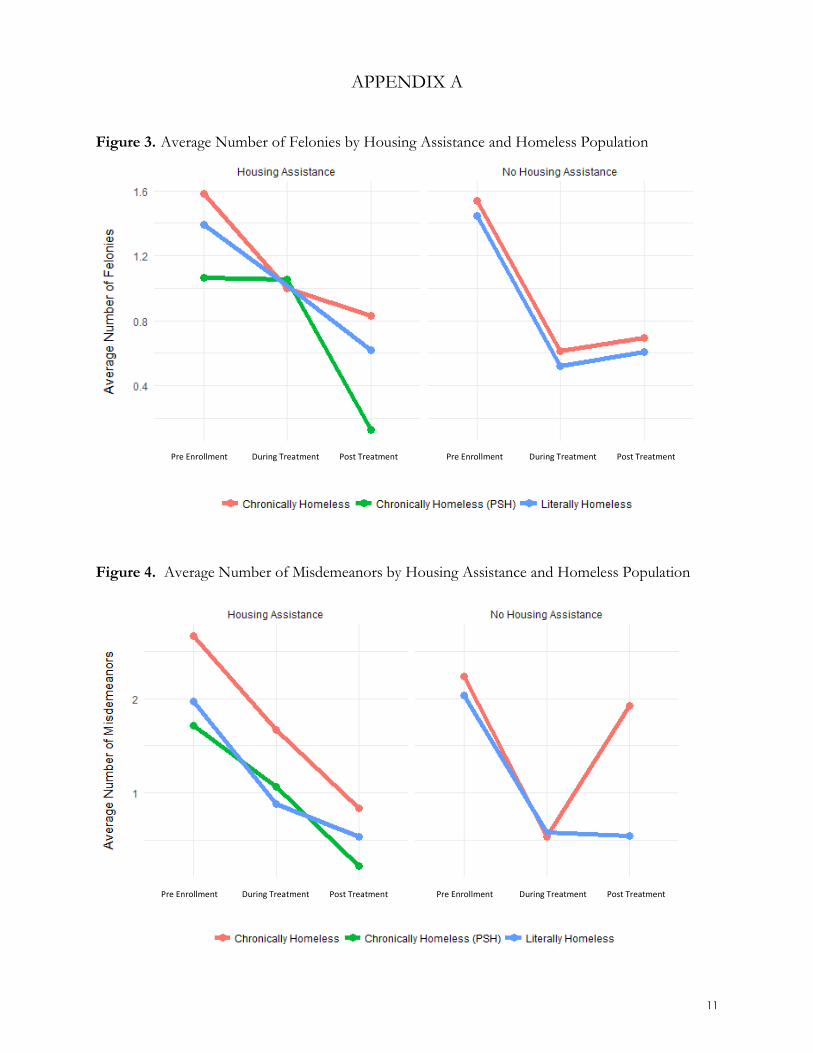
Table 3 provides a summary of the average number of bookings by severity type across populations in the study and housing assistance provision. Overall, the average number of misdemeanors dropped by 1.4 charges (t=11.1, p<0.001) between the pre-enrollment and post-treatment periods, while the average number of felonies dropped by 0.8 (t=10.9, p<0.001). These reductions over time are statistically significant at the 0.01 level. Figures for both misdemeanors and felonies can be found in Appendix A.
Table 3. Average Number of Felonies and Misdemeanors by Housing Assistance and Homeless Population
No Housing Assistance Housing Assistance Provided
Population Pre Enrollment During Treatment Post Treatment Pre Enrollment During Treatment Post Treatment
Chronic Homeless - PSH
Felonies - - - 1.1 1.1 0.1
Misdemeanors - - - 1.7 1.1 0.2
Chronic Homeless – No PSH
Felonies 1.5 0.6 0.7 1.6 1.0 0.8
Misdemeanors 2.2 0.5 1.9 2.7 1.7 0.8
Literally Homeless
Felonies 1.4 0.5 0.6 1.4 1.0 0.6
Misdemeanors 2.0 0.6 0.5 2.0 0.9 0.5

7
Figure 1. Average Number of Bookings, by Population Type and Housing Assistance
Figure 2. Average Number of Total Jail Days, by Population Type and Housing Assistance
Table 4 provides a summary of the most frequent offenses by major category. The top five offenses for the sample were Trespassing, Theft, Drug Possession, Assault, and Prostitution. Bookings for these offenses for all three populations were reduced during the treatment and post-treatment periods with the exception of chronic homeless individuals without PSH who experienced an increase in Trespassing offenses following treatment. Other key observations include an increase in bookings of Driving While Intoxicated (DWI) offenses during the treatment period for chronic homeless individuals with PSH and the literally homeless.
Pre Enrollment During Treatment Post Treatment Pre Enrollment During Treatment Post Treatment
Pre Enrollment During Treatment Post Treatment Pre Enrollment During Treatment Post Treatment

8
Additional offenses that increased for chronic homeless individuals with PSH were Robbery, Tampering W/Evidence, Solicitation, Unauth Use of Vehicle and Weapons Possession. The literally homeless experienced an increase in Forgery/Fraud and Man/Del CS offenses. For chronic homeless individuals without PSH, increases in offenses by major category were only observed following the treatment period. Parole Violations decreased during the treatment period for both chronic homeless individuals with PSH and the literally homeless; however, began to increase during the post-treatment period but still below pre-treatment levels. Overall, the literally homeless population had more variation in the type of offenses, which included Murder, Sexual Assault, and Unauthorized Signage, all of which were not included in the booking histories of the chronic homeless populations. See Appendix B for a list of all offenses by period and homeless population type. Table 4. Offenses by Major Category, Time Period and Homeless Population Type
Chronic Homeless
With PSH Chronic Homeless
No PSH Literally Homeless
OFFENSE CATEGORY Pre- During Post- Pre- During Post- Pre- During Post-
ASSAULT 14 25 0 11 5 5 70 15 10
BURGLARY 11 8 0 1 1 0 16 4 8
CRIMINAL MISCHIEF 2 2 0 3 4 4 15 7 3
DRUG POSSESSION 32 27 4 16 5 4 114 52 36
DWI 0 5 0 1 0 0 1 3 2
EVADING ARREST/DETENTION
6 3 2 2 0 1 20 7 11
FAILURE TO PROVDIE ID 3 2 0 0 0 0 7 1 2
FORGERY/FRAUD 3 3 1 0 0 1 4 8 4
HARASSMENT 2 1 0 3 3 1 7 6 3
INDECENT EXPOSURE 0 0 0 0 2 0 6 4 0
INTERFERE DUTIES PUB SERVANT
2 0 0 0 0 1 3 4 3
MAN/DEL CS 2 3 1 0 0 2 5 7 6
PAROLE VIOLATION 20 2 3 0 0 0 8 3 5
PROSTITUTION 17 4 2 5 0 3 40 25 12
PUBLIC INTOXICATION 3 0 1 0 0 0 11 1 4
RESISTING ARREST/SEARCH
5 5 0 2 0 0 10 4 2
RETALIATION 4 2 0 0 0 0 8 1 6
ROBBERY 1 3 0 1 0 1 7 4 8
SOLICIT EMPL/BUS FM OCCU/VEH
0 4 0 0 0 0 4 4 0
TAMPERING W/EVIDENCE 1 5 0 0 0 0 1 1 2
TERRORISTIC THREAT 5 2 1 1 0 0 3 1 3
THEFT 44 23 5 17 9 4 114 54 30
TRAFFIC VIOLATION 11 5 3 5 0 3 48 14 13
TRESPASSING 61 41 8 27 18 21 118 54 42
UNAUTH USE OF VEHICLE 0 4 0 0 0 0 4 4 5
WEAPONS POSSESSION 1 4 0 0 0 1 2 1 2
HOUSING ASSISTANCE
The MHJDP provides two types of housing assistance for up to 90 days (or more under special circumstances): Emergency Housing and Temporary Housing. Emergency Housing is a type of housing classification used by the MHJDP to help identify clients on the HHH/SEARCH caseload or those who are being considered for PSH services. Individuals who have been approved for PSH

9
and/or are undergoing the PSH eligibility process if released from jail prior to approval will be placed in Emergency Housing prior to PSH move-in. The HHH/SEARCH PSH Team works with participants on obtaining proper documentation to complete the required housing applications for Permanent Supportive Housing as well as applications for government benefits. Temporary Housing is the housing classification used to identify clients on the Harris Center caseload and is available to participants who need to apply for government benefits and/or find employment so that stable housing can be secured (e.g., an apartment). Table 5 provides a summary of the average and total cost of housing assistance types for each homeless population type, as well as the average number of days utilized for each housing type across homeless populations. Chronically homeless individuals with PSH used the most housing assistance, based on the total and average number of housing days (i.e., 40,685 total and 443 average days), followed by literally homeless individuals (i.e., 4,918 total and 46 average days) and chronically homeless individuals without PSH (i.e., 371 total and 31 average days).
Literally homeless individuals did not use any PSH, and their overall average of housing assistance days was fewer than the chronically homeless with PSH group but greater than the chronically homeless without PSH group. Chronically homeless individuals without PSH used less temporary housing time (days) compared with the other two groups.
Table 5. Total and Average Number of Days and Cost by Housing Type and Population
Housing Type Chronically Homeless - PSH Chronically Homeless – No PSH Literally Homeless
Total Average Total Average Total Average Emergency Housing Days 4,374 50 292 30 469 40 Emergency Housing Costs $182,810 $2,077 $13,486 $1,349 $20,511 $1,709 Temporary Housing Days 1,607 70 79 14 4,264 42 Temporary Housing Costs $48,106 $2,092 $2,819 $470 $15,0238 $1,473 PSH Days 34,704 378 - - - - PSH Costs $61,966 $674 - - - -
Overall Housing Days 40,685 443 371 31 4,918 46 Overall Housing Costs $292,881 $3,183 $16,804 $1,400 $170,748 $1,581
Next, we compared the average cost per day of housing for each population and housing type by taking the total housing cost and dividing it by the total number of days. Table 6 summarizes the results. The least expensive type of housing was PSH housing, which was also associated with longer stays (i.e., 378 days on average).
Table 6. Average Cost Per Day, By Population and Housing Type
Housing Type Chronically Homeless - PSH Chronically Homeless – No PSH Literally Homeless
Emergency Housing $42 $46 $44 Temporary Housing $30 $36 $35 PSH $2 - -
Overall Housing $7 $45 $35
10
SUMMARY
Our analysis found evidence for reductions in criminal justice involvement for the sample of homeless participants in the MHJDP. All three groups experienced statistically significant reductions in bookings, felonies, misdemeanors, and jail days from the pre-enrollment period to post-treatment period, which is defined as the time from when an individual is enrolled in the program to the point of discharge, or as of May 31, 2017, if currently enrolled.
All groups who received housing assistance experienced a continued decrease in the average number of bookings and jail days up to the post-treatment period. Thus, housing assistance may be an important factor in criminal justice outcomes for the homeless. PSH may provide even more benefits than just providing temporary housing assistance alone. Chronic homeless individuals with PSH remained in the program two times longer on average as compared to the chronic homeless without PSH and literally homeless populations. As a result, they experienced a greater percent change from the pre-enrollment to post-treatment period for bookings and jail days as compared to the other populations with and without housing assistance.
For individuals that did not receive housing assistance, bookings and jail days, as well as felonies and misdemeanors, generally increased again after treatment. This may be an indication that even without housing assistance, the decreases observed during the treatment period for the chronically homeless without PSH and literally homeless participants demonstrate the benefits of access to services and care coordination provided by the MHJDP.
The top five offenses by major category committed by homeless individuals were Trespassing, Theft, Drug Possession, Assault, and Prostitution. Bookings for these offenses in all three populations were reduced during treatment and through the post-treatment period with the exception of chronic homeless individuals without PSH who experienced an increase in Trespassing offenses following treatment. Parole Violations also decreased during the treatment period for both chronic homeless individuals with PSH and the literally homeless. These observations in the reduction of offenses common to homeless individuals can be attributed to the benefits of housing stability and/or service provision on some level.
Lastly, chronically homeless individuals with PSH used the most housing assistance, based on the total and average number of housing days (i.e., 40,685 total and 443 average days), followed by literally homeless individuals (i.e., 4,918 total and 46 average days) and chronically homeless individuals without PSH (i.e., 371 total and 31 average days). On average, housing costs for chronically homeless individuals with PSH were the highest of the three groups (i.e., $3,183), followed by literally homeless individuals (i.e., $1,581), and chronically homeless individuals without PSH (i.e., $1,400), however, were more cost effective on an average cost per day basis at $7 versus $35 and $45, respectively.
The high costs associated with PSH can be attributed to lengthy stays in Emergency Housing due to delays in 1) obtaining approval from the apartment complex, 2) apartment readiness, and 3) securing the necessary documents needed prior to move-in. Emergency Housing was also made available in the event client and/or apartment safety became a concern following PSH move-in. One can conclude that the costs associated with providing housing assistance are offset by the significant reductions (i.e., cost savings) in bookings and jail days which have been estimated to cost the taxpayer $11,435 per booking3 and $149 per day4.
3 Estimated maximum cost per adult criminal court case in Harris County which include law enforcement, detention, and court activities. 4 The average of $149/day was computed using the $67/day rate for the General Population Receiving Psychiatric Medication and Specialized Mental Health Unit rate of $232/day in the Harris County Jail.
11
APPENDIX A
Figure 3. Average Number of Felonies by Housing Assistance and Homeless Population
Figure 4. Average Number of Misdemeanors by Housing Assistance and Homeless Population
Pre Enrollment During Treatment Post Treatment Pre Enrollment During Treatment Post Treatment
Pre Enrollment During Treatment Post Treatment Pre Enrollment During Treatment Post Treatment

12
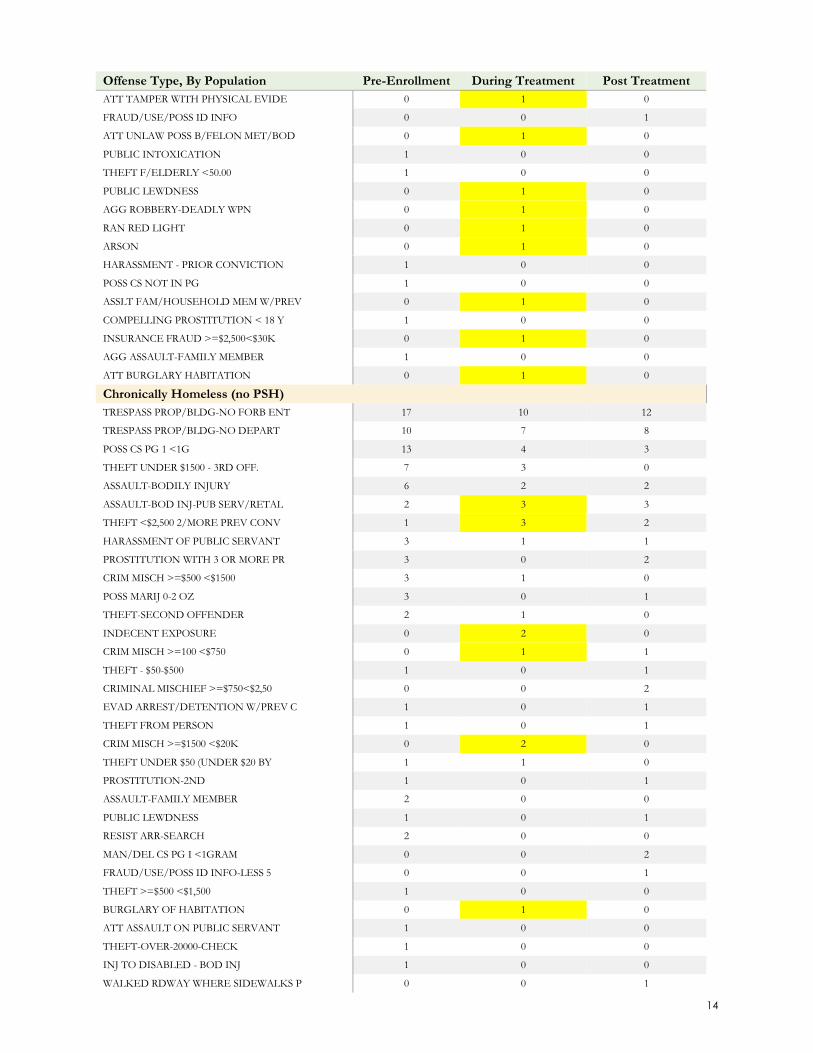
APPENDIX B
Offense Type, By Population Pre-Enrollment During Treatment Post Treatment
Chronically Homeless (PSH)
TRESPASS PROP/BLDG-NO FORB ENT 32 21 8
TRESPASS PROP/BLDG-NO DEPART 26 19 0
POSS CS PG 1 <1G 22 14 2
THEFT UNDER $1500 - 3RD OFF. 21 6 1
MOTION TO REVOKE PAROLE 20 2 3
THEFT - $50-$500 11 2 0
THEFT <$2,500 2/MORE PREV CONV 1 10 2
PROSTITUTION WITH 3 OR MORE PR 10 2 0
RESIST ARR-SEARCH 5 5 0
ASSAULT-BODILY INJURY 5 5 0
ASSAULT-FAMILY MEMBER 4 4 0
TERRORISTIC THREAT 5 2 1
EVAD ARREST/DETENTION W/PREV C 2 3 1
BURGLARY OF HABITATION 1 5 0
NO DRIVER'S LICENSE 3 2 1
POSS MARIJ 0-2 OZ 6 0 0
TAMPER/FABRICATE EVIDENCE 1 4 0
POSS MARIJUANA UNDER 2 OZ (HSC 0 5 0
RETALIATION 3 2 0
PROSTITUTION - NON PUBLIC OFFE 3 2 0
EVADING ARREST/DETENTION 4 0 1
ASSAULT-BOD INJ-PUB SERV/RETAL 1 4 0
BURGLARY OF VEHICLE 4 0 0
SOLICIT EMPL/BUS FM OCCU/VEH 0 4 0
FORGERY 2 2 0
FAILURE MAINTAIN FINANCIAL RES 2 1 1
UNAUTH USE OF VEHICLE 0 4 0
PROSTITUTION-2ND 2 0 2
FELON POSS WPN 0 4 0
THEFT >=$500 <$1,500 4 0 0
MAN/DEL CS PG I <1GRAM 1 2 1
AGG ASSAULT W/DEADLY WEAPON 2 2 0
ASLT FAM/HOUSE MEM IMPED BRTH/ 0 4 0
FAIL TO ID TO P.O. FALSE INF 2 1 0
BURGLARY MOTOR VEHICLE - ENHAN 2 1 0
BURGLARY OF A BUILDING 3 0 0
CRIMINAL TRESPASS 3 0 0
PUBLIC INTOX W/3 PRIOR CONVICT 2 0 1
DEADLY CONDUCT 3 0 0
ROBBERY-BODILY INJURY 1 2 0
OBSTRUCT HIGHWAY/PASSAGEWAY 0 2 1
DRIVING WHILE INTOXICATED 0 3 0
POSS SYNTH CANNABINOIDS =<2OZ 1 2 0
DEL SYNTH CANNABINOIDS <1 GRAM 0 2 0
HARASSMENT OF PUBLIC SERVANT 1 1 0

13
Offense Type, By Population Pre-Enrollment During Treatment Post Treatment
ASSAULT-BOD INJ-FAMILY MEMBER 1 1 0
THEFT >=2,500 <30,000 0 2 0
FAIL TO ID TO P.O. FALSE INF/F 1 1 0
CRIM MISCH >=100 <$750 1 1 0
ASSAULT 0 2 0
POSS CS PG 1 1 - 4 GRAMS 0 2 0
ASSLT INT/RCK/IMP/BRTH/CIRC/PR 0 2 0
POSS CS PG 1 4G - 200G 0 2 0
THEFT $1500-20K 1 1 0
POSS DANGEROUS DRUG 1 1 0
CHILD SUPPORT VIOLATION 1 0 1
DWI 2ND 0 2 0
BURG OF VEHICLE W/2 OR MORE CO 1 1 0
INTERFERE DUTIES PUB SERVANT 2 0 0
VIOLATE PROMISE TO APPEAR 1 1 0
MAN/DEL CS NOT IN PG - SYNTHET 1 1 0
NO SEAT BELT-DRIVER 2 0 0
DRIVING WHILE LICENSE INVALID 1 0 0
WRIT OF ATTACHMENT (WITNESS) 1 0 0
THEFT FROM PERSON 0 0 1
EXPIRED REGISTRATION 0 0 1
THEFT 1 0 0
POSS CS PG 2-A < 2OZ 1 0 0
THEFT >=$750 <$2,500 0 0 1
POSS CS PG 3 <28 GRAMS 0 0 1
POSS DRUG PARAPHERNALIA 0 1 0
CREDIT/DEBIT CARD ABUSE 0 1 0
DEFECTIVE TAIL LIGHT 1 0 0
POSS MARIHUANA UNDER 2 OZ (HSC 0 1 0
NO DRIVER LICENSE ON DEMAND 0 1 0
CRIM MISCH >= $50 <= $500 1 0 0
THEFT >=$30,000 <$150,000 0 1 0
FAIL YLD ROW TURNING LEFT 1 0 0
THEFT BY CHECK $50.00 - $500.0 1 0 0
POSS OF PROHIBITED WEAPON 1 0 0
THEFT-AGGREGATE $50-500 1 0 0
ATTEMPT THEFT UNDER $50 1 0 0
UNLAW POSS B/FELON METAL/BODY 0 1 0
POSS W/INT DEL/MAN/DEL PG1 >=4 0 0 1
STALKING 0 1 0
PRK HANDICAP SPACE-NO DISAB LP 1 0 0
ATT FORGE CHECK 1 0 0
FALSE REPORT TO POLICE OFFICER 1 0 0
ATT RETALIATION OR OBSTRUCTION 1 0 0
PROSTITUTION - PUBLIC OFFER 1 0 0
THEFT <$100 W/PREV CONVICTION 0 1 0
CRIM TRES HAB/SHLTR/SUPRFUND/I 0 1 0
THEFT >=$100<$750 1 0 0
CRIMINAL MISCHIEF >=$750<$2,50 0 1 0
14
Offense Type, By Population Pre-Enrollment During Treatment Post Treatment
ATT TAMPER WITH PHYSICAL EVIDE 0 1 0
FRAUD/USE/POSS ID INFO 0 0 1
ATT UNLAW POSS B/FELON MET/BOD 0 1 0
PUBLIC INTOXICATION 1 0 0
THEFT F/ELDERLY <50.00 1 0 0
PUBLIC LEWDNESS 0 1 0
AGG ROBBERY-DEADLY WPN 0 1 0
RAN RED LIGHT 0 1 0
ARSON 0 1 0
HARASSMENT - PRIOR CONVICTION 1 0 0
POSS CS NOT IN PG 1 0 0
ASSLT FAM/HOUSEHOLD MEM W/PREV 0 1 0
COMPELLING PROSTITUTION < 18 Y 1 0 0
INSURANCE FRAUD >=$2,500<$30K 0 1 0
AGG ASSAULT-FAMILY MEMBER 1 0 0
ATT BURGLARY HABITATION 0 1 0
Chronically Homeless (no PSH)
TRESPASS PROP/BLDG-NO FORB ENT 17 10 12
TRESPASS PROP/BLDG-NO DEPART 10 7 8
POSS CS PG 1 <1G 13 4 3
THEFT UNDER $1500 - 3RD OFF. 7 3 0
ASSAULT-BODILY INJURY 6 2 2
ASSAULT-BOD INJ-PUB SERV/RETAL 2 3 3
THEFT <$2,500 2/MORE PREV CONV 1 3 2
HARASSMENT OF PUBLIC SERVANT 3 1 1
PROSTITUTION WITH 3 OR MORE PR 3 0 2
CRIM MISCH >=$500 <$1500 3 1 0
POSS MARIJ 0-2 OZ 3 0 1
THEFT-SECOND OFFENDER 2 1 0
INDECENT EXPOSURE 0 2 0
CRIM MISCH >=100 <$750 0 1 1
THEFT - $50-$500 1 0 1
CRIMINAL MISCHIEF >=$750<$2,50 0 0 2
EVAD ARREST/DETENTION W/PREV C 1 0 1
THEFT FROM PERSON 1 0 1
CRIM MISCH >=$1500 <$20K 0 2 0
THEFT UNDER $50 (UNDER $20 BY 1 1 0
PROSTITUTION-2ND 1 0 1
ASSAULT-FAMILY MEMBER 2 0 0
PUBLIC LEWDNESS 1 0 1
RESIST ARR-SEARCH 2 0 0
MAN/DEL CS PG I <1GRAM 0 0 2
FRAUD/USE/POSS ID INFO-LESS 5 0 0 1
THEFT >=$500 <$1,500 1 0 0
BURGLARY OF HABITATION 0 1 0
ATT ASSAULT ON PUBLIC SERVANT 1 0 0
THEFT-OVER-20000-CHECK 1 0 0
INJ TO DISABLED - BOD INJ 1 0 0
WALKED RDWAY WHERE SIDEWALKS P 0 0 1

15
Offense Type, By Population Pre-Enrollment During Treatment Post Treatment
INTERFERE DUTIES PUB SERVANT 0 0 1
EVADING ARREST/DETENTION 1 0 0
ISSUE BAD CHECK 1 0 0
EXPIRED REGISTRATION 1 0 0
ATT INJURY TO DISABLED PERSON 1 0 0
THFT MATERIAL ALUM/BRNZ/COPPR/ 1 0 0
NO BRAKE LIGHTS (LAMPS) ON TRA 0 0 1
UNSEC CHILD UND 8/LESS THAN 4F 1 0 0
NO DRIVER'S LICENSE 1 0 0
TERRORISTIC THREAT 1 0 0
ATTEMPT HARASS B/PER IN CORR/F 0 1 0
THEFT $1500-20K 1 0 0
POSS CS PG 2 <1GRAM 0 1 0
THEFT >=$100<$750 0 1 0
CRIMINAL MISCHIEF >=$2,500<30K 0 0 1
EXPIRED INSPECTION CERTIFICATE 1 0 0
PROSTITUTION - NON PUBLIC OFFE 1 0 0
FAILURE MAINTAIN FINANCIAL RES 1 0 0
BURG OF VEHICLE W/2 OR MORE CO 1 0 0
FELON POSS WPN 0 0 1
CRIMINAL TRESPASS 0 0 1
TRESPASS ON GROUND-INS OF HIGH 0 1 0
DRV W/LIC INV W/PR CN/SUS/W/O 0 0 1
HARASSMENT BY PERSON IN CORR/F 0 1 0
DWI 1ST 1 0 0
URINATING IN A PUBLIC PLACE 0 0 1
ROBBERY-BODILY INJURY 0 0 1
CONSUMPTION ON OFF PREMISE LIC 1 0 0
ROBBERY-THREATS 1 0 0
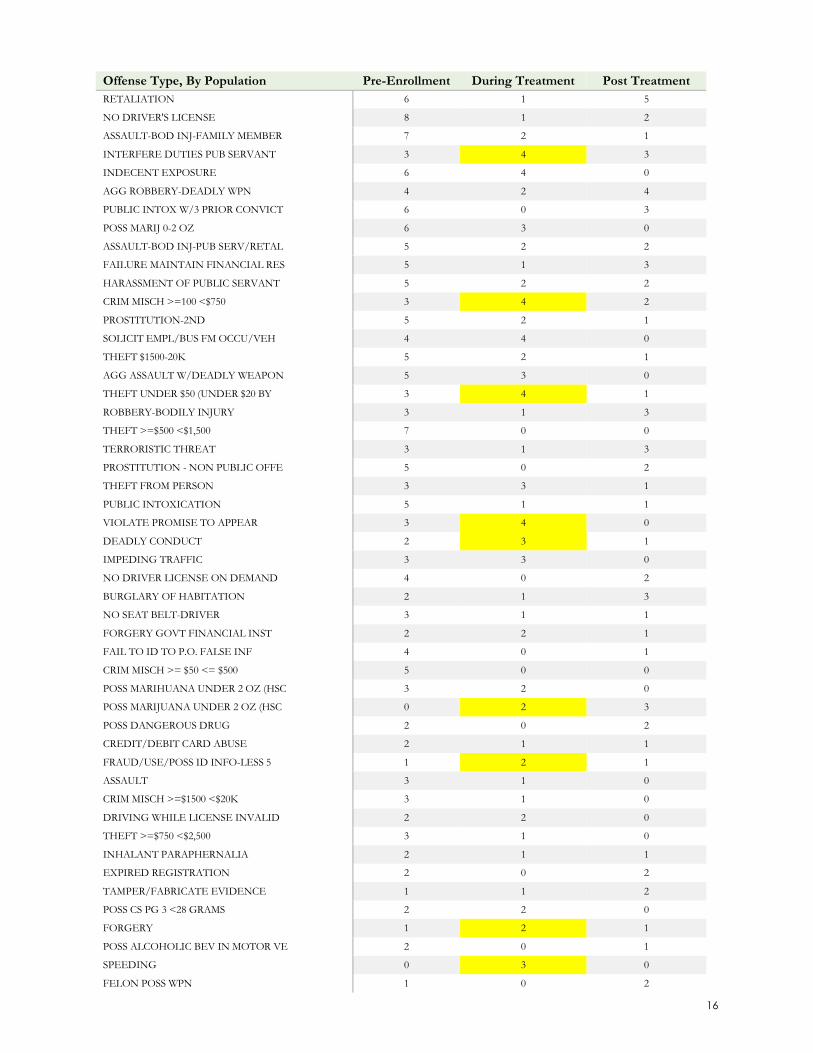
Literally Homeless
POSS CS PG 1 <1G 84 38 25
TRESPASS PROP/BLDG-NO FORB ENT 55 22 28
TRESPASS PROP/BLDG-NO DEPART 50 29 11
PROSTITUTION WITH 3 OR MORE PR 29 20 9
THEFT <$2,500 2/MORE PREV CONV 16 24 14
THEFT UNDER $1500 - 3RD OFF. 35 7 3
ASSAULT-BODILY INJURY 25 4 2
THEFT - $50-$500 27 3 0
ASSAULT-FAMILY MEMBER 20 1 0
EVAD ARREST/DETENTION W/PREV C 9 6 6
CRIMINAL TRESPASS 13 3 1
EVADING ARREST/DETENTION 11 1 4
MAN/DEL CS PG I <1GRAM 5 6 5
MOTION TO REVOKE PAROLE 8 3 5
RESIST ARR-SEARCH 10 4 1
POSS CS PG 1 1 - 4 GRAMS 8 4 2
THEFT >=$100<$750 4 3 6
UNAUTH USE OF VEHICLE 4 4 5
BURGLARY OF VEHICLE 7 2 3
16
Offense Type, By Population Pre-Enrollment During Treatment Post Treatment
RETALIATION 6 1 5
NO DRIVER'S LICENSE 8 1 2
ASSAULT-BOD INJ-FAMILY MEMBER 7 2 1
INTERFERE DUTIES PUB SERVANT 3 4 3
INDECENT EXPOSURE 6 4 0
AGG ROBBERY-DEADLY WPN 4 2 4
PUBLIC INTOX W/3 PRIOR CONVICT 6 0 3
POSS MARIJ 0-2 OZ 6 3 0
ASSAULT-BOD INJ-PUB SERV/RETAL 5 2 2
FAILURE MAINTAIN FINANCIAL RES 5 1 3
HARASSMENT OF PUBLIC SERVANT 5 2 2
CRIM MISCH >=100 <$750 3 4 2
PROSTITUTION-2ND 5 2 1
SOLICIT EMPL/BUS FM OCCU/VEH 4 4 0
THEFT $1500-20K 5 2 1
AGG ASSAULT W/DEADLY WEAPON 5 3 0
THEFT UNDER $50 (UNDER $20 BY 3 4 1
ROBBERY-BODILY INJURY 3 1 3
THEFT >=$500 <$1,500 7 0 0
TERRORISTIC THREAT 3 1 3
PROSTITUTION - NON PUBLIC OFFE 5 0 2
THEFT FROM PERSON 3 3 1
PUBLIC INTOXICATION 5 1 1
VIOLATE PROMISE TO APPEAR 3 4 0
DEADLY CONDUCT 2 3 1
IMPEDING TRAFFIC 3 3 0
NO DRIVER LICENSE ON DEMAND 4 0 2
BURGLARY OF HABITATION 2 1 3
NO SEAT BELT-DRIVER 3 1 1
FORGERY GOVT FINANCIAL INST 2 2 1
FAIL TO ID TO P.O. FALSE INF 4 0 1
CRIM MISCH >= $50 <= $500 5 0 0
POSS MARIHUANA UNDER 2 OZ (HSC 3 2 0
POSS MARIJUANA UNDER 2 OZ (HSC 0 2 3
POSS DANGEROUS DRUG 2 0 2
CREDIT/DEBIT CARD ABUSE 2 1 1
FRAUD/USE/POSS ID INFO-LESS 5 1 2 1
ASSAULT 3 1 0
CRIM MISCH >=$1500 <$20K 3 1 0
DRIVING WHILE LICENSE INVALID 2 2 0
THEFT >=$750 <$2,500 3 1 0
INHALANT PARAPHERNALIA 2 1 1
EXPIRED REGISTRATION 2 0 2
TAMPER/FABRICATE EVIDENCE 1 1 2
POSS CS PG 3 <28 GRAMS 2 2 0
FORGERY 1 2 1
POSS ALCOHOLIC BEV IN MOTOR VE 2 0 1
SPEEDING 0 3 0
FELON POSS WPN 1 0 2
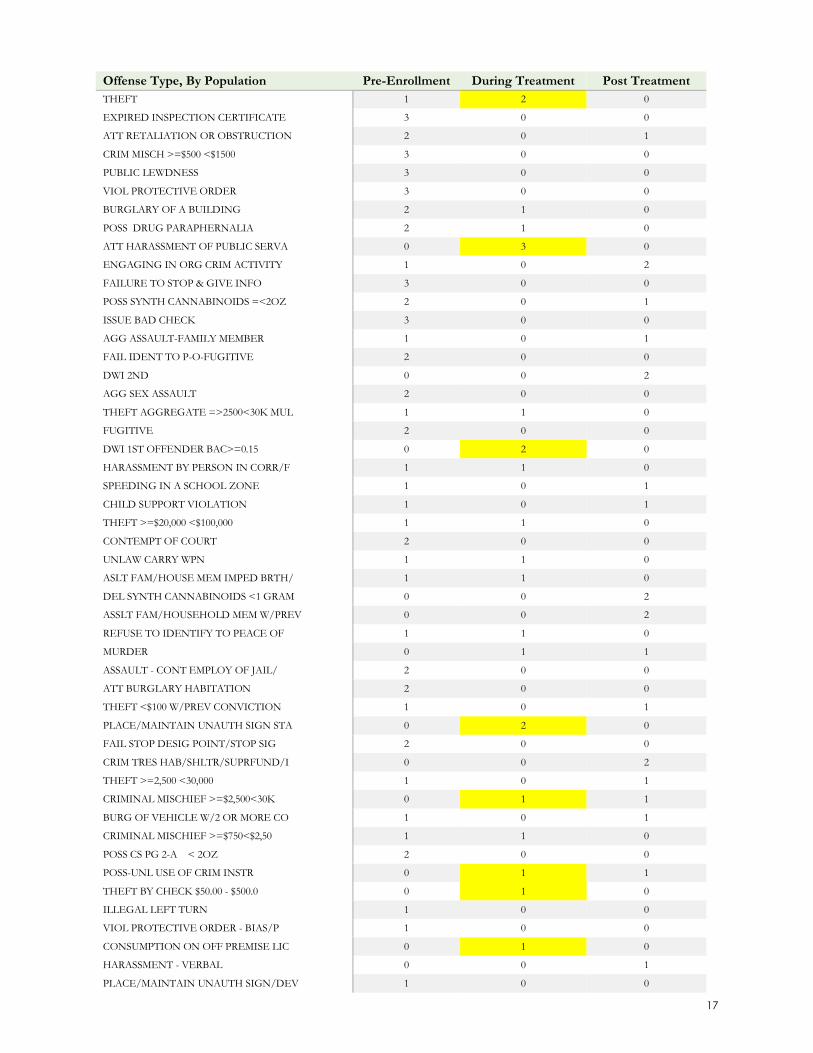
17
Offense Type, By Population Pre-Enrollment During Treatment Post Treatment
THEFT 1 2 0
EXPIRED INSPECTION CERTIFICATE 3 0 0
ATT RETALIATION OR OBSTRUCTION 2 0 1
CRIM MISCH >=$500 <$1500 3 0 0
PUBLIC LEWDNESS 3 0 0
VIOL PROTECTIVE ORDER 3 0 0
BURGLARY OF A BUILDING 2 1 0
POSS DRUG PARAPHERNALIA 2 1 0
ATT HARASSMENT OF PUBLIC SERVA 0 3 0
ENGAGING IN ORG CRIM ACTIVITY 1 0 2
FAILURE TO STOP & GIVE INFO 3 0 0
POSS SYNTH CANNABINOIDS =<2OZ 2 0 1
ISSUE BAD CHECK 3 0 0
AGG ASSAULT-FAMILY MEMBER 1 0 1
FAIL IDENT TO P-O-FUGITIVE 2 0 0
DWI 2ND 0 0 2
AGG SEX ASSAULT 2 0 0
THEFT AGGREGATE =>2500<30K MUL 1 1 0
FUGITIVE 2 0 0
DWI 1ST OFFENDER BAC>=0.15 0 2 0
HARASSMENT BY PERSON IN CORR/F 1 1 0
SPEEDING IN A SCHOOL ZONE 1 0 1
CHILD SUPPORT VIOLATION 1 0 1
THEFT >=$20,000 <$100,000 1 1 0
CONTEMPT OF COURT 2 0 0
UNLAW CARRY WPN 1 1 0
ASLT FAM/HOUSE MEM IMPED BRTH/ 1 1 0
DEL SYNTH CANNABINOIDS <1 GRAM 0 0 2
ASSLT FAM/HOUSEHOLD MEM W/PREV 0 0 2
REFUSE TO IDENTIFY TO PEACE OF 1 1 0
MURDER 0 1 1
ASSAULT - CONT EMPLOY OF JAIL/ 2 0 0
ATT BURGLARY HABITATION 2 0 0
THEFT <$100 W/PREV CONVICTION 1 0 1
PLACE/MAINTAIN UNAUTH SIGN STA 0 2 0
FAIL STOP DESIG POINT/STOP SIG 2 0 0
CRIM TRES HAB/SHLTR/SUPRFUND/I 0 0 2
THEFT >=2,500 <30,000 1 0 1
CRIMINAL MISCHIEF >=$2,500<30K 0 1 1
BURG OF VEHICLE W/2 OR MORE CO 1 0 1
CRIMINAL MISCHIEF >=$750<$2,50 1 1 0
POSS CS PG 2-A < 2OZ 2 0 0
POSS-UNL USE OF CRIM INSTR 0 1 1
THEFT BY CHECK $50.00 - $500.0 0 1 0
ILLEGAL LEFT TURN 1 0 0
VIOL PROTECTIVE ORDER - BIAS/P 1 0 0
CONSUMPTION ON OFF PREMISE LIC 0 1 0
HARASSMENT - VERBAL 0 0 1
PLACE/MAINTAIN UNAUTH SIGN/DEV 1 0 0
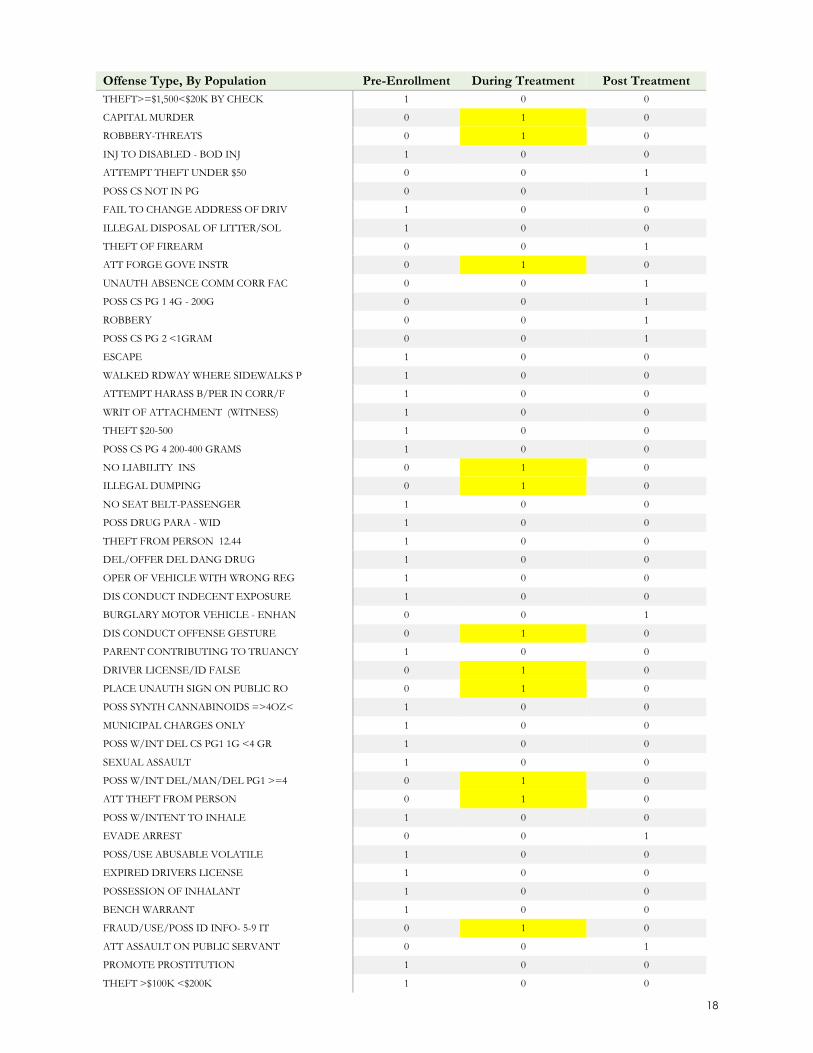
18
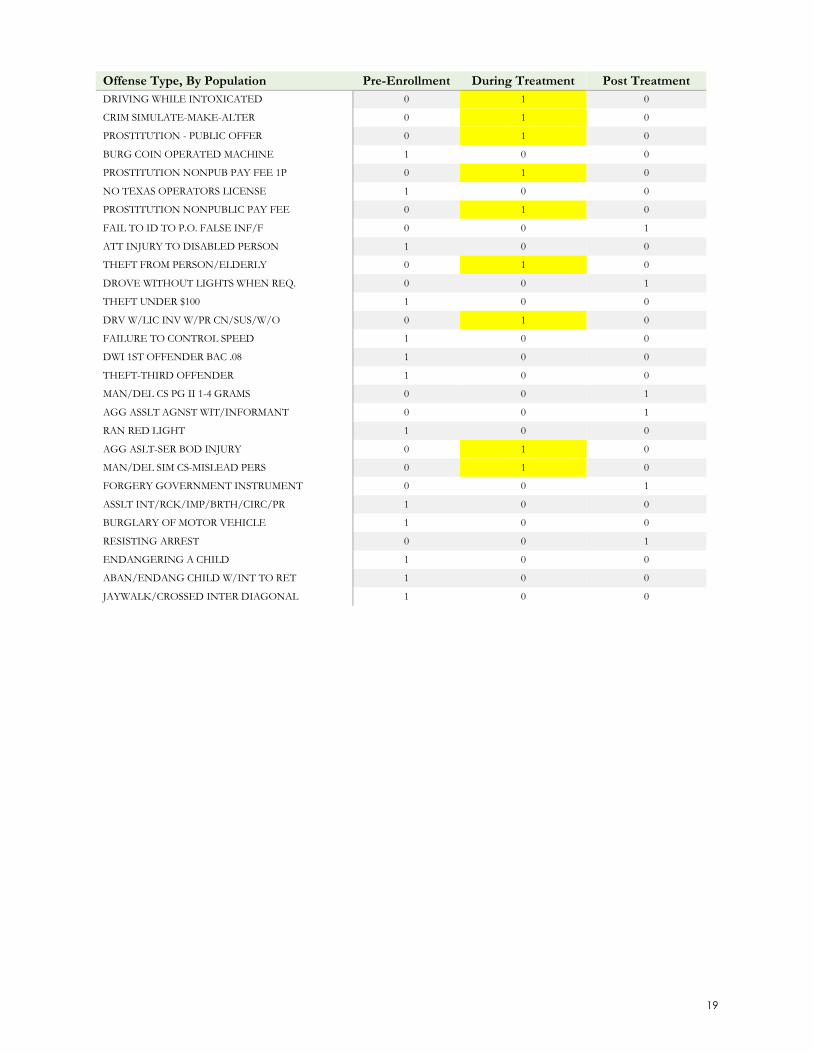
Offense Type, By Population Pre-Enrollment During Treatment Post Treatment
THEFT>=$1,500<$20K BY CHECK 1 0 0
CAPITAL MURDER 0 1 0
ROBBERY-THREATS 0 1 0
INJ TO DISABLED - BOD INJ 1 0 0
ATTEMPT THEFT UNDER $50 0 0 1
POSS CS NOT IN PG 0 0 1
FAIL TO CHANGE ADDRESS OF DRIV 1 0 0
ILLEGAL DISPOSAL OF LITTER/SOL 1 0 0
THEFT OF FIREARM 0 0 1
ATT FORGE GOVE INSTR 0 1 0
UNAUTH ABSENCE COMM CORR FAC 0 0 1
POSS CS PG 1 4G - 200G 0 0 1
ROBBERY 0 0 1
POSS CS PG 2 <1GRAM 0 0 1
ESCAPE 1 0 0
WALKED RDWAY WHERE SIDEWALKS P 1 0 0
ATTEMPT HARASS B/PER IN CORR/F 1 0 0
WRIT OF ATTACHMENT (WITNESS) 1 0 0
THEFT $20-500 1 0 0
POSS CS PG 4 200-400 GRAMS 1 0 0
NO LIABILITY INS 0 1 0
ILLEGAL DUMPING 0 1 0
NO SEAT BELT-PASSENGER 1 0 0
POSS DRUG PARA - WID 1 0 0
THEFT FROM PERSON 12.44 1 0 0
DEL/OFFER DEL DANG DRUG 1 0 0
OPER OF VEHICLE WITH WRONG REG 1 0 0
DIS CONDUCT INDECENT EXPOSURE 1 0 0
BURGLARY MOTOR VEHICLE - ENHAN 0 0 1
DIS CONDUCT OFFENSE GESTURE 0 1 0
PARENT CONTRIBUTING TO TRUANCY 1 0 0
DRIVER LICENSE/ID FALSE 0 1 0
PLACE UNAUTH SIGN ON PUBLIC RO 0 1 0
POSS SYNTH CANNABINOIDS =>4OZ< 1 0 0
MUNICIPAL CHARGES ONLY 1 0 0
POSS W/INT DEL CS PG1 1G <4 GR 1 0 0
SEXUAL ASSAULT 1 0 0
POSS W/INT DEL/MAN/DEL PG1 >=4 0 1 0
ATT THEFT FROM PERSON 0 1 0
POSS W/INTENT TO INHALE 1 0 0
EVADE ARREST 0 0 1
POSS/USE ABUSABLE VOLATILE 1 0 0
EXPIRED DRIVERS LICENSE 1 0 0
POSSESSION OF INHALANT 1 0 0
BENCH WARRANT 1 0 0
FRAUD/USE/POSS ID INFO- 5-9 IT 0 1 0
ATT ASSAULT ON PUBLIC SERVANT 0 0 1
PROMOTE PROSTITUTION 1 0 0
THEFT >$100K <$200K 1 0 0
19
Offense Type, By Population Pre-Enrollment During Treatment Post Treatment
DRIVING WHILE INTOXICATED 0 1 0
CRIM SIMULATE-MAKE-ALTER 0 1 0
PROSTITUTION - PUBLIC OFFER 0 1 0
BURG COIN OPERATED MACHINE 1 0 0
PROSTITUTION NONPUB PAY FEE 1P 0 1 0
NO TEXAS OPERATORS LICENSE 1 0 0
PROSTITUTION NONPUBLIC PAY FEE 0 1 0
FAIL TO ID TO P.O. FALSE INF/F 0 0 1
ATT INJURY TO DISABLED PERSON 1 0 0
THEFT FROM PERSON/ELDERLY 0 1 0
DROVE WITHOUT LIGHTS WHEN REQ. 0 0 1
THEFT UNDER $100 1 0 0
DRV W/LIC INV W/PR CN/SUS/W/O 0 1 0
FAILURE TO CONTROL SPEED 1 0 0
DWI 1ST OFFENDER BAC .08 1 0 0
THEFT-THIRD OFFENDER 1 0 0
MAN/DEL CS PG II 1-4 GRAMS 0 0 1
AGG ASSLT AGNST WIT/INFORMANT 0 0 1
RAN RED LIGHT 1 0 0
AGG ASLT-SER BOD INJURY 0 1 0
MAN/DEL SIM CS-MISLEAD PERS 0 1 0
FORGERY GOVERNMENT INSTRUMENT 0 0 1
ASSLT INT/RCK/IMP/BRTH/CIRC/PR 1 0 0
BURGLARY OF MOTOR VEHICLE 1 0 0
RESISTING ARREST 0 0 1
ENDANGERING A CHILD 1 0 0
ABAN/ENDANG CHILD W/INT TO RET 1 0 0
JAYWALK/CROSSED INTER DIAGONAL 1 0 0

20
APPENDIX C
To see whether MHJDP treatment had an effect on reducing criminal justice recidivism, we looked at two outcomes: bookings and jail days. Explanatory variables are population type (i.e., chronically homeless with PSH, chronically homeless without PSH, and literally homeless), housing assistance (i.e., yes or no), and time period. Each program participant has several program IDs; for this analysis, we used their Harris Center medical record ID.
Both total bookings and total jail days were analyzed using linear mixed-effects regression models (also known as mixed models or multilevel models) via the lme4 package in R. Often used for analyzing change over time, these types of statistical models account for several important characteristics of the data.
First, the data was collected at multiple levels: At the top level, there are characteristics that describe the program participants themselves: their homeless population type and whether they received housing assistance. At a lower level, each program participant has three measurements for bookings and jail days: one year before enrollment, during the treatment period, and one year post-treatment. By using a mixed-effects model, we can account explicitly for this multilevel data structure by specifying participant characteristics as predictors of bookings and jail days on the higher level and by specifying that each participant has several measurements for bookings and jail days on the lower level. Specifying that each participant has several measurements for bookings and jail days is important because we expect that each individual’s measurements to be somewhat similar to each other. In other words, if a program participant has a lot of bookings during the year before enrollment, that participant will probably have a lot of bookings during the treatment and post-treatment period as well, even if his/her overall trend shows improvement. In statistical terms, we expect each individual’s measurements to be somewhat correlated with each other (i.e., not statistically independent). By accounting for this correlation in our mixed-effects models for bookings and jail days, we can obtain better estimates of the effects of predictors like housing assistance.
Second, a mixed-effects model can account for variations between program participants. We know that different participants to have different baselines. Some participants have a high number of bookings and/or jail days while others have fewer bookings and spent fewer days in jail. Also, different participants might experience change over time in different ways; some participants might have a slow but steady decrease in bookings and jail days, while others might experience very sharp reductions over time. In a mixed-effects model, we can account for these differences through “random effects.” Specifically, we estimate a “random intercept” for bookings and jail days (i.e., we estimate a range of averages instead of just a single average for the baseline). Furthermore, we specify a “random slope” with respect to time for each participant (i.e., we estimate a range of trajectories over time).
In addition to “random effects,” mixed-effects models also include “fixed effects.” For our mixed model approach, we considered time period, population type, and housing assistance as fixed effects. In other words, after accounting for individual differences among program participants, we assume that the standalone effects of time, population type, and housing assistance are constant quantities, rather than varying quantities.
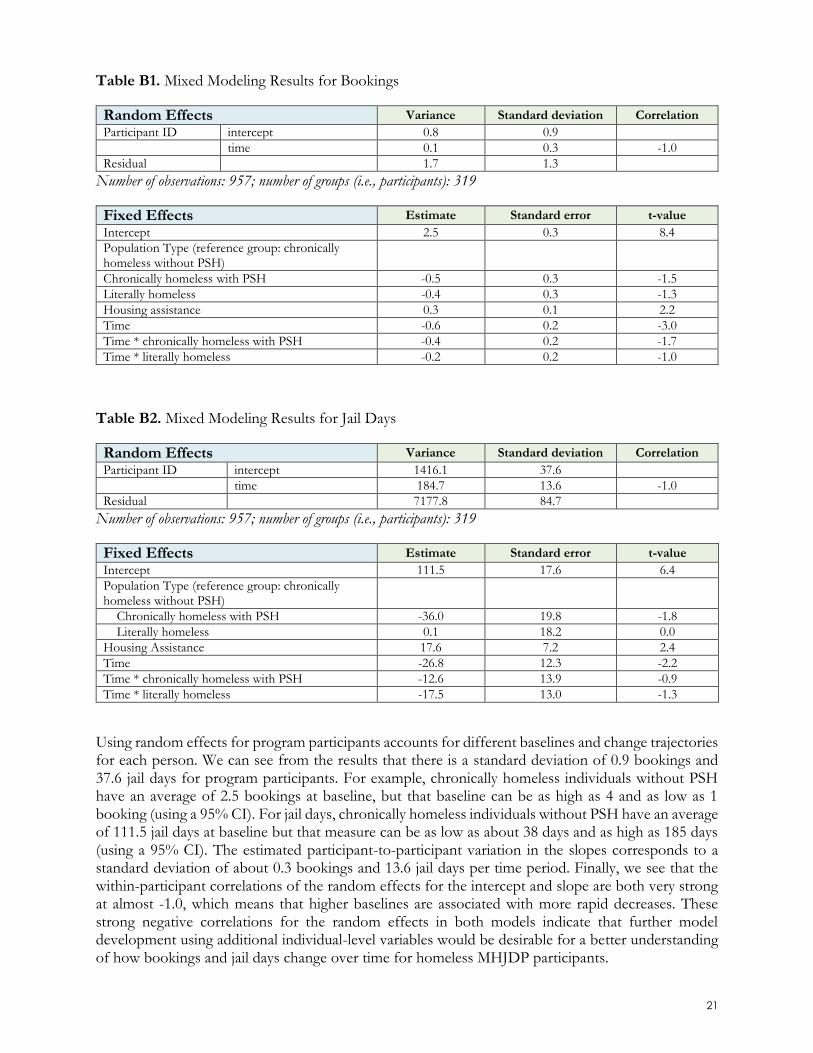
To check the models, we used standard statistical techniques for model selection, such as checking for interactions among the fixed effects and assessing the necessity of including the random slope. The final models and results for bookings and jail days are summarized in Table B1 and B2.
21
Table B1. Mixed Modeling Results for Bookings
Random Effects Variance Standard deviation Correlation
Participant ID intercept 0.8 0.9
time 0.1 0.3 -1.0
Residual 1.7 1.3
Number of observations: 957; number of groups (i.e., participants): 319
Fixed Effects Estimate Standard error t-value
Intercept 2.5 0.3 8.4
Population Type (reference group: chronically homeless without PSH)
Chronically homeless with PSH -0.5 0.3 -1.5
Literally homeless -0.4 0.3 -1.3
Housing assistance 0.3 0.1 2.2
Time -0.6 0.2 -3.0
Time * chronically homeless with PSH -0.4 0.2 -1.7
Time * literally homeless -0.2 0.2 -1.0
Table B2. Mixed Modeling Results for Jail Days
Random Effects Variance Standard deviation Correlation
Participant ID intercept 1416.1 37.6
time 184.7 13.6 -1.0
Residual 7177.8 84.7
Number of observations: 957; number of groups (i.e., participants): 319
Fixed Effects Estimate Standard error t-value
Intercept 111.5 17.6 6.4
Population Type (reference group: chronically homeless without PSH)
Chronically homeless with PSH -36.0 19.8 -1.8
Literally homeless 0.1 18.2 0.0
Housing Assistance 17.6 7.2 2.4
Time -26.8 12.3 -2.2
Time * chronically homeless with PSH -12.6 13.9 -0.9
Time * literally homeless -17.5 13.0 -1.3
Using random effects for program participants accounts for different baselines and change trajectories for each person. We can see from the results that there is a standard deviation of 0.9 bookings and 37.6 jail days for program participants. For example, chronically homeless individuals without PSH have an average of 2.5 bookings at baseline, but that baseline can be as high as 4 and as low as 1 booking (using a 95% CI). For jail days, chronically homeless individuals without PSH have an average of 111.5 jail days at baseline but that measure can be as low as about 38 days and as high as 185 days (using a 95% CI). The estimated participant-to-participant variation in the slopes corresponds to a standard deviation of about 0.3 bookings and 13.6 jail days per time period. Finally, we see that the within-participant correlations of the random effects for the intercept and slope are both very strong at almost -1.0, which means that higher baselines are associated with more rapid decreases. These strong negative correlations for the random effects in both models indicate that further model development using additional individual-level variables would be desirable for a better understanding of how bookings and jail days change over time for homeless MHJDP participants.

22
For the fixed effects, we found a significant negative effect of time on bookings as well as jail days – in other words, both bookings and jail days decrease over time. The effect of housing assistance was also significant for both outcomes. The estimates indicate that those who received housing assistance also tended to have higher bookings and jail days on average.