evaluation of the black hawk county mental health jail ...firstdcs.com/reports/2014.bhc mh jail...
TRANSCRIPT
Evaluation of the Black Hawk County Mental Health Jail Diversion ProgramPrepared byDr. Joe GortonDr. Keith Crew
Department of Sociology, Anthropology,and Criminology
University of Northern Iowa
Prepared forIowa Department of Correctional ServicesFirst Judicial District
June 2014

EXECUTIVE SUMMARY
This study presents an evaluation of the First Judicial District Department of Correctional
Services mental health jail diversion program. The analysis examines both program efficacy and
cost-benefits.
The evaluation is based on analyses of both quantitative and qualitative data. Quantitative data
were collected from probation/parole and jail records of 482 offenders who participated in the
program from 2007 through 2011. Qualitative data was derived from in-depth interviews of
criminal justice officials and social service providers who are directly involved with the program.
• Two-thirds of the inmates diverted into the mental health program were white males most
of whom were younger than 30 years old. Women were under represented in the study
population, however, they were significantly more likely to be placed in the diversion
program.
• For two-thirds of the diverted sample, the primary mental health diagnoses was a mood
disorder (e.g., bi-polar, depressive, anxiety, etc.). Approximately one-fourth of the
sample had a primary diagnoses of psychotic disorder. Schizophrenia, paranoid type was
the most common psychotic condition.
• Based on their LSI-R scores, 67.6 percent most of the diverted inmates were either a
medium-high risk or high risk. For non-diverted inmates 61.9 percent were either
medium-high risk or high risk.
• Inmates with psychotic disorders were more likely to be diverted than offenders with less
severe mental health problems.

2
• Comparisons of arrest data for two years prior to being booked into jail and for two years
of post-diversion indicate that the diversion program helps to reduce the likelihood of
criminal recidivism.
• Diverted inmates with a primary diagnosis of a psychotic disorder were significantly less
likely to be arrested than diverted inmates who did not have a psychotic disorder.
• The totality of quantitative findings indicate that Black Hawk County’s mental health
diversion program is effective at reducing criminal recidivism among mentally ill inmates
• We estimate that diverted inmates served 15 fewer days in jail than non-diverted inmates.
• The total estimate for annual cost savings produced by the mental health jail diversion
program is $237,509. The annual net fiscal benefit of the program (without cost
estimates for prosecutions, prison confinement, and taxpayer funded victimization
programs) is estimated at $137,509.

3
INTRODUCTION
This study presents an evaluation of the First Judicial District Department of Correctional
Services mental health jail diversion program. The analysis examines both program efficacy and
cost-benefits. Central goals for the program are to reduce recidivism risks presented by mentally
ill offenders and to improve cost efficiencies within the local criminal justice system.
Our evaluation is based on analyses of both quantitative and qualitative data. Quantitative data
were collected from probation/parole and jail records of 482 offenders who participated in the
program from 2007 through 2011. Qualitative data was derived from in-depth interviews of
criminal justice officials and social service providers who are directly involved with the program.
PROGRAM OVERVIEW
Prior to 2004, diversion of Black Hawk County’s mentally ill offenders from jail confinement to
community support services was largely the product of informal arrangements among criminal
justice officials and social service providers. During this period, it was not uncommon for
mentally ill inmates to be in jail for relatively long periods of time prior to their release. In most
instances, diversion occurred after a criminal justice official and/or social service provider
concluded that a jail inmate would benefit from jail release to community social services.
Typically, this would lead to informal discussions among individuals who worked together to
secure an inmate’s release from confinement with referral to appropriate social service and/or
community supports.
The Black Hawk County mental health jail diversion program began in February 2004. Its
implementation was marked by the creation of a formal diversion process. A key element of the
program is funding for a program coordinator paid for jointly by the First Judicial District

4
Department of Correctional Services and the Black Hawk County Sheriff’s Office. Like its
informal predecessor, the program emphasizes a post-booking model for diverting mentally ill
offenders after they have been processed into the county jail. The program coordinator is a
probation/parole officer with ancillary responsibilities not directly linked to the program.
The overwhelming majority of diverted inmates are selected through one of the following
methods.
1. During the jail intake screening process arresting officers submit documentation that
includes information about mental health problems on the part of the arrestee. In
addition, jail officials screen each inmate on various issues and make note of any
indications of mental health issues. Jail officials also review their information system for
references to mental health issues during prior confinements. Notations about mental
health or substance abuse problems are included on daily initial court appearance lists
prepared by jail officials. The program coordinator reviews the list each day for inmates
who might be appropriate for mental health diversion.
2. In addition to the intake screening process, some inmates are selected for diversion after
self-referral to medical staff at the jail who subsequently report their findings to the
program coordinator.
3. In other instances, parole or probation officers will inform the coordinator when an
offender on their caseload who has mental health problems has been booked into jail.
4. On some occasions, mental health problems do not become evident until the inmate has
been confined for a period of time. In those cases, jail officials notify the program
coordinator that the inmate might be appropriate for a mental health diversion.

5
The program coordinator conducts an assessment of each inmate identified as possibly
appropriate for the diversion program. The assessment includes the coordinator’s review of
intake records from jail officials and arresting officers. The coordinator also conducts a
thorough interview of each offender. Depending on offenders’ backgrounds, information is also
collected from criminal justice and/or social service agencies.
The coordinator’s assessment provides a description of psycho-social factors that directly affect
an inmate’s ability to reside in the community pending the adjudication of their case. Those
factors include, but are not limited to: access to suitable housing; existence of family and
community support; current arrangements for mental health treatment; mental health treatment
history; cognitive ability to comply with mental health medication requirements; substance abuse
problems; substance abuse history; physical disabilities; Medicaid eligibility; employment status
and job skills. During the interview portion of the assessment, the coordinator seeks to learn the
inmates’ subjective views of their most pressing needs and goals, the areas of their lives they
want to improve, and their motivation to succeed in the program.
A key part of the assessment process is to screen out inmates who have a pattern of violent
behavior that would make them an unacceptable risk for release into the community. Likewise,
inmates who have ever been convicted of, or arrested for, a sex offense, are usually screened out.
Ultimately, the process of evaluating the public risk posed by a candidate for diversion is an
issue decided by officers of the court. Having managed the program for several years, the
program coordinator is usually able to anticipate which inmates would be regarded by the court
as presenting an unacceptable risk to public safety.

6
For inmates released into the diversion program, the coordinator formulates a post-release plan.
During this part of this process, the coordinator carefully explains to the inmate each of the
following areas: purpose of release; agency referrals; tasks the inmate must complete; contacting
the probation/parole officer to whom the inmate will be assigned; and legal requirements
associated with the conditions of release. In cases where release occurs prior to the next court
appearance, the coordinator contacts the inmate’s defense attorney to inform them of their
client’s release from jail and the post-release plan.
Inmates approved by the criminal court judge for jail diversion are assigned to one of five
probation/parole officers who comprise a mental health unit within the First Judicial District
Department of Correctional Services. Officers in this unit supervise specialized caseloads of
mentally ill offenders on probation, parole, or pre-trial release. In addition, the program
coordinator sometimes supervises a relatively small number of jail diversion cases.
Referrals to community and social services are a central part of the diversion program. In
virtually all diversions, the referral process begins very soon after the psycho-social assessment.
Because of the complex array of criminogenic needs and the relative scarcity of community
services, arranging appropriate referrals can be difficult. In most cases, it is necessary to provide
referrals to multiple agencies for assistance in areas such as mental health treatment/medication,
substance abuse problems, housing, health care, and social support.
In sum, the Black Hawk County Mental Health Jail Diversion Program is a structured and
multifaceted process that integrates the efforts of personnel from the sheriff’s office, criminal
courts, adult probation/parole, and social services toward the goal of safely releasing mentally ill

7
jail inmates into the community for treatment and supervision. Approximately, 10 to 15 inmates
are diverted each month.
METHODS
The analysis employs both quantitative and qualitative methods. Quantitative data were collected
on 23 variables for 481 offenders who were screened for acceptance into the mental health jail
diversion program during the five year period from 2007 through 2011. These data were
collected from automated records information systems maintained by the Black Hawk County
Jail and the Iowa Correctional Offender Network (ICON) management information system.
Data related to offenders’ mental health diagnoses were collected from case files maintained by
the jail diversion program coordinator. Information that could identify individual cases was
deleted from our data sets. Statistical Programs for Social Sciences (SPSS) programs were used
to produce the quantitative findings.
Qualitative data were collected from structured interviews of nine respondents who work directly
with the jail diversion program. The interviewees included personnel from adult
probation/parole, the Black Hawk County Sheriff’s Office, Black Hawk County Attorney’s
Office; Black Hawk County Public Defender’s Office, Black Hawk-Grundy Mental Health
Services, Cedar Valley Community Support Services and Black Hawk County Social Services.
Interviews ranged from 45 minutes to 90 minutes in length. Each interview was audio taped and
transcribed verbatim into written text. All of the interviews were confidential. To identify
significant trends in program processes and outcomes, the interview data were analyzed using
cross coding methods that evaluate important analytical themes across the functional roles of
each interviewee.

8
QUANTITATIVE FINDINGS
Descriptive Statistics
The population sample for the analysis includes Black Hawk County jail inmates screened for
jail diversion from 2007 through 2011. During that time, several inmates were booked into jail
multiple times. In those instances, we included data connected only to each individual’s most
recent jail confinement. In other words, each individual appears in the sample only once. There
are no duplicate cases.
From the population of inmates screened, approximately 74 percent (n = 356) were diverted from
jail into the community. Table 1 shows the distribution of key descriptive variables for all cases
in the study and for all case selected for the jail diversion program.
Table 1 Distribution of Descriptive Variables for Screened and Placed in Diversion Program
Screened (N = 481) In Jail Diversion (N = 356)1 Percent Male 73.7 68.7 Percent Female 26.3 31.3 Percent African American 28.4 29.7 Percent White 70.6 69.5 Percent under 20 years old 8.5 8.4 Percent age 21 – 24 20.0 20.3 Percent age 25 – 29 15.8 14.5 Percent age 30 – 34 15.1 15.4 Percent age 35 – 39 11.1 9.6 Percent age 40 – 44 11.3 11.1 Percent age 45 – 49 9.0 10.5 Percent age 50 and over 9.4 9.9 On Probation at Time of Screening 46.4% (n=217) 57% (n=203) Pre-Trial Release N/A 11.5% Primary Mental Health Diagnosis Mood/Adjustment Disorder Psychotic Disorder
68.4% 20.9%
66.6% 23.8%
1 N varies by one to three cases due to missing values on some variables.

9
Figure 1 depicts the numbers of women and men who were screened for diversion, diverted from
jail, or not diverted. From 2007 to 2011, female inmates were more likely than men to be
diverted. The proportion of women in the diversion program was 16 percent higher than
proportion of women screened. By contrast, the proportion of men diverted was only 4.4 percent
greater than the proportion of men screened. Though the correlation between being female and
placement in the diversion program was small (r =.119), it was statistically significant (p = .01).
Figure 1 Program Diversions by Gender
The age of the inmates placed in the jail diversion program ranged from 16 to 76 years old.2 The
mean age for the entire sample was 33.6 and the median age was 31. Individuals who were
screened but not placed in the program were slightly younger, with a mean age of 32.2 and a
median age of 30. The bar chart in Figure 2 shows that the age distribution of the sample
2 For this analysis, age refers to how old an inmate was at the time s/he was screened for the jail diversion program.
0
50
100
150
200
250
300
350
400
450
500
Screened Diversion NoDiversion
345
241
101
134
110
24 Num
ber o
f Ind
ivid
uals
Male Female

10
population generally fits the “age/crime curve” frequently reported. Among the inmates
screened, 44.3 percent were younger than 30 years old. Among those diverted, 43.2 fell within
that age range. Approximately, 30 percent of the entire sample and 32 percent of those diverted
were in the three oldest age categories. Fewer than ten percent of the screened and diverted
inmates were age 50 or older. The differences between the ages of the individuals who were
screened and those diverted were not statistically significant.
Figure 2 Age Distribution
The percentages of whites and African Americans are virtually identical across the categories of
inmates screened, diverted from jail, or not diverted from jail. In other words, placement in the
diversion program is proportionate by race given the persons considered. In 2010, 8.9 percent of
Black Hawk County residents were African Americans and 85.6 percent were white (U.S.
Census Bureau 2014). African Americans were overrepresented by a factor of 3.2 for inmates
29
70
50 53
33 39
36
19 19
10 5
0
10
20
30
40
50
60
70
80
Under 20 20 - 24 25 -29 30 - 34 35 -39 40 - 44 45 -49 50 - 54 55 - 59 60 - 64 65 andolder
Num
ber o
f Ind
ivid
uals
Age Increments

11
screened and 3.3 for those diverted. However, the over representation is consistent with both
statewide and national trends. For example, in 2010 African American were approximately three
percent of Iowa residents (U.S. Census Bureau 2014) and 14 percent of those under community
based supervision by the Iowa Department of Corrections (Iowa Department of Corrections
2010).
Figure 3 Program Diversion by Race
All of the individuals placed in the jail diversion program were diagnosed with at least one form
of mental illness. The bar chart in Figure 4 shows the distribution of diagnoses for individuals
who were screened and those who were diverted. About two-thirds of diversion participants
were classified with a primary diagnosis of bipolar disorder, depression, severe anxiety, or other
mood/adjustment disorder. The next largest category was comprised of psychotic disorders and
accounted for about 24 percent of the individuals who were diverted. Among this portion of
offenders, schizophrenia, paranoid type, was the most commonly reported diagnosis, followed by
0%
20%
40%
60%
80%
100%
Screened
Diversion
No Diversion
70.6
69.5 73.6
28.4 29.7
24.8
Perc
ent D
iver
ted
White Black Native Am.

12
undifferentiated psychotic symptoms. Individuals with psychotic diagnoses were slightly more
likely to be selected into the program at screening. About 84 percent of the screened individuals
with some form of psychosis or psychotic symptoms were placed in the program, compared to
about 66 percent of those with bipolar, depression, or anxiety conditions. The difference is
statistically significant (Chi-square = 7.436, p = .024).
Figure 4 Primary Psychiatric Diagnosis
Social and psychological needs linked to criminal offending and the extent to which an offender
poses a risk to public safety are key determinants in decisions related to placing offenders on
community based supervision. The most widely accepted method for measuring variation in
these factors is the Level of Service Inventory-Revised (LSI-R). Responses to the LSI-R
instrument are used to identify criminogenic needs and to quantify the risk of recidivism. The
54-item instrument is administered by trained assessors and evaluates offenders across the
68.4 66.6
20.9 23.8
7.7 7.4 2.9 2.3
0
10
20
30
40
50
60
70
80
Screened Placed in Jail Diversion
Perc
enta
ge
Mood/Adjustment Psychotic Brain Function Attention Deficit
13
following areas: criminal history, education/employment, finances, family/marital issues,
housing accommodations, leisure/recreation, companions, alcohol/drug problems,
emotional/personal issues and attitudes/orientation.
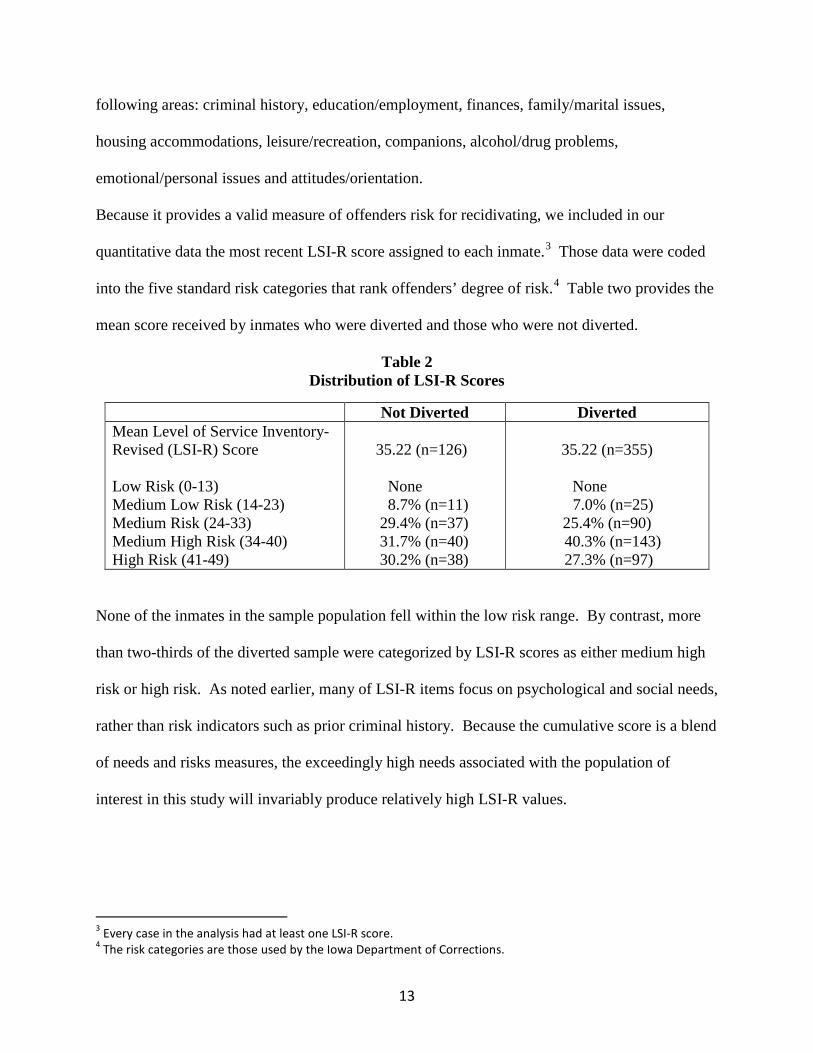
Because it provides a valid measure of offenders risk for recidivating, we included in our
quantitative data the most recent LSI-R score assigned to each inmate.3 Those data were coded
into the five standard risk categories that rank offenders’ degree of risk.4 Table two provides the
mean score received by inmates who were diverted and those who were not diverted.
Table 2 Distribution of LSI-R Scores
Not Diverted Diverted Mean Level of Service Inventory-Revised (LSI-R) Score Low Risk (0-13) Medium Low Risk (14-23) Medium Risk (24-33) Medium High Risk (34-40) High Risk (41-49)
35.22 (n=126) None 8.7% (n=11) 29.4% (n=37) 31.7% (n=40) 30.2% (n=38)
35.22 (n=355)
None
7.0% (n=25) 25.4% (n=90)
40.3% (n=143) 27.3% (n=97)
None of the inmates in the sample population fell within the low risk range. By contrast, more
than two-thirds of the diverted sample were categorized by LSI-R scores as either medium high
risk or high risk. As noted earlier, many of LSI-R items focus on psychological and social needs,
rather than risk indicators such as prior criminal history. Because the cumulative score is a blend
of needs and risks measures, the exceedingly high needs associated with the population of
interest in this study will invariably produce relatively high LSI-R values.
3 Every case in the analysis had at least one LSI-R score. 4 The risk categories are those used by the Iowa Department of Corrections.

14
The LSI-R scores for primary mental health diagnoses helps clarify the relationship between
inmates’ needs and their risk categories. As shown in Table 3, LSI-R scores increase in
accordance with the severity of inmates’ mental health condition.
Table 3 Primary Mental Health Category by LSI-R Scores
Primary Mental Health Category Average LSI-R Score Impaired Intellectual Functioning 33.68 Mood Disorder 34.73 Psychotic Disorder 37.43
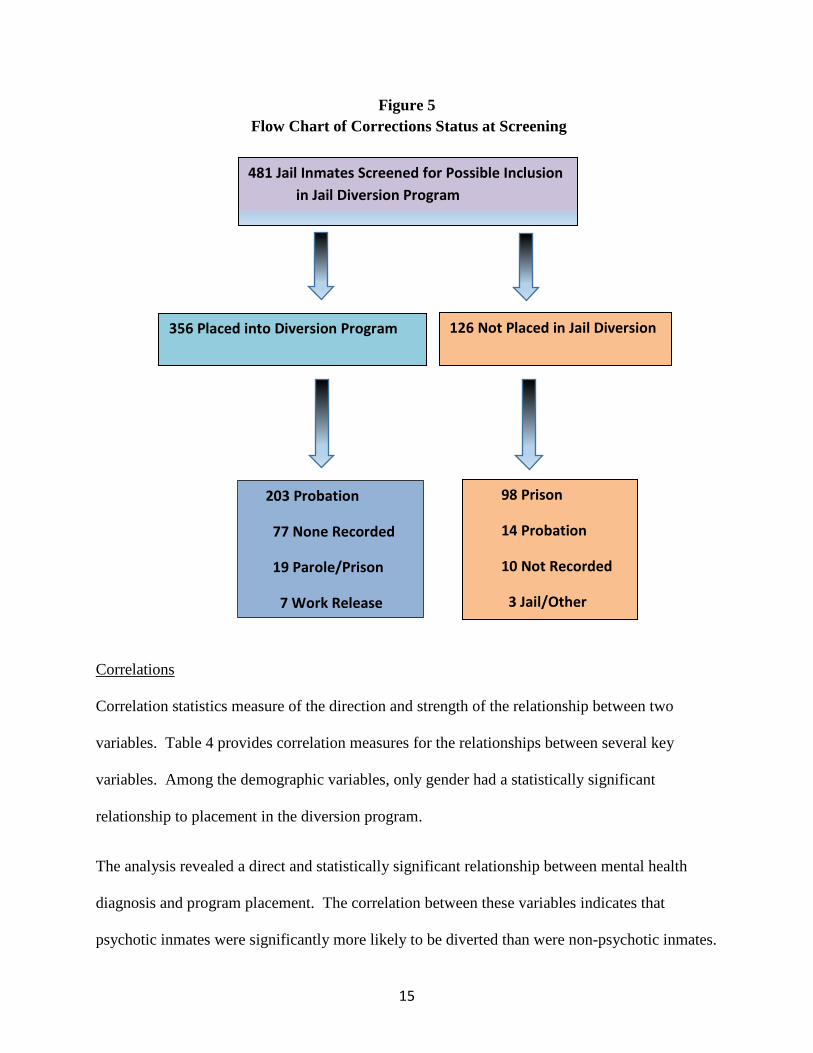
Figure 5 provides a flow chart for the correctional status of inmates at the time they were
screened. The flow chart shows that in contrast to the majority of diverted inmates who were on
probation when they were screened, 77 percent (n=98) of the non-diverted sample had the
designation of “prison.” Though we did not have detailed information for these cases, these
individuals were probably awaiting transfer to prison. Except for special circumstances the
prison designation probably made them ineligible for diversion.
To help measure program efficacy we collected data for arrests on new criminal charges that
occurred during the two years after inmates were screened for diversion. During that time frame,
68 percent of diverted inmates received a new arrest. This equated to .69 arrests per diverted
inmate. We also calculated similar outcomes for the much smaller sample of non-diverted
inmates (n=15). The mean number of arrests for inmates who did not participate in the diversion
program equaled 2.31.
15
Figure 5 Flow Chart of Corrections Status at Screening
Correlations
Correlation statistics measure of the direction and strength of the relationship between two
variables. Table 4 provides correlation measures for the relationships between several key
variables. Among the demographic variables, only gender had a statistically significant
relationship to placement in the diversion program.
The analysis revealed a direct and statistically significant relationship between mental health
diagnosis and program placement. The correlation between these variables indicates that
psychotic inmates were significantly more likely to be diverted than were non-psychotic inmates.
481 Jail Inmates Screened for Possible Inclusion in Jail Diversion Program
356 Placed into Diversion Program 126 Not Placed in Jail Diversion
203 Probation
77 None Recorded
19 Parole/Prison
7 Work Release
98 Prison
14 Probation
10 Not Recorded
3 Jail/Other

16
In terms of correctional status disposition, inmates in the diversion program were significantly
more likely to be on probation whereas inmates who were not diverted were more likely to have
a prison sentence. A large part of the inverse relationship between the prison designation and
diversion is probably due to the severity of instant offenses and/or criminal histories among
prison designated inmates who were not chosen for diversion. There was no correlation between
LSI-R scores and whether inmates were accepted into the jail diversion program. In addition,
there were no significant correlations between LSI-R and race, age, or gender.
Table 4 Correlation Outcomes (Pearson’s r Coefficients)
Variable: Pearson r Comments Gender .119** Female arrestees more likely to be put into jail
diversion. Age .055 No correlation between age and diversion. Race Nonwhite White
-.036 .049
No correlation between race and diversion
Mental Health Diagnostic Category
.119** Of arrestees screened, those placed in jail diversion are slightly more likely to have psychotic symptoms
Prison -.768*** Those in jail diversion far less likely to receive prison sentence
Probation .398*** Those in jail diversion are more likely to have received probation as a case disposition
LSI-R .000 No correlation between LSI-R and diversion Days in Jail -.254** Those in jail diversion spent an average of 36 days in
jail; those not diverted averaged 87.5 days in jail *significant at p = .05 **significant at p = .01 ***significant at p = .001
Part of the inverse relationship between diversion and jail days is explained by the number of
non-diverted inmates who had a prison designation. Those individuals accounted for 78 percent
of the non-diverted sample and were confined in jail for an average of 97 days. We believe that
that the large percentage of non-diverted inmates awaiting prison confinement had the effect of
inflating the inverse correlation between diversion and jail days confined.

17
The analysis also revealed a significant relationship between jail diversion and the number of
days inmates were confined in jail. Inmates diverted into the program spent almost three months
in jail. By contrast, diverted inmates were confined for five weeks.
To capture a more reliable measure of diversion efficacy we compared the average number of
jail days for diverted inmates to similar data collected for an analysis of the program’s first year.
The Black Hawk County Central Point of Coordination (CPC) office (now the Community
Services Office) collected data for jail days served by diverted inmates from February 2004 to
February 2005.5 Those data showed that during year one of the program, diverted inmates
served an average of 51 days in jail. That period of time exceeds by 15 days the average number
of jail days served by the diverted inmates included in our analysis.
An examination of annual number of jail days served by non-diverted inmates who did not have
the prison designation (n=23) produced results similar to the CPC’s 2004 - 2005 data. On
average, our non-diverted, no-prison designation inmates were confined in jail for 53 days. The
average difference between jail time served by that part of our sample and by our diverted
inmates equaled 17 days. That amount of time is similar to the difference between the diverted
inmates in the CPC analysis and the diverted inmates from our study. The consistency of these
results cause us to believe that 15 days is a conservative and valid estimate for the difference in
jail days served by the non-diverted and diverted inmates in our sample.
Logistic Regression Model
In addition to assessing the impact of program participation on days served in jail, we examined
differences in the total number arrests for criminal charges during the two year period prior to
5 A copy of the findings from the CPC analysis is included in the appendix.

18
being booked in jail and for two years after diversion.6 During the two years prior to being
booked into jail, diverted inmates had a total of 380 arrests for an average of 1.07 arrests per
offender. During the two year post release period, that number declined to 234 for an average of
.69 arrests per offender. In the two years following their release, diverted inmates had 38 percent
fewer arrests for criminal charges than they did during the two years prior to being booked into
jail. Given the high risk profile for this population, the two year decline in average arrests is
rather dramatic.
To further evaluate program efficacy we conducted a binary logistic regression analysis for post
diversion arrests. Binary logistic regression is a statistical method that measures the influence of
multiple independent variables upon a single dependent variable. This method is used for
evaluating the simultaneous effects that changes in the values of one or more independent
variables have on variation in the dependent variable. Logistic regression is employed when
those changes fit into two or more categories. The dependent variable in this analysis is a
categorical measure of arrest outcomes (arrested = 1, not arrested =0).
Logistic regression methods predict the odds that changes in an independent variable will
contribute to changes in the dependent variable, while controlling for the effects of other
variables. The significance of the contribution of each independent variable may be seen in the
Wald statistic. Regression coefficients are considered statistically significant if p < .05 or if the
Wald statistic exceeds a critical value of 2. The Exp (B) for each regression coefficient gives the
logs-odds ratio for the independent variables. Odds ratios greater than one indicate an increase
in the odds of being arrested, and ratios less than one indicate a decrease in the odds of being
arrested. 6 Arrests for probation or parole violations were not included.

19
Table 5 presents the results of the logistic regression model in which post diversion arrest is the
dependent variable. After controlling for gender, age, race, pre-trial release, and LSI-R score
one mental health variable was significantly related to whether inmates in the diversion program
received a new arrest after their release from jail. The logs-odds ratio (Exp B) shows that
psychotic offenders were more than six times less likely to receive a new arrest than were non-
psychotic offenders. This condition holds even after controlling for the significant effects of age
and LSI-R scores. The model shows that the diversion program produced a significant decline in
the likelihood that upon release from jail the highest risk offenders would be arrested for new
criminal charges.
Table 5 Logistic Regression Predicting Post-Diversion Arrest
Independent Variable B Wald Sig. Exp (B)
Gender Age Race Psychotic Pre-Trial Release LSI-R Score
.310
-.031
-20
-.392
-.396.
.061
1.29
9.02
4.86
6.71
1.14
11.41
.256
.003**
.089
.01***
.287
.001***
1.36
.969
.000
.675
.673
1.06
*significant at p = .05 **significant at p = .01 ***significant at p = .001
Costs - Benefits Assessment
To assess the costs and benefits of the jail diversion program we compared annual program costs
to estimates of annual fiscal savings linked to program efficacy. Potential benefits include fiscal

20
savings related to arrests, jail confinement, judicial and correctional interventions, and
psychotropic medications.
During the two year period that preceded being booked into jail, diverted inmates had a total of
380 arrests. In the two years after their diversion they were arrested a total of 243 times. The
average number of arrests per diverted inmate declined from 1.07 to .69. The data set for this
analysis did not permit us to calculate arrest totals based on a one year periods prior to booking
and post-diversion. To arrive at annual arrest estimates we divided the bi-annual totals in half.
This approach provided a baseline estimate of 190 arrests for the pre-booking year of 190 arrests.
For the post-diversion year, we estimated a total of 117 arrests. From these numbers, we
estimate that during one year of diversion inmates had 73 fewer arrests than they did during one
year prior to being booked into jail.
To calculate cost benefits associated with the reduction in arrests we relied upon widely cited
cost benefit analyses published by Washington State Institute for Public Policy and the Oregon
Criminal Justice Commission.7 After adjusting for inflation, we estimate costs per arrest to be
$765. Based on that estimate, 73 fewer arrests during the post-diversion year produces an
estimated savings of $55,845.
For every reduction in arrests, fewer tax dollars are spent for judicial and correctional
interventions. To estimate post-arrest criminal justice savings we referred to 2014 cost estimates
produced by the Iowa Legislative Services Agency (LSA) for correctional interventions (prison,
probation, and parole), public defender costs and the judicial branch (Lyons 2014). The estimates
7 Given the variation in types of arrests, cost per arrest estimates are complex. Our calculations are based on estimates in the Washington State Institute for Public Policy’s report, The Comparative Costs and Benefits of Programs to Reduce Crime (Aos, Phipps, Barnoski, and Leib 2001) and related estimates from Cost-Benefits Methodology published by State of Oregon Criminal Justice Commission (Wilson 2011).

21
do not include costs associated with prosecution or jail operations. For post arrest cost estimates,
the LSA separates cost ranges into the following categories: simple misdemeanors $30 - $300;
serious misdemeanors $210 - $4,500; aggravated misdemeanors $2,000 - $6,700; class D
felonies $4,800 - $11,800; class C felonies $5,800 - $18,400; class B felonies $7,500 - $35,000.
Three steps were taken to reduce the likelihood of overestimating post-arrests savings. First, we
included calculations only for misdemeanor cases. Second, our cost estimates are based upon the
number of dollars for only one-third of the range for each category. For example, the cost range
for a simple misdemeanor is $270. Therefore, our estimated cost for each simple misdemeanor
case is $90. Third, we weighted our case categories in favor of the less costly misdemeanors.
Based on the estimate that diverted offenders committed 73 fewer crimes during a single year of
diversion, we presumed the following distribution of cases: 36 simple misdemeanors, 24
aggravated misdemeanors, and 13 aggravated misdemeanors. Based on this model, we estimate
one year of post diversion cost savings for arrests at $57,926.
Our post-arrest cost estimate does not include costs for prosecutions, felony crimes, prison costs
or government funded medical costs for crime victims. For this reason, they underestimate the
cost savings for post-arrest interventions. For example, the 2013 Iowa Department of
Corrections Annual Report places the per day cost of prison confinement at $86.35. For each
offender the diversion program helped to keep out of prison for one year, Iowa taxpayers saved
$31,517. Because we included only misdemeanor case categories, our post arrest estimate does
not include cost savings related to prison confinement. Had we included savings for only two
felony imprisonments with one year periods of incarceration our post arrest estimate would have
increased by approximately $63,000.

22
According to Black Hawk County Sheriff’s officials, inmates are confined in jail at the cost of
$85 per day (Teisinger 2014). We estimate that, on average, inmates diverted into the mental
health program are confined for 15 fewer days than non-diverted inmates. At 82 diversions per
year the current program produces an estimated annual reduction of 1,230 jail days for mentally
ill offenders. Based on that number of days, we estimate the mental health diversion program
annually produces a $104,550 reduction in spending for jail confinement.
During jail confinement, mentally ill inmates are typically receive daily doses of various
psychotropic medications. According to the health care contractor who delivers medical services
for jail inmates, the monthly expenditure for psychotropic medicines per inmate is $19.50.
Based on an average 82 diversions per year, we estimate that the diversion program reduces the
Sheriff’s office pharmaceutical costs by $19,188 per year (Teisinger 2014).
The total estimate for annual cost savings produced by the mental health jail diversion program
is $237,509. According to the officials from the First Judicial District Department of
Correctional Services, annual program costs are $100,000. Therefore, the annual fiscal benefit
of the program (without cost estimates for prosecutions, prison confinement, and taxpayer
funded victimization programs) is estimated at $137,509.
DISCUSSION OF QUANTITATIVE FINDINGS
The quantitative data show that two-thirds of the inmates diverted into the mental health program
were white males most of whom were younger than 30 years old. Women were under
represented in the study population, however, they were significantly more likely to be placed in
the diversion program. This is not surprising given the findings from previous studies that

23
female jail inmates are significantly more likely than males to be diagnosed with a serious
mental illness (National GAINS Center 2001; Stedman and Naples 2005; Baillargeon et al 2009).
For two-thirds of the diverted sample, the primary mental health diagnoses was a mood disorder
(e.g., bi-polar, depressive, anxiety, etc.). Approximately one-fourth of the sample had a primary
diagnoses of psychotic disorder. Schizophrenia, paranoid type was the most common psychotic
condition.
Research analyses related to mental health jail diversions do not consistently aggregate the
mental health diagnoses of their population samples. For example, Stedman and Naples study of
diversion programs in eight states found that diverted offenders were more likely, “to have a
primary diagnosis of schizophrenia or a mood disorder with psychotic features.” Shafer, Arthur,
and Franczak’s analysis of jail diversions among inmates with co-occurring disorders reported
that, “53% of the study participants were identified as having an Axis I diagnosis that was
consistent with a mood disorder; 47% were diagnosed with schizophrenia or a related disorder.”
The mental health categories employed in the above studies are much different from each other
and from the categories used in our analysis. Given these inconsistencies we are not able to
comment on the extent to which the distribution of mental health diagnoses in our study matches
the distribution of diagnostic outcomes for the general population of diverted inmates.
All of the inmates in the analysis had at least one prior probation. Approximately 46 percent
were on probation at the time they were screened for the program. Among those diverted, 57
percent were on probation. The mean LSI-R score for diverted inmates was virtually equal to the
average score of inmates who were not diverted. The LSI-R findings indicate a higher

24
percentage of medium-high risk and high risk scores (67.6 percent) among diverted inmates. For
non-diverted inmates 61.9 percent received a score that was medium-high or high.
The risk findings should be interpreted with caution. LSI-R scores incorporate data about
offenders’ social and psychological needs. For this reason, the average risk score for a sample of
mentally ill offenders can be expected to exceed the average score for the general population of
adults on probation or parole.
Correlation statistics reveal a significant relationship between the primary diagnosis of psychotic
disorders and diversion. Among inmates screened, those with psychotic disorders were more
likely to be diverted than offenders with less severe mental health problems. A second key
correlation is the significant relationship between diversion and days in jail. Diverted inmates
spent 36 fewer days in jail than non-diverted inmates. However, we have noted that the large
percentage of non-diverted inmates awaiting prison confinement probably inflates the
appearance of a program treatment effect. We are not able to specify precisely how many of the
36 fewer jail days were due to the treatment effects of the program.
Because of the ambiguity related to jail days we incorporated three additional comparisons. The
first of these indicated that diverted inmates had 15 fewer days of confinement than non-diverted
inmates who did not have a prison designation. With the second comparison we found that
diverted inmates in our analysis served 17 fewer jail days than the diverted inmates who were
included in the 2004 - 2005 Central Point of Coordination study. The third comparison is to
Broner et al’s 2004 multisite study of post-release jail diversion. That analysis found that twelve
months after release, diverted inmates had 16 fewer jail confinement days than non-diverted

25
inmates. The consistency of these comparisons indicate that 15 fewer jail days for diverted
inmates is a more reliable estimate than 36 fewer jail days.
To create an additional measure of program efficacy we collected data on arrests for new
criminal charges that occurred two years after inmates were screened for diversion. During the
two year post-release period, the total number of arrests per diverted inmate declined 36 percent,
from 380 to 243 and the average number of arrests per inmate declined from 1.07 to .69. These
findings indicate that the diversion program helped to reduce the likelihood of criminal
recidivism. It also helps to explain why diverted inmates served fewer days in jail after diversion
than they did prior to being booked. The re-arrest finding is consistent with Shaffer et al.’s 2004
finding that diverted inmates had significantly lower re-arrest rates than their non-diverted
counterparts.
Findings from the logistic regression analysis for new arrests are consistent with the view that
the diversion program reduced the likelihood of new arrest for the highest risk inmates. After
controlling for the significant effects of age and LSI-R score, diverted inmates with a primary
diagnosis of a psychotic disorder were less likely to be arrested than diverted inmates who did
not have a psychotic disorder.
The totality of quantitative findings indicate that Black Hawk County’s mental health diversion
program is effective at reducing criminal recidivism among mentally ill inmates. Moreover the
public safety benefits are attained while simultaneously reducing taxpayer costs for criminal
justice interventions by $237,509.

26
QUALITATIVE ANALYSIS
Qualitative data were acquired from confidential structured interviews with nine respondents
involved directly with the jail diversion program. The interviewees included probation/parole
officers from the First Judicial District of Department of Correctional Services and officials
employed by the Black Hawk County Sheriff’s Office, Black Hawk County Attorney’s Office,
Black Hawk County Public Defender’s Office, Black Hawk-Grundy Mental Health Services,
Cedar Valley Community Support Services and Black Hawk County Social Services. Interviews
ranged from 45 minutes to 90 minutes in length. Each interview was audio taped and transcribed
verbatim into written text. The interview data were analyzed using cross coding methods that
evaluate the extent to which analytical themes are reported consistently by most of the
interviewees.
Analysis of the interview data found consistent support for the following themes.
1. The mental health diversion program is a major improvement over earlier interventions with
mentally ill jail inmates. Interventions prior to the existing program relied upon a fragmented
and informal process that resulted in much lengthier periods of jail confinement, significantly
less community and social support upon release, higher numbers of re-arrests and quicker
returns to jail.
2. All of the interviewees agreed that the diversion program is effective in reducing the
likelihood of re-arrest among mentally ill inmates released from jail.
3. Interviewees familiar with jail operations agreed that the program has reduced the potential for
disruptive behavior within the jail.

27
4. The program works because it offers a structured and well integrated process that quickly
connects diverted inmates with a variety of social and community services.
5. The program coordinator provides the foundation for the program’s success. The coordinator
possesses extensive knowledge about the treatment population and has a strong commitment to
reducing recidivism among mentally ill offenders. At the level of service delivery she screens
inmates who are candidates for diversion, arranges initial referrals, and in some cases works
directly with diverted inmates. At the organizational level she understands fully the resources,
responsibilities and limitations of agencies integral to the program. The coordinator’s
relationships with criminal justice officials and service providers have fostered the development
of a well-organized program that collaborates as an effective partner with collateral agencies.
6. The current program coordinator has additional probation/parole responsibilities that extend
beyond the diversion program per se. Interviewees generally agreed that the program would
benefit from additional staff support.
CONCLUSIONS AND RECOMMENDATIONS
Based on our quantitative and qualitative analyses we believe the Black Hawk County mental
health diversion program is both effective and cost efficient. The statistical findings indicate
clearly that program participation contributed to reductions in recidivism among mentally ill
offenders. Those reductions were most likely to occur among psychotic offenders who pose the
highest risk to public safety and present the highest level of treatment needs. We conclude that
these successes are the product of a well-integrated program that provides appropriate levels of
treatment and supervision for diverted inmates.

28
The cost benefit analysis leads us to conclude that the program is cost efficient. Using
conservative estimates for savings related to arrests, post-arrests interventions, jail days and
psychotropic medications, we found that the net annual fiscal benefits of the program amount to
$137,509.
The qualitative data suggest that adding another staff person to the program could increase the
number of diversions and produce additional cost efficiencies. It is also possible that significant
efficiencies could be attained by augmenting the current effort with a pre-booking diversion
program. Pre-booking programs divert individuals from booking procedures. The focus on early
diversion seeks to address offenders’ criminogenic needs and avoid the use of jail confinement
altogether (Scherer: 2009). The pre-booking model is well suited for individuals who have
committed minor offenses. A 2013 study by Crowell et al found that, “pre-booking diversion for
people with serious mental illness saved $2,819 per person in cumulative taxpayer costs over the
2 years after the point of diversion.”
Black Hawk County’s existing mental health jail diversion program is producing significant
success in both public safety and taxpayer savings. We recommend that consideration be given
to either growing the program or augmenting it with pre-booking model.

APPENDIX
29

30
31
REFERENCES
Aos, Steve, Polly Phipps, Robert Barnoski, Roxanne Lieb. 2001. The Comparative Costs and Benefits of Programs to Reduce Crime. Washington State Institute for Public Policy. Olympia, WA. Document No. 01-05-1201.
Baillargeon, Jacques, Ingrid A. Binswanger, Joseph V. Peen, Brie A. Williams, Owen J. Murray. 2009. Psychiatric Disorders and Repeat Incarcerations: The Revolving Prison Door. American Journal of Psychiatry 166: 103-109.
Broner, Nahama, Pamela K. Lattimore, Alexander Cowell, and William E. Schlenger. 2004. Effects of Diversion on Adults with Co-Occurring Mental Illness and Substance Use: Outcomes from a National Multi-Site Study. Behavioral Sciences and the Law 22: 519-541.
Crowell, Alexander, J., Jesse M. Hinde, Nahama Broner, and Arnie P. Aldridge. 2013. The Impact on Taxpayer Costs of a Jail Diversion Program for People with Serious Mental Illness. Evaluation and Program Planning 41: 31-37.
Iowa Department of Corrections. 2010. Annual Report FY 2010. Des Moines, IA.
Iowa Department of Corrections. 2013. Annual Report FY 2010. Des Moines, IA.
Lyons, Holly M. 2014. Correctional Impact Statements. Memorandum to Members of the Iowa General Assembly. Iowa Legislative Services Agency. Des Moines, IA. Retrieved May 15, 2014. https://www.legis.iowa.gov/docs/GA/85GA/Session.2/FiscalNotes/CorrectionalImpact/Correctional%20Impact%20Standard%20Statements.pdf.
National GAINS Center. 2001. The Prevalence of Co-Occurring Mental Illness and Substance Use Disorders in Jails. Fact Sheet Series. Delmar, NY.
Schafer, Michael. Brian Arthur and Michael Franczak. 2004. An Analysis of Post-Booking Jail Diversion Programming for Persons with Co-Occurring Disorders. Behavioral Sciences and the Law 22: 771-785.
Scherer, Rachel. 2009. Jail Diversion Programs for those with Mental Illness: An Emphasis on Pre-Booking Diversion and other Early Diversion Models. Mental Health Association in California. Sacramento, CA.
Stedman, Henry J. and Michelle Naples. 2005. Assessing the Effectiveness of Jail Diversion Programs for Persons with Serious Mental Illness and Co-Occurring Substance Abuse Disorder. Behavioral Sciences and the Law Vol. 234: 163-170.
Teisinger, Lance. 2014. Interview by author. Waterloo, Iowa. June 4, 2014.
United States Census Bureau. 2014. State and County Quick Facts. Washington, DC. Retrieved April 2, 2014 (http://www.quickfacts.gov/qfd/states/19000.html).

32
Wilson, Michael. 2011. 2011. Cost benefit Methodology. Oregon Criminal Justice Commission. Retrieved May 14, 2014 (http://www.oregon.gov/cjc/docs/cost_benefit_methodology_090106. .pdf).