health and safety statistics highlights 2001/02
TRANSCRIPT

Health and Safety
Statistics Highlights2001/02

H S C ’ S M I S S I O N S TAT E M E N T
To ensure that risks to
people’s health and safety
from work activities
are properly controlled
A National Statistics publication
National Statistics are produced to high
professional standards set out in the
National Statistics Code of Practice. They
undergo regular quality assurance reviews
to ensure that they meet customer needs.
They are produced free from any political
interference.

Introduction and contents 1
Work-related ill health 5Countries, Government Office Regions and HSE Field Operation Divisions 6Revitalising health and safety targets 7Revitalising priority sectors: agriculture 8Revitalising priority sectors: construction 9Revitalising priority sectors: health services 10Revitalising priority hazards: kinds of accident 11Revitalising priority hazards: types of ill health 12Injuries in the extractive and utility supply industries 13Injuries in the manufacturing industries 14Injuries in the service industries 15Kinds of accidents 16Asbestos-related diseases and cancers 17Respiratory diseases 18Skin and infectious diseases 19
The key new statistics are:��2001/02 figures on non-fatal injuries notified by employers and others under the Reporting of Injuries, Diseases and
Dangerous Occurrences Regulations (RIDDOR), supplemented by injury statistics from the Labour Force Survey (LFS).Comparable statistics of non-fatal injuries are only available from 1996/97 on the introduction of revised RIDDOR 95 (seesafety technical note).
��Headline results from the 2001/02 Self-reported Work-related Illness (SWI) household survey, together with ill health datafrom other sources including specialist doctors in the Occupational Disease Intelligence Network (ODIN) and assessedbenefit cases under the Industrial Injuries Scheme (IIS) (see ill health technical note).
These inform the measurement of progress against the three targets set in the Revitalising Health and Safety strategy (please see http://www.hse.gov.uk/statistics/statnote.pdf) and provide statistical information on the eight Priority Programmes identified by the Health and Safety Commission, as well as permitting a range of other analyses.
The statistics are derived from a number of different sources, some of which are surveys and are therefore subject to samplingerrors (because the estimates are based on a sample rather than the whole population). Where possible, “95% confidenceintervals” are quoted to indicate the range of uncertainty due to this: each of these shows the range of values which we are 95%confident contains the true value. Correspondingly, a difference between two estimates is described as “statistically significant” ifthere is a less than 5% chance that it is due to sampling error alone. Rates are expressed per 100 000 workers, employees, or self-employed people as appropriate.
This is the first year that health and safety statistics have been published in this way, in a slim Highlights publication backed up by awide range of detailed information available on the web. Our aim is to offer users a clearer means of presentation and moreconvenient access to the data than the large Health and Safety Statistics volume published in previous years. We would welcomefeedback on this new approach, or other aspects of the statistics, to the contacts given on the final page.
CONTENTS
Other occupational diseases and exposures 20Riskiest industries for injuries and ill health 21Dangerous Occurrences and Gas Safety 22Enforcement 23Injury tables 24 – 27Ill health tables 28 – 29Safety technical note 30Ill health technical note 31 - 32Contacts 32
Introduction and contents 1Fatal injuries - reported under RIDDOR 2Non-fatal injuries - reported under RIDDOR 3Non-fatal injuries - Labour Force Survey and reporting levels 4
INTRODUCTION
Health and Safety Statistics Highlights presents the latest top level statistics on workplace fatalities and injuries, and work-related illhealth in Great Britain. It also includes summary information on dangerous occurrences, gas safety and enforcement action by the Health and Safety Executive (HSE) and local authorities. More detailed data and commentary are available on HSE’s website athttp://www.hse.gov.uk/statistics. Statistics of fatalities and enforcement for 2001/02 have been released earlier in the year.
Fatal injuries – reported under RIDDOR 2 (See tables 1 & 4)
��
��
��
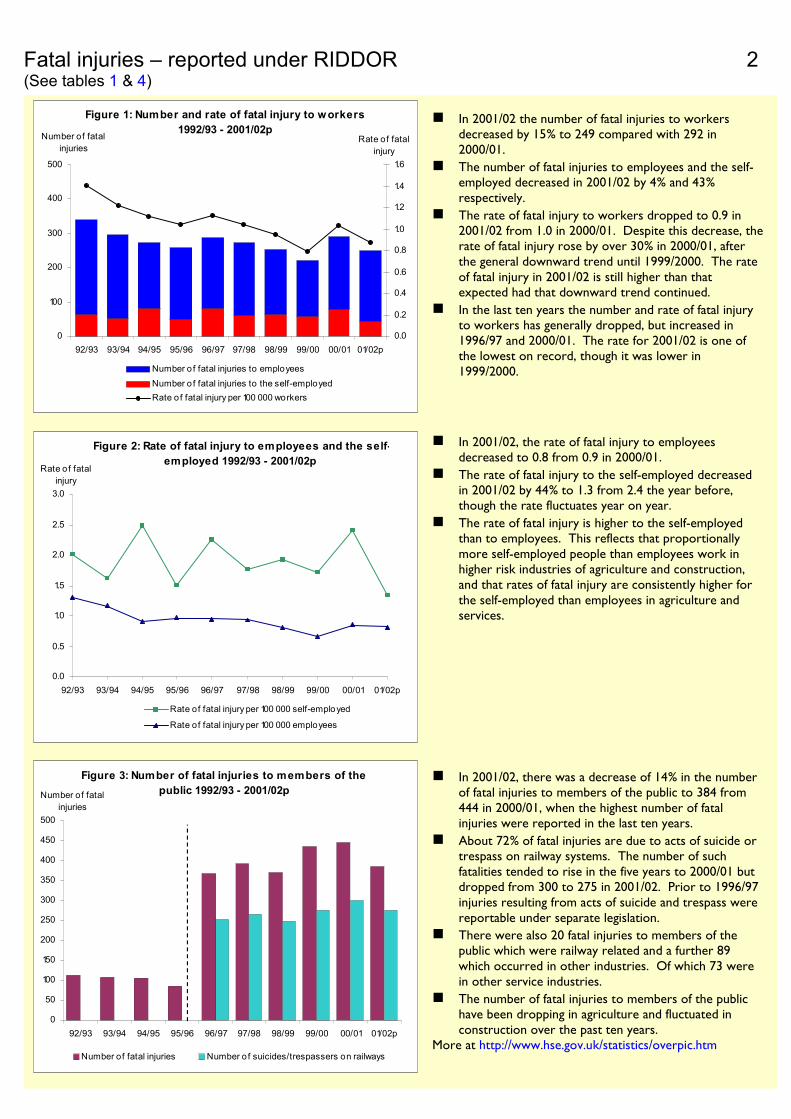
In 2001/02 the number of fatal injuries to workersdecreased by 15% to 249 compared with 292 in2000/01.The number of fatal injuries to employees and the self-employed decreased in 2001/02 by 4% and 43% respectively.The rate of fatal injury to workers dropped to 0.9 in2001/02 from 1.0 in 2000/01. Despite this decrease, therate of fatal injury rose by over 30% in 2000/01, afterthe general downward trend until 1999/2000. The rateof fatal injury in 2001/02 is still higher than thatexpected had that downward trend continued.
��
��
��
��
��
��
��
��
In the last ten years the number and rate of fatal injuryto workers has generally dropped, but increased in1996/97 and 2000/01. The rate for 2001/02 is one of the lowest on record, though it was lower in1999/2000.
In 2001/02, there was a decrease of 14% in the numberof fatal injuries to members of the public to 384 from444 in 2000/01, when the highest number of fatalinjuries were reported in the last ten years.About 72% of fatal injuries are due to acts of suicide or trespass on railway systems. The number of suchfatalities tended to rise in the five years to 2000/01 butdropped from 300 to 275 in 2001/02. Prior to 1996/97injuries resulting from acts of suicide and trespass werereportable under separate legislation.There were also 20 fatal injuries to members of the public which were railway related and a further 89 which occurred in other industries. Of which 73 were in other service industries.The number of fatal injuries to members of the publichave been dropping in agriculture and fluctuated inconstruction over the past ten years.
More at http://www.hse.gov.uk/statistics/overpic.htm
In 2001/02, the rate of fatal injury to employeesdecreased to 0.8 from 0.9 in 2000/01.The rate of fatal injury to the self-employed decreasedin 2001/02 by 44% to 1.3 from 2.4 the year before,though the rate fluctuates year on year.The rate of fatal injury is higher to the self-employedthan to employees. This reflects that proportionallymore self-employed people than employees work inhigher risk industries of agriculture and construction,and that rates of fatal injury are consistently higher forthe self-employed than employees in agriculture andservices.
Figure 1: Number and rate of fatal injury to w orkers1992/93 - 2001/02p
0
100
200
300
400
500
92/93 93/94 94/95 95/96 96/97 97/98 98/99 99/00 00/01 01/02p
Number of fatalinjuries
0.0
0.2
0.4
0.6
0.8
1.0
1.2
1.4
1.6
Rate of fatalinjury
Number o f fatal injuries to employeesNumber o f fatal injuries to the self-employedRate o f fatal injury per 100 000 workers
Figure 2: Rate of fatal injury to employees and the self-employed 1992/93 - 2001/02p
0.0
0.5
1.0
1.5
2.0
2.5
3.0
92/93 93/94 94/95 95/96 96/97 97/98 98/99 99/00 00/01 01/02p
Rate o f fatalinjury
Rate of fatal injury per 100 000 self-employed
Rate of fatal injury per 100 000 employees
Figure 3: Number of fatal injuries to members of thepublic 1992/93 - 2001/02p
0
50
100
150
200
250
300
350
400
450
500
92/93 93/94 94/95 95/96 96/97 97/98 98/99 99/00 00/01 01/02p
Number of fatalinjuries
Number of fatal injuries Number o f suicides/trespassers on railways

Non-fatal injuries – reported under RIDDOR 3 (See tables 2, 3 & 4)
��
��
��
��
The number of reported non-fatal injuries to membersof the public decreased by 31% to 14 362 in 2001/01from 20 836 in the previous year. There has been ageneral downward trend in the number of non-fatalinjuries since 1996/97.In 2001/02, 96% of the non-fatal injuries to members of the public occurred in the services sector. The numberof non-fatal injuries in the service sector has decreasedby 32% from 20 243 injuries in 2000/01 to 13 726injuries.Of 14 362 members of the public injuries in 2001/02,3497 (24%) occurred in education; 2430 (17%)occurred in land transport; 2230 (16%) occurred inretail and wholesale industries; and 1640 (11%) occurred in recreational and sporting activities.In construction the number of non-fatal injuriesincreased by 21% in 2001/02.
More at http://www.hse.gov.uk/statistics/overpic.htm
��The number of reported over-3-day injury to employeesdecreased by 5% in 2001/02 to 127 084 compared to 134 105 in the previous year. The final figure for 2001/02 allowing for late reports is expected to be lower than in 2000/01.
��
��
��
In 2001/02 the rate of over-3-day injury decreased by 6% to 506.3, the final figure for 2001/02 is expected to be lower than for 2000/01.The number of reported over-3-day injuries hasfluctuated in the past six years. However, the rate of over-3-day injury has decreased steadily since 1997/98,reflecting an increase in the number of employees.Injuries sustained to employees while handling, liftingand carrying accounted for 38% of over-3-day injuries in2001/02,
��Over-3-day injuries also occur as a result of slipping/tripping(23%), and being struck by a moving/falling object (13%).
��The number of reported major injuries to employeesremained steady at 27 477 in 2001/02, compared with27 524 in 2000/01. The figure for 2001/02 is provisionaland will be updated next year for late reports. The finalfigure is expected to show a small increase for majorinjuries in 2001/02. The rate of reported major injurydecreased by 0.6% to 109.5 in 2001/02 from 110.2 in2000/01. The finalised rate for 2001/02 is expected to show a small increase on 2000/01.
��
��
Longer term, the number of major injuries has changedrelatively little since the new reporting regulations were introduced in 1996/97. Since then the rate of majorinjury has decreased by 14%, reflecting an increase inthe number of employees since the mid 1990s.Since 1996/97, the rate of major injury has decreased inmain sectors apart from agriculture. Rates of employeemajor injury are highest in: mining/quarrying, utilities,forestry, railways, construction and some manufacturingindustries (see page 21), and lowest in most serviceindustries.
Figure 4: Number and rate of major injury toemployees 1992/93 - 2001/02p
0
5000
10000
15000
20000
25000
30000
35000
92/93 93/94 94/95 95/96 96/97 97/98 98/99 99/00 00/01 01/02p
Number of majorinjuries
0
20
40
60
80
100
120
140
Rate of majorinjury
Number o f reported major injuries to employees
Rate of reported major injury per 100 000 employees
Figure 5: Number and rate of over-3-day injury toemployees 1992/93 - 2001/02p
0
20000
40000
60000
80000
100000
120000
140000
160000
180000
92/93 93/94 94/95 95/96 96/97 97/98 98/99 99/00 00/01 01/02p
Number of over-3-day injuries
0
100
200
300
400
500
600
700
Rate of over-3-day injury
Number of reported over-3-day injuries to employees
Rate of reported over-3-day injury per 100 000 employees
Figure 6: Number of non-fatal injuries to members ofthe public 1992/93 - 2001/02p
0
5000
10000
15000
20000
25000
30000
35000
40000
92/93 93/94 94/95 95/96 96/97 97/98 98/99 99/00 00/01 01/02p
Number of non-fatal injuries
Number of reported non-fatal injuries to members of the public

Non-fatal injuries – Labour Force Survey and reporting levels 4 (See tables 2,3 & 5)
��Rates of reportable injury from the LFS are presentedmostly as three year averages, smoothing sampling errorfluctuations in the annual series, particularly for specificindustries. The averaged LFS rate is available for 1994/95to 2000/01 and the annual series for 1993/94 - 2001/02.
��The averaged LFS rates for reportable injury are generallyhigher than rates of reported non-fatal (major and over-3-day) injury, confirming suspected under reporting of non-fatal injuries. The averaged LFS rate for 2000/01 isestimated to be 1530 while the rate of reported non-fatalinjury is 647. The estimated level of reporting of employee injuries is based on the averaged LFS rate and is42.3% in 2000/01 (647/1530).
��
��
Rates of non-fatal injury for the self-employed aresubstantially lower. The rate of reported non-fatal injuryin 2000/01 is 41, indicating that self-employed peoplereport less than 3% of reportable injuries.The LFS and RIDDOR sources jointly provide a pictureon trends in non-fatal injury rates. The averaged LFS ratefell by 14% between 1994/95 to 1998/99 but has risensince then from 1490 to 1530 in 2000/01.
��The rate of reported non-fatal injury to employeesdropped 7% between 1994/95 to 1998/99 and continuedto fall in 2000/01 and 2001/02 (by a further 11%). Thiscontinued downward trend in rates of reported non-fatalinjury coupled with the small rise in the averaged LFSrates (to 2000/01) suggests reporting levels dropped in1999/2000 and 2000/01.
��The annual rates of reportable injury from the LFS willtell us about reporting in 2001/02. Annual rates of reportable injury from the LFS generally fell in the 1990suntil 1998/99, but have changed relatively little in the pasttwo years. However, the rate of reported non-fatalinjury to employees dropped 4.8% to 616 in 2001/02,suggesting that the reporting level dropped further in2001/02.
��
��
��
��
There is early evidence that reporting levels improved in2001/02 for some areas where under-reporting has been particularly severe. There were substantial increases inthe rates of reported major and over-3-day injuries to the self-employed, and to employees in agriculture and inbusiness services. A full judgement on reporting in theseand other specific industries will be possible when theaveraged LFS rate for 2001/02 is available next year.The longer term comparison between the rates of reportable injury from the LFS and rates of reportedinjury, suggest that reporting improved in the first twoyears (1996/97 and 1997/98) of the revised reportingregulations but has declined thereafter.The estimate of reporting level based on the averagedLFS rate, has fallen steadily from 47.4% in 1997/98 to 42.3% in 2000/01. Projecting this down ward trend givesa figure of 40.9% for the reporting level of employeeinjuries in 2001/02.The estimated reporting level for 2001/02 will be derivedfrom the averaged LFS rate for 2001/02 next year when the annual LFS rate 2002/03 is available. Despite the likely variation in the annual LFS rate it is expected thatthe estimate of the reporting level will still be lower in2001/02. The projected reporting level of 40.9% for 2001/02 will be used in this report.
More at http://www.hse.gov.uk/statistics/2002/lfsfct01.pdf
Figure 7: Rate of reported non-fatal injury to employees and the self-employed, and the averaged
LFS rate of reportable non-fatal injury to workers1994/95 - 2001/02p
0
200
400
600
800
1000
1200
1400
1600
1800
94/95 95/96 96/97 97/98 98/99 99/00 00/01 01/02p
Rate o f non-fatalinjury
Averaged LFS rate o f reportable non-fatal injury per 100 000 workersRate o f reported non-fatal injury per 100 000 employeesRate o f reported non-fatal injury per 100 000 self-employed
Figure 8: Rate of reported non-fatal injury to employees and the averaged and annual LFS rate of
reportable non-fatal injury to workers 1993/94 -2001/02p
400
600
800
1000
1200
1400
1600
1800
2000
93/94 94/95 95/96 96/97 97/98 98/99 99/00 00/01 01/02p
Rate o f non-fatalinjury
Annual LFS rate o f reportable non-fatal injury per 100 000 workersAveraged LFS rate o f reportable non-fatal injury per 100 000 workersRate of reported non-fatal injury per 100 000 employees
Figure 9: Reporting percentage of reportable non-fatal injuries to employees from the annual and
averaged LFS 1994/95 - 2001/02p
35
37
39
41
43
45
47
49
94/95 95/96 96/97 97/98 98/99 99/00 00/01 01/02p
Reportingpercentage
Reporting percentage o f employees from the annual LFS rateReporting percentage of employees from the averaged LFS rate
- - - - Averaged LFS rate projected for 2001/02

Work-related ill health 5 N
��
��
��
SWI01/02 estimated that 32.9 million working days were lost in the previous 12 months through illness caused or made worse by work. On average each person suffering took an estimated 22.9 days off in that 12 month period. Stress, depression or anxiety and musculoskeletal disorders accounted for 13.4 and 12.3 million days respectively. Average annual days lost per case for stress, depression or anxiety (29.2 days per case) was higher than for all work-related illness (the difference was statistically significant). The figure for annual working days lost is higher than estimated by the SWI95 survey (18.0 million). It is difficult to know how much of this can be explained by
��A new self-reporting household survey carried out in 2001/02 (SWI01/02) estimated that 2.3 million individuals in Great Britain were suffering from an illnesswhich they believed was caused or made worse by their current or past work. This prevalence estimate includeslong standing as well as new cases.
��
��
��
��
The most common types of illness were musculo-skeletal disorders (affecting an estimated 1 126 000 people) and stress, depression or anxiety (563 000 people), followed by breathing and lung problems (168 000) and hearing problems (87 000). Self-reporting surveys give the most broadly-based estimates of work-related illness prevalence, but alternative perspectives come from other sources (presented later in this document).
More at http://www.hse.gov.uk/statistics/pdf/swi01.pdf
Comparisons between the latest figures and those from HSE’s previous three SWI surveys have to be based on a restricted coverage (e.g. limited to people who worked in the last 12 months), and even on this basis are affected by differences in survey design. These comparisons suggest that the rate of self-reported work-related illness prevalence in 2001/02 wassomewhat higher than in 1998/99, but still below the levels in 1990 and 1995 (all these differences were statistically significant).
��
��
The estimated prevalence rate of stress and related (mainly heart) conditions has increased over time and is now around double the level it was in 1990. Musculoskeletal disorders had a higher prevalence rate in 2001/02 than in 1998/99, but lower than a decade ago (again, the differences were statistically significant).
More at http://www.hse.gov.uk/statistics/pdf/swi05.pdf and http://www.hse.gov.uk/statistics/pdf/swi06.pdf
Figure 10: Estimated prevalence of self-reported work-related illness, 2001/02
0 100 200 300 400 500 600
Headache/eyestrain
Hearing problems
Breathing/lung problems
Heart disease/attack,o ther circulatory
Stress/depression/anxiety
lower limbs
upper limbs/neck
back
Thousands
Central estimate 95% confidence intervalNote: See Table 21 on Page 28 for detailed data and definitions.
All disease groups:2 328 thousand(95% confidence interval: 2 261 to 2 394 thousand)
M usculoskeletal disorders mainly affecting:
Figure 11: Estimated prevalence rate of self-reported work-related illness, restricted to people who
worked in the last 12 months in England and Wales
0
1000
2000
3000
4000
5000
6000
7000
1990 1995 1998/99 2001/02
Rate per 100 000
Total M usculoskeletal disorders Stress and related conditions95% confidence interval
Note: See Table 22 on Page 28 fo r detailed data and definitions.
Figure 12: Estimated w orking days lost due to w ork-related ill health
0
10
20
30
40
50
60
70
Days lost (millions)
0
5
10
15
20
25
30
35
Average days lost per case
Da
Note:
ulo-
ta
l er
s
s,
sion
ie
ty
ulo-
ta
l er
s
s,
sion
ie
ty
al
1995
ys lost (millions) Average days
95% confiden95% confidence interval
Estimates for 1995 and 2001/02 are not compara
Tot
Mus
cSk
ele
Dis
ord
Stre
sD
epre
sor
anx
al
32
technical differences and how much is a true increase. Some of it, however, does appear to be due to an increase in absence durations: the average days off per case in 1995 was 13.9. The rise in the prevalence of stress, depression or anxiety over time will also have contributed.
More at http://www.hse.gov.uk/statistics/pdf/swi04.pdf
2001/02
lost per case
ce interval
ble. See Table 24 on Page 29
Tot
Mus
cSk
ele
Dis
ord
Stre
sD
epre
sor
anx

Countries, Government Office Regions and HSE Field Operation Divisions 6
Wales and South West
368 000 38
3744
More at:http://www.hse.gov.uk/statistics/regions/index.htm andhttp://www.hse.gov.uk/statistics/pdf/swi02.pdf
NorthEast106 000 151314
Yorkshireand the Humber236 000 202921
North West
266 000273283
Wales135 000 181599
WestMidlands232 000 192514
EastMidlands165 000 252363
Midlands 397 000 44
4877
Yorkshire andNorth East
342 000 35
4235
East205 000 152354
East andSouth East
524 000 46 5792
SouthEast319 000 313438
SouthWest234 000 202145
The injury figures above exclude 6 worker fatalities and 53 major injuries to employees that were reported to HazardousInstallations Directorate’s Offshore Safety Division; 5 worker fatalities and 308 major injuries to employees reported to the Railway Inspectorate, and 18 major injuries to employees where the location of the incident is not recorded.
London256 000 212431
Scotland174 000 272736
For 2001/02
Countries, Government OfficeRegions (GOR) and HSE FieldOperation Divisions (FOD):
Self-reported ill health prevalenceestimated from SWI 01/02Number of fatal injuries to workers in2001/02pNumber of major injuries to employees in2001/02p
Revitalising Health and Safety targets 7 ��
��
��
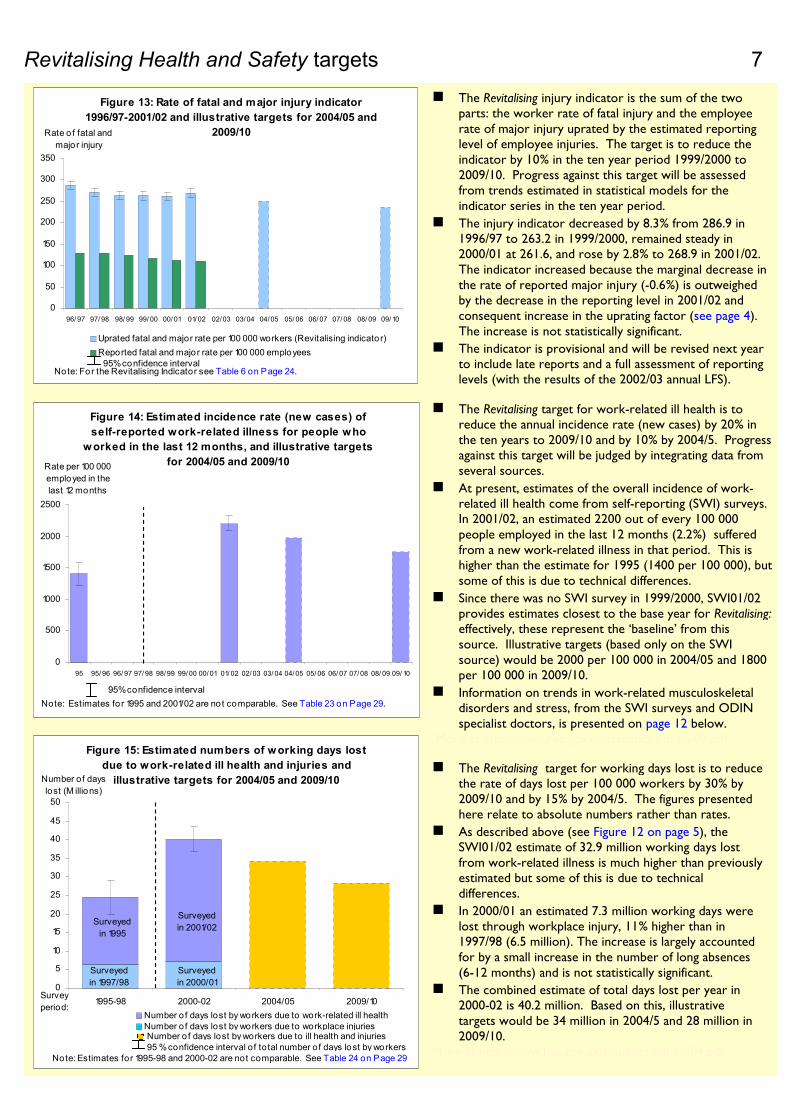
��The Revitalising target for work-related ill health is to reduce the annual incidence rate (new cases) by 20% inthe ten years to 2009/10 and by 10% by 2004/5. Progressagainst this target will be judged by integrating data fromseveral sources.
��At present, estimates of the overall incidence of work-related ill health come from self-reporting (SWI) surveys.In 2001/02, an estimated 2200 out of every 100 000 people employed in the last 12 months (2.2%) sufferedfrom a new work-related illness in that period. This is higher than the estimate for 1995 (1400 per 100 000), butsome of this is due to technical differences.
��Since there was no SWI survey in 1999/2000, SWI01/02provides estimates closest to the base year for Revitalising:effectively, these represent the ‘baseline’ from thissource. Illustrative targets (based only on the SWIsource) would be 2000 per 100 000 in 2004/05 and 1800 per 100 000 in 2009/10.
��
��
Information on trends in work-related musculoskeletaldisorders and stress, from the SWI surveys and ODINspecialist doctors, is presented on page 12 below.
More at http://www.hse.gov.uk/statistics/pdf/swi03.pdf
The Revitalising target for working days lost is to reducethe rate of days lost per 100 000 workers by 30% by2009/10 and by 15% by 2004/5. The figures presentedhere relate to absolute numbers rather than rates.
��As described above (see Figure 12 on page 5), the SWI01/02 estimate of 32.9 million working days lostfrom work-related illness is much higher than previouslyestimated but some of this is due to technicaldifferences.
��
��
In 2000/01 an estimated 7.3 million working days werelost through workplace injury, 11% higher than in1997/98 (6.5 million). The increase is largely accountedfor by a small increase in the number of long absences(6-12 months) and is not statistically significant.The combined estimate of total days lost per year in2000-02 is 40.2 million. Based on this, illustrativetargets would be 34 million in 2004/5 and 28 million in 2009/10.
More at http://www.hse.gov.uk/statistics/pdf/swi04.pdf
The Revitalising injury indicator is the sum of the twoparts: the worker rate of fatal injury and the employeerate of major injury uprated by the estimated reportinglevel of employee injuries. The target is to reduce the indicator by 10% in the ten year period 1999/2000 to 2009/10. Progress against this target will be assessedfrom trends estimated in statistical models for the indicator series in the ten year period.The injury indicator decreased by 8.3% from 286.9 in1996/97 to 263.2 in 1999/2000, remained steady in2000/01 at 261.6, and rose by 2.8% to 268.9 in 2001/02.The indicator increased because the marginal decrease inthe rate of reported major injury (-0.6%) is outweighedby the decrease in the reporting level in 2001/02 andconsequent increase in the uprating factor (see page 4).The increase is not statistically significant.The indicator is provisional and will be revised next yearto include late reports and a full assessment of reportinglevels (with the results of the 2002/03 annual LFS).
Figure 13: Rate of fatal and major injury indicator1996/97-2001/02 and illustrative targets for 2004/05 and
2009/10
0
50
100
150
200
250
300
350
96/ 97 97/ 98 98/ 99 99/ 00 00/ 01 01/ 02 02/03 03/04 04/05 05/ 06 06/ 07 07/ 08 08/ 09 09/ 10
Rate o f fatal andmajor injury
Uprated fatal and major rate per 100 000 workers (Revitalising indicator)Reported fatal and major rate per 100 000 employees95% confidence interval
Note: For the Revitalising Indicator see Table 6 on Page 24.
Figure 14: Estimated incidence rate (new cases) of self-reported work-related illness for people who
w orked in the last 12 months, and illustrative targetsfor 2004/05 and 2009/10
0
500
1000
1500
2000
2500
95 95/ 96 96/ 97 97/ 98 98/99 99/ 00 00/ 01 01/ 02 02/ 03 03/ 04 04/05 05/ 06 06/ 07 07/08 08/ 09 09/ 10
Rate per 100 000 employed in thelast 12 months
Note: Estimates fo r 1995 and 2001/02 are no t comparable. See Table 23 on Page 29.95% confidence interval
Figure 15: Estimated numbers of w orking days lostdue to work-related ill health and injuries and
illustrative targets for 2004/05 and 2009/10
0
5
10
15
20
25
30
35
40
45
50
1995-98 2000-02 2004/05 2009/10Surveyperiod:
Number of dayslost (M illions)
Number o f days lost by workers due to work-related ill healthNumber o f days lost by workers due to workplace injuriesNumber o f days lost by workers due to ill health and injuries
Surveyedin 1995
Surveyedin 1997/98
Surveyedin 2001/02
Surveyedin 2000/01
Note: Estimates for 1995-98 and 2000-02 are not comparable. See Table 24 on Page 2995 % confidence interval of total number of days lost by workers

Revitalising priority sectors: agriculture 8 (See table 7)
Ill health in the agriculture sector��
��
��
The SWI survey in 2001/02 estimated that 30 000 people whose current or most recent job in the last 8 years was in theagriculture, hunting, forestry and fishing industries suffered from an illness which they believed was caused or made worse bythis job.
The corresponding prevalence rate, 6500 per 100 000 people working in the last 8 years, was the highest of all SIC92Industry Sections (see Figure 55 on page 21) and was statistically significantly higher than the average for all industries: inother words, there is less than a 5% chance that the difference was due to sampling error alone.
Looking at the incidence of new cases reported by specialist doctors to the ODIN scheme or assessed for compensationunder the IIS over the years 1999-2001, agriculture had relatively high rates for asthma (from both sources) and for hearingloss, upper limb disorders and dermatitis (from ODIN).
��The averaged LFS rate of reportable injury in agriculturerose by 37% from 2020 in 1996/97 to 2760 in 2000/01.The upward trend is statistically significant.
��The rate of reported non-fatal injury decreased by 12.6%between 1996/97 and 2000/01, (808.9 compared with707.2). The reduction in the rate of reported injurycompared with the increase in the averaged LFS ratesuggests that the reporting level of employee injuries hasgenerally decreased. In 2001/02 there were substantialincreases in the rates of major and over-3-day injury.The averaged LFS rate of reportable injury in 2001/02 willbe available next year to confirm if this rise in reportedinjuries represents an improvement in reporting.
��If rates of major injury to employees were uprated for reporting levels, then the RHS injury indicator foragriculture would increase in the four years to 2000/01.
��
��
��
The number of major injuries to employees remainedsteady at 598 in 2001/02 compared with 595 in 2000/01,but is lower now than five years ago in 1996/97 whenthere were 678.The rate of employee major injury increased by 12% to 239.3 in 2001/02 from 213.9 in 2000/01. The rate of major injury may be lower now than in 1996/97, but hasfluctuated more recently.In 2001/02, 22% of employee major injuries were due to falling from a height, 21% due to slipping/tripping, and17% by employees being struck by a moving/falling object.
More at http://www.hse.gov.uk/statistics/pdf/rhsag.pdf and http://www.hse.gov.uk/statistics/pdf/table10.pdf
��The number of fatal injuries to workers has fluctuated inthe past ten years with no overall trend. The numberdropped by 15% in 2001/02 to 39 from 46 in 2000/01.
��
��
��
The number of fatal injuries to employees rose to 20 in2001/02 from 13 in 2000/01 but has fluctuated with no overall trend in the past ten years.The number of fatal injuries to the self-employeddecreased in 2001/02 to 19 from 33 the year before,but has generally fluctuated over the past ten years andis the same as in 1992/93.The rate of fatal injury to workers decreased by 9% in2001/02 to 9.2 from 10.2 in 2000/01 though hasfluctuated in the past ten years. The rate of fatal injuryto the self-employed is higher in the past two years thanin the early 1990s.
Figure 16: Number and rate of fatal injury to workers1996/97 - 2001/02p
0
10
20
30
40
50
60
70
96/97 97/98 98/99 99/00 00/01 01/02p
Number of fatalinjuries
0
2
4
6
8
10
12
Rate of fatalinjury
Number of fatal injuries to workersRate o f fatal injury per 100 000 workers
Figure 17: Number and rate of major injury toemployees 1996/97 - 2001/02p
0100200300400500600700800900
1000
96/97 97/98 98/99 99/00 00/01 01/02p
Number of majorinjuries
0
50
100
150
200
250
300
Rate o f majorinjury
Number o f reported major injuries to employeesRate of reported major injury per 100 000 employees
Figure 18: Rate of reported non-fatal injury toemployees and the averaged LFS rate of reportable
non-fatal injury to workers 1996/97 - 2001/02p
0
500
1000
1500
2000
2500
3000
96/97 97/98 98/99 99/00 00/01 01/02p
Rate o f non-fatalinjury
Averaged LFS rate o f reportable non-fatal injury per 100 000 workers
Rate o f reported non-fatal injury per 100 000 employees

Revitalising priority sectors: construction 9 (See table 10)
Figure 19: Number and rate of fatal injury to workers1996/97 - 2001/02p
0
20
40
60
80
100
120
140
160
96/97 97/98 98/99 99/00 00/01 01/02p
Number of fatalinjuries
0
1
2
3
4
5
6
7
Rate of fatalinjury
Number o f fatal injuries to workersRate of fatal injury per 100 000 workers
Figure 20: Number and rate of major injury toemployees 1996/97 - 2001/02p
0
1000
2000
3000
4000
5000
6000
96/97 97/98 98/99 99/00 00/01 01/02p
Number of majorinjuries
050100150200250300350400450
Rate o f majorinjury
Number o f reported major injuries to employeesRate o f reported major injury per 100 000 employees
Figure 21: Rate of reported non-fatal injury toemployees and the averaged LFS rate of reportable
non-fatal injury to workers 1996/97 - 2001/02p
0
500
1000
1500
2000
2500
3000
96/97 97/98 98/99 99/00 00/01 01/02p
Rate o f non-fatalinjury
Averaged LFS rate o f reportable non-fatal injury per 100 000 workers
Rate o f reported non-fatal injury per 100 000 employees
�� The SWI survey in 2001/02 estimated that 137 000 people whose current or most recent job in the last 8 years was in the construction industry suffered from an illness which they believed was caused or made worse by this job. Thecorresponding prevalence rate, 5600 per 100 000 people working in the last 8 years, was statistically significantly higher thanthe average for all industries (see Figure 55 on page 21).
��
��
An earlier SWI survey, conducted in 1998/99 but restricted to people who worked in the last 12 months, indicated that the highest prevalence rate of self-reported musculoskeletal disorders (ascribed to the current or most recent job) was in theconstruction industry. This rate was statistically significantly higher than the average for all industries.
Looking at the incidence of new IIS cases over the years 1999-2001, construction had by far the highest rates for asbestosisand mesothelioma and relatively high rates for vibration white finger, dermatitis and hearing loss.
Ill health in the construction sector
��
��
��
The number of fatal injuries to workers dropped to 79 in 2001/02 from 105 in 2000/01, a reduction of 25%.The construction industry accounts for 32% of allworker fatalities.The number of fatal injuries to employees and the self-employed dropped in 2001/02 compared with the previous year, from 73 to 59 and 32 to 20 respectively.The rate of fatal injury to workers dropped 28% to 4.2in 2001/02 from 5.9 in 2000/01, one of the lowest in the1990s.
��
��
The rate of fatal injury generally dropped in the 1990suntil 1998/99, but rose substantially in the next two years to 2000/01 when the number was the highest for ten years.
The number of major injuries to employees rose between1996/97 and 1999/2000 but decreased in 2000/01 and2001/02.
��
��
��
The rate of major injury to employees has shown a downward trend since 1999/2000 and decreased by 12% in 2001/02 to 333.3. This is the lowest since the introduction of RIDDOR 95 in 1996/97.Falls from a height accounted for 30% of major injuries in2001/02, and remains the most common kind of accident.Over 26% of major injuries were due to slipping andtripping accidents.
More at http://www.hse.gov.uk/statistics/pdf/rhscon.pdf and http://www.hse.gov.uk/statistics/pdf/table13.pdf
The averaged LFS rate of reportable injury inconstruction has fluctuated in the past three years withno real trend. The rate in 2000/01 is 4.4% lower than in1996/97 (2580 compared with 2700).
��The rate of reported non-fatal (major and over-3-day)injury decreased by 18.3% between 1996/97 and 2000/01(1481.6 compared with 1210.1). The greater reduction inthe rate of reported injury suggests that the reportinglevel has generally decreased. The rate of reported injurydecreased further in 2001/02 by 10%.
��If rates of major injury to employees were uprated for reporting levels, then the RHS indicator for constructionwould fluctuate and not show any statistically significanttrend.

Revitalising priority sectors: health services 10 (See table 11)
Figure 22: Number and rate of major injury toemployees 1996/97 - 2001/02p
0200400600800
10001200140016001800
96/97 97/98 98/99 99/00 00/01 01/02p
Number of majorinjuries
0102030405060708090100
Rate o f majorinjury
Number of reported major injuries to employeesRate o f reported major injury per 100 000 employees
The SWI survey in 2001/02 estimated that 199 000 people whose current or most recent job in the last 8 years was inhealth and social work (the SIC92 Industry Section approximating to health services) suffered from an illness which theybelieved was caused or made worse by this job. The corresponding prevalence rate, 5200 per 100 000 people working inthe last 8 years, was statistically significantly higher than the average for all industries (see Figure 55 on page 21).
An earlier SWI survey, conducted in 1998/99 but restricted to people who worked in the last 12 months, indicated thathealth and social work had a prevalence rate of self-reported stress, depression or anxiety (ascribed to the current or most recent job) which was statistically significantly higher than the average for all industries.
Looking at the incidence of new cases reported by specialist doctors to the ODIN scheme over the years 1999-2001, healthand social work had relatively high rates for mental illness, spine/back disorders, dermatitis and infections.
��
��
��
Ill health in the health services sector
��
��
��
��
��
��
��
In 2001/02, there were 9755 reported employees over-3-day injuries in health services, compared with 10449 in 2000/01.The rate of over-3-day injury to employees decreasedby 1.3% to 610.4 in 2001/02 from 618.7 in 2000/01.The rate of over-3-day injury has decreased by 20% between 1996/97 and 2001/02.About half of over-3-day injuries are due to injury whilsthandling, lifting or carrying.
More at http://www.hse.gov.uk/statistics/pdf/rhshlth.pdf and http://www.hse.gov.uk/statistics/pdf/table15.pdf
��Between 1996/97 and 2000/01, there is a generaldownward trend in the rate of non-fatal injury in healthservices; the averaged LFS rate of reportable injurydecreased by 33%, and the rate of reported injurydecreased by 19%.
��
��
The level of reporting from health services appears tohave increased given that the averaged LFS ratedecreased further than the rate of reported non-fatalinjury.In 2001/02, the rate of reported non-fatal injurydecreased by just 1.3% to 697.0 from 688.1 in 2000/01.The finalised rate for 2001/02 is likely to show a smallincrease on 2000/01 after updating for late reports. Theaveraged LFS in 2001/02 will be available next year to confirm if this rise represents an improvement inreporting.
Between 1996/97 and 2001/02, there were three fatalinjuries to employees in health services. They resultedfrom a low fall, being struck by a moving vehicle andslipping/tripping.In 2001/02 there were 1241 reported major injuries inhealth services, compared with 1323 in 2000/01. Therate of major injury to employees decreased marginallyfrom 78.3 in 2000/01 to 77.7 in 2001/02.The number and rate of major injury to employees havedecreased since 1997/98. The rate of major injurydecreased by 18% since 1996/97 when the figure was94.2.Slipping/tripping accounted for about half of all majorinjuries in health services in 2001/02, and assaults andviolence accounted for 11%.
Figure 24: Rate of reported non-fatal injury toemployees and the averaged LFS rate of reportable
non-fatal injury to employees 1996/97 - 2001/02p
0
500
1000
1500
2000
96/97 97/98 98/99 99/00 00/01 01/02p
Rate o f non-fatalinjury
Averaged LFS rate o f reportable non-fatal injury per 100 000 employees
Rate o f reported non-fatal injury per 100 000 employees
Figure 23: Number and rate of over-3-day injury toemployees 1996/97 - 2001/02p
0
2000
4000
6000
8000
10000
12000
14000
96/97 97/98 98/99 99/00 00/01 01/02p
Number o f over-3-day injuries
0100200300400
500600700800
Rate o f over-3-day injury
Number of reported over-3-day injuries to employees
Rate of reported over-3-day injury per 100 000 employees

Revitalising priority hazards: kinds of accident 11 (See tables 13, 14 & 15) More at http://www.hse.gov.uk/statistics/pdf/rhsfall.pdf and http://www.hse.gov.uk/statistics/causinj/index.htm
��
��
Of 127 084 employee over-3-day injuries in 2001/02,29 509 involved slipping/tripping (23%). The numberincreased in 2001/02 from 28 552 in 2000/01 (21%).The number has increased every year from 1996/97when there were 24 537. Slipping/tripping hasaccounted for a gradually increasing percentage of over-3-day injuries.Falling from a height accounted for 5331 (4.2%) of employee over-3-day injuries in 2001/02 compared with9023 (6.7%) in 2000/01, 9019 (6.7%) in 1999/2000, and8492 in 1996/97. Falls have accounted for a relativelystable percentage of employee over-3-day injuriesbetween 1996/97 and 2000/01.
��If the percentage of employee over-3-day injuries due tothe two kinds slipping/tripping and falling from a heightwere applied 127 084 injuries in 2001/02, then therewould be about 3220 extra fall injuries, and 2450 lessslip/trip injuries. The changes are between these two kinds which together account for similar percentages inboth years. The changes reflect the use of the new guidelines for recording accident circumstances.
��Slipping/tripping remains the commonest kind of employee major injuries, accounting for 37% in 2001/02,and 33% in 2000/01. The percentage share for fallsfrom a height decreased to 15% in 2001/02 from 19% in2000/01. The two kinds together account for 51%-52% of major injuries but the guidelines have resulted in a shift from falls to slip/trip accidents. Despite this, thenumber and percentage share due to slip/trip accidentshas generally risen before 2001/02 (31% in 1996/97 to33% in 2000/01). The percentage share due to falls wassteady at 18%-19% before 2001/02.
��Slips/trips involve slips on wet surfaces or on asubstance, a trip over obstructions and uneven surfaces.Falls involve ladders, vehicles and scaffolding, but 54%involve falls from less than two metres.
��In 1999/2000 the number of employee major injuriesfrom being hit by a vehicle was 959. The figure droppedin 2000/01 (823) and in 2001/02 (722). The percentageshare has dropped since 1999/2000 (3.3%, 3.0% and2.6%).
��In 2001/02 HSE introduced new guidelines to improvethe quality of recording kinds of accident and give moredetail on equipment/material agents involved. The kindcategories remain the same and the 2001/02 figures stillhave the same commonest kinds as in past years. Thereare small changes in percentage share which will affectthe numbers in each kind (mainly for major and over-3-day injuries).
��
��
��
In 2001/02, there were 44 fatal injuries to workers dueto high falls (over 2 metres), 36% less than in 2000/01.There were 40 fatal injuries from workers being struckby a moving vehicle compared with 43 in 1996/97, butthe number has fluctuated and shown no real trend.In 2001/02, there were 11 fatal injuries to workers dueto low falls, compared with 5 in 1999/2000 and 2000/01.
��The number of fatal injuries to workers due to slippingand tripping accidents decreased to 2 in 2001/02 from 4 in 2000/01. Slips and trips account for a small numberof fatal injuries and has fluctuated since 1996/97.
Figure 25: Number of fatal injuries to w orkers bykinds of accident in the RHS programme 1996/97 -
2001/02p
0
10
20
30
40
50
60
70
80
96/97 97/98 98/99 99/00 00/01 01/02p
Number of fatalinjuries
High falls from a height Low falls from a height
Struck by a moving vehicle Slips, trips or falls on the same level
Figure 26: Number of reported major injuries toemployees by kinds of accident in the RHS
programme 1996/97 - 2001/02p
0
2000
4000
6000
8000
10000
12000
96/97 97/98 98/99 99/00 00/01 01/02p
Number o f majorinjuries
Slips, trips or falls on the same level High falls from a heightLow falls from a height Struck by a moving vehicle
Figure 27: Number of reported over-3-day injuries toemployees by kinds of accident in the RHS
programme 1996/97 - 2001/02p
0
5000
10000
15000
20000
25000
30000
35000
96/97 97/98 98/99 99/00 00/01 01/02p
Number o f over-3-day injuries
Slips, trips or falls on the same level High falls from a heightLow falls from a height Struck by a moving vehicle

Revitalising priority hazards: types of ill health 12
��
��
��
��
The latest self-reported illness survey, SWI01/02,estimated that there were 240 000 new cases of work-related musculoskeletal disorders in the previous 12 months.An estimated 7800 cases of work-related musculo-skeletal disorders were seen for the first time in 2001 by rheumatologists and occupational physiciansreporting to the ODIN surveillance schemes.SWI01/02 estimated that 12.3 million working dayswere lost in the previous 12 months due to amusculoskeletal disorder caused or made worse bywork.Estimates from SWI, the most comprehensive source of data, on the incidence of work-related musculoskeletaldisorders are not directly comparable. However, thenumber of first visits to ODIN specialists appears to have remained fairly stable in recent years at around anestimated 8000 a year.
��
��
Occupational groups carrying the highest prevalencerates of work-related musculoskeletal disorders inSWI98/99 included skilled construction trades, healthassociate professionals (e.g. nurses) and other skilledtrades. Occupations involving typing and repetitivetasks (e.g. typists and word processor operators,assemblers and lineworkers) were amongst those withthe highest incidence rates reported by rheumatologiststo ODIN.
More at http://www.hse.gov.uk/statistics/causdis/musc.htm
The most recent survey of self-reported work-relatedillness, SWI01/02, estimated that there were 265 000new cases of work-related stress, depression or anxietyin the previous 12 months.
��
��
��
Just under 7500 new cases of work-related mentalhealth problems in Britain were estimated to have been seen by psychiatrists and occupational physiciansreporting to the ODIN surveillance schemes in 2001.Of these some 6700 related to stress, depression or anxiety.Estimates from SWI01/02 indicate that self-reportedwork-related stress, depression or anxiety accountedfor approximately 13.5 million lost working days per year.Both survey data and surveillance data suggest thatwork-related stress and related disorders are increasingin the British population. However, these data aredifficult to interpret and the exact extent of thisincrease cannot be determined.
��Occupation and industry groups containing teachers andnurses have the highest prevalence rates of work-related stress in SWI surveys and the SHAW stress survey, and among the highest incidence rates in ODIN.
More at http://www.hse.gov.uk/statistics/causdis/stress.htm
Figure 28: Estimated incidence of work-relatedmusculoskeletal disorders
0
50
100
150
200
250
300
1995 1996 1997 1998 1999 2000 2001 2001/02
Incidence- SWI(Thousands)
0
1
2
3
4
5
6
7
8
9
10
Incidence- ODIN(Thousands)
Self-reported (SWI)
Reported by specialist doctors (ODIN)95% confidence interval
Note: SWI estimates fo r 1995 and 2001/02 are no t comparable. See Table 23 on Page 29
Figure 29: Estimated incidence of work-relatedstress, depression or anxiety
0
50
100
150
200
250
300
1995 1996 1997 1998 1999 2000 2001 2001/02
Incidence- SWI(Thousands)
0
1
2
3
4
5
6
7
8
Incidence- ODIN(Thousands)
Self-reported (SWI)
Reported by specialist doctors (ODIN)95% confidence interval
Note: SWI estimates fo r 1995 and 2001/02 are no t comparable. See Table 23 on Page 29

Injuries in the extractive and utility supply industries 13 (See table 8)
��
��
The extractive industries include: coal mines, open castmining, quarrying, extraction of oil and gas, and the supply of electricity, gas and water. The statistics coveremployees mainly because there are relatively few self-employed people in these industries. In 2000/01 and2001/02 there were no fatal injuries to the self-employed.The number of employee fatal injuries fluctuate but haverisen from 6 in 1999/2000 to 14 in 2001/02.
��
��
The rate of fatal injury to workers increased in 2001/02to 7.6 from 4.4 the year before. There were sixfatalities in electricity generation/supply in 2001/02,compared with none in 2000/01 (the figures for extraction of petroleum and gas are four in 2001/02,three in 2000/01and two in 1999/2000).
The number of reported major injuries in the extractiveand utility supply industries has generally decreased in the five years to 2001/02. There were 679 in 1996/97compared with 437 in 2001/02.
��
��
��
The rate of major injury to employees decreased in2001/02 by 6% and is now 20% lower than five yearsago in 1996/97.In 2001/02, the rate of major injury dropped in mining,in extraction of petroleum and gas, and in quarrying.The rate of major injury rose in the electricitygeneration and supply industry (3%), and in the collection and distribution of water (22%).
More at http://www.hse.gov.uk/statistics/pdf/table11.pdf
From comparison with the LFS it is estimated that thereis nearly full reporting of employee injuries from theextractive and utility supply sector as a whole. Trendsin reported non-fatal injuries in the sector are thereforerelatively unaffected by under reporting.
��The number of reported non-fatal injuries to employeesin the extractive and utility supply industries decreasedby 30% to 2598 in 2001/02 from 3702 in 1996/97.These figures are dominated by over-3-day injuries(there were 2161 in 2001/02 and 3023 in 1996/97).
��
��
The rate of reported non-fatal injury dropped 8% to 1489.7 in 2001/02 from 1621.7 in 2000/01. The rate of non-fatal injury decreased in most years and in 2001/02is 13% lower than in 1996/97.In 2001/02, the rate of reported non-fatal injurydropped in mining, in extraction of petroleum and gas,and in quarrying, but rose in the utility industries(electricity generator/supply) and in the collection/distribution of water.
Figure 30: Number and rate of fatal injury to workers1996/97 - 2001/02p
0
5
10
15
20
25
96/97 97/98 98/99 99/00 00/01 01/02p
Number of fatalinjuries
0
1
2
3
4
5
6
7
8
9
Rate o f fatalinjury
Number o f fatal injuries to workersRate of fatal injury per 100 000 workers
Figure 31: Number and rate of major injury toemployees 1996/97 - 2001/02p
0
100
200
300
400
500
600
700
800
96/97 97/98 98/99 99/00 00/01 01/02p
Number of majorinjuries
0
50
100
150
200
250
300
350
Rate of majorinjury
Number o f reported major injuries to employees
Rate of reported major injury per 100 000 employees
Figure 32: Rate of reported non-fatal injury toemployees 1996/97 - 2001/02p
0
200
400
600
800
1000
1200
1400
1600
1800
2000
96/97 97/98 98/99 99/00 00/01 01/02p
Rate o f non-fatalinjury
Rate o f reported non-fatal injury per 100 000 employees

Injuries in the manufacturing industries 14 (See table 9)
��
��
��
��
��
��
The number of reported major injuries to employees inmanufacturing industries dropped 7% to 6879 in2001/02 from 7408 in 2000/01.The rate of major injury to employees dropped to 187.4in 2001/02, 3.5% lower than in 2000/01. The rate of major injury dropped in fifteen manufacturing industriesin 2001/02 but rose (by small amounts) in eightindustries (food products, tobacco products, clothing,wood products, pulp/paper products, printing/publishing,miscellaneous products, and recycling/scrap).
��
��
In the five years to 2001/02, the rate of major injury to employees decreased by 9%. In that period the rate of major injury tended to increase in wood products,leather products and in non-metallic mineral products.
More at http://www.hse.gov.uk/statistics/pdf/table12.pdf
Between 1996/97 and 2000/01, the averaged LFS rate of reportable injury in manufacturing has fluctuated thoughis 6% higher in 2000/01, (the rise is not statisticallysignificant). The rate of reported non-fatal injury toemployees has also fluctuated in this period and is 1.3%lower in 2000/01 compared to 1996/97. The rate hasdropped 5.8% further in 2001/02 to become 7.1% lowerthan five years ago in 1996/97. The averaged LFS ratefor 2001/02 will confirm next year if this recentdecrease is a result of lower reporting.
��
��
The LFS rate of reportable injury and rate of reportedinjury give a recent picture of fluctuation with no substantial movement up or down.The picture on reported injuries differs for a few industries. The rate of reported injury in five years hastended to rise in leather products and in woodproducts, and tended to drop in food products/tobacco,textiles and clothes, vehicles and transport equipment,in miscellaneous products, and in recycling /scrap.
In 2001/02 there were 47 fatal injuries to workerscompared with 50 in 2000/01. The number issubstantially lower than in most of the 1990s.The number of employee fatal injuries in 2001/02remained the same as in 2000/01 at 46. The number of fatal injuries to the self-employed dropped from 4 in2000/01 to one in 2001/02.The rate of fatal injury to workers is 1.2 in 2001/02, the same as in 2000/01 (to one decimal place), and is lowerthan in the early 1990s.Of the 97 fatal injuries to workers in 2000/01 and2001/02, 18 were in fabricated metal products, 13 inbasic metals and 11 in food products and beverages.
Figure 33: Number and rate of fatal injury to workers1996/97 - 2001/02p
0
10
20
30
40
50
60
70
80
96/97 97/98 98/99 99/00 00/01 01/02p
Number of fatalinjuries
0.0
0.2
0.4
0.6
0.8
1.0
1.2
1.4
1.6
1.8
Rate of fatalinjury
Number o f fatal injuries to workersRate of fatal injury per 100 000 workers
Figure 34: Number and rate of major injury toemployees 1996/97 - 2001/02p
0
2000
4000
6000
8000
10000
12000
96/97 97/98 98/99 99/00 00/01 01/02p
Number o f majorinjuries
0
50
100
150
200
250
Rate of majorinjury
Number of reported major injuries to employees
Rate o f reported major injury per 100 000 employees
Figure 35: Rate of reported non-fatal injury toemployees and the averaged LFS rate of reportable
non-fatal injury to w orkers 1996/97 - 2001/02p
0
500
1000
1500
2000
2500
96/97 97/98 98/99 99/00 00/01 01/02p
Rate o f non-fatalinjury
Averaged LFS rate of reportable non-fatal injury per 100 000 workers
Rate of reported non-fatal injury per 100 000 employees
Injuries in the service industries 15 (See table 12)
��
��
��
��
��
��
��
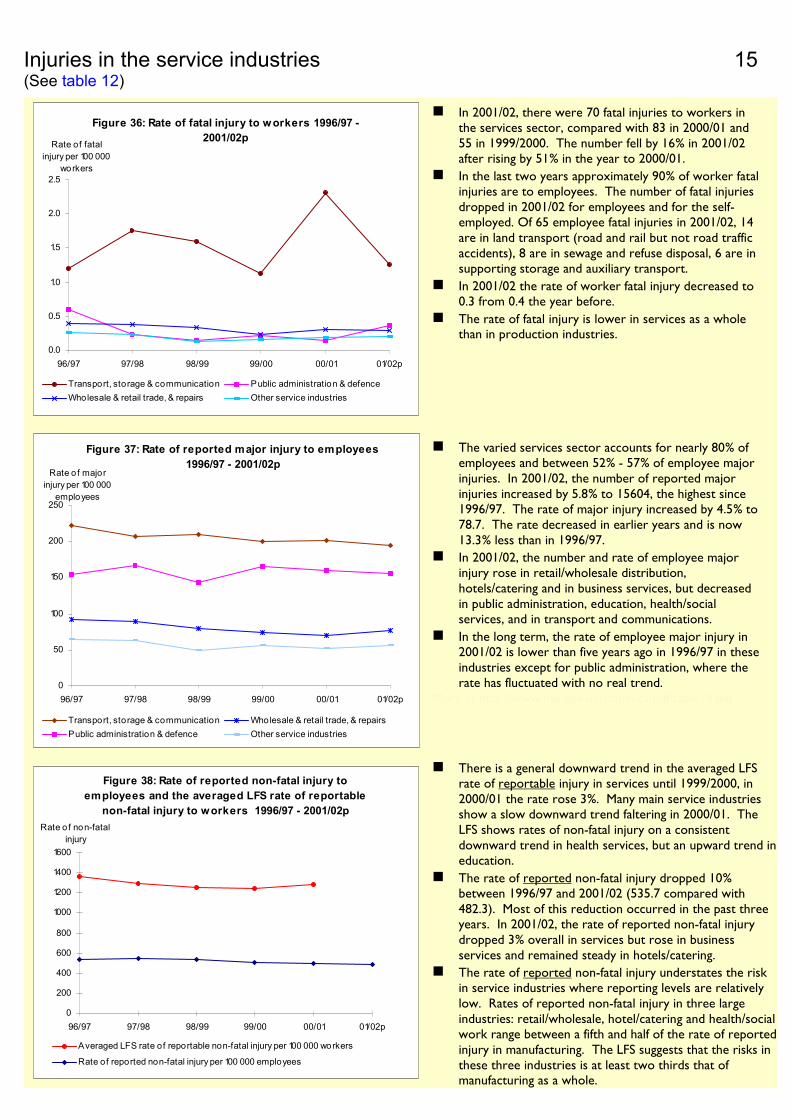
��There is a general downward trend in the averaged LFSrate of reportable injury in services until 1999/2000, in2000/01 the rate rose 3%. Many main service industriesshow a slow downward trend faltering in 2000/01. TheLFS shows rates of non-fatal injury on a consistentdownward trend in health services, but an upward trend ineducation.
��The rate of reported non-fatal injury dropped 10% between 1996/97 and 2001/02 (535.7 compared with482.3). Most of this reduction occurred in the past three years. In 2001/02, the rate of reported non-fatal injurydropped 3% overall in services but rose in businessservices and remained steady in hotels/catering.
��The rate of reported non-fatal injury understates the riskin service industries where reporting levels are relativelylow. Rates of reported non-fatal injury in three largeindustries: retail/wholesale, hotel/catering and health/socialwork range between a fifth and half of the rate of reportedinjury in manufacturing. The LFS suggests that the risks inthese three industries is at least two thirds that of manufacturing as a whole.
The varied services sector accounts for nearly 80% of employees and between 52% - 57% of employee majorinjuries. In 2001/02, the number of reported majorinjuries increased by 5.8% to 15604, the highest since1996/97. The rate of major injury increased by 4.5% to 78.7. The rate decreased in earlier years and is now13.3% less than in 1996/97.In 2001/02, the number and rate of employee majorinjury rose in retail/wholesale distribution,hotels/catering and in business services, but decreasedin public administration, education, health/socialservices, and in transport and communications.In the long term, the rate of employee major injury in2001/02 is lower than five years ago in 1996/97 in theseindustries except for public administration, where the rate has fluctuated with no real trend.
More at http://www.hse.gov.uk/statistics/pdf/table14.pdf
In 2001/02, there were 70 fatal injuries to workers inthe services sector, compared with 83 in 2000/01 and55 in 1999/2000. The number fell by 16% in 2001/02after rising by 51% in the year to 2000/01.In the last two years approximately 90% of worker fatalinjuries are to employees. The number of fatal injuriesdropped in 2001/02 for employees and for the self-employed. Of 65 employee fatal injuries in 2001/02, 14 are in land transport (road and rail but not road trafficaccidents), 8 are in sewage and refuse disposal, 6 are insupporting storage and auxiliary transport.In 2001/02 the rate of worker fatal injury decreased to 0.3 from 0.4 the year before.The rate of fatal injury is lower in services as a wholethan in production industries.
Figure 36: Rate of fatal injury to workers 1996/97 -2001/02p
0.0
0.5
1.0
1.5
2.0
2.5
96/97 97/98 98/99 99/00 00/01 01/02p
Rate of fatalinjury per 100 000
workers
Transport, storage & communication Public administration & defenceWholesale & retail trade, & repairs Other service industries
Figure 37: Rate of reported major injury to employees1996/97 - 2001/02p
0
50
100
150
200
250
96/97 97/98 98/99 99/00 00/01 01/02p
Rate o f majorinjury per 100 000
employees
Transport, storage & communication Wholesale & retail trade, & repairsPublic administration & defence Other service industries
Figure 38: Rate of reported non-fatal injury toemployees and the averaged LFS rate of reportable
non-fatal injury to workers 1996/97 - 2001/02p
0
200
400
600
800
1000
1200
1400
1600
96/97 97/98 98/99 99/00 00/01 01/02p
Rate o f non-fatalinjury
Averaged LFS rate of reportable non-fatal injury per 100 000 workers
Rate of reported non-fatal injury per 100 000 employees

Kinds of accidents 16 (See tables 13, 14 & 15)
��
��
In 2001/02, 43 workers were fatally injured bymoving/flying objects compared with 57 in 1996/97, adecrease of 25%.The number of worker fatalities due to being trapped bysomething collapsing/overturning decreased to 8 in2001/02 from 40 in 2000/01. The number of suchfatalities has fluctuated in the past five years.
��
��
The number of worker fatalities due to contact withmoving machinery increased to 22 from 19 in 2000/01and 14 in 1999/2000, the lowest since 1996/97.
Being struck by moving/flying objects accounted for14.5% of employee major injuries in 2000/01 and in2001/02. The figure is 16.5% for 1996/97, the percentage share having gradually dropped. There were3993 in 2001/02 compared with 4606 in 1996/97.
��
��
��
The number of major injuries to employees injuredwhile handling, lifting and carrying has fluctuated in the past five years. There were 2809 in 2001/02 comparedwith 2695 in 2000/01. The percentage share is about10%.The number of employee major injuries due to contactwith moving machinery has decreased in 2001/02 and in2000/01 (there were 1779 in 1999/2000, 1636 in2000/01 and 1373 in 2001/02). The percentage sharefluctuated between 6.0% and 6.6% until 1999/2000 andthen dropped to 5.9% in 2000/01 and 5.0% in 2001/02.
Being injured while handling, lifting or carryingaccounted for 36% - 38% of employee over-3-dayinjuries in the five years to 2001/02. The number hasdropped marginally to 48 000 in 2001/02 from 48 327 in2000/01. Common ways are: lifting/putting down loads;sprains/strains from body movement; and handlingsharp/coarse items. Common agents involved in theseways are respectively: various storage containers andstored products; the injured person themselves; andvarious hand tools for cutting/nailing/drilling.
��Being struck by a moving/falling object accounted for12.6% of employee over-3-day injuries in 2000/01 and in2001/02 compared with 14.4% in 1996/97. The numberof such injuries has dropped from 18 293 in 1999/2000to 16 008 in 2001/02.
��The number of employee over-3-day injuries due to contact with moving machinery has dropped every yearsince 1996/97, the percentage share dropping from 4.5%to 3.5% in 2001/02.
More at http://www.hse.gov.uk/statistics/injury.htm
Figure 39: Number of fatal injuries to workers bykinds of accident 1996/97 - 2001/02p
0
10
20
30
40
50
60
96/97 97/98 98/99 99/00 00/01 01/02p
Number of fatalinjuries
Struck by a moving/falling objectTrapped by something collapsing or overturningContact with moving machinery
Figure 40: Number of reported major injuries toemployees by kinds of accident 1996/97 - 2001/02p
0
500
1000
1500
2000
2500
3000
3500
4000
4500
5000
96/97 97/98 98/99 99/00 00/01 01/02p
Number of majorinjuries
Struck by a moving/falling objectInjured while handling, lifting or carryingContact with moving machinery
Figure 41: Number of reported over-3-day injuries toemployees by kinds of accident 1996/97 - 2001/02p
0
10000
20000
30000
40000
50000
60000
96/97 97/98 98/99 99/00 00/01 01/02p
Number of over-3-day injuries
Injured while handling, lifting or carryingStruck by a moving/falling objectContact with moving machinery
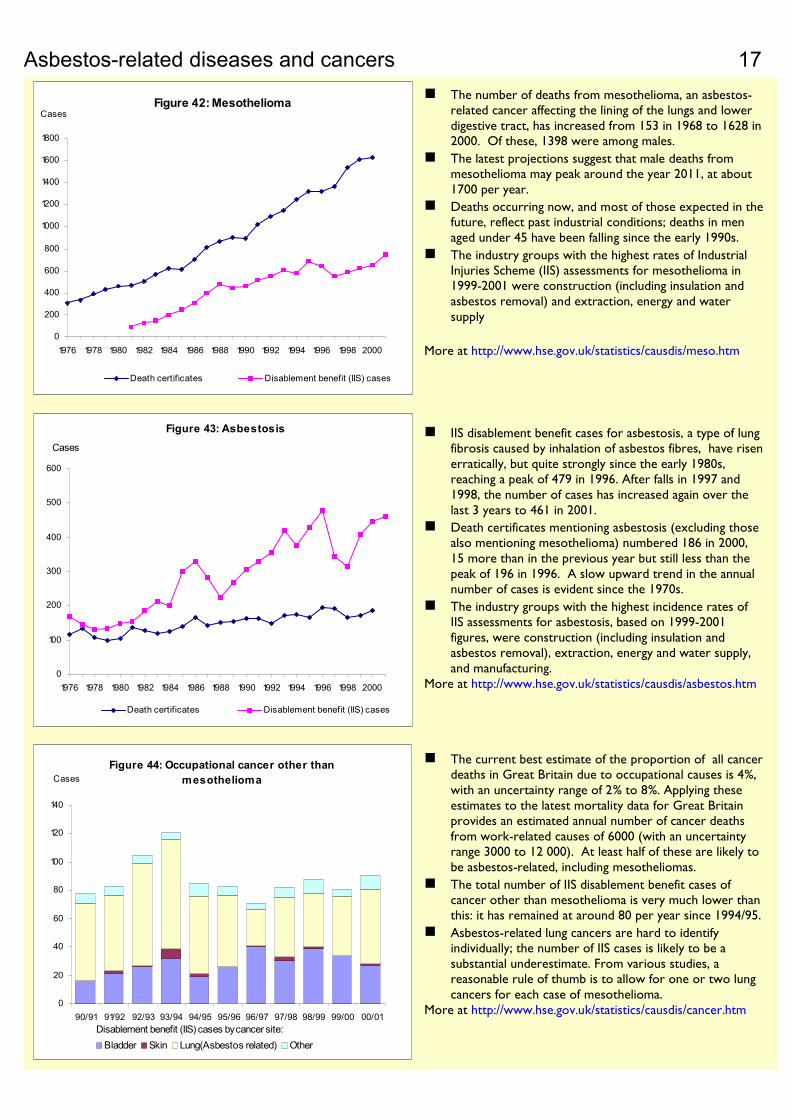
Asbestos-related diseases and cancers 17 ��The number of deaths from mesothelioma, an asbestos-
related cancer affecting the lining of the lungs and lowerdigestive tract, has increased from 153 in 1968 to 1628 in2000. Of these, 1398 were among males.
��
��
The latest projections suggest that male deaths from mesothelioma may peak around the year 2011, at about1700 per year.Deaths occurring now, and most of those expected in thefuture, reflect past industrial conditions; deaths in menaged under 45 have been falling since the early 1990s.
��
��
The industry groups with the highest rates of IndustrialInjuries Scheme (IIS) assessments for mesothelioma in1999-2001 were construction (including insulation andasbestos removal) and extraction, energy and watersupply
More at http://www.hse.gov.uk/statistics/causdis/meso.htm
IIS disablement benefit cases for asbestosis, a type of lungfibrosis caused by inhalation of asbestos fibres, have risenerratically, but quite strongly since the early 1980s,reaching a peak of 479 in 1996. After falls in 1997 and1998, the number of cases has increased again over the last 3 years to 461 in 2001.
��
��
��
Death certificates mentioning asbestosis (excluding thosealso mentioning mesothelioma) numbered 186 in 2000,15 more than in the previous year but still less than thepeak of 196 in 1996. A slow upward trend in the annualnumber of cases is evident since the 1970s.The industry groups with the highest incidence rates of IIS assessments for asbestosis, based on 1999-2001figures, were construction (including insulation andasbestos removal), extraction, energy and water supply,and manufacturing.
More at http://www.hse.gov.uk/statistics/causdis/asbestos.htm
The current best estimate of the proportion of all cancerdeaths in Great Britain due to occupational causes is 4%,with an uncertainty range of 2% to 8%. Applying theseestimates to the latest mortality data for Great Britainprovides an estimated annual number of cancer deathsfrom work-related causes of 6000 (with an uncertaintyrange 3000 to 12 000). At least half of these are likely to be asbestos-related, including mesotheliomas.
��The total number of IIS disablement benefit cases of cancer other than mesothelioma is very much lower thanthis: it has remained at around 80 per year since 1994/95.
��Asbestos-related lung cancers are hard to identifyindividually; the number of IIS cases is likely to be a substantial underestimate. From various studies, areasonable rule of thumb is to allow for one or two lungcancers for each case of mesothelioma.
More at http://www.hse.gov.uk/statistics/causdis/cancer.htm
Figure 42: Mesothelioma
0
200
400
600
800
1000
1200
1400
1600
1800
1976 1978 1980 1982 1984 1986 1988 1990 1992 1994 1996 1998 2000
Cases
Death certificates Disablement benefit (IIS) cases
Figure 43: Asbestosis
0
100
200
300
400
500
600
1976 1978 1980 1982 1984 1986 1988 1990 1992 1994 1996 1998 2000
Cases
Death certificates Disablement benefit (IIS) cases
Figure 44: Occupational cancer other thanmesothelioma
0
20
40
60
80
100
120
140
90/91 91/92 92/93 93/94 94/95 95/96 96/97 97/98 98/99 99/00 00/01
Cases
Bladder Skin Lung(Asbestos related) OtherDisablement benefit (IIS) cases by cancer site:
Respiratory diseases 18
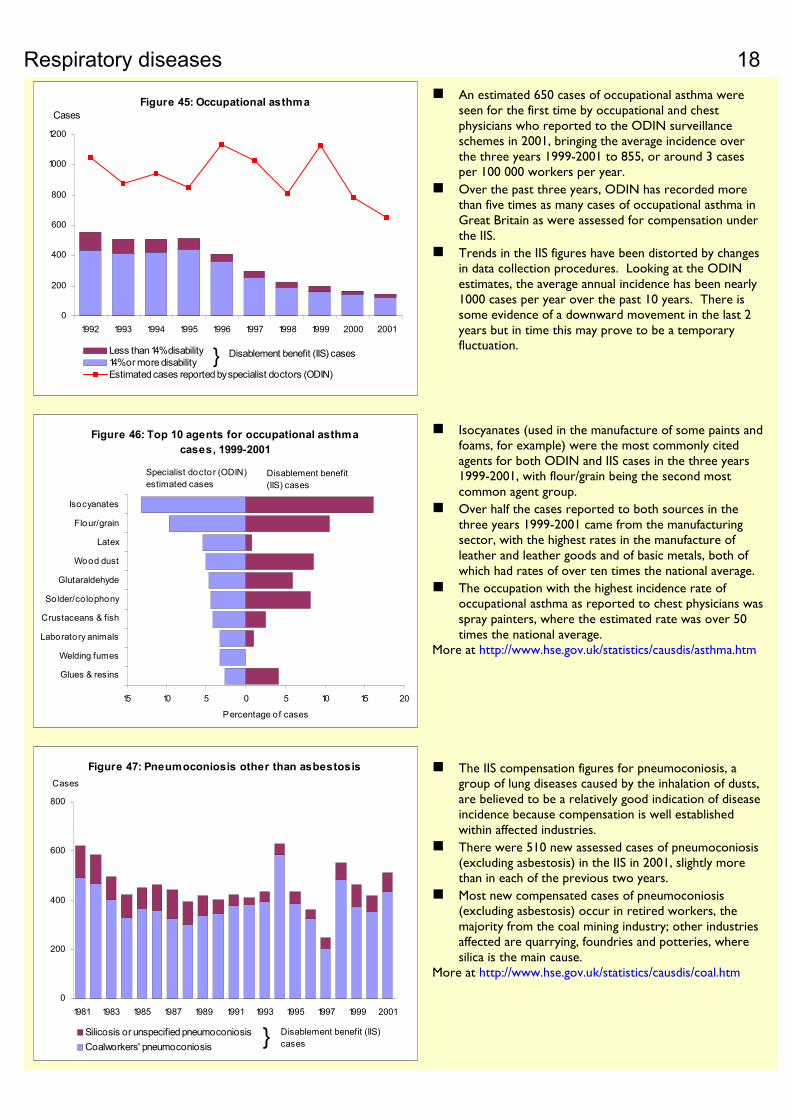
��The IIS compensation figures for pneumoconiosis, agroup of lung diseases caused by the inhalation of dusts,are believed to be a relatively good indication of diseaseincidence because compensation is well establishedwithin affected industries.
��
��
There were 510 new assessed cases of pneumoconiosis(excluding asbestosis) in the IIS in 2001, slightly morethan in each of the previous two years.Most new compensated cases of pneumoconiosis(excluding asbestosis) occur in retired workers, the majority from the coal mining industry; other industriesaffected are quarrying, foundries and potteries, where silica is the main cause.
More at http://www.hse.gov.uk/statistics/causdis/coal.htm
��
��
��
��Isocyanates (used in the manufacture of some paints andfoams, for example) were the most commonly citedagents for both ODIN and IIS cases in the three years1999-2001, with flour/grain being the second mostcommon agent group.
��
��
Over half the cases reported to both sources in the three years 1999-2001 came from the manufacturingsector, with the highest rates in the manufacture of leather and leather goods and of basic metals, both ofwhich had rates of over ten times the national average.The occupation with the highest incidence rate of occupational asthma as reported to chest physicians wasspray painters, where the estimated rate was over 50 times the national average.
More at http://www.hse.gov.uk/statistics/causdis/asthma.htm
An estimated 650 cases of occupational asthma were seen for the first time by occupational and chestphysicians who reported to the ODIN surveillanceschemes in 2001, bringing the average incidence overthe three years 1999-2001 to 855, or around 3 casesper 100 000 workers per year.Over the past three years, ODIN has recorded morethan five times as many cases of occupational asthma inGreat Britain as were assessed for compensation underthe IIS.Trends in the IIS figures have been distorted by changesin data collection procedures. Looking at the ODINestimates, the average annual incidence has been nearly1000 cases per year over the past 10 years. There issome evidence of a downward movement in the last 2years but in time this may prove to be a temporaryfluctuation.
Figure 45: Occupational asthma
0
200
400
600
800
1000
1200
1992 1993 1994 1995 1996 1997 1998 1999 2000 2001
Cases
Less than 14% disability14%or more disabilityEstimated cases reported by specialist doctors (ODIN)
Disablement benefit (IIS) cases}
Figure 46: Top 10 agents for occupational asthmacases, 1999-2001
15 10 5 0 5 10 15 20
Glues & resins
Welding fumes
Laboratory animals
Crustaceans & fish
Solder/colophony
Glutaraldehyde
Wood dust
Latex
Flour/grain
Isocyanates
Percentage of cases
Disablement benefit(IIS) cases
Specialist doctor (ODIN)estimated cases
Figure 47: Pneumoconiosis other than asbestosis
0
200
400
600
800
1981 1983 1985 1987 1989 1991 1993 1995 1997 1999 2001
Cases
Silicosis or unspecified pneumoconiosisCoalworkers' pneumoconiosis } Disablement benefit (IIS)
cases
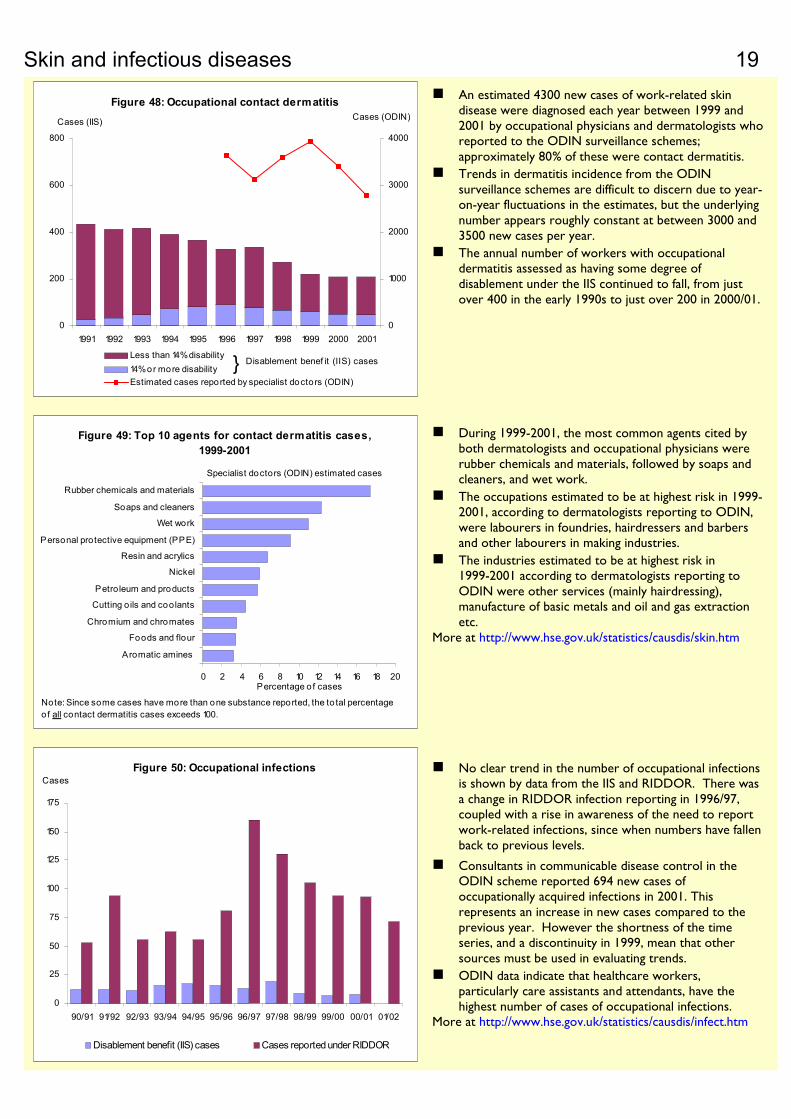
Skin and infectious diseases 19 ��An estimated 4300 new cases of work-related skin
disease were diagnosed each year between 1999 and2001 by occupational physicians and dermatologists whoreported to the ODIN surveillance schemes;approximately 80% of these were contact dermatitis.
��
��
��
��
��
��
��
��
Trends in dermatitis incidence from the ODINsurveillance schemes are difficult to discern due to year-on-year fluctuations in the estimates, but the underlyingnumber appears roughly constant at between 3000 and3500 new cases per year.The annual number of workers with occupationaldermatitis assessed as having some degree of disablement under the IIS continued to fall, from justover 400 in the early 1990s to just over 200 in 2000/01.
No clear trend in the number of occupational infectionsis shown by data from the IIS and RIDDOR. There wasa change in RIDDOR infection reporting in 1996/97,coupled with a rise in awareness of the need to report work-related infections, since when numbers have fallenback to previous levels.
Consultants in communicable disease control in the ODIN scheme reported 694 new cases of occupationally acquired infections in 2001. Thisrepresents an increase in new cases compared to the previous year. However the shortness of the timeseries, and a discontinuity in 1999, mean that other sources must be used in evaluating trends.ODIN data indicate that healthcare workers,particularly care assistants and attendants, have thehighest number of cases of occupational infections.
More at http://www.hse.gov.uk/statistics/causdis/infect.htm
During 1999-2001, the most common agents cited byboth dermatologists and occupational physicians wererubber chemicals and materials, followed by soaps andcleaners, and wet work.The occupations estimated to be at highest risk in 1999-2001, according to dermatologists reporting to ODIN,were labourers in foundries, hairdressers and barbersand other labourers in making industries.The industries estimated to be at highest risk in1999-2001 according to dermatologists reporting to ODIN were other services (mainly hairdressing),manufacture of basic metals and oil and gas extractionetc.
More at http://www.hse.gov.uk/statistics/causdis/skin.htm
Figure 48: Occupational contact dermatitis
0
200
400
600
800
1991 1992 1993 1994 1995 1996 1997 1998 1999 2000 2001
Cases (IIS)
0
1000
2000
3000
4000
Cases (ODIN)
Less than 14% disability14% or more disabilityEstimated cases reported by specialist doctors (ODIN)
} Disablement benef it (IIS) cases
Figure 49: Top 10 agents for contact dermatitis cases,1999-2001
0 2 4 6 8 10 12 14 16 18 20
Aromatic amines
Foods and flour
Chromium and chromates
Cutting oils and coolants
Petroleum and products
Nickel
Resin and acrylics
Personal protective equipment (PPE)
Wet work
Soaps and cleaners
Rubber chemicals and materials
Percentage o f cases
Note: Since some cases have more than one substance reported, the to tal percentageof all contact dermatitis cases exceeds 100.
Specialist doctors (ODIN) estimated cases
Figure 50: Occupational infections
0
25
50
75
100
125
150
175
90/91 91/92 92/93 93/94 94/95 95/96 96/97 97/98 98/99 99/00 00/01 01/02
Cases
Disablement benefit (IIS) cases Cases reported under RIDDOR
Other occupational diseases and exposures 20
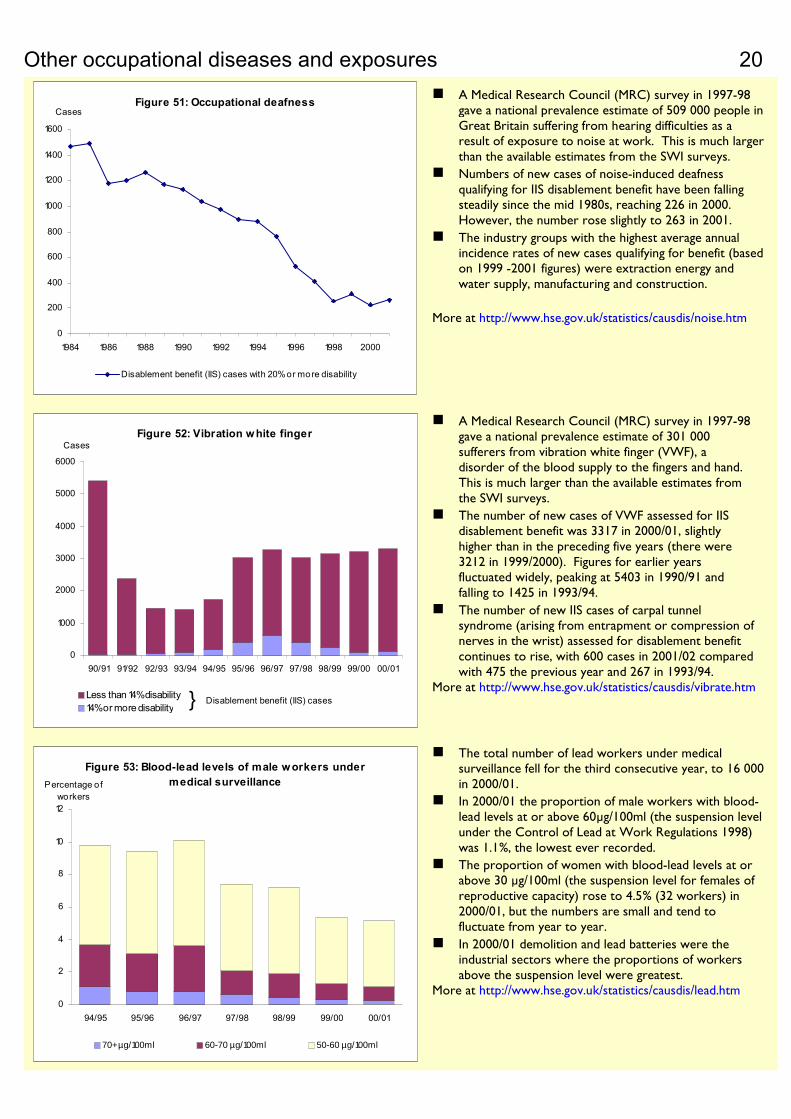
��The total number of lead workers under medicalsurveillance fell for the third consecutive year, to 16 000in 2000/01.
��In 2000/01 the proportion of male workers with blood-lead levels at or above 60µg/100ml (the suspension levelunder the Control of Lead at Work Regulations 1998) was 1.1%, the lowest ever recorded.
��
��
The proportion of women with blood-lead levels at or above 30 µg/100ml (the suspension level for females of reproductive capacity) rose to 4.5% (32 workers) in2000/01, but the numbers are small and tend to fluctuate from year to year.In 2000/01 demolition and lead batteries were the industrial sectors where the proportions of workers above the suspension level were greatest.
More at http://www.hse.gov.uk/statistics/causdis/lead.htm
��
��
��
A Medical Research Council (MRC) survey in 1997-98gave a national prevalence estimate of 301 000 sufferers from vibration white finger (VWF), adisorder of the blood supply to the fingers and hand.This is much larger than the available estimates fromthe SWI surveys.The number of new cases of VWF assessed for IIS disablement benefit was 3317 in 2000/01, slightlyhigher than in the preceding five years (there were 3212 in 1999/2000). Figures for earlier yearsfluctuated widely, peaking at 5403 in 1990/91 andfalling to 1425 in 1993/94.The number of new IIS cases of carpal tunnelsyndrome (arising from entrapment or compression ofnerves in the wrist) assessed for disablement benefitcontinues to rise, with 600 cases in 2001/02 comparedwith 475 the previous year and 267 in 1993/94.
More at http://www.hse.gov.uk/statistics/causdis/vibrate.htm
��A Medical Research Council (MRC) survey in 1997-98gave a national prevalence estimate of 509 000 people inGreat Britain suffering from hearing difficulties as aresult of exposure to noise at work. This is much largerthan the available estimates from the SWI surveys.
��
��
Numbers of new cases of noise-induced deafnessqualifying for IIS disablement benefit have been fallingsteadily since the mid 1980s, reaching 226 in 2000.However, the number rose slightly to 263 in 2001.The industry groups with the highest average annualincidence rates of new cases qualifying for benefit (basedon 1999 -2001 figures) were extraction energy andwater supply, manufacturing and construction.
More at http://www.hse.gov.uk/statistics/causdis/noise.htm
Figure 51: Occupational deafness
0
200
400
600
800
1000
1200
1400
1600
1984 1986 1988 1990 1992 1994 1996 1998 2000
Cases
Disablement benefit (IIS) cases with 20% or more disability
Figure 52: Vibration white finger
0
1000
2000
3000
4000
5000
6000
90/91 91/92 92/93 93/94 94/95 95/96 96/97 97/98 98/99 99/00 00/01
Cases
Less than 14% disability14% or more disability } Disablement benefit (IIS) cases
Figure 53: Blood-lead levels of male workers undermedical surveillance
0
2
4
6
8
10
12
94/95 95/96 96/97 97/98 98/99 99/00 00/01
Percentage o fworkers
70+ µg/100ml 60-70 µg/100ml 50-60 µg/100ml

Riskiest industries for injuries and ill health 21
Figure 54: Rate of reported major injury to employees, per 100 000, by SIC 92 Industry Section, 2001/02p
109.5
286.7
301.5
333.3
340.5
347.5
391.9
463
506.9
596.2
631.1
652.1
803.9
0 100 200 300 400 500 600 700 800 900
All industries
Manufacture of food products and beverages (SIC 15)
Manufacture of other non-metallic mineral products (SIC 26)
Construction (SIC 45)
Sew age and refusal disposal (SIC 90)
Other mining and quarrying (SIC 14)
Manufacture of basic metals (SIC 27)
Recycling of w aste and scrap (SIC 37)
Manufacture of w ood and w ood products (SIC 20)
Forestry, logging (SIC 02)
Railw ays (SIC 6010)
Collection, purif ication and distribution of w ater (SIC 41)
Mining of coal and lignite (SIC 10)
Major injury rate per 100 000 employeesSIC 92 - Standard Industrial Classif ication (1992)
Figure 55: Estimated prevalence rates of self-reported illness caused or made worse by current ormost recent job, by SIC 92 Industry Section, per 100 000 people working in the last 8 years, 2001/02
6500
5700
5600
5600
5400
5200
5000
4400
3900
3800
3300
2900
2700
4300
0 1000 2000 3000 4000 5000 6000 7000 8000 9000
Agriculture, hunting, forestry and f ishing (SIC A&B)
Public administration and defence (SIC L)
Construction (SIC F)
Energy and w ater supply (SIC C&E)
Education (SIC M)
Health and social w ork (SIC N)
Transport, storage and communication (SIC I)
Manufacturing (SIC D)
Financial intermediation (SIC J)
Other community, social and personal service activities (SIC O)
Real estate, renting and business activities (SIC K)
Wholesale, retail and motor trade (SIC G)
Hotels and restaurants (SIC H)
All industries
Prevalence rate (per 100 000)Central estimate 95% confidence interval
More at http://www.hse.gov.uk/statistics/pdf/swi07.pdf

Dangerous Occurrences and Gas Safety 22 (See tables 16 & 17)
��In 2001/02, 9899 dangerous occurrences were reportedto HSE, an increase of 57 (0.6%) compared with theprevious year, but a decrease of 7% from 1998/99, whenthe largest number of dangerous occurrences were reported since the introduction of RIDDOR 95.
��
��
��
��
��
��
��
RIDDOR 95 reports dangerous occurrences under fivesections. In 2001/02, the number of dangerousoccurrences reported were:
5061 (51%) in relation to railways4196 (42%) in relation to any place of work462 (5%) in relation to offshore workplaces93 (0.9%) in relation to quarries87 (0.9%) in relation to mines.
In 2001/02, the total number of occurrences reported inrelation to any place of work and to offshoreworkplaces decreased, whereas the number ofoccurrences reported in relation to mines, quarries andrailways increased.
��
��
Of the dangerous occurrences reported in relation to any place of work, 29% were due to failure of liftingmachinery in 2001/02 compared with 24% in 2000/01,and 18% were due to the escape of substances.
More at http://www.hse.gov.uk/statistics/pdf/tabledo1.pdf
The total number of incidents involving the supply anduse of flammable gas and causing injury has decreased by15% in 2001/02 to 148 from 174 in 2000/01. This isthe lowest number of incidents over the past five years,and follows a previous upward trend in the last fiveyears.
��In 2001/02, there were 29 fatal injuries resulting fromincidents involving gas , a drop of 12% from the previousyear. Of these 24 fatal injuries were due to carbonmonoxide poisoning and 5 were due to an explosion or fire.
��The number of non-fatal injuries resulting from incidentsinvolving gas, decreased by 34% in 2001/02 to 198. Thisfollows an upward trend in the past five years.
More at http://www.hse.gov.uk/statistics/pdf/tablegs1.pdf
Figure 56: Number of dangerous occurrencesreported to HSE 1992/93 - 2001/02p
0
2000
4000
6000
8000
10000
12000
92/93 93/94 94/95 95/96 96/97 97/98 98/99 99/00 00/01 01/02p
Number ofoccurrences
Number of dangerous occurrences
Figure 57: Number of injuries relating to the supplyand use of flammable gas 1992/93 - 2001/02p
0
50
100
150
200
250
300
350
92/93 93/94 94/95 95/96 96/97 97/98 98/99 99/00 00/01 01/02p
Number o finjuries
Number o f fatal injuries Number of reported non-fatal injuries

Enforcement 23 (See tables 18, 19 & 20)
��In 2000/01, there were 16 866 enforcement noticesissued by all enforcing authorities, a 3% decrease on theprevious year. Statistics for enforcement notices for2001/02 issued by local authorities are not yet available,but the number issued by local authorities droppedsubstantially from 26 980 in 1992/93 to 5810 in 2000/01.
��
��
��
��
��
In 2001/02 HSE issued 11 009 enforcement notices, 47 less than the year before. The number of notices fell inthe early 1990s from 11 914 in 1992/93 to 7444 in1996/97 but has risen since. The figure for 2001/02 is8% lower than ten years ago in 1992/93.In 2001/02, the number of improvement notices issuedby HSE decreased in agriculture and the extractiveindustries, but increased in all other industries. Thenumber of prohibition notices increased in all industriesexcept agriculture.
In 2001/02, there were 2035 informations laid by HSE,one of the highest numbers reported and a 3% increasefrom 2000/01. The number generally fell in the early1990s to 1490 in 1996/97, and rose till 1999/2000.The number of informations laid in the main industriesfluctuates year on year, but the number is higher that itwas five years ago in all industries apart fromconstruction.In 2001/02, the proportion of informations laid by HSEwhich resulted in a conviction was 73%, compared with76% in 2000/01 and 1999/2000. This proportion rangedfrom 63% in the extractive industries to 70% in the services sector.
��
��
��
��
The average fine for offences which lead to a convictionunder health and safety legislation brought by HSE in2001/02 was £8 284, this is the highest fine in the lastfive years.
Statistics for 2001/02 for prosecutions by localauthorities are not yet available. In 2000/01, therewere 401 informations laid by local authorities, adecrease of 21% compared with 1997/98, when thehighest number was reported since 1993/94.In 2000/01 the proportion of informations laid by localauthorities that lead to a conviction was 88% comparedwith 78 % in 1999/2000.The average fine per conviction by local authorities was£3 903 in 2000/01, a decrease of 15% from the previousyear when the highest fine in the last four years wasreported.
More at http://www.hse.gov.uk/statistics/enforce/ and http://www.hse.gov.uk/enforce/off01-02.pdf
Figure 58: Number of enforcement notices issued byenforcing authorities 1992/93 - 2000/01
0
5000
10000
15000
20000
25000
30000
35000
40000
45000
92/93 93/94 94/95 95/96 96/97 97/98 98/99 99/00 00/01
Number o fenforcement
notices
Number of notices issued by HSE Number o f no tices issued by local authorities
Figure 59: Number of informations laid andconvictions by HSE 1992/93 - 2001/02p
0
500
1000
1500
2000
2500
92/93 93/94 94/95 95/96 96/97 97/98 98/99 99/00 00/01 01/02p
Number o finfo rmations
laid/convictions
Number of informations laid Number of convictions
Figure 60: Number of informations laid andconvictions by local authorities 1992/93 - 2000/01
0
100
200
300
400
500
600
700
800
900
92/93 93/94 94/95 95/96 96/97 97/98 98/99 99/00 00/01
Number o finfo rmations
laid/convictions
Number o f informations laid Number of convictions

Injury tables 24 Table 1: Number and rate of reported fatal injuries to workers
92/93 93/94 94/95 95/96 96/97 97/98 98/99 99/00 00/01 01/02pNumber 276 245Employees 191 209 207 212 188 162 213 204Rate (a) 1.3 1.2 0.9 1.0 0.9 0.9 0.8 0.7 0.9 0.8Number 63 51 81Self-employed 49 80 62 65 58 79 45Rate (b) 2.0 1.6 2.5 1.5 2.3 1.8 1.9 1.7 2.4 1.3Number 339 296 272 258 287 274 253 220 292 249Workers Rate (c) 1.4 1.2 1.1 1.0 1.1 1.0 0.9 0.8 1.0 0.9
Table 2: Number and rate of reported major* injuries to workers
92/93 93/94 94/95 95/96 96/97 97/98 98/99 99/00 00/01 01/02pNumber 16938 16705Employees 17041 16568 27964 29187 28368 28652 27524 27477Rate (a) 80.3 79.3 80.4 77.1 127.5 127.6 121.7 116.6 110.2 109.5Number 1115 1274Self-employed 1313 1166 1356 815 685 663 630 906Rate (b) 35.8 40.6 40.4 36.0 38.4 23.3 20.3 19.7 19.2 27.1Number 18053 17979 18354 17734Workers 29320 30002 29053 29315 28154 28383Rate (c) 74.6 74.2 75.1 71.7 115.1 113.8 108.8 104.9 99.6 99.8
Table 3: Number and rate of reported over-3-day* injuries to workers
92/93 93/94 94/95 95/96 96/97 97/98 98/99 99/00 00/01 01/02pNumber 141147 134928 139349 130582 127286 134789 132295Employees 135381 134105 127084Rate (a) 669.0 640.2 657.2 607.4 580.1 589.2 567.3 550.9 536.9 506.3
Self-employed Number 2136 2531 2869 2394 2282 984 849 732 715 895Rate (b) 68.5 80.7 88.4 73.8 64.6 28.1 25.2 21.8 21.8 26.8Number 143283 137459Workers 142218 132976 129568 135773 133144 136113 134820 127979Rate (c) 591.8 567.7 581.6 537.5 508.7 514.8 498.8 487.3 477.1 450.0
Table 4: Number of reported fatal and reported non-fatal* injuries to members of the public
92/93 93/94 94/95 95/96 96/97 97/98 98/99 99/00 00/01 01/02pFatal 113 107 104 86 367 393 369 436 444 384Non-fatal (d) 10669 11552 12642 13234 35694 28613 23800 25059 20836 14362
(a) Per 100 000 employees(b) Per 100 000 self-employed(c) Per 100 000 workers(d) The definition of a non-fatal injury to members of the public is different to that of a worker (see technical note).* Non-fatal (major and over-3-day) injury statistics from 1996/97 cannot be compared with earlier years (see Technical note on page 30).
Table 5: Rates of all reported non-fatal injuries and averaged LFS rate of reportable non-fatal injury to workers
89/90 94/95 95/96 96/97 97/98 98/99 99/00 00/01 01/02pLFS reportable (workers) 2480 1740 1640 1590 1510 1490 1500 1530 n/aRIDDOR reported (employees) 835 738 684 708 717 689 667 647 616Percentage of injuries reported 33.6 42.5 41.6 44.6 47.4 46.2 44.4 42.3 n/a
Table 6: Revitalising Indicator - Rates of reported fatal and major injury
96/97 97/98 98/99 99/00 00/01 01/02pRate of reported fatal and major injury (a) 128.6 128.6 122.6 117.4 111.2 110.4Uprated rate of fatal and major injury (b) 286.9 270.4 264.1 263.2 261.6 268.9
(a) Rate of fatal injury per 100 000 workers plus the rate of major injury per 100 000 employees.(b) Rate of fatal injury per 100 000 workers plus the rate of major injury uprated for under-reporting, using a reporting level derived from an averaged
Labour Force Survey (LFS) rate for each year. The level used for 2001/02 is 40.9%, a projection from reporting levels in 1997/98 to 2000/01.

Injury tables 25 Industries - rates of reported fatal injury to workers (a), reported non-fatal* injury to employees (b) and averaged rateof reportable injury from the LFS to workers (a)
Table 7: In agriculture, hunting, forestry and fishing
92/93 93/94 94/95 95/96 96/97 97/98 98/99 99/00 00/01 01/02pFatal (a) 7.5 7.3 8.5 8.0 10.8 7.5 9.3 7.7 10.2 9.2Major (b) 144.2 147.1 142.6 158.6 256.9 223.3 205.6 224.4 213.9 239.3Over-3-day (b) 483.0 436.1 441.8 497.3 552.0 443.9 427.5 487.0 493.3 621.9LFS reportable (a) n/a n/a 2290 2180 2020 1830 2270 2520 2760 n/a
Table 8: In extractive and utility supply industries (c)
92/93 93/94 94/95 95/96 96/97 97/98 98/99 99/00 00/01 01/02pFatal (a) n/a n/a n/a 7.7 4.0 8.0 5.0 3.5 4.4 7.6Major (b) 255.6 235.5 194.6 225.9 315.1 282.7 246.8 244.1 267.0 250.6Over-3-day (b) 2066.9 1767.7 1587.0 1411.5 1402.8 1482.6 1347.9 1254.9 1354.7 1239.1
Table 9: In manufacturing
92/93 93/94 94/95 95/96 96/97 97/98 98/99 99/00 00/01 01/02pFatal (a) 1.3 1.5 1.3 1.0 1.4 1.4 1.6 1.0 1.2 1.2Major (b) 136.2 138.6 138.9 130.5 206.4 216.1 201.5 204.1 194.2 187.4Over-3-day (b) 1219.0 1162.1 1193.7 1067.4 1002.8 1026.1 969.8 1007.9 998.8 936.4LFS reportable (a) n/a n/a 2230 2130 1960 1980 1960 2110 2080 n/a
Table 10: In construction
92/93 93/94 94/95 95/96 96/97 97/98 98/99 99/00 00/01 01/02pFatal (a) 5.9 5.7 5.1 5.0 5.6 4.6 3.8 4.7 5.9 4.2Major (b) 230.4 214.4 221.2 224.0 403.0 382.3 402.7 395.9 380.9 333.3Over-3-day (b) 1277.6 1127.4 1139.4 1030.3 1078.6 966.3 863.4 917.0 829.2 758.8LFS reportable (a) n/a n/a 2970 2550 2700 2430 2590 2530 2580 n/a
Table 11: In health services
96/97 97/98 98/99 99/00 00/01 01/02pFatal (b) 0.1 - - - 0.1 0.1Major (b) 94.2 94.3 93.1 84.1 78.3 77.7Over-3-day (b) 766.2 737.5 745.5 671.2 618.7 610.4LFS reportable (b) 1920 1720 1480 1450 1280 n/a
Table 12: In service industries
92/93 93/94 94/95 95/96 96/97 97/98 98/99 99/00 00/01 01/02pFatal (a) 0.7 0.5 0.5 0.4 0.4 0.4 0.3 0.3 0.4 0.3Major (b) 51.2 51.3 53.5 50.1 90.8 88.4 83.7 79.5 75.3 78.7Over-3-day (b) 462.3 459.9 479.4 447.5 444.9 456.1 450.8 430.0 423.4 403.6LFS reportable (a) n/a n/a 1460 1410 1360 1290 1250 1240 1280 n/a
Table 13: Number of reported fatal injuries to workers by kinds of accident
92/93 93/94 94/95 95/96 96/97 97/98 98/99 99/00 00/01 01/02pFalls from a height (d) 90 81 79 64 88 92 80 68 74 68Struck by a moving vehicle 51 46 45 42 43 45 48 34 64 40Struck by moving/falling object 45 33 39 32 57 41 41 35 51 43Trapped by somethingcollapsing/overturning 36 52 33 41 16 25 15 16 40 8
Total workers (e) 339 296 272 258 287 274 253 220 292 249

Injury tables 26
Table 14: Number of reported major* injuries to employees by kinds of accident
92/93 93/94 94/95 95/96 96/97 97/98 98/99 99/00 00/01 01/02pFalls from a height (d) 3741 3503 3552 3530 5023 5382 5454 5500 5286 3996Slips, trips or falls on the same level 5513 5962 5941 5800 8562 8671 9007 9087 9054 10118Struck by moving/falling object 2013 2010 2046 1978 4606 4739 4287 4370 3988 3993Injured while handling, lifting or carrying 1092 1087 1235 1134 2745 3002 2894 2862 2695 2809Struck by a moving vehicle 565 524 574 572 903 915 928 959 823 722Total employees (e) 16938 16705 17041 16568 27964 29187 28368 28652 27524 27477
Table 15: Number of reported over-3-day* injuries to employees by kinds of accident
92/93 93/94 94/95 95/96 96/97 97/98 98/99 99/00 00/01 01/02pSlips, trips or falls onthe same level 28501 28441 28537 26790 24537 25883 26687 27615 28552 29509
Struck bymoving/falling object 19716 18809 20082 18663 18283 18772 18029 18293 16892 16008
Injured while handling,lifting or carrying 49664 46885 48563 45015 46366 50640 49044 48729 48327 48000
Struck by a movingvehicle 3427 3217 3460 3327 2810 3071 2934 3172 3128 2085
Total employees (e) 141147 134928 139349 130582 127286 134789 132295 135381 134105 127084
(a) Per 100 000 workers.(b) Per 100 000 employees.(c) LFS rates are not available for this sector due to the numbers being relatively small.(d) Falls from a height include falls from, up to and including 2 metres, over 2 metres and height not known.(e) The total number of injuries includes other kinds of accident not shown in the table.
* Non-fatal (major and over-3-day) injury statistics from 1996/97 cannot be compared directly with earlier years due to the introduction of revisedinjury reporting requirements (RIDDOR 95) in 1996.
n/a not available
Table 16: Number of dangerous occurrences reported to HSE
96/97 97/98 98/99 99/00 00/01 01/02pPart 1(Notifiable in relation to any place of work) 3829 4273 4333 4479 4333 4196Part 2 (Notifiable in relation to mines) 70 96 114 79 77 87Part 3 (Notifiable in relation to quarries) 114 105 122 92 63 93Part 4 (Notifiable in relation to railways) 5197 5218 5625 5309 4825 5061Part 5 (Notifiable in relation to offshore workplaces) 347 403 446 453 544 462Total dangerous occurrences 9557 10095 10640 10412 9842 9899
Table 17: Number of incidents relating to the supply and use of flammable gas
96/97 97/98 98/99 99/00 00/01 01/02pExplosion/fire 40
Number of incidents45 37 56 38 43
Carbon monoxide poisoning 103 119 114 118 136 105Total 143 164 151 174 174 148Explosion/fire 9 8 11 10
Number of fatal injuries8 5
Carbon monoxide poisoning 31 28 37 26 25 24Total 40 36 48 36 33 29Explosion/fire
Number of non-fatalinjuries
35 43 30 61 36 46Carbon monoxide poisoning 156 189 194 228 265 152Total 191 232 224 289 301 198
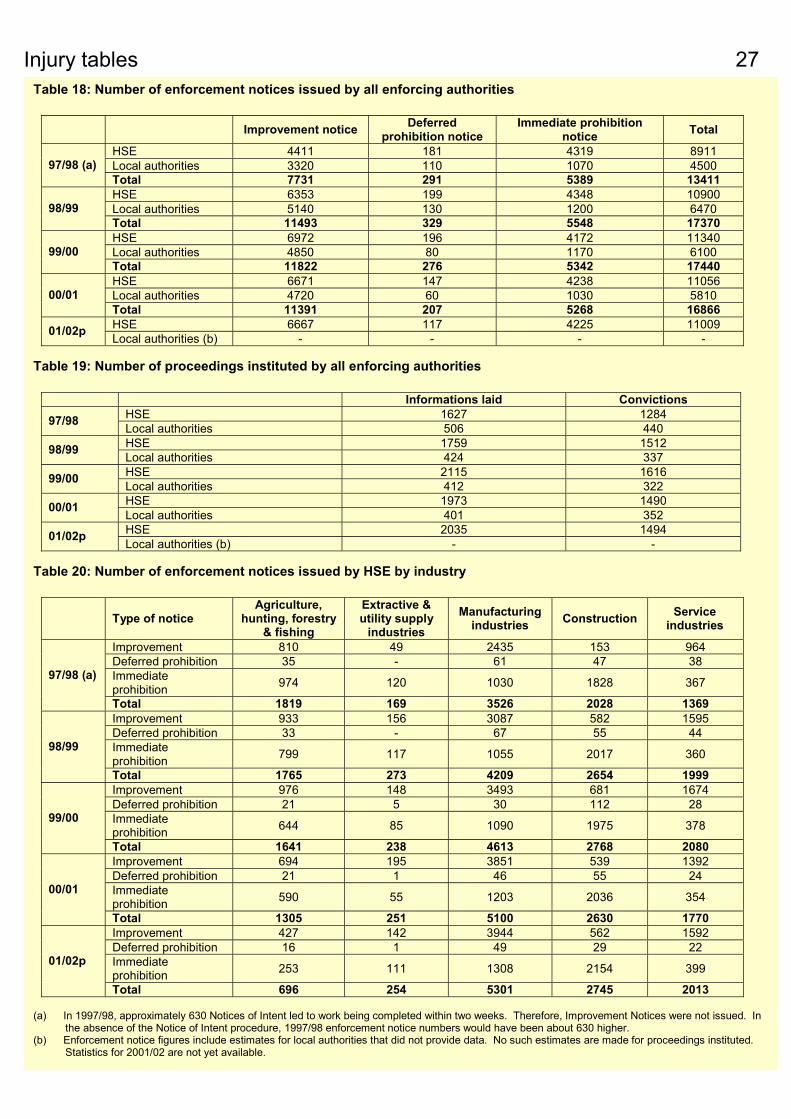
Injury tables 27 Table 18: Number of enforcement notices issued by all enforcing authorities
Improvement notice Deferredprohibition notice
Immediate prohibitionnotice Total
HSE 4411 181 4319 8911Local authorities 3320 11097/98 (a) 1070 4500Total 7731 291 5389 13411HSE 6353 199 4348
98/9910900
Local authorities 5140 130 1200 6470Total 11493 329 5548 17370HSE 6972 196 4172 11340Local authorities 4850 80 1170 610099/00Total 11822 276 5342 17440HSE 6671
00/01147 4238 11056
Local authorities 4720 60 1030 5810Total 11391 207 5268 16866HSE 6667 117 4225 1100901/02p Local authorities (b) - - - -
Table 19: Number of proceedings instituted by all enforcing authorities
Informations laid ConvictionsHSE 1627 128497/98 Local authorities 506 440HSE 1759 151298/99 Local authorities 424 337HSE 2115 161699/00 Local authorities 412 322HSE 1973 149000/01 Local authorities 401 352HSE 2035 1494Local authorities (b) - -01/02p
Table 20: Number of enforcement notices issued by HSE by industry
Type of notice Agriculture,
hunting, forestry& fishing
Extractive &utility supply
industriesManufacturing
industries Construction Serviceindustries
Improvement 810
97/98 (a)
49 2435 153 964Deferred prohibition 35 - 61 47 38Immediateprohibition 974 120 1030 1828 367
Total 1819 169 3526 2028 1369Improvement 933 156 3087
98/99
582 1595Deferred prohibition 33 - 67 55 44Immediateprohibition 799 117 1055 2017 360
Total 1765 273 4209 2654 1999Improvement
99/00
976 148 3493 681 1674Deferred prohibition 21 5 30 112 28Immediateprohibition 644 85 1090 1975 378
Total 1641 238 4613 2768 2080Improvement
00/01
694 195 3851 539 1392Deferred prohibition 21 1 46 55 24Immediateprohibition 590 55 1203 2036 354
Total 1305 251 5100 2630 1770Improvement 427 142 3944
01/02p
562 1592Deferred prohibition 16 1 49 29 22Immediateprohibition 253 111 1308 2154 399
Total 696 254 5301 2745 2013
(a) In 1997/98, approximately 630 Notices of Intent led to work being completed within two weeks. Therefore, Improvement Notices were not issued. Inthe absence of the Notice of Intent procedure, 1997/98 enforcement notice numbers would have been about 630 higher.
(b) Enforcement notice figures include estimates for local authorities that did not provide data. No such estimates are made for proceedings instituted.Statistics for 2001/02 are not yet available.

Ill health tables 28 Table 21: Estimated prevalence of self-reported illness caused or made worse by work, by type of complaint, forpeople ever employed, 2001/02
Estimated prevalence (a) (thousands)Type of complaint Sample cases
95% C.I. Central estimatelower upper
Musculoskeletal disorders 2439 1126 1081 1172 mainly affects the upper limbs or neck 867 396 369 423 mainly affects the lower limbs 460 209 190 229 mainly affects the back 1112 520 489 552Breathing or lung problem 380 168 151 185Skin problems 82 39 30 48Hearing problems 202 87 75 100Stress, depression or anxiety 1186 563 530 596Heart disease/attack, other circulatory system 176 80 68 92Headache and/or eyestrain 108 54 43 65Infectious disease (virus, bacteria) 67 33 25 41Other types of complaint 362 171 153 189Missing 13 .. .. ..
All persons 5015 2328 2261 2394
.. Not applicable 95% C.I.: 95% confidence interval, the range within which we are 95% confident that the true value lies.
(a) The estimates in this table (and Figure 10) are based on the Self-reported Work-related Illness (SWI) survey for 2001/02. They are not comparablewith the results of earlier SWI surveys because of differences in design, coverage and the level of information collected. Please see Technical Noteon Page 32.
Table 22: Comparison of estimated 1990, 1995, 1998/99 and 2001/02 prevalence rates of self-reported illness causedor made worse by work, by type of complaint, for people working in the last 12 months in England and Wales
Rate per 100 000 employed in last 12 monthsType of complaint Year (b) Sample cases 95% C.I.Central estimate lower upper
1990 2900 5900
All persons
5700 62001995 940 6300 5900 6700
1998/99 2662 4700 4500 49002001/02 2789 5000 4800 5200
1990 1342 2800 2600Musculoskeletal
disorders
29001995 544 3600 3300 4000
1998/99 1146 2000 1900 21002001/02 1232 2200 2100 2300
1990 399Stress and related
conditions (a)
820 730 9001995 168 1100 900 1200
1998/99 931 1600 1500 18002001/02 961 1700 1600 1800
95% C.I.: 95% confidence interval, the range within which we are 95% confident that the true value lies.(a) Includes stress, depression or anxiety and heart conditions.(b) The estimates in this table (and in Figure 11) are based on four separate SWI surveys, each linked to the Labour Force Survey in the year concerned.
They have been adjusted such that the coverage is approximately consistent but comparisons will still be affected by factors such as differences inquestion wording and survey design. Please see Technical Note on Page 32.

Ill health tables 29 Table 23: Estimated incidence and rates of self-reported illness caused or made worse by work, by type of complaint, 2001/02 (a)
95% C.I. Type of complaint Samplecases
Centralestimate
lower upperEstimated incidence (thousands) for people ever employed All persons 1427 686 649 723 Musculoskeletal disorders 495 240 219 262 Stress, depression or anxiety 559 265 242 288Estimated incidence rates per 100 000 employed in the last 12 months All persons 1340 2200 2100 2300 Musculoskeletal disorders 455 760 690 830 Stress, depression or anxiety 550 880 810 960
95% C.I.: 95% confidence interval, the range within which we are 95% confident that the true value lies.(a) The estimates in this table (and the 2001/02 data in Figure 14) are based on the Self-reported Work-related Illness (SWI) survey for 2001/02. They
are not comparable with the results of the 1995 SWI survey because of differences in design, coverage and the level of information collected.Please see Technical Note on Page 32.
Table 24: Estimated number of working days lost due to work-related ill health and workplace injuries, 2000-02
Days lost (thousands) Average days lost per caseSurvey period 95% C.I. 95% C.I.Central
estimateCentral
estimatelower upper lower upperDays lost due to work-related ill health (full-day equivalent) (a)2001/02 Total 32906 30151 35661 22.9 21.1 24.6
Musculoskeletal disorders 12276 10631 13921 19.4 17.0 21.8Stress, depression or anxiety 13401 11606 15196 29.2 25.8 32.6
Days lost due to workplace injuries2000/01 Total 7257 6321 8192 14.5 12.6 15.3Days lost due to work-related ill health and workplace injuries (b) 2000-02 Total 40163 36800 43526 n/a n/a n/a
95% C.I.: 95% confidence interval, the range within which we are 95% confident that the true value lies.(a) The estimates of days lost due to ill health in this Table (and the 2001/02 data in Figures 12 and 15) are based on the Self-reported Work-related
Illness (SWI) survey for 2001/02. They are not comparable with those from the 1995 SWI survey because of differences in design, coverage and thelevel of information collected. Please see Technical Note on Page 32.
(b) The total estimates in this table (and in Figure 15) combine estimates for injuries and ill health from different dates, and using somewhat differentmethodologies. The estimates for 2004/05 and 2009/10 are planned to be from single surveys. The methodologies are currently being reviewed toensure greater consistency between the two estimates. The 95% CI for the total has been estimated by assuming that the lower and upper limits are the same proportions of the central estimate as for ill health.
n/a: not available
Table 25: Time series for selected occupational diseases (various sources) (a)
Year Mesothelioma(death
certificates)
Asbestosis(IIS assessed
cases) (b)
OtherPneumoconiosis
(IIS assessed cases)
Deafness(IIS assessed
cases) (b)
Asthma(ODIN reports)
(c)
Dermatitis(ODIN reports)
1987 814 282 441 1202 n/a n/a1988 872 225 392 1261 n/a n/a1989 909 280 419 1170 n/a n/a1990 895 306 403 1128 n/a n/a1991 1023 330 421 1041 n/a n/a1992 1097 354 411 972 1047 n/a1993 1152 418 435 901 877 n/a1994 1246 376 630 882 941 n/a1995 1317 427 433 763 851 n/a1996 1322 479 362 531 1136 36431997 1367 344 249 413 1031 31241998 1541 316 554 258 808 35871999 1613 407 461 316 1129 39332000 1628 447 419 226 785 34102001 n/a 461 510 263 650 2782
n/a: not available(a) For descriptions of the sources please see Technical Note on Page 31.(b) Asbestosis and other pneumoconiosis data exclude cases under the Pneumoconiosis Byssinosis and Miscellaneous Diseases Benefit (PBMDB)
scheme.(c) Asthma data relate to United Kingdom up to 1997 and Great Britain from 1998.
Safety technical note 30
Certain reporting requirements under RIDDOR 95 differ from those under the previous regulations, RIDDOR 85. Forexample, the definition of a major injury to workers was widened and that of members of the public was altered to include the hospital criterion. Therefore statistics of worker fatalities are comparable, but other injury statistics including major injuries,dangerous occurrences from 1996/97 cannot be compared with those for previous years. RIDDOR 95 also introduced acts of violence at work, and acts of suicide or trespass on railways or other transport systems.
Injuries which are not reportable under RIDDOR 95 are: road traffic accidents involving people traveling in the course of theirwork, which are covered by road traffic legislation; accidents reportable under separate merchant shipping, civil aviation and airnavigation legislation; accidents to members of the armed forces; and fatal injuries to the self-employed arising out of accidentsat premises which the injured person either owns or occupies.
Selected incidents which have a high potential to cause death or serious injury, but which happen relatively frequently are reportable under RIDDOR 95 as dangerous occurrences. A dangerous occurrence is reportable whether or not someone isinjured. Statistics reported from 1996/97 are reported under RIDDOR 95, while statistics prior to 1996/97 were reportedunder RIDDOR 85. The updated reporting requirements differ considerably from RIDDOR 85, including an extra sectionrelating dangerous occurrences to offshore workplaces was added.
Injury rates for employees produced by HSE are based on employment estimates produced by the Office for National Statistics(ONS). The Short Term Employment Survey is used to obtain top level employment data and the Annual Business Inquiry hasbeen used to obtain SIC 92 four-digit employment data since 2000/01, previously this was taken from the Annual EmploymentSurvey. Such estimates are normally subject to a number of revisions based on information from the Annual EmploymentSurvey. When HSE finalises the provisional injury statistics, rates are revised using the employment data available at thatparticular time. Injury rates are not revised to incorporate subsequent revisions to employment estimates by the ONS.
HSE developed the Labour Force Survey (LFS) as a source of information on workplace injury, to complement the flow of the injury reports made by employers and others under RIDDOR. HSE placed a supplement of detailed questions on workplaceinjury in the 1990 LFS, and has placed a limited set of injury questions annually since 1993. The LFS gives estimates on the levelsof workplace injury which are not subject to under-reporting, and together with the rates of reported injury, give estimates ofthe levels of reporting of injuries in industries. LFS injury rates are presented as three year moving averages, to reduce annualfluctuations which stem from sampling error (2000/01 rate is the average of 1999/2000, 2000/01, and 2001/02 surveys).
Every three years a further question is asked to establish the actual number of days off work following the workplace injury.The total working days lost figure is based on those injuries that result in at least one full day being taken off work. No estimates are made for the small proportion of people who are still off work following an injury at the time of interview, or expect never to return to work. Further results and background information are available in the LFS fact sheet(http://www.hse.gov.uk/statistics/2002/lfsfct01.pdf).
Enforcement - HSE inspectorates and local authorities issue three types of enforcement notices. These are: improvementnotices (requires employers to put right a contravention of health and safety legislation within a specified time limit); immediateprohibition notices (stops work activity that gives, or will give, rise to a risk of serious personal injury); and deferred notices(which stop a work activity with a specified time).
Prosecution statistics are based on the informations laid by inspectors before the courts in England and Wales and on thecharges preferred in Scottish courts. Conviction statistics are based on the number of informations laid which resulted in a conviction. The remaining informations laid are those which resulted in withdrawals, verdicts of not guilty etc. Informationslaid are counted against sections of regulations cited in the case.
Safety - Injury and dangerous occurrence statistics given in this report for 1996/97 - 2001/02 were complied from reportsmade to HSE and local authorities under the Reporting of Injuries, Disease and Dangerous Occurrences Regulations 1995 (RIDDOR 95). These Regulations came into effect on 1 April 1996 and replaced RIDDOR 85, the Railways (Notice ofAccidents) Order 1986, and certain provisions of the Offshore Installations (Inspectors and Casualties) Regulations 1973 andthe Submarine Pipelines (Inspectors etc) Regulations 1977. Certain provisions of the Regulation of Railways Act 1871 and the Transport and Works Act 1992 were also repealed or amended.
Deaths of all employed people and members of the public arising from work activity are reportable to either HSE or the localauthority. There are three categories of reportable injury to workers defined under the regulations: fatal, major and over-3-day injury. Examples of major injuries include: fractures (except to fingers, thumbs or toes), amputations, dislocations (ofshoulder, hip, knee, spine) and other injuries leading to resuscitation or 24 hour admittance to hospital. Over-3-day injuriesinclude other injuries to workers which lead to their absence from work, or inability to do their usual job, for over three days.A non-fatal injury to a member of the public is reportable if it results in the injured person being taken from the site of theincident to hospital.

Ill health technical note More at http://www.hse.gov.uk/statistics/causdis/sources.htm 31
Background
The terms ‘occupational’ or ‘work-related’ ill health cover the wide range of disorders which can be attributed to a person’s work.Some, such as lead poisoning and asbestosis, are clearly occupational since the exposures which cause them are unlikely to be found outside work. However, many conditions which can be linked to work exposures may arise from a variety of factors: for example, back pain may be due to poor posture at work or at home, while stress may come from work pressures or from problems in outside life.
Another special feature of occupational ill health is that, unlike workplace injuries and fatalities, it normally does not occurimmediately after exposure to the hazard. There is a delay between exposure and ill health, which may range from a few hours (inthe case of some infectious diseases) to several decades (for many cancers).
The multifactorial nature of ill health, combined with its usually delayed effects, can make it difficult to attribute individual cases of ill health to causation by work factors. Attribution will be done differently by different people – e.g. doctors, employers andindividual workers – reflecting their own perspectives, knowledge and awareness. All of this means that work-related ill healthcannot be defined or measured in a single, straightforward way.
��
��
��
��
��
��
Sources
Because of this, no single source of information is available in Great Britain on the nature and full extent of occupational or work-related ill health. HSE’s policy is to make the fullest use of a range of data sources, and develop new ones where necessary. Thestatistics presented in this document are based on five main sources, mostly referred to by their acronyms:
SWI: Household surveys of self-reported work-related illness, giving estimates of the number of people who say that theyhave conditions which they think have been caused or made worse by work (regardless of whether they have been seen bydoctors). SWI surveys have been carried out, in conjunction with the Labour Force Survey, in 1990, 1995, 1998/99 and mostrecently 2001/02. SWI estimates are subject to sampling error and are generally presented with the associated 95% confidence intervals. More details of the SWI01/02 survey, and the methodological differences between it and SWI surveysfor previous years, are given below; a full report will be published in early 2003.
ODIN: Voluntary medical surveillance schemes in the Occupational Disease Intelligence Network, counting new cases whichare caused by work in the opinion of the specialist doctor who sees them. ODIN data are available from 1999 for work-related mental ill health, from 1998 for hearing loss, musculoskeletal disorders and infections, and from the early 1990s for respiratory and skin disorders, up to 2001. Research has been commissioned to estimate sampling errors and confidenceintervals for ODIN estimates but these are not yet available
IIS: Compensation under the Department for Work and Pensions’ Industrial Injuries Scheme, recording new cases of specified ‘prescribed diseases’ (conditions whose occupational cause is well established) assessed for Disablement Benefit. IISdata are available annually from at least the 1980s up to 2001 (for lung diseases) and 2000/01 (for non-lung diseases).
RIDDOR: Statutory reports by employers under HSE’s Reporting of Injuries, Diseases and Dangerous OccurrencesRegulations of cases of a defined list of diseases (similar to the IIS list of prescribed diseases) occurring in their employees.RIDDOR data, which are subject to far greater under-reporting for ill health than for injuries, are available from the 1980s upto 2001/02.
Death Certificates for some types of occupational lung disease, including mesothelioma and asbestosis (for these two diseases special registers are maintained by HSE). Again these are available for a long time series, the most recent data beingfor 2000.
In addition, more specific sources provide data for certain conditions or hazards:
SHAW: The Stress and Health at Work household survey in 1998, which reported on how stressful individuals believed theirjobs were.
��
�� uired underthe Control of Lead at Work Regulations, from which annual statistics are produced, most recently for 2000/01.
Progress measurement for the targets
plan to produce such integrated judgement about progress up to 2004/05, the mid-point of the strategy period, in late 2005.
MRC: Two Medical Research Council studies in 1997/98, which gave estimates of the numbers of people suffering fromwork-related deafness and from Vibration White Finger based on the fractions of the national prevalence attributable towork.
Blood-lead: The measurement of levels of lead in workers’ blood samples, as part of the medical surveillance req
Revitalising Health and Safety
HSE set out its technical approach to assessing progress against the Revitalising targets in a Statistical Note published in 2001(http://www.hse.gov.uk/statistics/statnote.pdf). The target for ill health incidence presents major challenges for measurement, notleast because of the multiple data sources described above. Work is under way to refine these sources, to develop new ones andto integrate estimates from all of them to give an overall judgement about progress against the target. Wean

Ill health technical note More at http://www.hse.gov.uk/statistics/causdis/sources.htm 32
CONTACTS
Enquiries about statistics for: Website: http://www.hse.gov.uk/statistics
Injuries arising from work activity, dangerous Work-related ill health should be addressed to:occurrences, gas safety and enforcementaction should be addressed to:
Safety and Enforcement Statistics Unit Epidemiology and Medical Statistics UnitHealth and Safety Executive Health and Safety ExecutiveRoom 518, Daniel House, Trinity Road, Bootle, Room 244, Magdalen House, Trinity Road, Bootle,Merseyside L20 7HE Merseyside L20 3QZTel: 0151 951 4842/3864 Tel: 0151 951 3479/3051
SWI01/02 methodology
For the SWI survey carried out in winter 2001/02, over 98 000 adults in Great Britain were administered the following screeningquestion as part of the Labour Force Survey (LFS):
“Within the last twelve months have you suffered from any illness, disability or other physical or mental problem thatwas caused or made worse by your job or work done in the past?”
Individuals answering ‘yes’ to this were then asked some further questions about their illness (the most serious if more thanone).
In the 1998/99 SWI survey, a programming error restricted the coverage to people working in the past 12 months rather thanpeople ever employed. SWI01/02 was a re-run of SWI98/99, which corrected this error and also included a question on when people had first become aware of their work-related illness (so permitting an estimate of the incidence of new cases) and a moredetailed breakdown of the amount of time they had taken off work (needed for estimating the number of lost working days).SWI01/02 therefore provides the first estimates since 1995 of overall self-reported illness prevalence, of incidence and ofworking days lost.
There are several important differences between SWI01/02 and the three earlier surveys, especially SWI95:SWI95 SWI01/02
Design Screening questions in main LFS. Positive responsesadministered a detailed follow-up questionnaire(proxy responses were not accepted).
Module of questions in main LFS (includingresponses by proxy – from another adult inthe same household – if respondent wasunavailable).
Question wording “… any illness, disability or other physical problem…”
“… any illness, disability or other physical ormental problem …”
Illnesses covered All illnesses (most serious illness was identified atfollow-up).
Most serious illness.
Information collectedon type of illness
Question within LFS classified illness(es) into 6disease groups. Follow-up questionnaire collectedmore detail.
Question within LFS classified illness(es) into11 disease groups. Limited number of questions.
Review of individualcases
All individual responses at follow-up (includinginformation provided by the respondent’s doctors)were reviewed, and excluded if the link between illness and work was implausible.
There was insufficient information to reviewand exclude cases.
These differences mean that only broad comparisons can be made over time, and even these need to be treated with caution.The prevalence rates in Figure 11 have been calculated to allow some comparison between the four surveys: restricted toEngland and Wales (since SWI90 did not cover Scotland) and to people who worked in the last 12 months (for consistency withSWI98/99), and with the SWI95 results based on screening questions asked in the main LFS (and therefore e.g. including the cases excluded by the review of individual responses). Estimates of incidence or working days lost are not available for all foursurveys and it is not possible to establish estimates of these for the remaining surveys with a similar level of reliability forcomparison purposes. Therefore Figures 14, 28 and 29 (incidence) and Figures 12 and 15 (days lost) show a discontinuitybetween the data for 1995 and 2001/02.
The estimates of working days lost from SWI01/02 include the effects of past workplace injuries. They are expressed as full-dayequivalent days, to take account of the variation in daily hours worked (for example part-timers who work a shorter day or people who work particularly long hours), by adjusting the days lost estimates using the ratio of the individual’s usual weeklyhours to the average usual weekly hours of all full-time workers estimated from the LFS. In SWI95, the adjustment was onlymade for part-time workers.

Made in the UK, Revive Silk is 75% recycled content comprises 35% de-inked post consumer waste and40% pre-consumer waste, the remaining being millbroke and virgin fibres
Printed and published by the Health and Safety Executive
MISC472 12/02 C40

http://www.hse.gov.uk/statistics/overpic.htm