heat monitoring plan in building for energy efficiency using thermal imaging · pdf...
TRANSCRIPT
Heat Monitoring Plan in Building for Energy Efficiency using Thermal Imaging Analysis
Angelo Galiano, *Alessandro Massaro, Donato Barbuzzi, Leonardo Pellicani and Vitangelo
Birardi Dyrecta Lab srl, Via V. Simplicio – 70014 Conversano (BA) - Italy
Abstract In this paper the authors discuss some useful procedures for energy efficiency in buildings. For this
purpose, it is necessary to simulate the temperature trend concerning a building. More specifically, a hybrid solar/photovoltaic system suitable for smart grid is considered, in order to define some generic critical aspects concerning energy efficiency. Starting from critical points, such as the analysis of temperature ripples and heat leakage, the authors provide a workflow procedure in order to plan the monitoring activities aimed to reduce energy losses. So, a part of this procedure involves the thermal imaging analysis. The authors focused the attention on a single thermal image, divided in 15 sub-images through the sliding windows approach, to predict the energy leakage around a window. For the experimental and numerical evaluation have been used both the k-Means algorithm for clustering and the Nearest Neighbor (NN) classifier to represent a particular risk map. RapidMiner tool has been used for the processing of the radiometric measurements. The proposed procedure provides important information about heat leakage associated to energy efficiency in building.
Keywords: Building Energy Efficiency, Thermal Imaging Technique, k-Means
1. Introduction
Both the modeling and the control of a hybrid renewable energy system represent important topics
for many researches in energy building management. In particular, some authors have studied how the optimal energy flows in a building, characterized by a mix of such renewable resources as solar plate collector, PV, biomass, wind and battery storage, in order to satisfy different energy demands and to offer the opportunity to diminish energy dependence [1] [2]. Recent studies have analyzed the integration of thermal supply systems into an energy management system, providing a heat demand prediction model [3]. The role of Information and Communication Technologies (ICT) seems to have reached an adequate level of reliability and flexibility, in order to support new concepts of electricity network and smart grid [4] [5]. Network Buildings represent indeed a new concept of electricity, since they are important contributors to energy consumption accounting for around one-third of energy consumed in cities: large public buildings are the dominant energy consumers, and energy consumption might be significantly decreased through Building Energy Management Systems (BEMS) [6] or by introducing innovative technologies. New technologies, concerning renewable wind energy systems based on energy-harvesting micro components [7] [8] have been discussed by some researchers with respect to the limits concerning the rectification of the electric current [8] and consequently about the whole energy system. For this purpose, it is relevant to focus the attention on actual commercial and traditional renewable energy systems by defining the best procedures to optimize energy efficiency in buildings. The energy optimization could be performed also by building monitoring during the time by using sensors and other instrumentations such as thermal cameras. For this purpose it is very important to define procedures oriented on the best energetic optimization, especially in leakage detections. In this direction the energy leakage detection using thermal imaging analysis has been investigated in the last decade [9-12]. Thermal camera produces an image with different colors representing infrared (IR) radiation emitters correlated with the different temperature between the object to measure and the external environment. According with this property an important “object” to measure are the windows which represent a critical part of the building as thermal bridge. Therefore, the goal of the proposed work is to define some steps of a useful procedure for the optimization of energy systems in buildings based on solar/photovoltaic hybrid technologies and monitoring approaches. The proposed steps are related to: (i) simulations of temperature trends, (ii)
Heat Monitoring Plan in Building for Energy Efficiency using Thermal Imaging Analysis Angelo Galiano, Alessandro Massaro, Donato Barbuzzi, Leonardo Pellicani, Vitangelo Birardi
Journal of Next Generation Information Technology(JNIT) Volume7, Number4, Dec. 2016
8
approaches to data analysis and to monitoring procedures, (iii) suggestions on the supporting technologies such as thermal cameras [13] and image post-processing tools, including data mining analysis.
2. Temperature Simulation
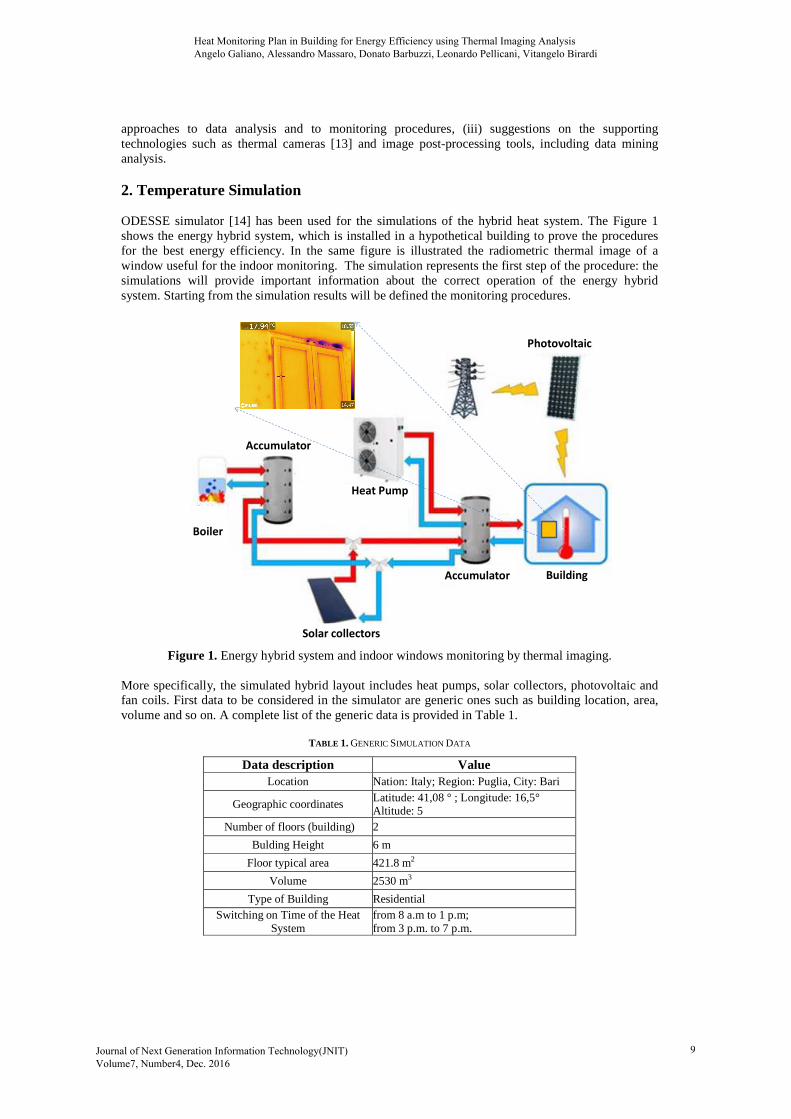
ODESSE simulator [14] has been used for the simulations of the hybrid heat system. The Figure 1 shows the energy hybrid system, which is installed in a hypothetical building to prove the procedures for the best energy efficiency. In the same figure is illustrated the radiometric thermal image of a window useful for the indoor monitoring. The simulation represents the first step of the procedure: the simulations will provide important information about the correct operation of the energy hybrid system. Starting from the simulation results will be defined the monitoring procedures.
Photovoltaic
Solar collectors
Building
Heat Pump
Accumulator
Accumulator
Boiler
Figure 1. Energy hybrid system and indoor windows monitoring by thermal imaging.
More specifically, the simulated hybrid layout includes heat pumps, solar collectors, photovoltaic and fan coils. First data to be considered in the simulator are generic ones such as building location, area, volume and so on. A complete list of the generic data is provided in Table 1.
TABLE 1. GENERIC SIMULATION DATA
Data description Value Location Nation: Italy; Region: Puglia, City: Bari
Geographic coordinates Latitude: 41,08 ° ; Longitude: 16,5° Altitude: 5
Number of floors (building) 2
Bulding Height 6 m
Floor typical area 421.8 m2
Volume 2530 m3
Type of Building Residential Switching on Time of the Heat
System from 8 a.m to 1 p.m; from 3 p.m. to 7 p.m.
Heat Monitoring Plan in Building for Energy Efficiency using Thermal Imaging Analysis Angelo Galiano, Alessandro Massaro, Donato Barbuzzi, Leonardo Pellicani, Vitangelo Birardi
Journal of Next Generation Information Technology(JNIT) Volume7, Number4, Dec. 2016
9
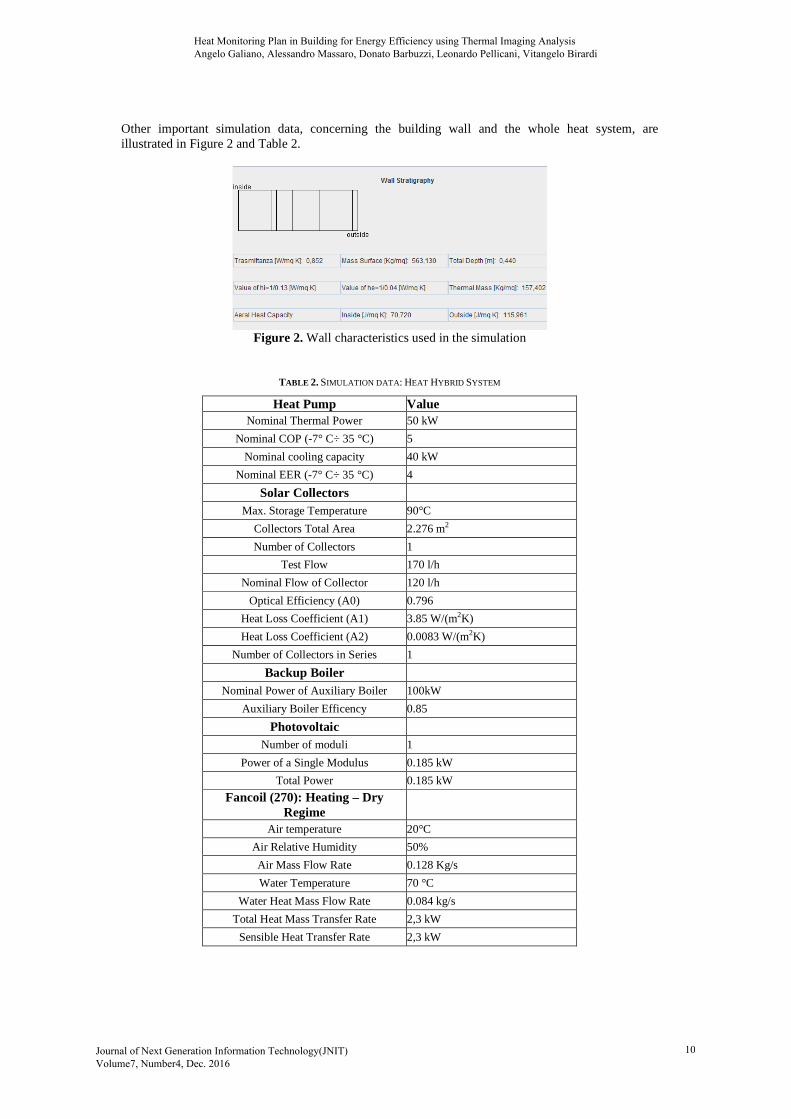
Other important simulation data, concerning the building wall and the whole heat system, are illustrated in Figure 2 and Table 2.
Figure 2. Wall characteristics used in the simulation
TABLE 2. SIMULATION DATA : HEAT HYBRID SYSTEM
Heat Pump Value Nominal Thermal Power 50 kW
Nominal COP (-7° C÷ 35 °C) 5
Nominal cooling capacity 40 kW
Nominal EER (-7° C÷ 35 °C) 4
Solar Collectors Max. Storage Temperature 90°C
Collectors Total Area 2.276 m2
Number of Collectors 1
Test Flow 170 l/h
Nominal Flow of Collector 120 l/h
Optical Efficiency (A0) 0.796
Heat Loss Coefficient (A1) 3.85 W/(m2K)
Heat Loss Coefficient (A2) 0.0083 W/(m2K)
Number of Collectors in Series 1
Backup Boiler Nominal Power of Auxiliary Boiler 100kW
Auxiliary Boiler Efficency 0.85
Photovoltaic Number of moduli 1
Power of a Single Modulus 0.185 kW
Total Power 0.185 kW
Fancoil (270): Heating – Dry Regime
Air temperature 20°C
Air Relative Humidity 50%
Air Mass Flow Rate 0.128 Kg/s
Water Temperature 70 °C
Water Heat Mass Flow Rate 0.084 kg/s
Total Heat Mass Transfer Rate 2,3 kW
Sensible Heat Transfer Rate 2,3 kW
Heat Monitoring Plan in Building for Energy Efficiency using Thermal Imaging Analysis Angelo Galiano, Alessandro Massaro, Donato Barbuzzi, Leonardo Pellicani, Vitangelo Birardi
Journal of Next Generation Information Technology(JNIT) Volume7, Number4, Dec. 2016
10
Storage volume 6m3
Security Storage Temperature 95°C
Envelope Thermal Transmittance 1 W/m°K
Form Factor 0.3 Input Water Temperature 15 °C
Output Water Temperature 65 °C
Thermal Power of Separated Boiler 10 kW
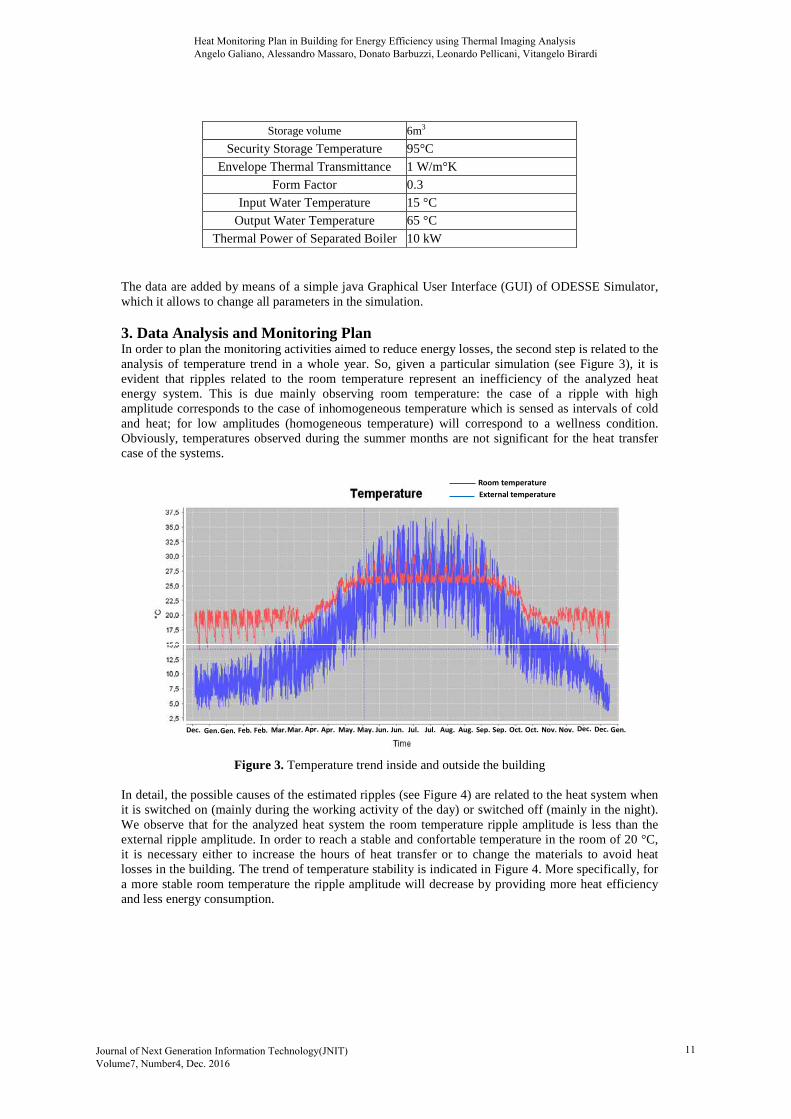
The data are added by means of a simple java Graphical User Interface (GUI) of ODESSE Simulator, which it allows to change all parameters in the simulation. 3. Data Analysis and Monitoring Plan In order to plan the monitoring activities aimed to reduce energy losses, the second step is related to the analysis of temperature trend in a whole year. So, given a particular simulation (see Figure 3), it is evident that ripples related to the room temperature represent an inefficiency of the analyzed heat energy system. This is due mainly observing room temperature: the case of a ripple with high amplitude corresponds to the case of inhomogeneous temperature which is sensed as intervals of cold and heat; for low amplitudes (homogeneous temperature) will correspond to a wellness condition. Obviously, temperatures observed during the summer months are not significant for the heat transfer case of the systems.
Dec. Gen.Gen. Feb. Feb. Mar.Mar. Apr. Apr. May. May. Jun. Jun. Jul. Jul. Aug. Aug. Sep. Sep. Oct. Oct. Nov. Nov. Dec. Dec. Gen.
Room temperature
External temperature
Figure 3. Temperature trend inside and outside the building In detail, the possible causes of the estimated ripples (see Figure 4) are related to the heat system when it is switched on (mainly during the working activity of the day) or switched off (mainly in the night). We observe that for the analyzed heat system the room temperature ripple amplitude is less than the external ripple amplitude. In order to reach a stable and confortable temperature in the room of 20 °C, it is necessary either to increase the hours of heat transfer or to change the materials to avoid heat losses in the building. The trend of temperature stability is indicated in Figure 4. More specifically, for a more stable room temperature the ripple amplitude will decrease by providing more heat efficiency and less energy consumption.
Heat Monitoring Plan in Building for Energy Efficiency using Thermal Imaging Analysis Angelo Galiano, Alessandro Massaro, Donato Barbuzzi, Leonardo Pellicani, Vitangelo Birardi
Journal of Next Generation Information Technology(JNIT) Volume7, Number4, Dec. 2016
11

0
5
10
15
20
25
0 10 20 30 40 50 60 70
External Temperature
Room Temperature
Hours
°C
Ripple
Ripple
System on System off
HeatTemperature stability
Hypothetical measurments
Figure 4. Temperature trend, inside and outside the building, related to the December month We observe that critical parts of building, which potentially generate inhomogeneous temperatures, are windows and doors interfacing with the external environment. Assuming that the external faces of windows and doors are energetically efficient, we will focus the attention on the indoor monitoring. 3.1 Temperature Analyses To define possible causes of inefficiency, it is important to compare simulation results respect to measured temperature. The comparison is necessary to understand the real temperature trend of the building, in order to find other different critical points respect to the energy hybrid system. For this purpose, temperature measurements should be performed during the same hours of a time window containing the ripple. We suppose, for example, that the temperature measurements have the same trend as the dashed green line of Figure 4. In this hypothetical case, temperature stability is not checked and more time is required to reach the best temperature of 20 °C. Possible main critical points responsible for the difference between simulated and measured results could be the windows and the doors of the building, especially for old structures (see Figure 5(a) an old windows behaving as a bad thermal bridge).
(a) (b)
Figure 5. (a) Old window frame with heat loss and (b) Single image acquired with a thermal camera An immediate way to check these critical elements is the real time monitoring by means of a thermal camera based on infrared light technology. The acquired thermal image provides different colors (see
Heat Monitoring Plan in Building for Energy Efficiency using Thermal Imaging Analysis Angelo Galiano, Alessandro Massaro, Donato Barbuzzi, Leonardo Pellicani, Vitangelo Birardi
Journal of Next Generation Information Technology(JNIT) Volume7, Number4, Dec. 2016
12

Figure 5(b)) respect to IR radiation emitters correlated with the different temperature between the object and the external environment.
Given a single image, to detect a particular leakage degree the sliding window approach is used. More specifically, the technique has been used to obtain a complete training set by one single image. The sliding window approach has been used in different topics such as the image segmentation for the handwritten character recognition [15]. We observe that in many cases, thermal monitoring is performed by only one image acquired in a defined time. For data mining approach usually it is important to acquire different thermal images for training and testing phases. In our approach we define a method which requires only a single image by allowing to reduce costs about specialist monitoring. For the radiometric image has been used a FLIR T640 camera, having the following main specifications: thermal sensitivity <0,035 °C at 30 °C, temperature range of -40°C to 2000°C, 640 x 480 pixels, frame rate of 30 Hz.
The thermal image has been divided in 15 zones (z11, …, z53) as in Figure 6.
Figure 6. Single image divided in 15 different zones
The FLIR tool, for pre-processing task, has been used to extract the features by each zone. Successively, the features have been imported in RapidMiner tool for clustering, using the k-Means algorithm, and classification, using NN algorithm, tasks. The whole process is described in appendix. Figure 7 shows heat leakage degree based on three different risk level, as described below:
• High heat leakage risk: 2,4 – 3 • Medium heat leakage risk: 1,7 - 2,3 • Low heat leakage risk:1 - 1,6
The decision rule has considered both the classification output in each row of the zone and the weight associated to it. So, the rule was: (#Cluster0*3+#Cluster1*2+#Cluster2*1)/96 where the Cluster0 grouped the rows with cold temperatures and Cluster2 hot temperatures.
Heat Monitoring Plan in Building for Energy Efficiency using Thermal Imaging Analysis Angelo Galiano, Alessandro Massaro, Donato Barbuzzi, Leonardo Pellicani, Vitangelo Birardi
Journal of Next Generation Information Technology(JNIT) Volume7, Number4, Dec. 2016
13
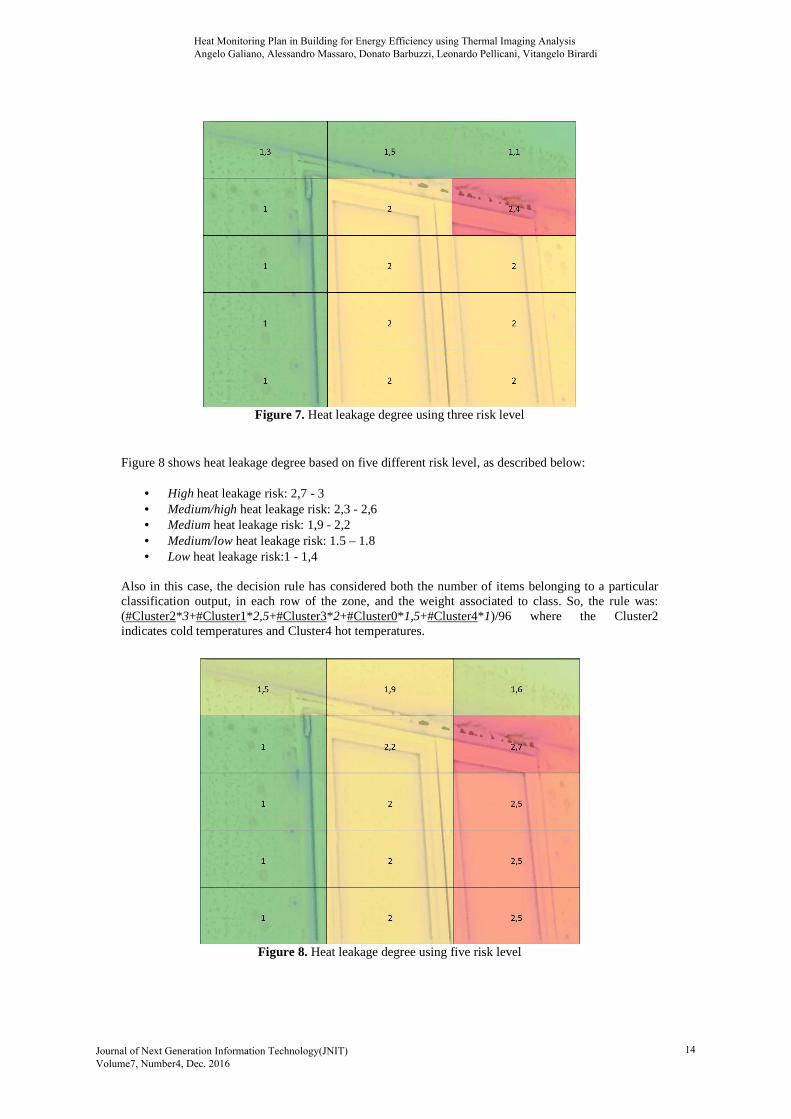
Figure 7. Heat leakage degree using three risk level
Figure 8 shows heat leakage degree based on five different risk level, as described below:
• High heat leakage risk: 2,7 - 3 • Medium/high heat leakage risk: 2,3 - 2,6 • Medium heat leakage risk: 1,9 - 2,2 • Medium/low heat leakage risk: 1.5 – 1.8 • Low heat leakage risk:1 - 1,4
Also in this case, the decision rule has considered both the number of items belonging to a particular classification output, in each row of the zone, and the weight associated to class. So, the rule was: (#Cluster2*3+#Cluster1*2,5+#Cluster3*2+#Cluster0*1,5+#Cluster4*1)/96 where the Cluster2 indicates cold temperatures and Cluster4 hot temperatures.
Figure 8. Heat leakage degree using five risk level
Heat Monitoring Plan in Building for Energy Efficiency using Thermal Imaging Analysis Angelo Galiano, Alessandro Massaro, Donato Barbuzzi, Leonardo Pellicani, Vitangelo Birardi
Journal of Next Generation Information Technology(JNIT) Volume7, Number4, Dec. 2016
14
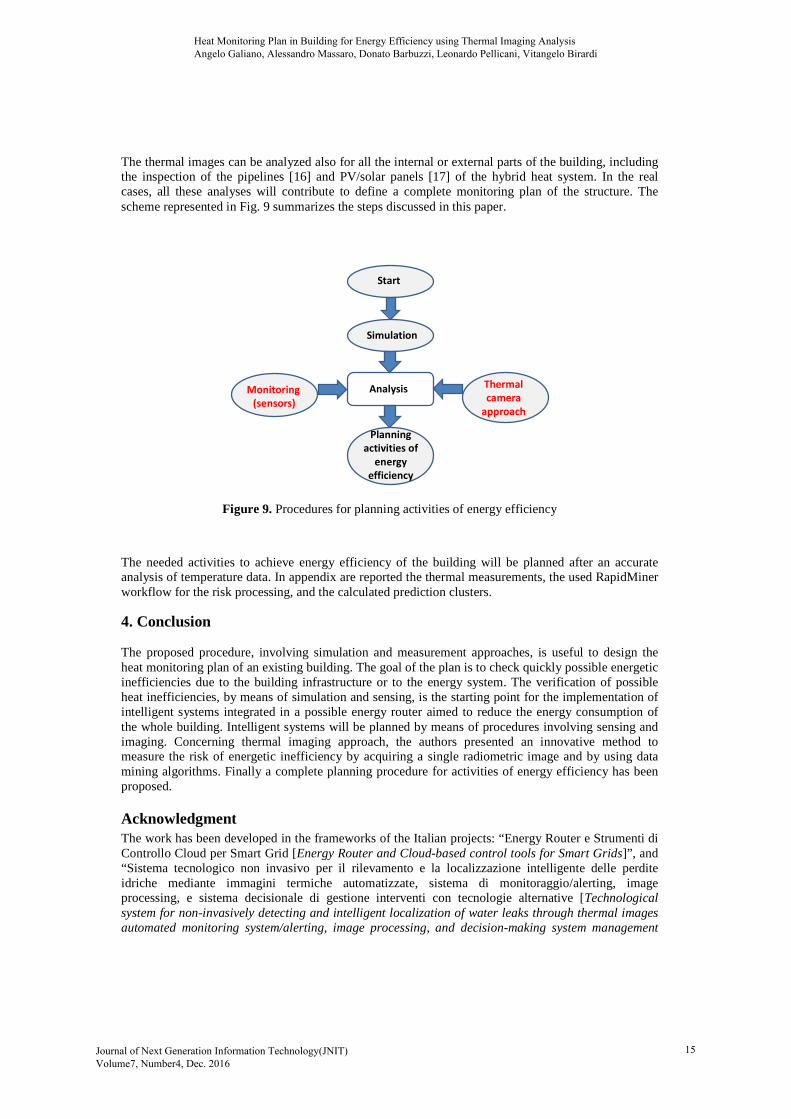
The thermal images can be analyzed also for all the internal or external parts of the building, including the inspection of the pipelines [16] and PV/solar panels [17] of the hybrid heat system. In the real cases, all these analyses will contribute to define a complete monitoring plan of the structure. The scheme represented in Fig. 9 summarizes the steps discussed in this paper.
Start
Simulation
AnalysisMonitoring
(sensors)
Thermal
camera
approach
Planning
activities of
energy
efficiency
Figure 9. Procedures for planning activities of energy efficiency
The needed activities to achieve energy efficiency of the building will be planned after an accurate analysis of temperature data. In appendix are reported the thermal measurements, the used RapidMiner workflow for the risk processing, and the calculated prediction clusters.
4. Conclusion The proposed procedure, involving simulation and measurement approaches, is useful to design the heat monitoring plan of an existing building. The goal of the plan is to check quickly possible energetic inefficiencies due to the building infrastructure or to the energy system. The verification of possible heat inefficiencies, by means of simulation and sensing, is the starting point for the implementation of intelligent systems integrated in a possible energy router aimed to reduce the energy consumption of the whole building. Intelligent systems will be planned by means of procedures involving sensing and imaging. Concerning thermal imaging approach, the authors presented an innovative method to measure the risk of energetic inefficiency by acquiring a single radiometric image and by using data mining algorithms. Finally a complete planning procedure for activities of energy efficiency has been proposed.
Acknowledgment The work has been developed in the frameworks of the Italian projects: “Energy Router e Strumenti di Controllo Cloud per Smart Grid [Energy Router and Cloud-based control tools for Smart Grids]”, and “Sistema tecnologico non invasivo per il rilevamento e la localizzazione intelligente delle perdite idriche mediante immagini termiche automatizzate, sistema di monitoraggio/alerting, image processing, e sistema decisionale di gestione interventi con tecnologie alternative [Technological system for non-invasively detecting and intelligent localization of water leaks through thermal images automated monitoring system/alerting, image processing, and decision-making system management
Heat Monitoring Plan in Building for Energy Efficiency using Thermal Imaging Analysis Angelo Galiano, Alessandro Massaro, Donato Barbuzzi, Leonardo Pellicani, Vitangelo Birardi
Journal of Next Generation Information Technology(JNIT) Volume7, Number4, Dec. 2016
15

interventions with alternative technologies]” (Open Labs project). Authors gratefully thanks Matteo Fanelli (Energenia) for the radiometric images of the analyzed window. References
[1] H. Dagdouguia, R. Minciardi, A. Ouammi, M. Robba, and R. Sacile, “Modelling and control of a
hybrid renewable energy system,” International Congress on Environmental Modelling and Software, 2010.
[2] P. Gopi, and I. P. Reddy, “Modelling and optimization of renewable energy integration in buildings,” Second International Conference on Sustainable Energy and Intelligent System, SEISCON 2011, pp. 116-120.
[3] M. Hasselmann, and C. Beier, “Integrating decentralized electrically powered thermal supply systems into a smart grid,” Energy Procedia, vol. 73, pp. 317-323, 2015.
[4] L. Ardito, G. Procaccianti, G. Menga, and M. Morisio, “Smart Grid Technologies in Europe: An Overview,” Energies, vol. 6, pp. 251-281, 2013.
[5] Hossain MR, Oo AMT, and ABMS Ali. Smart Grid. In A.B.M. Shawkat Ali, editor, Smart Grids - Opportunities, Developments, and Trends, ch. 2, pp. 23-44. Springer, 2013. ISBN 978-1-4471-5210-1.
[6] K. Park, Y. Kim, S. Kim, K. Kim, “Building Energy Management System based on Smart Grid,” IEEE 33rd International Telecommunications Energy Conference (INTELEC), pp. 1-4, 2011.
[7] A. Massaro, S. De Guido, I. Ingrosso, R. Cingolani, M. De Vittorio, M. Cori, A. Bertacchini, L. Larcher, A. Passaseo, “Free Standing Piezoelectric Rings for High Efficiency Energy Harvesting at Low Frequency”, Appl. Phys. Lett., 98, 053502, 2011.
[8] A. Massaro, Energy Harvesting Aspects of Irregular Vibrating Forces Acting on Piezoelectric Devices. IGI book: Innovative Materials and Systems for Energy Harvesting Applications. DOI: 10.4018/978-1-4666-8254-2, ISBN13: 9781466682542, Chapter 6.
[9] Jadin, Mohd Shawal, and Kamarul Hawari Ghazali. "Gas Leakage Detection Using Thermal Imaging Technique." Computer Modelling and Simulation (UKSim), 2014 UKSim-AMSS 16th International Conference on. IEEE, 2014.
[10] Jadin, Mohd Shawal, and Soib Taib. "Recent progress in diagnosing the reliability of electrical equipment by using infrared thermography." Infrared Physics & Technology 55.4 (2012): 236-245.
[11] Safitri, Anisa, Xiaodan Gao, and M. Sam Mannan. "Dispersion modeling approach for quantification of methane emission rates from natural gas fugitive leaks detected by infrared imaging technique." Journal of Loss Prevention in the Process Industries 24.2 (2011): 138-145.
[12] Yadav, G., Gupta, V., Gaur, V., & Bhattacharya, M. (2012). Optimized flame detection using image processing based techniques. Indian Journal of Computer Science and Engineering, 3(2).
[13] S. Narayanan, M. G. Apte, P. Haves, M. A. Piette, and J. Elliot, “Systems Approach to Energy Efficient Building Operation: Case Studies and Lessons Learned in a University Campus,” Proceeding of ACEEE Summer Study on Energy Efficiency in Buildings, pp. 296-309, 2010.
[14] G. Balletto, A. Casu, and A. Scalas, “The building dynamic simulation software ODESSE (Optimal DESign for Smart Energy): Analysis and Suggested Improvement,” Proceesing of 3rd International Conference on Informatics, Environment, Energy and Applications IPCBEE, vol.66, 2014.
[15] Gattal, Abdeljalil, and Youcef Chibani. "Segmentation and recognition strategy of handwritten connected digits based on the oriented sliding window." Frontiers in Handwriting Recognition (ICFHR), 2012 International Conference on. IEEE, 2012.
[16] O. Friman, P. Follo, J. Ahlberg, and S. Sjokvist, “Methods for large-scale monitoring of district heating systems using airborne Thermography,” IEEE Trans. Geosci. Remote Sens., vol. 52 no.8 , pp. 5175- 5182, 2014.
[17] Editor staff, “Identification of solar cell defects using thermal imaging techniques,” ME Focus in Thermography, pp. 40-44, 2013.
Heat Monitoring Plan in Building for Energy Efficiency using Thermal Imaging Analysis Angelo Galiano, Alessandro Massaro, Donato Barbuzzi, Leonardo Pellicani, Vitangelo Birardi
Journal of Next Generation Information Technology(JNIT) Volume7, Number4, Dec. 2016
16
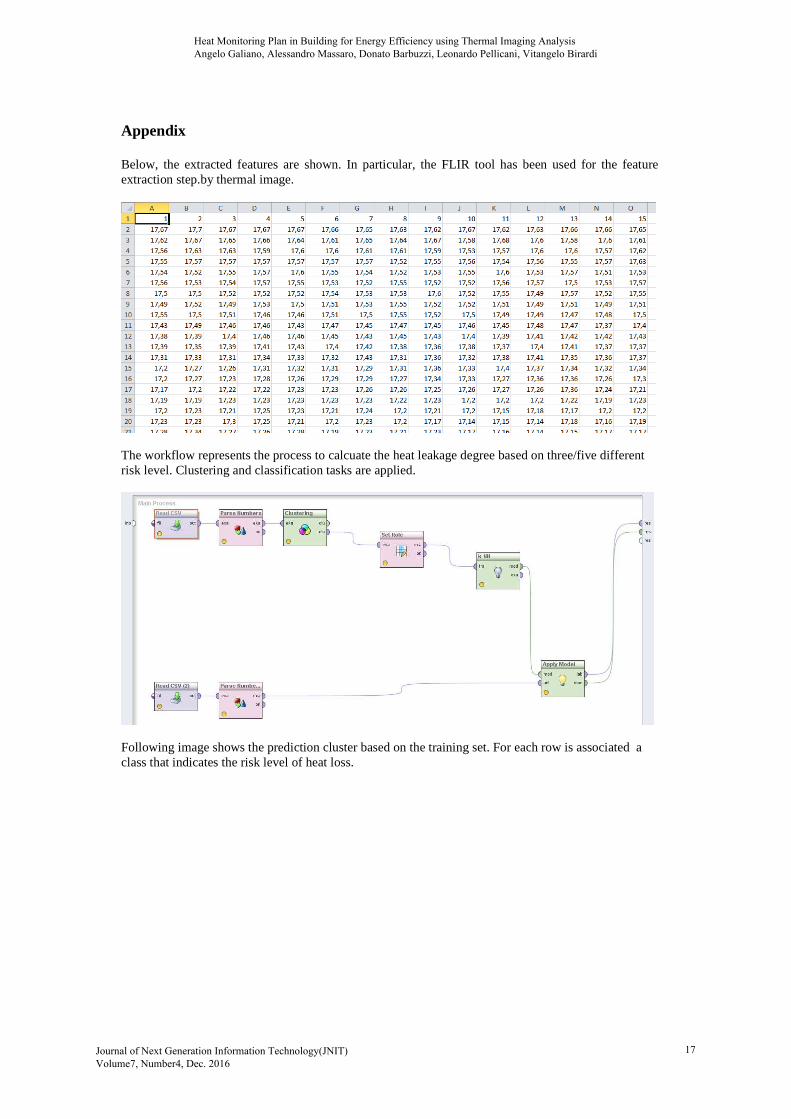
Appendix Below, the extracted features are shown. In particular, the FLIR tool has been used for the feature extraction step.by thermal image.
The workflow represents the process to calcuate the heat leakage degree based on three/five different risk level. Clustering and classification tasks are applied.
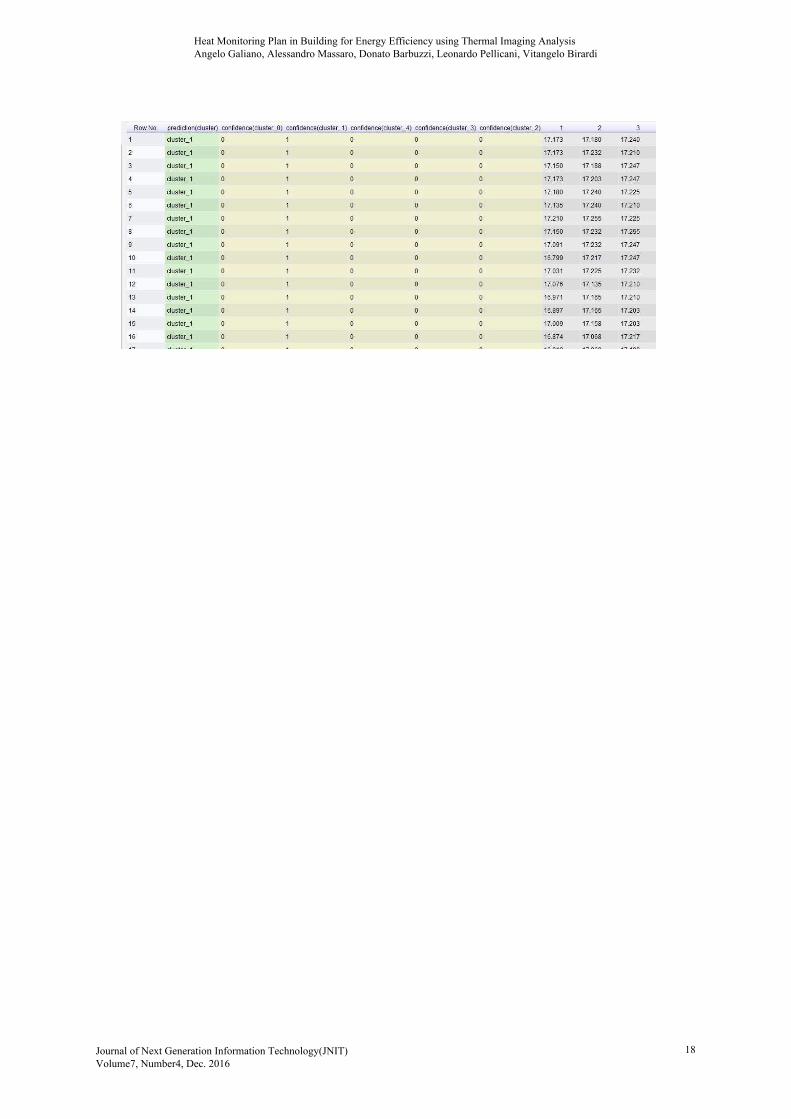
Following image shows the prediction cluster based on the training set. For each row is associated a class that indicates the risk level of heat loss.
Heat Monitoring Plan in Building for Energy Efficiency using Thermal Imaging Analysis Angelo Galiano, Alessandro Massaro, Donato Barbuzzi, Leonardo Pellicani, Vitangelo Birardi
Journal of Next Generation Information Technology(JNIT) Volume7, Number4, Dec. 2016
17
Heat Monitoring Plan in Building for Energy Efficiency using Thermal Imaging Analysis Angelo Galiano, Alessandro Massaro, Donato Barbuzzi, Leonardo Pellicani, Vitangelo Birardi
Journal of Next Generation Information Technology(JNIT) Volume7, Number4, Dec. 2016
18