heidelbergcement: q1 2015 presentation
TRANSCRIPT

Slide 1 - 2015 First Quarter Results - 07 May 2015
HeidelbergCement
2015 First Quarter Results 07 May 2015
Dr. Bernd Scheifele, CEO and Dr. Lorenz Näger, CFO
Stuttgart U12 Tunnel Project

Slide 2 - 2015 First Quarter Results - 07 May 2015
Unless otherwise indicated, the financial information provided herein has been prepared under International Financial Reporting Standards (IFRS).
This presentation contains forward-looking statements and information. Forward-looking statements and information are statements that are not historical facts,
related to future, not past, events. They include statements about our believes and expectations and the assumptions underlying them. These statements and
information are based on plans, estimates, projections as they are currently available to the management of HeidelbergCement. Forward-looking statements
and information therefore speak only as of the date they are made, and we undertake no obligation to update publicly any of them in light of new information or
future events.
By their very nature, forward-looking statements and information are subject to certain risks and uncertainties. A variety of factors, many of which are beyond
HeidelbergCement’s control, could cause actual results to defer materially from those that may be expressed or implied by such forward-looking statement or
information. For HeidelbergCement particular uncertainties arise, among others, from changes in general economic and business conditions in Germany, in
Europe, in the United States and elsewhere from which we derive a substantial portion of our revenues and in which we hold a substantial portion of our
assets; the possibility that prices will decline as result of continued adverse market conditions to a greater extent than currently anticipated by
HeidelbergCement’s management; developments in the financial markets, including fluctuations in interest and exchange rates, commodity and equity prices,
debt prices (credit spreads) and financial assets generally; continued volatility and a further deterioration of capital markets; a worsening in the conditions of the
credit business and, in particular, additional uncertainties arising out of the subprime, financial market and liquidity crises; the outcome of pending
investigations and legal proceedings and actions resulting from the findings of these investigations; as well as various other factors. More detailed information
about certain of the risk factors affecting HeidelbergCement is contained throughout this presentation and in HeidelbergCement’s financial reports, which are
available on the HeidelbergCement website, www.heidelbergcement.com. Should one or more of these risks or uncertainties materialize, or should underlying
assumptions prove incorrect, actual results may vary materially from those described in the relevant forward-looking statement or information as expected,
anticipated, intended, planned, believed, sought, estimated or projected.
In the first quarter of 2014 HeidelbergCement applied the new IFRS standards 10 and 11 for the first time. According to the new rules the proportionate
consolidation is abolished. Instead, joint ventures are to be accounted for using the equity method. Assets and liabilities as well as income and expenses of
joint ventures will no longer be shown proportionately in the relevant balance sheet or income statement items, but will only be shown in a separate line using
the equity method: the carrying amount in the balance sheet and the result from joint ventures in the income statement. Among the joint ventures of
HeidelbergCement are important operations in Australia, Turkey, China, Hungary, Bosnia and the USA (Texas), which have contributed significant results to
the operating income in the past. In order to continue with a comprehensive presentation of the operational performance, HeidelbergCement will include the
result from joint ventures in operating income before depreciation starting with the first quarter of 2014.
2014 figures are restated by reclassification of disposed part of Building Products (in accordance with IFRS 5) and reclassification of Cement Australia due to a
new interpretation of IFRS 11 based on tentative IFRIC agenda decision in November 2014.
Disclaimer

Slide 3 - 2015 First Quarter Results - 07 May 2015
Contents
Page
1. Overview and key figures 4
2. Results by Group areas 14
3. Financial report 21
4. Outlook 2015 31
5. Appendix 35

Slide 4 - 2015 First Quarter Results - 07 May 2015
Market and financial overview Q1 2015
Best start of the year since the financial crisis supports strong outlook
– Revenues increased by +12% (LfL1) +4%) to €bn 2.8
– Operating EBITDA up +46% (LfL1) +29%) to €m 299
– Strong operating leverage and demand growth in all major key markets drive
margin improvement in all regions
Focus on margin improvement continues with announced programs; results
are clearly visible
Net debt down to €bn 6.1 (prior year: €bn 7.8); leverage at 2.6X (prior year: 3.5X)
Q1 results strengthen confidence in outlook 2015
– Volume growth in all Group Areas
– Double digit percentage increase in revenue, operating income and net income2)
– Earn cost of capital in 2015
– Further decrease in financial costs
New strategic targets to be presented during CMD in June
1) Like for like excluding currency and scope impacts 2) Net income for the financial year before non-recurring items

Slide 5 - 2015 First Quarter Results - 07 May 2015
Key financials
1) 2014 values are restated. Please see disclaimer page for details.
2) Attributable to the parent entity.
3) Excluding puttable minorities.
€m March Year to Date
2014 1) 2015 Variance Opr. Cons. Decons. Curr. L-f-L
Volumes
Cement (Mt) 16,988 16,843 -1 % -111 8 -41 0 -1%
Aggregates (Mt) 44,330 46,276 4 % 2,160 302 -516 0 5%
Ready-Mix Concrete (Mm3) 7,707 7,857 2 % 117 33 0 0 2%
Asphalt (Mt) 1,528 1,568 3 % 40 0 0 0 3%
Income statement
Revenue 2,522 2,835 12 % 98 14 -8 210 4%
Operating EBITDA 205 299 46 % 68 1 0 25 29%
in % of revenue 8.1% 10.6%
Operating income 41 115 183 % 60 0 1 14 108%
Profit / Loss for the period -108 -80 25 %
Earnings per share in € (IAS 33) 2) -0.78 -0.65 16 %
Statement of cash flows
Cash flow from operating activities -294 -373 -79
Total investments -248 -188 60
Balance sheet
Net debt 3) 7,844 6,100 -1,743
Gearing 63.1% 38.3%

Slide 6 - 2015 First Quarter Results - 07 May 2015
Operating EBITDA bridge
299
+29%
Q1 2015
Operating EBITDA
205
Scope
1
Operating
68
Q1 2014
Operating EBITDA
Currency
25
Q1 2014 LfL
Operating EBITDA
230
29% organic operating EBITDA growth driven by solid operational performance
€m
2014 values are restated. Please see disclaimer page for details.

Slide 7 - 2015 First Quarter Results - 07 May 2015
North America
Africa-Mediterranean Basin Eastern Europe-Central Asia
Asia-Pacific Western and Northern Europe
Mt Mt Mm³
Group sales volumes
1.2
17.1
2.2 1.3
18.1
2.2
+2% +7%
+6%
Ready Mix Aggregates Cement
Q1 2015 Q1 2014
2.7
13.9
4.6 2.7
13.9
4.4
0%
0% -4%
Ready Mix Aggregates Cement
0.5
2.32.8
0.5
3.02.7
+27%
+22%
-4%
Ready Mix Aggregates Cement
0.8
2.7
1.7
0.7
2.71.9
-2%
-5%
+14%
Ready Mix Aggregates Cement
2.6
8.65.8
2.6
8.8
5.6
+3%
0% -4%
Ready Mix Aggregates Cement
44.3
+4%
Group Aggregates
46.3 17.0
-1%
Group Cement
16.8 7.7
+2%
Group Ready-mixed concrete
7.9
2014 values are restated. Please see disclaimer page for details.

Slide 8 - 2015 First Quarter Results - 07 May 2015
Margin Improvement in all regions
North America Western and Northern Eu. East Eu. – Central Asia
Asia – Pacific Africa – Med. Basin TOTAL GROUP
Q1 2014 Q1 2015
2.7%
6.1%
Q1 2014 Q1 2015
2.8%
4.2%
Q1 2014 Q1 2015
-3.0%
-1.9%
Q1 2014 Q1 2015
24.0% 26.1%
Q1 2014 Q1 2015
20.8%
27.3%
Q1 2014 Q1 2015
8.1%
10.6%
+346 bps +144 bps +105 bps
+212 bps +651 bps +242 bps
2014 values are restated. Please see disclaimer page for details.

Slide 9 - 2015 First Quarter Results - 07 May 2015
Solid growth in aggregates in key developed markets
North America UK Australia
Significant operating leverage in key emerging markets
Indonesia Africa Eastern Eu. – Central Asia
Quality asset base continues to pay-off
92
279
104
299
+19
+13
Revenues EBITDA
Q1 2015
Q1 2014
65%
34
165
58
195
EBITDA Revenues
+30
+24
83%
-6
194
-3
177
+2
Revenues EBITDA
-16
++
3.7%
7.7%
18.117.1
Q1 2015
+6%
Q1 2014
19.1%
16.0%
6.46.1
+4%
Q1 2015 Q1 2014
30.5%
25.5%
5.44.9
+11%
Q1 2015 Q1 2014
Agg. EBITDA margin
Agg.
Volume
Agg.
Volume
Agg.
Volume
Agg. EBITDA margin Agg. EBITDA margin
2014 values are restated. Please see disclaimer page for details.

Slide 10 - 2015 First Quarter Results - 07 May 2015
Cement Energy Cost (per ton)
(Q115 vs. Q114)
Q1 energy costs below prior year
Low energy costs provide a significant tailwind for the rest of the year
Electricity
0.9%
Fuel
-9.0%
Total Energy
-4.1%
(All values excluding currency and scope impacts)
Aggregates Energy Cost (per ton)
(Q115 vs. Q114)
Electricity
-7.5%
Fuel
-25.1%
Total Energy
-18.8%
(All values excluding currency and scope impacts)

Slide 11 - 2015 First Quarter Results - 07 May 2015
UK
01.01.2015
01.03.2015
Benelux
01.01.2015
Germany
01.01.2015
Bosnia
01.01.2015
Poland
01.04.2015
Norway
01.01.2015
Hungary
01.03.2015
01.04.2015
PERFORM – Focus on margin improvement in cement continues
British Columbia
01.01.2015
Washington
01.01.2015
Oregon
01.01.2015
California
01.04.2015
01.10.2015
Arizona
01.04.2015 Texas
01.04.2015
Alabama
01.04.2015
Florida
01.01.2015
Central Region
01.04.2015
Prairies
01.01.2015
Mid Atlantic
01.04.2015
North East
01.04.2015
New York
01.04.2015
EUROPE
Already announced and mostly executed
cement price increases
Czech. Rep.
01.01.2015
NORTH AMERICA
Already announced and mostly executed
cement price increases

Slide 12 - 2015 First Quarter Results - 07 May 2015
UK
01.01.2015
Benelux
01.01.2015
Germany
01.04.2015
Romania
01.04.2015
Poland
01.04.2015
Norway
01.01.2015
Czech Rep.
01.04.2015
CLIMB COMMERCIAL – increase in market leading aggregates margin
Edmonton: 01.04.2015
BC: 01.01.2015
Ferndale: 01.01.2015
Cadman: 01.01.2015 Northern AB/BC: 01.01.2015
Saskatoon: 01.04.2015
Regina: 01.04.2015
Winnipeg: 01.04.2015
Calgary: 01.04.2015
South
01.01.2015
Mid West
01.04.2014
North East
01.01.2015
Sweden
01.01.2014
South East
01.03.2015
West
01.04.2015
EUROPE
Already announced and mostly executed
aggregates price increases
NORTH AMERICA
Already announced and mostly executed
aggregates price increases
Significant price increases in core markets US and UK drive profitability further up

Slide 13 - 2015 First Quarter Results - 07 May 2015
Contents
Page
1. Overview and key figures 4
2. Results by Group areas 14
3. Financial report 21
4. Outlook 2015 31
5. Appendix 35
Slide 14 - 2015 First Quarter Results - 07 May 2015
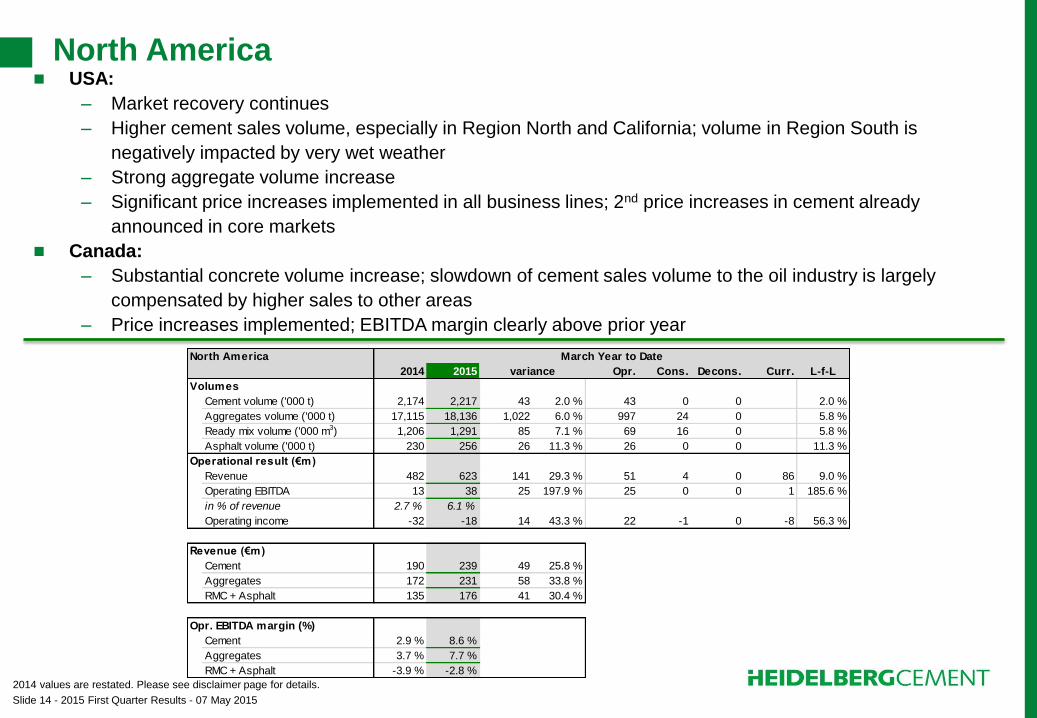
North America
North America March Year to Date
2014 2015 variance Opr. Cons. Decons. Curr. L-f-L
Volumes
Cement volume ('000 t) 2,174 2,217 43 2.0 % 43 0 0 2.0 %
Aggregates volume ('000 t) 17,115 18,136 1,022 6.0 % 997 24 0 5.8 %
Ready mix volume ('000 m3) 1,206 1,291 85 7.1 % 69 16 0 5.8 %
Asphalt volume ('000 t) 230 256 26 11.3 % 26 0 0 11.3 %
Operational result (€m)
Revenue 482 623 141 29.3 % 51 4 0 86 9.0 %
Operating EBITDA 13 38 25 197.9 % 25 0 0 1 185.6 %
in % of revenue 2.7 % 6.1 %
Operating income -32 -18 14 43.3 % 22 -1 0 -8 56.3 %
Revenue (€m)
Cement 190 239 49 25.8 %
Aggregates 172 231 58 33.8 %
RMC + Asphalt 135 176 41 30.4 %
Opr. EBITDA margin (%)
Cement 2.9 % 8.6 %
Aggregates 3.7 % 7.7 %
RMC + Asphalt -3.9 % -2.8 %
USA:
– Market recovery continues
– Higher cement sales volume, especially in Region North and California; volume in Region South is
negatively impacted by very wet weather
– Strong aggregate volume increase
– Significant price increases implemented in all business lines; 2nd price increases in cement already
announced in core markets
Canada:
– Substantial concrete volume increase; slowdown of cement sales volume to the oil industry is largely
compensated by higher sales to other areas
– Price increases implemented; EBITDA margin clearly above prior year
2014 values are restated. Please see disclaimer page for details.

Slide 15 - 2015 First Quarter Results - 07 May 2015
Western and Northern Europe
Western & Northern Europe March Year to Date
2014 2015 variance Opr. Cons. Decons. Curr. L-f-L
Volumes
Cement volume ('000 t) 4,622 4,432 -190 -4.1 % -198 8 0 -4.3 %
Aggregates volume ('000 t) 13,892 13,895 3 0.0 % -133 136 0 -1.0 %
Ready mix volume ('000 m3) 2,724 2,726 2 0.1 % -15 17 0 -0.6 %
Asphalt volume ('000 t) 692 751 59 8.5 % 59 0 0 8.5 %
Operational result (€m)
Revenue 848 889 41 4.9 % 11 7 0 23 1.3 %
Operating EBITDA 23 37 14 59.8 % 12 1 0 1 50.4 %
in % of revenue 2.8 % 4.2 %
Operating income -33 -21 12 36.9 % 13 0 0 -1 37.7 %
Revenue (€m)
Cement 382 381 -2 -0.4 %
Aggregates 178 200 22 12.5 %
RMC + Asphalt 322 355 33 10.2 %
Opr. EBITDA margin (%)
Cement 2.8 % 1.2 %
Aggregates 11.4 % 14.7 %
RMC + Asphalt -0.8 % 1.2 %
Solid market demand; volumes below prior year due to extraordinarily mild winter weather in Q1’14
UK: Recovery continues, driven by increasing residential demand and large infrastructure projects in the London
area; result and volumes significantly above prior year (flooding in Q1’14); strong operating leverage;
considerable price increases, especially in concrete and asphalt
Germany: Weather-driven volume decline leads to lower result; price increases implemented
Benelux: Volume below prior year, especially in the Netherlands; gradual market recovery expected in 2015
Northern Europe: Increased building materials demand in Sweden, primarily driven by residential construction;
slightly lower demand in Norway; fewer exports to Russia; positive outlook overall
2014 values are restated. Please see disclaimer page for details.

Slide 16 - 2015 First Quarter Results - 07 May 2015
Eastern Europe-Central Asia
Eastern Europe - Cent. Asia March Year to Date
2014 2015 variance Opr. Cons. Decons. Curr. L-f-L
Volumes
Cement volume ('000 t) 2,823 2,720 -103 -3.7 % -103 0 0 -3.7 %
Aggregates volume ('000 t) 2,329 2,962 633 27.2 % 664 0 -31 28.9 %
Ready mix volume ('000 m3) 451 549 98 21.9 % 98 0 0 21.9 %
Asphalt volume ('000 t) 0 0 0 N/A 0 0 0 N/A
Operational result (€m)
Revenue 194 177 -16 -8.4 % 5 0 -1 -21 2.7 %
Operating EBITDA -6 -3 2 40.7 % 0 0 0 3 -16.4 %
in % of revenue -3.0 % -1.9 %
Operating income -31 -26 5 15.0 % -1 0 0 6 -4.1 %
Revenue (€m)
Cement 167 146 -21 -12.5 %
Aggregates 12 14 2 17.8 %
RMC + Asphalt 25 31 6 22.2 %
Opr. EBITDA margin (%)
Cement 0.9 % 0.8 %
Aggregates -42.4 % -19.6 %
RMC + Asphalt -7.0 % -2.6 %
Poland: Good market demand, led by commercial construction recovery; higher concrete and aggregates
volume, despite tough comparison base; positive outlook
Czech Republic: Good market situation; aggregate volume increase, helped by an early start to the construction
season; positive result development
Romania: Aggregate and concrete volume increases, due to good weather and an early start of commercial
construction projects; cement volume declines due to delayed infrastructure projects
Russia: Result above prior year, primarily driven by higher cement sales volume
Ukraine: Substantial volume decline due to an unstable environment in the eastern part of the Ukraine; result
clearly above prior year driven by strong pricing
Kazakhstan: Strong volume development as a result of our new Shetpe plant; profit negatively affected by
margin pressure from imports

Slide 17 - 2015 First Quarter Results - 07 May 2015
Indonesia: Intentionally implemented sales strategy focusing on strong volumes in core markets, pricing and strict
cost management led to solid results which is contrary to the negative market trend
India: Higher volumes and lower variable costs overcompensate weaker pricing; result clearly above prior year
Bangladesh: Result clearly above prior year due to significantly increased sales volume and lower raw material
costs
Australia: Strong concrete and aggregate volume development driven by residential construction growth and pull-
through of own aggregates into concrete enabled by integrated supply chain management; additional tailwind from
lower energy costs; significant result improvement
China: Lower variable costs cannot completely offset substantial price declines
Asia-Pacific
Asia - Pacific March Year to Date
2014 2015 variance Opr. Cons. Decons. Curr. L-f-L
Volumes
Cement volume ('000 t) 5,815 5,589 -226 -3.9 % -226 0 0 -3.9 %
Aggregates volume ('000 t) 8,556 8,803 247 2.9 % 476 142 -371 5.8 %
Ready mix volume ('000 m3) 2,569 2,571 2 0.1 % 2 0 0 0.1 %
Asphalt volume ('000 t) 506 472 -34 -6.7 % -34 0 0 -6.7 %
Operational result (€m)
Revenue 623 693 70 11.2 % 2 2 -1 68 0.2 %
Operating EBITDA 150 181 31 21.0 % 13 1 0 18 8.1 %
in % of revenue 24.0 % 26.1 %
Operating income 121 148 27 22.4 % 12 0 0 14 9.2 %
Revenue (€m)
Cement 334 374 39 11.8 %
Aggregates 115 134 19 16.8 %
RMC + Asphalt 233 260 27 11.7 %
Opr. EBITDA margin (%)
Cement 31.5 % 32.3 %
Aggregates 24.7 % 29.1 %
RMC + Asphalt -0.8 % 0.4 %
2014 values are restated. Please see disclaimer page for details.

Slide 18 - 2015 First Quarter Results - 07 May 2015
Africa-Mediterranean Basin
Africa - Med. Basin March Year to Date
2014 2015 variance Opr. Cons. Decons. Curr. L-f-L
Volumes
Cement volume ('000 t) 1,663 1,902 239 14.4 % 280 0 -41 17.3 %
Aggregates volume ('000 t) 2,712 2,669 -43 -1.6 % 72 0 -114 2.8 %
Ready mix volume ('000 m3) 758 720 -38 -5.0 % -38 0 0 -5.0 %
Asphalt volume ('000 t) 100 89 -11 -10.8 % -11 0 0 -10.8 %
Operational result (€m)
Revenue 230 265 35 15.3 % 40 0 -6 1 18.0 %
Operating EBITDA 48 72 25 51.4 % 23 0 0 2 45.5 %
in % of revenue 20.8 % 27.3 %
Operating income 41 62 21 50.9 % 19 0 1 1 43.7 %
Revenue (€m)
Cement 162 194 32 19.6 %
Aggregates 21 23 1 5.4 %
RMC + Asphalt 52 51 -1 -1.6 %
Opr. EBITDA margin (%)
Cement 20.5 % 29.9 %
Aggregates 20.4 % 20.1 %
RMC + Asphalt 1.7 % -0.2 %
Ghana: Result clearly above prior year due to higher prices and lower clinker costs
Tanzania: Result above prior year; significant volume growth - supported by our capacity increase in Q3’2014 –
and lower costs overcompensate price pressure
Togo: Good domestic demand, particularly in the southern part of the country; significant volume increase driven
by the start up of our new clinker plant
Israel: Slight result decline as a result of price pressure in RMC; revenue and result are still on a high level
Turkey: Bad weather leads to volume decline; prices considerably above prior year
Spain: Difficult market situation persists; stabilization on a very low level

Slide 19 - 2015 First Quarter Results - 07 May 2015
Group Services
Group Services March Year to Date
2014 2015 variance Opr. Cons. Decons. Curr. L-f-L
Operational result (€m)
Revenue 244 282 38 15.5 % -15 0 0 53 -5.0 %
Operating EBITDA 6 7 0 4.9 % -1 0 0 1 -13.6 %
in % of revenue 2.6 % 2.4 %
Operating income 6 7 0 4.7 % -1 0 0 1 -13.7 %
Significant sea-bound raw material availability and low transport costs have continued to contribute to
competitive import costs and increased profitability of HC grinding units worldwide and especially in Africa
International sales volumes increased by 10% compared to Q1 2014 thanks to an increase in cement and
clinker sales
Externally traded cement and clinker volumes increased by 35% to 2.3 mt compared with Q1’2014 ; main
drivers are strong sales in Africa, the Indian Ocean region and South America
Q1 EBITDA increased on the back of higher volumes to Africa and the Indian Ocean region as well as the
depreciation of the Euro against the US-Dollar

Slide 20 - 2015 First Quarter Results - 07 May 2015
Contents
Page
1. Overview and key figures 4
2. Results by Group areas 14
3. Financial report 21
4. Outlook 2015 31
5. Appendix 35
Slide 21 - 2015 First Quarter Results - 07 May 2015
Financial key messages Strategic target achieved: Net debt and leverage in line with Investment Grade metrics
Group share of loss reduced to €m -123 (Q1 2014: €m -147)
– Net interest expenses reduced by €m 35 to €m -98 (Q1 2014: €m -133); compensated
by foreign exchange losses and decreasing other financial result in the CIS-countries
(e.g. Russia, Kazakhstan)
– Quarterly increase in income tax expenses to €m -34 (Q1 2014: €m -2);
taxes paid slightly down to €m -77
Strategic target achieved: Net debt and leverage well in line with Investment Grade
metrics
– Net debt in the ordinary course of business reduced by €m 498 vs. Q1 2014
– Proceeds from disposal of Hanson Building Products (~ €m 1,245) further reduce debt
and leverage
Moody's changes its outlook on HeidelbergCement's rating to positive
Strong liquidity headroom and a well-balanced debt maturity profile ensure financial
flexibility
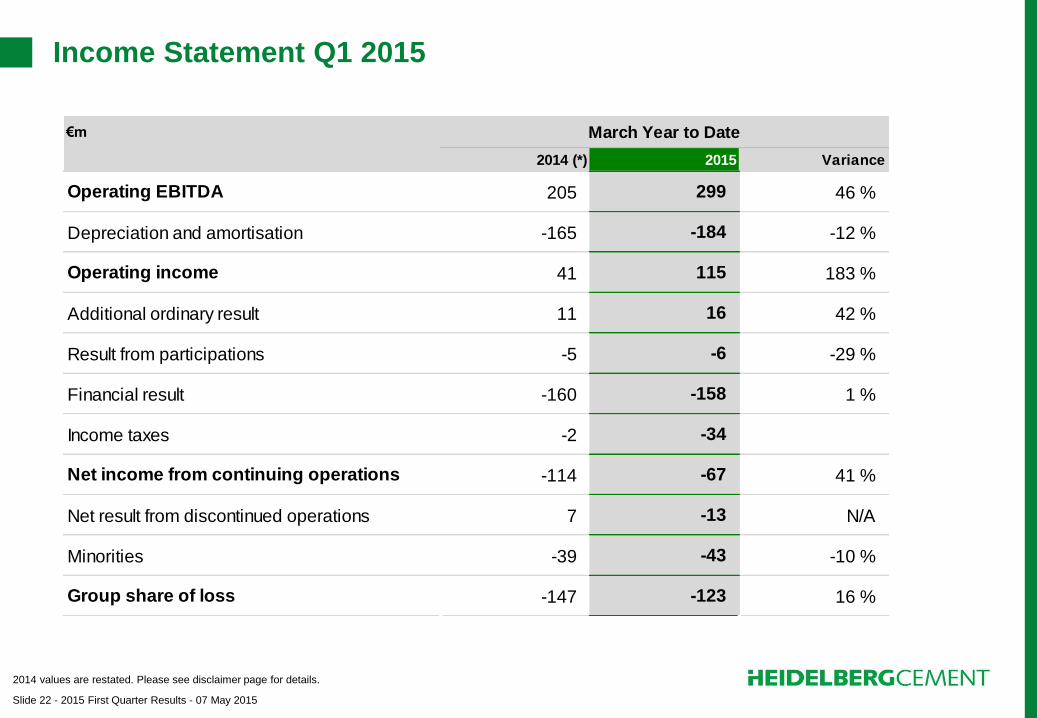
Slide 22 - 2015 First Quarter Results - 07 May 2015
Income Statement Q1 2015
2014 values are restated. Please see disclaimer page for details.
€m March Year to Date
2014 (*) 2015 Variance
Operating EBITDA 205 299 46 %
Depreciation and amortisation -165 -184 -12 %
Operating income 41 115 183 %
Additional ordinary result 11 16 42 %
Result from participations -5 -6 -29 %
Financial result -160 -158 1 %
Income taxes -2 -34
Net income from continuing operations -114 -67 41 %
Net result from discontinued operations 7 -13 N/A
Minorities -39 -43 -10 %
Group share of loss -147 -123 16 %

Slide 23 - 2015 First Quarter Results - 07 May 2015
Cash flow Statement Q1 2015
2014 values are restated. Please see disclaimer page for details.
€m March Year to Date
2014 (*) 2015 Variance
Cash flow incl. provisions through cash payments 6 49 43
Changes in working capital -292 -377 -84
Cash flow from operating activities - discontinued operations -9 -46 -37
Cash flow from operating activities -294 -373 -79
Total investments -248 -188 60
Proceeds from fixed asset disposals/consolidation 60 24 -35
Cash flow from investing activities - discontinued operations 1 1,231 1,230
Cash flow from investing activities -187 1,068 1,255
Free cash flow -482 695 1,176
Dividend payments -2 -3 -1
Transactions between shareholders -6 6
Net change in bonds and loans 394 -442 -836
Cash flow from financing activities - discontinued operations 0 -5 -5
Cash flow from financing activities 387 -449 -836
Net change in cash and cash equivalents -95 246 341
Effect of exchange rate changes 31 86 55
Change in cash and cash equivalents -64 332 396

Slide 24 - 2015 First Quarter Results - 07 May 2015
Successful working capital management
3837
414243
46
30
25
20
15
Working capital
per quarter (€bn)
3.5
3.0
2.5
2.0
1.5
1.0
0.5
0.0
-5 days
-29 days
Q1 15
1.5
Q4 14*
1.1
Q3 14*
1.8
75
1.6
70
50
45
40
35
Q2 14* Q1 14*
1.5
Q4 13*
1.3
Q4 09
1.7
72
Rolling average
working capital
(days)
Reduction of working capital releases liquidity of > €m 700
compared to the situation in 2010 when our project kicked-off
* as reported

Slide 25 - 2015 First Quarter Results - 07 May 2015
Usage of free cash flow
Net debt reduced by €m -1,743 vs. Q1 2014
352
147
16135638
625
Accounting
& currency
effects
Cartel
fine
IFRS 10/11
restatement
& decons.
"HBP"
Accounting
& currency
effects
Debt
payback
7,844
Debt
payback
Accounting
& currency
effects
1,245
Proceeds
disposal
"HBP"
6,100
Net debt
1Q15
Net debt
1Q14
Net debt
1Q13
€m -1,743
149 2)
8,198
Debt
payback
Net debt
1Q12
7,476
€m
1) Before growth CapEx and disposals.
2) Before cartel fine payment.
3) Values restated (please see disclaimer page for details)
410 135
1,170
625
FCF 1 Growth CapEx
Debt payback
Dividends
513 180149
842
450 279147
876
Q1 2014 (LTM) 2) 3) Q1 2015 (LTM) Q1 2013 (LTM)

Slide 26 - 2015 First Quarter Results - 07 May 2015
Balance Sheet (Currency-related) increases in Q1 2015
€m
Mar 2014 Dec 2014 Mar 2015 €m %
Assets
Intangible assets 9,717 9,864 10,624 907 9 %
Property, plant and equipment 9,464 9,493 10,154 690 7 %
Financial assets 1,791 1,832 1,899 109 6 %
Fixed assets 20,971 21,190 22,677 1,705 8 %
Deferred taxes 415 688 842 428 103 %
Receivables 2,329 2,213 2,709 380 16 %
Inventories 1,411 1,397 1,489 78 6 %
Cash and short-term derivatives 1,337 1,265 1,617 280 21 %
Assets held for sale and discontinued operations 1,380 76 76
Balance sheet total 26,463 28,133 29,410 2,947 11 %
Equity and liabilities
Equity attributable to shareholders 11,382 13,150 14,678 3,296 29 %
Non-controlling interests 1,031 1,095 1,218 187 18 %
Equity 12,413 14,245 15,896 3,482 28 %
Debt 1) 9,200 8,222 7,743 -1,457 -16 %
Provisions 2,097 2,445 2,659 562 27 %
Deferred taxes 502 442 483 -20 -4 %
Operating liabilities 2,250 2,557 2,605 356 16 %
Liabilities held for sale and discontinued operations 222 24 24
Balance sheet total 26,463 28,133 29,410 2,947 11 %
Net Debt (excl. puttable minorities) 7,844 6,929 6,100 -1,743 -22 %
Gearing 63.1 % 48.6 % 38.3 %
Variance
Mar 15/Mar14
1) Includes non-controlling interests with put options in the amount of €m 20 (Mar 2014), €m 28 (Dec 2014), €m 27 (Mar 2015).

Slide 27 - 2015 First Quarter Results - 07 May 2015
7,517
3.3
Q2
2014
7,892
3.5
Q1
2014
7,844
3.5
7,307
3.3
2012
6,100
€m -1,743
Q1
2015
2.6
2014
6,929
2013
3.0
Q3
2014
7,047
2.9
2011
7,770
3.3
2010
8,146
3.6
2009
8,423
4.0
2008
11,566
3.9
2007
14,608
6.0
Net debt development Net debt reduced by €m -1,743 vs Q1 2014
Strategic target: Well in line with
Investment Grade metrics
Net debt / Op. EBITDA (LTM)
Net debt (in €m)
-324
Net debt down to €bn 6.1 and well in line with our strategic target
2014 values are restated. Please see disclaimer page for details.

Slide 28 - 2015 First Quarter Results - 07 May 2015
Debt maturity profile as at 31 March 2015
0
500
1,000
1,500
2,000
980
12
2017
1,144 501
1,051 1,021
4
992
4
1,200
1,742
1,145
[€m]
>2021
1
2018
1,000
6 15
2021
500
1
2020
1,050
1
2016
999
201
2015
1,300
442
2019
Syndicated Facility (SFA)
Debt Instruments
Bond
- Excluding reconciliation adjustments of liabilities of €m 11.6 (accrued transaction costs, issue prices and fair value adjustments) as well as derivative liabilities of €m
50.0. Excluding also puttable minorities with a total amount of €m 26.6.

Slide 29 - 2015 First Quarter Results - 07 May 2015
Short-term liquidity headroom as at 31 March 2015
237
[€m]
4,500
4,000
3,500
3,000
2,500
2,000
1,500
1,000
500
0
4,409
€m +2,354
Total liquidity
1,608
9
2,793
Total maturities < 12 months
2,055
134 85
1,600 Free cash
Restricted cash
Free credit lines*
Accrued interest
Subsidiary
Other
Bond
*) Total committed confirmed credit line €m 3,000 (Guarantee
utilization €m 192.6)
Excluding reconciliation adjustments of liabilities of €m 1.2 (accrued transaction costs, issue prices and fair value adjustments) as well as derivative liabilities of €m 37.9.
Excluding also puttable minorities with a total amount of €m 21.0.

Slide 30 - 2015 First Quarter Results - 07 May 2015
Contents
Page
1. Overview and key figures 4
2. Results by Group areas 14
3. Financial report 21
4. Outlook 2015 31
5. Appendix 35

Slide 31 - 2015 First Quarter Results - 07 May 2015
Solid growth in our key markets
• Further growth driven by volume and price increases in US
• Recovery and ongoing demand growth in UK
• Solid market conditions in Germany and Australia
• Increase in volume demand in Indonesia and India, supported by additional capacity
• Solid growth driven by strong demand and increased capacity in Africa
Huge tail-winds in 2015
• Sharp fall in oil prices will have positive impact on the cost base
• Positive currency impact driven by weak EUR
Lower tax and interest payments
Additional result from new capacities in Indonesia and Africa
Outlook 2015
IMPROVED OPERATIONAL & FINANCIAL RESULTS
Volume growth in all Group Areas
Double digit percentage increase in revenue, operating income and net income1)
Earn cost of capital in 2015
Further decrease in financial costs
First quarter results confirm our outlook!
1) Net income for the financial year before non-recurring items

Slide 32 - 2015 First Quarter Results - 07 May 2015
210
53
-89
-261
-221
-273-273
-76
-43
102
257
25
-15-11
18
-70
-139
-207
32
69
-300
-250
-200
-150
-100
-50
0
50
100
150
200
250
300
Q4 15 … Q1 15
€m*
Q4 14
3
Q3 14
-31
Q2 14
-233
-67
Q1 14
-181
-44
Q4 13
-148
-65
Q3 13
-65
-57
Q2 13 Q1 13 Q4 12**
84
Q3 12**
65
40
Currency impact EBITDA (LTM)* Currency impact EBITDA Currency impact Revenue
* All figures for 2012 and 2013 include “Hanson Building Products” in NAM and UK as well as Cement Australia.
** All 2012 figures based on old IFRS regulations for JVs.
Clear tailwind in 2015: Positive currency impact driven by weak Euro
Currency developments support strong operating developments

Slide 33 - 2015 First Quarter Results - 07 May 2015
Targets 2015
2015 Target
CapEx* €bn 1.2
Maintenance ** €m 600
Expansion €m 600
Energy cost per tonne of cement produced Flat to slightly lower
Current tax rate 25 %
Cost of gross debt 6.2 %
Net debt / EBITDA Below 2.8x
* Before any currency impacts
** Including improvement CapEx
Slide 34 - 2015 First Quarter Results - 07 May 2015
Contents
Page
1. Overview and key figures 4
2. Results by Group areas 14
3. Financial report 21
4. Outlook 2015 31
5. Appendix 35

Slide 35 - 2015 First Quarter Results - 07 May 2015
Impacts from currency and change in consolidation scope
REVENUE March Year to Date Q1
€m Cons. Decons. Curr. Cons. Decons. Curr.
North America 4 0 86 4 0 86
Western / Northern Europe 7 0 23 7 0 23
Eastern Europe / Central Asia 0 -1 -21 0 -1 -21
Asia / Pacific 2 -1 68 2 -1 68
Africa / Med. Basin 0 -6 1 0 -6 1
Group Service 0 0 53 0 0 53
Total Group 14 -8 210 14 -8 210
OPERATING EBITDA March Year to Date Q1
€m Cons. Decons. Curr. Cons. Decons. Curr.
North America 0 0 1 0 0 1
Western / Northern Europe 1 0 1 1 0 1
Eastern Europe / Central Asia 0 0 3 0 0 3
Asia / Pacific 1 0 18 1 0 18
Africa / Med. Basin 0 0 2 0 0 2
Group Service 0 0 1 0 0 1
Total Group 1 0 25 1 0 25

Slide 36 - 2015 First Quarter Results - 07 May 2015
“Climb Commercial”
clearly pays-off !
Volume and price development
CEMENT (Gray Domestic)
Q115 vs. Q114 Volume Price
US ++ ++ Canada -- ++ Indonesia -- ++ Bangladesh ++ - Australia - - India ++ -- Germany -- + Belgium - - Netherlands -- - United Kingdom ++ ++ Norway -- ++ Sweden ++ -- Czech Republic - + Poland -- - Romania -- - Russia ++ + Ukraine -- ++ Kazakhstan ++ -- Georgia ++ ++ Ghana -- ++ Tanzania ++ --
AGGREGATES
Q115 vs. Q114 Volume Price
US ++ ++ Canada - ++ Australia ++ -(*) Indonesia -- + Malaysia -- + United Kingdom ++ ++ Germany -- ++ Belgium -- ++ Netherlands -- + Norway -- ++ Sweden ++ ++ Czech Republic ++ - Poland ++ ++ Israel + ++ Spain ++ +
++Strong +Slightly up -Slightly down --Negative
READY MIX
Q115 vs. Q114 Volume Price
US ++ ++ Canada ++ ++ Australia ++ - Indonesia -- ++ Malaysia -- + Germany ++ ++ Belgium - - Netherlands -- - United Kingdom ++ ++ Norway -- + Sweden + - Czech Republic - + Poland ++ + Israel -- -- Spain -- +
(*) Price increases announced 1st April

Slide 37 - 2015 First Quarter Results - 07 May 2015
Contact information and event calendar
Contact information
Investor Relations
Mr. Ozan Kacar
Phone: +49 (0) 6221 481 13925
Fax: +49 (0) 6221 481 13217
Mr. Steffen Schebesta, CFA
Phone: +49 (0) 6221 481 39568
Fax: +49 (0) 6221 481 13217
www.heidelbergcement.com
Corporate Communications
Mr. Andreas Schaller
Phone: +49 (0) 6221 481 13249
Fax: +49 (0) 6221 481 13217
Event calendar
10 Jun 2015 Capital Markets Day (in London)
29 Jul 2015 2015 half year results
05 Nov 2015 2015 third quarter results