helping you achieve marketing greatness
TRANSCRIPT

HELPING YOU ACHIEVE MARKETING GREATNESS
WHY?
how?
WHAT?
If we understand the potential of a market, we can:
plan to expand existing saleslaunch new products or services or enter a new market
position a product or service that meets the needs of a particular segmentdevelop a marketing strategy for a targeted audience
Government dataTrade association data
Financial data from major playersCustomer surveys
There are 4 approaches to market sizing:
There are 4 key information sources widely used in market sizing:
the dos. . . the doN'Ts. . .
Be focusedHave a clear view of the scope of the market that is to be assessed.
Look at the big pictureStart with a hypothesis of market size, perhaps based on desk research or rough estimates.
Be bold & creativeThink of as many ways as possible you can model the market.
Challenge your results Get as many “fixes” on the market size as possible to verify the calculation.
Get dauntedDon’t panic when only very limited information is found online. Get creative about modelling data that are available.
Get trapped on granular detailDon’t worry about spurious accuracy. It usually doesn’t matter whether the market is worth $500m or $550m p.a.
Overcomplicate the calculationDon’t create a “black box” model no one can understand.
Blindly trust the internetDon’t accept data without checking. Cross check data from the internet with other sources of information.
HOW TO calculate
MARKET SIZE
?
Use published data and reports to obtain a macro
view of the market
Top-Down Approach Looking at theDemand-Side
Consolidating all Informationinto Final ConclusionLooking at the Supply-Side
Gross up survey data toachieve the market size
Arrive at a market size from triangulation – i.e. bringing
together top-down, demand-side and supply-side estimates
Assess the size of all suppliers to the market and sum to achieve the market size
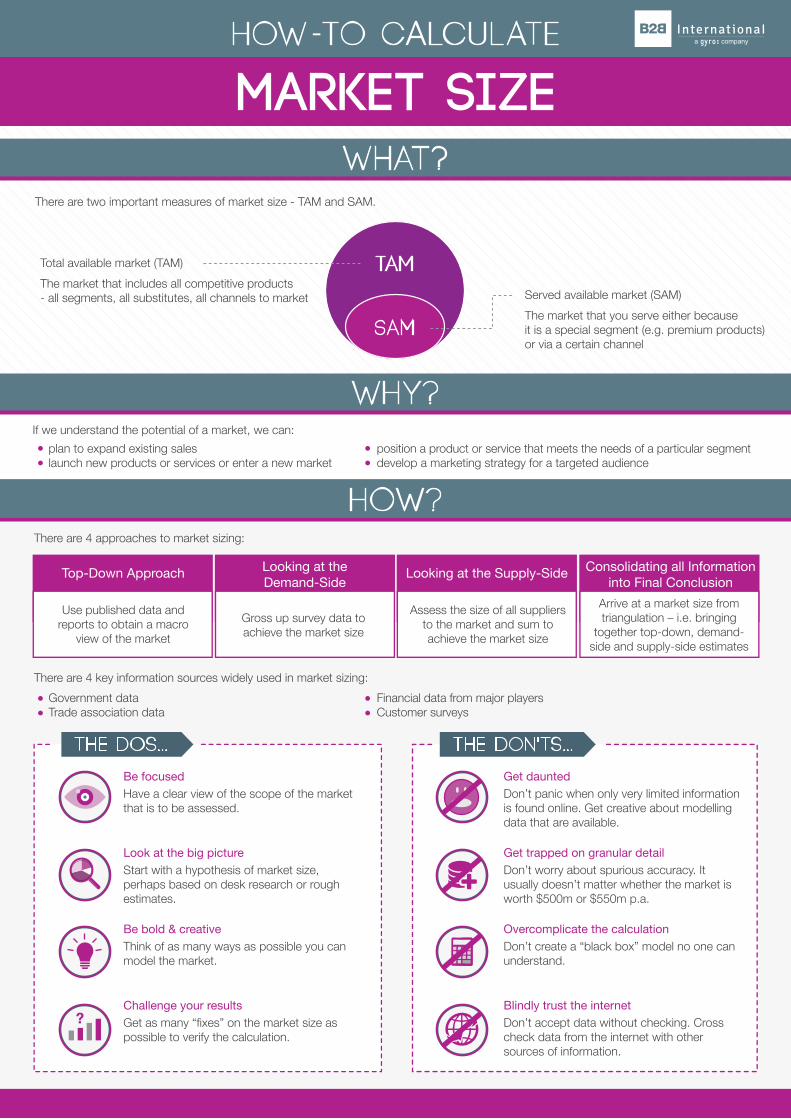
There are two important measures of market size - TAM and SAM.
Total available market (TAM)
The market that includes all competitive products- all segments, all substitutes, all channels to market Served available market (SAM)
The market that you serve either becauseit is a special segment (e.g. premium products)or via a certain channel
TAM
SAM
WHY?
how?
Unless your current and prospective customerscan pinpoint what is unique about your business, they won’t have any reason for choosing you over alternative suppliers.
the dos. . . the doN'Ts. . .
Focus on a specific audienceTailor your USP to a specific market segment that would most value your offer and which you could most profit from.
Communicate specific benefitsBenefits should be as specific as possible, e.g. “hand crafted in the USA”.
Make your USP conciseThe best USPs are those that can be expressed in a single sentence or, even better, a single phrase in order to be memorable.
Ensure your USP is reinforced in everything you doYour USP should be treated as your business’s identity and should be carried over into all aspects of your business from your products/services, marketing and promotion, through to sales and customer support.
Try to please everybodyCreating a USP to satisfy everyone risks not satisfying anyone.
Communicate generic benefitsAvoid using generic benefits like “highest quality” or “best selection”.
Overload your USP with too many benefitsThe more benefits claimed in a USP, the easier it is to confuse the message and the harder it is for your audience to retain it.
Treat your USP as a one-offAvoid treating your USP as a catchy slogan to simply use on your next ad campaign and then abandon for another catchy one for subsequent campaigns.
fact:
The average b2b company perceives its USP strength to be mediocre, with an overall rating of just 6.3 out of 10.
1. Define your target customer. No business can satisfy all customers, which is why some drink Coke and others Pepsi; some use an iPhone and others Android etc.
2. Identify what these customers value more than anything. Purchasing decisions require trade-offs, so what are the key purchase drivers among your audience? 3. Assess what aspects of your business or offer are better than the competition and would be highly valued by your target customer.
!!
how to create a
unique selling proposition
USP
x1
A Unique Selling Proposition (USP) is exactly that – the one thing that signifies your offer. It is much more specific than a customer value proposition (CVP) which covers more than one attribute in the offer.Developing a strong USP allows your business to stand apart from others in an often crowded marketplace.
Developing a USP thus requires a careful look into what aspects of your business or offering is unique andis strongly valued by your target audience.
WHAT?
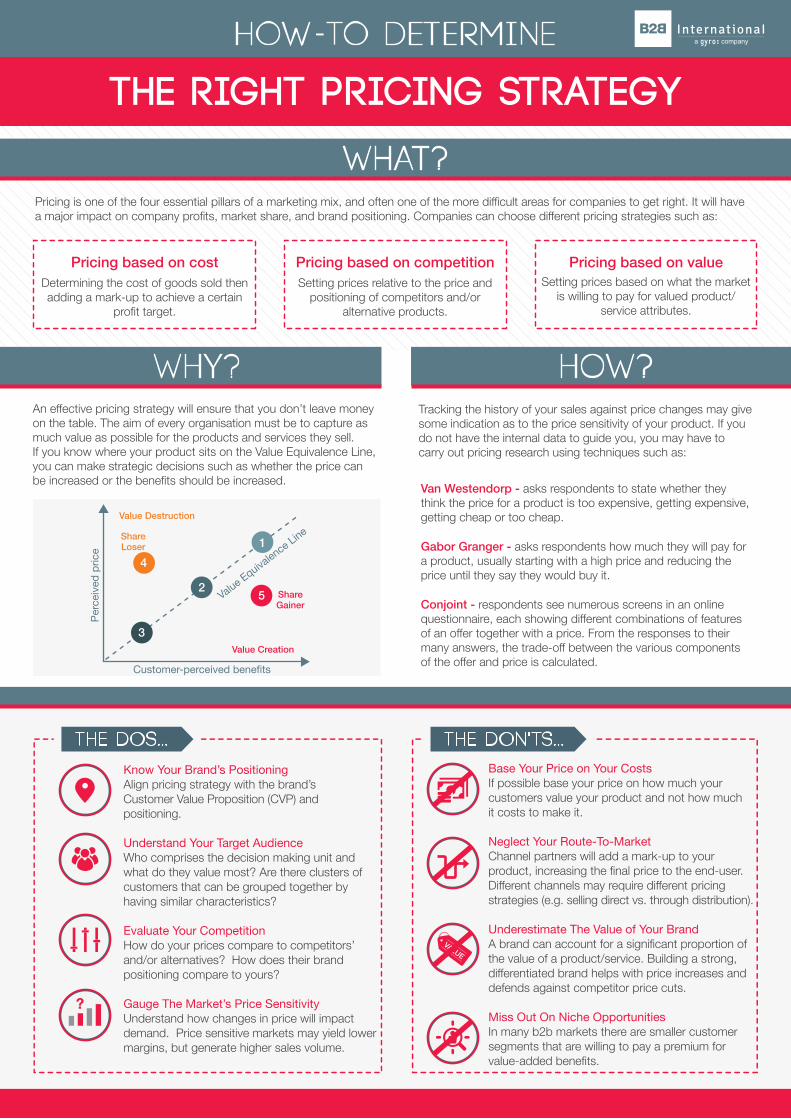
WHY?An effective pricing strategy will ensure that you don’t leave money on the table. The aim of every organisation must be to capture as much value as possible for the products and services they sell.If you know where your product sits on the Value Equivalence Line, you can make strategic decisions such as whether the price canbe increased or the benefits should be increased.
Tracking the history of your sales against price changes may give some indication as to the price sensitivity of your product. If you do not have the internal data to guide you, you may have to carry out pricing research using techniques such as:
Van Westendorp - asks respondents to state whether they think the price for a product is too expensive, getting expensive, getting cheap or too cheap.
Gabor Granger - asks respondents how much they will pay for a product, usually starting with a high price and reducing the price until they say they would buy it.
Conjoint - respondents see numerous screens in an online questionnaire, each showing different combinations of features of an offer together with a price. From the responses to their many answers, the trade-off between the various components of the offer and price is calculated.
how?
the dos. . . the doN'Ts. . .
Know Your Brand’s Positioning Align pricing strategy with the brand’sCustomer Value Proposition (CVP) and positioning.
Understand Your Target Audience Who comprises the decision making unit and what do they value most? Are there clusters of customers that can be grouped together by having similar characteristics?
Evaluate Your Competition How do your prices compare to competitors’ and/or alternatives? How does their brand positioning compare to yours?
Gauge The Market’s Price SensitivityUnderstand how changes in price will impact demand. Price sensitive markets may yield lower margins, but generate higher sales volume.
Base Your Price on Your CostsIf possible base your price on how much your customers value your product and not how muchit costs to make it.
Neglect Your Route-To-MarketChannel partners will add a mark-up to your product, increasing the final price to the end-user. Different channels may require different pricing strategies (e.g. selling direct vs. through distribution).
Underestimate The Value of Your BrandA brand can account for a significant proportion of the value of a product/service. Building a strong, differentiated brand helps with price increases and defends against competitor price cuts.
Miss Out On Niche OpportunitiesIn many b2b markets there are smaller customer segments that are willing to pay a premium for value-added benefits.
?
VALUE
Pricing is one of the four essential pillars of a marketing mix, and often one of the more difficult areas for companies to get right. It will havea major impact on company profits, market share, and brand positioning. Companies can choose different pricing strategies such as:
Pricing based on costDetermining the cost of goods sold then adding a mark-up to achieve a certain
profit target.
Pricing based on competitionSetting prices relative to the price and
positioning of competitors and/or alternative products.
Perc
eive
d pr
ice
Customer-perceived benefits
Value Equivalence Line
Value Creation
ShareGainer
ShareLoser
Value Destruction
1
2
3
4
5
how to determine
the right pricing strategy
WHAT?
Pricing based on valueSetting prices based on what the market
is willing to pay for valued product/service attributes.
fact:
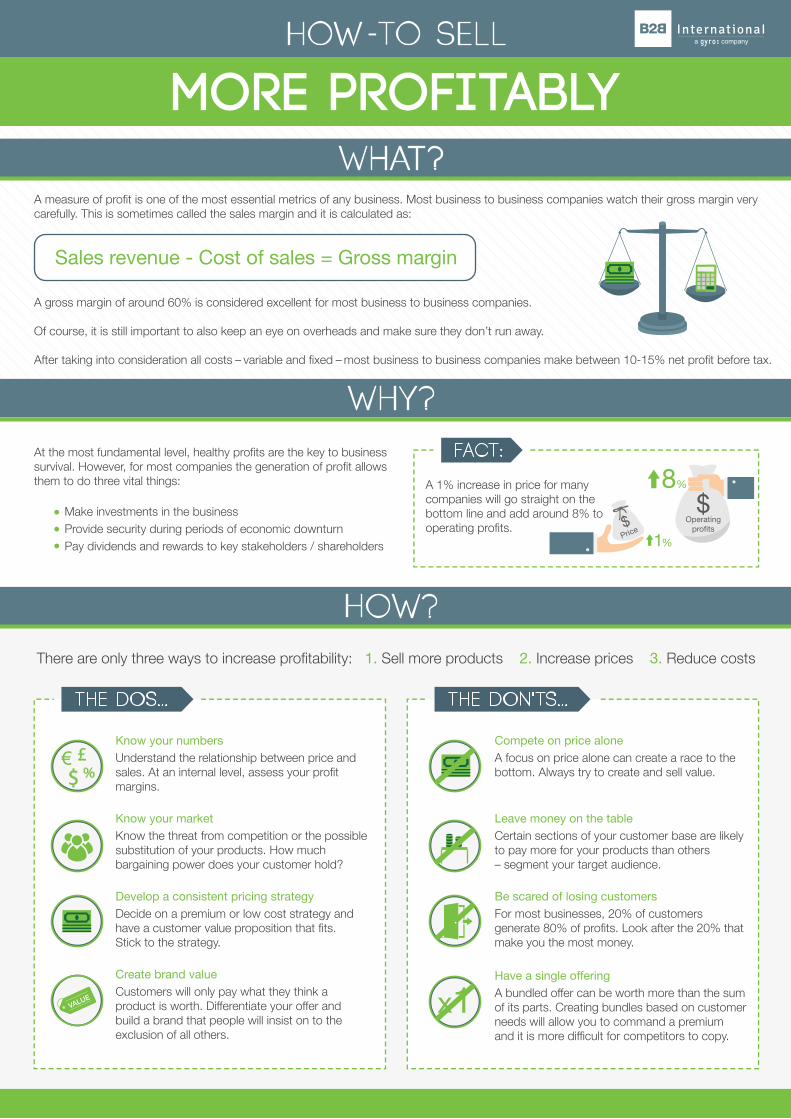
A 1% increase in price for many companies will go straight on the bottom line and add around 8% to operating profits.
HOW TO sell
WHY?
how?
WHAT?A measure of profit is one of the most essential metrics of any business. Most business to business companies watch their gross margin very carefully. This is sometimes called the sales margin and it is calculated as:
A gross margin of around 60% is considered excellent for most business to business companies.
Of course, it is still important to also keep an eye on overheads and make sure they don’t run away.
After taking into consideration all costs – variable and fixed – most business to business companies make between 10-15% net profit before tax.
At the most fundamental level, healthy profits are the key to businesssurvival. However, for most companies the generation of profit allowsthem to do three vital things:
Make investments in the businessProvide security during periods of economic downturnPay dividends and rewards to key stakeholders / shareholders
There are only three ways to increase profitability: 1. Sell more products 2. Increase prices 3. Reduce costs
the dos. . .
€ £$ %
the doN'Ts. . .
Know your numbersUnderstand the relationship between price and sales. At an internal level, assess your profit margins.
Know your marketKnow the threat from competition or the possible substitution of your products. How much bargaining power does your customer hold?
Develop a consistent pricing strategyDecide on a premium or low cost strategy and have a customer value proposition that fits. Stick to the strategy.
Create brand valueCustomers will only pay what they think a product is worth. Differentiate your offer and build a brand that people will insist on to the exclusion of all others.
Compete on price aloneA focus on price alone can create a race to the bottom. Always try to create and sell value.
Leave money on the tableCertain sections of your customer base are likely to pay more for your products than others– segment your target audience.
Be scared of losing customersFor most businesses, 20% of customers generate 80% of profits. Look after the 20% that make you the most money.
Have a single offeringA bundled offer can be worth more than the sum of its parts. Creating bundles based on customer needs will allow you to command a premium and it is more difficult for competitors to copy.
Sales revenue - Cost of sales = Gross margin
MORE PROFITABLY
$Price
$Operating
profits
1%
8%
VALUE x1
WHY?
how?
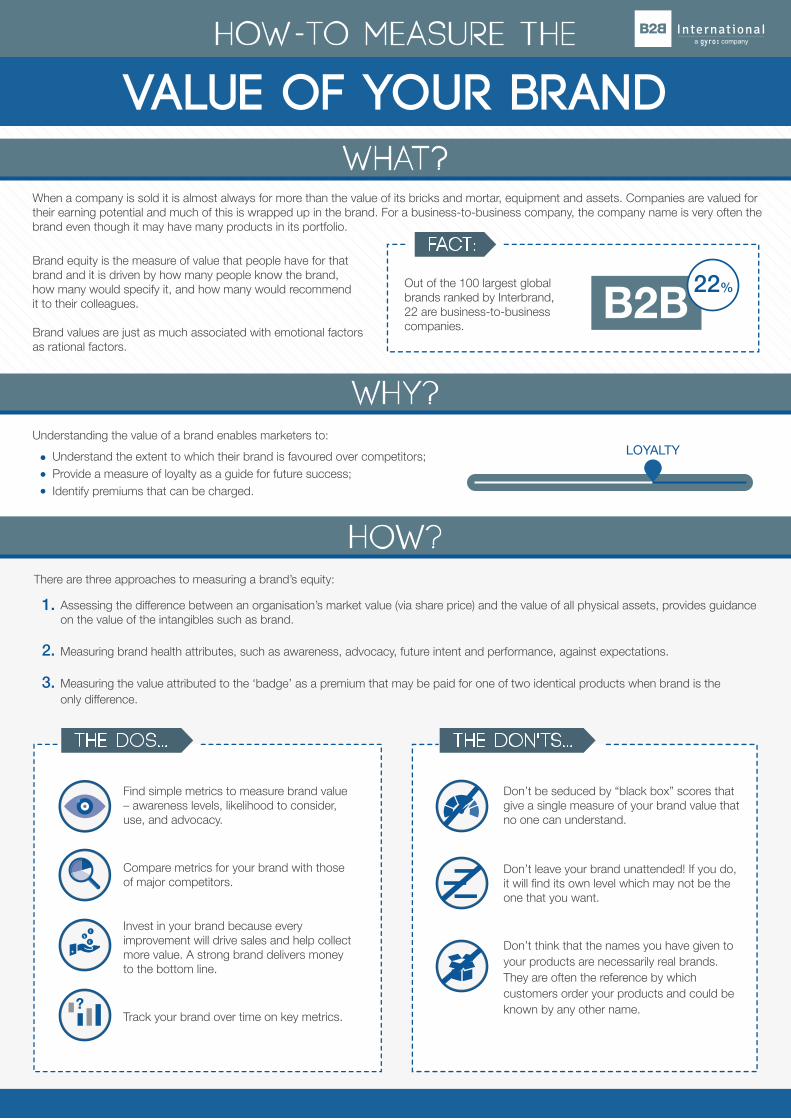
WHAT?When a company is sold it is almost always for more than the value of its bricks and mortar, equipment and assets. Companies are valued for their earning potential and much of this is wrapped up in the brand. For a business-to-business company, the company name is very often the brand even though it may have many products in its portfolio.
Brand equity is the measure of value that people have for that brand and it is driven by how many people know the brand,how many would specify it, and how many would recommendit to their colleagues.
Brand values are just as much associated with emotional factors as rational factors.
Understanding the value of a brand enables marketers to:LOYALTYUnderstand the extent to which their brand is favoured over competitors;
Provide a measure of loyalty as a guide for future success;Identify premiums that can be charged.
There are three approaches to measuring a brand’s equity:
Assessing the difference between an organisation’s market value (via share price) and the value of all physical assets, provides guidanceon the value of the intangibles such as brand.
Measuring brand health attributes, such as awareness, advocacy, future intent and performance, against expectations. Measuring the value attributed to the ‘badge’ as a premium that may be paid for one of two identical products when brand is theonly difference.
the dos. . . the doN'Ts. . .
Find simple metrics to measure brand value– awareness levels, likelihood to consider, use, and advocacy.
Compare metrics for your brand with thoseof major competitors.
Invest in your brand because every improvement will drive sales and help collect more value. A strong brand delivers moneyto the bottom line.
Track your brand over time on key metrics.
Don’t be seduced by “black box” scores that give a single measure of your brand value that no one can understand.
Don’t leave your brand unattended! If you do, it will find its own level which may not be the one that you want.
Don’t think that the names you have given to your products are necessarily real brands. They are often the reference by which customers order your products and could be known by any other name.
HOW TO measure the
value of your brand
?
fact:
Out of the 100 largest global brands ranked by Interbrand,22 are business-to-business companies.
B2B 22%
£
€$
1.
2.
3.There are only three ways to increase profitability: 1. Sell more products 2. Increase prices 3. Reduce costs
how?
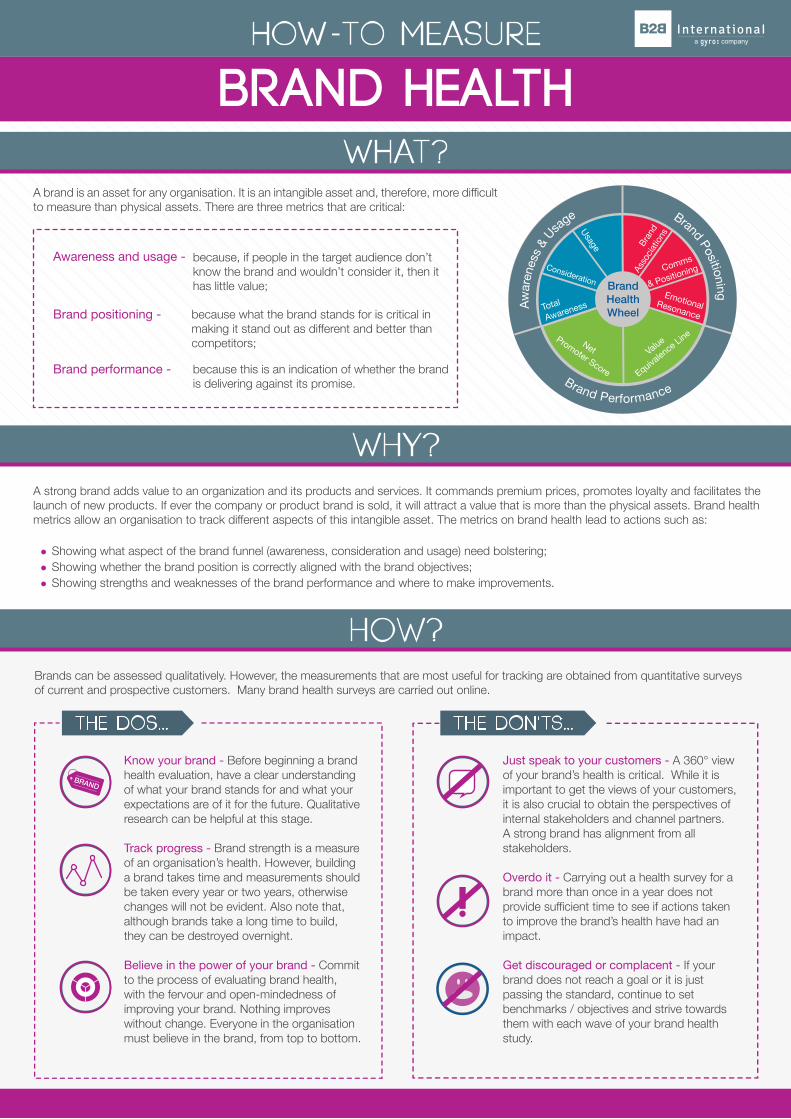
WHAT?A brand is an asset for any organisation. It is an intangible asset and, therefore, more difficult to measure than physical assets. There are three metrics that are critical:
A strong brand adds value to an organization and its products and services. It commands premium prices, promotes loyalty and facilitates the launch of new products. If ever the company or product brand is sold, it will attract a value that is more than the physical assets. Brand health metrics allow an organisation to track different aspects of this intangible asset. The metrics on brand health lead to actions such as:
Showing what aspect of the brand funnel (awareness, consideration and usage) need bolstering;Showing whether the brand position is correctly aligned with the brand objectives;Showing strengths and weaknesses of the brand performance and where to make improvements.
Brands can be assessed qualitatively. However, the measurements that are most useful for tracking are obtained from quantitative surveys of current and prospective customers. Many brand health surveys are carried out online.
the dos. . . the doN'Ts. . .
Know your brand - Before beginning a brand health evaluation, have a clear understanding of what your brand stands for and what your expectations are of it for the future. Qualitative research can be helpful at this stage.
Track progress - Brand strength is a measure of an organisation’s health. However, building a brand takes time and measurements should be taken every year or two years, otherwise changes will not be evident. Also note that, although brands take a long time to build, they can be destroyed overnight.
Believe in the power of your brand - Commit to the process of evaluating brand health, with the fervour and open-mindedness of improving your brand. Nothing improves without change. Everyone in the organisation must believe in the brand, from top to bottom.
Just speak to your customers - A 360° view of your brand’s health is critical. While it is important to get the views of your customers, it is also crucial to obtain the perspectives of internal stakeholders and channel partners.A strong brand has alignment from all stakeholders.
Overdo it - Carrying out a health survey for a brand more than once in a year does not provide sufficient time to see if actions taken to improve the brand’s health have had an impact.
Get discouraged or complacent - If your brand does not reach a goal or it is just passing the standard, continue to set benchmarks / objectives and strive towards them with each wave of your brand health study.
HOW TO measure
Brand health
£$
Brand Health Wheel
Bran
d
Asso
ciatio
ns
Comms
& Positioning
EmotionalResonance
Value
Equivalence Line
NetPromoter Score
Total
Awareness
Consideration
Usage
Brand Performance
Brand Positioning
A
war
enes
s & U
sage
WHY?
Awareness and usage - because, if people in the target audience don’t know the brand and wouldn’t consider it, then it has little value;
Brand positioning - because what the brand stands for is critical in making it stand out as different and better than competitors;
Brand performance - because this is an indication of whether the brandis delivering against its promise.
BRAND
!
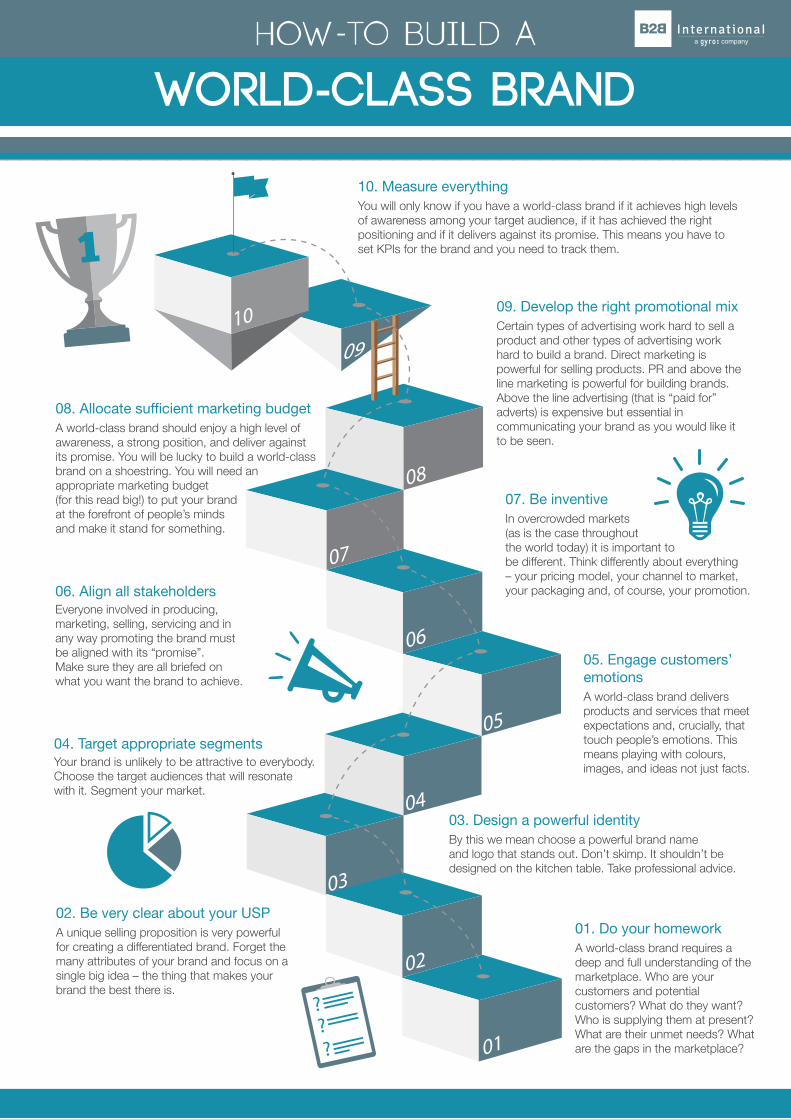
01. Do your homeworkA world-class brand requires a deep and full understanding of the marketplace. Who are your customers and potential customers? What do they want? Who is supplying them at present? What are their unmet needs? What are the gaps in the marketplace?
How to build a
02. Be very clear about your USPA unique selling proposition is very powerful for creating a differentiated brand. Forget the many attributes of your brand and focus on a single big idea – the thing that makes your brand the best there is.
04. Target appropriate segmentsYour brand is unlikely to be attractive to everybody. Choose the target audiences that will resonatewith it. Segment your market.
06. Align all stakeholdersEveryone involved in producing, marketing, selling, servicing and in any way promoting the brand must be aligned with its “promise”.Make sure they are all briefed on what you want the brand to achieve.
03. Design a powerful identityBy this we mean choose a powerful brand nameand logo that stands out. Don’t skimp. It shouldn’t be designed on the kitchen table. Take professional advice.
05. Engage customers’emotionsA world-class brand delivers products and services that meet expectations and, crucially, that touch people’s emotions. This means playing with colours, images, and ideas not just facts.
07. Be inventiveIn overcrowded markets(as is the case throughoutthe world today) it is important tobe different. Think differently about everything– your pricing model, your channel to market, your packaging and, of course, your promotion.
08. Allocate sufficient marketing budgetA world-class brand should enjoy a high level of awareness, a strong position, and deliver against its promise. You will be lucky to build a world-class brand on a shoestring. You will need an appropriate marketing budget(for this read big!) to put your brandat the forefront of people’s mindsand make it stand for something.
09. Develop the right promotional mixCertain types of advertising work hard to sell a product and other types of advertising work hard to build a brand. Direct marketing is powerful for selling products. PR and above the line marketing is powerful for building brands. Above the line advertising (that is “paid for” adverts) is expensive but essential in communicating your brand as you would like it to be seen.
10. Measure everythingYou will only know if you have a world-class brand if it achieves high levels of awareness among your target audience, if it has achieved the right positioning and if it delivers against its promise. This means you have to set KPIs for the brand and you need to track them.1
???
worLD-CLASS BRAND
WHY?
how?
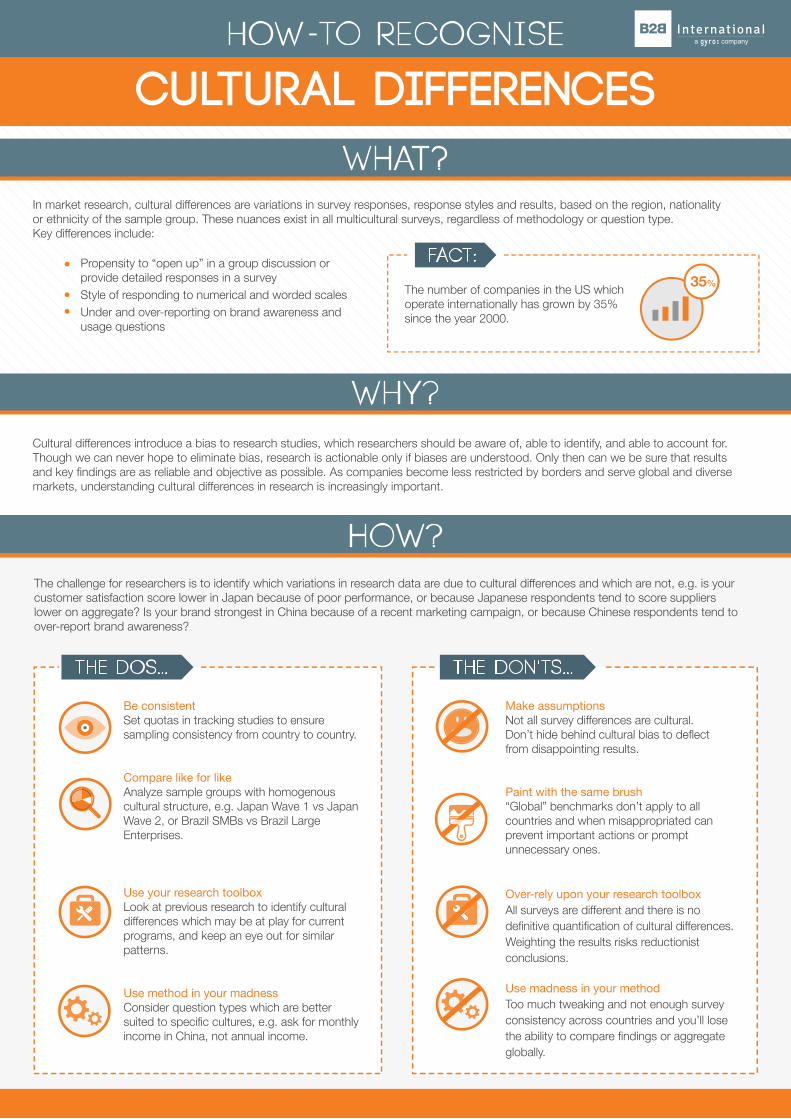
WHAT?In market research, cultural differences are variations in survey responses, response styles and results, based on the region, nationalityor ethnicity of the sample group. These nuances exist in all multicultural surveys, regardless of methodology or question type.Key differences include:
Propensity to “open up” in a group discussion or provide detailed responses in a survey Style of responding to numerical and worded scales Under and over-reporting on brand awareness and usage questions
Cultural differences introduce a bias to research studies, which researchers should be aware of, able to identify, and able to account for. Though we can never hope to eliminate bias, research is actionable only if biases are understood. Only then can we be sure that results and key findings are as reliable and objective as possible. As companies become less restricted by borders and serve global and diverse markets, understanding cultural differences in research is increasingly important.
The challenge for researchers is to identify which variations in research data are due to cultural differences and which are not, e.g. is your customer satisfaction score lower in Japan because of poor performance, or because Japanese respondents tend to score suppliers lower on aggregate? Is your brand strongest in China because of a recent marketing campaign, or because Chinese respondents tend to over-report brand awareness?
the dos. . . the doN'Ts. . .
Be consistentSet quotas in tracking studies to ensure sampling consistency from country to country.
Compare like for likeAnalyze sample groups with homogenous cultural structure, e.g. Japan Wave 1 vs Japan Wave 2, or Brazil SMBs vs Brazil Large Enterprises.
Use your research toolboxLook at previous research to identify cultural differences which may be at play for current programs, and keep an eye out for similar patterns.
Use method in your madnessConsider question types which are better suited to specific cultures, e.g. ask for monthly income in China, not annual income.
Make assumptionsNot all survey differences are cultural.Don’t hide behind cultural bias to deflectfrom disappointing results.
Paint with the same brush“Global” benchmarks don’t apply to all countries and when misappropriated can prevent important actions or prompt unnecessary ones.
Over-rely upon your research toolboxAll surveys are different and there is no definitive quantification of cultural differences. Weighting the results risks reductionist conclusions.
Use madness in your methodToo much tweaking and not enough survey consistency across countries and you’ll lose the ability to compare findings or aggregate globally.
How to Recognise
cultural differences
fact:
The number of companies in the US which operate internationally has grown by 35%since the year 2000.
35%
WHY?
fact:
how?
WHAT?
Not at alllikely
Extremelylikely
Neutral
Detractors
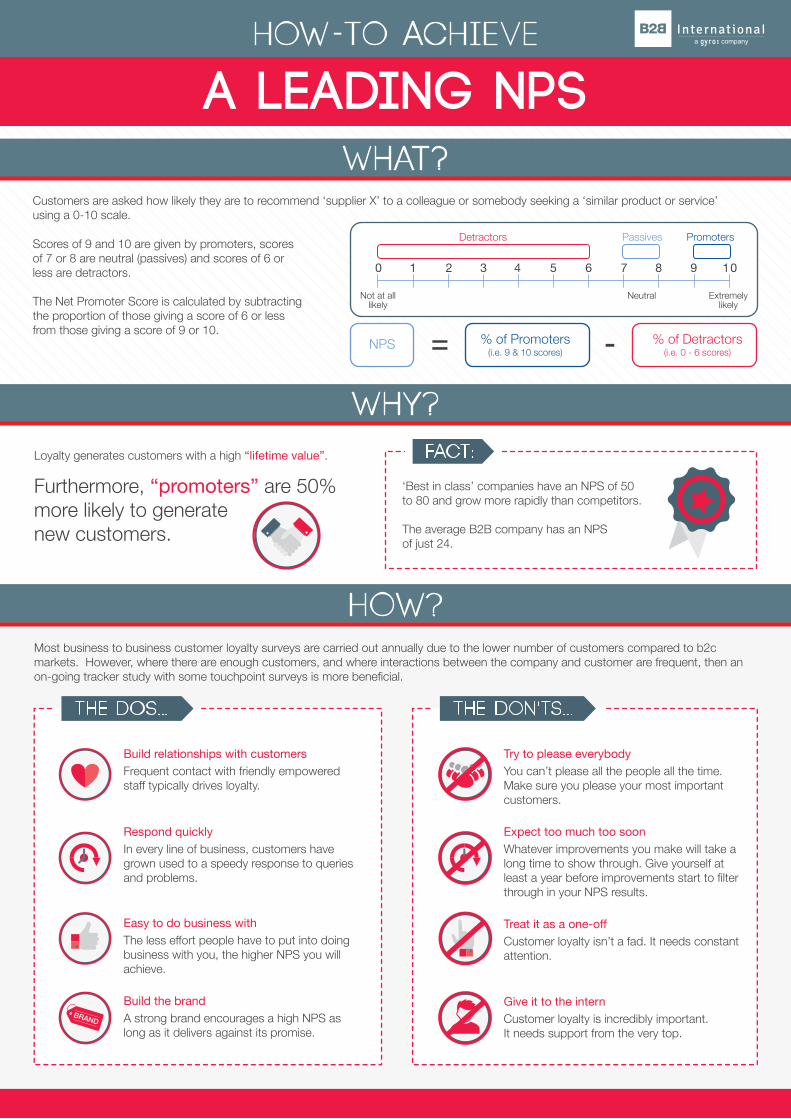
NPS = -% of Promoters(i.e. 9 & 10 scores)
% of Detractors(i.e. 0 - 6 scores)
Passives PromotersScores of 9 and 10 are given by promoters, scoresof 7 or 8 are neutral (passives) and scores of 6 or less are detractors.
The Net Promoter Score is calculated by subtracting the proportion of those giving a score of 6 or less from those giving a score of 9 or 10.
Loyalty generates customers with a high “lifetime value”.
Furthermore, “promoters” are 50%more likely to generatenew customers.
‘Best in class’ companies have an NPS of 50 to 80 and grow more rapidly than competitors.
The average B2B company has an NPSof just 24.
Customers are asked how likely they are to recommend ‘supplier X’ to a colleague or somebody seeking a ‘similar product or service’ using a 0-10 scale.
Most business to business customer loyalty surveys are carried out annually due to the lower number of customers compared to b2c markets. However, where there are enough customers, and where interactions between the company and customer are frequent, then an on-going tracker study with some touchpoint surveys is more beneficial.
the dos. . . the doN'Ts. . .
Build relationships with customersFrequent contact with friendly empowered staff typically drives loyalty.
Respond quicklyIn every line of business, customers have grown used to a speedy response to queries and problems.
Easy to do business withThe less effort people have to put into doing business with you, the higher NPS you will achieve.
Build the brandA strong brand encourages a high NPS as long as it delivers against its promise.
Try to please everybodyYou can’t please all the people all the time. Make sure you please your most important customers.
Expect too much too soonWhatever improvements you make will take a long time to show through. Give yourself at least a year before improvements start to filter through in your NPS results.
Treat it as a one-offCustomer loyalty isn’t a fad. It needs constant attention.
Give it to the internCustomer loyalty is incredibly important.It needs support from the very top.
0 1 2 3 4 5 6 7 8 9 10
BRAND
HOW TO ACHIEVE
A LEADING NPS
THE IMPACT OF SATISFIED CUSTOMERS:
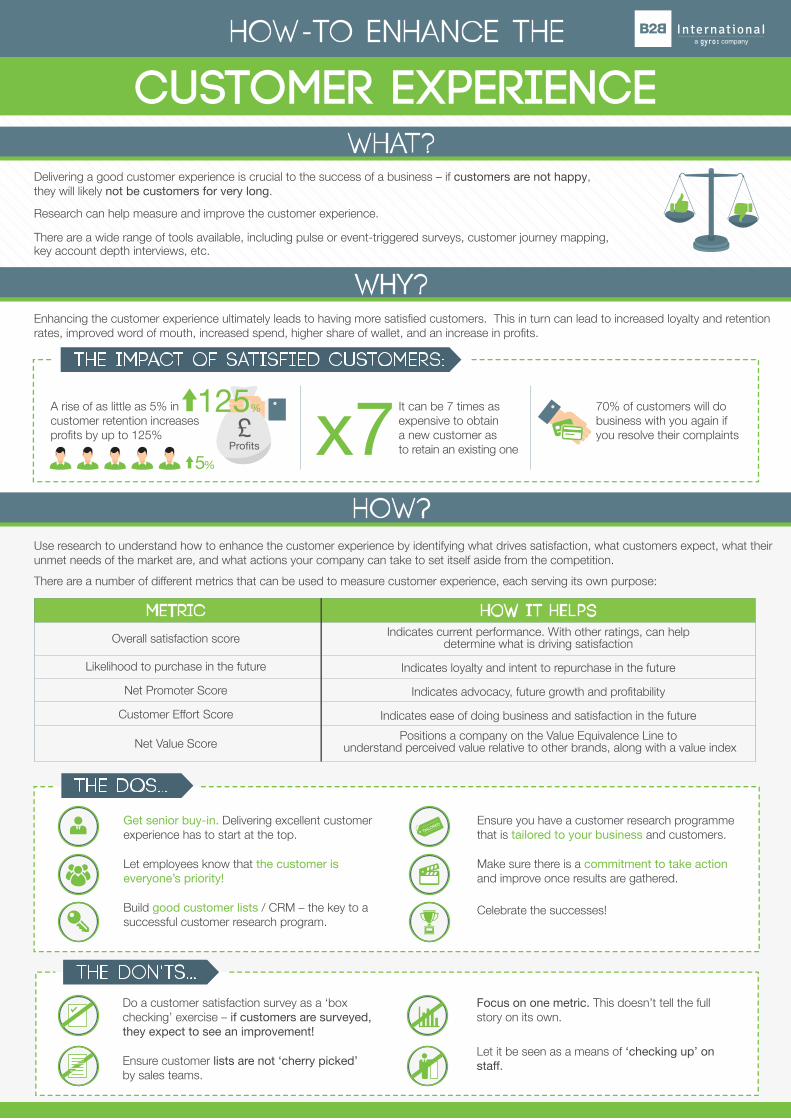
It can be 7 times as expensive to obtaina new customer asto retain an existing one
70% of customers will do business with you again ifyou resolve their complaints
WHY?
how?
WHAT?Delivering a good customer experience is crucial to the success of a business – if customers are not happy,they will likely not be customers for very long.
Research can help measure and improve the customer experience.
There are a wide range of tools available, including pulse or event-triggered surveys, customer journey mapping, key account depth interviews, etc.
Enhancing the customer experience ultimately leads to having more satisfied customers. This in turn can lead to increased loyalty and retention rates, improved word of mouth, increased spend, higher share of wallet, and an increase in profits.
Use research to understand how to enhance the customer experience by identifying what drives satisfaction, what customers expect, what their unmet needs of the market are, and what actions your company can take to set itself aside from the competition.
There are a number of different metrics that can be used to measure customer experience, each serving its own purpose:
the dos. . .
the doN'Ts. . .
Get senior buy-in. Delivering excellent customer experience has to start at the top.
Let employees know that the customer is everyone’s priority!
Build good customer lists / CRM – the key to a successful customer research program.
Ensure you have a customer research programmethat is tailored to your business and customers.
Make sure there is a commitment to take actionand improve once results are gathered.
Celebrate the successes!
Do a customer satisfaction survey as a ‘box checking’ exercise – if customers are surveyed, they expect to see an improvement!
Ensure customer lists are not ‘cherry picked’by sales teams.
Focus on one metric. This doesn’t tell the full story on its own.
Let it be seen as a means of ‘checking up’ on staff.
£Profits
5%
125% x7A rise of as little as 5% in customer retention increases profits by up to 125%
METRIC
Overall satisfaction score
Likelihood to purchase in the future
Net Promoter Score
Customer Effort Score
Net Value Score
HOW IT HELPSIndicates current performance. With other ratings, can help
determine what is driving satisfaction
Indicates loyalty and intent to repurchase in the future
Indicates advocacy, future growth and profitability
Indicates ease of doing business and satisfaction in the future
Positions a company on the Value Equivalence Line to understand perceived value relative to other brands, along with a value index
TAILORED
HOW TO ENHANCE THE
CUSTOMER EXPERIENCE
WHY?
how?
WHAT?
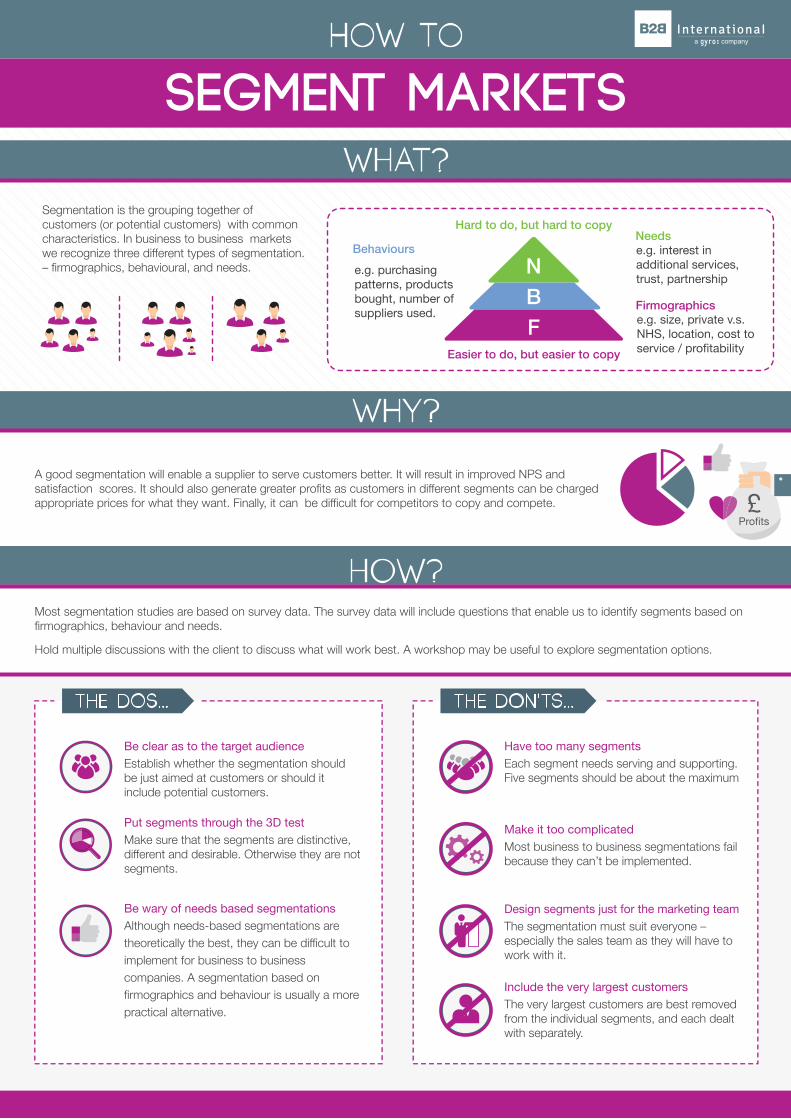
Segmentation is the grouping together of customers (or potential customers) with common characteristics. In business to business markets we recognize three different types of segmentation. – firmographics, behavioural, and needs.
Most segmentation studies are based on survey data. The survey data will include questions that enable us to identify segments based on firmographics, behaviour and needs.
Hold multiple discussions with the client to discuss what will work best. A workshop may be useful to explore segmentation options.
A good segmentation will enable a supplier to serve customers better. It will result in improved NPS and satisfaction scores. It should also generate greater profits as customers in different segments can be charged appropriate prices for what they want. Finally, it can be difficult for competitors to copy and compete.
the dos. . . the doN'Ts. . .
Be clear as to the target audienceEstablish whether the segmentation should be just aimed at customers or should it include potential customers.
Put segments through the 3D testMake sure that the segments are distinctive, different and desirable. Otherwise they are not segments.
Be wary of needs based segmentationsAlthough needs-based segmentations are theoretically the best, they can be difficult to implement for business to business companies. A segmentation based on firmographics and behaviour is usually a more practical alternative.
Have too many segmentsEach segment needs serving and supporting. Five segments should be about the maximum
Make it too complicatedMost business to business segmentations fail because they can’t be implemented.
Design segments just for the marketing teamThe segmentation must suit everyone – especially the sales team as they will have to work with it.
Include the very largest customersThe very largest customers are best removed from the individual segments, and each dealt with separately.
HOW TO
segment markets
Hard to do, but hard to copyNeeds
Firmographics
Behaviours
Easier to do, but easier to copy
NBF
e.g. interest in additional services, trust, partnership
e.g. purchasing patterns, products bought, number of suppliers used. e.g. size, private v.s.
NHS, location, cost to service / profitability
£Profits
WHY?
how?
WHAT?
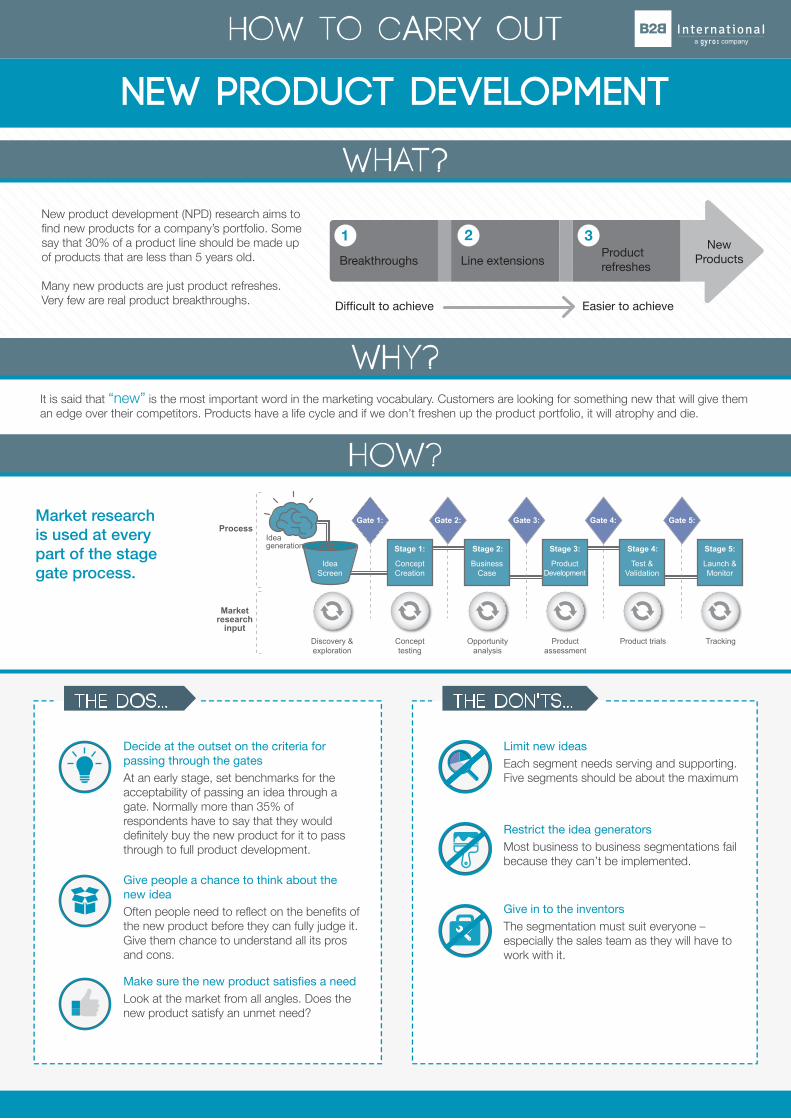
New product development (NPD) research aims to find new products for a company’s portfolio. Some say that 30% of a product line should be made up of products that are less than 5 years old.
Many new products are just product refreshes. Very few are real product breakthroughs.
Market research is used at every part of the stage gate process.
It is said that “new” is the most important word in the marketing vocabulary. Customers are looking for something new that will give them an edge over their competitors. Products have a life cycle and if we don’t freshen up the product portfolio, it will atrophy and die.
the dos. . . the doN'Ts. . .
Decide at the outset on the criteria for passing through the gatesAt an early stage, set benchmarks for the acceptability of passing an idea through a gate. Normally more than 35% of respondents have to say that they would definitely buy the new product for it to pass through to full product development.
Give people a chance to think about the new ideaOften people need to reflect on the benefits of the new product before they can fully judge it. Give them chance to understand all its pros and cons.
Make sure the new product satisfies a needLook at the market from all angles. Does the new product satisfy an unmet need?
Limit new ideasEach segment needs serving and supporting. Five segments should be about the maximum
Restrict the idea generatorsMost business to business segmentations fail because they can’t be implemented.
Give in to the inventorsThe segmentation must suit everyone – especially the sales team as they will have to work with it.
HOW TO CARRY OUT
NEW PRODUCT DEVELOPMENT
Difficult to achieve
Breakthroughs Line extensions Product refreshes
NewProducts
Easier to achieve
1 2 3
Discovery &exploration
Concept testing
Opportunityanalysis
Productassessment
Product trials Tracking
Ideageneration
Process
Marketresearch
input
Stage 1:
ConceptCreation
IdeaScreen
Business Case
Stage 2:
ProductDevelopment
Stage 3:
Test & Validation
Stage 4:
Launch & Monitor
Stage 5:
Gate 1: Gate 2: Gate 3: Gate 4: Gate 5: