henry hogo assistant deputy executive officer mobile source division science and technology...
TRANSCRIPT

Henry HogoAssistant Deputy Executive Officer
Mobile Source DivisionScience and Technology Advancement
2015 International Emission Inventory ConferenceSan Diego, CA April 14, 2015
Application of Emission Inventories in the Development of SIP
Control Strategies and Reconciliation with Air Quality Measurements
Application of Emission Inventories in the Development of SIP
Control Strategies and Reconciliation with Air Quality Measurements
1

• Substantial Air Quality Progress, But Still Serious Health Impacts
• Nation’s Largest Containerized Freight Gateway
California’s South Coast Air BasinCalifornia’s South Coast Air Basin
– 4-county Region–16+ Million People
– 261,000+ Diesel Vehicles– 11+ Million Gasoline Vehicles
22
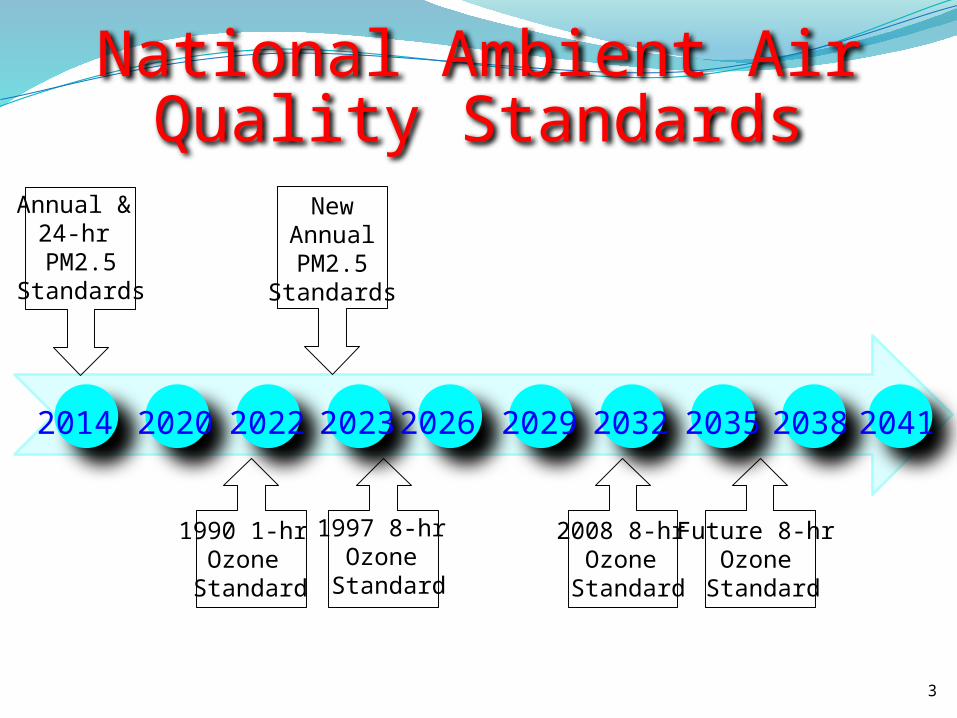
National Ambient Air Quality Standards
3
2014 2020 2023 20262022 2029 2032 2035 2038
Annual & 24-hr PM2.5
Standards
1997 8-hr Ozone
Standard
2041
1990 1-hr Ozone
Standard
2008 8-hr Ozone
Standard
Future 8-hr Ozone
Standard
NewAnnualPM2.5
Standards

2023 VOC and NOx Emissionsin the South Coast Air Basin
Station-ary and
Area Sources
22%
On-Road Vehicles
37%
Off-Road Vehicles
42%
NOx
4
Station-ary and
Area Sources
60%
On-Road Vehicles
16%
Off-Road Vehicles
25%
VOC
Total = 437.8 Total = 319

Heavy-Duty Diesel Trucks
Cars/SUVs
Off-Road Equipment
Ships & Commercial
Boats*
Manufac-ture/
Industrial
Med-Duty Vehicles
RECLAIM** Heavy-Duty Gasoline
Trucks
Locomo-tives
Residential Fuel
Combustion
Aircraft0
25
50
75
100
125
150
129
68 64
4735
27 27 22 22 2014
NOx
(tons
/day
)
* Ocean-going vessels = 35 tons/day**RECLAIM: 320 largest stationary sources, including all refineries and power plants
Top NOx Emissions Sources in 2014Top NOx Emissions Sources in 2014
5
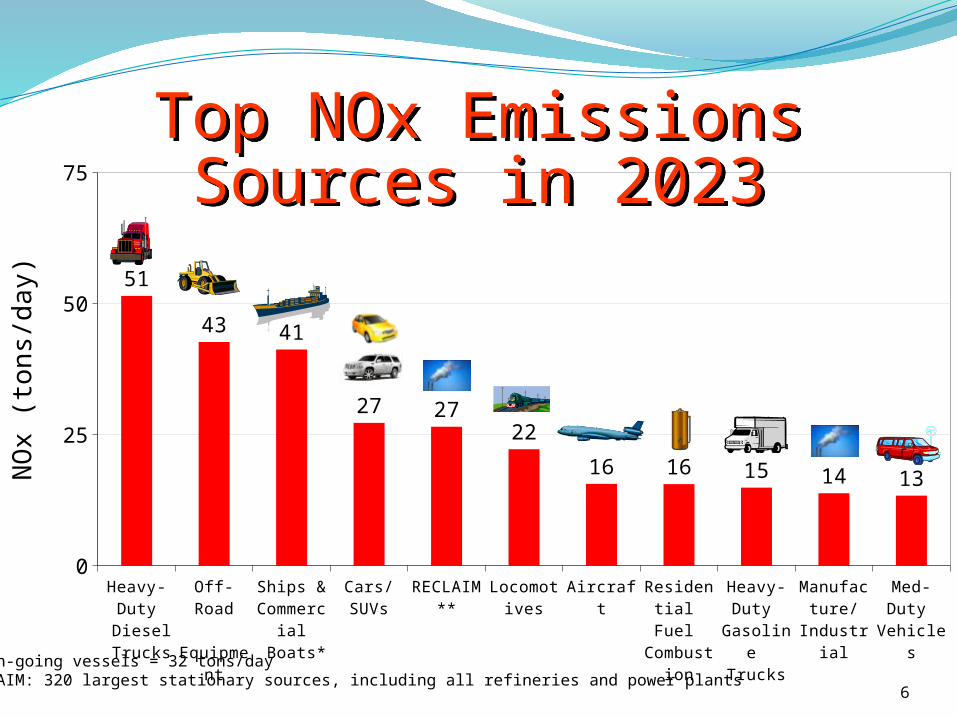
Heavy-Duty Diesel Trucks
Off-Road Equipment
Ships & Commercial
Boats*
Cars/SUVs
RECLAIM** Locomo-tives
Aircraft Residential Fuel
Combustion
Heavy-Duty Gasoline
Trucks
Manufac-ture/
Industrial
Med-Duty Vehicles
0
25
50
75
51
43 41
27 2722
16 16 15 14 13
NOx
(tons
/day
)
* Ocean-going vessels = 32 tons/day**RECLAIM: 320 largest stationary sources, including all refineries and power plants
Top NOx Emissions Sources in 2023Top NOx Emissions Sources in 2023
6
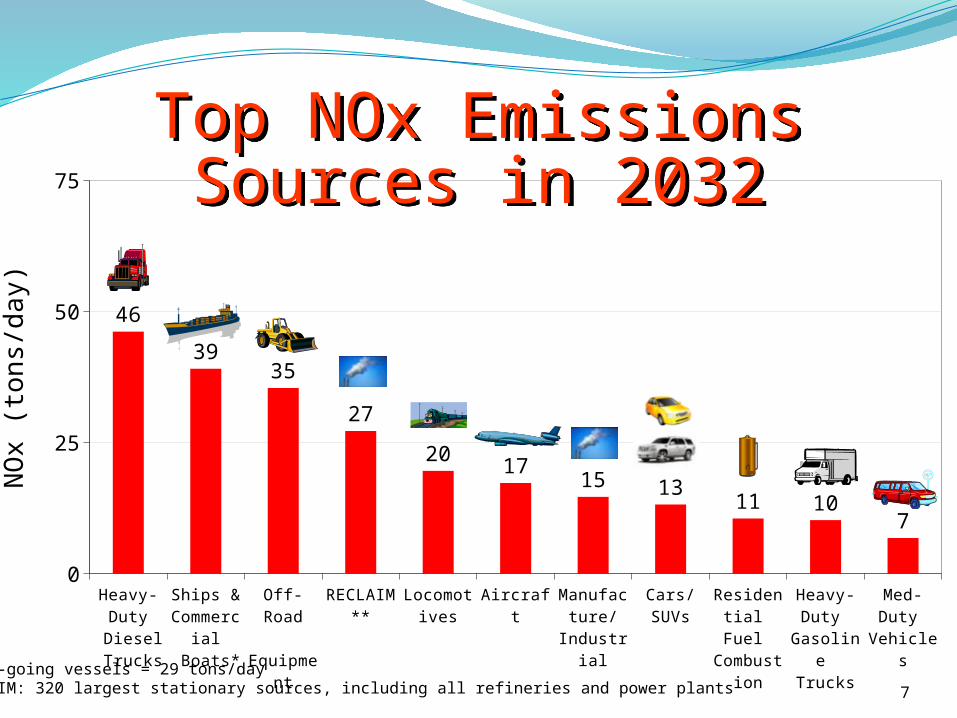
Heavy-Duty Diesel Trucks
Ships & Commercial
Boats*
Off-Road Equipment
RECLAIM** Locomo-tives
Aircraft Manufac-ture/
Industrial
Cars/SUVs
Residential Fuel
Combustion
Heavy-Duty Gasoline
Trucks
Med-Duty Vehicles
0
25
50
75
46
3935
27
20 1715 13
11 107
NOx
(tons
/day
)
* Ocean-going vessels = 29 tons/day**RECLAIM: 320 largest stationary sources, including all refineries and power plants
Top NOx Emissions Sources in 2032Top NOx Emissions Sources in 2032
7

8
0
50
100
150
200
250
300
350Heavy-Duty Diesel TrucksOff-Road EquipmentOcean-going VesselsOtherRECLAIM (Large Stationary)LocomotivesAircraftResidential Fuel CombustionHeavy-Duty Gasoline TrucksLight-Duty VehiclesMedium-Duty TrucksLight-Duty TrucksManufacturing and IndustrialCommercial BoatsService/CommercialRecreational Boats
Needed by 2032Needed by 2023
Needed Pollution Reductionto Meet Ozone Air Quality Standards
Needed Pollution Reductionto Meet Ozone Air Quality Standards

Passenger Sector Emission Contributions – NOx (tpd)
Passenger Sector Emission Contributions – NOx (tpd)
2014 Total: 485 tpd
2023 Total: 319 tpd
2032 Total: 276 tpd
Off-Road Passenger
Transportation, 26
On-Road Passenger
Transportation, 106
Others, 353
2014
Off-Road Passenger
Transportation, 27 On-Road
Passenger Transportation,
59
Others, 233
2023
Off-Road Passenger
Transportation, 27 On-Road
Passenger Transportation,
45
Others, 204
2032*
*
*
* Others represent sources not related to passenger transportation 9

Goods Movement Sector Emission Contribution to Total NOx (tpd)
Goods Movement Sector Emission Contribution to Total NOx (tpd)
2014 Total: 485 tpd
2023 Total: 319 tpd
2032 Total: 276 tpd
Off-Road Goods Movement, 60
On-Road Goods Movement, 161
Others, 264
2014
Off-Road Goods Movement, 29
On-Road Goods Movement, 75Others, 172
2032
Off-Road Goods Movement, 54
On-Road Goods Movement, 76
Others, 188
2023
*
*
*
* Others represent sources not related to goods movement 10
Emission Reduction Scenarios Emission Reduction Scenarios Baseline Emissions – 2023, 2032 Equal Share Reductions (Across-the-Board) All Sources at Greatest Level of Control Based
on Existing Emission Standards Certain Emission Sectors with 90% Greater
Reductions than Existing Emission Standards
11

Mobile Source NOx Emission Reductions to Achieve 8-Hr Ozone Air Quality Standards (2023)
Mobile Source NOx Emission Reductions to Achieve 8-Hr Ozone Air Quality Standards (2023)
0
20
40
60
80
100
120
140
160
180
200Ocean-going VesselsLocomotivesAircraftHHD Diesel TrucksMHD Diesel TrucksLHD Diesel TrucksHHD Gasoline TrucksMHD Gasoline TrucksLHD Gasoline TrucksLight-Duty PassengerMedium-Duty TrucksLight-Duty TrucksHarbor Craft
Needed by 2023Baseline
All Sources Reduced Equally
100% Engines Meeting Most Stringent Current Std.
Aggressive Scenario for Key Sectors*
*Key Sectors: On-Road HD Trucks, Locomotives, Marine Vessels at Berth, Harbor Crafts, Cargo Handling Equipment
12

Mobile Source NOx Emission Reductions to Achieve 8-Hr Ozone Air Quality Standards (2032)
Mobile Source NOx Emission Reductions to Achieve 8-Hr Ozone Air Quality Standards (2032)
0
20
40
60
80
100
120
140
160Ocean-going VesselsLocomotivesAircraftHHD Diesel TrucksMHD Diesel TrucksLHD Diesel TrucksHHD Gasoline TrucksMHD Gasoline TrucksLHD Gasoline TrucksLight-Duty PassengerMedium-Duty TrucksLight-Duty TrucksHarbor Craft
Needed by 2032Baseline
All Sources Reduced Equally
100% Engines Meeting Most Stringent Current Std.
Aggressive Scenario for Key Sectors*
*Key Sectors: On-Road HD Trucks, Locomotives, Marine Vessels at Berth, Harbor Crafts, Cargo Handling Equipment
13
Some Initial ObservationsSome Initial Observations• Not Likely to Reach “Equal
Share” Levels with Current Emissions Standards
• Some Emission Sources May Not Reach“Equal Share” Level – Need for Other Sources to Further Reduce Emissions
• Potential to Reach “Equal Share” Levels of Emission Reduction with Greater Penetration of Zero- and Near-Zero Emission Technologies
14

Some Initial ObservationsSome Initial Observations
• Need for Earlier Penetration of Zero- and Near-Zero Emission Technologies (Commercialization/Deployment)
• Priority Placed on Reducing Emissions from Largest Contributors (i.e., Sub-Categories of Emissions)
15
Examples of Using Air Quality Measurements
to Reconcile Emission Inventories
Examples of Using Air Quality Measurements
to Reconcile Emission Inventories
16

Ozone Air Quality ModelingOzone Air Quality Modeling• 1994 Air Quality Management Plan – Air
Quality Modeling Showed Low Levels of Ozone in the Eastern Region
• March Air Force Base – Military Aircraft Emission Profiles Different from Commercial Aircraft– Military Aircraft – Higher VOC
Emissions, Lower NOx Emissions
– Commercial Aircraft Emissions – Mostly NOx
• Revised Emission Profiles Resulted in Closer Levels of Ozone Compared with Monitoring Data
17

PM Air Quality ModelingPM Air Quality Modeling
• Use of Default AP-42 Factors May Not Be Applicable in Local Situations
Entrained Road Dust – Factors Assumed Increased Dust with Increased VMT (No Limits)
GIS Model Developed to Estimate Entrained Road Dust Limiting Amounts
18
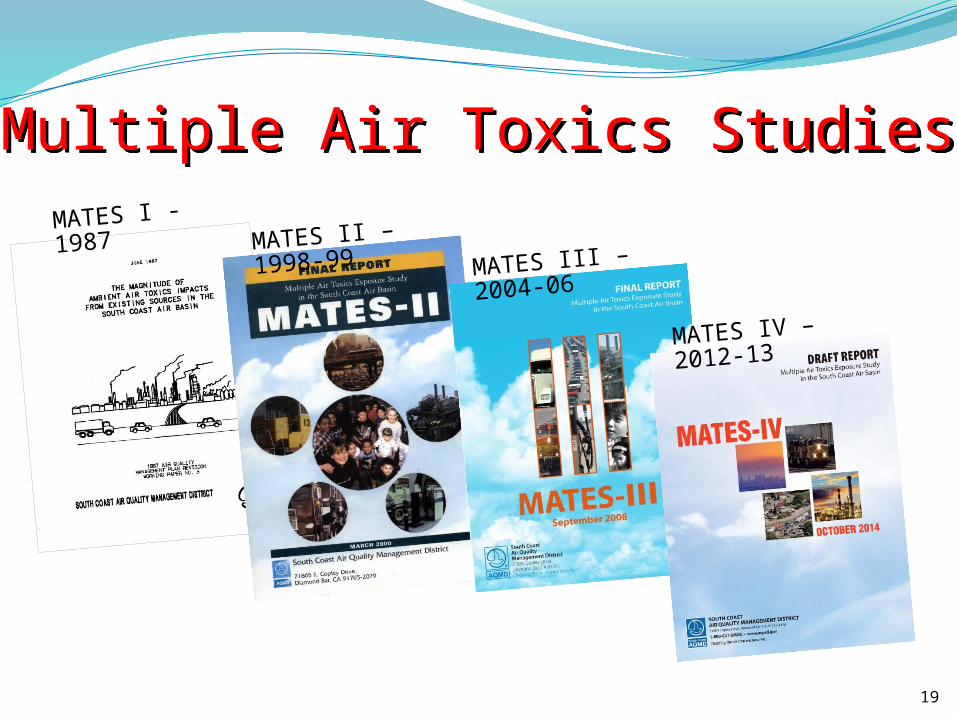
MATES I - 1987
Multiple Air Toxics StudiesMultiple Air Toxics StudiesMATES II – 1998-99
MATES III – 2004-06
MATES IV – 2012-13
19

MATES Data AnalysisMATES Data Analysis• Air Monitoring
Measurements of ~40 Chemicalsat 10 Fixed Sites
• Computer Simulation Modeling to Show Estimated Risk Levels Throughout the Region
• Computer Simulation Results Compared with Monitoring Data
20
F o n t a n a
Rubidoux
Wilmington
Pico Rivera
Sun Valley
San Bernardino Industry
Compton
Burbank
Anaheim
Inland Valley S.B.
Rubidoux
W. Long Beach N. Long Beach
Pico Rivera Central Los Angeles
Huntington Park
ReconciliationReconciliation• MATES-II
Elevated Levels of Styrene Measured in Anaheim
Model Did Not Predict High Levels Further Investigations Discovered
Foam Plant Out of Compliance
• MATES-III– Elevated Levels of Hexavalent Chrome
in Riverside Area, Not Predicted in Computer Modeling
– Further Investigations Discovered Elevated Levels of Chromium in Cement Manufacturing Operations
– Rule Amendments Were Adopted to Remedy Situation
21

SummarySummary• Emissions Inventory
Development Need to be Cross Checked with Real World Measurements Where Available
• Air Quality Modeling – Iterative Process Between Modeling Staff and Emissions Inventory Staff
• Control Strategy Development – Iterative Process Between Planning Staff, Emissions Inventory Staff, and Air Quality Modeling Staff
22