hernandez: spawning paterns for sardine and … · 2014-09-05 · hernandez: spawning paterns for...
TRANSCRIPT

HERNANDEZ: SPAWNING PATERNS FOR SARDINE AND ANCHOVY CalCOFl Rep., Vol. 35, 1994
DISTRIBUTION OF EGGS AND LARVAE FROM SARDINE AND ANCHOVY OFF CALIFORNIA AND BAJA CALIFORNIA, 195 1-1 989
SERGIO HERNANDEZ-VAZQUEZ Crntro de Investigacionrs Biologicas del Nororste, S.C
Km. 1 Cam. San Juan de La Costa “El Coinitan” Apartado portal 128
La Paz, B.C.S., MPxico 23000
ABSTRACT The CalCOFI data set for sardine and anchovy eggs
and larvae from 1951 to 1989 formed the basis of this analysis. The seasonal pattern is described on a monthly basis; for the geographical analysis the CalCOFI area was divided into alongshore regions and offshore-onshore regions. The percentage of positive stations was used to describe the seasonal and geographical patterns of sar- dine and anchovy eggs and larvae. Two seasonal spawn- ing patterns for sardine are described: one associated with the Southern California Bight area (northern pattern) and another located off Punta Eugenia, Baja California Sur (B.C.S.), Mexico (southern pattern). The northern pattern takes place from February to June-July; the south- ern pattern occurs from August to October. The tran- sition zone between patterns could be Punta Baja, Baja California, Mexico. In contrast, the spawning pattern described for anchovy shows no geographical varia- tions from Point Conception, California, to Magdalena Bay, B.C.S., and takes place from December to April, with high numbers of eggs and larvae in the Southern California Bight; there is, however, a secondary spawn- ing center in the Punta Eugenia region.
RESUMEN El presente anilisis se fundamenta en la base de datos
de “CalCOFI” de huevos y larvas de sardina y anchoveta de 1952 a 1989. Se describen 10s patrones estacionales sobre una base mensual. Para el anilisis geogrifico, se usaron diversos criterios: el irea total abarcada por 10s niuestreos “CalCOFI”, y subdivisiones de i s ta irea, por regibn a lo largo de la costa, y por regiones costeras vs. regiones en mar adentro. Se us6 el porcentaje de esta- ciones con presencia de huevos y larvas de sardina y anchoveta para describir 10s patrones estacionales y geo- grificos. Se describen dos patrones estacionales de de- sove para la sardina. El p a t h “norteiio” ocurre de febrero a junio-Julio al sur de Cahfornia, mientras que el “sureiio” ocurre de agosto a octubre en Punta Eugenia, Baja California Sur (B.C.S.), Mixico. La zona de transici6n entre ambos patrones podria ser Punta Baja, Baja California, Mixico. En contraste, el p a t h de desove de la anchoveta no varia geogrificamente desde Point
[Manuscript received January 15, 1994.1
Conception, California, hasta Bahia Magdalena, B.C.S., y ocurre de diciembre hasta abril con miximos de huevos y larvas en el sur de California. Existe asimismo un punto de desove secundario en el irea de Punta Eugenia.
INTRODUCTION The distribution and abundance of sardine (Savdinops
sugux) and anchovy (Evzgraulis rnordax) eggs and larvae in the California Current system have been intensely studied since the end of the 1940s, when the California Cooperative Oceanic Fisheries Investigations Program (CalCOFI) was established. This program was designed to obtain information about the causes of the great de- cline in sardine catches (Chelton et al. 1982). CalCOFI carried out oceanographic/biological cruises on a monthly basis from Cape Mendocino, California, to Cab0 San Lucas, Baja California Sur (B.C.S.), Mexico, to more than 200 nautical miles offshore.
In this paper I use the extensive CalCOFI data set to describe the distributional and abundance patterns of sardine and anchovy eggs and larvae observed during the 1951-89 period. Moser et ai. (1993) presented a global analysis of the whole CalCOFI area; here I explore de- tailed area/time windows to find seasonal trends. No in- terannual variations are accounted for because they are the subject of a second paper in preparation. The sea- sonal variation is described, and its possible causes are discussed.
Sardine and Anchovy Fishery/ Population Fluctuations
Even a superficial review of catch statistics of the small pelagic fishes of eastern boundary currents shows one feature: great fluctuations in their catches (and certainly in their abundance) on annual and decadal scales. The years considered in this analysis (1951-89) do not in- clude the period when great concentrations of sardine existed in the northern half of the CalCOFI area (California). In the 1930s and 1940s, the sardine catches in California were more than 500,000 tons in some years, but the fishery dramatically decreased at the beginning of 1950s. In the 1960s the California sardine fishery vir- tually disappeared, but a small Mexican fishery, less than 50,000 tons per year, was maintained on the west coast of Baja California. Barnes et al. (1992) present data on
94

HERNANDEZ: SPAWNING PAllERNS FOR SARDINE AND ANCHOVY CalCOFl Rep., Vol. 35, 1994
the fluctuations of sardine biomass off California and northern Baja California from 1933 to 1991, and show that the sardine population began to decline in the early 1940s and reached its lowest levels in the mid 1970s. Thus it must be realized that the information described in this paper was primarily taken while the sardine pop- ulation off California and northern Baja California (B.C.) was low.
The highest catches for the California anchovy fish- ery were made in the mid 1970s, with a maximum of 141,000 tons in the 1975-76 season. In the last ten years (1982-92), the annual average California catches were not over 3,000 tons; the Mexican fishery at Ensenada, B.C., fluctuated between 170,000 and 100 tons.
Sardine and Anchovy Spawning Range and Seasonality
It is known that in the 1930s, when a large Canadian sardine fishery existed, sardines spawned during summer as far north as British Columbia (Walford and Moser 1941). But sardines have been virtually absent from the region north of California since the 1950s and have only recently reappeared there. Clark (1934) showed that sar- dines spawn off California from February to August, with a peak in April-May. Scofield (1934) reported that the main areas of spawning were located between San Diego and Point Conception, with sporadic spawning as far north as San Francisco and as far south as Magdalena Bay, B.C.S. The cruises analyzed by Scofield were car- ried out during spring and early summer in 1929-32; only a few stations were located along the Mexican coast. The importance of the Scofield study is that it was made when sardine populations were at a high level in Cahfornia. Before the development of the CalCOFI pro- gram, several authors suggested that sardine spawning off California was concentrated during spring and sum- mer (Tibby 1937; Janssen 1937; Sette and Ahlstrom 1948).
Based on the more extensive coverage of the CalCOFI program, Ahlstrom (1954) described two main spawn- ing areas for the sardine. The first is an area of intensive spawning off the central part of the Baja California penin- sula. In this area spawning peaks from February to May, but eggs appear throughout the year in the Vizcaino, B.C., region. The second, larger area includes the Southern California Bight (SCB) and northern portion of the Baja California peninsula. In this region spawn- ing peaks in April-June. Ahlstrom (1954) reported that during 1950-51 more than 80% of sardine spawning was concentrated off of central Baja California.
Ahlstrom (1960) suggested that a group of sardines spawns in the Southern California Bight from April to June, and from January to June in warmer years; another group spawns off the central and southern part of Baja
California throughout the year, with peaks in both win- ter and summer. Also, he mentioned sporadic sardine spawning north of Point Conception from May to August.
Kramer and Smith (1971) used the CalCOFI 1951-60 data set for sardine eggs and larvae to suggest that “Two major centers of spawning are evident first in January in small areas off central Baja California and southern California . . . With the passage of time the southern groups spread northward and seaward; then in May and June, they intermix with the northern group, which spreads somewhat southward. In July, the two groups are separate again and, in October, heavy spawning occurs only off central Baja California.”
Lluch et al. (1992) analyzed sardine spawning during the 1950s off California and Baja California and found that spawning started early in the year near Punta Eugenia, B.C.S. During spring, sardine populations expand both northwards and southwards; in the north they reach the Southern Cahfornia Bight fi-om March to July. When spawning ceases there, sardine distribution contracts again to the Punta Eugenia area, where spawning takes place year-round. Moser et al. (1993) present the patterns for sardine eggs and larvae for 1951-84. Moser et al. found a major spawning area in the Punta Eugenia region, where spawning occurs throughout the year, with a max- imum from January to September. Moser et al. also show a spawning center in the Southern California Bight area during April-June, although some eggs are present there all year. Off central Baja Cahfornia eggs are concentrated in the first ten nautical miles; in the northern part of the peninsula and in the Southern California Bight eggs have a broader offshore distribution.
Regarding anchovy, Ahlstrom (1966) showed that lar- vae are distributed from Oregon to Punta San Juanico, B.C.S. A number of researchers have described the sea- sonal pattern of anchovy spawning in the southern California and northern Baja California region, using the presence of eggs and larvae in the CalCOFI data set, and gonad maturity information from adult anchovies. Lasker and Smith (1977), Chavez et al. (1977), Parrish et al. (1986), and Moser et al. (1993) state that anchovy spawning is concentrated from February to April in the Southern California Bight, although anchovy eggs and larvae and actively spawning adults are present through- out the year. Chavez et al. (1977) found mature anchovies during February-May in the Ensenada region.
Several authors have postulated environmental mech- anisms that may explain the distribution and timing of sardine and anchovy spawning in the California Current. Parrish et al. (1983) suggested a strong relationship be- tween the sea-surface temperature, turbulence and trans- port, and reproductive success. Lluch-Belda et al. (1991) proposed a hypothesis relating the upwelling index and
95

HERNANDEZ: SPAWNING PAlTERNS FOR SARDINE AND ANCHOVY CalCOFl Rep., Vol. 35, 1994
CM Lines 40-60 Cape Mendoclno region
MO Lines 61-80 Monterey region
SCB Lines 81-97 Southern California Bight region
PB Lines 98-113 Punta Bala region
PE Lines 114-13’2 Punta Eugenia region
M0 Liner 133-157 Magdalena Bay region
CalCOFl stations 110 95 80 65 50 35 20 - ............ ........... ..*..*.. 1.1.)
........... ............
................ ................ ................ ................ ................ ................
.................
................
.................. ..................
40
50
60
70
80
90 f
100 %
2
i; 0
u
110
120
130
140
150
157
Figure 1. Basic CalCOFl grid, with the geographic areas used in this analy- sis (1951-89). CM = Cape Mendocino, Calif.; SF = San Francisco; PC = Point Conception; SD = San Diego; PB = Punta Baja, B.C.; PE = Punta Eugenia, B.C.S.; and MB = Magdalena Bay).
sea-surface temperature to the distribution of sardine eggs and larvae on a yearly basis.
DATA AND METHODOLOGY The CalCOFI data set for sardine and anchovy eggs
and larvae for the 1951-89 period formed the basis of this analysis. The CalCOFI basic grid consists of an array of lines and stations (Eber and Hewitt 1979). Lines are perpendicular to the coast at intervals of 40 nautical miles (n.mi.). Stations are parallel to the coast, and separated by 4 n.mi. (figure 1). For each CalCOFI station the data base includes the date (year, month, and day), time, geographical position (CalCOFI line/station code), sea-surface temperature (0-10 m), and the number of sardine and anchovy eggs and larvae (standardized to 10 m2 of sea surface).
For the purpose of this paper the seasonal pattern is described on a monthly basis, and the geographical analy- ses utilize four different criteria as follows (figure 1):
1. All CalCOFI stations combined (global analysis). 2. The CalCOFI area divided by alongshore re-
gions: Cape Mendocino (CM) region, 40-60 lines;
Monterey (MO) region, 61-80 lines; Southern California Bight (SCB) region, 81-97 lines; Punta Baja (PB) region, 98-1 13 lines; Punta Eugenia (PE) region, 114-132 lines; and Magdalena Bay (MB) region, 133-157 lines.
3. By CalCOFI line. 4. Cross-shelf analysis: distance to the coast. The CalCOFI line analysis used the standard CalCOFI
lines (90, 93, 97 . . . . ) because these lines were system- atically sampled, whereas the intermediate lines-91, 92, 96-were omitted (of all stations sampled during the 1951-89 period only 5.6% were located in these inter- mediate CalCOFI lines). The other three analyses in- cluded all CalCOFI lines.
The percentage of positive stations was used to describe the seasonal and geographical pattern of occurrence of sardine and anchovy eggs and larvae for each of the four criteria. Some authors have used egg and larval density (the average number per station); others, however, have expressed doubts, because density may be biased if a sam- ple is taken near a spawning adult. Nevertheless, both indices are very well correlated; to be certain, I analyzed all of the series and found them to .be correlated beyond the 0.01 level.
The geographical and temporal coverage of the CalCOFI surveys varied widely during the 1951-89 period covered by this analysis. From 1951 to 1960, sur- veys were made monthly (only 6 months were not covered) and the latitudinal coverage was best from the north of Magdalena Bay (CalCOFI line 133) to Point Conception (CalCOFI line 80). Only 25% of surveys extended to the north and/or south of this area. Hewitt (1988) graphically described the temporal and spatial coverage surveys for the 1949-87 CalCOFI period. In summary, the geographical and seasonal coverage of the CalCOFI surveys is best from the Punta Eugenia area to the Monterey area and in the months fiom January to July; data are poorest in the Cape Mendocino re- gion and in the months of September, November, and December.
The number of stations sampled per month was great- est in the first part of the year (table 1). From January to July more than 2,500 stations were sampled each month, whereas from August to December (except October), no more than 1,300 stations were sampled per month. The number of stations per CalCOFI line, in general, was less than 100 from August to December (except October), but lines 90-93 (located in the Southern California Bight region) had more than 100 stations sampled per line. From January to July, more than 100 stations per line were sampled from line 80 (Point Conception) to line 130 (Punta Eugenia).
The surveys generally occupied stations as far offshore as station 90 (150 to 300 n.mi., depending on CalCOFI
96

HERNANDEZ: SPAWNING PAllERNS FOR SARDINE AND ANCHOVY CalCOFl Rep., Vol. 35, 1994
TABLE 1 Number of Stations Sampled in the CalCOFI Area, by Line and Month, 1951-1989
Total Total Nov. Dec. line Areas* areas
CalCOFI line Jan.
40 11 43 10 47 8 50 8 53 6 57 6 60 113 63 72 67 73 70 118 73 72 77 88 80 177 83 156 87 159 90 234 93 201 97 167
100 182 103 137 107 120 110 141 113 99 117 111 120 136 123 57 127 46 130 64 133 65 137 70 140 35 143 36 147 34 150 35 153 34 157 37
Feb. Mar. Apr. May June July Aug. Sept. Oct. -
Total* 3338 3580
6 1 1 9 8 8
37 46 53 47 58 88
125 142 208 216 237 185 172 1 53 144 174 154 163 196 111 122 1.53 124 120 50 29 33 33 29 28
2
44 37 39 50 63 84
122 119 127 192 22 1 167 149 110 106 138 105 114 164 90 81
100 79 79 18 17 13 18 7 9
9 6 3 7 4 4
144 95
101 129 88
1 05 171 175 212 25 1 230 208 224 221 2(15 187 191 199 208 115 117 132 137 120 36 24 34 17 28 12
2788 4224
*Includes intermediate CalCOFI lines (41, 42,
18 4 3
17 3 3
72 61 57 96 68
105 140 179 203 258 245 121 140 119 122 157 119 136 170 79 81
105 74 85 10
3137
55, 56,
8 3 3
19 11 12 64 43 50 69 43 63 97
122 139 191 205 223 195 186 158 148 137 127 134 5 8 58 68 53 56 20 9 5
22 9
20
23 15 14 26 13 15
147 87 88
125 76 97
145 164 189 222 220 202 208 172 184 183 172 207 215 129 124 124 107 105
6
2936 3903
6 3 2 5 3 3
30 23 25 33 21 47 84 57 67
125 101 57 73 49 45 96 54 62
112 57 67 95 79 65 15 1 0 9 9 2
1679
98, 99, .
line), but 14% of the surveys did not extend beyond CalCOFI station 80 (table 2).
RESULTS The results are presented for four geographical
perspectives, from a global CalCOFI view to regional cross-shelf views for both sardine and anchovy; each per- spective includes a seasonal analysis. The larvae/egg ratio for the global and subarea analyses is also presented.
Global Analysis for Entire CalCOFI Area For both sardine and anchovy, larvae were taken at
more stations than were eggs. The total number of sam- pled stations during 1951-89 was 31,897; 2,089 (6.5%) were positive for sardine eggs; 2,877 (9.0%) for sardine larvae; 7,147 (22.4%) for anchovy eggs; and 15,012 (47.0%) for anchovy larvae. The corresponding values for the mean number of eggs and larvae per station were
etc.)
25 5 6
17 5
16 70 56 68
135 127 50 52 39 39 50 49 62 72 33 27 37 22 22 7 3 4
10 3 2
7 6
7 3 3
67 40 41 54 44 65
104 131 3 48 192 201 169 167 126 125 131 117 114 160 83 90
115 95 89
7 7 9 9
12
2
7
40 20 22 38 21 42 68 69 69
103 94 39 49 17 17 44 3
17 49 20 19 41 19 31 21
14
11
13 11 12 12 10 14 52 45 71
108 91 61 64 53 60 65 61 58 79 43 39 44 34 27
6 6 6 6 3 3
1234 2821 1050 1207
TABLE 2
90 48 36
105 51 54
796 540 567 788 569 814
1355 1415 1660 2227 C M 1204 2173 M O 4771 1649 scn 9746 1675 Pn 7218 1382 PE 6242 1325 MB 2716 1514 Sum* 31897 1261 1370 1695 875 871
1078 888 869 231 141 147 173 127 122
Frequency of Occurrence of Each Station as the Most Offshore Location Sampled, 1951-1989
CalCOFI station Percent
40 50 60 70 80 9 0
100 110 120 130 140 150 160 170
190 200
I 80
1.47 1.10 3.68 4.04 3.68
30.51 23.16
3.68 12.87
1.47 3.68 0.74 1.47 0.37 1.10 0.00 6.99
97

HERNANDEZ: SPAWNING PAlTERNS FOR SARDINE AND ANCHOVY CalCOFl Rep., Vol. 35, 1994
A
0 0
/
____ _____ 'I
& , O L - L-- I - A
Jan Feb Mar Apr May Jun Jul Aug Sep Oct Nov Dec
70 -
30
10 a
e/,\, L. Anchovy Eggs +Anchovy Larvae; , w *\\
1 .-- I- -.- -- /' a
0 L.- -~ L- .p12 Jan Feb Mar Apr May Jun Jul Aug Sep Oct Nov Dec
' -< Sardine Anchovy- b C - 0
5 e $ 3 I m
- m . . .
11 Jan Feb Mar Apr May Jun Jul Aug Sep Oct Nov Dec
Figure 2 sardine and (B) anchovy C, larvaeiegg ratio for global analysis
Monthly percentage of positive stations for eggs and larvae of ( A )
13.86, 2.63, 65.81, and 64.82. Anchovy eggs and larvae occurred at more stations than sardine eggs and larvae. Sardine eggs and larvae. As described by earlier work- ers, sardine eggs and larvae are present throughout the year along Baja California and California (figure 2A), but it appears that the spawning season along the whole coast is more extended than that described in earlier studies, because the percentage of positive stations for sardine eggs remains in the 6% to 9%) range from February until September. The percentage decreases to less than 4% in October, to a n annual low of 1.7% in November, and then rises to almost 4% in December and January. The highest percentages for sardine larvae are during August (14%) and September (12%). During the earlier peak of eggs and larvae (February to July), the percent- age of positive stations is only slightly higher than that for eggs, but starting in August and continuing into the winter there are about twice as many positive stations for larvae as there are for eggs. As shown below, gen- eral patterns for the entire coast are due to complex sea- sonal patterns in different areas.
,'\ + Sardine Eggs + Sardine larvae
MB PE PB SCB MO CM
2o r 8 1 5 ,
\ 1
. OL--- , ~ -~ ~ ~
MB PE PB SCB MO CM
1 Anchovy Eggs Anchovy larvae
3.5
c n 3 cn
!$ 2.5
E 2
2 1 .e 1.5 -
0.5 MB PE PB SCB MO CM
Figure 3. Percentage of positive stations for eggs and larvae of (A) sardine and (13) anchovy. C, larvaeiegg ratio for analysis of areas (MB = Magdalena Bay: PE = Punta Eugenia: PB = Punta Baja; SCB = Southern California Bight; MO = Monterey; CM =Cape Mendocino).
The larvae/egg ratio for sardine (figure 2C) shows low values from March to July (Le., less than 1.5 larvae per egg), but the ratio increases to a maximum in November (highest ratio: 2.7). Anchovy eggs and larvae. Both anchovy eggs and larvae are present throughout the year along the whole coast, with a peak from December to April (i.e., 28%-35% for eggs and 48%-65% for larvae; figure 2B). Percentages decline to a minimum of about 10% for eggs in August to October and about 30% for larvae in November. High larvae/egg ratios occur from July to October (highest value in August: 3.4). The ratio declines to less than 2 from November to March. From April to June the ratio again increases above 2 (figure 2C).
Analysis by Areas This section describes latitudinal stratification of the
seasonal patterns for sardine and anchovy eggs and lar- vae. It appears that sardine and anchovy larvae have quite different geographical patterns (figure 3 ) . The highest values of occurrence of sardine larvae were in the Punta
98

HERNANDEZ: SPAWNING PAlTERNS FOR SARDINE AND ANCHOVY CalCOFl Rep., Vol. 35, 1994
40 A I
Jan Feb Mar Apr May Jun Jul Aug Sep Oct Nov Dec
Figure 4 Monthly percentage of positive stations for sardine larvae, by area (PB = Punta Baja, SCB = Southern California Bight, PE = Punta Eugenia)
Eugenia region, whereas for anchovy the highest val- ues were in the Southern California Bight region. The occurrence of sardine eggs from the Southern California Bight to the Punta Eugenia region varied little except for diminishing northward and southward. However, the occurrence of sardine larvae in the Punta Eugenia re- gion was almost twice that in the Punta Baja region and the SCB. Geographical patterns were similar for anchovy eggs and larvae, but larvae had higher percentages by region, except for Cape Mendocino, where the per- centages were similar.
The lowest sardine larvae/egg ratios were in Monterey, with an increase toward the south (figure 3C). The ratio for the CM region is undoubtedly biased because of the low number of stations sampled. The ratios for anchovy increase both to the south and the north from SCB. Sardine eggs and larvae. The seasonal patterns for eggs and larvae were similar for the three regions selected; I present only the data for larvae (figure 4). The Southern California Bight region shows the typical pattern de- scribed in the earlier papers; that is, the spawning season for the sardine begins in February and ends in June-July; some larvae, however, are present throughout the year. The adjacent Punta Baja region has its spawning peak two months earlier (March) than the SCB peak (May-June); there is also a small increase in positive stations during August. The Punta Eugenia region shows high values for all months except May and June. The maximum values of occurrence in the Punta Eugenia region (August-October) are much higher than those observed elsewhere.
The larvae/egg ratios for sardine have low values (with little variation) from February to September in the SCB region, and hghest values during October and November (figure 5). The Punta Baja region has a sharp peak in November and a decline from December to July, when ratios show the lowest values and variability. Punta Eugenia also has a maximum ratio in November, and lower ratios from February to September.
8
+SCB 0 PB A PE
0'-- ' ' I
Jan Feb Mar Apr May Jun Jul Aug Sep Oct Nov Dec
Figure 5. California Bight; PB = Punta Baja; PE = Punta Eugenia).
Monthly larvaeiegg ratio for sardine, by area (SCB = Southern
u)
0 .- - 4 60 +
0) cn
r
40 r n
20
+? +SCB +PB +PE
Jan Feb Mar Apr May Jun Jul Aug Sep Oct Nov Dec
Figure 6. Monthly percentage of positive stations for anchovy larvae, by area (SCB = Southern California Bight; PB = Punta Baja; PE = Punta Eugenia).
Anchovy eggs and larvae. Because anchovy, like sar- dine, have the same seasonal patterns for eggs and lar- vae, again I present only the data for larvae (figure 6). In general, the three regions with maximum abundance of anchovy larvae (SCB, PB, and PE) have a similar seasonal pattern: the principal spawning season extends from December to July, as described by previous re- searchers. The Southern California Bight region shows a high number of positive stations from December to April, with a small decrease from May to July. The low- est values for the SCB region occur during October and November. The spawning seasons for anchovy in PB and PE are shorter than in the SCB (Le., peak occur- rence from December to March), but there were higher occurrences in PE than in PB. A comparison of monthly values of the percentage of positive stations among regions indicates that PB had lower values, while the SCB and PE had similar values.
Seasonally, the larvae/egg ratios for anchovy vary less for the SCB than for PE and PB (figure 7). For the SCB, ratios are lower from December to April, increase slightly from May to September, and decrease once again to November. PB has the lowest ratios from November to March, but there is a sustained increase from April to October. The seasonal pattern found for PE shows some similarity to that for PB, but instead of a sus- tained increase, there is a higher variability.
99

HERNANDEZ: SPAWNING PATTERNS FOR SARDINE AND ANCHOVY CalCOFl Rep., Vol. 35, 1994
, I
Jan Feb Mar Apr May Jun Jul Aug Sep Oct Nov Dec
Monthly larvaeiegg ratios for anchovy, by area (SCB = Southern Figure 7 California Bight, PB = Punta Baja, PE = Punta Eugenia)
Analysis by CalCOFI Lines The geographical analysis by CalCOFI line may be
biased from CalCOFI line 140 (Magdalena Bay) to the south, as well as from line 77 (north of Point Conception) to the north, since fewer than 300 stations were sam- pled per line, whereas from Point Conception to the north of Magdalena Bay, from 800 to 2,200 stations were sampled per line (table 1).
The percentage of positive stations by CalCOFI line for sardine and anchovy eggs and larvae differs consid- erably for the two species (figure 8). The occurrence of sardine eggs is even from just south of Point Conception (line 80) to just north of Magdalena Bay (line 140), except for a sharp peak in the Punta Eugenia region (line
Sardine Eggs
20 0
120). Occurrence is very low to the north of Point Conception and south of Magdalena Bay. Sardine larvae have a similar latitudinal pattern, but from the Magdalena Bay region to the south the percentage of positive stations increases, suggesting an additional important spawning area; this pattern could, however, be due to the low number of stations sampled in this region (not more than 240 stations per line).
Sardine larvae/egg ratios show an increasing trend from north to south, with a sharp increase in the Punta Eugenia area (figure 9). In the northern areas the ratios vary from 0.77 to 1.11 (lines 80 to 97); the ratios ob- served at the northern portion of Baja California (lines 100 to 115) range from 0.84 to 1.6, whereas the values observed at the Punta Eugenia region (lines 117 to 130) vary from 1.36 to 2.52. The highest ratios (3.57 to 23) come from the southern part of the CalCOFI area (south of the Magdalena Bay region); again, the highest values might be biased because of the low number of stations taken in this region.
The percentage of positive stations for anchovy eggs and larvae indicates two areas of increased spawning: the Southern California Bight region and northern Baja California (figure 8). A second, bioader peak occurs in the region from north of Punta Eugenia to north of Magdalena Bay. Between these two spawning areas, in the Punta Baja area, there is a small decrease. Anchovy
Sardine Larvae Anchovy Eggs Anchovy Larvae
1
I
. _ _
! -
60 30 0
Percentage of positive stations Figure 8. Percentage of positive stations for sardine and anchovy eggs and larvae per CalCOFl line.
- 40
- 50
- 60
- 70
- 80
- 90
-100
-110
-120
-130
-140
-150
100
HERNANDEZ: SPAWNING PAllERNS FOR SARDINE AND ANCHOVY CalCOFl Rep., Vol. 35, 1994
Sardine Anchovy
.I 20 10 0
& 20 10 0
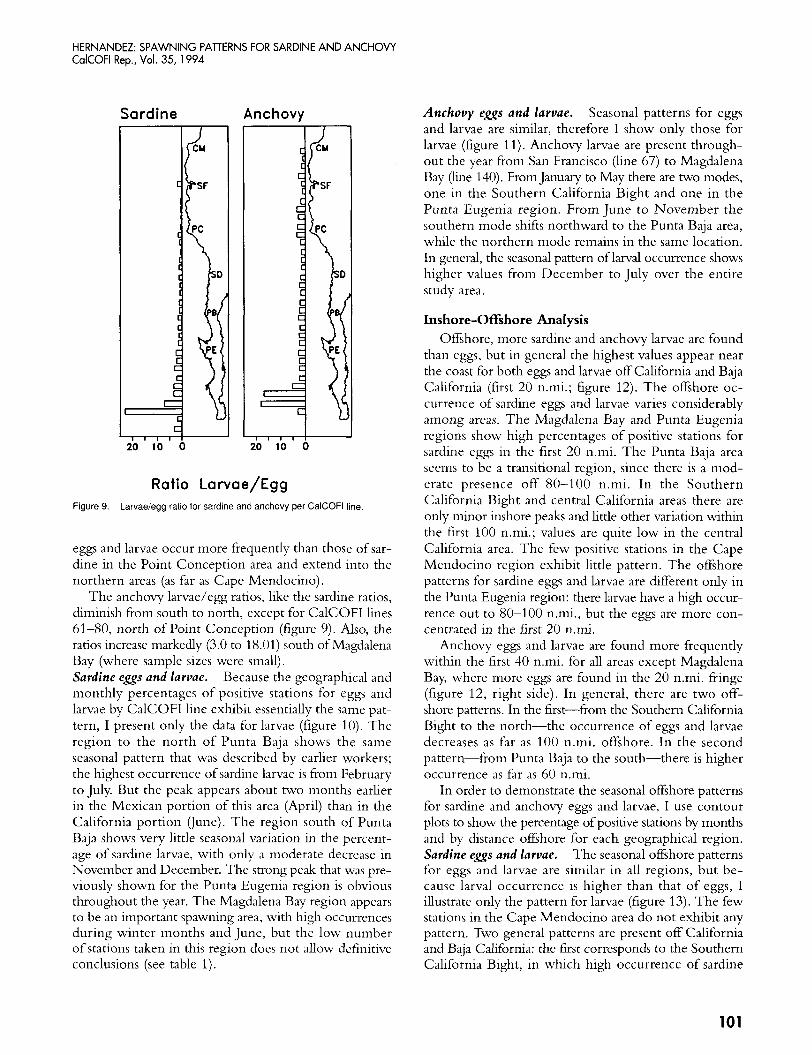
Ratio Larvae/Egg Figure 9. Larvaeiegg ratio for sardine and anchovy per CalCOFl line.
eggs and larvae occur more frequently than those of sar- dine in the Point Conception area and extend into the northern areas (as far as Cape Mendocino).
The anchovy larvae/egg ratios, like the sardine ratios, diminish from south to north, except for CalCOFI lines 61-80, north of Point Conception (figure 9). Also, the ratios increase markedly (3.0 to 18.01) south ofMagdalena Bay (where sample sizes were small). Sardine eggs and larvae. Because the geographical and monthly percentages of positive stations for eggs and larvae by CalCOFI line exhibit essentially the same pat- tern, I present only the data for larvae (figure 10). The region to the north of Punta Baja shows the same seasonal pattern that was described by earlier workers; the highest occurrence of sardine larvae is from February to July. But the peak appears about two months earlier in the Mexican portion of this area (April) than in the California portion (June). The region south of Punta Baja shows very little seasonal variation in the percent- age of sardine larvae, with only a moderate decrease in November and December. The strong peak that was pre- viously shown for the Punta Eugenia region is obvious throughout the year. The Magdalena Bay region appears to be an important spawning area, with high occurrences during winter months and June, but the low number of stations taken in this region does not allow definitive conclusions (see table I).
Anchovy eggs and larvae. Seasonal patterns for eggs and larvae are similar, therefore I show only those for larvae (figure 11). Anchovy larvae are present through- out the year from San Francisco (line 67) to Magdalena Bay @ne 140). From January to May there are two modes, one in the Southern California Bight and one in the Punta Eugenia region. From June to November the southern mode shifts northward to the Punta Baja area, while the northern mode remains in the same location. In general, the seasonal pattern of larval occurrence shows higher values from December to July over the entire study area.
Inshore-Offshore Analysis Offshore, more sardine and anchovy larvae are found
than eggs, but in general the highest values appear near the coast for both eggs and larvae off California and Baja California (first 20 n.mi.; figure 12). The offshore oc- currence of sardine eggs and larvae varies considerably among areas. The Magdalena Bay and Punta Eugenia regions show high percentages of positive stations for sardine eggs in the first 20 n.mi. The Punta Baja area seems to be a transitional region, since there is a mod- erate presence off 80-100 n.mi. In the Southern California Bight and central California areas there are only minor inshore peaks and little other variation within the first 100 n.mi.; values are quite low in the central California area. The few positive stations in the Cape Mendocino region exhibit little pattern. The offshore patterns for sardine eggs and larvae are different only in the Punta Eugenia region: there larvae have a hgh occur- rence out to 80-100 n.mi., but the eggs are more con- centrated in the first 20 n.mi.
Anchovy eggs and larvae are found more frequently within the first 40 n.mi. for all areas except Magdalena Bay, where more eggs are found in the 20 n.mi. fringe (figure 12, right side). In general, there are two off- shore patterns. In the first-from the Southern California Bight to the north-the occurrence of eggs and larvae decreases as far as 100 n.mi. offshore. In the second pattern-from Punta Baja to the south-there is higher occurrence as far as 60 n.mi.
In order to demonstrate the seasonal offshore patterns for sardine and anchovy eggs and larvae, I use contour plots to show the percentage of positive stations by months and by distance offshore for each geographical region. Sardine eggs and larvae. The seasonal offshore patterns for eggs and larvae are similar in all regions, but be- cause larval occurrence is higher than that of eggs, I illustrate only the pattern for larvae (figure 13). The few stations in the Cape Mendocino area do not exhibit any pattern. Two general patterns are present off California and Baja California: the first corresponds to the Southern California Bight, in which high occurrence of sardine
101

HERNANDEZ: SPAWNING PAllERNS FOR SARDINE AND ANCHOVY ColCOFl Rep., Vol. 35, 1994
I
I I
v) a, C -I .- ii 0 Y d
Jan Feb Mar Apr May Jun Jul Aug Sep Oct Nov Dec I
3
I I I 1 Sardine Larvae I
l l l l l l l l l l l l l l l l l l l l l l l l l l l l l l l l l I I I I I l ! l ! L
S B 0 S R O S B O S B 0 S B 0 $ B 0 $ B 0 ~ ~ Percentage of positive stations
Figure IO. Monthly percentage of positive stations for sardine larvae per CalCOFl line.
larvae begins in April and extends until August, with the highest values during May and June. This region also shows a relatively homogenous offshore occurrence dur- ing those months. After August, low percentages (less than 5%) of positive stations extend as far as 90 n.mi. offshore in the SCB. In contrast, the Punta Eugenia area exhibits a high inshore occurrence of sardine larvae from August to February (more than 50%). From March to July moderate occurrence is evident (less than 30%), but the offshore distribution is homogenous as far as 90 n.mi. for this region.
The Punta Baja region seems to be a transitional area between the southern (Punta Eugenia region) and the northern patterns (SCB area), since features of both patterns are present: nearshore occurrence is high- est from July to September, and there is a secondary, smaller, peak in February-March (associated with the northern pattern).
- 7 j r *
I
SD
* No stations sampled
In the Magdalena Bay area the low number of off- shore stations sampled did not allow a comparison with the Punta Eugenia region. In the Monterey area, there are high offshore values during June and July and low inshore values during the winter. Anchovy eggs and larvae. Anchovy larvae are present throughout the year in all areas. Highest concentrations are nearshore from February to March (figure 14). Larvae show, in general, a more oceanic distribution than eggs for each area. In the area from Monterey to Magdalena Bay, high concentrations of anchovy larvae begin in November-December (near the coast) with a rapid increase until February-March. From April to May-June the presence of larvae decreases, reaching the lowest values in September and October. Regarding the in- shore-offshore monthly distribution of larvae, the 50% contour shows higher offshore values from January to April (corresponding to the spawning peak), whereas in
102

HERNANDEZ: SPAWNING PATERNS FOR SARDINE AND ANCHOVY CalCOFl Rep., Vol. 35, 1994
Jan Feb Mar Apr May Jun Jul Aug Sep Oct Nov Decl I 1 * , I I I
Figure 11. Monthly percentage of positive stations for anchovy larvae per CalCOFl line.
September and October the larvae are concentrated nearshore.
For particular regions, some specific features can be observed. There is a homogenous offshore distribution during June and July for the Monterey region. Offshore of Cape Mendocino, a high concentration nucleus at 70 n.mi. is evident during July.
DISCUSSION In order to describe the long-term average geographic
and seasonal distributions for sardine and anchovy eggs and larvae off California and Baja California it is im- portant to briefly discuss several considerations. First, sardine and anchovy live in a highly productive and vari- able habitat. In the California Current they extend over three coastal zoogeographic provinces, an entire coastal upwelling zone, and three oceanic water masses (Moser et al. 1993). The large geographic range where these
* No stations sampled
fishes live places them in regions with different seasonal and geographic patterns of abiotic and biotic parame- ters (SST, productivity, zooplankton biomass, etc.). The different patterns of these parameters along the extended range of sardine and anchovy could be a major factor in determining these fishes' reproductive behavior on a geographical/monthly basis. On the other hand, during the period studied (1951-89), the California Current experienced a series of warm and cold events. Also, nat- ural fluctuations in abundance (on a decadal basis) of these populations, as well as the fisheries on them, could have altered the population structure and hence their reproductive processes.
Sardine Eggs and Larvae The CalCOFI line and subarea analysis clearly demon-
strates that sardine eggs and larvae are most concentrated in the southern portion of the range, fi-om south of Punta
103

HERNANDEZ: SPAWNING PATTERNS FOR SARDINE AND ANCHOVY CalCOFl Rep., Vol. 35, 1994
Sardine Eggs Sardine Larvae
I pB region I I n
100 80 60 40 20 0
Figure 12. Inshore-offshore patterns for sardine and anchovy eggs and larvae by geographic region
Baja, B.C., to north of Magdalena Bay, B.C.S. Eggs and larvae occur over the entire area studied, from San Francisco to Cabo San Lucas, B.C.S., but south of Magdalena Bay and north of Point Conception their val- ues are relatively low. This geographic pattern agrees, in part, with the findings of Ahlstrom (1960) and Kramer and Smith (1971) that the Punta Eugenia region and the Southern California Bight are important spawning cen- ters. M o m et al. (1 993) also show that the Punta Eugenia area has the highest concentration of eggs and larvae.
The slight southward increase in the larvae/egg ratio (increasing southward) observed in analyses by CalCOFI line and subareas could be associated with higher SSTs observed in the south. Also the higher larvae/egg ratio from July to November could be associated with the high
Anchovy Larvae
SST during these months. These patterns can be observed, generally, from Punta Eugenia to southern California. Incubation time is shorter at high SST (Lasker 1965).
The global seasonal analysis, which is very similar to that described in Moser et al. (1993) presents a mis- leading picture of the seasonality of sardine spawning. Both analyses are a composite of the two quite different seasonal patterns in the southern California-northern Baja California region and the central-southern Baja California region. In the northern pattern, spawning takes place from February to July, whereas the southern pattern shows two spawning peaks: a strong one from August to September and a small one in March.
The results presented in this paper have established that sardine eggs and larvae can be observed during any
1 04

HERNANDEZ: SPAWNING PAllERNS FOR SARDINE AND ANCHOVY CalCOFl Rep., Vol. 35, 1994
JAN -
FEB ~
MAR-
APR -
MAY-
JUN-
JUL -
AUG-
SEP -
OCT -
NOV-
DEC -
JAN
FEB
MAR
APR
MAY
$ JUN
JUL
AUG
SEP
OCT
NOV
DEC
v) I
0 I
JAN -
FEE -
MAR-
APR -
MAY-
JUN-
JUL -
AUG-
SEP ~
OCT -
NOV-
DEC-
JAN -
FEB -
MAR-
APR -
MAY-
JUN-
JUL -
AUG-
SEP -
OCT -
NOV-
DEC-
Figure 13.
CAPE MENDOCINO REGION
5
7
3
i , MILES FROM THE COAST
100 90 70 50 30 10
PUNTA BAJA REGION
MONTEREY REGION I
JAN
FEE
MAE
APR
MAY
JUN
JUL
AUG
SEP
OCT
NOV
DEC
100 9'0 7'0 50 30 1'0
PUNTA EUGENIA REGION
~
100 90 70 50 30 10
Monthly percentage of positive stations for sardine larvae by area and offshore.
JAN
FEE
MAR
APR
MAY
JUN
JUL
AUG
SEP
OCT
NOV
DEC
SCB REGIOK
f 5 ' /
- 100 90 70 50 30 10
MAGDALENA BAY REGION
0 (r) 30 -
100 90 7 0 50 30 10
month in at least one place off California and Baja California. The geographical-temporal analysis indicates in which months and areas high or low concentrations are found.
The analyses by CalCOFI line (geographical/seasonal) and subarea suggest that the Punta Baja region is a tran- sition zone between the Punta Eugenia region and the
Southern California Bight, because the Punta Baja seasonal pattern shows higher occurrence of larvae from February to March (as in southern California) and a small peak of spawning in August (the Punta Eugenia pattern).
The results for the geographical offshore analyses agree with those of Moser et al. (1993). High inshore
105

HERNANDEZ: SPAWNING PAllERNS FOR SARDINE AND ANCHOVY
JAN -
FEE -
MAR-
APR -
MAY-
5 JUN-
JUL -
AUG-
SEP -
OCT -
NOV-
cn I
0 I
DEC -
ColCOFl Rep., Vol. 35, 1994
CAPE MENDOCINO REGION
JAN -
FEE -
MAR-
APR -
MAY -
JUN-
JUL 7
SEP -
OCT-
NOV-
DEC-
JAN
FEE
MAR
APR
MAY
JUN
JUL
AUG
SEP
OCT
NOV
DEC
I MILES FROM THE COAST
100 90 70 50 30 10
PUNTA BAJA REGION
100 90 7 0 50 30 10
APR
MAY
JUN
JUL
AUG
SEP -
OCT-
NOV-
DEC,
MONTEREY REGION
100 9 0 70 5’0 30 1’0
PUNTA EUGENIA REGION
I
100 9 0 70 50 30 10
JAN
FEE
MAR
APR
MAY
JUN
JUL
AUG
SEP
OCT
NOV
DEC
JAN
FEE
MAR
APR
MAY
JUN
JUL
AUG
SEP
OCT
NOV
DEC
SCB REGION
100 90 7 0 50 30 10
MAGDALENA BAY REGION
100 90 70 50 30 10
Figure 14. Monthly percentage of positive stations for anchovy larvae by area and offshore
concentrations of sardine eggs and larvae are observed in the southern areas (Punta Baja south), and broader offshore presence of spawning is observed from south- ern California to the north. In the geographical/seasonal offshore analyses the pattern changes seasonally. From March to July, there is a honiogenous presence of eggs and larvae from the coast to 100 n.nii. (from southern
California to the Punta Eugenia region), which could be associated with upwelling processes during those months. From August to February, the offshore occur- rence virtually disappears in the southern California and Punta Baja regions, but not in the Punta Eugenia area.
It can be concluded that the patterns found in the southern areas (Magdalena Bay and Punta Eugenia) are
106

HERNANDEZ: SPAWNING PAllERNS FOR SARDINE AND ANCHOVY CalCOFl Rep., Vol. 35, 1994
different from those found in the northern areas (Punta Baja and the Southern California Bight).
Anchovy Eggs and Larvae The main anchovy spawning center is clearly located
in the Southern California Bight, but there is a secondary center in the Punta Eugenia area. As observed for the sardine, the higher larvae/egg ratio for anchovy from July to October could be associated with higher SSTs during these months, but the geographical effect on the ratios is not clear.
The spawning peak stretches from December to April in the global seasonal analyses, as has been previously de- scribed by several workers. The results of subarea and CalCOFI line analyses suggest no latitudinal differences for anchovy; the same seasonal pattern could be seen from southern California to the Punta Eugenia region.
I t is evident that sardine and anchovy have different geographical and seasonal patterns in spawning. Although the sardine has its main spawning center in the Punta Eugenia region, anchovy are located in the Southern California Bight area. The main spawning season of the anchovy is restricted in time (December to April), whereas that of the sardine differs geographically.
ACKNOWLEDGMENTS I wish to thank the CalCOFI staff, especially Izadore
Barrett, for allowing me to use their data base. I thank Richard H. Parrish for his help and careful reviews and critical comments. I also thank the PFEG-SWFC staff for their hospitality during my stay at the Monterey lab. Principal support for this work was provided by the Centro de Investigaciones Biologicas del Noroeste at La Paz, B.C.S., Mexico. Finally, I also thank Daniel Lluch B. for the guidance and criticism that improved this paper.
LITERATURE CITED Ahlstrorii, E. H. 1954. Distribution and abundance of eggs and larvae pop-
ulations of the Pacific sardine. Fish. Bull. 56:83-140. -. 1960. Synopsis on the biology ofthe Pacific sardine (Sardinops caenrlm).
Proceedings of the World Scientific Meeting on the Biology of Sardines aud Related Species 2:415-451.
. 1966. Distribution and abundance of sardine and anchovy larvae in the California Current region off California and Baja California, 1951-64: a summary. U.S. Fish Wildl. Serv., Spec. Sci. Rep. Fish. 534, 71 pp.
Barnes, J. T., A. D. MacCall, L. D. Jacobson, and P. Wolf. 1992. Recent population trends and abundance estimates for the Pacific sardine (Sardinops saxax). Calif. Coop. Oceanic Fish. Invest. Rep. 33:60-74.
ChavCz, H., S. Silva, and J. S. Sunada. 1977. The fishery for northern an- chovy, Engradis mordax, off California and Baja California in 1975. Calif. Coop. Oceanic Fish. Invest. 1 9:147-165.
Chelton, D. B., P. A. Bernal, and J. A. McGowan. 1982. Large-scale inter- annual physical and biological interaction in the California Current. J. Mar. Res. 40(4):1095-1195.
Clark, F. N. 1934. Matunty of the California sardine (Sardina caerdra), de-
Eber, L. E., and R. P. Hewitt. 1979. Conversion algorithnls for the CalCOFI
Hewitt, R. P. 1988. Historical review of the oceanographic approach to fish-
Janssen, J . F. 1937. First report of sardine taggng in California. Calif. Fish
Krainer, D., and P. E. Smth. 1971. Seasonal and geographic characteristics of fishery resources. California Current region-VII. Pacific sardine. Commer. Fish. Rev. 33(10):7-11.
Lasker, R. 1965. The physiology of Pacific sardine embryos and larvae. Calif Coop. Oceanic Fish. Invest. Rep. 10:96-101.
Lasker, R., and P. E. Smith. 1977. Estimation of the effects of environmental variations on the eggs and larvae of the northern anchovy. Calif Coop. Oceanic Fish. Invest. Rep. 19:128-137.
Lluch-Belda, D., S. Hernindez-Vizquez, and R. A. Schwartzlose. 1991. A hypothetical model for fluctuation of the California sardine population (Savdinops s a p x caerrrlea). In Long-temi variability of pelagic fish popula- tions and their environment, T. Kawasaky et al., eds. Pergamon Press,
Lluch-Belda, D., D. B. Lluch-Cota, S. Hernindez-Vlzquez, and C. A. Shnas- Zavald. 1992. Sardine population expansion in eastern boundary systems of the Pacific Ocean as related to sea surface temperature. In Benguela trophic functioning, A. I. L. Payne, et al., eds. S. Afr. J . Mar. Sci. 12: 147-1 55.
Moser, H. G., R. L. Charter, P. E. Smith, D. A. Ambrose, S. R. Charter, C. A. Myer, E. M. Sandknop, and W. Watson. 1993. Distributional atlas of fish larvae and eggs in the California Current region: taxa with 1000 or more total larvae, 1951 through 1984. Calif. Coop. Oceanic Fish. Invest. Atlas 31, 233 pp.
Pamsh, R. H., A. Bakun, D. M. Hucby, and C. S. Nelson. 1983. Comparative climatology of selected environmental processes in relation to eastern boundary current pelagic fish reproduction. In Proceedings of the Expert Consultation to Examine Changes in Abundance and Species Composition of Neritic Fish Resources, San JosC, Costa Rica, April 1983. G. D. Sharp and J. Csirke, eds. F. A. 0. Fish. Rep. 291(3):731-777.
Parnsh, R. H., Mallicoate, D. L., and K. A. Klingbeil. 1986. Age dependent fecundity, number of spawnings per year, sex ratio, and maturation stages in northern anchovy, Engradis mordax. Fish. Bull. 84(3):503-517.
Scofield, E. C. 1934. Early life history of the California sardine (Sardinops raenrlra), with special reference to distribution of eggs and larvae. Fish.
Sette, 0. E., and E. H. Ahlstrom. 1948. Estimations of abundance of the e g g of the Pacific pilchard (Sardinops caerrrlea) off southern California dur- ing 1940 and 1941. J. Mar. Res. 7(3):511-542.
Tibby, R. B. 1937. The relation between surface water temperature and the distribution of spawn of the California sardine, Sardinops caenrlca. Calif. Fish Game 23(2):132-137.
Walford, L. A,, and K. Moser. 1941. Extension ofpilchard spawning to north Pacific waters indicated. Pac. Fisheniian 39(3):47.
termined by ova diameter measurements. Fish Bull. 42, 49 pp.
station grid. Calif. Coop. Oceanic Fish. Invest. Rep. 20:135-137.
ery research. Calif. Coop. Oceanic Fish. Invest. Rep. 29:27-41.
G ~ I I I ~ 23(3):190-204.
pp. 293-300.
Uull. 41:48 pp.
107