high-amplitude cofluctuations in cortical activity drive
TRANSCRIPT
NEU
ROSC
IEN
CEA
PPLI
EDM
ATH
EMA
TICS
High-amplitude cofluctuations in cortical activity drivefunctional connectivityFarnaz Zamani Esfahlania,1, Youngheun Joa,1 , Joshua Faskowitza,b , Lisa Byrgea , Daniel P. Kennedya,b,c ,Olaf Spornsa,b,c,d, and Richard F. Betzela,b,c,d,2
aDepartment of Psychological and Brain Sciences, Indiana University, Bloomington, IN 47405; bProgram in Neuroscience, Indiana University, Bloomington, IN47405; cCognitive Science Program, Indiana University, Bloomington, IN 47405; and dNetwork Science Institute, Indiana University, Bloomington, IN 47405
Edited by Marcus E. Raichle, Washington University in St. Louis, St. Louis, MO, and approved September 11, 2020 (received for review March 24, 2020)
Resting-state functional connectivity is used throughout neuro-science to study brain organization and to generate biomark-ers of development, disease, and cognition. The processes thatgive rise to correlated activity are, however, poorly understood.Here we decompose resting-state functional connectivity usinga temporal unwrapping procedure to assess the contributionsof moment-to-moment activity cofluctuations to the overall con-nectivity pattern. This approach temporally resolves functionalconnectivity at a timescale of single frames, which enables usto make direct comparisons of cofluctuations of network orga-nization with fluctuations in the blood oxygen level-dependent(BOLD) time series. We show that surprisingly, only a small frac-tion of frames exhibiting the strongest cofluctuation amplitudeare required to explain a significant fraction of variance in theoverall pattern of connection weights as well as the network’smodular structure. These frames coincide with frames of highBOLD activity amplitude, corresponding to activity patterns thatare remarkably consistent across individuals and identify fluc-tuations in default mode and control network activity as theprimary driver of resting-state functional connectivity. Finally,we demonstrate that cofluctuation amplitude synchronizes acrosssubjects during movie watching and that high-amplitude framescarry detailed information about individual subjects (whereaslow-amplitude frames carry little). Our approach reveals fine-scaletemporal structure of resting-state functional connectivity anddiscloses that frame-wise contributions vary across time. Theseobservations illuminate the relation of brain activity to functionalconnectivity and open a number of directions for future research.
functional connectivity | dynamics | time-varying connectivity |naturalistic stimuli
Resting-state functional connectivity (rsFC) refers to the cor-relation structure of functional magnetic resonance imaging
(fMRI) blood oxygen level-dependent (BOLD) activity, usu-ally estimated over the course of an entire scan session (1, 2).Interindividual differences in rsFC have been linked to vari-ation in biological age (3, 4), cognitive state (5), and clinicalstatus (6). Other studies have emphasized the dynamic natureof rsFC, using sliding window techniques to generate tempo-rally blurred estimates of rsFC across time (7–9) and link-ing changes in network architecture to behavior (10, 11) andphenotypes (12, 13).
Despite intense interest and widespread application, the pro-cesses that underpin and shape rsFC are not fully understood.For instance, how do moment-to-moment fluctuations in con-nectivity contribute to the pattern of rsFC estimated overlonger timescales? How are changes in connectivity supportedby instantaneous fluctuations in brain activity?
In principle, these questions can be addressed using sliding-window approaches to track fluctuations in rsFC across time.However, the windowing procedure induces a blurring effect,making it impossible to localize time-varying connectivity in timeand assess the contributions made by individual frames (14). Onthe other hand, methods like coactivation patterns (CAPs) allowfor brain dynamics to be characterized at the resolution of single
frames (15–19). Using these types of methods, previous studieshave shown that coactivity patterns fluctuate across time, with thebrain’s system-level organization expressed only during a selectset of time points (20). However, these approaches generallyrequire the specification of a seed region or a threshold for deter-mining what constitutes high-amplitude activity. Consequently, acomprehensive and mathematically precise explanation for howthese coactivity patterns combine to give rise to rsFC over longertimescales remains elusive (21).
Here we address these questions using a mathematically exactdecomposition of rsFC into its frame-wise contributions, explic-itly linking instantaneous patterns of cofluctuation to rsFC overlonger timescales (22, 23). We find that at rest, cofluctuationsare bursty and occur intermittently as part of whole-brain cofluc-tuation events that are uncorrelated with respiration, cardiaccycle, and in-scanner motion. We then show that rsFC esti-mated using only high-amplitude frames is highly correlatedwith rsFC estimated over the entire scan session, indicating thatrsFC and its system-level organization are driven by cofluctu-ations during relatively few frames. We then show that high-amplitude cofluctuations are underpinned by the activation ofa particular spatial mode of brain activity in which default modeand control networks are anticorrelated with sensorimotor andattentional systems. We then present two careful examinations
Significance
Despite widespread applications, the origins of functionalconnectivity remain elusive. Here we analyze human func-tional neuroimaging data. We decompose resting-state func-tional connectivity across time to assess the contributionsof moment-to-moment activity cofluctuations to the overallconnectivity pattern. We show that functional connectivityis driven by a small number of high-amplitude frames. Weshow that these frames are underpinned by a specific modeof brain activity; that the topography of this mode getsmodulated during in-scanner tasks; and that high-amplitudeframes encode personalized, subject-specific information. Insummary, our parameter-free method provides an exact math-ematical link between functional connectivity and frame-wisecofluctuations, creating opportunities for studying both staticand time-varying functional brain networks.
Author contributions: F.Z.E., Y.J., and R.F.B. designed research; F.Z.E., Y.J., and R.F.B. per-formed research; F.Z.E., Y.J., J.F., L.B., D.P.K., and O.S. contributed new reagents/analytictools; F.Z.E., Y.J., and R.F.B. analyzed data; and F.Z.E., Y.J., J.F., L.B., D.P.K., O.S., and R.F.B.wrote the paper.y
The authors declare no competing interest.y
This article is a PNAS Direct Submission.y
This open access article is distributed under Creative Commons Attribution-NonCommercial-NoDerivatives License 4.0 (CC BY-NC-ND).y1F.Z.E. and Y.J. contributed equally to this work.y2 To whom correspondence may be addressed. Email: [email protected]
This article contains supporting information online at https://www.pnas.org/lookup/suppl/doi:10.1073/pnas.2005531117/-/DCSupplemental.y
First published October 22, 2020.
www.pnas.org/cgi/doi/10.1073/pnas.2005531117 PNAS | November 10, 2020 | vol. 117 | no. 45 | 28393–28401
Dow
nloa
ded
by g
uest
on
Janu
ary
22, 2
022
of high-amplitude cofluctuations. First, we demonstrate thattime series of cofluctuation amplitude synchronize across sub-jects during movie watching, and second, we show that subjects’“fingerprints” are enhanced during high-amplitude frames com-pared to low-amplitude frames.
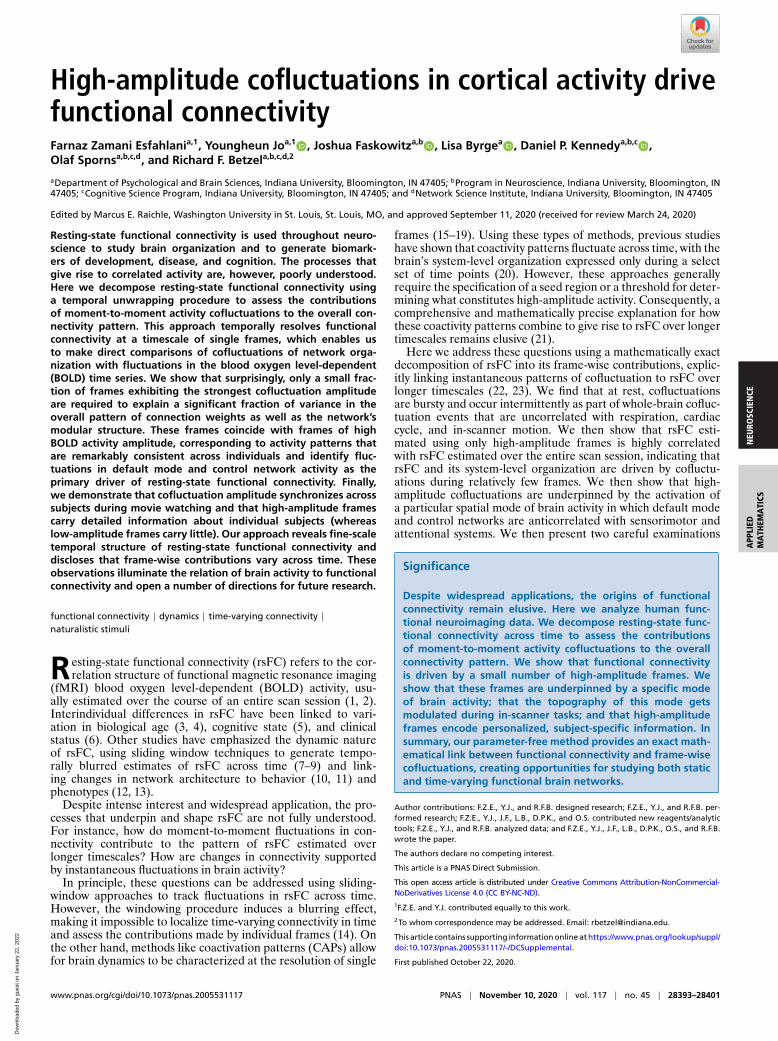
ResultsThe strength of rsFC between two brain regions can be quanti-fied as the Pearson correlation of their fMRI BOLD time series,which is calculated (after z-scoring) as the mean value of theirelement-wise product (24). By omitting the averaging step, wecan temporally unwrap the correlation measure, which resultsin a new set of time series—one for every pair of brain regions(network edges)—whose elements represent the magnitude ofcofluctuation between those regions resolved at every momentin time (Fig. 1A). These edge time series can be analyzed directlyto pinpoint both the magnitude and timing of cofluctuationsbetween pairs of brain regions.
In rsFC Is Driven by Short-Lived and High-Amplitude Cofluctu-ation Events and in High-Amplitude Frames Are Driven by Fluc-tuations of Task-Positive/Task-Negative Mode of Brain Activity,we analyze cofluctuation time series constructed from functionalimaging data acquired as part of the Human ConnnectomeProject (25, 26) (see Materials and Methods for details). Allresults reported in those sections generated using these data; wereplicate these findings using a second dataset (27), with resultsreported in SI Appendix. In Intersubject Synchrony of Whole-Brain Cofluctuation Amplitude during Passive Movie Watchingand in High-Amplitude Cofluctuations Enhance Identifiability, weanalyze an independently acquired movie-watching dataset (28,29) and data from the Midnight Scan Club (MSC) (27, 30),respectively.
rsFC Is Driven by Short-Lived and High-Amplitude CofluctuationEvents. While past studies have used sliding window methods togenerate estimates of moment-to-moment fluctuations in rsFC(8, 9), the use of a windowing procedure results in a temporallyblurred estimate of rsFC. This restricts the timescale of obser-vations regarding dynamic changes in functional connectivity tothe width of the time window, generally on the order of dozens offrames (approximately 1 min of real time, although we note thatrecently, several groups have explored methods for estimatingtime-varying FC at a frame-wise timescale, e.g., refs. 31 and 32).Here we address this limitation using cofluctuation times series.
When analyzed across the whole brain, we find that edge timeseries exhibit bursty behavior, such that the amplitude of cofluc-tuations (quantified by computing the root sum square [RSS])moves around a mean value but is punctuated by brief, intermit-tent, and disproportionately large fluctuations (Fig. 1B). Thesehigh-amplitude frames are not directly related to cardiac and res-piratory cycles, in-scanner head motion (SI Appendix, Fig. S1),and spectral properties of fMRI BOLD time series (SI Appendix,Fig. S2) and appear aperiodic with heavy-tailed distributions ofsize, duration, and intervals (SI Appendix, Fig. S3).
To better understand how instantaneous cofluctuations con-tribute to whole-brain rsFC, we isolated high-amplitude framesand compared them with low-amplitude episodes (top and bot-tom 5% in terms of cofluctuation amplitude; 60 frames for HCP;see SI Appendix, Fig. S4, for comparisons at other percentiles).We then estimated rsFC separately for each category, using onlyfMRI BOLD data corresponding to those time points, and com-pared the resulting networks. First, we found that connectionweights were significantly stronger during high-amplitude framesthan low-amplitude (within-sample t test, p< 10−15; Fig. 1C).Next, we calculated the similarity of rsFC estimated during high-
Edg
es
Time-averaged
-0.85
+0.85
FC
(co
rrel
atio
n)
Regions
Region
s
Regions
Region
s Regions
Region
s
Top 5% RSS FC Bottom 5% RSS FC
A
C
Top
Botto
m
Cor
rela
tion
with
time-
aver
aged
rsF
C
D
Top
Botto
m
Mod
ular
ity (
dete
cted
), q
*E
Vectorize
0
100
200
300
RS
S
BHigh
amp.
95%
5%
0 100 200 300 400 500 600 700
0.4
0.6
0.8
0.4
0.5
0.6
0.7
High
amp. High
amp. High
amp.
Time (seconds)
Fig. 1. Cofluctuation time series reveal bursty structure of resting-state functional connectivity. (A) We use a temporal unwrapping of the Pearson cor-relation to generate cofluctuation time series for every pair of brain regions (edges). The elements of the cofluctuation time series are the element-wiseproducts of z-scored regional BOLD time series that, when averaged across time, yield vectors that are exactly equal to the Pearson correlation coefficientand can be rearranged to create a resting-state functional connectivity matrix. (B) We find that the cofluctuation time series contains moments in timewhere many edges collectively cofluctuate. We can identify these moments by calculating the RSS across all cofluctuation time series and plotting this valueas a function of time. In B we label high- and low-amplitude frames. The distribution of edge cofluctuation amplitude is heavy tailed. We wanted to assessthe contribution of high- and low-amplitude frames to the overall pattern of functional connectivity. To do this, we extracted the top and bottom 5% of alltime points (ordered by cofluctuation amplitude) and estimated functional connectivity from those points alone. (C) Average functional connectivity across100 subjects using top 5% (Left) and bottom 5% (Right). (D) In general, the networks estimated using the top 5% of time points were much more similar totraditional functional connectivity than those estimated using the bottom 5% of time points. (E) We performed a similar comparison of network modularityusing networks reconstructed using top and bottom 5% frames.
28394 | www.pnas.org/cgi/doi/10.1073/pnas.2005531117 Zamani Esfahlani et al.
Dow
nloa
ded
by g
uest
on
Janu
ary
22, 2
022

NEU
ROSC
IEN
CEA
PPLI
EDM
ATH
EMA
TICS
and low-amplitude episodes with respect to time-averaged rsFCestimated using the full time series. We found that the high-amplitude networks were highly correlated with rsFC (r =0.81±0.05) while the low-amplitude networks were much less correlated(r =0.54± 0.07) and that these differences were highly signifi-cant (t test, p< 10−15; Fig. 1D). We also performed an analogouscomparison of network modularity (33), an index that can beinterpreted as a measure of how segregated a network’s systemsare from one another. As before, we found that modularity wasgreater in the high-amplitude networks (q =0.51± 0.06) com-pared to the networks estimated from low-amplitude frames (q =0.37± 0.05) (t test, p< 10−15; Fig. 1E).
In SI Appendix we show similar results in a second dataset (SIAppendix, Fig. S5). We also demonstrate that these effects persistwith highly conservative motion censoring (SI Appendix, Fig. S6),when using an alternative strategy for estimating networks fromthe top and bottom 5% time points (SI Appendix, Fig. S7), andwhen comparing against a null model that preserves the tempo-ral structure of cofluctuation amplitude while sampling framesrandomly from the entire time series (SI Appendix, Fig. S8).
Collectively, these results suggest that rsFC, estimated overlong timescales, is driven by a small number of brief, intermit-tent, and high-amplitude cofluctuations. The network structureover these points in time contributes disproportionately to theoverall modularity and system-level organization of cerebralcortex, as estimated from long-time averages of rsFC. In con-trast, low-amplitude cofluctuations are only weakly related tothe overall pattern of rsFC and correspond to less modulararchitectures.
High-Amplitude Frames Are Driven by Fluctuations of Task-Positive/Task-Negative Mode of Brain Activity. In the previous sec-tion we demonstrated that time-averaged rsFC can be explainedby high-amplitude cofluctuations that occur during a relativelysmall number of frames. It remains unclear, however, whetherhigh-amplitude frames are underpinned by a specific pattern of
brain activity or whether they reflect contributions from multi-ple distinct patterns. Here we address this question directly, byinvestigating the patterns of brain activity that occur at the sametime as high-amplitude frames.
As a first point of comparison, we calculated the RSS of boththe cofluctuation time series as well as the z-scored fMRI BOLDtime series. We found that across subjects, these time serieswere highly correlated (r =0.97), indicating that high-amplitudeframes have an almost one-to-one correspondence with high-amplitude BOLD fluctuations (Fig. 2A). This relationship isexpected; because cofluctuations are calculated as products ofz-scored regional activity, their amplitudes will necessarily becorrelated with one another.
Given that fluctuations in BOLD activity are greater duringhigh-amplitude frames compared to low-amplitude frames, weasked whether they formed a consistent and recognizable pat-tern of activity. To address this question, we calculated the meanactivity pattern for each subject during high- and low-amplitudeframes and computed between-subject and between-scan simi-larity (Fig. 2B). In general, activity during high-amplitude frameswas more correlated across subjects compared to the activity pat-terns during low-amplitude frames (t test, p< 10−15). To betterunderstand what was driving these correlations, we performeda principal components analysis of the activity patterns duringhigh- and low-amplitude frames, aggregated over all subjects andscans. We focused on the first principal component (PC1), whichexplained 26% of total variance. The coefficients for PC1 were,on average, much greater for high-amplitude frames comparedto low-amplitude (t test, p< 10−15; Fig. 2C), indicating that PC1was descriptive of activity patterns during high-amplitude framesbut less so for low-amplitude frames. We then mapped compo-nent scores for PC1 onto the cortical surface and found that PC1corresponded to a mode of activity that delineates regions indefault mode and control networks from sensorimotor and atten-tional networks (Fig. 2 D and E). We replicated these results ina second dataset (SI Appendix, Fig. S9).
RSS (BOLD activity)
0 10 200
500
1000
r = 0.93
RS
S (
co-f
luct
uatio
n)
Top
5%
Bot
tom
5%
Top 5% Bottom 5%
-0.5
+0.5
Cor
rela
tion
A B
-6.0
+6.0
PC
1 S
core
D
PC
1 S
core
Con
taC
ontb
Con
tcD
MN
aD
MN
bD
MN
cD
AN
aD
AN
bLi
m.
Sal
/VA
Na
Sal
/VA
Nb
SM
Na
SM
Nb
TP
Vis
cV
isp
E Top 5
% (R
SS)
Botto
m 5
% (R
SS)PC
1 co
effic
ient
s (a
bsol
ute
valu
e)C
-4
-2
0
2
4
6
0
0.05
0.1
* * * * * * * * * *
Fig. 2. Relationship of network cofluctuations with BOLD fluctuations. In rsFC Is Driven by Short-Lived and High-Amplitude Cofluctuation Events wedemonstrated that resting-state functional connectivity could be explained on the basis of relatively few frames during which high-amplitude cofluctuationsoccurred. Here we relate those cofluctuation frames to BOLD activity fluctuations. We first calculate the RSS amplitude of BOLD activity at each time pointand compare that to the amplitude of cofluctuations. (A) Pooling data from across subjects, we find that these two variables are highly correlated. (B)To investigate this relationship further, we extract mean activity patterns for each subject and for each scan during the top and bottom 5% time points,indexed according to cofluctuation amplitude. Here we show the correlation matrix of those activity vectors. (C) We then performed a principal componentanalysis of this correlation matrix and found that absolute value of coefficients for the first component (PC1) were greater for the top 5% than the bottom5%, and (D and E) the PC1 score corresponded to activity patterns that emphasized correlated fluctuations of default mode and control networks that wereweakly or anticorrelated with fluctuations elsewhere in the brain. Asterisks indicate systems whose mean PC1 score was significantly greater (more positiveor negative) than expected by chance (permutation test; FDR fixed at 5%; padjusted = 0.018). These observations suggest that high-amplitude cofluctuations,which drive resting-state functional connectivity, are underpinned by instantaneous activation and deactivation of default mode and control network areas.
Zamani Esfahlani et al. PNAS | November 10, 2020 | vol. 117 | no. 45 | 28395
Dow
nloa
ded
by g
uest
on
Janu
ary
22, 2
022

These results suggest that underlying high-amplitude framesis a mode of brain activity whose spatial pattern resembles thetraditional task-positive/task-negative division of the brain (34).This pattern of activity is similar across individuals, suggesting aconserved mechanism by which rsFC emerges from brain activity.These observations suggest a fundamental link between distinctpatterns of brain activity and connectivity while further clarifyingthe origins of high-amplitude frames.
Intersubject Synchrony of Whole-Brain Cofluctuation Amplitude dur-ing Passive Movie Watching. In the previous sections we showedthat rsFC can be viewed as an average of time-varying cofluctua-tions. We also showed that time-averaged rsFC is disproportion-ately impacted by high-amplitude frames that are, themselves,underpinned by a specific mode of brain activity and were notclearly related to motion or physiological artifacts. What, then, isthe purpose of high-amplitude frames? Are they random cofluc-tuations, or are they related to fluctuations in an individual’sbrain/cognitive state? To address these questions, we exploredthe cofluctuation time series for a cohort of 29 subjects thatwere scanned multiple times at rest and while passively viewingcomplex, naturalistic stimuli (movies) (28).
Specifically, we computed edge time series for all subjects andscans for both conditions. From these edge time series, we esti-mated the cofluctuation amplitude across all node pairs. For agiven scan, this procedure results in 29 time series (1 per sub-ject) of identical length. We found that cofluctuation time serieswere correlated across subjects during movie watching (Fig. 3 Aand B) but uncorrelated during rest (Fig. 3 C and D). We directlycompared the distributions of intersubject correlations betweenconditions (all scans from the same condition pooled together),discovering that as expected, the mean intersubject correlation
was greater during movie watching than at rest (permutation test,p< 0.05; Fig. 3E). Importantly, we found no difference betweenconditions for the overall amplitude of RSS values (permutationtest, p=0.07; Fig. 3F).
Next, we explored differences between movie watching and restin terms of brain activity patterns during high- and low-amplitudeframes. Our exploration consisted of two analyses. First, and as inthe previous section, we extracted activity patterns during high-and low-amplitude frames (top and bottom 5% by cofluctuationamplitude) separately for the movie-watching and resting condi-tions. We then performed principal component analysis (PCA) onthese matrices and retained the top PC score for each condition.Interestingly, these PC scores exhibited distinct topography; themovie-watching PC (Fig. 3G) emphasized activity in visual anddorsal attention networks, whereas the resting PC (Fig. 3H) reca-pitulated the pattern shown in the previous section, emphasizing atask-positive/task-negative mode of activity. To directly comparethese two patterns, we computed their element-wise (region-wise)difference and grouped these differences by system (Fig. 3 I andJ). As expected, we found statistically significant differences in thedorsal attention and visual systems (movie > rest; false discov-ery rate fixed at q =0.05) and salience/ventral attention system(movie< rest). These differences are further evident when we plotthe PCs against one another, revealing that these systems deviatefrom the identity line (Fig. 3K).
We note that another strategy for comparing movie-watchingand resting-state conditions is to analyze them simultaneously byconcatenating high-amplitude activity patterns from both condi-tions into a single matrix and jointly decomposing that matrixusing PCA. This procedure results in modes of activity that areshared across both conditions. Here we retain both the firstand second PCs (SI Appendix, Fig. S10 A and C), whose spatial
Movie
Rest
Intersubject correlation
50
175
SS
R
50
175
SS
R
A E
0 1 2 30
5
-0.5 0 0.50
2
4
Log10 RSS amplitude
-0.4
+0.4
ISC
-0.4
+0.4
ISC
Time (seconds)
Time (seconds)
Sub
ject
sS
ubje
cts
Sub
ject
sS
ubje
cts
Subjects
Subjects
Movie
Rest
B
C D F
ytisneD
ytisneD
RestMovie
RestMovie
*
-17
+17
erocs1
CP
-17
+17
erocs1
CP
G
H
rest
movie
-23
+23
Mov
ie -
res
t
I
-100
1020
Cont.
DMNDAN
Lim.
SalVAN
SMN Vis.
Mov
ie -
res
t
*J
-10 0 10
-10
0
10
PC1 score (movie)
PC
1 sc
ore
(res
t)
K
SalVAN
DAN
Vis.
1 770
1 971
Fig. 3. Whole-brain cofluctuation amplitude synchronizes during passive movie watching. We compared cofluctuation time series during resting state andmovie watching. For both conditions, we computed cofluctuation time series for 29 subjects. We show those time series in A (movie) and C (rest). We findthat when subjects watch movies, their cofluctuation time series are synchronous, presumably due to the shared audiovisual stimulus. At rest, cofluctuationtime series are asynchronous. We demonstrate this synchrony by computing the intersubject correlation matrix of subjects’ cofluctuation time series. Weshow matrices for movie watching and rest in B and D, respectively. By comparing the elements of these matrices, we demonstrate statistically that moviewatching leads to increased intersubject correlations. We show the distributions in E. We find, however, that the overall amplitude of fluctuations (RSS) is notstatistically different from one condition to the other (F). To further contrast these two conditions, we repeated the analysis from High-Amplitude FramesAre Driven by Fluctuations of Task-Positive/Task-Negative Mode of Brain Activity to identify modes of brain activity that underpin high-amplitude frames.We find that the resting mode recapitulates the topographic distribution reported in the previous section (H), emphasizing a task-positive/task-negativedivision. During movie watching, however, the mode of activity emphasizes contributions of visual and dorsal attention networks (G). In I–K, we comparerest and movie-watching modes of activity more directly. I depicts the region-wise differences in modes, J groups those differences by system, and K presentsthem as a scatterplot, highlighting differences associated with visual, dorsal attention, and salience/ventral attention networks.
28396 | www.pnas.org/cgi/doi/10.1073/pnas.2005531117 Zamani Esfahlani et al.
Dow
nloa
ded
by g
uest
on
Janu
ary
22, 2
022
NEU
ROSC
IEN
CEA
PPLI
EDM
ATH
EMA
TICS
topography is similar to what we show in Fig. 3 G and H. Asexpected, we find differences between the two maps in termsof their PC coefficients, with movie-watching frames loadingmore strongly onto the first map (permutation test, p< 0.05; SIAppendix, Fig. S10B) and resting frames loading more stronglyonto the second (permutation test, p< 0.05; SI Appendix,Fig. S10D).
Viewed collectively, these results complement our previousfindings that cofluctuation time series are not clearly related tomotion or physiological artifacts. Importantly, we demonstratethat subjects’ cofluctuation time series synchronize when jointlypresented with complex, time-varying, and naturalistic stimuli.This observation, combined with the topographic differencesbetween movie-watching and resting-state activity during high-amplitude frames, strongly suggests that cofluctuation amplitudeis at least in part modulated by subjects’ cognitive states.
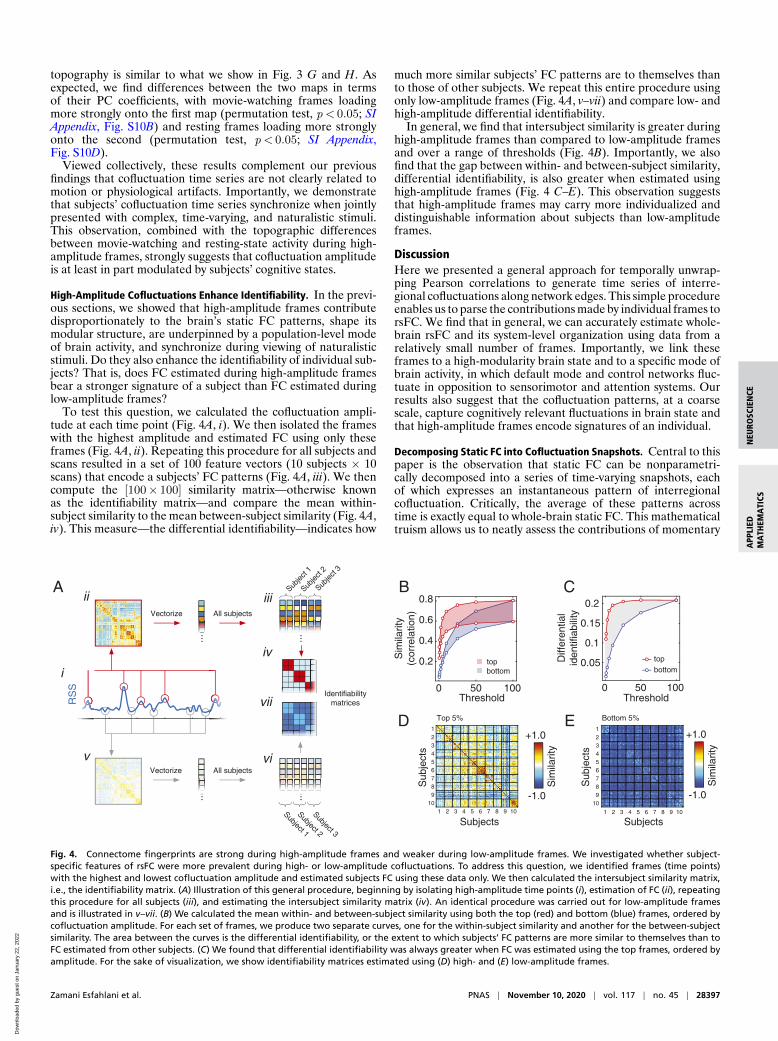
High-Amplitude Cofluctuations Enhance Identifiability. In the previ-ous sections, we showed that high-amplitude frames contributedisproportionately to the brain’s static FC patterns, shape itsmodular structure, are underpinned by a population-level modeof brain activity, and synchronize during viewing of naturalisticstimuli. Do they also enhance the identifiability of individual sub-jects? That is, does FC estimated during high-amplitude framesbear a stronger signature of a subject than FC estimated duringlow-amplitude frames?
To test this question, we calculated the cofluctuation ampli-tude at each time point (Fig. 4A, i). We then isolated the frameswith the highest amplitude and estimated FC using only theseframes (Fig. 4A, ii). Repeating this procedure for all subjects andscans resulted in a set of 100 feature vectors (10 subjects × 10scans) that encode a subjects’ FC patterns (Fig. 4A, iii). We thencompute the [100× 100] similarity matrix—otherwise knownas the identifiability matrix—and compare the mean within-subject similarity to the mean between-subject similarity (Fig. 4A,iv). This measure—the differential identifiability—indicates how
much more similar subjects’ FC patterns are to themselves thanto those of other subjects. We repeat this entire procedure usingonly low-amplitude frames (Fig. 4A, v–vii) and compare low- andhigh-amplitude differential identifiability.
In general, we find that intersubject similarity is greater duringhigh-amplitude frames than compared to low-amplitude framesand over a range of thresholds (Fig. 4B). Importantly, we alsofind that the gap between within- and between-subject similarity,differential identifiability, is also greater when estimated usinghigh-amplitude frames (Fig. 4 C–E). This observation suggeststhat high-amplitude frames may carry more individualized anddistinguishable information about subjects than low-amplitudeframes.
DiscussionHere we presented a general approach for temporally unwrap-ping Pearson correlations to generate time series of interre-gional cofluctuations along network edges. This simple procedureenables us to parse the contributions made by individual frames torsFC. We find that in general, we can accurately estimate whole-brain rsFC and its system-level organization using data from arelatively small number of frames. Importantly, we link theseframes to a high-modularity brain state and to a specific mode ofbrain activity, in which default mode and control networks fluc-tuate in opposition to sensorimotor and attention systems. Ourresults also suggest that the cofluctuation patterns, at a coarsescale, capture cognitively relevant fluctuations in brain state andthat high-amplitude frames encode signatures of an individual.
Decomposing Static FC into Cofluctuation Snapshots. Central to thispaper is the observation that static FC can be nonparametri-cally decomposed into a series of time-varying snapshots, eachof which expresses an instantaneous pattern of interregionalcofluctuation. Critically, the average of these patterns acrosstime is exactly equal to whole-brain static FC. This mathematicaltruism allows us to neatly assess the contributions of momentary
Vectorize
... ...
RS
S
... ...
Vectorize
Subjec
t 1
Subjec
t 2
Subjec
t 3
Subject 1
Subject 2
Subject 3
All subjects
All subjects
A
i
ii iii
iv
v vi
viiIdentifiability
matrices
B
0 50 100
0.2
0.4
0.6
0.8
Threshold
Sim
ilarit
y(c
orre
latio
n)
0 50 100
0.1
0.2
Threshold
Diff
eren
tial
iden
tifia
bilit
y
C
Sub
ject
s
Subjects
123456789
101 2 3 4 5 6 7 8 9 10
-1.0
+1.0
Sim
ilarit
y
D
Sub
ject
s
Subjects
123456789
10
1 2 3 4 5 6 7 8 9 10
-1.0
+1.0
Sim
ilarit
yETop 5% Bottom 5%
. .
topbottom
topbottom
0.05
0.15
Fig. 4. Connectome fingerprints are strong during high-amplitude frames and weaker during low-amplitude frames. We investigated whether subject-specific features of rsFC were more prevalent during high- or low-amplitude cofluctuations. To address this question, we identified frames (time points)with the highest and lowest cofluctuation amplitude and estimated subjects FC using these data only. We then calculated the intersubject similarity matrix,i.e., the identifiability matrix. (A) Illustration of this general procedure, beginning by isolating high-amplitude time points (i), estimation of FC (ii), repeatingthis procedure for all subjects (iii), and estimating the intersubject similarity matrix (iv). An identical procedure was carried out for low-amplitude framesand is illustrated in v–vii. (B) We calculated the mean within- and between-subject similarity using both the top (red) and bottom (blue) frames, ordered bycofluctuation amplitude. For each set of frames, we produce two separate curves, one for the within-subject similarity and another for the between-subjectsimilarity. The area between the curves is the differential identifiability, or the extent to which subjects’ FC patterns are more similar to themselves than toFC estimated from other subjects. (C) We found that differential identifiability was always greater when FC was estimated using the top frames, ordered byamplitude. For the sake of visualization, we show identifiability matrices estimated using (D) high- and (E) low-amplitude frames.
Zamani Esfahlani et al. PNAS | November 10, 2020 | vol. 117 | no. 45 | 28397
Dow
nloa
ded
by g
uest
on
Janu
ary
22, 2
022
cofluctuations to the overall FC pattern and to establish a clearlink between FC and fluctuations in brain activity.
Our findings, which complement previous work (15–18, 20,32), leverage a mathematically exact decomposition of FC intoits frame-wise contributions to suggest that static FC is drivenby contributions from relatively few time points, namely, thosewith the highest levels of cofluctuation amplitude. Frames withlow levels of cofluctuation, on the other hand, contribute lit-tle. Because the cofluctuation time series are estimated at atemporal resolution of single frames, we directly compared high-amplitude frames with coincident patterns of brain activity. Weestablished that at rest, high-amplitude cofluctuations occur intandem with a specific mode of brain activity that emphasizesoppositional activation of sensorimotor and association cortex.Notably, similar patterns of activity have been reported in otherstate-based analyses of brain dynamics (39, 40), linking this pat-tern of activity to mentation during wakeful rest and workingmemory performance.
The observations reported here both clarify and challenge coreassumptions concerning static FC and brain network dynamics(41). Specifically, our findings suggest that whole-brain FC fol-lows a bursty trajectory through a high-dimensional state space,with extended periods of quietude punctuated by brief and inter-mittent events, whose timing is not clearly related to motionor physiological artifacts (42). This observation leads to severalquestions, the most important of which concerns the origins ofhigh-amplitude frames. Are they spontaneous occurrences? Arethey relevant, in any way, to ongoing cognitive processes? Howindividualized are high-amplitude frames?
Linking High-Amplitude Cofluctuations to Cognition and Individ-ual Differences. We performed two separate analyses in orderto help clarify the origins of high-amplitude frames. First, weperformed a comparison of their structure at rest and dur-ing movie watching (28). While the amplitude of cofluctuationswas not statistically different between conditions, we foundthat cofluctuations were correlated during movie watching, sug-gesting that high-amplitude frames may be driven by audiovi-sual features in movies. This finding supports the hypothesisthat the timing of high-amplitude frames is linked to percep-tion and processing of sensory information and further sug-gests that high-amplitude frames are not simply spontaneousoccurrences. These observations open up possibilities for futurestudies that leverage the temporal structure of cofluctuationamplitudes to track changes in an individual’s cognitive stateacross time.
Importantly, we also discover differences in the mode of brainactivity underpinning high-amplitude cofluctuations in moviewatching compared to rest. In particular, we found strongerexpression of visual and dorsal attention networks, brain systemsthat one might hypothesize to play an important role in pro-cessing visual information and redirecting attentional resourceswhile viewing complex naturalistic stimuli (43, 44). This findingalso demonstrates that although high-amplitude cofluctuationscan occur spontaneously in correlated, modular systems, theircharacter and timing are modulated by time-varying sensoryinput, presenting an opportunity for future studies to compre-hensively map the task-evoked topography of high-amplitudecofluctuations (45).
In our second analysis, we asked whether high-amplitudecofluctuations were personalized and idiosyncratic (27, 46, 47).To address this question, we estimated subjects’ FC separatelyusing high- and low-amplitude frames and compared these net-works in terms of their differential identifiability—the extentto which the similarity of FC patterns was stronger within sub-jects than between (48). Surprisingly, we found that identifiabilitywas significantly stronger during high-amplitude cofluctuations,suggesting that subject-specific information is expressed morestrongly during those frames.
Collectively, these findings suggest that the structure of high-amplitude cofluctuations is highly organized. It tracks time-varying fluctuations in cognitive state and is deeply personalized.These are key observations with clear implications for the studyof brain–behavior associations, clinical neuroscience, and pheno-type discovery, where the ability to make inferences is limited bythe amount of data available. Our results suggest that by capital-izing on the fact that high-amplitude cofluctuations carry moresubject-specific information than low-amplitude cofluctuations,it may be possible to generate robust network-level biomark-ers using a relatively small number of frames and reducing theamount of required data (49) [we note this concept is beingexplored with other imaging modalities (50)]. This approach maybe especially useful in clinical and developmental neuroscience,which study populations with characteristics that generally pro-hibit the extended scan durations necessary for stably estimatingFC (51). For instance, because high-amplitude cofluctuationscarry more information about static FC than low-amplitudecofluctuations and because they encode identifiable features ofsubjects, implementing experimental paradigms that elicit largecofluctuations at greater frequency may obviate the need forlong scan sessions and large quantities of data and yield superiorestimates of FC.
System-Level Organization Emergences from the Structure of High-Amplitude Cofluctuations. Last, our findings hint at a crucial linkbetween instantaneous fluctuations in activity and the orga-nization of rsFC (31, 52). Many studies have found that thecommunity structure of rsFC resembles known coactivation pat-terns, including task-evoked activity (53, 54). Here we proposeda strategy that enabled us to tease apart the precise contributionof instantaneous BOLD fluctuations (and their topography) torsFC.
We demonstrated that a particular pattern of activity involv-ing default mode and control regions is primarily responsible fordriving high-amplitude frames and, in turn, whole-brain rsFC.While this mode made the greatest contribution, it is likely thatother modes make nontrivial contributions as well. By extendingthe definition to include lower-amplitude fluctuations, we expectto find patterns of activity that correspond to other, well-knownbrain systems (16). Moreover, we speculate that these patternslikely recombine in different proportions as a function of taskcomplexity and domain (53, 55) and across individuals (47).
We note that other studies have shown, using a wide rangeof approaches, that time-varying and static rsFC are related toone another and that this relationship depends, to a large extent,on high-amplitude network states. For instance, ref. 18 identi-fied time points of high-amplitude activity using sliding-windowmethods and seed-based analyses to show that activity coincideswith increased correlation (rsFC). Indeed, comparable resultshave been reported using similar methods (15, 17, 20, 36, 38,42, 56–58). The principal finding of these studies is that high-amplitude activity is somehow related to stronger FC or theexpression of particular brain systems.
While illuminating, these papers have some limitations.Notably, they describe relationships between FC and high-amplitude states but lack a mathematical mechanism for whythis relationship exists. In other cases, the observations requireuser-defined parameters to determine what constitutes high-amplitude activity, to specify a seed voxel or region for com-puting FC, or the width of a sliding window. In contrast, ourapproach addresses these limitations directly. Our first find-ing is in agreement with the above-referenced papers but isprecipitated from a mathematically precise decomposition ofstatic FC into its exact frame-wise contributions. With thisdecomposition, we can determine how individual time pointscombine to give rise to patterns of time-averaged, static FC.This recombination requires no additional parameterization andno sliding window and is naturally compared for all pairwise
28398 | www.pnas.org/cgi/doi/10.1073/pnas.2005531117 Zamani Esfahlani et al.
Dow
nloa
ded
by g
uest
on
Janu
ary
22, 2
022
NEU
ROSC
IEN
CEA
PPLI
EDM
ATH
EMA
TICS
connections (not just seeds). In summary, the framework wepresent here serves to unify these previous observations by pro-viding a mathematical framework to explicitly link instantaneouspatterns of cofluctuation to static FC.
In future work, the proportion of variance explained by dif-ferent patterns and other statistics related to high-amplitudeframes, including the frequency with which they occur, mayserve as potent correlates of cognitive and disease state. Becausehigh-amplitude frames appear to drive the overall configurationof rsFC, we further speculate that their statistics may serve asimportant complements to traditional measures of rsFC.
Future Work. The approach developed here presents severalexciting opportunities for future studies. These include investi-gating time-varying FC using cofluctuation patterns, which pro-vide frame-wise estimates of network structure and circumventlimitations of sliding window approaches (7, 14, 59). Other possi-bilities include mapping the relationship of structural connectiv-ity to regional fluctuations or interregional cofluctuations duringhigh- and low-amplitude frames (60) and studying individual dif-ferences in cognitive, development, and disease state based onfeatures extracted from high-amplitude frames, which we showprovide more reliable estimates of subject-level networks.
A remaining open question concerns the neurobiology thatshapes high-amplitude cofluctuations. On one hand, their infre-quent occurrence could reflect a dynamic strategy for limiting theconsumption of metabolic resources (9, 61). This theory is sup-ported by previous reports demonstrating that metabolic activityis elevated within the default mode network (62–64), a systemthat overlaps closely with the dominant mode of activity wefind underpins high-amplitude frames. On the other hand, high-amplitude frames are, to some extent, a mathematical necessityemerging in correlated, modular systems. For instance, a groupof brain regions form a mutually correlated functional module,then by definition their activity (and coactivity) will follow similartime courses, with a tendency to fluctuate together at the sameinstants in time. However, the observation that high-amplitudecofluctuations synchronize during movie watching suggests thatthey are also related to some underlying psychological process(with a presumed neurobiological correlate). Future work shouldinvestigate the neurobiological underpinnings of high-amplitudecofluctuations in greater detail.
Importantly, the entire cofluctuation time series enterprisecould be extended in several important ways, including by apply-ing it to other imaging modalities, e.g., electrophysiologicalrecordings (65–68) or fluorescence imaging data (69, 70). Addi-tionally, it would be straightforward to calculate cofluctuationtime series after partialing out the effects of activity from otherregions in the brain (24) or to investigate temporal dependenciesand lags between brain regions (71, 72).
Finally, the approach developed here decomposes functionalconnections into their exact frame-wise contributions. We spec-ulate that this decomposition might offer a selective means ofaddressing in-scanner motion, e.g., by identifying and censoringtime points impacted by motion on an edge-wise basis (73, 74).
Relationship with Existing Approaches. We note that the analy-sis of cofluctuation time series is conceptually similar to severalexisting methods (20, 36–38) or in some cases even builds uponshared mathematical machinery (75). For instance, multiplica-tion of temporal derivatives (MTDs) (76) calculates the element-wise products using differenced activity time series for all pairs ofnodes. These time series are then convolved with a kernel to gen-erate smooth estimates of time-varying nFC. Although similar,our approach relies on untransformed activity to estimate edgetime series, thereby preserving the relationship between staticnFC and the mean value of each edge time series. Furthermore,our approach omits the smoothing step, making it, in princi-ple, capable of detecting fluctuations in network structure over
shorter timescales compared to MTDs. Another related methodis CAPs (15, 16), which extracts and clusters voxel- or vertex-level activity during high-activity frames. Because a voxel can becoactive under different contexts, the cluster centroids spatiallyoverlap with one another.
Although these approaches arrive at similar conclusions, theypossess distinct advantages and disadvantages that make somemethods uniquely well suited for testing specific hypotheses andresearch questions. For instance, MTDs and the analysis of cofluc-tuation time series presented here are appropriate for trackingpatterns of connectivity across time. In the case of cofluctuationtime series, which are mathematically related to the static FCpattern, our approach is especially well suited for assessing thecontributions of frame-wise cofluctuation patterns to the brain’soverall FC (we note that this relationship, to our knowledge, hasnot been previously discussed in the extant literature). CAPS andinnovation-driven CAPS on the other hand, are better suited forstudying activity patterns and tracking their cooccurrences acrosstime. In principle, a systematic and careful comparison of thesemethods could be carried out in future work.
Finally, we note that our approach incorporates elements ofboth CAPs and MTDs. Like MTDs and other sliding-windowmethods, our approach yields a time series of node-by-node matri-ces, each of which encodes pairwise relationships among brainregions across time. In the case of sliding-window methods, theelements in each matrix represent estimates of instantaneouscorrelations, which requires first estimating variances (a secondmoment) from a limited set of observations, which can lead toinaccurate and noisy FC inference, especially when the num-ber of observations is small (narrow windows) (14, 77). Instead,the matrices generated using our approach encode instantaneouscofluctuation magnitudes, like CAPs. That is, each element indi-cates the magnitude with which the activity of two brain regionsis instantaneously deflecting in the same direction. Importantly,deflections are calculated with respect to means and variancesestimated using the full set of observations (the entire scan). Con-sequently, the time-varying estimates of cofluctuations reportedhere may be less sensitive to noise than sliding-window methods.
Additionally, it is important to note that while our approachand CAPs are similar in some ways, e.g., they both operate onsingle-frame timescales, our method is nonetheless distinct andhas unique advantages. Most importantly, our method is builtupon a mathematically exact decomposition of static rsFC intoits frame-wise contributions. This decomposition enables us toquantify, precisely, how individual time points impact static rsFC.Here we use this property to demonstrate that a relatively smallnumber of frames are necessary to explain rsFC [a finding thathas been reported elsewhere (15, 17, 36)], to show that cofluctua-tions become synchronized during movie watching, and that high-amplitude frames can be used to enhance subjects’ connectome-based fingerprints. Second, our method is parameter-free; thedecomposition does not depend on a specification of ad hocthresholds for high-amplitude activity nor does it require thatwe select a seed region or brain system in advance. Rather,our decomposition method considers all activity levels and theentire network simultaneously. As noted earlier, we envision thisapproach being useful for future studies of time-varying FC, forgenerating more sensitive and subject-specific biomarkers, and inconjunction with non-fMRI imaging modalities.
Limitations. One of the most key limitations concerns the cal-culation and interpretation of cofluctuation time series. Theprocedure for calculating edge time series begins by z-scoringeach brain region’s activity time series. This procedure, however,is only appropriate if the sample mean and SD are temporallyinvariant (78). If there is a sustained increase or decrease in activ-ity, e.g., the effect of a blocked task, then the z-scoring procedurecan result in a biased mean and SD resulting in poor esti-mates of fluctuations in activity. To minimize the likelihood of this
Zamani Esfahlani et al. PNAS | November 10, 2020 | vol. 117 | no. 45 | 28399
Dow
nloa
ded
by g
uest
on
Janu
ary
22, 2
022

occurring, we focused on resting-state and movie-watching datarather than blocked tasks. In future work, investigation of task-evoked cofluctuations could be investigated by employing alreadycommon preprocessing steps, e.g., constructing task regressors toremove the first-order effect of tasks on activity (79).
Conclusion. In conclusion, our study discloses a link between cor-tical activity and rsFC, facilitating a statistical explanation ofthe brain’s system-level architecture in terms of intermittent,short-lived, high-amplitude fluctuations in activity and coactiv-ity. Our methodological framework is readily applicable to otherimaging datasets and recording modalities, including observa-tions at neuronal scales, enabling the study of neural coactivityat unprecedented temporal resolution.
Materials and MethodsDatasets. We analyzed three separate datasets. Specifically, we focused onresting-state data from both The Human Connectome Project (HCP) andMSC. These data were processed similarly, the details of which are describedin this section. The third dataset, which has been analyzed elsewhere (28,49, 80), includes both resting-state and movie-watching data from a cohortof 29 individuals. This dataset was processed separately using a differentprocedure and is described in its own section. The processing pipelinesresulted in parcellations of cortex into N = 200 parcels (nodes) (81) in thecase of the HCP and MSC datasets and N = 114 parcels (52) in the case of theIndiana University dataset. The processing pipelines are described in detailin SI Appendix.
Cofluctuation Time Series. Constructing networks from fMRI data (or anyneural time series data) requires estimating the statistical dependencybetween every pair of time series. The magnitude of that dependency isusually interpreted as a measure of how strongly (or weakly) those vox-els or parcels are functionally connected to each other. By far the mostcommon measure of statistic dependence is the Pearson correlation coeffi-cient. Let xi = [xi(1), . . . , xi(T)] and xj = [xj(1), . . . , xj(T)] be the time seriesrecorded from voxels or parcels i and j, respectively. We can calculatethe correlation of i and j by first z-scoring each time series, such thatzi =
xi−µiσi
, where µi =1T
∑t xi(t) and σi =
1T−1
∑t[xi(t)−µi] are the time-
averaged mean and SD. Then, the correlation of i with j can be calculatedas rij =
1T−1
∑t[zi(t) · zj(t)]. Repeating this procedure for all pairs of parcels
results in a node-by-node correlation matrix, i.e., an estimate of FC. If thereare N nodes, this matrix has dimensions [N×N].
To estimate edge-centric networks, we need to modify the aboveapproach in one small but crucial way. Suppose we have two z-scored parceltime series, zi and zj . To estimate their correlation we calculate the meanof their element-wise product (not exactly the average, because we divideby T − 1 rather than T). Suppose, instead, that we never calculate the meanand simply stop after calculating the element-wise product. This operationwould result in a vector of length T whose elements encode the moment-by-moment cofluctuation magnitude of parcels i and j. For instance, supposeat time t, parcels i and j simultaneously increased their activity relative tobaseline. These increases are encoded in zi and zj as positive entries in thetth position, so their product is also positive. The same would be true if iand j decreased their activity simultaneously (because the product of neg-atives is a positive). On the other hand, if i increased while j decreased (orvice versa), this would manifest as a negative entry. Similarly, if either i or jincreased or decreased while the activity of the other was close to baseline,the corresponding entry would be close to zero.
Accordingly, the vector resulting from the element-wise product of zi
and zj can be viewed as encoding the magnitude of moment-to-momentcofluctuations between i and j. An analogous vector can easily be calculated
for every pair of parcels (network nodes), resulting in a set of cofluctua-tion (edge) time series. With N parcels, this results in N(N−1)
2 pairs, each oflength T .
Modularity Maximization. Modularity maximization is a heuristic for detect-ing communities in networks (82). Intuitively, it attempts to decomposea network into nonoverlapping subnetworks such that the observed den-sity of connections within subnetworks maximally exceeds what would beexpected by chance, where chance is determined by the user. The actualprocess of detecting communities is accomplished by choosing communityassignments that maximize a modularity quality function, Q, defined as
Q =∑
ij
Bijδ(gi , gj), [1]
where Bij = Aij − Pij is the {i, j} element of the modularity matrix, whichrepresents the observed weight of the connection between nodes i and jminus the expected weight. The variable gi is the community assignmentof node i, and δ(gi , gj) is the Kronecker delta function, whose value is1 when gi = gj and 0 otherwise. The modularity, Q, is effectively a sumover all edges that fall within communities and is optimized when theobserved weights of connections is maximally greater than the expected.In general, larger values of Q are thought to reflect superior communitypartitions.
Signed and Correlation Matrices. In this manuscript, we used the followingvariant of modularity, q∗, which has been shown to be especially well suitedfor use with correlation matrices (33):
q* = q++
v−v+v− q−, [2]
where q± = 1v±
∑ij(r
±ij −
k±i k±jv±
)δ(gi , gj). In this expression, r±ij represents
either the positive or negative elements of the correlation matrix, k±i =∑
j r±ij , and v± =∑
i k±i .
Differential Identifiability. Let A1 be an N×N FC matrix. We can repre-sent this matrix as an M = N× (N− 1)/2-dimensional vector by extractingits upper triangle elements. We can assess the similarity of two matrices, A1
and A2, by computing the similarity of their vector representations. Supposewe had multiple scans from multiple individuals. Let Iself and Iothers be theaverage within- and between-subject similarity. Differential identifiability,then, is simply Idiff = Iself − Idiff (48). Intuitively, the larger the value of Idiff ,the stronger the population-level fingerprint (46).
Code Availability. Code and example data for generating and analyz-ing edge time series are available in Github (https://github.com/brain-networks/edge-ts).
Data Availability. Two of the imaging datasets come from publicly avail-able, open-access repositories. HCP data can be accessed freely via https://db.humanconnectome.org/ after signing a data use agreement. MSC datacan be accessed via OpenfMRI at https://openneuro.org/datasets/ds000224/versions/1.0.3. Postprocessed data from the Indiana University study dataand code have been deposited in Figshare and GitHub (postprocessed dataare available at https://doi.org/10.6084/m9.figshare.12971162).
ACKNOWLEDGMENTS. R.F.B. and F.Z.E. acknowledge support from Indi-ana University Office of the Vice President for Research Emerging Area ofResearch Initiative, Learning: Brains, Machines and Children. This work wassupported by the NIH (grants R01MH110630 and R00MH094409 to D.P.K.and T32HD007475 Postdoctoral Traineeship to L.B.).
1. R. C. Craddock et al., Imaging human connectomes at the macroscale. Nat. Methods10, 524–539 (2013).
2. B. P. Rogers, V. L. Morgan, A. T. Newton, J. C. Gore, Assessing functional connectivityin the human brain by fMRI. Magn. Reson. Imaging 25, 1347–1357 (2007).
3. S. Gu et al., Emergence of system roles in normative neurodevelopment. Proc. Natl.Acad. Sci. U.S.A. 112, 13681–13686 (2015).
4. R. F. Betzel et al., Changes in structural and functional connectivity among resting-state networks across the human lifespan. Neuroimage 102, 345–357 (2014).
5. M. W. Cole, D. S. Bassett, J. D. Power, T. S. Braver, S. E. Petersen, Intrinsic and task-evoked network architectures of the human brain. Neuron 83, 238–251 (2014).
6. A. Fornito, A. Zalesky, M. Breakspear, The connectomics of brain disorders. Nat. Rev.Neurosci. 16, 159–172 (2015).
7. R. M. Hutchison et al., Dynamic functional connectivity: Promise, issues, andinterpretations. Neuroimage 80, 360–378 (2013).
8. E. A. Allen et al., Tracking whole-brain connectivity dynamics in the resting state.Cereb. Cortex 24, 663–676 (2014).
9. A. Zalesky, A. Fornito, L. Cocchi, L. L. Gollo, M. Breakspear, Time-resolved resting-statebrain networks. Proc. Natl. Acad. Sci. U.S.A. 111, 10341–10346 (2014).
10. A. Kucyi, K. D. Davis, Dynamic functional connectivity of the default mode networktracks daydreaming. Neuroimage 100, 471–480 (2014).
11. P. Barttfeld et al., Signature of consciousness in the dynamics of resting-state brainactivity. Proc. Natl. Acad. Sci. U.S.A. 112, 887–892 (2015).
12. E. Damaraju et al., Dynamic functional connectivity analysis reveals transient states ofdysconnectivity in schizophrenia. Neuroimage Clin. 5, 298–308 (2014).
28400 | www.pnas.org/cgi/doi/10.1073/pnas.2005531117 Zamani Esfahlani et al.
Dow
nloa
ded
by g
uest
on
Janu
ary
22, 2
022
NEU
ROSC
IEN
CEA
PPLI
EDM
ATH
EMA
TICS
13. U. Sakoglu et al., A method for evaluating dynamic functional network connectivityand task-modulation: Application to schizophrenia. MAGMA. 23, 351–366 (2010).
14. R. Hindriks et al., Can sliding-window correlations reveal dynamic functionalconnectivity in resting-state fMRI?. Neuroimage 127, 242–256 (2016).
15. X. Liu, J. H. Duyn, Time-varying functional network information extracted from briefinstances of spontaneous brain activity. Proc. Natl. Acad. Sci. U.S.A. 110, 4392–4397(2013).
16. F. I. Karahanoglu, D. Van De Ville, Transient brain activity disentangles fMRI resting-state dynamics in terms of spatially and temporally overlapping networks. Nat.Commun. 6, 7751 (2015).
17. E. Tagliazucchi, P. Balenzuela, D. Fraiman, D. R. Chialvo, Criticality in large-scale brainfMRI dynamics unveiled by a novel point process analysis. Front. Physiol. 3, 15 (2012).
18. N. Petridou, C. C. Gaudes, I. L. Dryden, S. T. Francis, P. A. Gowland, Periods of rest infMRI contain individual spontaneous events which are related to slowly fluctuatingspontaneous activity. Hum. Brain Mapp. 34, 1319–1329 (2013).
19. C. C. Gaudes, N. Petridou, S. T. Francis, I. L. Dryden, P. A. Gowland, Paradigm freemapping with sparse regression automatically detects single-trial functional magneticresonance imaging blood oxygenation level dependent responses. Hum. Brain Mapp.34, 501–518 (2013).
20. T. W. Allan et al., Functional connectivity in MRI is driven by spontaneous bold events.PloS One 10, e0124577 (2015).
21. M. G. Preti, T. A. W. Bolton, D. Van De Ville, The dynamic functional connectome:State-of-the-art and perspectives. Neuroimage 160, 41–54 (2017).
22. J. Faskowitz, F. Zamani Esfahlani, Y. Jo, O. Sporns, R. F. Betzel, Edge-centric functionalnetwork representations of human cerebral cortex reveal overlapping system-levelarchitecture. bioRxiv:799924 (13 October 2019).
23. Y. Jo et al., The diversity and multiplexity of edge communities within and betweenbrain systems. https://doi.org/10.1101/2020.05.05.067777 (6 May 2020).
24. S. M. Smith et al., Network modeling methods for fMRI. Neuroimage 54, 875–891(2011).
25. D. C. Van Essen et al., The Wu-minn human connectome project: An overview.Neuroimage 80, 62–79 (2013).
26. D. C. Van Essen et al.; Wu-Minn HCP Consortium, Data from “Human connec-tome project resting-state data.” ConnectomeDB. https://db.humanconnectome.org/.Accessed 1 September 2019.
27. E. M. Gordon et al., Precision functional mapping of individual human brains. Neuron,95, 791–807 (2017).
28. R. F. Betzel, L. Byrge, F. Z. Esfahlani, D. P. Kennedy. Temporal fluctuations in the brain’smodular architecture during movie-watching. Neuroimage 213, 116687 (2020).
29. R. Betzel, D. Kennedy, L. Byrge, Data from “Resting-state and movie-watching data.”Figshare. https://doi.org/10.6084/m9.figshare.12971162. Deposited 17 September2020.
30. E. M. Gordon et al., Data from “The midnight scan club (MSC) dataset.” OpenNeuro.https://openneuro.org/datasets/ds000224/versions/1.0.3. Accessed 1 September 2019.
31. M. Pedersen, A. Omidvarnia, A. Zalesky, G. D. Jackson. On the relationship betweeninstantaneous phase synchrony and correlation-based sliding windows for time-resolved fMRI connectivity analysis. Neuroimage 181, 85–94 (2018).
32. J. Cabral et al., Exploring mechanisms of spontaneous functional connectivity in MEG:How delayed network interactions lead to structured amplitude envelopes of band-pass filtered oscillations. Neuroimage 90, 423–435 (2014).
33. M. Rubinov, O. Sporns, Weight-conserving characterization of complex functionalbrain networks. Neuroimage 56, 2068–2079 (2011).
34. M. Mennes et al., Inter-individual differences in resting-state functional connectivitypredict task-induced bold activity. Neuroimage 50, 1690–1701 (2010).
35. E. Tagliazucchi, M. Siniatchkin, H. Laufs, D. R. Chialvo, The voxel-wise functional con-nectome can be efficiently derived from co-activations in a sparse spatio-temporalpoint-process. Front. Neurosci. 10, 381 (2016).
36. I. Cifre, M. Zarepour, S. G. Horovitz, S. Cannas, D. R. Chialvo, On why a few points suf-fice to describe spatiotemporal large-scale brain dynamics. arXiv:1707.00759 (3 July2017).
37. D. Gutierrez-Barragan, M. A. Basson, S. Panzeri, A. Gozzi, Infraslow state fluctuationsgovern spontaneous fMRI network dynamics. Curr. Biol. 29, 2295–2306 (2019).
38. X. Zhang, W.-J. Pan, S. D. Keilholz, The relationship between bold and neural activityarises from temporally sparse events. Neuroimage 207, 116390 (2020).
39. E. J. Cornblath et al., Temporal sequences of brain activity at rest are constrained bywhite matter structure and modulated by cognitive demands. Commun Biol. 3, 261(2020).
40. T. Karapanagiotidis et al., The psychological correlates of distinct neural statesoccurring during wakeful rest. bioRxiv:2019.12 (12 March 2020).
41. G. Deco, V. K. Jirsa, A. R. McIntosh, Emerging concepts for the dynamical organizationof resting-state activity in the brain. Nat. Rev. Neurosci. 12, 43–56 (2011).
42. W. H. Thompson, P. Fransson, Bursty properties revealed in large-scale brain networkswith a point-based method for dynamic functional connectivity. Sci. Rep. 6, 39156(2016).
43. S. Sonkusare, M. Breakspear, C. Guo, Naturalistic stimuli in neuroscience: Criticallyacclaimed. Trends Cogn. Sci. 23, 699–714 (2019).
44. U. Hasson, Y. Nir, I. Levy, G. Fuhrmann, R. Malach, Intersubject synchronization ofcortical activity during natural vision. Science 303, 1634–1640 (2004).
45. M. W. Cole et al., Multi-task connectivity reveals flexible hubs for adaptive taskcontrol. Nat. Neurosci. 16, 1348–1355 (2013).
46. E. S. Finn et al., Functional connectome fingerprinting: Identifying individuals usingpatterns of brain connectivity. Nat. Neurosci. 18, 1664–1671 (2015).
47. C. Gratton et al., Functional brain networks are dominated by stable group andindividual factors, not cognitive or daily variation. Neuron 98, 439–452 (2018).
48. E. Amico, J. Goni, The quest for identifiability in human functional connectomes. Sci.Rep. 8, 8254 (2018).
49. L. Byrge, D. P. Kennedy, High-accuracy individual identification using a “thin slice” ofthe functional connectome. Netw. Neurosci. 3, 363–383 (2019).
50. J. A. Nielsen, R. W. Mair, J. T. Baker, R. L. Buckner, Precision brain morphometry:Feasibility and opportunities of extreme rapid scans. bioRxiv:530436 (26 January2019).
51. T. O. Laumann, et al., Functional system and areal organization of a highly sampledindividual human brain. Neuron 87, 657–670 (2015).
52. B. T. Yeo et al. The organization of the human cerebral cortex estimated by intrinsicfunctional connectivity. J. Neurophysiol. 106, 1125–1165 (2011).
53. S. M. Smith et al., Correspondence of the brain’s functional architecture duringactivation and rest. Proc. Natl. Acad. Sci. U.S.A. 106, 13040–13045 (2009).
54. N. A. Crossley et al.. Cognitive relevance of the community structure of the humanbrain functional coactivation network. Proc. Natl. Acad. Sci. U.S.A. 110. 11583–11588(2013).
55. T. Yarkoni, R. A. Poldrack, D. C. Van. Essen, T. E. Nichols, D. W. Tor, Large-scale auto-mated synthesis of human functional neuroimaging data. Nat. Methods. 8, 665–670(2011).
56. R. F. Betzel, M. Fukushima, H. Ye, X.-N. Zuo, O. Sporns, Dynamic fluctuations coincidewith periods of high and low modularity in resting-state functional brain networks.Neuroimage 127, 287–297 (2016).
57. W. H. Thompson, F. Peter, The mean–variance relationship reveals two possible strate-gies for dynamic brain connectivity analysis in fMRI. Front. Hum. Neurosci. 9, 398(2015).
58. J. Cabral et al., Cognitive performance in healthy older adults relates to spontaneousswitching between states of functional connectivity during rest. Sci. Rep. 7, 5135(2017).
59. D. J. Lurie et al., Questions and controversies in the study of time-varying functionalconnectivity in resting fMRI. Netw. Neurosci. 4, 30–69 (2020).
60. L. E. Suarez, D. R. Markello, R. F. Betzel, B. Misic, Linking structure and function inmacroscale brain networks. Trends Cogn. Sci. 24, 302–315 (2020).
61. S. B. Laughlin, J. T. Sejnowski, Communication in neuronal networks. Science 301,1870–1874 (2003).
62. M. E. Raichle et al., A default mode of brain function. Proc. Natl. Acad. Sci. U.S.A. 98,676–682 (2001).
63. M. E. Raichle, A. Z. Snyder, A default mode of brain function: A brief history of anevolving idea. Neuroimage 37, 1083–1090 (2007).
64. S. Passow et al., Default-mode network functional connectivity is closely related tometabolic activity. Hum. Brain Mapp. 36, 2027–2038 (2015).
65. R. F. Betzel et al., Structural, geometric and genetic factors predict interregional brainconnectivity patterns probed by electrocorticography. Nat. Biomed. Eng.3, 902–916(2019).
66. A. N. Khambhati, K. A. Davis, T. H. Lucas, B. Litt, D. S. Bassett. Virtual cortical resectionreveals push-pull network control preceding seizure evolution. Neuron 91, 1170–1182(2016).
67. S. P. Burns et al., Network dynamics of the brain and influence of the epileptic seizureonset zone. Proc. Natl. Acad. Sci. U.S.A., 111, E5321–E5330 (2014).
68. B. J. He, A. Z. Snyder, J. M. Zempel, M. D. Smyth, M. E. Raichle. Electrophysiologicalcorrelates of the brain’s intrinsic large-scale functional architecture. Proc. Natl. Acad.Sci. U.S.A. 105, 16039–16044 (2008).
69. K. Mann, C. L. Gallen, T. R. Clandinin, Whole-brain calcium imaging reveals an intrinsicfunctional network in drosophila. Curr. Biol. 27, 2389–2396 (2017).
70. R. Betzel, Organizing principles of whole-brain functional connectivity in zebrafishlarvae. bioRxiv:496414 (15 December 2018).
71. A. Mitra, M. E. Raichle, How networks communicate: Propagation patterns in spon-taneous brain activity. Philos. Trans. R. Soc. Lond. B Biol. Sci. 371, 20150546(2016).
72. A. Mitra, A. Z. Snyder, B. Tyler, M. E. Raichle, Lag threads organize the brain’s intrinsicactivity. Proc. Natl. Acad. Sci. U.S.A. 112, E2235–E2244 (2015).
73. J. D. Power, K. A. Barnes, A. Z. Snyder, B. L. Schlaggar, S. E. Petersen, Spurious butsystematic correlations in functional connectivity mri networks arise from subjectmotion. Neuroimage 59, 2142–2154 (2012).
74. J. D. Power et al., Methods to detect, characterize, and remove motion artifact inresting state fMRI. Neuroimage, 84, 320–341 (2014).
75. E. S. B. van Oort et al., Functional parcellation using time courses of instantaneousconnectivity. Neuroimage, 170, 31–40 (2018).
76. J. M. Shine et al., Estimation of dynamic functional connectivity using multiplicationof temporal derivatives. Neuroimage 122, 399–407 (2015).
77. N. Leonardi, D. Van De Ville, On spurious and real fluctuations of dynamic functionalconnectivity during rest. Neuroimage 104, 430–436 (2015).
78. R. Liegeois, T. O. Laumann, A. Z. Snyder, J. Zhou, B. T. T. Yeo, Interpreting temporalfluctuations in resting-state functional connectivity MRI. Neuroimage 163, 437–455(2017).
79. Ml. W. Cole et al., Task activations produce spurious but systematic inflation of taskfunctional connectivity estimates. Neuroimage 189, 1–18 (2019).
80. L. Byrge, D. P. Kennedy, Accurate prediction of individual subject identity and task,but not autism diagnosis, from functional connectomes. Hum Brain Mapp. 41, 2249–2262 (2020).
81. A. Schaefer et al., Local-global parcellation of the human cerebral cor-tex from intrinsic functional connectivity MRI. Cereb. Cortex 28, 3095–3114(2017)
82. M. E. J. Newman, M. Girvan, Finding and evaluating community structure innetworks. Phys. Rev. E 69, 026113 (2004).
Zamani Esfahlani et al. PNAS | November 10, 2020 | vol. 117 | no. 45 | 28401
Dow
nloa
ded
by g
uest
on
Janu
ary
22, 2
022