higher education conference enrollment management
TRANSCRIPT

Higher Education Conference
enrollment management

The Role of Data and Playful Experimentation in Enrollment
Management
A Look at Campuses and the State
Don Hossler
Indiana University Bloomington

An Advanced Organizer
• Common understanding of EM
• Your challenges, expectations, and goals
• The science of EM – information not data
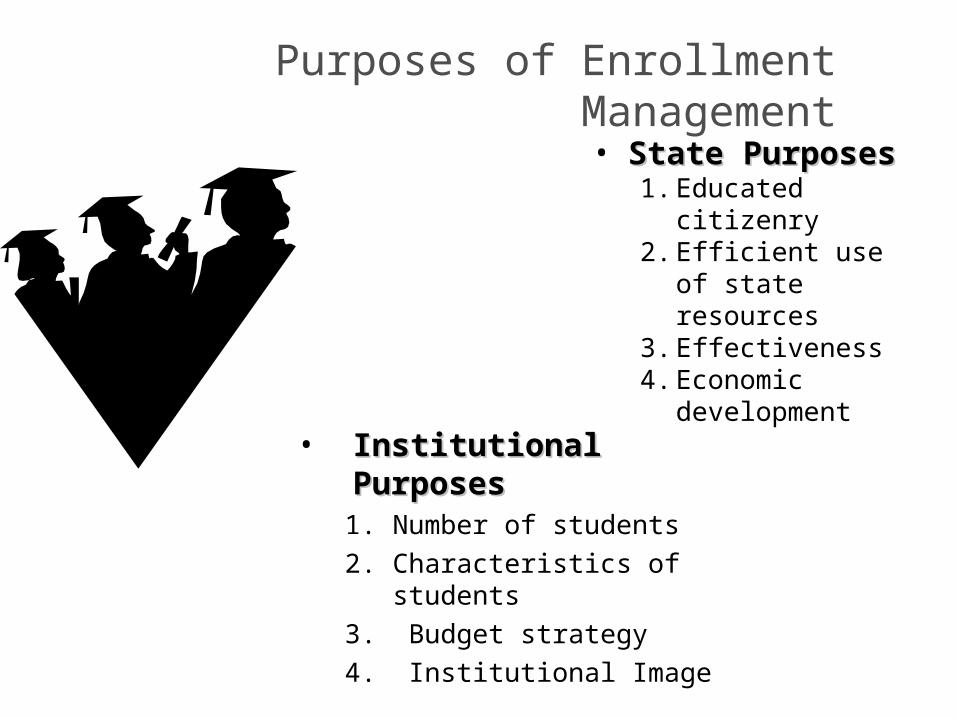
Purposes of Enrollment Management
• Institutional PurposesInstitutional Purposes1. Number of students
2. Characteristics of students
3. Budget strategy
4. Institutional Image
• State PurposesState Purposes1. Educated citizenry2. Efficient use of
state resources3. Effectiveness4. Economic
development

Defining Enrollment ManagementDefining Enrollment Management
Organized by strategic planning & research and supported by research, enrollment management
activities concern student college choice, the transition to college, student retention, & student outcomes.
These processes are studied to guide campus practices in the areas of new student recruitment and
financial aid, student support services, curriculum development, & other academic areas that affect
enrollments

• Information Resource Management
Information Development - research, analysis, evaluation, assessment
Information & Systems Management - data processing, MIS, DSS - the networked campus, web-enabled processes
Information Dissemination & Use : - knowledge management systems; intellectual capital - processes of organizational learning
D. Kalsbeek, 2004

The Incentive Structures
• Graduation & degree completion
• Transfer • Credit hours earned• Retention

Science of Enrollment Management
• A caveat – information will not fix organizational structure, lack of expertise, or bad decisions
• Data transformed into information are essential

Relevant State Policy Trends at the National Level
• Constrain demands for state resources going to postsecondary education– Appropriations to institutions– Support for student financial aid
• Seamless transferability– Encourage transfer & articulation agreements– Mandate them
• All of these are likely to increase the social acceptability of starting at Two-Year Colleges
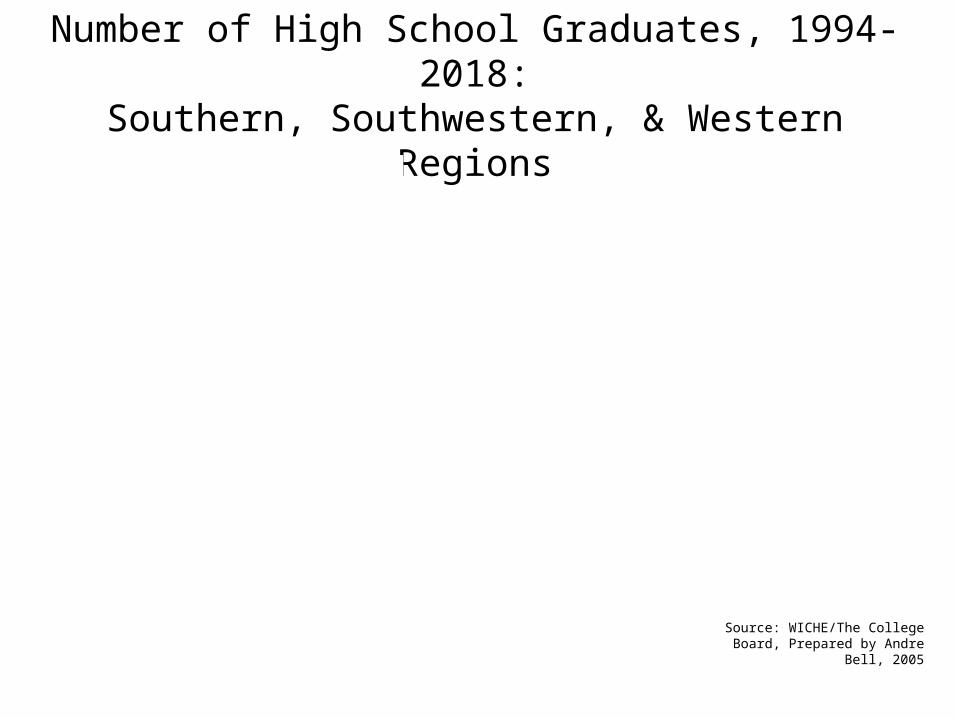
Number of High School Graduates, 1994-2018:Southern, Southwestern, & Western Regions
Source: WICHE/The College Board, Prepared by Andre Bell, 2005
0
150,000
300,000
450,000
600,000
750,000
900,000
94 96 98 00 02 04 06 08 10 12 14 16 18
Non-Public White Black Asian Hispanic American Indian
South
0
150,000
300,000
450,000
600,000
750,000
900,000
91 93 95 97 99 01 03 05 07 09 11 13 15 17
Non-Public White Black Asian Hispanic American Indian
Southwest
0
150,000
300,000
450,000
600,000
750,000
900,000
94 96 98 00 02 04 06 08 10 12 14 16 18
Non-Public White Black Asian Hispanic American Indian
West

Market Research
• No dramatic compelling advantage
• From a large campus…Personal attention, small classes, not fr. seminars, not theme residence halls
• A complex message, uncertain results, not easily implemented

The Playfulness of EM
• Information delimits choices but seldom produces - the choicethe choice
• Seldom a sure thingSeldom a sure thing
Yet, senior administrators often want, uncertainty reduction—a sure thing.
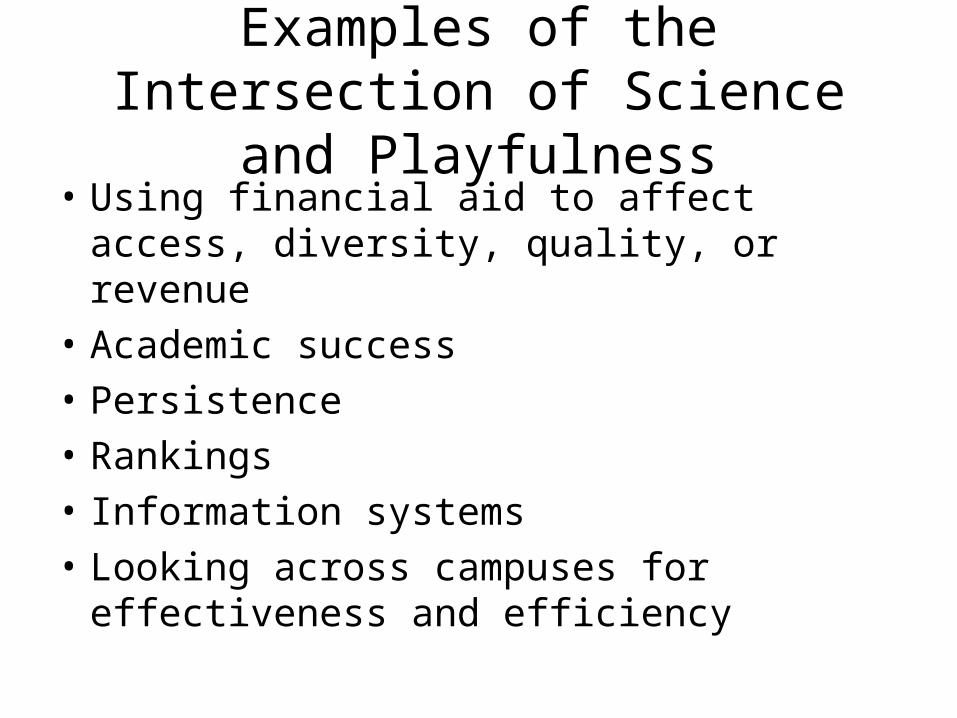
Examples of the Intersection of Science and Playfulness
• Using financial aid to affect access, diversity, quality, or revenue
• Academic success
• Persistence
• Rankings
• Information systems
• Looking across campuses for effectiveness and efficiency
Academic Rating (Based on ACT, HS Class Rank, HS GPA) / (Median ACT shown)
1 2 3 4 5 6
Expected Family Contribution
Average Enrollment Yield by Level of Family Resources and Strength of Academic Profile:
24%
45%
45%
57%
59%
60%
17%
39%
41%
53%
52%
51%
18%
48%
35%
40%
58%
42%
18%
35%
33%
40%
41%
41%
14%
31%
32%
39%
43%
44%
12%
32%
34%
34%
37%
40%
Non-AidApplicant
Highest
Mid
Lowest

Academic Rating (Based on ACT, HS Class Rank, HS GPA) / (Median ACT shown)
1 2 3 4 5 6
Expected Family Contribution
Managing the Mix
129
45
39
57
74
100
72
40
42
56
64
68
99
65
50
60
85
75
70
45
47
52
67
57
67
50
47
58
61
58
51
63
64
61
46
31
Non-AidApplicant
Highest
Mid
Lowest
Market Merit
Mission
Margin

Always keep in mind, can our staffs and our systems handle this new initiative?

When Working with Aid Models
• Need good data, which is no easy task• Need multiple years• Need to carefully examine your our own past
practices• Need to realize that you can never predict
exactly• Sunk costs are largest problem• Can your systems handle your plan?• Can never predict your competitors’ behavior

• What drives student rankings?
• In your cluster of institutions – really not much
variance & strategies easy to copy
• In your cluster of IHEs – not much variance & most are easy to copy
Look Under the Hood
% of Ranking Variance Factor Explained
• Teaching quality 3%
• % students with jobs at graduation 0
• Responsiveness of the program 2%
• Career services support 42%
• Post-MBA salary 30%

“The Quality of International Students is Declining”
Fr to Soph Retention
00 01 02 03 04
Internatl 90% 84% 83% 92% 89%
Domestic residents
82% 82% 83% 83% 84%
Domestic non-residents
86% 86% 87% 86% 86%

These New Programs at the Community College are Hurting our
Regional Campus Enrollments!
Actual data indicated they were enrolling students who simply had not been attending any postsecondary

This Transfer Program Is a Model Program
• Get our data

One Final Problem in a System Environment
• It’s a unit of analysis question.• Always a temptation to make the results fit our
beliefs or political expediency.• Who controls the results?

Higher Education Conference
enrollment management