history network - miraeasset daewoo · history network financials market capitalization ... * ksfc...
TRANSCRIPT
0

1
2
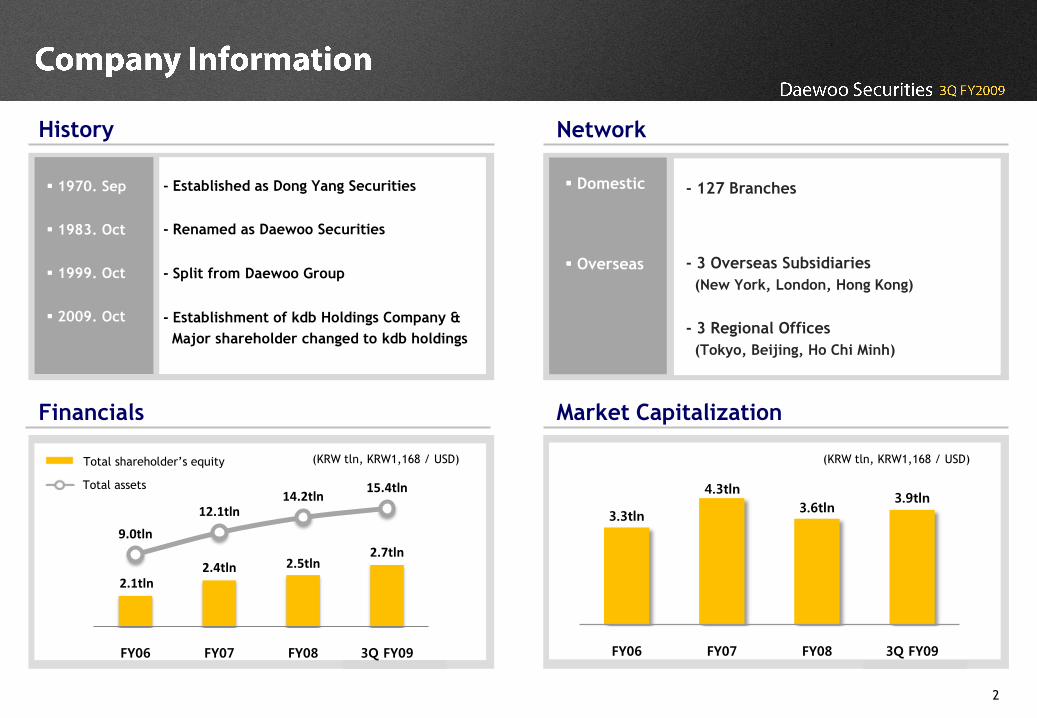
History Network
Financials Market Capitalization
1970. Sep
1983. Oct
1999. Oct
2009. Oct
Domestic
Overseas
- 127 Branches
- 3 Overseas Subsidiaries
(New York, London, Hong Kong)
- 3 Regional Offices
(Tokyo, Beijing, Ho Chi Minh)
- Established as Dong Yang Securities
- Renamed as Daewoo Securities
- Split from Daewoo Group
- Establishment of kdb Holdings Company &
Major shareholder changed to kdb holdings
(KRW tln, KRW1,168 / USD)(KRW tln, KRW1,168 / USD)
Total assets
Total shareholder’s equity
2.1tln2.4tln 2.5tln
2.7tln
9.0tln
12.1tln14.2tln
15.4tln
FY06 FY07 FY08 3Q FY09
3.3tln
4.3tln
3.6tln3.9tln
FY06 FY07 FY08 3Q FY09
3
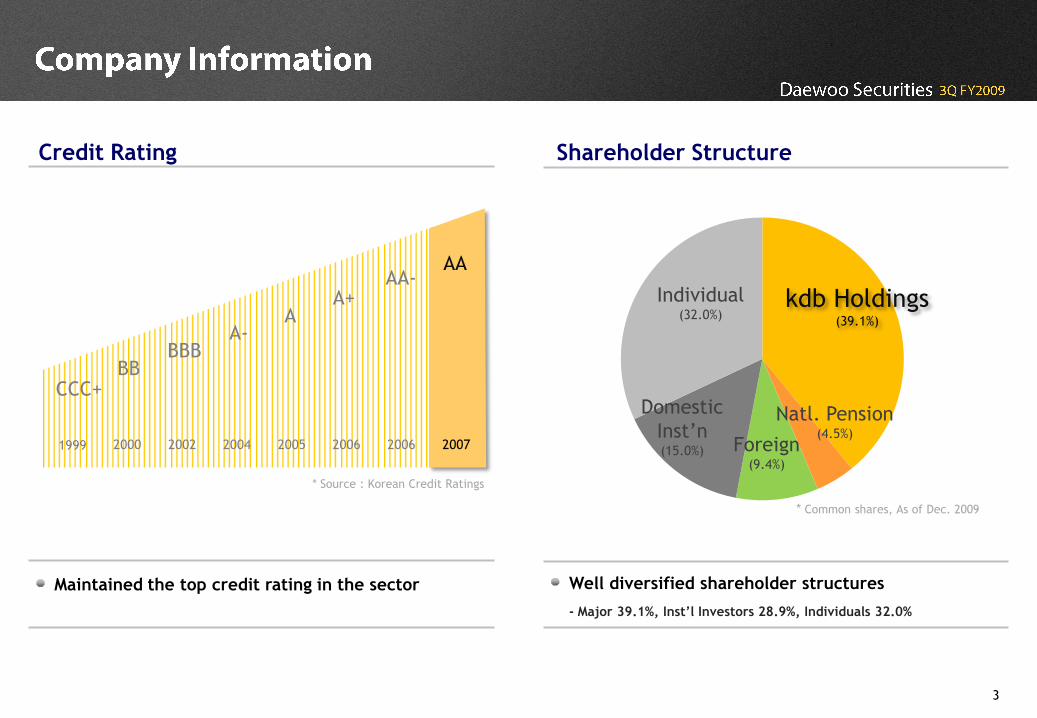
Credit Rating Shareholder Structure
2000 2002 2004 2005 20062006 20071999
CCC+BB
BBBA-
A A+
AA-AA
Natl. Pension(4.5%)
Foreign(9.4%)
Individual(32.0%)
kdb Holdings(39.1%)
Domestic
Inst’n(15.0%)
* Common shares, As of Dec. 2009
Maintained the top credit rating in the sector
* Source : Korean Credit Ratings
Well diversified shareholder structures
- Major 39.1%, Inst’l Investors 28.9%, Individuals 32.0%
4
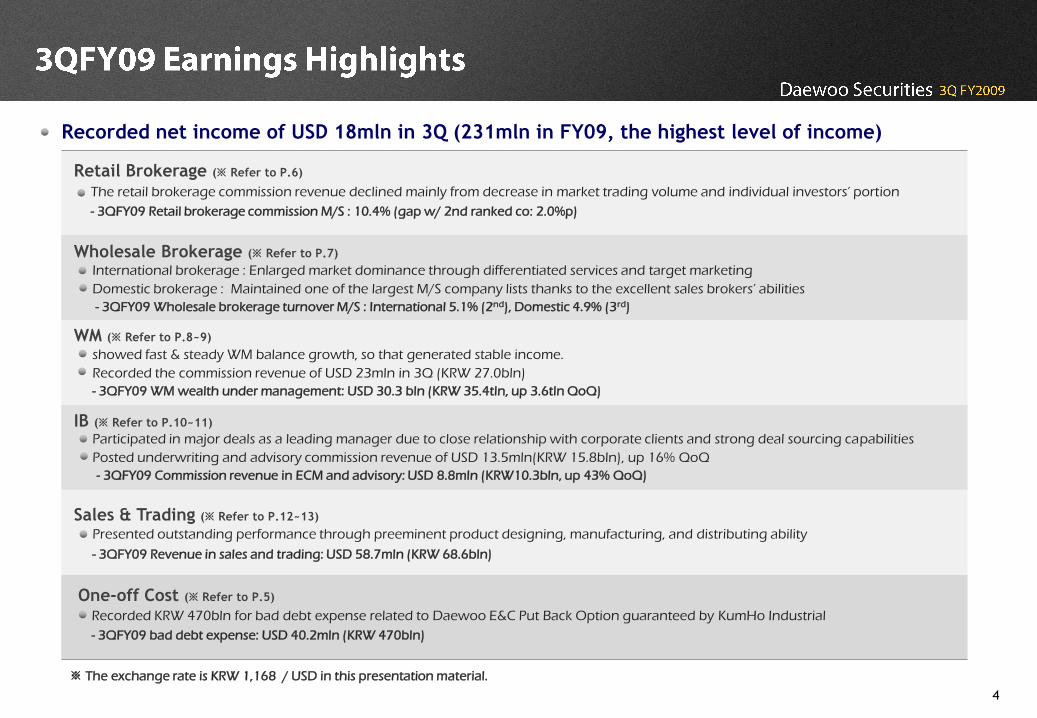
Retail Brokerage (※ Refer to P.6)
The retail brokerage commission revenue declined mainly from decrease in market trading volume and individual investors’ portion
- 3QFY09 Retail brokerage commission M/S : 10.4% (gap w/ 2nd ranked co: 2.0%p)
Recorded net income of USD 18mln in 3Q (231mln in FY09, the highest level of income)
Wholesale Brokerage (※ Refer to P.7)
International brokerage : Enlarged market dominance through differentiated services and target marketing
Domestic brokerage : Maintained one of the largest M/S company lists thanks to the excellent sales brokers’ abilities
- 3QFY09 Wholesale brokerage turnover M/S : International 5.1% (2nd), Domestic 4.9% (3rd)
WM (※ Refer to P.8~9)
showed fast & steady WM balance growth, so that generated stable income.
Recorded the commission revenue of USD 23mln in 3Q (KRW 27.0bln)
- 3QFY09 WM wealth under management: USD 30.3 bln (KRW 35.4tln, up 3.6tln QoQ)
IB (※ Refer to P.10~11)
Participated in major deals as a leading manager due to close relationship with corporate clients and strong deal sourcing capabilities
Posted underwriting and advisory commission revenue of USD 13.5mln(KRW 15.8bln), up 16% QoQ
- 3QFY09 Commission revenue in ECM and advisory: USD 8.8mln (KRW10.3bln, up 43% QoQ)
Sales & Trading (※ Refer to P.12~13)
Presented outstanding performance through preeminent product designing, manufacturing, and distributing ability
- 3QFY09 Revenue in sales and trading: USD 58.7mln (KRW 68.6bln)
One-off Cost (※ Refer to P.5)
Recorded KRW 470bln for bad debt expense related to Daewoo E&C Put Back Option guaranteed by KumHo Industrial
- 3QFY09 bad debt expense: USD 40.2mln (KRW 470bln)
※ The exchange rate is KRW 1,168 / USD in this presentation material.
5
54%40%
4%
3%
3%
3%
7%
8%
5%
7%
20%32%
7% 7%
2Q 3Q
Interest Income
GFM
IB
WM
Int'l Brok.
Inst. Brok.
Retail Brok.
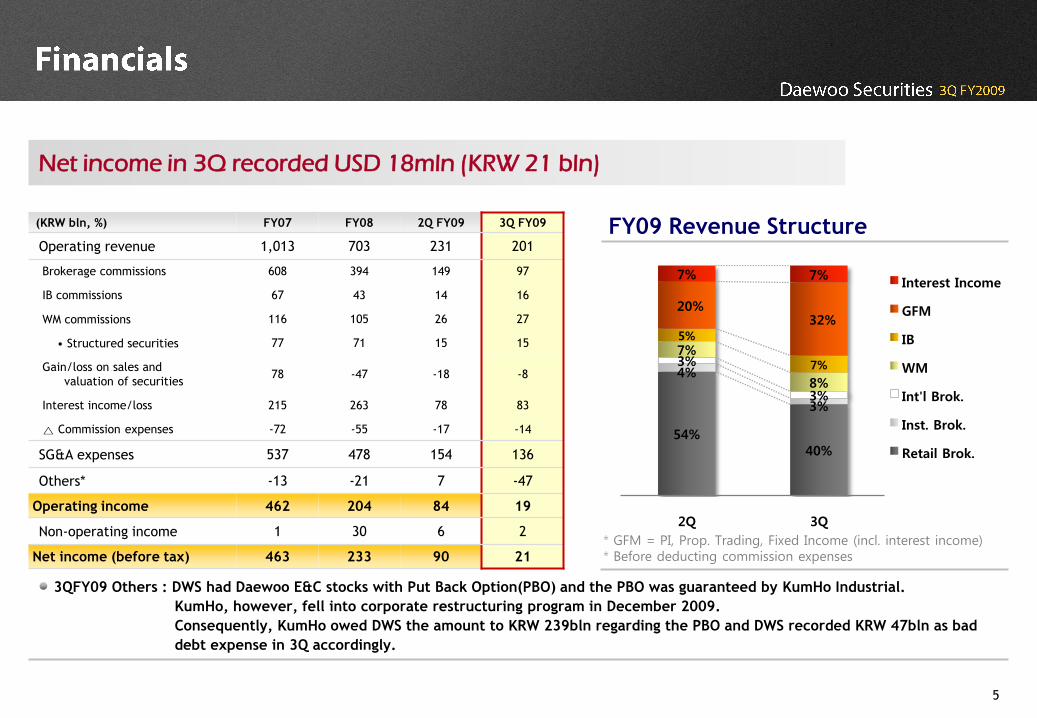
(KRW bln, %) FY07 FY08 2Q FY09 3Q FY09
Operating revenue 1,013 703 231 201
Brokerage commissions 608 394 149 97
IB commissions 67 43 14 16
WM commissions 116 105 26 27
• Structured securities 77 71 15 15
Gain/loss on sales and
valuation of securities78 -47 -18 -8
Interest income/loss 215 263 78 83
△ Commission expenses -72 -55 -17 -14
SG&A expenses 537 478 154 136
Others* -13 -21 7 -47
Operating income 462 204 84 19
Non-operating income 1 30 6 2
Net income (before tax) 463 233 90 21
Net income in 3Q recorded USD 18mln (KRW 21 bln)
FY09 Revenue Structure
3QFY09 Others : DWS had Daewoo E&C stocks with Put Back Option(PBO) and the PBO was guaranteed by KumHo Industrial.
KumHo, however, fell into corporate restructuring program in December 2009.
Consequently, KumHo owed DWS the amount to KRW 239bln regarding the PBO and DWS recorded KRW 47bln as bad
debt expense in 3Q accordingly.
* GFM = PI, Prop. Trading, Fixed Income (incl. interest income)* Before deducting commission expenses
6
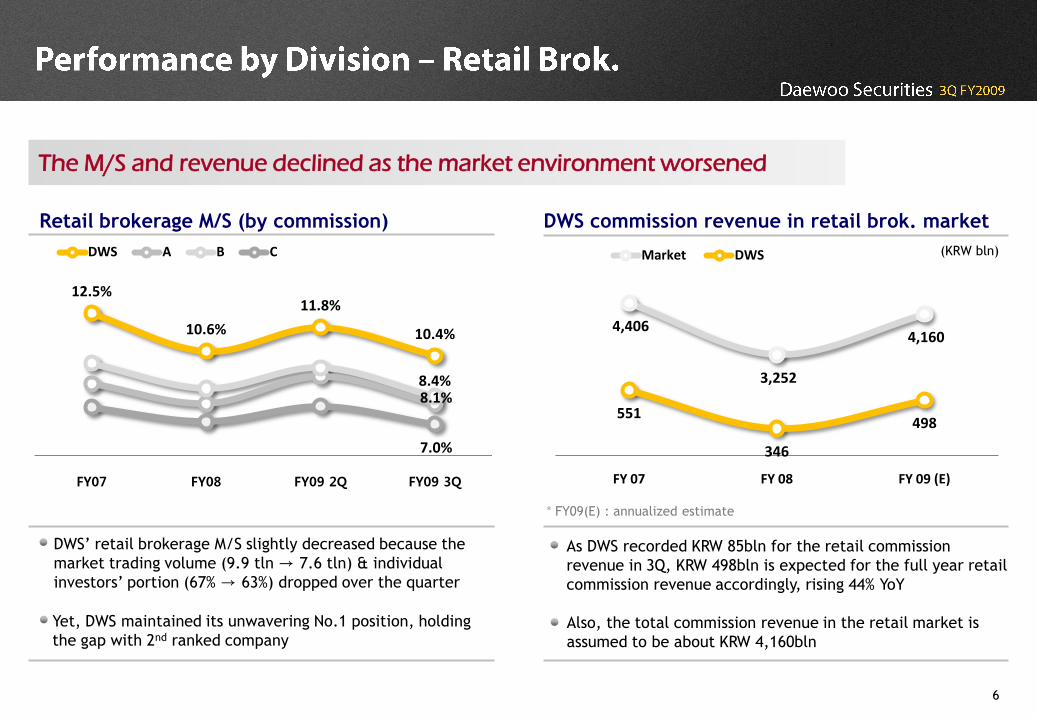
12.5%
10.6%
11.8%
10.4%
8.1%8.4%
7.0%
FY07 FY08 FY09 2Q FY09 3Q
DWS A B C
4,406
3,252
4,160
551
346
498
FY 07 FY 08 FY 09 (E)
Market DWS
The M/S and revenue declined as the market environment worsened
* FY09(E) : annualized estimate
Retail brokerage M/S (by commission) DWS commission revenue in retail brok. market
(KRW bln)
DWS’ retail brokerage M/S slightly decreased because the
market trading volume (9.9 tln → 7.6 tln) & individual
investors’ portion (67% → 63%) dropped over the quarter
Yet, DWS maintained its unwavering No.1 position, holding
the gap with 2nd ranked company
As DWS recorded KRW 85bln for the retail commission
revenue in 3Q, KRW 498bln is expected for the full year retail
commission revenue accordingly, rising 44% YoY
Also, the total commission revenue in the retail market is
assumed to be about KRW 4,160bln
7
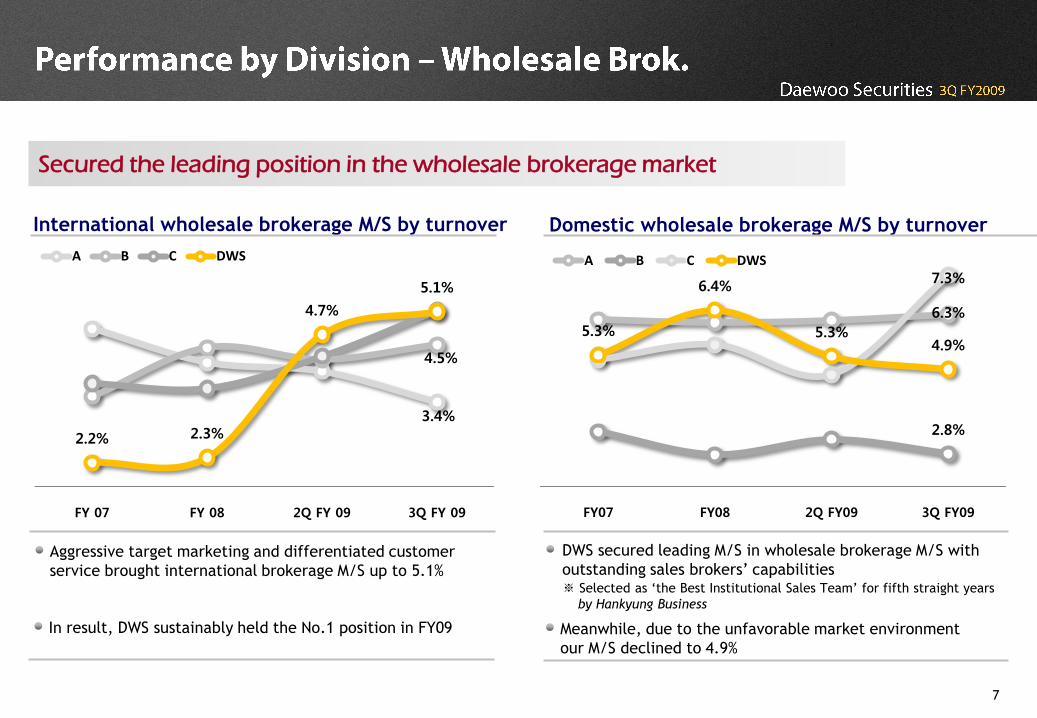
Secured the leading position in the wholesale brokerage market
International wholesale brokerage M/S by turnover Domestic wholesale brokerage M/S by turnover
Aggressive target marketing and differentiated customer
service brought international brokerage M/S up to 5.1%
DWS secured leading M/S in wholesale brokerage M/S with
outstanding sales brokers’ capabilities ※ Selected as ‘the Best Institutional Sales Team’ for fifth straight years
by Hankyung Business
3.4%
4.5%
2.2% 2.3%
4.7%
5.1%
FY 07 FY 08 2Q FY 09 3Q FY 09
A B C DWS
6.3%
2.8%
7.3%
5.3%
6.4%
5.3%4.9%
FY07 FY08 2Q FY09 3Q FY09
A B C DWS
In result, DWS sustainably held the No.1 position in FY09 Meanwhile, due to the unfavorable market environment
our M/S declined to 4.9%
8
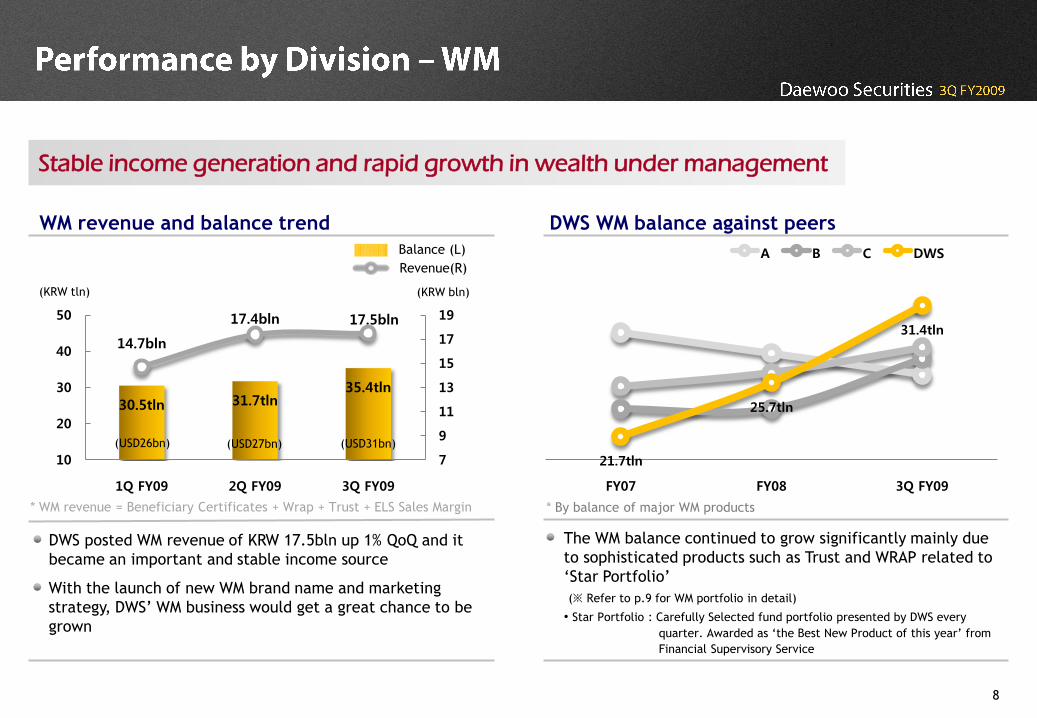
30.5tln 31.7tln35.4tln
14.7bln
17.4bln 17.5bln
7
9
11
13
15
17
19
10
20
30
40
50
1Q FY09 2Q FY09 3Q FY09
21.7tln
25.7tln
31.4tln
FY07 FY08 3Q FY09
A B C DWS
WM revenue and balance trend
Stable income generation and rapid growth in wealth under management
Balance (L)
Revenue(R)
* By balance of major WM products
DWS WM balance against peers
* WM revenue = Beneficiary Certificates + Wrap + Trust + ELS Sales Margin
(USD26bn) (USD27bn) (USD31bn)
(KRW tln) (KRW bln)
DWS posted WM revenue of KRW 17.5bln up 1% QoQ and it
became an important and stable income source
The WM balance continued to grow significantly mainly due
to sophisticated products such as Trust and WRAP related to
‘Star Portfolio’
(※ Refer to p.9 for WM portfolio in detail)
• Star Portfolio : Carefully Selected fund portfolio presented by DWS every
quarter. Awarded as ‘the Best New Product of this year’ from
Financial Supervisory Service
With the launch of new WM brand name and marketing
strategy, DWS’ WM business would get a great chance to be
grown
9
0.6tln 0.6tln 0.7tln 0.6tln
1.9tln 2.0tln 2.0tln 2.2tln
605,357 615,758
649,645677,973
4Q FY08 1Q FY09 2Q FY09 3Q FY09
Bond type Deposit type No. of accounts
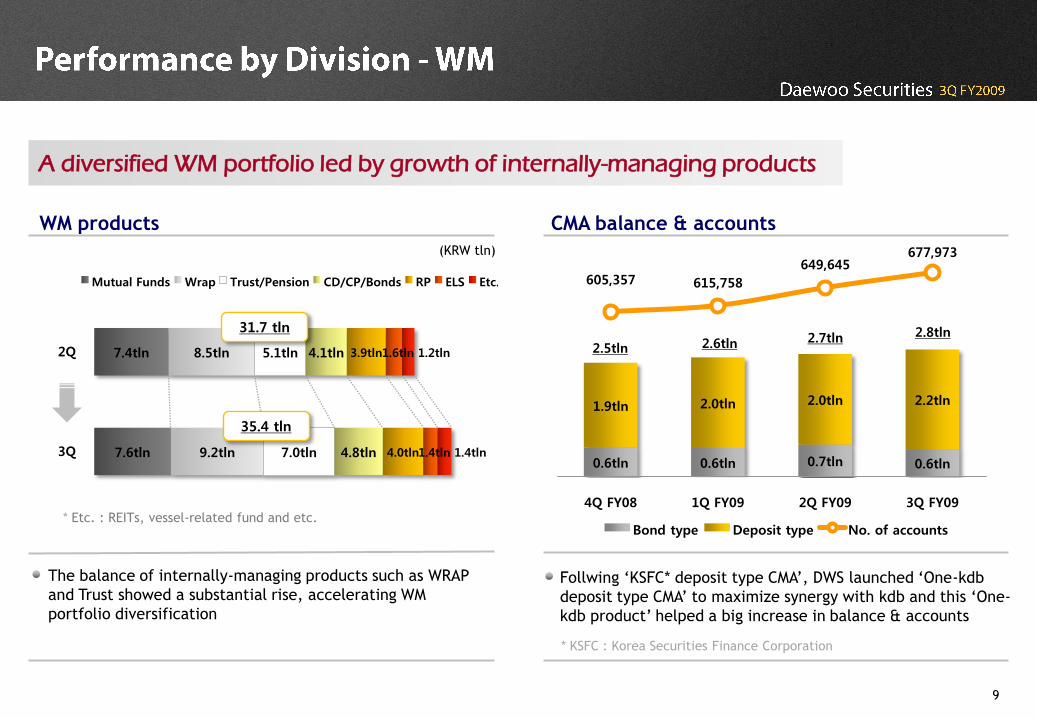
A diversified WM portfolio led by growth of internally-managing products
* Etc. : REITs, vessel-related fund and etc.
WM products CMA balance & accounts
(KRW tln)
The balance of internally-managing products such as WRAP
and Trust showed a substantial rise, accelerating WM
portfolio diversification
Follwing ‘KSFC* deposit type CMA’, DWS launched ‘One-kdb
deposit type CMA’ to maximize synergy with kdb and this ‘One-
kdb product’ helped a big increase in balance & accounts
7.6tln
7.4tln
9.2tln
8.5tln
7.0tln
5.1tln
4.8tln
4.1tln
4.0tln
3.9tln
1.4tln
1.6tln
1.4tln
1.2tln
3Q
2Q
Mutual Funds Wrap Trust/Pension CD/CP/Bonds RP ELS Etc.
2.5tln 2.6tln 2.7tln 2.8tln31.7 tln
35.4 tln
* KSFC : Korea Securities Finance Corporation
10
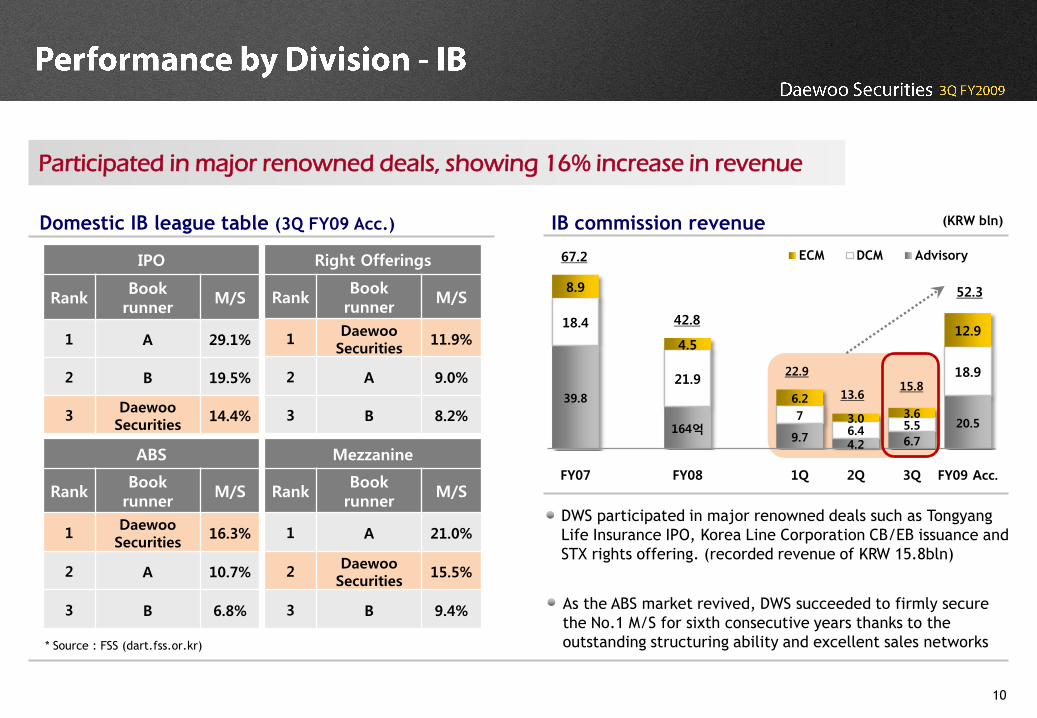
Participated in major renowned deals, showing 16% increase in revenue
Domestic IB league table (3Q FY09 Acc.)
* Source : FSS (dart.fss.or.kr)
As the ABS market revived, DWS succeeded to firmly secure
the No.1 M/S for sixth consecutive years thanks to the
outstanding structuring ability and excellent sales networks
IB commission revenue (KRW bln)
DWS participated in major renowned deals such as Tongyang
Life Insurance IPO, Korea Line Corporation CB/EB issuance and
STX rights offering. (recorded revenue of KRW 15.8bln)
IPO
RankBook
runnerM/S
1 A 29.1%
2 B 19.5%
3Daewoo Securities
14.4%
Right Offerings
RankBook
runnerM/S
1Daewoo Securities
11.9%
2 A 9.0%
3 B 8.2%
ABS
RankBook
runnerM/S
1Daewoo Securities
16.3%
2 A 10.7%
3 B 6.8%
Mezzanine
RankBook
runnerM/S
1 A 21.0%
2Daewoo Securities
15.5%
3 B 9.4%
39.8
164억9.7
4.2 6.7
20.5
18.4
21.9
7
6.4 5.5
18.9
8.9
4.5
6.2
3.0 3.6
12.9
FY07 FY08 1Q 2Q 3Q FY09 Acc.
ECM DCM Advisory67.2
42.8
13.615.8
22.9
52.3
11
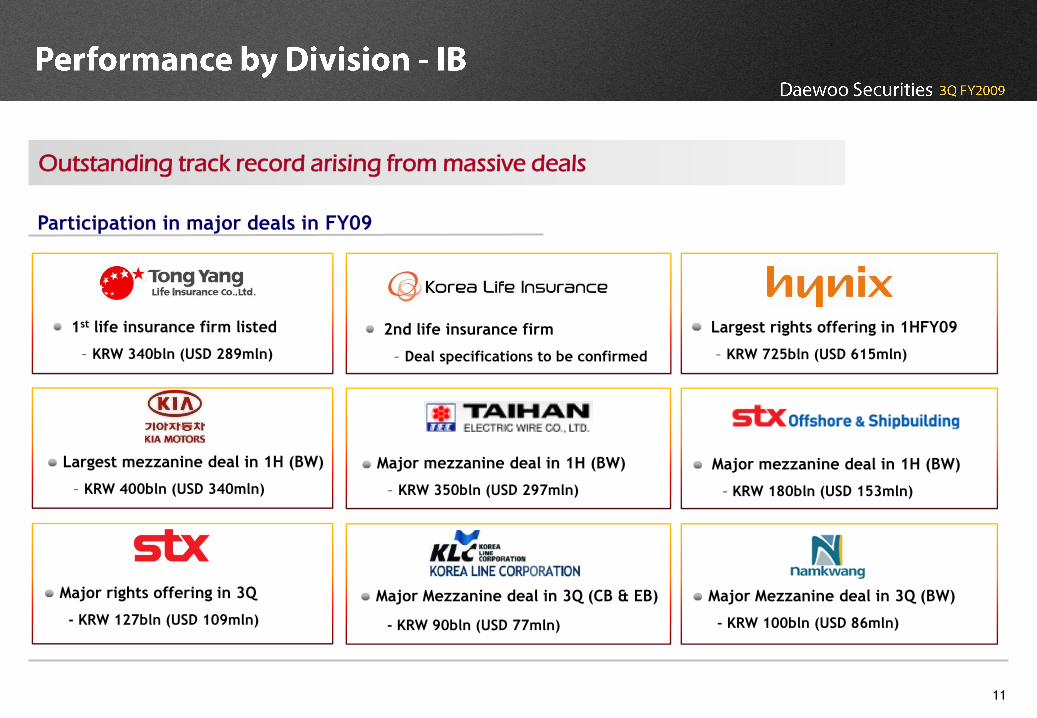
Outstanding track record arising from massive deals
Participation in major deals in FY09
1st life insurance firm listed
- KRW 340bln (USD 289mln)
2nd life insurance firm
- Deal specifications to be confirmed
Largest mezzanine deal in 1H (BW)
- KRW 400bln (USD 340mln)
Major mezzanine deal in 1H (BW)
- KRW 350bln (USD 297mln)
Major mezzanine deal in 1H (BW)
- KRW 180bln (USD 153mln)
Largest rights offering in 1HFY09
- KRW 725bln (USD 615mln)
Major rights offering in 3Q
- KRW 127bln (USD 109mln)
Major Mezzanine deal in 3Q (CB & EB)
- KRW 90bln (USD 77mln)
Major Mezzanine deal in 3Q (BW)
- KRW 100bln (USD 86mln)
12
90.6
9.3 18.4 19.4 9.7
47.5
92.2
167.3
56.6 31.2 58.9
146.7
FY07 FY08 1Q 2Q 3Q FY09 Acc.
Prop. Trading Fixed Income & OTC derivatives (Incl. interest)
182.8 176.6
50.668.675.0
194.2
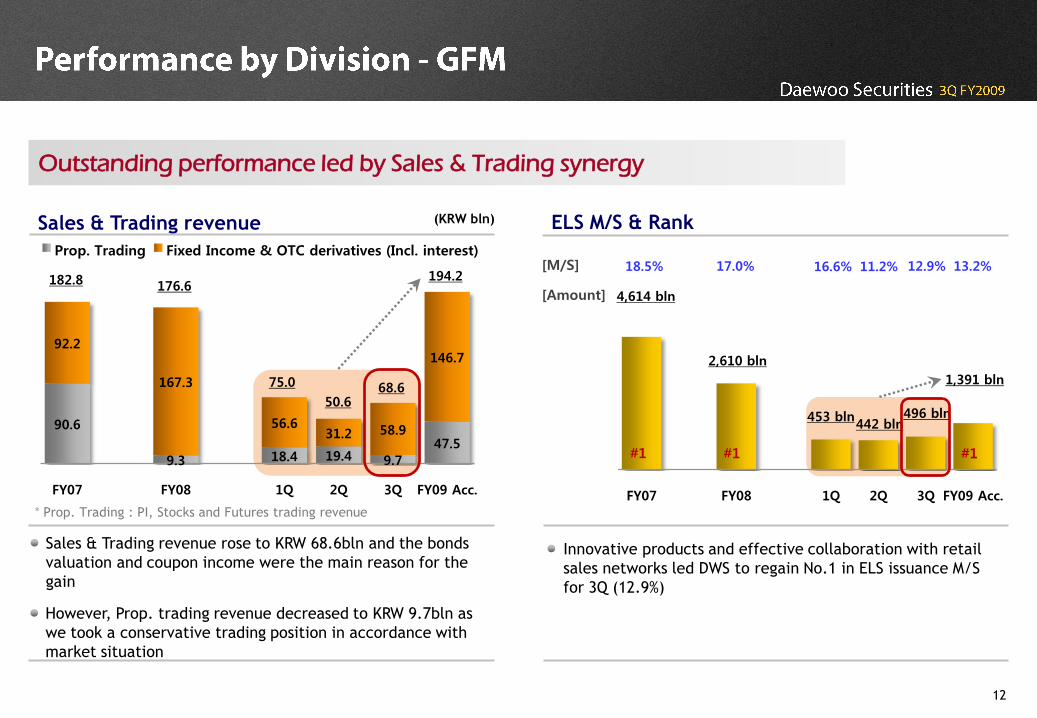
Outstanding performance led by Sales & Trading synergy
ELS M/S & RankSales & Trading revenue (KRW bln)
Sales & Trading revenue rose to KRW 68.6bln and the bonds
valuation and coupon income were the main reason for the
gain
Innovative products and effective collaboration with retail
sales networks led DWS to regain No.1 in ELS issuance M/S
for 3Q (12.9%)
However, Prop. trading revenue decreased to KRW 9.7bln as
we took a conservative trading position in accordance with
market situation
* Prop. Trading : PI, Stocks and Futures trading revenue
FY07 FY08 1Q 2Q 3Q FY09 Acc.
4,614 bln
2,610 bln
453 bln
1,391 bln
442 bln496 bln
[Amount]
[M/S] 18.5% 17.0% 16.6% 11.2% 12.9% 13.2%
#1 #1 #1
13
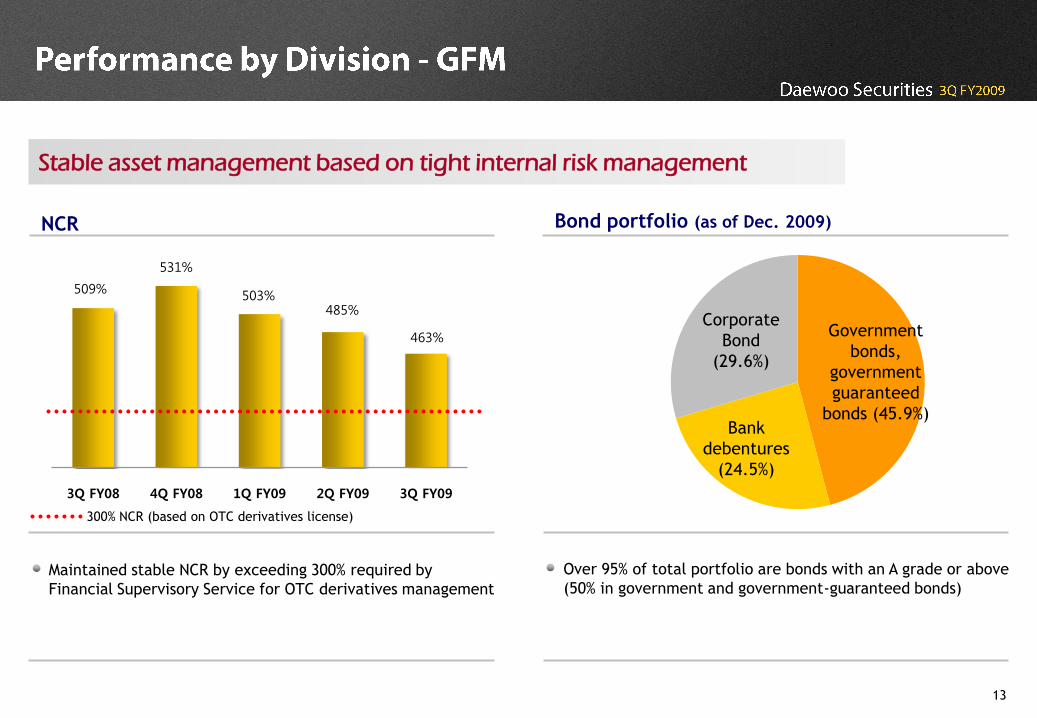
3Q FY08 4Q FY08 1Q FY09 2Q FY09 3Q FY09
Stable asset management based on tight internal risk management
300% NCR (based on OTC derivatives license)
NCR Bond portfolio (as of Dec. 2009)
Maintained stable NCR by exceeding 300% required by
Financial Supervisory Service for OTC derivatives management
Over 95% of total portfolio are bonds with an A grade or above
(50% in government and government-guaranteed bonds)
Government
bonds,
government
guaranteed
bonds (45.9%)Bank
debentures
(24.5%)
Corporate
Bond
(29.6%)
509%
531%
503%485%
463%
14
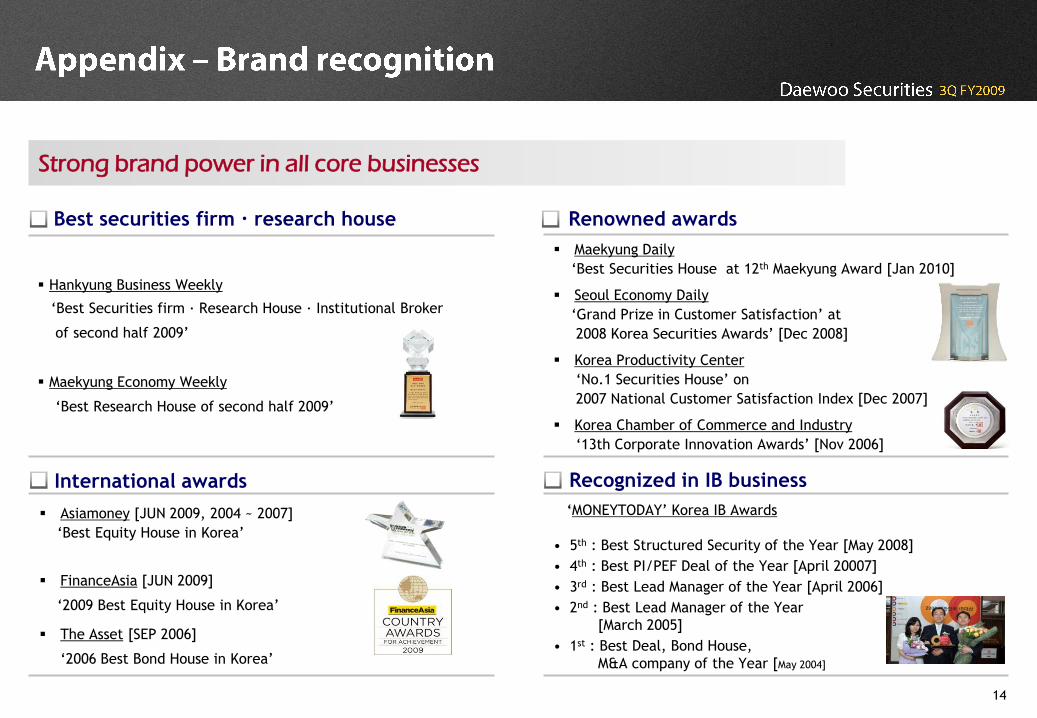
Strong brand power in all core businesses
‘MONEYTODAY’ Korea IB Awards
• 5th : Best Structured Security of the Year [May 2008]
• 4th : Best PI/PEF Deal of the Year [April 20007]
• 3rd : Best Lead Manager of the Year [April 2006]
• 2nd : Best Lead Manager of the Year
[March 2005]
• 1st : Best Deal, Bond House,
M&A company of the Year [May 2004]
Asiamoney [JUN 2009, 2004 ~ 2007]
‘Best Equity House in Korea’
FinanceAsia [JUN 2009]
‘2009 Best Equity House in Korea’
The Asset [SEP 2006]
‘2006 Best Bond House in Korea’
Renowned awards
Maekyung Daily
‘Best Securities House at 12th Maekyung Award [Jan 2010]
Seoul Economy Daily
‘Grand Prize in Customer Satisfaction’ at
2008 Korea Securities Awards’ [Dec 2008]
Korea Productivity Center
‘No.1 Securities House’ on
2007 National Customer Satisfaction Index [Dec 2007]
Korea Chamber of Commerce and Industry
‘13th Corporate Innovation Awards’ [Nov 2006]
Hankyung Business Weekly
‘Best Securities firm · Research House · Institutional Broker
of second half 2009’
Maekyung Economy Weekly
‘Best Research House of second half 2009’
Best securities firm · research house
International awards Recognized in IB business
15
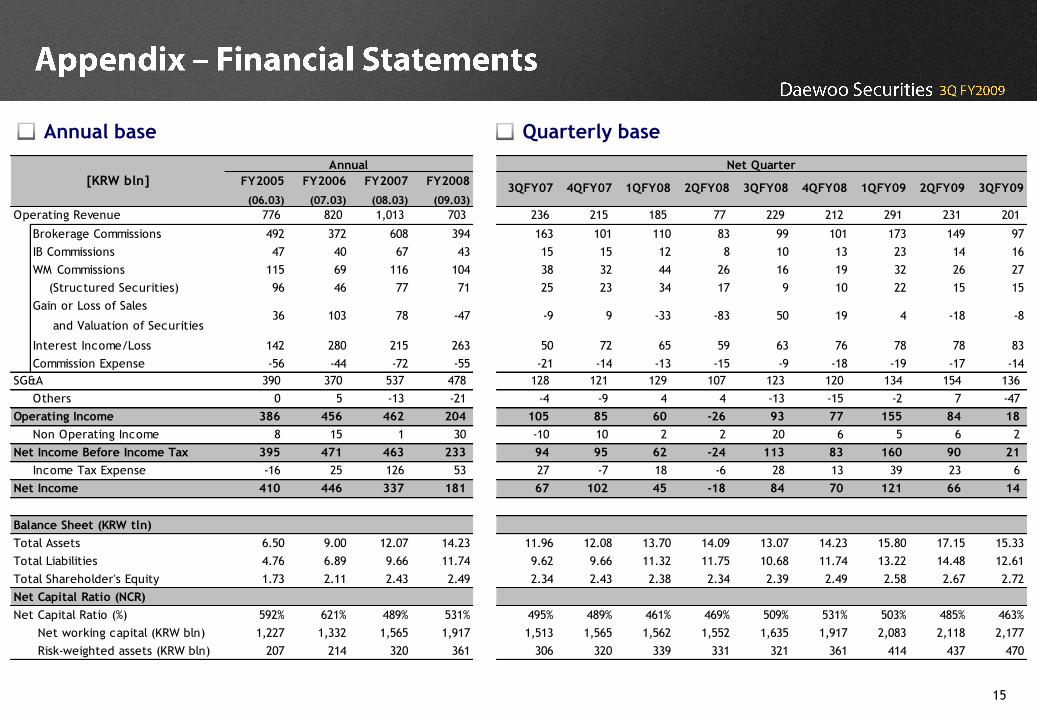
Annual base Quarterly base
FY2005
(06.03)
FY2006
(07.03)
FY2007
(08.03)
FY2008
(09.03)3QFY07 4QFY07 1QFY08 2QFY08 3QFY08 4QFY08 1QFY09 2QFY09 3QFY09
Operating Revenue 776 820 1,013 703 236 215 185 77 229 212 291 231 201
Brokerage Commissions 492 372 608 394 163 101 110 83 99 101 173 149 97
IB Commissions 47 40 67 43 15 15 12 8 10 13 23 14 16
WM Commissions 115 69 116 104 38 32 44 26 16 19 32 26 27
(Structured Securities) 96 46 77 71 25 23 34 17 9 10 22 15 15
Gain or Loss of Sales
and Valuation of Securities36 103 78 -47 -9 9 -33 -83 50 19 4 -18 -8
Interest Income/Loss 142 280 215 263 50 72 65 59 63 76 78 78 83
Commission Expense -56 -44 -72 -55 -21 -14 -13 -15 -9 -18 -19 -17 -14
SG&A 390 370 537 478 128 121 129 107 123 120 134 154 136
Others 0 5 -13 -21 -4 -9 4 4 -13 -15 -2 7 -47
Operating Income 386 456 462 204 105 85 60 -26 93 77 155 84 18
Non Operating Income 8 15 1 30 -10 10 2 2 20 6 5 6 2
Net Income Before Income Tax 395 471 463 233 94 95 62 -24 113 83 160 90 21
Income Tax Expense -16 25 126 53 27 -7 18 -6 28 13 39 23 6
Net Income 410 446 337 181 67 102 45 -18 84 70 121 66 14
6.50 9.00 12.07 14.23 11.96 12.08 13.70 14.09 13.07 14.23 15.80 17.15 15.33
4.76 6.89 9.66 11.74 9.62 9.66 11.32 11.75 10.68 11.74 13.22 14.48 12.61
1.73 2.11 2.43 2.49 2.34 2.43 2.38 2.34 2.39 2.49 2.58 2.67 2.72
592% 621% 489% 531% 495% 489% 461% 469% 509% 531% 503% 485% 463%
1,227 1,332 1,565 1,917 1,513 1,565 1,562 1,552 1,635 1,917 2,083 2,118 2,177
207 214 320 361 306 320 339 331 321 361 414 437 470
Net working capital (KRW bln)
Balance Sheet (KRW tln)
Total Assets
Total Liabilities
Risk-weighted assets (KRW bln)
[KRW bln]
Annual
Total Shareholder's Equity
Net Capital Ratio (NCR)
Net Capital Ratio (%)
Net Quarter

16
dwsec.com dwsec.com