homology modeling tutorial
TRANSCRIPT
Homology Modeling Tutorial Ho Chi Minh City, 12/01/2012
Emiliano Ippoliti: [email protected]
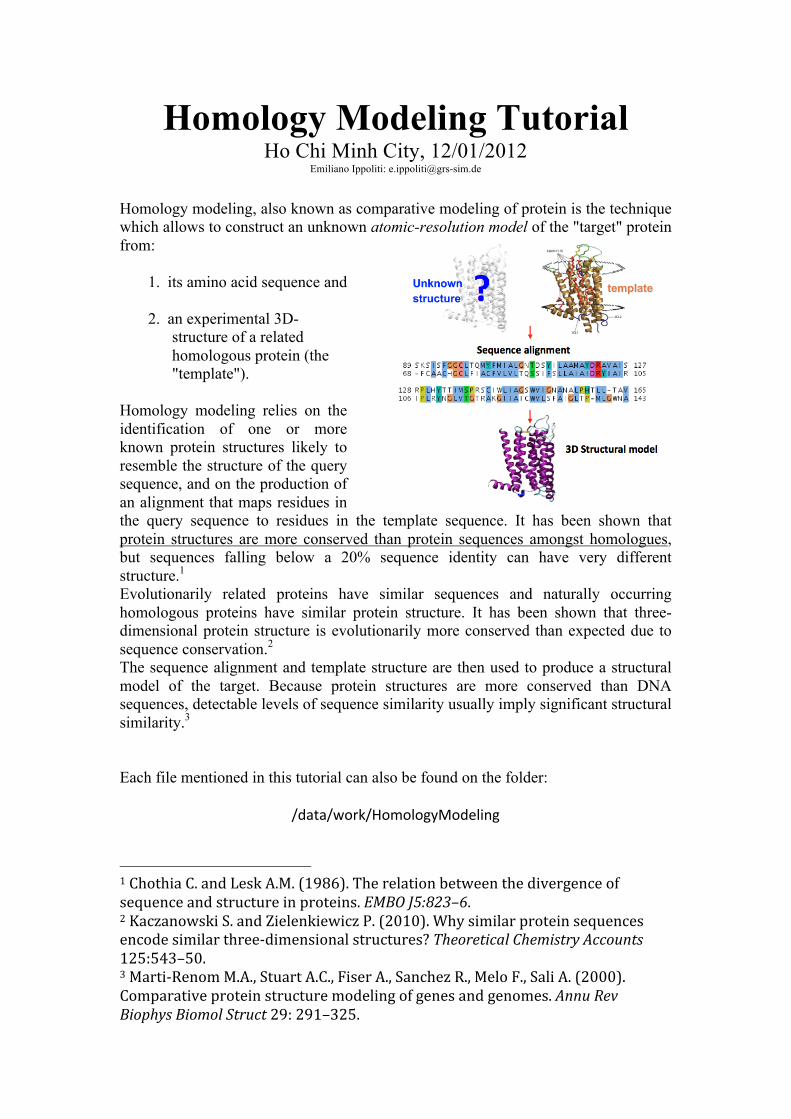
Homology modeling, also known as comparative modeling of protein is the technique which allows to construct an unknown atomic-resolution model of the "target" protein from:
1. its amino acid sequence and
2. an experimental 3D-structure of a related homologous protein (the "template").
Homology modeling relies on the identification of one or more known protein structures likely to resemble the structure of the query sequence, and on the production of an alignment that maps residues in the query sequence to residues in the template sequence. It has been shown that protein structures are more conserved than protein sequences amongst homologues, but sequences falling below a 20% sequence identity can have very different structure.1 Evolutionarily related proteins have similar sequences and naturally occurring homologous proteins have similar protein structure. It has been shown that three-dimensional protein structure is evolutionarily more conserved than expected due to sequence conservation.2 The sequence alignment and template structure are then used to produce a structural model of the target. Because protein structures are more conserved than DNA sequences, detectable levels of sequence similarity usually imply significant structural similarity.3 Each file mentioned in this tutorial can also be found on the folder:
/data/work/HomologyModeling
1 Chothia C. and Lesk A.M. (1986). The relation between the divergence of sequence and structure in proteins. EMBO J5:823–6. 2 Kaczanowski S. and Zielenkiewicz P. (2010). Why similar protein sequences encode similar three-‐dimensional structures? Theoretical Chemistry Accounts 125:543–50. 3 Marti-‐Renom M.A., Stuart A.C., Fiser A., Sanchez R., Melo F., Sali A. (2000). Comparative protein structure modeling of genes and genomes. Annu Rev Biophys Biomol Struct 29: 291–325.
To do your tests and exercises, work in your own folder that you can create in the directory:
/data/work
by the command:
mkdir /data/work/your_name/ Inside this directory create the folder for this tutorial:
mkdir /data/work/your_name/hm_practice Then go to this folder:
cd /data/work/your_name/hm_practice
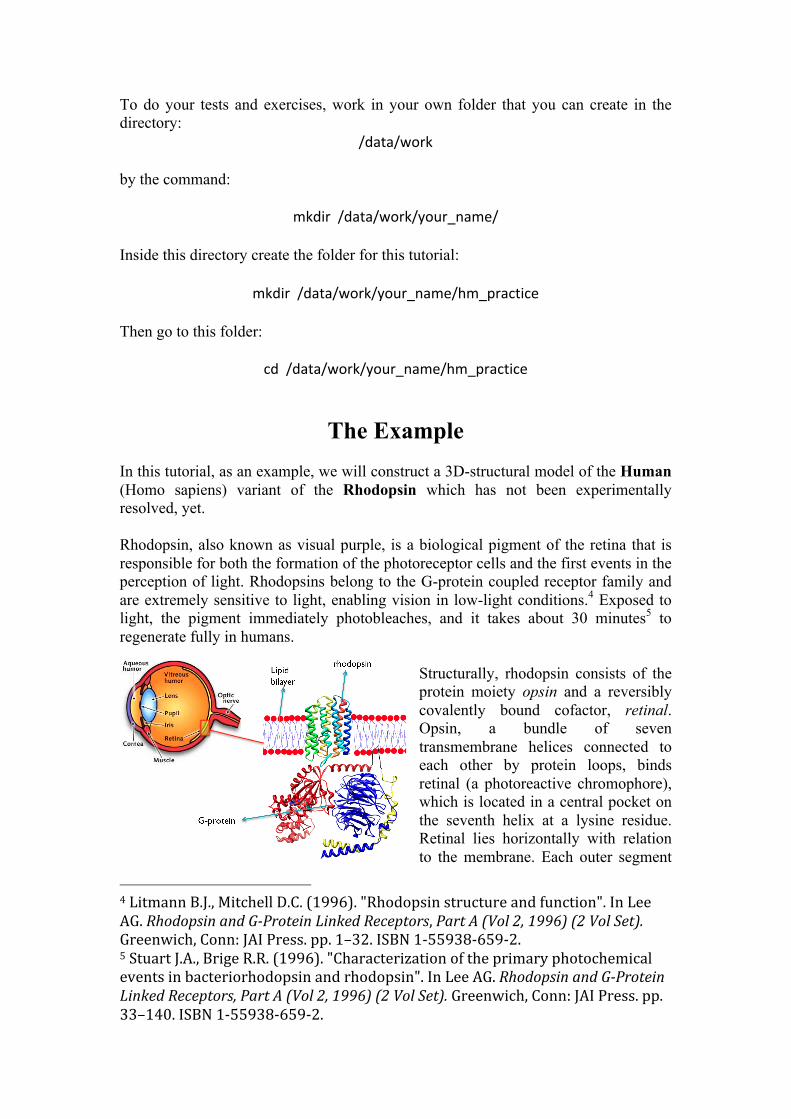
The Example In this tutorial, as an example, we will construct a 3D-structural model of the Human (Homo sapiens) variant of the Rhodopsin which has not been experimentally resolved, yet. Rhodopsin, also known as visual purple, is a biological pigment of the retina that is responsible for both the formation of the photoreceptor cells and the first events in the perception of light. Rhodopsins belong to the G-protein coupled receptor family and are extremely sensitive to light, enabling vision in low-light conditions.4 Exposed to light, the pigment immediately photobleaches, and it takes about 30 minutes5 to regenerate fully in humans.
Structurally, rhodopsin consists of the protein moiety opsin and a reversibly covalently bound cofactor, retinal. Opsin, a bundle of seven transmembrane helices connected to each other by protein loops, binds retinal (a photoreactive chromophore), which is located in a central pocket on the seventh helix at a lysine residue. Retinal lies horizontally with relation to the membrane. Each outer segment
4 Litmann B.J., Mitchell D.C. (1996). "Rhodopsin structure and function". In Lee AG. Rhodopsin and G-Protein Linked Receptors, Part A (Vol 2, 1996) (2 Vol Set). Greenwich, Conn: JAI Press. pp. 1–32. ISBN 1-‐55938-‐659-‐2. 5 Stuart J.A., Brige R.R. (1996). "Characterization of the primary photochemical events in bacteriorhodopsin and rhodopsin". In Lee AG. Rhodopsin and G-Protein Linked Receptors, Part A (Vol 2, 1996) (2 Vol Set). Greenwich, Conn: JAI Press. pp. 33–140. ISBN 1-‐55938-‐659-‐2.
disc contains thousands of visual pigment molecules. About half the opsin is within the lipid bilayer. Retinal is produced in the retina from Vitamin A, from dietary beta-carotene. Isomerization of 11-cis-retinal into all-trans-retinal by light induces a conformational change (bleaching) in opsin continuing with metarhodopsin II, which activates the associated G protein transducin and triggers a second messenger cascade.5,6,7 EXERCISES:
1. Go to the Protein Data Bank website http://www.rcsb.org/ and download the pdb file of the Bovine variant of the rhodopsin.
2. Use VMD visualization program: http://www.ks.uiuc.edu/Research/vmd/ also installed on your workstation:
vmd PDB_code.pdb to identify all the secondary structure features of the protein mentioned above, and the retinal.
3. Are there other partial structures beyond the rhodopsin one in the pdb file? What do they represent?
Several closely related opsins exist that differ only in a few amino acids and in the wavelengths of light that they absorb most strongly. Humans have four different other opsins beside rhodopsin. The photopsins are found in the different types of the cone cells of the retina and are the basis of color vision. They have absorption maxima for yellowish-green (photopsin I), green (photopsin II), and bluish-violet (photopsin III) light. The remaining opsin (melanopsin) is found in photosensitive ganglion cells and absorbs blue light most strongly. Recent data supports that it is a functional monomer as opposed to a dimer, which was the paradigm of G-coupled protein receptors for many years.8 6 Hofmann K.P., Heck M. (1996). "Light-‐induced protein-‐protein interactions on the rod photoreceptor disc membrane". In Lee AG. Rhodopsin and G-Protein Linked Receptors, Part A (Vol 2, 1996) (2 Vol Set). Greenwich, Conn: JAI Press. pp. 141–198. ISBN 1-‐55938-‐659-‐2. 7 Kolb H., Fernandez E., Nelson R., Jones B.W. (2010-‐03-‐01). "Webvision: Photoreceptors": http://webvision.med.utah.edu/book/part-‐ii-‐anatomy-‐and-‐physiology-‐of-‐the-‐retina/photoreceptors/. University of Utah. 8 Chabre M., le Maire M. (July 2005). "Monomeric G-‐protein-‐coupled receptor as a functional unit". Biochemistry 44 (27): 9395–403. doi:10.1021/bi050720o. PMID 15996094.
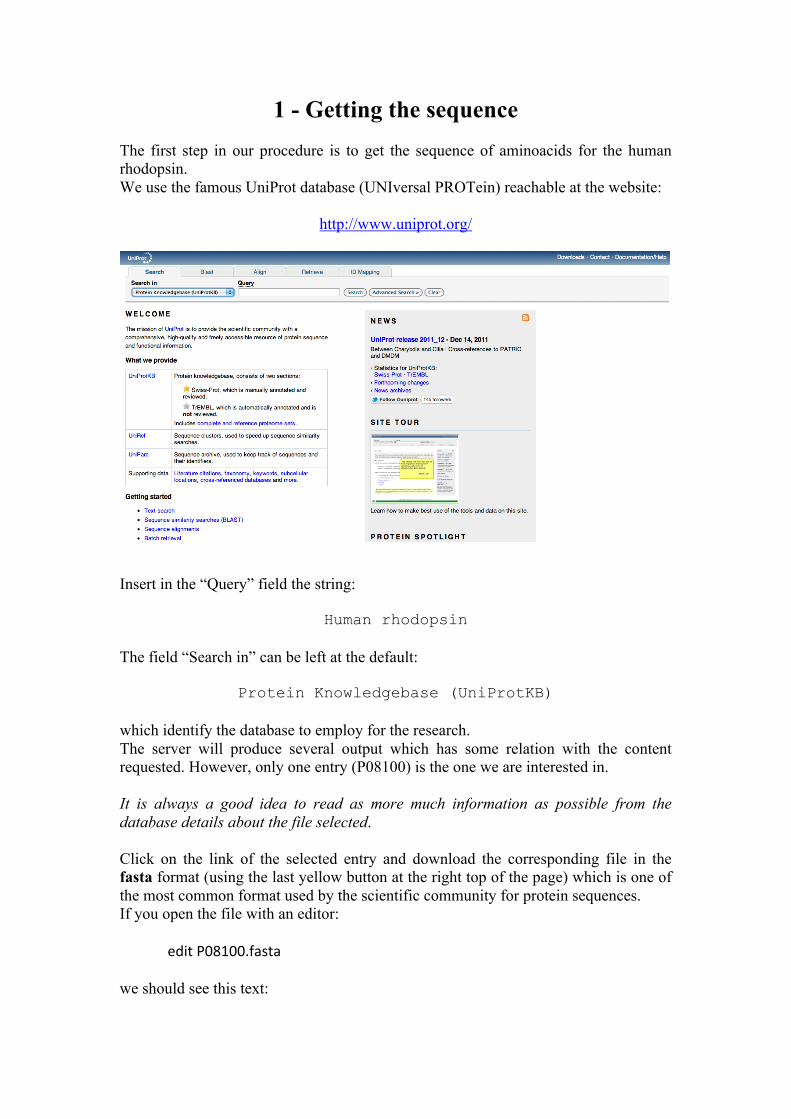
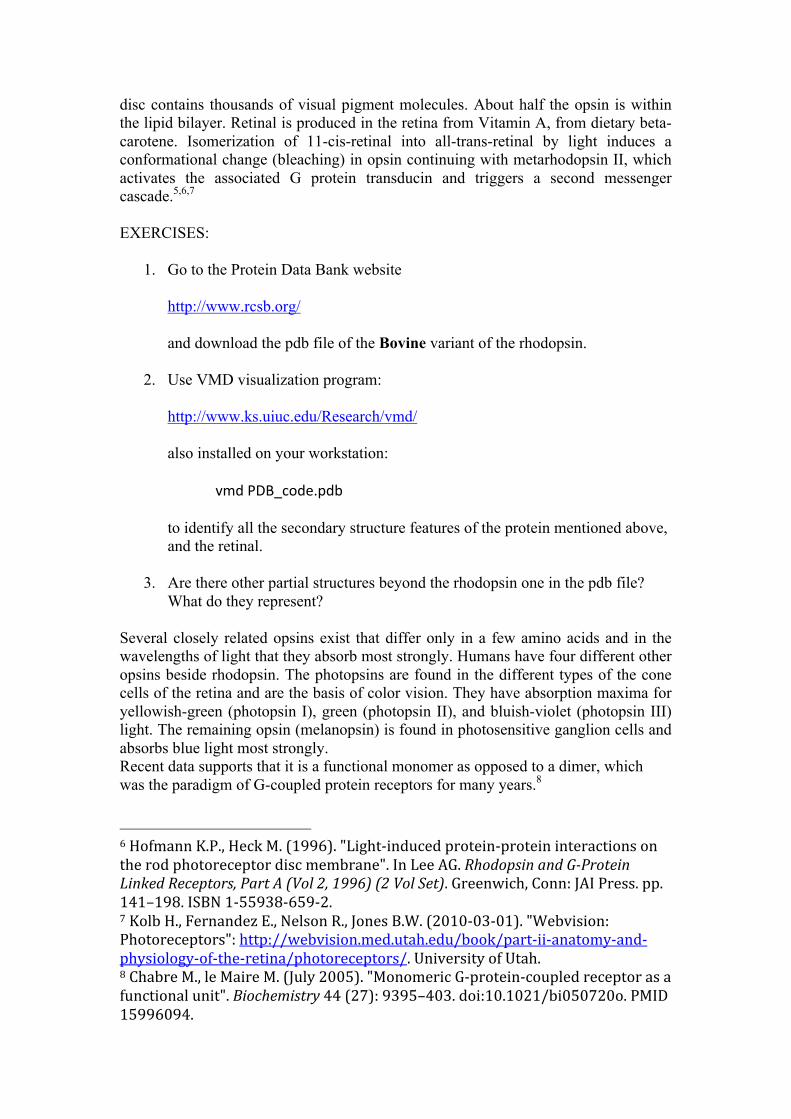
1 - Getting the sequence The first step in our procedure is to get the sequence of aminoacids for the human rhodopsin. We use the famous UniProt database (UNIversal PROTein) reachable at the website:
http://www.uniprot.org/
Insert in the “Query” field the string:
Human rhodopsin
The field “Search in” can be left at the default:
Protein Knowledgebase (UniProtKB)
which identify the database to employ for the research. The server will produce several output which has some relation with the content requested. However, only one entry (P08100) is the one we are interested in. It is always a good idea to read as more much information as possible from the database details about the file selected. Click on the link of the selected entry and download the corresponding file in the fasta format (using the last yellow button at the right top of the page) which is one of the most common format used by the scientific community for protein sequences. If you open the file with an editor: edit P08100.fasta we should see this text:
>sp|P08100|OPSD_HUMAN Rhodopsin OS=Homo sapiens GN=RHO PE=1 SV=1 MNGTEGPNFYVPFSNATGVVRSPFEYPQYYLAEPWQFSMLAAYMFLLIVLGFPINFLTLY VTVQHKKLRTPLNYILLNLAVADLFMVLGGFTSTLYTSLHGYFVFGPTGCNLEGFFATLG GEIALWSLVVLAIERYVVVCKPMSNFRFGENHAIMGVAFTWVMALACAAPPLAGWSRYIP EGLQCSCGIDYYTLKPEVNNESFVIYMFVVHFTIPMIIIFFCYGQLVFTVKEAAAQQQES ATTQKAEKEVTRMVIIMVIAFLICWVPYASVAFYIFTHQGSNFGPIFMTIPAFFAKSAAI YNPVIYIMMNKQFRNCMLTTICCGKNPLGDDEASATVSKTETSQVAPA
The first line after the symbol “>” is a comment which specify relevant information about the sequence. The rest of the lines are the aminoacidic sequence in the single-letter code:
• G - Glycine (Gly) • P - Proline (Pro) • A - Alanine (Ala) • V - Valine (Val) • L - Leucine (Leu) • I - Isoleucine (Ile) • M - Methionine (Met) • C - Cysteine (Cys) • F - Phenylalanine (Phe) • Y - Tyrosine (Tyr) • W - Tryptophan (Trp) • H - Histidine (His) • K - Lysine (Lys) • R - Arginine (Arg) • Q - Glutamine (Gln) • N - Asparagine (Asn) • E - Glutamic Acid (Glu) • D - Aspartic Acid (Asp) • S - Serine (Ser) • T - Threonine (Thr)
2 – Template selection The second step is to find a protein whose 3D-structure is known and that is as most similar as possible to our target regarding their aminoacid sequence: the procedure is called sequence alignment. One of the most widely used algorithms for comparing primary biological sequences, such as aminoacid sequences, is BLAST (Basic Local Alignment Search Tool). A BLAST search enables a researcher to compare a query sequence with a library or database of sequences, and identify library sequences that resemble the query sequence above a certain threshold. We can do a BLAST search online by exploiting the webserver:
http://blast.ncbi.nlm.nih.gov/Blast.cgi In particular click on the “protein blast” link to restrict the search on the protein database:
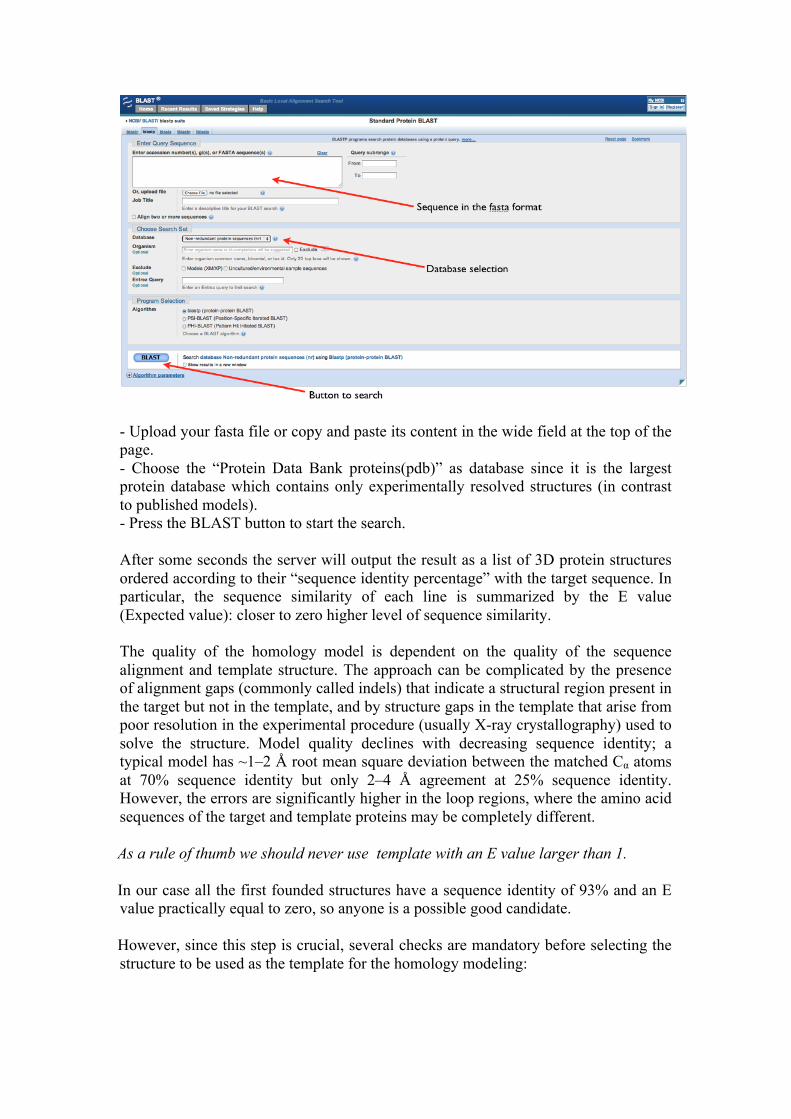
- Upload your fasta file or copy and paste its content in the wide field at the top of the page. - Choose the “Protein Data Bank proteins(pdb)” as database since it is the largest protein database which contains only experimentally resolved structures (in contrast to published models). - Press the BLAST button to start the search.
After some seconds the server will output the result as a list of 3D protein structures ordered according to their “sequence identity percentage” with the target sequence. In particular, the sequence similarity of each line is summarized by the E value (Expected value): closer to zero higher level of sequence similarity. The quality of the homology model is dependent on the quality of the sequence alignment and template structure. The approach can be complicated by the presence of alignment gaps (commonly called indels) that indicate a structural region present in the target but not in the template, and by structure gaps in the template that arise from poor resolution in the experimental procedure (usually X-ray crystallography) used to solve the structure. Model quality declines with decreasing sequence identity; a typical model has ~1–2 Å root mean square deviation between the matched Cα atoms at 70% sequence identity but only 2–4 Å agreement at 25% sequence identity. However, the errors are significantly higher in the loop regions, where the amino acid sequences of the target and template proteins may be completely different. As a rule of thumb we should never use template with an E value larger than 1. In our case all the first founded structures have a sequence identity of 93% and an E value practically equal to zero, so anyone is a possible good candidate. However, since this step is crucial, several checks are mandatory before selecting the structure to be used as the template for the homology modeling:
• Is an X-ray crystallography structure (NMR structure are usually much less resolved)?
• All the atoms are resolved in the selected structure? • Is the chosen structure the best resolved one (typical good resolution is smaller
than 2Å for membrane protein as rhodopsin and 1Å for the other proteins) among the structures with the same E value?
• … This implies a careful inspection of each candidate structure with a visualization program as VMD. Note that inside the webpage associated to any BLAST result entry you can ask for the list of all the structures corresponding to the same sequence. This way for each structure you can identify the best resolved one, etc. To do so, click on the link “Identical Proteins”. However, with this procedure also results from other databases are reported. Therefore, you should take into account only the experimentally resolved 3D structures as opposed to models. Moreover, you should always read the articles associated to the structures (retrievable from the database) to understand all the conditions and the limitations related with them. Finally, we suggest also to try another search tool for cross-checking. A suggestion could be the HHsearch server:
http://toolkit.tuebingen.mpg.de/hhpred When the template structure is identified, download the corresponding pdb file in your folder or through the BLAST website or searching it on the PDB website. EXERCISES:
1. Select the most appropriate template for the homology modeling of the human rhodopsin.
2. Why did you choose it?
3 – Sequence alignment To create the model (with the procedure in the next chapter) we need a sequence alignment file (.aln file) between our target and the selected template sequence. To this aim, we will use another online server, the multiple sequence alignment ClustalW2:
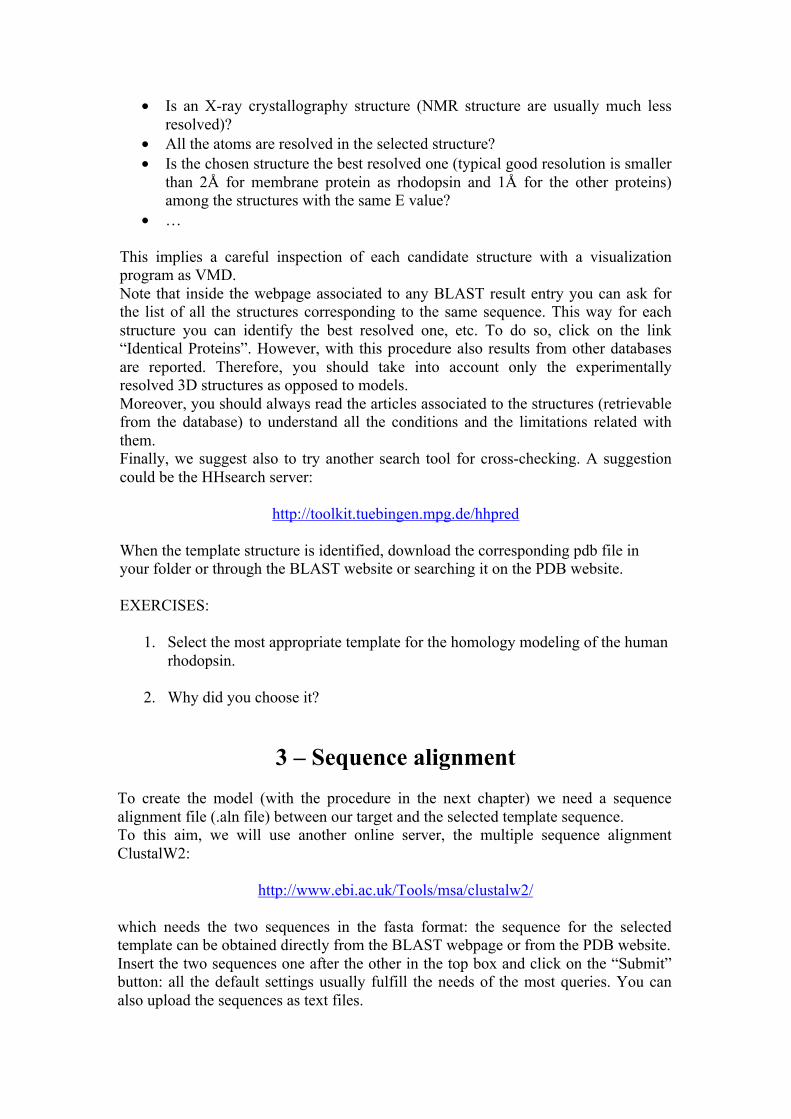
http://www.ebi.ac.uk/Tools/msa/clustalw2/ which needs the two sequences in the fasta format: the sequence for the selected template can be obtained directly from the BLAST webpage or from the PDB website. Insert the two sequences one after the other in the top box and click on the “Submit” button: all the default settings usually fulfill the needs of the most queries. You can also upload the sequences as text files.
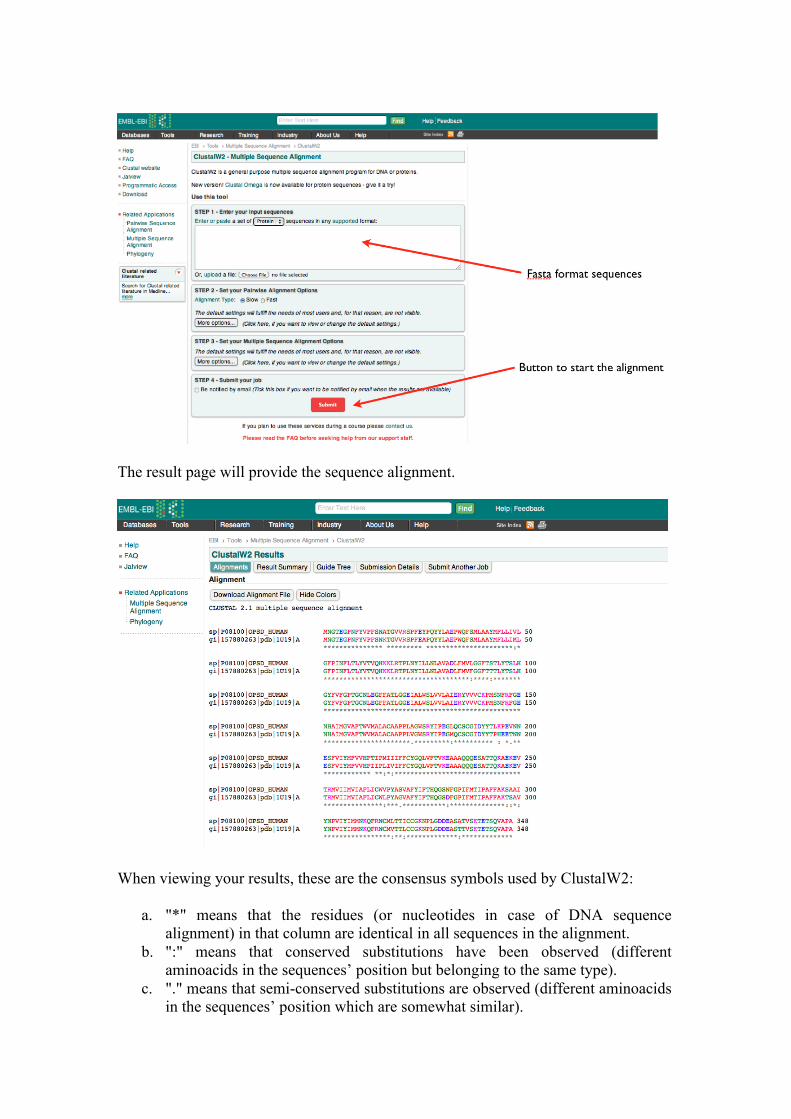
The result page will provide the sequence alignment.
When viewing your results, these are the consensus symbols used by ClustalW2:
a. "*" means that the residues (or nucleotides in case of DNA sequence alignment) in that column are identical in all sequences in the alignment.
b. ":" means that conserved substitutions have been observed (different aminoacids in the sequences’ position but belonging to the same type).
c. "." means that semi-conserved substitutions are observed (different aminoacids in the sequences’ position which are somewhat similar).
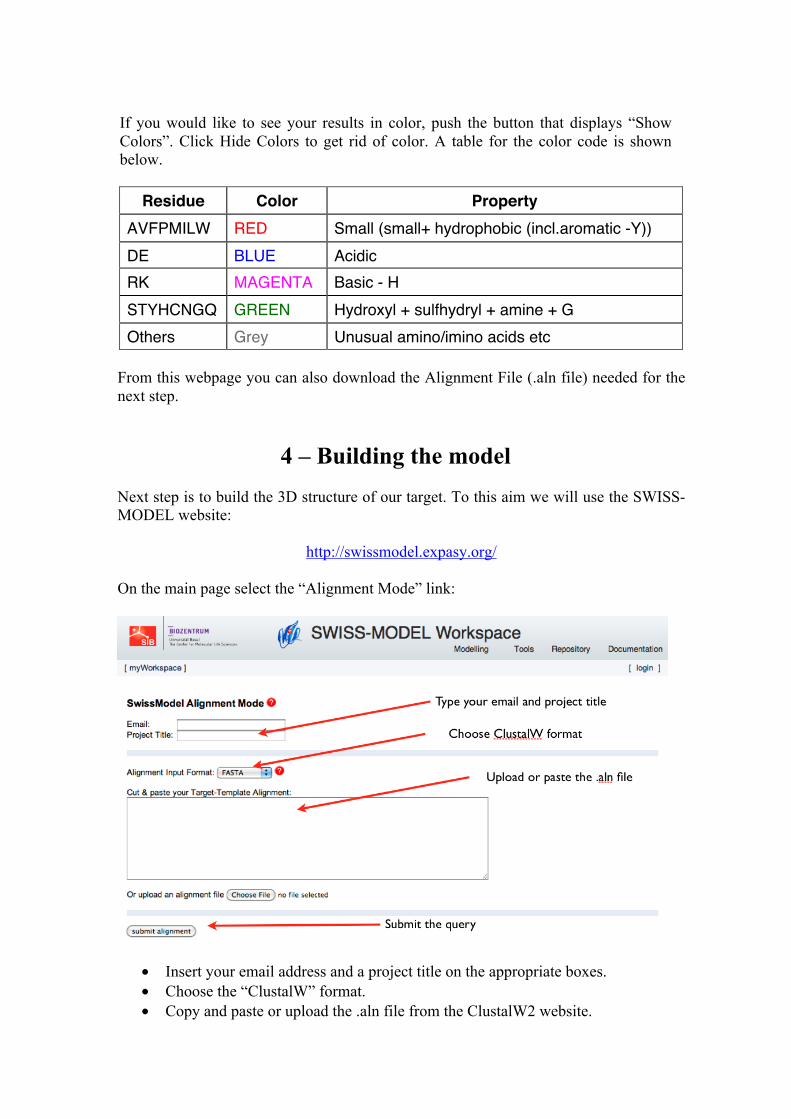
If you would like to see your results in color, push the button that displays “Show Colors”. Click Hide Colors to get rid of color. A table for the color code is shown below.
Residue Color Property AVFPMILW RED Small (small+ hydrophobic (incl.aromatic -Y)) DE BLUE Acidic RK MAGENTA Basic - H STYHCNGQ GREEN Hydroxyl + sulfhydryl + amine + G Others Grey Unusual amino/imino acids etc
From this webpage you can also download the Alignment File (.aln file) needed for the next step.
4 – Building the model Next step is to build the 3D structure of our target. To this aim we will use the SWISS-MODEL website:
http://swissmodel.expasy.org/ On the main page select the “Alignment Mode” link:
• Insert your email address and a project title on the appropriate boxes. • Choose the “ClustalW” format. • Copy and paste or upload the .aln file from the ClustalW2 website.
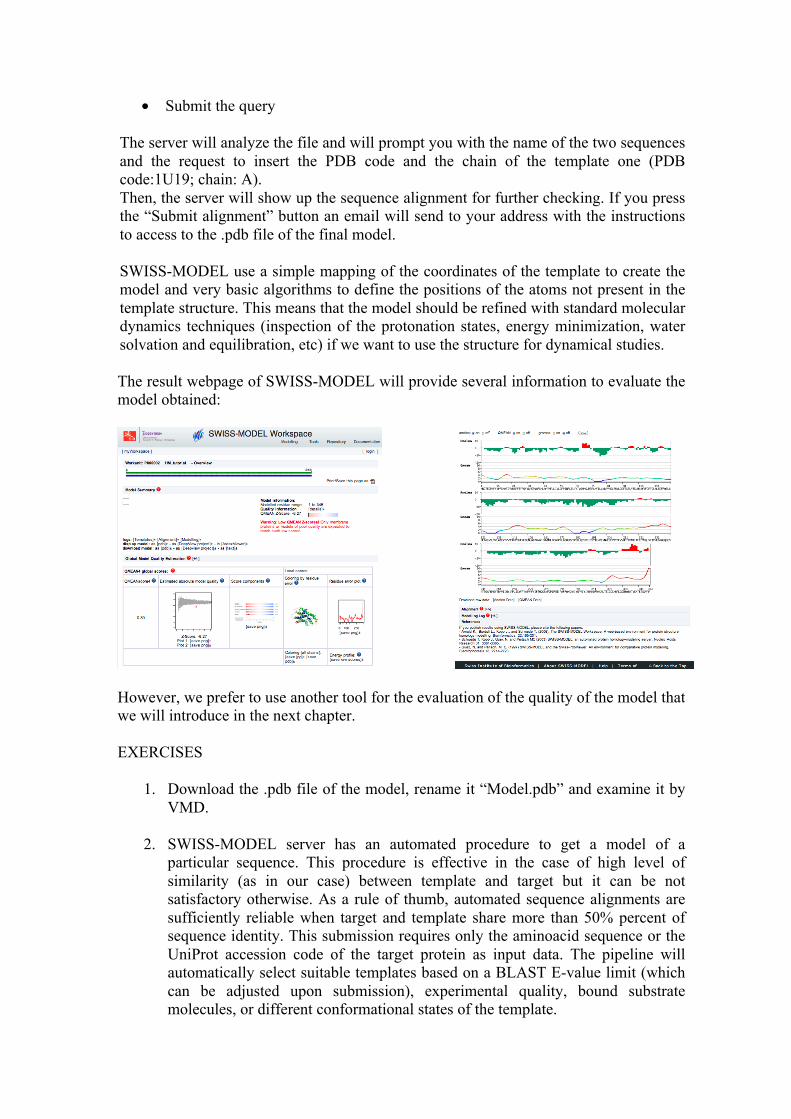
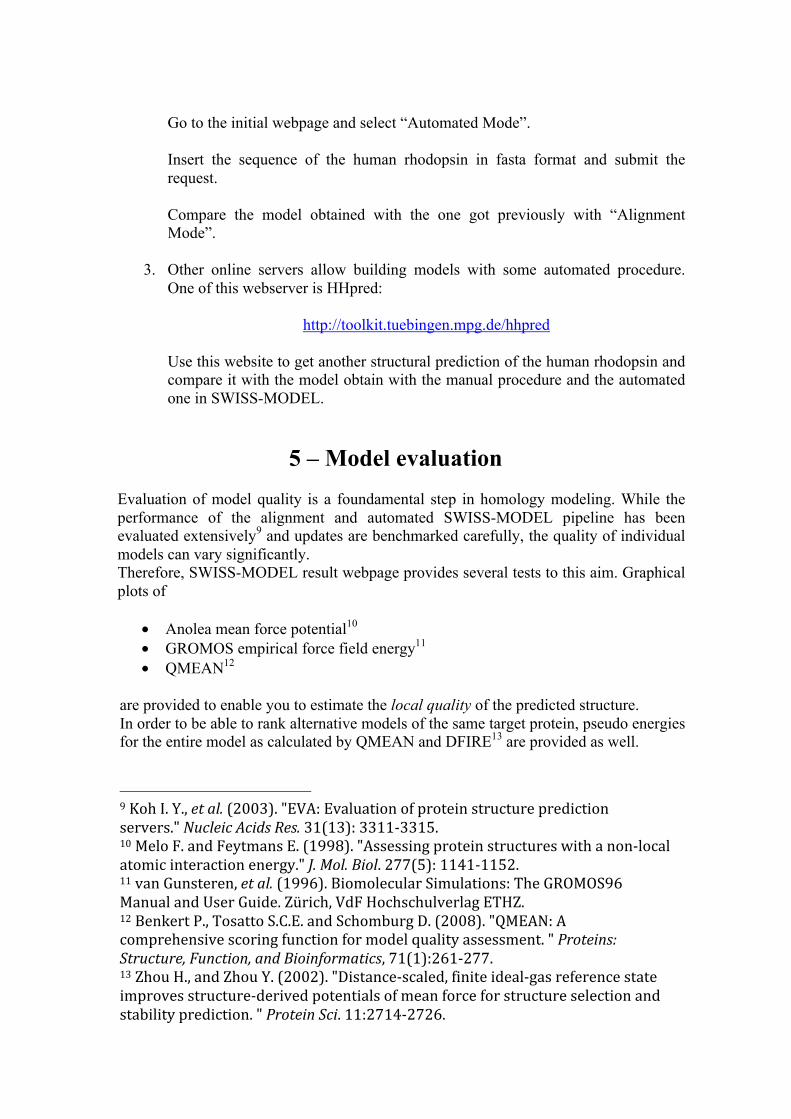
• Submit the query The server will analyze the file and will prompt you with the name of the two sequences and the request to insert the PDB code and the chain of the template one (PDB code:1U19; chain: A). Then, the server will show up the sequence alignment for further checking. If you press the “Submit alignment” button an email will send to your address with the instructions to access to the .pdb file of the final model. SWISS-MODEL use a simple mapping of the coordinates of the template to create the model and very basic algorithms to define the positions of the atoms not present in the template structure. This means that the model should be refined with standard molecular dynamics techniques (inspection of the protonation states, energy minimization, water solvation and equilibration, etc) if we want to use the structure for dynamical studies. The result webpage of SWISS-MODEL will provide several information to evaluate the model obtained:
However, we prefer to use another tool for the evaluation of the quality of the model that we will introduce in the next chapter. EXERCISES
1. Download the .pdb file of the model, rename it “Model.pdb” and examine it by VMD.
2. SWISS-MODEL server has an automated procedure to get a model of a particular sequence. This procedure is effective in the case of high level of similarity (as in our case) between template and target but it can be not satisfactory otherwise. As a rule of thumb, automated sequence alignments are sufficiently reliable when target and template share more than 50% percent of sequence identity. This submission requires only the aminoacid sequence or the UniProt accession code of the target protein as input data. The pipeline will automatically select suitable templates based on a BLAST E-value limit (which can be adjusted upon submission), experimental quality, bound substrate molecules, or different conformational states of the template.
Go to the initial webpage and select “Automated Mode”. Insert the sequence of the human rhodopsin in fasta format and submit the request. Compare the model obtained with the one got previously with “Alignment Mode”.
3. Other online servers allow building models with some automated procedure. One of this webserver is HHpred:
http://toolkit.tuebingen.mpg.de/hhpred Use this website to get another structural prediction of the human rhodopsin and compare it with the model obtain with the manual procedure and the automated one in SWISS-MODEL.
5 – Model evaluation
Evaluation of model quality is a foundamental step in homology modeling. While the performance of the alignment and automated SWISS-MODEL pipeline has been evaluated extensively9 and updates are benchmarked carefully, the quality of individual models can vary significantly. Therefore, SWISS-MODEL result webpage provides several tests to this aim. Graphical plots of
• Anolea mean force potential10 • GROMOS empirical force field energy11 • QMEAN12
are provided to enable you to estimate the local quality of the predicted structure. In order to be able to rank alternative models of the same target protein, pseudo energies for the entire model as calculated by QMEAN and DFIRE13 are provided as well.
9 Koh I. Y., et al. (2003). "EVA: Evaluation of protein structure prediction servers." Nucleic Acids Res. 31(13): 3311-‐3315. 10 Melo F. and Feytmans E. (1998). "Assessing protein structures with a non-‐local atomic interaction energy." J. Mol. Biol. 277(5): 1141-‐1152. 11 van Gunsteren, et al. (1996). Biomolecular Simulations: The GROMOS96 Manual and User Guide. Zürich, VdF Hochschulverlag ETHZ. 12 Benkert P., Tosatto S.C.E. and Schomburg D. (2008). "QMEAN: A comprehensive scoring function for model quality assessment. " Proteins: Structure, Function, and Bioinformatics, 71(1):261-‐277. 13 Zhou H., and Zhou Y. (2002). "Distance-‐scaled, finite ideal-‐gas reference state improves structure-‐derived potentials of mean force for structure selection and stability prediction. " Protein Sci. 11:2714-‐2726.
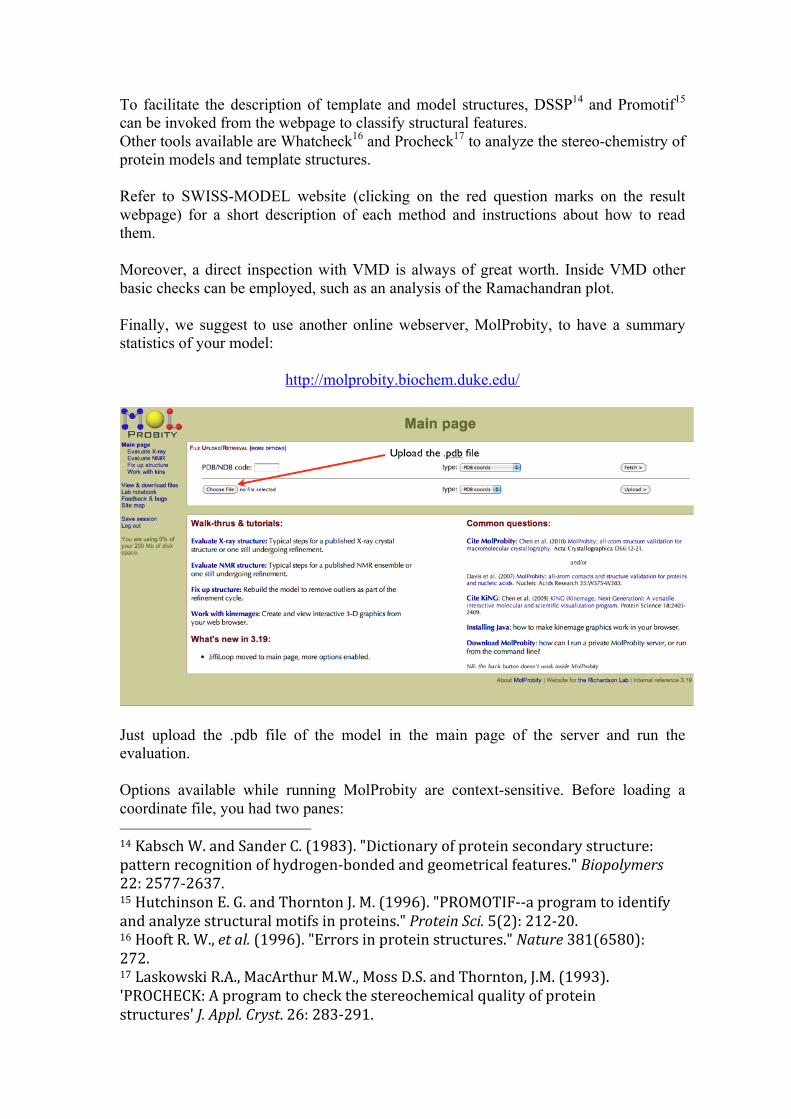
To facilitate the description of template and model structures, DSSP14 and Promotif15 can be invoked from the webpage to classify structural features. Other tools available are Whatcheck16 and Procheck17 to analyze the stereo-chemistry of protein models and template structures. Refer to SWISS-MODEL website (clicking on the red question marks on the result webpage) for a short description of each method and instructions about how to read them. Moreover, a direct inspection with VMD is always of great worth. Inside VMD other basic checks can be employed, such as an analysis of the Ramachandran plot. Finally, we suggest to use another online webserver, MolProbity, to have a summary statistics of your model:
http://molprobity.biochem.duke.edu/
Just upload the .pdb file of the model in the main page of the server and run the evaluation. Options available while running MolProbity are context-sensitive. Before loading a coordinate file, you had two panes: 14 Kabsch W. and Sander C. (1983). "Dictionary of protein secondary structure: pattern recognition of hydrogen-‐bonded and geometrical features." Biopolymers 22: 2577-‐2637. 15 Hutchinson E. G. and Thornton J. M. (1996). "PROMOTIF-‐-‐a program to identify and analyze structural motifs in proteins." Protein Sci. 5(2): 212-‐20. 16 Hooft R. W., et al. (1996). "Errors in protein structures." Nature 381(6580): 272. 17 Laskowski R.A., MacArthur M.W., Moss D.S. and Thornton, J.M. (1993). 'PROCHECK: A program to check the stereochemical quality of protein structures' J. Appl. Cryst. 26: 283-‐291.
• "File Upload/Retrieval" • MolProbity information
after loading the .pdb file of the model, you also have
• a "Suggested Tools" pane to work on the indicated coordinate file • a "Recently Generated Results" pane to manage the files in your work area
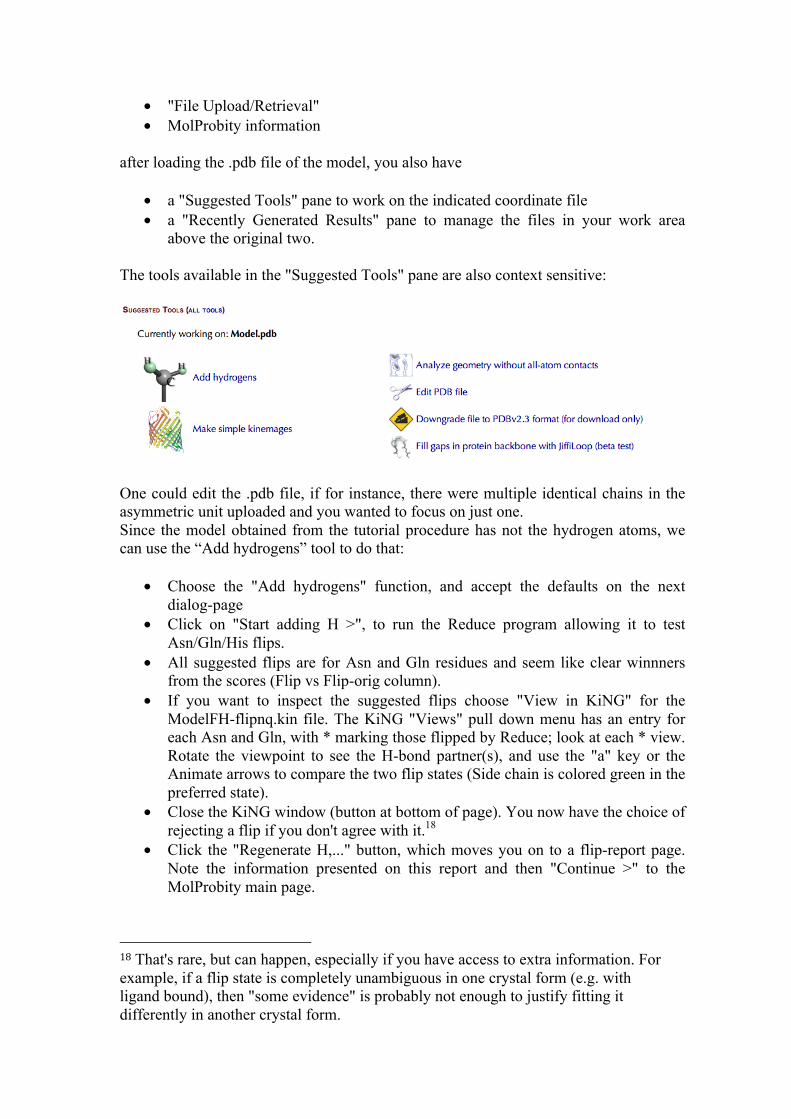
above the original two. The tools available in the "Suggested Tools" pane are also context sensitive:
One could edit the .pdb file, if for instance, there were multiple identical chains in the asymmetric unit uploaded and you wanted to focus on just one. Since the model obtained from the tutorial procedure has not the hydrogen atoms, we can use the “Add hydrogens” tool to do that:
• Choose the "Add hydrogens" function, and accept the defaults on the next dialog-page
• Click on "Start adding H >", to run the Reduce program allowing it to test Asn/Gln/His flips.
• All suggested flips are for Asn and Gln residues and seem like clear winnners from the scores (Flip vs Flip-orig column).
• If you want to inspect the suggested flips choose "View in KiNG" for the ModelFH-flipnq.kin file. The KiNG "Views" pull down menu has an entry for each Asn and Gln, with * marking those flipped by Reduce; look at each * view. Rotate the viewpoint to see the H-bond partner(s), and use the "a" key or the Animate arrows to compare the two flip states (Side chain is colored green in the preferred state).
• Close the KiNG window (button at bottom of page). You now have the choice of rejecting a flip if you don't agree with it.18
• Click the "Regenerate H,..." button, which moves you on to a flip-report page. Note the information presented on this report and then "Continue >" to the MolProbity main page.
18 That's rare, but can happen, especially if you have access to extra information. For example, if a flip state is completely unambiguous in one crystal form (e.g. with ligand bound), then "some evidence" is probably not enough to justify fitting it differently in another crystal form.
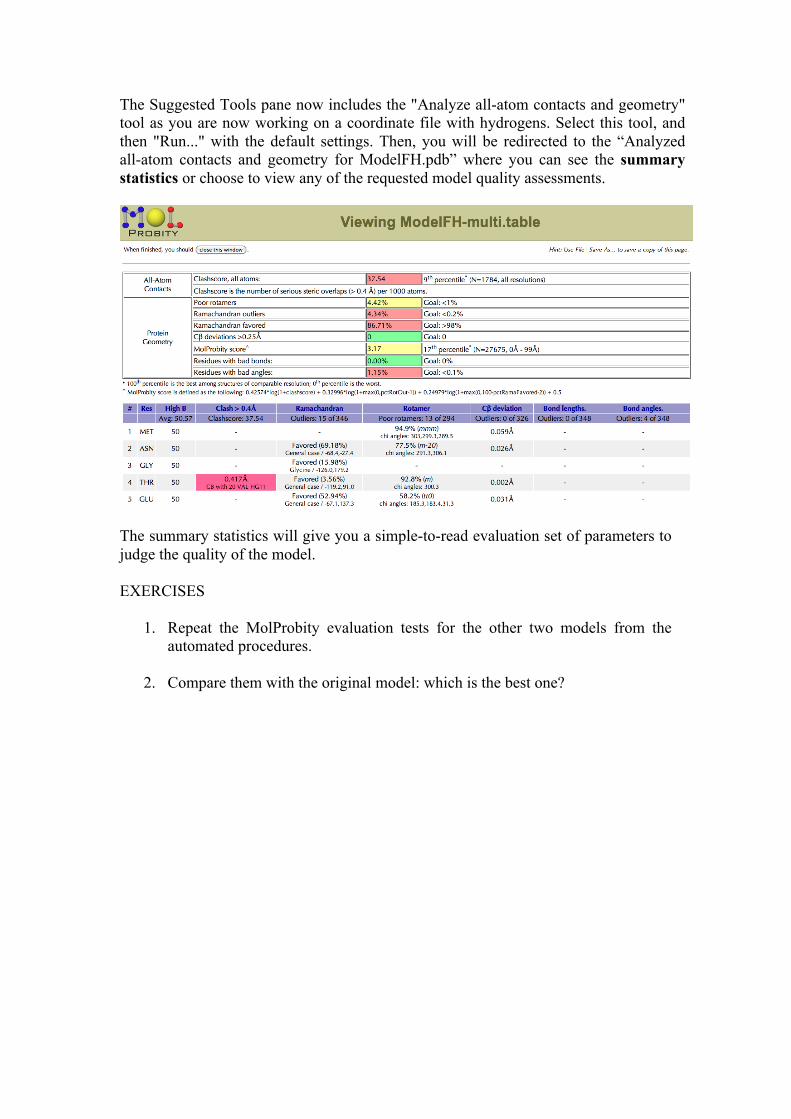
The Suggested Tools pane now includes the "Analyze all-atom contacts and geometry" tool as you are now working on a coordinate file with hydrogens. Select this tool, and then "Run..." with the default settings. Then, you will be redirected to the “Analyzed all-atom contacts and geometry for ModelFH.pdb” where you can see the summary statistics or choose to view any of the requested model quality assessments.
The summary statistics will give you a simple-to-read evaluation set of parameters to judge the quality of the model. EXERCISES
1. Repeat the MolProbity evaluation tests for the other two models from the automated procedures.
2. Compare them with the original model: which is the best one?