horizontal versus vertical foreign direct investment...
TRANSCRIPT

Horizontal versus Vertical Foreign Direct Investment:Revisiting Evidence from U.S. Multinationals
August 2012
Natalia RamondoArizona State University
Veronica RappoportLondon School of Economics and CEP
Kim J. RuhlNew York University Stern School of Business
ABSTRACTWe use firm-level data from the Bureau of Economic Analysis to document a new set of factsregarding the behavior of U.S. multinational firms. First, we find that intra-firm trade is con-centrated among a small number of large affiliates: The median affiliate reports no shipments tothe parent, and directs the bulk of its sales to unrelated parties in its country of operation. Inthis sense, “horizontal” rather than “vertical” FDI seems to better capture the role of most U.S.affiliates abroad. Second, we find that multinational firms often own affiliates that operate in up-stream or downstream industries, as defined by their industries’ input-output coefficients. Theseinput-output links, however, are not associated with intra-firm flows of physical goods. We con-jecture that the comparative advantage of multinational companies lies in their ability to transferintangible—rather than physical—inputs among production units.
We are thankful for helpful comments from David Atkin, Pablo Fajgelbaum, Fritz Foley, Nicholas Sly, and StephenYeaple, as well as seminar participants at the European Economic Association Annual Meetings, London School ofEconomics, NBER ITI, Columbia University, Princeton University, Society of Economic Dynamics, Rocky MountainEmpirical Trade Conference, and Stanford University. We would also like to thank William Zeile for help with themultinational affiliate data and comments on an early draft. Ruhl thanks the National Science Foundation for supportunder grant SES-0536970. The statistical analysis of firm-level data on U.S. multinational companies was conductedat the Bureau of Economic Analysis, U.S. Department of Commerce, under arrangements that maintain legal confi-dentiality requirements. The views expressed are those of the authors and do not reflect official positions of the U.S.Department of Commerce.
1 Introduction
Why do firms open foreign affiliates? Is it to sell goods in the foreign country? Is it to take
advantage of cross-country factor price differences? Is it a combination of both? The answers
to these questions lie at the center of an ongoing debate over the role of multinational firms in
the global economy. Harrison and McMillan (2011) shows that the impact of multinational firms
on domestic employment—the “shipment of jobs overseas”—depends crucially on the extent to
which the multinational firm is shipping goods to be processed, and whether they are shipped
to low-income or high-income countries. The sensitivity of trade and foreign direct investment
to taxation and trade policy—such as the tax amnesty program for multinationals proposed as
part of the stimulus package in 2011—varies greatly depending on the affiliate’s purpose. In fact,
almost any prediction regarding a multinational firm must be conditioned on the affiliate’s raison
d’etre.
We revisit the evidence on the motives for foreign direct investment (FDI) by studying firm-
level data collected by the U.S. Bureau of Economic Analysis (BEA). The detail regarding the data
on intra-firm versus arm’s-length transactions allows us to document several facts that are not
visible in the aggregate data. Our main finding is that there is very little intra-firm trade. This
suggests that most foreign affiliates are not created as parts of multistage production chains, but
as outposts to produce and to sell to unrelated parties in local markets.
Our dataset covers the universe of U.S. multinational firms and their foreign affiliates, and
includes measures of employment, sales, inputs, and their industries of operations. A key—and
unique—feature of these data is that we observe an affiliate’s sales broken down by destination (to
the United States, to the host country, or to a third country) and by transaction type (to the parent,
to another affiliate, or to an unaffiliated party). We also observe which inputs the affiliate sources
from the parent and from unaffiliated parties.
The intra-firm flow of goods between U.S. parents and their affiliates is an important compo-
nent of U.S. international trade, accounting for 20 percent of U.S. goods exports and 15 percent of
U.S. goods imports.1 We document that, behind these aggregate figures, there is substantial het-
erogeneity across affiliates. First, intra-firm trade is concentrated among a small number of large
1Readers familiar with Bernard, Jensen and Schott (2009) might find these numbers too small. The related-partytrade reported in Bernard et al. (2009) includes trade between U.S. parents and their affiliates, as we do, but alsoincludes trade between foreign parents and their U.S. affiliates, which we do not.
2

affiliates.2 Second, for most U.S. multinational firms, intra-firm trade represents a small fraction
of the affiliate’s operations, both relative to their input costs and to their total sales. In 2004, the
median manufacturing affiliate received none of its inputs from the parent firm, and sold 91 per-
cent of its production to unrelated parties, mostly in the host country. Finally, almost 55 percent
of affiliates report absolutely no shipments to their parent.
The extensive literature aimed at understanding the patterns of FDI has identified two primary
motives for locating production abroad. On the one hand, a firm may want to locate production in
the destination market to save on transportation costs; this mode is known as horizontal FDI. In this
case, arm’s-length exports and FDI are two alternative ways of supplying a foreign market.3 On
the other hand, the literature has pointed to differences in comparative advantage across countries
as a motive for the foreign location of some stages of production; this mode is known as vertical
FDI. In this case, intra-firm trade and FDI are complements.4
While the motives for creating foreign affiliates are more complex than the stylized horizontal
and vertical modes described in the literature, the data suggest that, for most affiliates, the pri-
mary motive is best described as horizontal—affiliates sell mostly to local, unaffiliated parties.5
Nevertheless, we find that foreign affiliates do not embody several characteristics that models of
horizontal FDI consider to be important. In models of horizontal FDI, firms create foreign affiliates
to replicate the production of the parent firm’s good in the destination market: These horizontal
affiliates are created to save the parent the costs of shipping goods. Two key predictions of these
models are that: (1) foreign affiliates produce the same goods as the parent firm, and (2) foreign
affiliates are more likely to exist in distant destinations because the cost of shipping goods is in-
creasing in distance.6
In the data, however, we find that 37 percent of affiliates operate in industries different from
the primary industry of the parent. We also find that, controlling for other destination country
characteristics (e.g. size, income per capita, institutional quality), distance from the United States
2The skewness of intra-firm trade towards large corporations mimics the distribution of exports across U.S. firmsfound in Bernard and Jensen (1995).
3See Horstmann and Markusen (1992), Brainard (1997), Markusen and Venables (2000), and Helpman, Melitz andYeaple (2004), among others. In an environment with uncertainty, see Ramondo, Rappoport and Ruhl (2010).
4See Helpman (1984), Yeaple (2003b), and Keller and Yeaple (2009). Frameworks that combine the two motives forFDI are featured in Carr, Markusen and Maskus (2001), Yeaple (2003a), Grossman, Helpman and Szeidl (2006), Ekholm,Forslid and Markusen (2007), Ramondo and Rodrıguez-Clare (2009), and Irrazabal, Moxnes and Opromolla (2010).
5The findings in Hanson, Mataloni and Slaughter (2005) and Feinberg and Keane (2006), who both use BEA firm-level data, also suggest that multinational firms have more complex integration strategies than simple horizontal andvertical strategies.
6New models are being developed that predict affiliates should be close to the parent. See, for example, Ramondoand Rodrıguez-Clare (2009) and Irrazabal et al. (2010).
3

decreases both the likelihood of a parent owning an affiliate and the size (in terms of sales and
employment) of existing affiliates.7
Not only do affiliates often operate in industries different than their parent, but, as character-
ized by the input-output matrix, the primary industries of operation of the parent and the affiliate
are typically linked, in the sense that the output of one industry is an input into the other. When
a parent produces an input into the affiliate’s industry (or an affiliate produces an input into the
parent’s industry) we say that the parent and affiliate share an input-output link, or an I-O link. We
find, as first documented by Alfaro and Charlton (2009), that the likelihood of a parent owning a
foreign affiliate is higher for parent-affiliate pairs with stronger I-O links.8
Intuitively, a strong I-O link suggests a vertical FDI motive, and we would expect to see ship-
ments of goods between the parent and affiliate. Surprisingly, the presence of an I-O link between
the parent and the affiliate does not predict the existence and volume of intra-firm flows. In our
empirical work, the coefficient that captures the effect of the I-O link between the parent and the
affiliate on the trade flow between those two parties is virtually zero. This finding coincides with
Hortacsu and Syverson (2009), which studies the domestic operations of U.S. multi-plant firms.
They find that shipments between establishments owned by the same firm within the United
States are surprisingly low. Moreover, they report that the sales of I-O linked establishments are,
for the most part, to non-related parties located near the domestic affiliate.
In other respects, our empirical work confirms previous findings in the literature. First, intra-
firm shipments into the United States are positively related to the income per capita of the host
country, but negatively related to host country size and distance to the United States.9 Second, we
find that the income level of the host country and the distance to the United States are significantly
and negatively related to the existence and the volume of exports from the U.S. parent to their
affiliates.10
Given our findings, an important question arises: If moving goods along a vertical production
chain is not the motive for foreign direct investment, then why do firms own affiliates linked
7Brainard (1997) and Carr et al. (2001) also find that distance has a negative effect on aggregate bilateral FDI flowsfrom the United States.
8The findings in Alfaro and Charlton (2009) are based on information on ownership and industry of operation ofparents and affiliates. Not having information on the intra-firm flows of physical goods, they interpret this input-output“closeness” between parent and affiliates as evidence of vertical FDI.
9See Yeaple (2006), Nunn (2007), Nunn and Trefler (2008), Bernard et al. (2009), and Costinot, Oldensky and Rauch(2011), among others. Most of the tests in these papers has been motivated by the work of Antras (2003) and Antrasand Helpman (2004).
10See Borga and Zeile (2004), Hanson et al. (2005), and Yeaple (2006).
4

by input-output relationships? As suggested in Hortacsu and Syverson (2009) for U.S. domestic
firms, we conjecture that the boundaries of the multinational firm are related to the transfer of
capabilities within the corporation. Strong input-output requirements between two goods may
signal the usage of a common set of intangible inputs. In the previous literature, these intangibles
have been formalized as knowledge capital (Markusen (1984)), technology capital (McGrattan
and Prescott (2010)), and managerial ability (Garicano and Rossi-Hansberg (2006) and Bloom and
Van Reenen (2007)).
Consider, for example, the case of Converted Paper Products (NAICS 3222)—stationary and
envelopes—which uses Paper (NAICS 3221) as its primary input. The production of these goods
likely involves knowledge about the quality of materials, demand, suppliers, and competition
that can be transmitted among the different units within the firm. Sharing these intangibles can
be an advantage in the production of I-O linked goods, even in the absence of physical shipments
between affiliates. Similarly, distance to the destination country may signal not only export costs,
but also the degree of transmissibility of these intangible assets. This may be the case of brands, for
example, which are recognized in markets that are closer to the parent firm. This interpretation has
been adopted by Ramondo and Rodrıguez-Clare (2009) and Irrazabal et al. (2010), which calibrate
the transportability of intangible assets and productivity within the corporation as a function of
the distance between the location of the parent firm and that of the foreign affiliate.
The remainder of the paper is organized as follows. Section 2 describes the data. Section 3
reports the importance of intra-firm flows for U.S. foreign affiliates. Section 4 presents estimates
of the relationship between input-output linkages, ownership, and the intra-firm trade of foreign
affiliates. Section 5 discusses the results. Section 6 performs some robustness analysis. Section 7
concludes.
2 The Data
Our firm-level data are collected by the U.S. Bureau of Economic Analysis for the purpose of
producing aggregate statistics on the operations of multinational companies. These data cover the
universe of U.S. parents and their foreign affiliates in the most recent benchmark year available,
2004. Parent and affiliate data are reported at different levels of aggregation. Parent data aggregate
all U.S.-located company operations that are part of the fully consolidated firm. The data are more
disaggregate at the affiliate level. Some affiliates of the same parent may report in a consolidated
5
manner if they are located in the same country and are in the same four-digit industry. Affiliates
may never consolidate across countries.
Detailed data on affiliate operations must be reported if affiliate sales, assets, or net income
(loss) are greater than $10 million. Of the 42,547 nonbank affiliates, 25,464 are large enough to
report.11 The reporting cutoff level is low: Reporting affiliates account for 99 percent of total
nonbank affiliate assets and sales. Within the set of reporting affiliates, we are interested in two
subsets of affiliates. The first subset is all of the nonbank affiliates of nonbank parents that are
majority-owned (greater than 50 percent ownership by the parent) and who have sales, assets,
or net income (loss) of more than $25 million. The second subset is all of the nonbank affiliates
of nonbank parents that are majority-owned and who have sales, assets, or net income (loss) of
more than $150 million. These cutoff levels are important since some of the variables used in our
analysis are asked only of these two subsets of affiliates. In appendix table B1, we summarize the
reporting cutoff levels for some of our variables of interest.
Our analysis focuses on manufacturing parents and affiliates.12 Within manufacturing, report-
ing affiliates account for 98 percent of foreign affiliate sales. Majority-owned foreign affiliates
(MOFA) with sales, assets, or net income (loss) of more than $25 million account for almost 80
percent of reported affiliate sales and 90 percent of reported affiliate sales to the parent. In what
follows, we refer to this sample of affiliates as MOFA25. In some of our calculations, we further
restrict the sample to majority-owned affiliates with more than $150 millions in sales, assets, or net
income (loss). This sample, which we refer to as MOFA150, accounts for 65 percent of all manufac-
turing affiliate sales, and 81 percent of reported affiliate sales to the parent. Note that, MOFA150 is
a strict subset of MOFA25. Further details of the sample construction are reported in table 1.
For each affiliate and parent in our data, we observe sales disaggregated in various ways. In
one breakout, parents and affiliates report sales in each of their seven largest industries. These
industries are classified according to the International Surveys Industry (ISI) classification, which
is roughly equivalent to the 2002 North American Industry Classification System (NAICS). The
BEA assigns to each parent and affiliate a primary industry based on these data.13 When we need
a broad categorization of a firm—to claim, for example, that a firm is in the manufacturing sector—
11For affiliates below the size threshold for reporting on an affiliate survey form, the parent reports affiliate sales,employment, and trade to and from the parent. Additionally, we do not consider 2,606 affiliates with “carry ” data (i.e.affiliates whose data were extrapolated from a previous survey); they represent eight percent of total reporting affiliatesales.
12The main reason to focusing on manufacturing is that intra-firm trade occurs primarily in goods, not services.13This procedure is described in Bureau of Economic Analysis (2008), page M–12.
6

we use this industry code. In our sample, affiliates span a total of 202 four-digit industries, and 77
industries when the sample is restricted to manufacturing (see table 1).
Affiliates are typically more focused on a core industry than the parent. On average, 84 percent
of the parent’s sales are in its primary industry of operation, compared to 96 percent for affiliates.
In manufacturing, 85 percent of a parent’s sales are in the primary industry, compared to 94 per-
cent for affiliates (see panel 2 in table 2). This is not quite the correct comparison, however, because
the data reported by the parents are an aggregate of all company operations of the fully consoli-
dated firm located in the United States. This may make parents seem artificially more diversified
than affiliates. For comparison, we also aggregate the operations of all the affiliates owned by the
parent, by country. Using this comparable measure, affiliates are still more focused on a single
industry than their parents: 91 percent of affiliate sales is concentrated in the primary industry of
an affiliate. The data are very skewed: The median affiliate operates in a single industry, while
larger affiliates (as measured by employment) operate in a larger set of industries (see panel 1 in
table 2).14
Our main results are made possible by data broken down by the destination of an affiliate’s
sales. In the data, an affiliate’s sales can be directed to: (i) the parent; (ii) unaffiliated U.S. parties;
(iii) local affiliates; (iv) local unaffiliated parties; (v) related parties in neither the U.S. nor the
host country (what we call third countries); and (vi) unaffiliated parties in third countries.15 These
variables are observed only for the affiliates in the MOFA25 sample and are summarized in panel 3
of table 2. For the very large majority-owned affiliates in the MOFA150 sample, we also observe the
composition of goods shipments from the parent to the affiliate as being “for further processing,”
“capital goods,” or “for resale.”
Being able to observe the trade flows between parents and affiliates is a unique feature of these
data that will allow us to say much more about how parents use (or do not use) affiliates to move
goods across countries.
14This is important since our baseline results below are based on a measure of what we call an input-output link thattakes into account the primary industries of the parent and the affiliate only.
15The data on shipments between the parent and the affiliates are not reported by industry. We do, however, knowwhat fraction of the trade is in goods and in services. Additionally, within the “third countries” category, the datadifferentiate between a few regions (Europe, Latin America, Africa, Middle East, Asia, Pacific, and Canada). Ouranalysis does not exploit this disaggregation.
7

3 Patterns of Intra-firm Flows
Traditional models of vertical FDI assume that a parent creates an affiliate in order to carry out
some stages of the production process, and that the home country remains the main destination
market of the firm: Production involves intra-firm flows of goods between the parent and the
affiliate, or among foreign affiliates who specialize in different stages of production. In contrast,
models of horizontal FDI are based on the assumption that a parent creates an affiliate to produce
in, and to sell to, the host country. If a parent-affiliate relationship is horizontal, we would expect
to see little trade between related parties, and most sales of the affiliate directed to the market of
operation. There are, of course, more complex motives for foreign investment that mix all these
activities, but the relevance of intra-firm trade will provide information about the primary motive
for establishing an affiliate.
Intra-firm trade accounts for a large share of U.S. exports and imports. In 2004, shipments from
U.S. parents to their foreign affiliates accounted for 20 percent of U.S. exports of goods, and ship-
ments from affiliates to their parents accounted for 15 percent of U.S. imports of goods. Restricting
the sample to manufacturing firms, total affiliate shipments to the parent totaled $188,720 million,
representing ten percent of total manufacturing affiliate sales, and 16 percent of U.S. manufactur-
ing imports. Exports from U.S. parents to manufacturing affiliates abroad were $145,525 million.
These intra-firm shipments in manufacturing accounted for 20 percent of U.S. manufacturing ex-
ports. Notice that these numbers imply a ratio of total affiliate sales to total U.S. manufacturing
exports of 2.5 and a ratio of 1.5 for total affiliate sales to total U.S. manufacturing imports.
Behind these aggregate numbers, is substantial heterogeneity at the firm level. Intra-firm trade
is concentrated among a small number of large affiliates abroad. As described in panel 3 of table
2, the median affiliate reports no shipments of goods to or from the parent, and ships 99 percent
of its product to unrelated parties, mostly in the local market. In manufacturing, these figures are
very similar: The median manufacturing affiliate does not report any shipments of goods to or
from the parent, and ships 91 percent of its product to unrelated parties. The average intra-firm
flow is larger when weighted by the size (as measured by employment) of the affiliate: While
the mean shipment from the affiliate in manufacturing to all related parties represents 27 percent
of total affiliate sales (column 4), the weighted-mean shipment increases to 33 percent (column
6), evidence that the affiliates engaging in intra-firm trade are larger. These statistics are further
broken down by geographical region and broad industry in tables B2 and B3 in the appendix.
8

To visualize the skewness of intra-firm shipments, we plot Lorenz curves (the cumulative share
of intra-firm trade by the cumulative share of affiliates) in figure 1. In each panel we plot the
Lorenz curve for shipments from affiliates to parents, for parents to affiliates, and for shipments
from the affiliate to any affiliated party. The pattern is clear: We only see parents and affiliates
engaging in intra-firm trade at the very top of the distribution.
For a striking majority of affiliates, shipping goods within the firm does not seem to be the
primary activity. We explore this feature of the data further in figure 2. This histogram plots
the distribution of affiliates by the share of total affiliate sales to unaffiliated parties. We report
this histogram for the entire sample, for parent-affiliate pairs in manufacturing, and for parent-
affiliate pairs in the North American motor vehicles sector (affiliates in ISI 3361–3363 located in
either Canada or Mexico). In the entire sample, more than 70 percent of affiliates sell more than
80 percent of their output to unaffiliated parties. The entire sample, however, includes service
industries in which we should expect to see little trade regardless of the mode of FDI. When we
restrict the sample to the manufacturing sector, about 65 percent of affiliates sell more than 80
percent of their output to unaffiliated parties. As we report in table 3, about 25 percent of the
affiliates in our sample do not report any intra-firm trade, neither with the parent nor with any
other related party.
The third group of parent-affiliate pairs in figure 2 is restricted to affiliates in the motor vehicle
industries in Canada and Mexico. Even in this sub-sample, more than 40 percent of affiliates sell
at least 80 percent of their output outside the boundaries of the firm, but almost 20 percent of
affiliates ship more than 90 percent of their output to the parent or other affiliates, as a model of
vertical FDI would predict. This industry, however, is an exception: No other industry has, on
average, more than 40 percent of affiliate output sold within the firm. We report statistics for 11
broad industries in table B3.
The lack of intra-firm trade between the parent and its affiliates is particularly stark. Panel (b)
in figure 3 contains a histogram of the share of affiliate sales shipped to the parent, and panel (a)
contains a histogram of the share of affiliate total input costs received from the parent. Almost
90 percent of affiliates ship less than five percent of their output to their parent, and almost 90
percent of affiliates source less than five percent of their inputs from their parent. In fact, almost
half of the affiliates report zero trade from their parent, as reported in columns 1 and 4 in table 3.
Affiliates in the motor vehicle industry located in Canada and Mexico are more likely to source
inputs from their parent, but these inputs still represent a relatively small fraction of the value of
9

inputs purchased by the affiliate.
The patterns evident in the data appear to be quite stable over time. The previous benchmark
survey was conducted in 1999. We reproduce table 2 using the 1999 data in appendix table B4.
4 Input-Output Links, Ownership, and Intra-firm Flows
In the previous section we documented that very few affiliates send goods to, or receive goods
from, their parents. For most U.S. foreign affiliates, intra-firm trade accounts for a small share of
their production, suggesting that most FDI is not undertaken to promote vertical specialization,
but rather, to serve the market of operation. In this section, we analyze the ownership structure of
multinational firms in terms of their vertical integration. We find that most parent-affiliate pairs
operate in upstream or downstream industries, in the sense that the output of one industry is a
direct input into the other. We say that these parent affiliate pairs have an input-output linkage or an
I-O link. This finding, along with the dearth of intra-firm trade, suggests that, while multinational
firms own affiliates in upstream and downstream industries, they do not do so with the purpose
of facilitating the transfer of goods along the production chain.
4.1 Do I-O Links Predict Ownership?
We begin by determining which of our parent-affiliate pairs are I-O linked. We follow Alfaro and
Charlton (2009) and Hortacsu and Syverson (2009), and base our classification on the industries in
which each firm operates. We observe a parent in industry i and its affiliate in industry j. To what
extent are industries i and j—and, by extension, parent and affiliate—dependent on each other
for inputs into production?
To characterize the input-output relationships between industries, we use the direct require-
ments table for the United States in 2002. In the direct requirements table, an observation is a
commodity-industry pair and the direct requirements coefficient, denoted by dij , specifies the
value of inputs from industry i needed to produce one dollar of output in the industry j. The
commodities and industries are defined using the Input-Output industry classification, which we
map into the BEA NAICS-based ISI classification. There are 77 manufacturing industries in the
classification. Of the 5,929 possible commodity-industry pairs, 51 percent of them are non-zero.
The direct requirements matrix is an important input into our measures of I-O linkages. In
10

figure 4a, we summarize the characteristics of the direct requirements matrix. The axes are the
ISI industry codes (manufacturing codes lie between 3111 and 3399): The x-axis is the using in-
dustry (downstream) and the y-axis is the producing industry (upstream). The size of a bubble is
proportional to the size of the direct requirements coefficient for the industry pair. It is clear from
the figure that most industries require inputs from similar industries: The entries in the direct
requirements matrix tend to be the largest on or near the diagonal.
We measure the strength of the input-output relationship between the parent and the affiliate
through the input-output matrix. We consider an affiliate to be upstream vis-a-vis the parent,
if the direct requirements coefficient between the producing (primary) industry of the affiliate
and the using (primary) industry of the parent is positive, drap > 0. Analogously, the affiliate is
downstream if the corresponding direct requirements coefficient between the (primary) industries
of the parent and affiliate is positive, drpa > 0. An I-O link between the (primary) industry of the
parent and the (primary) industry of the affiliate is defined by either a positive drap, or a positive
drpa.
This simple measure suggests that most of the observed parent-affiliate pairs are related by
I-O links. This is easy to see in figure 4b, where we plot the distribution of industry pairs in the
MOFA25 sample. In this figure, the size of a bubble is proportional to the number of observations
within the industry pair. Inspecting the figure, it is clear that most parents own affiliates on or
near the diagonal. Combining figures 4a and 4b suggests that, in the data, parents own affiliates
in similar industries, and that these industries are important producers of intermediate inputs
for each other.16 The average value of the direct requirements coefficients in the I-O matrix is
only 0.005, and 49 percent of the industry pairs do not have an input-output relationship, i.e.,
dr = 0. In the parent-affiliate data, the average direct requirements coefficient jumps to 0.072
when we consider the parent to be upstream, drpa, and 0.069 when we consider the affiliate to be
upstream, drap. The number of parent-affiliate industry pairs with no I-O linkage drops to less
than 10 percent.17
More formally, we investigate the extent to which I-O links are associated with the presence
16As noticed by Alfaro and Charlton (2009), an important share of these chains is unreported when the data are ag-gregated to three-digit SIC rather than four-digit SIC industry. That is, many parent-affiliate pairs operate in industrieswhich share the same three-digit SIC industry, but have different four-digit SIC industries. Our four-digit ISI classifica-tion is more coarse than the one in Alfaro and Charlton (2009): There are 77 manufacturing industries compared to the459 manufacturing industries in the 1987 SIC.
17Even when we restrict the sample to only include parents and affiliates operating in different (primary) industries(i.e., we exclude the diagonal of the I-O matrix), the average direct requirements coefficient is much larger than the I-Omatrix averages: 0.027 and 0.018, for drpa and drpa, respectively. The number of parent-affiliate industry pairs with noI-O linkage is less than 30 percent in this case.
11

of multinational affiliates. Following Alfaro and Charlton (2009), we estimate a Tobit specification
that accounts for the effect of I-O links on both the likelihood of owning affiliates and the number
(or size) of them,
FDIapc = βUdrap + βDdrpa + βcXc + βpXp + βcpXc ×Xp + εapc. (1)
The unit of observation is a triplet, apc, that refers to the primary industry of the affiliate, the
primary industry of the parent, and the affiliate’s country of operation. We measure multinational
activity, FDIapc, in two ways: (1) the number of affiliates in country c, industry of the parent p,
and industry of the affiliate a; and (2) the total employment of affiliates in country c, industry of
the parent p, and industry of the affiliate a. Our manufacturing MOFA25 sample spans 64 host
countries and 77 × 77 industry pairs, for a total of 379,456 possible combinations, most of which
display no multinational activity.18
The variables drap and drpa correspond to the direct requirements coefficients between the
(primary) industry of the parent and affiliate, with the affiliate in the upstream and downstream
industry, respectively. The coefficients βU and βD indicate the importance of I-O links as determi-
nants of the number and size of foreign affiliates in a country and parent-affiliate industry pair.
The vector Xc contains country-level controls: the host country GDP and GDP per capita from
the Penn World Table 6.3, as documented in Aten, Heston and Summers (2009); the distance to
the United States from CEPII, as documented in Mayer and Zignago (2011); a measure of the
rule of law from Beck, Clarke, Groff, Keefer and Walsh (2001); the average years of schooling
attainment from Barro and Lee (2000); and the capital-output ratio from Klenow and Rodrıguez-
Clare (2005). The vector Xp contains parent-industry controls: the capital and skill intensity of
the parent’s primary industry, from the NBER-CES manufacturing industry database from Becker
and Gray (2009). Additionally, as it is customary in the literature, we include terms that interact
the industry factor intensities with the host country factor supplies.
Columns 2 and 5 in table 4 present the baseline results for the number and total employment
of affiliates. Larger upstream and downstream direct requirements coefficients between the pri-
mary industry of operation of the parent and the affiliate are found to be significant predictors
of FDI activity. Moreover, comparing the pseudo R2 in columns 1 and 2 (4 and 5 in the case of
employment size), the explanatory power of the regression doubles when the I-O link measures
18There are 40 countries for which we do not have data on the control variables. These observations were droppedfrom the sample.
12

are added.19
The coefficients of the Tobit regressions are not straightforward to interpret as they combine
both the effects of the probability of owning affiliates as well as their number and size. We observe
affiliates in only 2, 378 of the 379, 456 potential industry-pair-country combinations. Therefore, the
probability of observing an affiliate is very small (0.006 = 2, 378/379, 456) and the overall Tobit
coefficients are, correspondingly, large. In particular, a ten-percent increase in the direct require-
ments coefficient from its average (0.07) implies a 60 percent increase in the average number of
affiliates in a given industry-pair-country combination: The average jumps from 0.05 to almost
0.08.20
For employment, the unconditional effects are larger: A ten-percent increase in the direct re-
quirements coefficient implies that, on average, employment increases from 3.4 employees in a
given industry-pair-country combination to 33 employees.21
The effect of I-O links on multinational activity comes almost entirely from the extensive mar-
gin. The marginal effects on the intensive margins (i.e., the expected number of affiliates, pro-
vided that we observe at least one affiliate in the industry-pair-country triplet) are 2.05 and 2.01,
for upstream and downstream affiliates, respectively: They imply that a ten-percent increase in
the average direct requirements coefficient corresponds to an increase in the expected number of
affiliates in a given industry-pair-country combination of only 0.4 percent. The marginal effects on
affiliate employment conditional on the existence of an affiliate are small, as well. A ten-percent
increase in the direct requirements coefficient, as described above, is associated with an increase in
affiliate employment from 554 employees—the average across industry-pair-country triplets with
a positive number of U.S. affiliates—to 584 employees, an increase of 5.4 percent.
The strong diagonal in the matrix of direct requirements, shown in figure 4a, introduces a
source of ambiguity into the interpretations of our results. An affiliate operating in the same
industry as the parent may be perceived as producing the same product as the parent, which
would be consistent with horizontal FDI motives. The direct requirements coefficients for the
diagonal elements are large, however, which is consistent with a vertical motive for FDI. To avoid
19Table 4 reports (McFadden-adjusted) pseudo R2 which are increasing in the likelihood of the model.20This is computed as FDI
′apc = FDIapc + (βU + βD)∆drap, where ∆drap = 0.1 × 0.07, and FDIapc = FDI
+apc ×
Pr(FDIapc > 0) = 7.1 × 0.006 = 0.05 (i.e., the average number of affiliates across the industry-pair-country tripletsobserved in the data times the probability of observing an affiliate in such triplet).
21This effect is calculated as in the previous footnote, using the βU and βD reported in column 5 of table 4, and whereFDIapc = FDI
+apc ×Pr(FDIapc > 0) = 554× 0.006 = 3.4 (i.e., the average employment of affiliates across all possible
industry-pair-country triplets with a positive number of employees, times the probability of observing an affiliate insuch triplet).
13

any source of ambiguity, we report estimates of (1) when the sample is restricted to include only
observations in which the affiliate and parent operate in different (primary) industries (columns 3
and 6 in table 4). In the restricted sample, the industry-pair-country triplets with a positive number
of affiliates drops to 1,383, approximately 60 percent of the observations in the complete sample.
The probability of observing affiliates in a given triplet is now 0.004. Although our results are
qualitatively unchanged, the magnitude of the effects are substantially reduced, consistent with
the fact that most affiliates and parents operate in the same primary industry.
4.2 Do I-O Links Predict Intra-Firm Flows?
The previous set of results establishes that an I-O link between the industries of operation of the
parent and the affiliate is a good predictor of multinational activity across countries and industries.
This result is consistent with Alfaro and Charlton (2009). Not having data on trade flows between
parents and affiliates, however, they interpret the presence of an I-O link between parent and
affiliate as the presence of vertical FDI, conjecturing that these input-output links are accompanied
by substantial flows of physical goods between the parent and the affiliate. We turn to this point
next: Are input-output linkages able to predict trade flows between the parent and the affiliate?
Using data on the observed flows of physical goods between parents and affiliates, our answer is
negative: While an I-O link is a good predictor of the existence and size of a multinational firm, it
is not associated with substantial intra-firm trade.
The descriptive statistics in table 3 (panel 2) present a first overview of the intra-firm trade
patterns between I-O linked parents and affiliates. Not only is the share of intra-firm trade small
for the average affiliate, it is also remarkably invariant with respect to the position of the affiliate
in the production chain (downstream from the parent, upstream from the parent, neither, or both).
On average, less than 30 percent of affiliate sales are shipped within the firm, and less than eight
percent are shipped to the parent, irrespective of whether the affiliate operates in an upstream
industry. Parents provide less than seven percent of an affiliate’s inputs, irrespective of whether
the affiliate operates in a downstream industry (panel 3).
The same conclusion emerges from the histograms in figure 5. Figure 5a contains histograms
of shipments from the parent to the affiliate as a share of the affiliate’s total input costs. For most
affiliates, parents are responsible for a very small fraction of their inputs, and this is unchanged if
we consider parents and affiliates in the same industry or different industries. Figure 5b contains
14

histograms of shipments from the affiliate to the parent as a share of total affiliate sales. Again,
intra-firm trade is small for most affiliates.
To measure the importance of I-O links while controlling for other factors, we turn to the
firm-level data. Given that only 46 percent of affiliates report positive shipments to the parent, we
estimate the following Tobit specification, which captures the determinants of both the probability
of reporting positive flows and their magnitude,
Yapc = βUdrap + βcXc + βsXp + βcsXc ×Xp + βpPp + εapc. (2)
The dependent variable Yapc is shipments from affiliate a in host country c, to the parent, p, as
share of the affiliate’s total sales.22 We measure the I-O link between an upstream affiliate and the
downstream parent with the direct requirements coefficient of the primary industry of affiliate a
in the production of the primary industry of the parent p, drap. In the robustness section, we also
use a different measure that aggregates the requirements of all the affiliate’s industries into the
production of all the industries of the parent.
The vectors Xc and Xp contain affiliate-country controls and parent-industry controls, as used
in (1). In addition, we include the number of affiliates owned by the parent and the total U.S.-
located employment of the parent in the vector Pp.
Table 5 reports the results from estimating equation (2). In column 1 we report the estimates
controlling only for country and parent characteristics. In column 2, we include our measure of
I-O linkages, drap. Column 3 restricts the sample to include only affiliates and parents operating
in different primary industries. The coefficient on our variable of interest, drap, is non-significant
and small: The I-O link between a parent and an affiliate is not associated with intra-firm trade.
Otherwise, our estimates are consistent with the ones in previous studies of intra-firm trade flows.
We find that intra-firm shipments into the United States are significantly smaller for affiliates lo-
cated in distant countries, and larger for affiliates in countries abundant in physical and human
capital. Affiliates located in countries with poor rule of law tend to ship a larger share of their sales
to the parent. Additionally, consistent with the descriptive statistics, larger multinational parents
in terms of employment (one of the parent controls) are associated with more intra-firm flows (not
reported).
22Although the BEA data report affiliate sales to all related parties, they only provide information on the identity ofthe related firm in the case of the parent. Therefore, we can only match flows and I-O links for trade between parentand affiliates.
15

Columns 4–6 of table 5 report the corresponding results for the intra-firm trade flow from the
parent to the affiliate. The baseline regression is a Tobit specification,
Ypac = βDdrpa + βcXc + βsXp + βcsXc ×Xp + βpPp + εpac. (3)
The dependent variable, Ypac, is shipments from the parent, p, to the affiliate, a, in country c, as a
share of total affiliate sales. The set of country, industry, and parent controls is the same as in (2).
Again, we find that the the I-O link between the upstream industry of the parent and the
downstream industry of the affiliate is not a significant predictor of flows of goods from the parent
to the affiliate. The distance between the location of the affiliate and the United States is, again, a
significant predictor of intra-firm flows, while affiliates located in countries with poor rule of law
receive a significantly larger fraction of their inputs from the parent.
In Section 6, we show that the results found in this section are robust to different definitions of
an I-O link and to different empirical specifications.
5 Discussion
We have established above that most multinational firms own foreign affiliates operating in I-O
linked industries. For the most part, however, these affiliates ship a surprisingly small share of
their production to the parent operating in a downstream industry, and they receive a very small
share of their physical inputs from the upstream parents. Moreover, most of the affiliates in these
I-O linked chains appear to sell almost exclusively to unrelated parties. These results raise a ques-
tion about the motives for not only owning foreign affiliates, but also the firm’s multi-product
patterns. Why do multinational firms own internationally segmented production chains if not for
transferring physical goods along it? Our proposed answer to this question is in line with the
answer given by Hortacsu and Syverson (2009) for U.S. domestic firms: The multinational firm
exists for the purpose of transferring intangible goods such as know-how, brands, and organiza-
tional capabilities within it. These intangibles can be transmitted internationally to the affiliates
within the firm, and they can be a source of comparative advantages in the production of goods
that are related in an I-O sense, even in the absence of physical shipments between affiliates.
The results in this paper can be rationalized within the multi-product framework in Bernard,
Redding and Schott (2011), by incorporating this additional source of comparative advantage in
16

the production of goods. In the model there is a continuum of firms, ω ∈ [0, 1], and K goods
that can be potentially produced by each firm, k = 1, ...,K. If produced, each firm produces a
differentiated variety of a given good k. Each firm is characterized by a vector of productivities
across goods, z(ω) = [z1(ω), z2(ω), ..., zK(ω)], drawn from a multivariate distribution function
F (z). A good k can be produced by an affiliate of firm ω according to
yk(ω) = zk(ω)Lk(ω), (4)
where yk(ω) is the quantity of good k and Lk(ω) the input bundle used in the production of good
k—hired in the country of production—by an affiliate of firm ω.23
The firm-specific vector of productivity draws across goods, z(ω), and the distribution func-
tion, F (z), are reduced-form representations of the sources of comparative advantage for the
multinational firm: Why are some firms more productive than others? How does a firm’s com-
parative advantage in the production of one product translate to other products? To be consistent
with our empirical findings, the properties of the distribution function should be related to the I-O
matrix: Firms tend to have a comparative advantage in producing goods that are related by I-O
linkages. Formally,
∂ Pr(Zn > zm|zk > zm)
∂drnk> 0
∂ Pr(Zn > zm|zk > zm)
∂drkn> 0, (5)
where Pr(Zn > zm|zk > zm) is the probability that the (random-variable) productivity draw for
good n, across the continuum of firms, is larger than the productivity threshold of opening an
affiliate abroad (zm)—determined by reasons similar to the ones in Helpman et al. (2004) and the
same across goods, for simplicity—given that the productivity draw for good k is large enough.
drnk corresponds to the direct requirements coefficients for good n into the production of good k.
Firms with draws above zm open affiliates abroad who produce a variety of good n.
The source of the correlation among goods within the firm can be interpreted in different ways.
As shown in figure 4, most industries require inputs from similar industries: The entries in the di-
rect requirements matrix tend to be the largest on or near the diagonal. Consider, for example,
the case of Converted Paper Products (NAICS 3222)—stationary and envelopes—which uses Paper
(NAICS 3221) as its main input. Presumably, the production of paper and paper products involves
similar knowledge about the quality of materials, demand, suppliers, and competitors. This com-
23For simplicity, we ignore heterogeneity across different host countries, but it can be easily incorporated.
17

monly required knowledge can be understood as the capacity to solve related problems, as in
Garicano and Rossi-Hansberg (2006), the stock technology capital—specific to goods of similar
characteristics—as in McGrattan and Prescott (2010), or the stock of knowledge capital that is a
public good within the corporation, as in the seminal work by Markusen (1984). If this is the case,
the firm may have comparative advantage in producing goods that are linked by I-O relationships
even in the absence of intra-firm physical flows.
The BEA collects data on a few variables which are related to intangibles goods. Affiliates
report the payments made to the parent for royalties and fees for the use of intangible property as
well as royalties and fees paid by the parent to the affiliate. Data are also collected about services
provided within the firm, such as managerial consulting, computer and technical support, and
research and development. These data report the allocated expenses and sales of services between
the parent and the affiliate.
The flows of payments for intangibles in the data are small: The median affiliate neither re-
ceives nor pays anything to the parent for the use of intangible property or for services. For
the average affiliate, services bought from the parent and the royalties and fees paid to the parent
make up only one percent of the value of its inputs. Of the 4,911 affiliates in the sample, 75 percent
do not report any intra-firm service flows. The small magnitudes we observe when measuring the
flow of intangible goods within the corporation should not be surprising. The same public-good
nature of intangible goods that makes them so valuable to the firm also makes them difficult to
measure in the data.24
While the reported flows are small, there is some interesting variation across affiliates. The
average affiliate in the same industry as its parent pays almost 30 percent more royalties than the
average affiliate operating in a different industry than its parent. The difference is larger for allo-
cated expenses and sales of services: The average affiliate pays 80 more to the parent for services
if it operates in the same industry as the parent. Of the affiliates who report purchases of services
from the parent, more than 40 percent list management consulting or information technology ser-
vices as the primary service provided.
24The difficulty in measuring intangibles in multinational firms has led McGrattan and Prescott (2010) to use anindirect measure of intangible capital. Others, like Bloom and Van Reenen (2007), try to directly measure a particularintangible input—namely, managerial ability.
18

6 Robustness
In this section we explore the robustness of our results to different empirical specifications and al-
ternative measures of the I-O links between the affiliate and the parent. Regardless of our measure
of I-O links and functional form, we do not find a positive and significant relationship between
the input-output relationship of a parent and affiliate and intra-firm trade.
6.1 Alternative Empirical Specifications
Any measure of intra-firm trade flows may be contaminated by the reporting of artificially low
values of goods traded, a phenomenon known as transfer pricing. While transfer pricing may bias
downward the value of trade reported, it is unlikely a firm with significant intra-firm trade could
report zero trade. Given that one of the most striking features of the data is the small number of
parent-affiliate pairs reporting any intra-firm flows, we estimate a linear probability model,
d(Yapc) = βUdrap + βcXc + βsXp + βcsXc ×Xp + βpPp + εapc. (6)
The binary variable d(Yapc) is equal to 1 if shipments from the affiliate to the parent are positive
and 0 otherwise. Arguably, transfer pricing cannot contaminate this variable as long as transfer
pricing does not completely eliminate the trade flow. The results from estimating (6) are reported
in table 6. In columns 1 and 2, we report the estimates for shipments from the affiliate to the parent.
In columns 3 and 4, we report estimates of (6) in which the intra-firm trade flow is shipments from
the parent to the affiliate. Columns 1 and 3 correspond to all reporting parents and affiliates; in
columns 2 and 4 the sample is restricted to parents and affiliates operating in different primary
industries.
The estimates from this specification do not support the idea that parents own affiliates in re-
lated industries in order to move goods along the value chain. In fact, we find the opposite: The
coefficients of interest are negative. A larger I-O link is associated with a lower probability of
observing trade in goods between the parent and the affiliate, but with one exception, the coeffi-
cients are not significant. We also observe this pattern when we exclude the parent-affiliate pairs
that operate in the same primary industry.
Our second set of alternative functional forms is meant to capture the importance of input-
output relationships in explaining the intensive margin of intra-firm flows, that is, the magnitude
19

of the trade flow conditional on observing trade. We estimate, using ordinary least squares,
log(Yapc) = βUdrap + βcXc + βsXp + βcsXc ×Xp + βpPp + εapc. (7)
The sample of affiliate-parent pairs is restricted to only those that report positive shipments. We
do not transform the I-O link variable, because there are zeros in the direct requirements table and
we do not want to discard those observations.
We report our estimates of (7) in table 6. The dependent variable in columns 5 and 6 is the
logarithm of shipments from the affiliate to the parent as a share of total affiliate sales, log(Yapc).
Columns 7 and 8 report the results from an analogous specification in which the dependent vari-
able is the logarithm of shipments from the parent to the affiliate, log(Ypac), and the direct require-
ments coefficient, drpa, is the measure of the I-O link. In columns 6 and 8, the samples are further
restricted to affiliates and parents operating in different primary industries.
The coefficients relating I-O links to intra-firm trade flows follow the same pattern as in our
baseline specification. For shipments from the affiliate to the parent, the coefficients are positive,
small, and insignificant. For shipments from the parent to the affiliate, the coefficients are negative
and become positive when parent-affiliate pairs on the diagonal are discarded. Again, in this
specification, I-O linkages are not found to be statistically significant predictors of intra-firm trade
flows.
6.2 Alternative Measures of I-O Links
Our baseline I-O link measure is the direct requirements coefficient between the primary industry
of the parent and the affiliate. Although this measure only uses a single industry per firm, it is
hardly a restrictive definition: The share of sales in the primary industry is 1.00 for the median
affiliate and 0.99 for the median parent in our sample (see table 2). Even so, in this section, we
construct a measure of the input-output link between the parent and the affiliate that takes into
account all of the industries of operation of both parties. We reestimate our baseline specification
using this measure.
Our more general measure of an I-O link is a sales-weighted average of the direct requirements
coefficients of all of the possible combinations of parent and affiliate industries. Let vap be the I-O
link when the affiliate is upstream and vpa be the I-O link when the parent is upstream. The set P
contains all of the industries in which the parent operates and the set A is the set of industries in
20
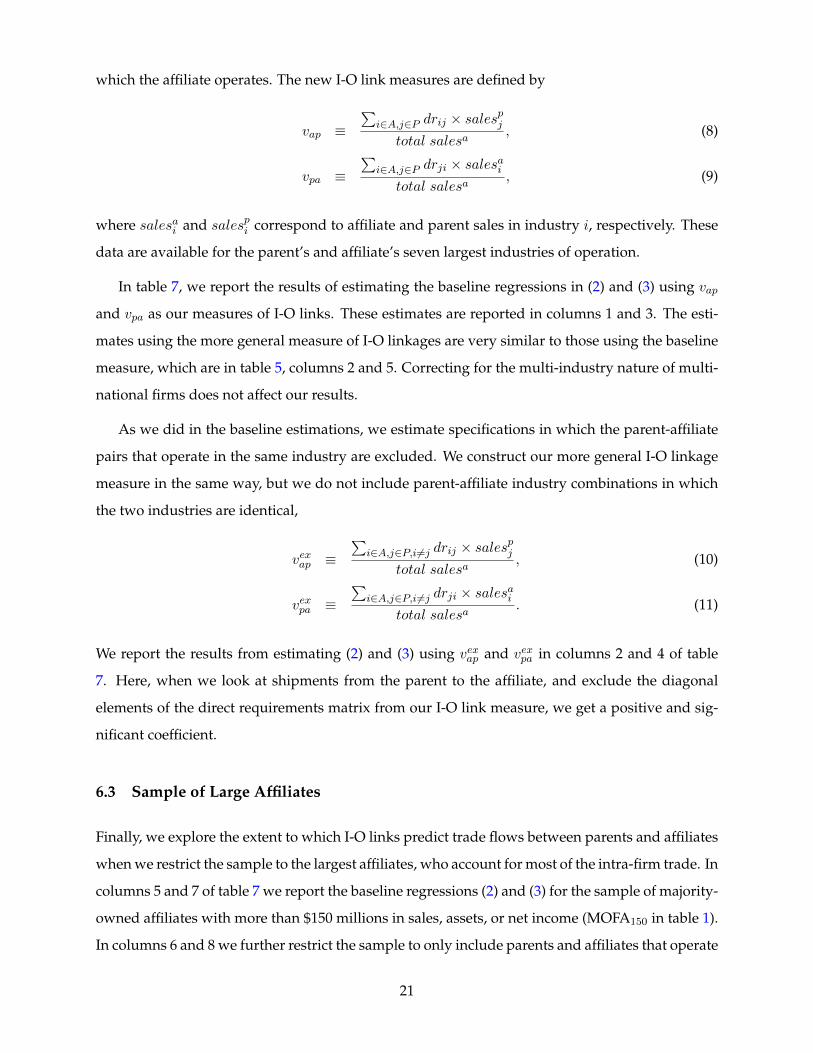
which the affiliate operates. The new I-O link measures are defined by
vap ≡∑
i∈A,j∈P drij × salespj
total salesa, (8)
vpa ≡∑
i∈A,j∈P drji × salesaitotal salesa
, (9)
where salesai and salespi correspond to affiliate and parent sales in industry i, respectively. These
data are available for the parent’s and affiliate’s seven largest industries of operation.
In table 7, we report the results of estimating the baseline regressions in (2) and (3) using vap
and vpa as our measures of I-O links. These estimates are reported in columns 1 and 3. The esti-
mates using the more general measure of I-O linkages are very similar to those using the baseline
measure, which are in table 5, columns 2 and 5. Correcting for the multi-industry nature of multi-
national firms does not affect our results.
As we did in the baseline estimations, we estimate specifications in which the parent-affiliate
pairs that operate in the same industry are excluded. We construct our more general I-O linkage
measure in the same way, but we do not include parent-affiliate industry combinations in which
the two industries are identical,
vexap ≡∑
i∈A,j∈P,i6=j drij × salespj
total salesa, (10)
vexpa ≡∑
i∈A,j∈P,i6=j drji × salesaitotal salesa
. (11)
We report the results from estimating (2) and (3) using vexap and vexpa in columns 2 and 4 of table
7. Here, when we look at shipments from the parent to the affiliate, and exclude the diagonal
elements of the direct requirements matrix from our I-O link measure, we get a positive and sig-
nificant coefficient.
6.3 Sample of Large Affiliates
Finally, we explore the extent to which I-O links predict trade flows between parents and affiliates
when we restrict the sample to the largest affiliates, who account for most of the intra-firm trade. In
columns 5 and 7 of table 7 we report the baseline regressions (2) and (3) for the sample of majority-
owned affiliates with more than $150 millions in sales, assets, or net income (MOFA150 in table 1).
In columns 6 and 8 we further restrict the sample to only include parents and affiliates that operate
21

in different primary industries. The estimated coefficients are positive and slightly significant for
flows from the affiliate to the parent, but become insignificant if we remove the diagonal from the
direct requirements matrix. The coefficients estimated from the parent to affiliate trade flow are
negative and significant.
Our baseline conclusions are hardly changed by the previous robustness analysis: I-O linkages
do not consistently predict the size, the existence, or even the direction of intra-firm trade flows.
7 Conclusion
Using confidential firm-level data from the Bureau of Economic Analysis, this paper documents
new facts regarding the behavior of U.S. multinational firms. We find that intra-firm trade is
concentrated among a small number of large affiliates. For the vast majority of affiliates, shipments
to the parent account for a very small fraction of total sales, and shipments from the parent account
for a small share of total input costs. For most U.S. foreign affiliates, local unrelated parties are
the main destination of their sales. In this sense, “horizontal” FDI, as opposed to “vertical” FDI,
seems to better capture the role of the majority of U.S. affiliates abroad.
Despite the lack of intra-firm trade, relative to the overall activity of affiliates, we find that
multinational corporations often own production units that are linked in input-output space: Most
affiliates operate in industries upstream or downstream from those of the parent. Nonetheless,
these I-O links are not accompanied by an intra-firm flow of physical goods between upstream
and downstream units of production. More precisely, the presence of an I-O link between the
parent and the affiliate, as defined by the input-output matrix, does not predict the existence, or
volume, of intra-firm flows. This fact suggests that the primary motive of the multinational firm is
not the ability to transfer physical goods within the corporation. We conjecture that multinational
firms may have a comparative advantage in producing goods related by I-O links which share the
same intangible inputs, such as managerial ability or organizational capital.
22

References
Alfaro, Laura, and Andrew Charlton (2009) ‘Intra-Industry Foreign Direct Investment.’ The Amer-ican Economic Review 99(5), 2096–2119
Antras, Pol (2003) ‘Firms, Contracts, and Trade Structure.’ The Quarterly Journal of Economics118(4), 1375–1418
Antras, Pol, and Elhanan Helpman (2004) ‘Global Sourcing.’ Journal of Political Economy112(3), 552–580
Aten, Bettina, Alan Heston, and Robert Summers (2009) Penn World Table Version 6.3 (Center forInternational Comparisons of Production, Income, and Prices at the University of Pennsylva-nia)
Barro, Robert J., and Jong-Wha Lee (2000) ‘International Data on Educational Attainment: Updatesand Implications.’ CID Working Paper 42
Beck, Thorsten, George Clarke, Alberto Groff, Philip Keefer, and Patrick Walsh (2001) ‘New Toolsin Comparative Political Economy: The Database of Political Institutions.’ World Bank Eco-nomic Review 15(1), 165–176
Becker, Randy A., and Wayne B. Gray (2009) ‘NBER-CES Manufacturing Industry Database.’http://www.nber.org/data/nbprod2005.html
Bernard, Andrew B., and J. Bradford Jensen (1995) ‘Exporters, Jobs, and Wages in U.S. Manufac-turing: 1976-1987.’ Brookings Papers on Economic Activity. Microeconomics pp. 67–119
Bernard, Andrew B., J. Bradford Jensen, and Peter K. Schott (2009) ‘Importers, Exporters, andMultinationals: A Portrait of Firms in the U.S. that Trade Goods.’ In Producer Dynamics: NewEvidence from Micro Data, ed. Tim Dunne, J. Bradford Jensen, and Mark J. Roberts (Universityof Chicago Press) pp. 513–552
Bernard, Andrew B., Stephen J. Redding, and Peter K. Schott (2011) ‘Multi-Product Firms andTrade Liberalization.’ The Quarterly Journal of Economics 126(3), 1271–1318
Bloom, Nicholas, and John Van Reenen (2007) ‘Measuring and Explaining Management PracticesAcross Firms and Countries.’ Quarterly Journal of Economics 122(4), 1351–1408
Borga, Maria, and William J. Zeile (2004) ‘International Fragmentation of Production and the In-trafirm Trade of U.S. Multinational Companies.’ BEA Working Paper 2004-02
Brainard, S. Lael (1997) ‘An Empirical Assessment of the Proximity-Concentration Trade-Off be-tween Multinational Sales and Trade.’ The American Economic Review 87(4), 520–544
Bureau of Economic Analysis (2008) U.S. Direct Investment Abroad, 2004 Final Benchmark Data(Washington, D.C.: U.S. Government Printing Office)
Carr, David L., James R. Markusen, and Keith E. Maskus (2001) ‘Estimating the Knowledge-Capital Model of the Multinational Enterprise.’ American Economic Review 91, 693–708
Costinot, Arnaud, Lindsey Oldensky, and James Rauch (2011) ‘Adaptation and the Boundary ofMultinational Firms.’ Review of Economics and Statistics 93(1), 298–308
23

Ekholm, Karolina, Rikard Forslid, and James R. Markusen (2007) ‘Export-Platform Foreign DirectInvestment.’ Journal of the European Economic Association 5(4), 776–95
Feinberg, Susan, and Michael P. Keane (2006) ‘Accounting for the Growth of MNC-Based TradeUsing a Structural Model of US MNCs.’ American Economic Review 96(5), 1515–58
Garicano, Luis, and Esteban Rossi-Hansberg (2006) ‘Organization and Inequality in a KnowledgeEconomy.’ The Quarterly Journal of Economics 121(4), 1383–1435
Grossman, Gene M., Elhanan Helpman, and Adam Szeidl (2006) ‘Optimal Integration Strategiesfor the Multinational Firm.’ Journal of International Economics 70(1), 216–238
Hanson, Gordon H., Raymond J. Mataloni, Jr., and Matthew J. Slaughter (2005) ‘Vertical Produc-tion Networks in Multinational Firms.’ Review of Economics and Statistics 87(4), 664–678
Harrison, Ann, and Margaret McMillan (2011) ‘Offshoring Jobs? Mulitnationals and U.S. Manu-facturing Employment.’ The Review of Economics and Statistics 93(3), 857–875
Helpman, Elhanan (1984) ‘A Simple Theory of International Trade with Multinational Corpora-tions.’ Journal of Political Economy 92(3), 451–471
Helpman, Elhanan, Marc J. Melitz, and Stephen R. Yeaple (2004) ‘Export versus FDI with Hetero-geneous Firms.’ American Economic Review 94(1), 300–316
Horstmann, Ignatius J., and James R. Markusen (1992) ‘Endogenous Market Structures in Interna-tional Trade (natura facit saltum).’ Journal of International Economics 32(1-2), 109–129
Hortacsu, Ali, and Chad Syverson (2009) ‘Why Do Firms Own Production Chains?’ UnpublishedManuscript
Irrazabal, Alfonso, Andreas Moxnes, and Luca Opromolla (2010) ‘The Margins of MultinationalProduction and the Role of Intra-firm Trade.’ CEPR Discussion Paper 7145
Keller, Wolfang, and Stephen R. Yeaple (2009) ‘Gravity in the Weightless Economy.’ NBER WorkingPaper 15509
Klenow, Peter J., and Andres Rodrıguez-Clare (2005) ‘Externalities and Growth.’ In Handbook ofEconomic Growth, ed. Philippe Aghion and Steven N. Durlauf, vol. 1 (North Holland) pp. 817–861
Markusen, James R. (1984) ‘Multinationals, Multi-plant Economies, and the Gains from Trade.’Journal of International Economics 16(3-4), 205–226
Markusen, James R., and Anthony Venables (2000) ‘The Theory of Endowment, Intra-Industryand Multi-national Trade.’ Journal of International Economics 52(2), 209–234
Mayer, Thierry, and Soledad Zignago (2011) ‘Notes on CEPII’s Distances Measures.’ Working Paper25
McGrattan, Ellen, and Edward C. Prescott (2010) ‘Technology Capital and the U.S. Current Ac-count.’ American Economic Review 100(4), 1493–1522
Nunn, Nathan (2007) ‘Relationship-Specificity, Incomplete Contracts and the Pattern of Trade.’Quarterly Journal of Economics 122(2), 569–600
24
Nunn, Nathan, and Daniel Trefler (2008) ‘The Boundaries of the Multinational Firm: An EmpiricalAnalysis.’ In The Organization of Firms in a Global Economy, ed. Elhanan Helpman, Dalia Marin,and Thierry Verdier (Harvard University Press) pp. 55–83
Ramondo, Natalia, and Andres Rodrıguez-Clare (2009) ‘Trade, Multinational Production, and theGains from Openness.’ NBER Working Paper 15604
Ramondo, Natalia, Veronica Rappoport, and Kim J. Ruhl (2010) ‘The Proximity-ConcentrationTradeoff under Uncertainty.’ Unpublished Manuscript
Yeaple, Stephen R. (2003a) ‘The Complex Integration Strategy of Multinationals and Cross Coun-try Dependencies in the Structure of Foreign Direct Investment.’ Journal of International Eco-nomics 60, 293–314
(2003b) ‘The Role of Skill Endowments in the Structure of US Outward Foreign Direct Invest-ment.’ Review of Economics and Statistics 85(3), 726–734
(2006) ‘Offshoring, Foreign Direct Investment, and the Structure of U.S. Trade.’ Journal ofEuropean Economic Association 4(2-3), 602–611
25

A Figures and Tables
Figure 1: Lorenz Curve: cumulative share of intra-firm trade by cumulative share of affiliates
(a) All
parent to affiliate
affiliate to parent
affiliate to all affiliated parties
0.0
0.2
0.4
0.6
0.8
1.0
Cu
mu
lati
ve in
tra−
firm
flo
w
0.0 0.2 0.4 0.6 0.8 1.0
Cummulative share of affiliates
(b) Manufacturing
parent to affiliate
affiliate to parent
affiliate to all affiliated parties
0.0
0.2
0.4
0.6
0.8
1.0
Cu
mu
lati
ve in
tra−
firm
flo
w
0.0 0.2 0.4 0.6 0.8 1.0
Cummulative share of affiliates
Notes: All includes all majority-owned, nonbank affiliates of nonbank parents, whose sales, assets, or net income (loss)is greater than $25 million. “Manufacturing” includes includes all majority-owned manufacturing affiliates whoseparents’ primary industry is in manufacturing, and whose sales, assets, or net income (loss) is greater than $25 million.
26
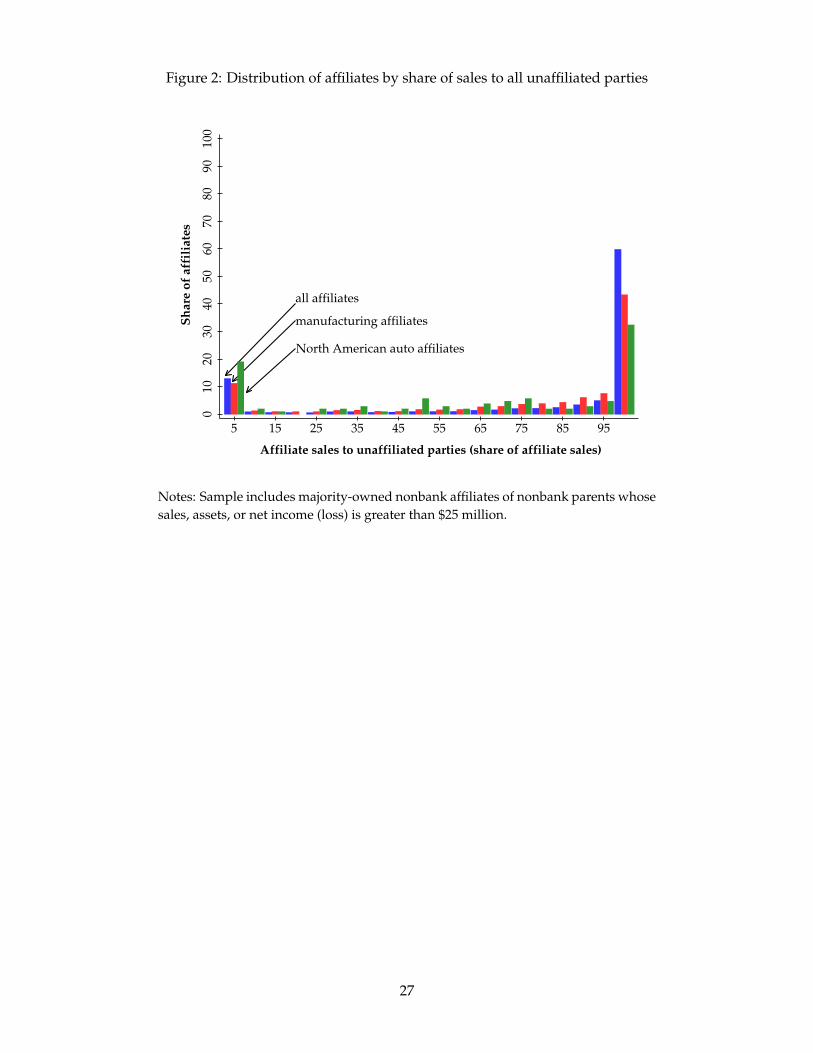
Figure 2: Distribution of affiliates by share of sales to all unaffiliated parties
all affiliates
manufacturing affiliates
North American auto affiliates
010
2030
4050
6070
8090
100
Sh
are
of a
ffil
iate
s
5 15 25 35 45 55 65 75 85 95
Affiliate sales to unaffiliated parties (share of affiliate sales)
Notes: Sample includes majority-owned nonbank affiliates of nonbank parents whosesales, assets, or net income (loss) is greater than $25 million.
27

Figure 3: Distribution of affiliates by share of intra-firm trade
(a) By shipments from parent to affiliate
all affiliates
manufacturing affiliates
North American auto affiliates
010
2030
4050
6070
8090
100
Sh
are
of a
ffil
iate
s
5 15 25 35 45 55 65 75 85 95
Shipments from parent (share of affiliate input costs)
(b) By shipments from affiliate to parent
all affiliates
manufacturing affiliates
North American auto affiliates
010
2030
4050
6070
8090
100
Sh
are
of a
ffil
iate
s
5 15 25 35 45 55 65 75 85 95
Shipments to parent (share of affiliate sales)
Notes: All includes all majority-owned, nonbank affiliates of nonbank parents. Manufacturing includes all majority-owned manufacturing affiliates whose parents’ primary industry is in manufacturing. North American autos includes allmajority-owned affiliates whose primary industry is automotive, and whose parents’ primary industry is automotive,operating in Canada and Mexico. All of the samples are made up of affiliates whose sales, assets, or net income (loss)is greater than $25 million.
28

Figure 4: Direct requirements coefficients and I-O links
(a) Industry-pair direct requirements
3100
3200
3300
3400
Pro
du
cin
g in
du
stry
3100 3200 3300 3400
Using industry
(b) Distribution of parent-affiliate industry pairs
3100
3200
3300
3400
In
du
stry
of
par
ent
3100 3200 3300 3400
Industry of affiliate
Left Panel: Direct requirements coefficients for industry pairs in 2002; bubbles are proportional to the size of the di-rect requirements coefficient. The direct requirements coefficient is the value of goods needed from the producing(upstream) industry in order to produce one dollar of output in the using (downstream) industry. Manufacturingindustries only (international surveys industry codes 3111–3399).
Right Panel: Frequency of the (primary) industries of parent-affiliate pairs; bubbles are proportional to the number ofparent-affiliate pairs in a given industry pair. The sample includes majority-owned manufacturing affiliates of manu-facturing parents whose sales, assets, or net income (loss) is greater than $25 million.
29

Figure 5: Distribution of affiliates by share of intra-firm trade and vertical links
(a) By shipments from parent to affiliate
parent and affiliate in same industry
parent and affiliate in different industries
010
2030
4050
6070
8090
100
Sh
are
of a
ffil
iate
s
5 15 25 35 45 55 65 75 85 95
Shipments from parent (share of affiliate input costs)
(b) By shipments from affiliate to parent
parent and affiliate in same industry
parent and affiliate in different industries
010
2030
4050
6070
8090
100
Sh
are
of a
ffil
iate
s
5 15 25 35 45 55 65 75 85 95
Sales to parent (share of affiliate sales)
Notes: Industry refers to the primary industry of the parent and affiliate. Sample includes majority-owned manufactur-ing affiliates of manufacturing parents whose sales, assets, or net income (loss) is greater than $25 million.
30

Table 1: Sample construction
Parent-Affiliate in all non-bank sectors Parent-Affiliate in manufacturing
All Reporting MOFA25 MOFA150 All Reporting MOFA25 MOFA150
(1) (2) (3) (4) (5) (6) (7) (8)
# Affiliates 42, 547 25, 464 15, 451 5, 888 13, 163 8, 174 4, 949 1, 632# Parents 3, 444 2, 412 1, 673 802 1, 458 1, 049 734 351Total parent sales 7, 517, 056 7, 207, 894 6, 520, 263 5, 320, 874 3, 089, 664 3, 032, 799 2, 788, 527 2, 443, 003Total affiliate employment 10, 445 10, 149 7, 335 5, 179 4, 646 4, 530 3, 323 2, 286Affiliate sales 3, 976, 341 3, 939, 894 3, 045, 381 2, 584, 693 1, 705, 473 1, 691, 360 1, 304, 586 1, 112, 004
to parent 270, 225 246, 319 137, 626 124, 027to unaffiliate in US 55, 989 46, 260 25, 943 21, 425to local unaffiliate 1, 718, 548 1, 401, 975 657, 165 544, 027to local affiliate 169, 560 149, 973 91, 756 80, 717to affiliate in 3rd countries 462, 698 420, 991 253, 115 230, 435to unaffiliate in 3rd countries 368, 361 319, 175 138, 980 111, 374
Sales of goods from parent to affiliate 136, 744 109, 815 14, 199 69, 408for further processing 63, 826 59, 484for resale 40, 948 6, 944of capital equipment 703 497of other goods 4, 337 2, 483
# Parent industries 197 192 182 160 76 76 74 66# Affiliate industries 202 200 195 182 77 77 77 74# Countries 200 173 159 119 150 124 104 76
Notes: Columns 1–4 include all nonbank parent-affiliate pairs, while columns 5–8 include only the parent-affiliate pairs in which the primary industry of boththe parent and affiliate are in manufacturing. Columns 1 and 5 describe all affiliates of all parents. Columns 2 and 6 describe affiliates whose sales, assets, or netincome (loss) is greater than $10 million. Columns 3–4 and 7–8 describe Majority-Owned Foreign Affiliates (MOFAs) whose sales, assets, or net income (loss) isgreater than $25 or $150 million. Sales are expressed in millions of dollars. Employment is expressed in thousands of employees.
31

Table 2: Summary statistics
All Parent-Affiliate in manufacturing
Mean Median Weighted Ave Mean Median Weighted Ave(1) (2) (3) (4) (5) (6)
Panel 1: Number of industries# A industries 1.28 1.00 1.45 1.43 1.00 1.58# P industries 2.38 2.00 3.29 2.30 1.00 2.72
Panel 2: Share of sales in primary industryAffiliate 0.96 1.00 0.94 0.94 1.00 0.92Affiliate-country aggregate† 0.91 1.00 0.85 0.90 1.00 0.84Parent 0.84 0.99 0.78 0.85 1.00 0.84
Panel 3: Share of affiliate salesto unaffiliated parties 0.78 0.99 0.78 0.73 0.91 0.67to affiliated parties 0.22 0.01 0.22 0.27 0.09 0.33to local unaffiliate 0.65 0.92 0.69 0.57 0.66 0.53to local affiliate 0.07 0.00 0.04 0.06 0.00 0.06to parent 0.06 0.00 0.08 0.07 0.00 0.11to U.S. unaffiliate 0.02 0.00 0.02 0.02 0.00 0.03to third country affiliate 0.10 0.00 0.10 0.14 0.01 0.17to third country unaffiliate 0.10 0.00 0.07 0.14 0.00 0.11
Panel 4: Share of affiliate input costs from parenttotal 0.04 0.00 0.04 0.06 0.00 0.06for further processing 0.02 0.00 0.02 0.05 0.00 0.05for distribution 0.02 0.00 0.01 0.00 0.00 0.00of capital equipment 0.00 0.00 0.00 0.00 0.00 0.00
Notes: Panels 1–3 include all majority-owned affiliates with sales, assets, or net income (loss), greater than $25 million. Panel 4 includes allmajority-owned affiliates with sales, assets, or net income (loss), greater than $150 million. Columns 2 and 5 report the average of the 9 firmssurrounding the median. In columns 3 and 6 observations are weighted by affiliate employment. †An observation is the aggregate over allaffiliates of a parent, by country.
32

Table 3: Descriptive statistics. I-O linkages and intra-firm shipments
IP = IA IP 6= IA
drap = drpa > 0 all drap > 0 drpa > 0 other(1) (2) (3) (4) (5)
Panel 1: Number of affiliatestotal 3103 1808 1393 1332 139share with shipments to parent > 0 0.46 0.44 0.47 0.45 0.31share with shipments to any affiliated party > 0 0.76 0.77 0.80 0.79 0.66share with shipments to any unaffiliated party > 0 0.92 0.92 0.93 0.91 0.94share with shipments from parent > 0 0.50 0.48 0.50 0.50 0.36
Panel 2: Avg. affiliate shipment size (share of total sales)to all affiliated 0.27 0.26 0.26 0.26 0.23to all unaffiliated 0.73 0.74 0.74 0.74 0.77to local unaffiliated 0.57 0.56 0.56 0.55 0.62to local unaffiliated 0.06 0.07 0.07 0.07 0.07to parent 0.08 0.06 0.05 0.05 0.06to unaffiliated in U.S. 0.03 0.02 0.02 0.02 0.02to third-country affiliated 0.13 0.14 0.13 0.14 0.10to third-country unaffiliated 0.13 0.16 0.16 0.16 0.14
Panel 3: Avg. shipment size from parent (share of total input costs)total 0.05 0.06 0.05 0.06 0.08for further processing 0.05 0.05 0.05 0.05 0.07for resale 0.00 0.00 0.00 0.00 0.01of capital equipment 0.00 0.00 0.00 0.00 0.00
Notes: The sample includes manufacturing affiliates whose parent’s primary industry is in manufacturing. Panels 1 and 2 include affiliateswhose sales, assets, or net income (loss) is greater than $25 million. Panel 3 includes affiliates whose sales, assets, or net income (loss) isgreater than $150 million. drap > 0 refers to affiliates whose primary industry of operation supplies inputs into the primary industry of theparent. drpa > 0 refers to affiliates whose primary industry of operation uses as inputs the primary industry of the parent.
33

Table 4: I-O linkages and FDI activity
Dep. Variable # affiliatesapc employmentapc(1) (2) (3) (4) (5) (6)
drpa 28.746∗∗∗ 16.568∗∗∗ 29, 290.5∗∗∗ 10, 433.2∗∗∗
(1.221) (0.657) (3, 998.6) (719.2)
drap 28.173∗∗∗ 14.933∗∗∗ 28, 590.5∗∗∗ 9, 477.5∗∗∗
(1.378) (0.629) (3, 996.9) (646.6)
log(gdpc) 1.310∗∗∗ 1.247∗∗∗ 0.777∗∗∗ 1, 289.1∗∗∗ 1, 303.2∗∗∗ 502.8∗∗∗
(0.062) (0.063) (0.036) (174.1) (186.7) (37.4)
log(gdplc) 0.797∗∗∗ 0.783∗∗∗ 0.601∗∗∗ 668.6∗∗∗ 683.6∗∗∗ 332.2∗∗∗
(0.157) (0.155) (0.121) (177.0) (187.8) (80.1)
log(distancec) −0.689∗∗∗ −0.620∗∗∗ −0.374∗∗∗ −713.6∗∗∗ −697.8∗∗∗ −256.5∗∗∗(0.081) (0.076) (0.059) (124.1) (128.1) (42.1)
log(lawc) 1.402∗∗∗ 1.452∗∗∗ 0.974∗∗∗ 1345.0∗∗∗ 1, 470.9∗∗∗ 617.9∗∗∗
(0.287) (0.292) (0.236) (310.8) (336.3) (153.2)
log(k/gdpc) −0.465∗ −0.542∗∗ −0.424∗∗ −327.3 −414.4 −212.7(0.267) (0.259) (0.199) (265.2) (273.3) (132.2)
log(schoolingc) 0.810 0.601 0.111 451.5 261.2 19.7(0.676) (0.633) (0.493) (672.9) (674.6) (321.7)
Ind. controls yes yes yes yes yes yesParent controls yes yes yes yes yes yesObservations 379, 456 379, 456 374, 528 379, 456 379, 456 374, 528Positive obs. 2, 378 2, 378 1, 383 2, 327 2, 327 1, 341
Pseudo R2 0.11 0.21 0.17 0.05 0.10 0.09
Sample MOFA25 MOFA25 MOFA25 MOFA25 MOFA25 MOFA25
No diag. No diag.
Notes: Results from the Tobit regression in (1). In columns 1–3 the dependent variable is the number of affiliates inindustry a in country c owned by parents in industry p. In columns 4–6, the dependent variable is aggregate employ-ment in affiliates in industry a in country c owned by parents in industry p. In columns 3 and 6, the sample does notinclude parent affiliate pairs that share the same primary industry. Industry controls include physical and human cap-ital intensities, as well as their interaction with the respective country factor abundance. Parent controls include totalemployment and total number of foreign affiliates in the firm. Robust standard errors, clustered at the country-mainindustry of the parent level, are in parentheses. Levels of significance are denoted ∗∗∗ p < 0.01, ∗∗ p < 0.05, and ∗
p < 0.1.
34

Table 5: I-O linkages and intra-firm shipments
Dep. Variable Yap Ypa
(1) (2) (3) (4) (5) (6)
drap 0.142 0.004(0.101) (0.147)
drpa −0.210 0.462(0.134) (0.348)
log(gdpc) 0.003 0.003 0.002 0.012 0.012 0.002(0.007) (0.007) (0.008) (0.010) (0.010) (0.011)
log(gdplc) −0.018 −0.018 −0.028 0.054∗ 0.054∗ 0.018(0.027) (0.027) (0.034) (0.028) (0.028) (0.033)
log(distancec) −0.075∗∗∗ −0.075∗∗∗ −0.081∗∗∗ −0.039∗∗ −0.039∗∗ −0.042∗∗(0.011) (0.011) (0.012) (0.016) (0.016) (0.019)
log(lawc) −0.147∗∗ −0.146∗∗ −0.119 −0.312∗∗ −0.314∗∗ −0.257∗(0.068) (0.067) (0.074) (0.127) (0.127) (0.147)
log(k/gdpc) 0.036∗∗ 0.036 0.047 0.029 0.031 0.023(0.046) (0.046) (0.056) (0.049) (0.049) (0.063)
log(schoolingc) 0.220∗ 0.220∗ 0.078 0.126 0.126 0.091(0.114) (0.114) (0.131) (0.143) (0.143) (0.184)
Ind. controls yes yes yes yes yes yesParent controls yes yes yes yes yes yesObservations 4, 717 4, 717 1, 728 4, 714 4, 714 1, 728
Pseudo R2 0.07 0.07 0.10 0.03 0.03 0.03
Sample MOFA25 MOFA25 MOFA25 MOFA25 MOFA25 MOFA25
No diag. No diag.
Notes: The sample includes majority-owned manufacturing affiliates with sales, assets, or net income (loss) greater than$25 million. In columns 1–3, the dependent variable, Yap, is shipments from the affiliate to the parent as a share of theaffiliate’s total sales. drap is the direct requirements coefficient of the primary industry of the affiliate in the productionof the parent’s primary industry. In columns 4–6, the dependent variable, Ypa, is shipments of goods from the parentto the affiliate as a share of the affiliate’s total input costs. drpa is the direct requirements coefficient of the primaryindustry of the parent in the production of the affiliate’s primary industry. The samples in columns 3 and 6 includeonly parent-affiliate pairs in which the parent’s main industry differs from that of the affiliate. Industry controls includephysical and human capital intensities, as well as their interaction with the respective country factor abundance. Parentcontrols include total employment and total number of foreign affiliates in the firm. Robust standard errors, clusteredat the country-main industry of the parent level, are in parentheses. Levels of significance are denoted ∗∗∗ p < 0.01, ∗∗
p < 0.05, and ∗ p < 0.1.
35

Table 6: Robustness. Alternative empirical specifications
Dep. Variable d(Yap) d(Ypa) log(Yap) log(Ypa)
(1) (2) (3) (4) (5) (6) (7) (8)
drap −0.089 −0.002(0.112) (0.182)
drpa −0.420∗∗∗ 0.005(0.110) (0.163)
log(drap) 0.021 −0.020(0.028) (0.037)
log(drpa) −0.027 0.008(0.025) (0.034)
log(gdpc) 0.031∗∗∗ 0.025∗∗ 0.016∗∗ 0.007 −0.248∗∗∗ −0.174∗ −0.010 0.074(0.009) (0.013) (0.008) (0.012) (0.064) (0.091) (0.059) (0.096)
log(gdplc) 0.038 0.012 0.080∗∗∗ 0.046 −0.540∗∗ −0.500 −0.125 −0.309(0.031) (0.045) (0.026) (0.042) (0.248) (0.346) (0.204) (0.298)
log(distancec) −0.076∗∗∗ −0.085∗∗∗ −0.009 −0.011 −0.582∗∗∗ −0.678∗∗∗ −0.395∗∗∗ −0.431∗∗∗
(0.012) (0.018) (0.012) (0.018) (0.086) (0.117) (0.069) (0.096)
log(lawc) −0.070 −0.036 −0.248∗∗∗ −0.226∗∗ −0.779 −0.433 −0.991∗∗ −0.930(0.063) (0.091) (0.053) (0.091) (0.520) (0.750) (0.385) (0.580)
log(k/gdpc) 0.006 0.042 −0.059 −0.016 0.160 0.001 0.297 −0.483(0.056) (0.085) (0.053) (0.079) (0.425) (0.658) (0.365) (0.566)
log(schoolingc) 0.249∗ −0.047 0.043 −0.062 2.439∗∗ 1.000 0.007 1.201(0.132) (0.216) (0.119) (0.206) (1.131) (1.747) (0.882) (1.530)
Ind. controls yes yes yes yes yes yes yes yesParent controls yes yes yes yes yes yes yes yesObservations 4, 717 1, 728 4, 714 1, 728 2, 046 646 2, 169 641R2adj 0.05 0.06 0.04 0.04 0.10 0.09 0.06 0.07
Sample MOFA25 MOFA25 MOFA25 MOFA25 MOFA25 MOFA25 MOFA25 MOFA25
No diag. No diag. No diag. No diag.
Notes: The sample includes majority-owned manufacturing affiliates with sales, assets, or net income (loss) greaterthan $25 million. Sample No diag. excludes parent-affiliate pairs in which the parent and affiliate operate in the sameindustry. Columns 1–2 and 3–4 correspond to the linear probability model in equation (6), for flows from affiliate toparent (Yap) and parent to affiliate (Ypa). Columns 5–6 and 7–8 report the results for the OLS estimation of equation(7), for intra-firm flows to and from the parent. Industry controls include physical and human capital intensities of theparent’s primary industry, as well as their interaction with the respective country factor abundance. Parent controlsinclude total employment and total number of foreign affiliates in the firm. Robust standard errors, clustered at thecountry-main industry of the parent level, are in parentheses. Levels of significance are denoted ∗∗∗ p < 0.01, ∗∗
p < 0.05, and ∗ p < 0.1.
36

Table 7: Robustness. Alternative measure of I-O links and sample
Dep. Variable Yap Ypa Yap Ypa
(1) (2) (3) (4) (5) (6) (7) (8)
vap 0.127 0.009(0.097) (0.120)
vpa −0.106 0.449∗∗
(0.125) (0.220)
drap 0.237∗ 0.085(0.142) (0.141)
drpa −0.381∗∗∗ −0.278∗
(0.099) (0.156)
log(gdpc) 0.004 0.004 0.013 0.013 −0.028∗∗∗ −0.018 −0.002 −0.010(0.007) (0.007) (0.010) (0.010) (0.010) (0.013) (0.008) (0.014)
log(gdplc) −0.016 −0.016 0.055∗ 0.054∗ −0.020 −0.006 0.001 −0.002(0.027) (0.027) (0.028) (0.028) (0.033) (0.043) (0.024) (0.043)
log(distancec) −0.075∗∗∗ −0.075∗∗∗ −0.041∗∗∗ −0.041∗∗ −0.066∗∗∗ −0.059∗∗∗ −0.041∗∗∗ −0.050∗∗∗
(0.011) (0.015) (0.016) (0.016) (0.015) (0.016) (0.010) (0.014)
log(lawc) −0.141∗∗ −0.143∗∗ −0.310∗∗ −0.310∗∗ −0.083 −0.090 −0.106∗ −0.161∗
(0.067) (0.068) (0.126) (0.128) (0.089) (0.111) (0.061) (0.084)
log(k/gdpc) 0.034 0.034 0.027 0.025 −0.013 −0.027 0.029 0.037(0.046) (0.046) (0.050) (0.050) (0.056) (0.067) (0.051) (0.083)
log(schoolingc) 0.238∗∗ 0.237∗∗ 0.135 0.137 0.091 −0.079 0.020 −0.222(0.114) (0.114) (0.144) (0.143) (0.150) (0.194) (0.092) (0.151)
Ind. controls yes yes yes yes yes yes yes yesParent controls yes yes yes yes yes yes yes yesObservations 4, 717 4, 717 4, 714 4, 717 1, 567 524 1, 567 524Pseudo R2 0.08 0.08 0.03 0.03 0.12 0.31 0.10 0.15
Sample MOFA25 MOFA25 MOFA25 MOFA25 MOFA150 MOFA150 MOFA150 MOFA150
No diag. No diag. No diag. No diag.
Notes: The MOFA25 sample includes majority-owned manufacturing affiliates with sales, assets, or net income (loss)greater than $25 million. The MOFA150 sample includes majority-owned manufacturing affiliates with sales, assets, ornet income (loss) greater than $150 million. The dependent variable Yap is sales from the affiliate to the parent as a shareof the affiliate’s total sales; Ypa is shipments of goods from the parent to the affiliate as a share of the affiliate’s totalinput costs. The sub-sample No diag. is restricted to parent-affiliate pairs in which the parent and affiliate operate indifferent industries (for the measure v, the diagonal elements of the direct requirements coefficient matrix are omitted).Industry controls include physical and human capital intensities of the parent’s primary industry, as well as theirinteraction with the respective country factor abundance. Parent controls include total employment and total numberof foreign affiliates in the firm. Robust standard errors, clustered at the country-main industry of the parent level, arein parentheses. Levels of significance are denoted ∗∗∗ p < 0.01, ∗∗ p < 0.05, and ∗ p < 0.1.
37

B For Online Publication
Table B1: BEA 2004 benchmark survey reporting thresholds
All Affiliates Majority-Owned Affiliates> $10 million > $25 million > $150 million
Total affiliate sales X X Xto parent X Xto U.S. unaffiliate X Xto local unaffiliate X Xto local affiliate X Xto third-country affiliate X Xto third-country unaffiliate X X
Total parent sales of goods to affiliate X Xin goods for further processing Xin goods for resale Xin capital goods X
Affiliate employment X X XAffiliate cost of goods sold X XAllocated expenses and sales of services
from the parent to the affiliate X Xfrom the affiliate to the parent X X
Notes: Reporting thresholds refer to affiliate sales, assets, or net income (loss).
Table B2: Summary by region
Obs Mean Std 25pc 50pc 75pc
Sales to unaffiliated parties, as a share of total salesAll 4911 0.73 0.34 0.58 0.91 1.00OECD 3093 0.74 0.34 0.59 0.90 1.00Non-OECD 1818 0.73 0.36 0.57 0.92 1.00North America 643 0.70 0.36 0.50 0.88 1.00Latin America, not Mexico 400 0.81 0.29 0.75 0.96 1.00Europe 2668 0.72 0.34 0.56 0.88 1.00Africa 93 0.78 0.37 0.71 0.99 1.00Middle East 45 0.67 0.40 0.27 0.88 1.00Asia 1062 0.75 0.35 0.61 0.95 1.00
Shipments from parent, as a share of total input costsAll 4908 0.07 0.29 0.00 0.00 0.04OECD 3093 0.08 0.34 0.00 0.00 0.04Non-OECD 1815 0.06 0.16 0.00 0.00 0.04North America 643 0.21 0.69 0.00 0.04 0.22Latin America, not Mexico 400 0.06 0.14 0.00 0.01 0.04Europe 2667 0.04 0.12 0.00 0.00 0.01Africa 92 0.03 0.09 0.00 0.00 0.01Middle East 45 (D) (D) (D) (D) (D)Asia 1061 0.09 0.18 0.00 0.00 0.07
Notes: The sample includes all majority-owned affiliates with sales, assets, or net income (loss), greater than $25 million.25, 50, and 75 percentiles report the average of the 9 firms surrounding the percentile affiliate. (D) Suppressed to avoiddisclosure of firm-level data.
38

Table B3: Summary by industry
Obs Mean Std 25pc 50pc 75pc
Sales to unaffiliated parties, as a share of total salesAll 4911 0.73 0.34 0.58 0.91 1.00Food, beverage, tobacco 481 0.80 0.32 0.75 0.98 1.00Textile and apparel 89 0.76 0.34 0.58 0.96 1.00Chemicals 1203 0.76 0.34 0.66 0.94 1.00Glass and stone 84 0.83 0.25 0.76 0.94 1.00Metal 104 0.77 0.33 0.67 0.95 1.00Metal products 201 0.75 0.30 0.60 0.88 0.99Machinery 485 0.64 0.36 0.33 0.79 0.97Electronics 573 0.68 0.38 0.41 0.90 1.00Electrical equipment 208 0.63 0.38 0.22 0.78 0.97Transportation 635 0.75 0.32 0.61 0.88 1.00Others 848 0.74 0.34 0.58 0.91 1.00
Shipments from parent, as a share of total input costsAll 4908 0.07 0.29 0.00 0.00 0.04Food, beverage, tobacco 481 0.01 0.05 0.00 0.00 0.00Textile and apparel 89 0.05 0.16 0.00 0.00 0.01Chemicals 1203 0.06 0.14 0.00 0.00 0.04Glass and stone 84 0.06 0.14 0.00 0.01 0.04Metal 103 0.06 0.15 0.00 0.00 0.03Metal products 201 0.07 0.15 0.00 0.01 0.07Machinery 485 0.07 0.16 0.00 0.00 0.07Electronics 572 0.12 0.37 0.00 0.00 0.08Electrical equipment 207 0.10 0.21 0.00 0.00 0.07Transportation 635 0.09 0.52 0.00 0.00 0.02Others 848 0.08 0.34 0.00 0.00 0.06
Notes: The sample includes all majority-owned affiliates with sales, assets, or net income (loss), greater than $25 million.25, 50, and 75 percentiles report the average of the 9 firms surrounding the percentile affiliate.
39

Table B4: 1999 summary statistics
All Parent-Affiliate in manufacturing
Mean Median Weighted Ave Mean Median Weighted Ave(1) (2) (3) (4) (5) (6)
Panel 1: Number of industries# A industries 1.41 1.00 1.65 1.59 1.00 1.79# P industries 2.33 2.00 2.94 2.48 2.00 2.68
Panel 2: Share of sales in primary industryAffiliate 0.95 1.00 0.91 0.92 1.00 0.90Affiliate-country aggregate† 0.90 1.00 0.85 0.89 1.00 0.87Parent 0.85 0.98 0.80 0.82 0.90 0.81
Panel 3: Share of affiliate salesto unaffiliated parties 0.79 0.99 0.77 0.75 0.90 0.66to affiliated parties 0.21 0.01 0.23 0.25 0.10 0.34to local unaffiliate 0.67 0.92 0.68 0.59 0.68 0.52to local affiliate 0.05 0.00 0.03 0.04 0.00 0.04to parent 0.06 0.00 0.09 0.08 0.00 0.14to U.S. unaffiliate 0.02 0.00 0.02 0.03 0.00 0.03to third country affiliate 0.09 0.00 0.11 0.13 0.01 0.16to third country unaffiliate 0.11 0.00 0.07 0.14 0.00 0.11
Panel 4: Allocated expenses and sales of servicesto the parent (share of input costs) 0.01 0.00 0.01 0.01 0.00 0.01from the parent (share of aff. sales) 0.01 0.00 0.01 0.00 0.00 0.00
Panel 5: Share of affiliate input costs from parenttotal 0.06 0.00 0.09 0.09 0.01 0.15for further processing 0.03 0.00 0.08 0.09 0.00 0.14for distribution 0.02 0.00 0.01 0.00 0.00 0.01of capital equipment 0.00 0.00 0.00 0.00 0.00 0.00
Notes: Panels 1–4 include all majority-owned affiliates with sales, assets, or net income (loss), greater than $50 million. Panel 5 includes allmajority-owned affiliates with sales, assets, or net income (loss), greater than $100 million. Columns 2 and 5 report the average of the 9 firmssurrounding the median. In columns 3 and 6 the average is weighted by affiliate employment. †An observation is the aggregate over all affiliatesof a parent, by country.
40