hotel development is eating up residential space … · the internet creates unprecedented benefits...
TRANSCRIPT

1
Hotel Development Is Eating Up Residential Space In New York City
Combating Rising rents in the big apple With An innovative Approach to Tourism and Home Sharing

About the Internet Association
The Internet Association’s mission is to foster innovation, promote economic growth, and empower people through the free and open Internet. The Internet creates unprecedented benefits for society, and as the voice of the world’s leading Internet companies, we ensure stakeholders understand these benefits. The Internet Association represents the interests of leading Internet companies including Airbnb, Amazon, Auction.com, Coinbase, DoorDash, Dropbox, eBay, Etsy, Expedia, Facebook, Fanduel, Google, Groupon, Handy, IAC, Intuit, LinkedIn, Lyft, Monster Worldwide, Netflix, Pandora, PayPal, Pinterest, Practice Fusion, Rackspace, reddit, Salesforce.com, Snapchat, SurveyMonkey, TransferWise, TripAdvisor, Turo, Twitter, Uber Technologies, Inc., Yahoo!, Yelp, Zenefits, and Zynga. www.InternetAssociation.org.
2
table of contentsOverview ................................................................................................................................................... 4
Summary Of Findings ................................................................................................................................ 5
1.1 Record Levels of Visitors, Record Levels of Hotel Rooms ................................................................. 5
1.2 As Hotels Boom, So Housing Suffers ................................................................................................. 5
1.3 The Most Affected Neighborhoods ..................................................................................................... 9
1.4 The Housing That Could Have Been .................................................................................................. 11
1.5 New York City’s Land Use Laws Promote Hotel Development Over Housing, Industrial Businesses 14
1.6 Conclusion .......................................................................................................................................... 15
Appendices ................................................................................................................................................ 16
Appendix A: Methodology ......................................................................................................................... 16
Appendix B: Hotel Developments Resulting In Loss Of Residential Housing .......................................... 18
Appendix C: New Space In Buildings With Hotel Use In 2016, Potential Affordable Units ....................... 19
Appendix D: PLUTO Fields Used In Analysis ........................................................................................... 20
Endnotes ................................................................................................................................................... 21
3

New York City is facing an affordable housing crisis.
Between 2008 and 2014 the city’s total number of housing units increased by just 0.85%.¹ Insufficient residential space helped push the city’s 5-year (2010-2014) median rent up by 9% over the previous period (2005-2009). The median condominium sales price rose by 28% from 2010 to 2015. And more than 5% of affordable housing rental units disappeared between 2010 and 2014.² Meanwhile, the population has grown rapidly, rising 4.6% between 2010 and 2015, exacerbating the demand for more housing and particularly affordable housing.
So, why has the number of housing units not kept up with population growth and demand? Where has the existing affordable unit stock gone? While frustration has grown and some have turned to blaming short-term rental platforms for housing price increases,
active units by the end of 2016 and by 32% to 135,000 units by the year 2019.³ In 2014 and 2015 alone, the city brought on 61 new or renovated hotels, adding over 11,000 rooms to the total supply. And from January 2016 through the end of 2019, another 147 hotel projects are expected to come online.⁴
This pace of construction is the fastest it has been in generations – as one industry expert noted, “We have not seen anything like today’s construction since the 1920s and early 1930s.”⁵
However, it is not simply an issue of hotel growth. Using data for the years 2010 and 2016 from the publicly-available PLUTO database on land use from the government of the City of New York, this report demonstrates that hotel development between 2010-2016 has directly resulted in the loss of more than 750,000 square feet of preexisting residential space and 773 preexisting residential units. Of those units lost, over half (398 or 51%) were in buildings converted from a majority residential use to a majority hotel use in that period.
In addition to this loss of existing housing, new and expanded hotels took over building area that could have been used for permanent housing. If just half of the total new hotel space had been used for residential purposes and 20% of that space was dedicated to affordable housing,⁶ more than 2.9 million square feet of market-rate housing and over 727,000 square feet of affordable housing could have been created.
That is the equivalent of 3,878 market-rate and 969 affordable one-bedroom units, assuming an average unit size of 750 square feet.⁷
Far from exacerbating the crisis, home-sharing platforms help local residents stay in their homes, promote active use of properties that may otherwise sit vacant, and allow the City to accommodate the surging tourist trade through existing residential
Overview
This pace of construction is the fastest it has been in generations – as one industry expert noted, “We have not seen anything like today’s construction since the 1920s and early 1930s.”
this report shows that an unprecedented boom in hotels and hotel rooms has directly contributed to: 1) a loss of residential space, 2) a missed opportunity for increasing residential living area and units, and 3) increased demand and price pressures within the housing market.
In fact, hotel rooms increased by 34% from 2008-2014, far outpacing growth in residential units and population during the same period. This trend is set to continue, with the number of hotel rooms projected to increase by another 18% to approximately 120,000
4

summary offindings
properties.
Instead of falsely vilifying home-sharing platforms for New York’s housing crunch, it’s time to start looking into the actual causes, including the historic growth of hotels over the past decade, which has eaten up huge amounts of land and preexisting residential housing.
Rather than further sacrificing scarce city land for hotel use while losing additional residential space in the process, New York should embrace home-sharing platforms that give families a lifeboat in a rising tide of rents.
⁹
750,000 FT2
Hotel development between 2010 & 2016 has directly resulted in the loss of
of preexisting residential space and
773 preexisting residential units.
1.1: RECORD LEVELS OF VISITORS, RECORD LEVELS OF HOTEL ROOMSNew York City is experiencing a tourist boom.
In 2015, more than 58 million visitors came to the city and 59.7 million are forecast for 2016, which would make it the seventh consecutive year of record-breaking tourism.⁸ Going forward, the city’s official goal for 2021 is to have 67 million visitors in that year.
Mirroring this, the city has witnessed a surge in hotel development, with the total number of hotel rooms soaring from 73,300 in 2007 to a projected 120,000 by the end of 2016, an increase of 64% over that period.¹⁰ The total number of hotel rooms is expected to reach 135,000 rooms by 2019. ¹¹
Growth in both tourism and hotel construction is projected to continue, but the rate of hotel room growth has increased in recent years (with the biggest increase expected this year in 2016) while the rate of visitor growth has slowed. Yet, despite increasing evidence of overbuilding (see Figures 1 and 2), especially in Manhattan,12 hotel construction has reached a pace not seen for nearly 100 years and one that exceeds needs.13 As one market research firm recently concluded, “New York’s hotel market is still adding supply faster than demand can keep up.”14
1.2: AS HOTELS BOOM, SO HOUSING SUFFERSWhile the boom in New York City hotel growth is well reported, it has generally not been discussed in the context of the residential housing market or its impacts on housing.
5

Source: NYC & Company (June 15, 2016; September 6, 2016); NYC Office of the Mayor (March 18, 2015)
Source: NYC & Company (June 15, 2016; September 6, 2016); NYC Office of the Mayor (March 18, 2015)
73.3 76.4 80.9 86.6 89.7 92 95.6102 107
120
45.9 47.1 45.6 48.8 50.9 52.7 54.3 56.5 58.3 59.7
0
20
40
60
80
100
120
140
2007 2008 2009 2010 2011 2012 2013 2014 2015 2016(Projected)
Figure 1: Annual Visitor and Hotel Room Counts in New York City
Hotel Rooms (Thousands) Visitors (Millions)
4.25.9
7
4.33.5 3.9
6.7
4.9
12.1
2.6
-3.2
7
3.62.6 3
4.13.2
2.4
-4
-2
0
2
4
6
8
10
12
14
2008 2009 2010 2011 2012 2013 2014 2015 2016(Projected)
Figure 2: YOY Visitor and Hotel Room Growth in New York City
Hotel Room % Increase Visitors % Increase
6

Consequently, the paper turned to data for 2010 and 2016 from New York City’s Primary Land Use Tax Lot Output (PLUTO) database, which provides building and land characteristics including use classification, square footage, number of units, and much more, to examine this issue. The paper analyzed changes in building characteristics between 2010 and 2016, specifically changes in buildings with 2016 hotel use classifications. It then calculated impacts by location, type, and more. A full methodology is offered in Appendix A.
The analysis revealed that hotel development between 2010 and 2016 has resulted in the loss of more than 750,000 square feet of preexisting residential space and 773 residential housing units.15 As shown in Table 1, Brooklyn was the hardest hit borough, with 488 units eliminated, which is not surprising considering the number of hotels has tripled since 2006.16 The borough of Manhattan lost 270 units and Queens lost 15 units. In the Bronx and Staten Island, where there are only 25 and nine hotels respectively, there was no measurable impact on preexisting residential space or units due to hotel development.17
TABLE 1HOTEL DEVELOPMENT AND RESIDENTIAL AREA LOSS BETWEEN 2010 AND 2016
Borough CD
Residential Area of
Converted Buildings in
2010
Residential Units of
Converted Buildings in
2010
Residential Area in
2016 After Conversion
Residential Units
2016 After Conversion
Change in Residential
Area
Change in Residential
Units
Brooklyn
1 8,732 11 0 0 -8,732 -112 25,000 247 0 0 -25,000 -2473 11,232 33 0 0 -11,232 -336 67,068 125 0 0 -67,068 -1257 50,753 49 0 0 -50,753 -49
10 17,880 20 0 0 -17,880 -2016 3,039 3 0 0 -3,039 -3
Total 183,704 488 0 0 -183,704 -488
Manhattan
1 300,000 0 0 0 -300,000 02 10,052 8 0 0 -10,052 -83 34,140 43 42,264 35 8,124 -84 21,542 17 50,794 54 29,252 375 116,766 140 36,739 45 -80,027 -957 104,850 258 37,200 62 -67,650 -196
Total 587,350 466 166,997 196 -420,353 -270
Queens
1 52,062 8 0 0 -52,062 -82 56,970 0 0 0 -56,970 07 11,196 13 5,500 6 -5,696 -7
12 31,700 0 0 0 -31,700 0
Total 151,928 21 5,500 6 -146,428 -15Grand Total 922,982 975 172,497 202 -750,485 -773
Source: New York City PLUTO Database
7

Breaking these figures down by building type, Table 2 shows that 398 of the residential units lost (or 51%) involved buildings that were converted from majority residential use in 2010 to majority hotel use in 2016. The type of residential building most affected were elevator apartments, which lost 242 units.
Specific examples of residential buildings converted to hotel use include:
• 815 Avenue of the Americas, Midtown, Manhattan: An elevator apartment building with 50,349 square feet of residential space and 51 units in 2010 was converted into the Hyatt House New York/Chelsea, a long-stay hotel with no residential space or units that will start accepting reservations in December 2016.18
• 17 Seabring Street, Park Slope/Carroll Gardens, Brooklyn: A walk-up apartment building with 29,672 square feet of residential space and 81 units in 2010 was converted into the Comfort Inn Red Hook, a hotel with no residential space or units that opened in 2011.19
• 517 39th Street, Sunset Park, Brooklyn: An elevator apartment building with 24,062 square feet of residential space and 46 units in 2010 was converted into the Sunny 39 Hotel, a hotel with no residential space or units.20
• 31-02 and 31-16 Linden Street, Flushing/Whitestone, Queens: Mixed-used residential and two-family dwelling
properties with a combined total of 3,776 square feet of residential space and 7 units were converted into a hotel development site and newly built hotel in 2014.21
A full list of the buildings that lost residential space and units can be found in Appendix B.
2010 Majority Use Change in Residential Area, 2010-2016 Change in Residential Units, 2010-2016B2 -3,096 -4B9 -2,836 -2
Total Two Family Dwellings -5,932 -6C0 -5,664 -6C3 -2,352 -4C4 -9,232 -10C5 -44,962 -121
Total Walk Up Apartments -62,210 -141D1 -111,669 -193D6 -25,669 -29D9 -17,880 -20
Total Elevator Apartments -155,218 -242S4 -4,829 -4S5 -2,600 -5
Total Residence-Multiple Use -7,429 -9Grand Total -230,789 -398
TABLE 2RESIDENTIAL LOSSES IN BUILDINGS WITH MAJORITY RESIDENTIAL USE IN 2010
Source: New York City PLUTO Database
8
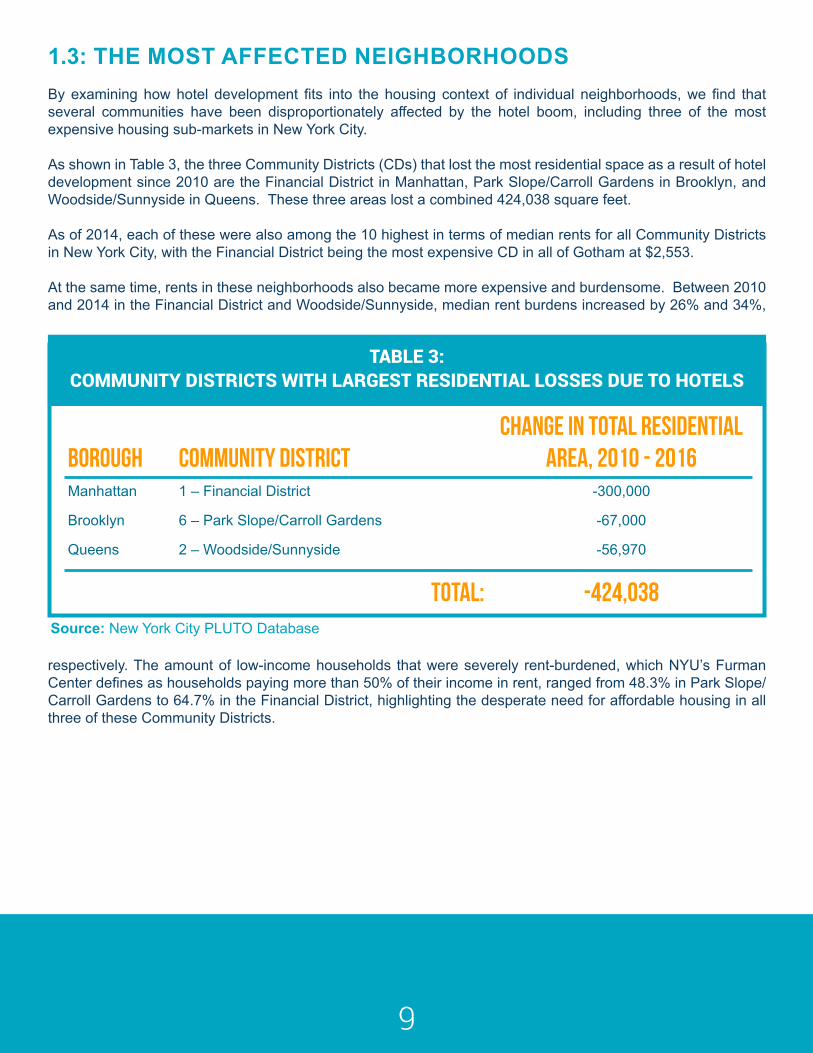
TABLE 3: COMMUNITY DISTRICTS WITH LARGEST RESIDENTIAL LOSSES DUE TO HOTELS
BoroughManhattan
Brooklyn
Queens
Community district1 – Financial District
6 – Park Slope/Carroll Gardens
2 – Woodside/Sunnyside
Total:
CHange in TOTAL residential Area, 2010 - 2016
-300,000
-67,000
-56,970
-424,038Source: New York City PLUTO Database
1.3: THE MOST AFFECTED NEIGHBORHOODSBy examining how hotel development fits into the housing context of individual neighborhoods, we find that several communities have been disproportionately affected by the hotel boom, including three of the most expensive housing sub-markets in New York City.
As shown in Table 3, the three Community Districts (CDs) that lost the most residential space as a result of hotel development since 2010 are the Financial District in Manhattan, Park Slope/Carroll Gardens in Brooklyn, and Woodside/Sunnyside in Queens. These three areas lost a combined 424,038 square feet.
As of 2014, each of these were also among the 10 highest in terms of median rents for all Community Districts in New York City, with the Financial District being the most expensive CD in all of Gotham at $2,553.
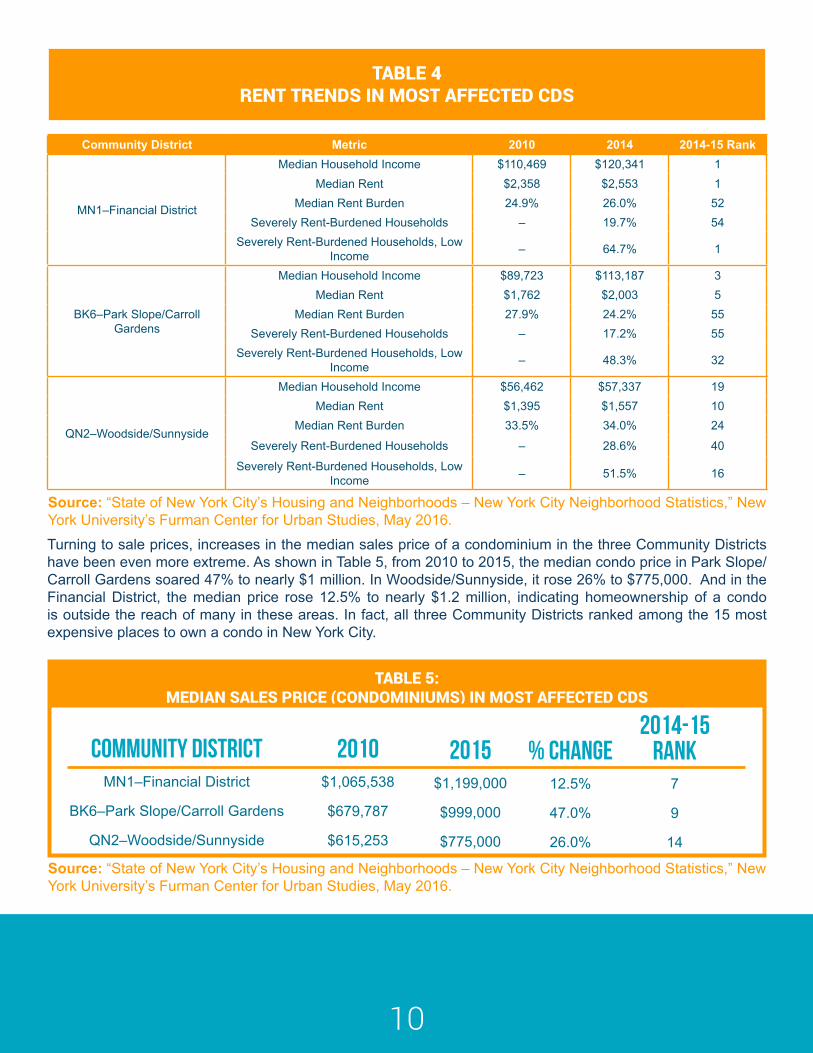
At the same time, rents in these neighborhoods also became more expensive and burdensome. Between 2010 and 2014 in the Financial District and Woodside/Sunnyside, median rent burdens increased by 26% and 34%,
respectively. The amount of low-income households that were severely rent-burdened, which NYU’s Furman Center defines as households paying more than 50% of their income in rent, ranged from 48.3% in Park Slope/Carroll Gardens to 64.7% in the Financial District, highlighting the desperate need for affordable housing in all three of these Community Districts.
9
Community District Metric 2010 2014 2014-15 Rank
MN1–Financial District
Median Household Income $110,469 $120,341 1Median Rent $2,358 $2,553 1
Median Rent Burden 24.9% 26.0% 52Severely Rent-Burdened Households – 19.7% 54
Severely Rent-Burdened Households, Low Income – 64.7% 1
BK6–Park Slope/Carroll Gardens
Median Household Income $89,723 $113,187 3Median Rent $1,762 $2,003 5
Median Rent Burden 27.9% 24.2% 55Severely Rent-Burdened Households – 17.2% 55
Severely Rent-Burdened Households, Low Income – 48.3% 32
QN2–Woodside/Sunnyside
Median Household Income $56,462 $57,337 19Median Rent $1,395 $1,557 10
Median Rent Burden 33.5% 34.0% 24
Severely Rent-Burdened Households – 28.6% 40
Severely Rent-Burdened Households, Low Income – 51.5% 16
TABLE 4RENT TRENDS IN MOST AFFECTED CDS
Source: “State of New York City’s Housing and Neighborhoods – New York City Neighborhood Statistics,” New York University’s Furman Center for Urban Studies, May 2016.
Source: “State of New York City’s Housing and Neighborhoods – New York City Neighborhood Statistics,” New York University’s Furman Center for Urban Studies, May 2016.
TABLE 5: MEDIAN SALES PRICE (CONDOMINIUMS) IN MOST AFFECTED CDS
COMMUNITY DISTRICTMN1–Financial District
BK6–Park Slope/Carroll Gardens
QN2–Woodside/Sunnyside
2010$1,065,538
$679,787
$615,253
2015$1,199,000
$999,000
$775,000
% CHange12.5%
47.0%
26.0%
Rank
7
9
14
2014-15
Turning to sale prices, increases in the median sales price of a condominium in the three Community Districts have been even more extreme. As shown in Table 5, from 2010 to 2015, the median condo price in Park Slope/Carroll Gardens soared 47% to nearly $1 million. In Woodside/Sunnyside, it rose 26% to $775,000. And in the Financial District, the median price rose 12.5% to nearly $1.2 million, indicating homeownership of a condo is outside the reach of many in these areas. In fact, all three Community Districts ranked among the 15 most expensive places to own a condo in New York City.
10

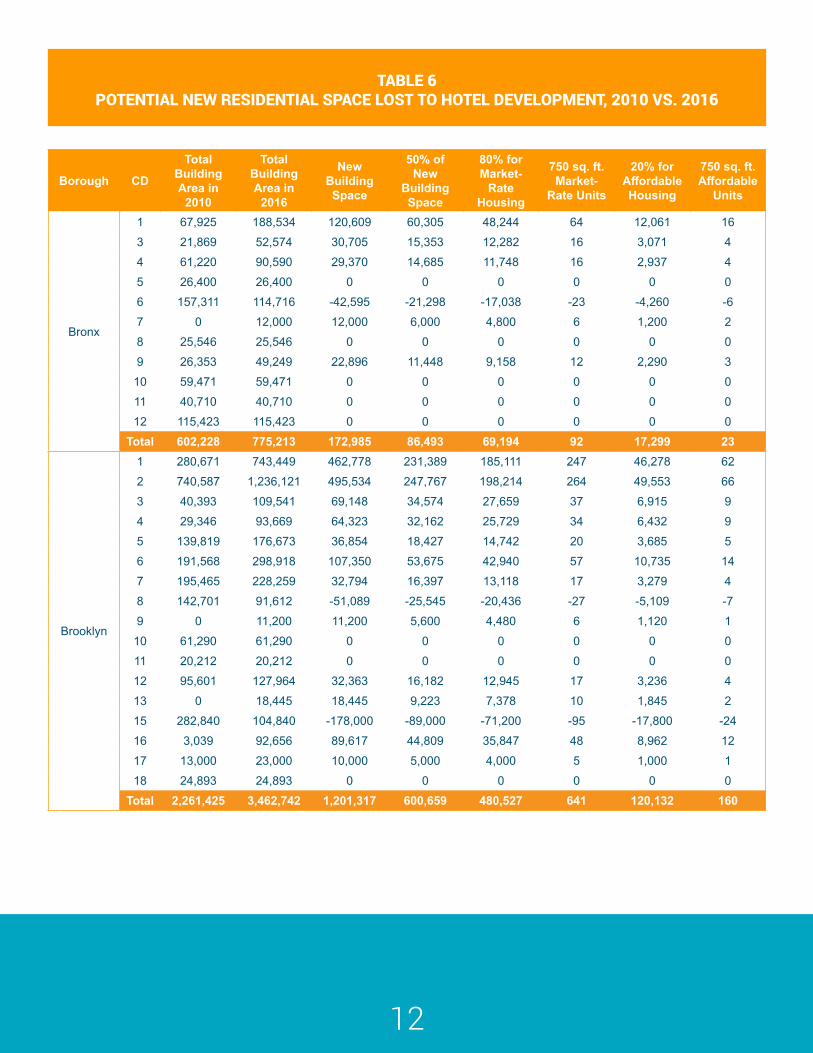
1.4: THE HOUSING THAT COULD HAVE BEENThe analysis so far has focused only on actual losses of preexisting residential space and units as reported in PLUTO buildings with a majority hotel use in 2016 when compared to their 2010 characteristics.
However, the effect on the housing market is even greater if we estimate the opportunity-cost – i.e. housing that could have been constructed had the new building space been used to build housing for New Yorkers instead of hotel rooms for transient guests.
In one scenario, let’s assume just half the new building space added since 2010 in buildings that are now mostly used for hotel purposes had instead been used for residential projects and that 20% of that space was dedicated to affordable housing.22 This would have resulted in more than 2.9 million square feet of market-rate housing and over 727,000 square feet of affordable housing—the equivalent of 3,878 market-rate and 969 affordable one bedroom units, assuming an average unit size of 750 square feet.23 60% of those units—2,927—could have been created in Manhattan, the city’s most expensive borough to rent and own a condo.24
In a scenario where 75% of the hotel area had been used for residential housing, those numbers increase to 5,816 market rate units and 1,454 affordable housing units.
A full list of the new building space and potential housing units by 2016 hotel use type can be found in Appendix C.
11
Borough CD
Total Building Area in
2010
Total Building Area in
2016
New Building Space
50% of New
Building Space
80% for Market-
Rate Housing
750 sq. ft. Market-
Rate Units
20% for Affordable Housing
750 sq. ft. Affordable
Units
Bronx
1 67,925 188,534 120,609 60,305 48,244 64 12,061 163 21,869 52,574 30,705 15,353 12,282 16 3,071 44 61,220 90,590 29,370 14,685 11,748 16 2,937 45 26,400 26,400 0 0 0 0 0 06 157,311 114,716 -42,595 -21,298 -17,038 -23 -4,260 -67 0 12,000 12,000 6,000 4,800 6 1,200 28 25,546 25,546 0 0 0 0 0 09 26,353 49,249 22,896 11,448 9,158 12 2,290 3
10 59,471 59,471 0 0 0 0 0 011 40,710 40,710 0 0 0 0 0 012 115,423 115,423 0 0 0 0 0 0
Total 602,228 775,213 172,985 86,493 69,194 92 17,299 23
Brooklyn
1 280,671 743,449 462,778 231,389 185,111 247 46,278 622 740,587 1,236,121 495,534 247,767 198,214 264 49,553 663 40,393 109,541 69,148 34,574 27,659 37 6,915 94 29,346 93,669 64,323 32,162 25,729 34 6,432 95 139,819 176,673 36,854 18,427 14,742 20 3,685 56 191,568 298,918 107,350 53,675 42,940 57 10,735 147 195,465 228,259 32,794 16,397 13,118 17 3,279 48 142,701 91,612 -51,089 -25,545 -20,436 -27 -5,109 -79 0 11,200 11,200 5,600 4,480 6 1,120 1
10 61,290 61,290 0 0 0 0 0 011 20,212 20,212 0 0 0 0 0 012 95,601 127,964 32,363 16,182 12,945 17 3,236 413 0 18,445 18,445 9,223 7,378 10 1,845 215 282,840 104,840 -178,000 -89,000 -71,200 -95 -17,800 -2416 3,039 92,656 89,617 44,809 35,847 48 8,962 1217 13,000 23,000 10,000 5,000 4,000 5 1,000 118 24,893 24,893 0 0 0 0 0 0
Total 2,261,425 3,462,742 1,201,317 600,659 480,527 641 120,132 160
TABLE 6POTENTIAL NEW RESIDENTIAL SPACE LOST TO HOTEL DEVELOPMENT, 2010 VS. 2016
12

Manhattan
1 3,206,346 3,171,412 -34,934 -17,467 -13,974 -19 -3,493 -52 1,365,163 1,751,727 386,564 193,282 154,626 206 38,656 523 863,121 1,372,014 508,893 254,447 203,557 271 50,889 684 5,075,928 7,035,629 1,959,701 979,851 783,880 1,045 195,970 2615 24,286,919 25,621,743 1,334,824 667,412 533,930 712 133,482 1786 5,054,408 5,238,662 184,254 92,127 73,702 98 18,425 257 1,994,149 2,003,908 9,759 4,880 3,904 5 976 18 1,898,124 1,900,551 2,427 1,214 971 1 243 0
10 18,383 26,690 8,307 4,154 3,323 4 831 111 112,505 112,505 0 0 0 0 0 012 28,850 59,705 30,855 15,428 12,342 16 3,086 4
Total 43,903,896 48,294,546 4,390,650 2,195,325 1,756,260 2,342 439,065 585
Queens
1 814,267 1,237,562 423,295 211,648 169,318 226 42,330 562 455,718 661,351 205,633 102,817 82,253 110 20,563 273 1,337,434 1,337,434 0 0 0 0 0 04 141,887 217,391 75,504 37,752 30,202 40 7,550 105 102,544 102,544 0 0 0 0 0 06 8,870 8,870 0 0 0 0 0 07 687,448 1,143,202 455,754 227,877 182,302 243 45,575 618 86,849 163,216 76,367 38,184 30,547 41 7,637 10
10 264,300 278,992 14,692 7,346 5,877 8 1,469 211 95,644 95,644 0 0 0 0 0 012 886,140 1,000,520 114,380 57,190 45,752 61 11,438 1513 289,359 321,411 32,052 16,026 12,821 17 3,205 414 4,560 53,589 49,029 24,515 19,612 26 4,903 7
Total 5,175,020 6,621,726 1,446,706 723,353 578,682 772 144,671 193
Staten Island
1 33,085 34,845 1,760 880 704 1 176 02 338,189 395,333 57,144 28,572 22,858 30 5,714 83 12,760 12,760 0 0 0 0 0 0
Total 384,034 442,938 58,904 29,452 23,562 31 5,890 8Grand Total 52,326,603 59,597,165 7,270,562 3,635,281 2,908,225 3,878 727,056 969
TABLE 6 (continued)POTENTIAL NEW RESIDENTIAL SPACE LOST TO HOTEL DEVELOPMENT, 2010 VS. 2016
13

1.5 NEW YORK CITY’S LAND USE LAWS PROMOTE HOTEL DEVELOPMENT OVER HOUSING, INDUSTRIAL BUSINESSESHotel construction in New York City isn’t merely a product of the tourist boom; it's also a predictable outcome of land use policies that provide incentives for land owners to build hotels instead of permanent housing or industrial businesses, including a moratorium on the conversion of hotels into housing and allowing hotels to be built “as-of-right” on land zoned for industry.25
In May 2015, following pressure from the politically powerful New York Hotel Trades Council (HTC), New York City Mayor Bill de Blasio and the City Council agreed to impose a two-year moratorium on the conversion of more than 20% of hotel space in Manhattan to residential condominiums.26
The Real Estate Board of New York (REBNY) sued to block the law, stating, “To take away what is clearly now an as-of-right ability to generate some more residential units at the expense of a few hotel units to me is again not only illegal, but is inappropriate.27
REBNY recently lost the lawsuit on a technicality: lack of legal standing.28
Several groups have sounded the alarm about the threat posed by hotel construction to the future of the New York City’s manufacturing base. The Association for Neighborhood and Housing Development (ANHD) has stated that, “the current industrial and manufacturing zoning framework...does not speak to our city’s current economic development needs and real estate market reality.”29
The New York City Council identified as-of-right hotel construction in industrial business zones (IBZ) as, “the greatest current threat to industrial businesses in manufacturing zones.”30 This is because hotels don’t simply take up precious land that could be used for manufacturing, but “fundamentally change
the character of areas previously reserved for manufacturing and industrial work...often with fewer jobs with poorer wages and benefits than the uses they replaced.”
For example, since the Wythe Hotel opened in the Williamsburg IBZ in 2012, three additional large hotel projects have been launched within a two block radius. As a result, while the area remains a designated IBZ, the City Council has found that, “hotel, nightlife, and retail uses have proliferated to the point where the southern half of the zone has been almost entirely purged of working industrial uses.”31 According to the Council, “nearly all the remaining industrial land is either vacant and being warehoused for development or is soon to shut down for planned redevelopment.”
Case in point: a property owner in Williamsburg recently said that when he made an offer for a building near its Williamsburg location, the landowner came back with a counteroffer six times higher than his assessment because “they thought the property could fetch the higher price because it could be developed into a hotel.”32
According to a 2015 study by the Pratt Center for Community Development, the proliferation of hotels has had a significant impact on neighborhoods and land-use patterns in New York City, arguing a “highly permissive regulatory framework” has enabled projects “inconsistent with existing community or City Hall intentions,” and as a result, is “undermining” the industrial character of some neighborhoods, affordable housing initiatives, and Gotham’s efforts to nurture the high-tech sector. And despite their proximity to New York City Housing Authority developments, public housing residents “are not being hired for the jobs being created by these hotels.”33
Not only do the city’s land use policies promote hotel construction over affordable housing, but the city itself has passed up opportunities to repurpose land it owns for residential use, instead adding to the development of hotels. The New York City Economic Development Corporation recently signed a contract to convert the Battery Maritime
14

Building in Lower Manhattan into a 70-room boutique hotel with a luxury restaurant and bar on the rooftop. No permanent housing will be included.34
1.6 CONCLUSION On his deathbed in 1848, John Jacob Astor—then America’s richest man—declared, “Could I begin life again, knowing what I now know, and had money to invest, I would buy every foot of land on the island of Manhattan.”35
In the ensuing years, land in New York City has grown ever more precious, as millions have flocked to the Big Apple from across the country and around the world. According to the New York City Department of Finance, the market value of property in the city has more than tripled in the last twenty years, from $294 billion in Fiscal Year (FY) 1996 to $906 billion in FY 2015, with rents rising accordingly.36
As the affordable housing crisis continues to deepen, it is critical that the city’s land use policies create incentives for property owners to build permanent and affordable housing, rather than continuing to profit from the hotel boom that has brought transient housing to neighborhoods across New York.
To that end, New York should not only take additional steps to limit as-of-right hotel development in industrial zones,37 but should also support comprehensive reforms to foster responsible home sharing as a way to accommodate NYC’s growing tourist economy.
Unlike more traditional business models, the internet allows businesses and individuals to more efficiently deploy their resources. The sharing economy in particular enables individuals to tap into the broader economy by leveraging their personal assets in ways that enhance economic efficiency and flexibility, making everyone better off. Home sharing can absorb a significant amount of the demand for transient/tourist lodging, reducing the need for continued hotel construction and ensuring that precious land can be used for permanent housing, manufacturing, and other critical needs. While hotel construction converts homes into hotels, short-term renting lets people keep their homes and also benefit from the thriving tourism industry.
Despite the fact that home sharing is already providing a boon to cities and towns throughout the Empire State, the New York Legislature has failed to pass—or even consider—comprehensive regulations governing this growing industry.
Instead, it has passed a bill (A-8704(C)/S-6340(A)) that would do nothing to crack down on illegal hotel operators and impose draconian fines on everyday New Yorkers who occasionally share their homes to make ends meet.
Governor Cuomo should veto this misguided legislation and bring together interested parties around a set of reforms that foster the growth of responsible home sharing and provide an example for other states to follow in grappling with the challenges of the 21st century economy.
15

APPENDICES APPENDIX A:METHODOLOGYThe report primarily relied on two sources of hous-ing data for New York City. The first was New York City’s Primary Land Use Tax Lot Output (PLUTO) database.39 This data compiles zoning, land and building use and spatial data tied to the city’s tax assessments. A primary repository of tax assess-ment information, it provides a credible source of changes in land use over time. A full list of the fields in PLUTO and those used in this research can be found in Appendix D.
The following are the key assumptions informing the PLUTO research in this report:
• Buildings that have a majority hotel use in 2016 are hotel buildings
• Hotel buildings that reported losses in residential space and units when comparing their 2016 characteristics to their 2010 characteristics impacted housing stock in the city
• Hotel buildings that reported changes in total building area when comparing their 2016 characteristics to their 2010 characteristics indicates construction
• Changes in these characteristics can be attributed to the 2016 hotel use and can be considered hotel development
• Hotel space is similar to residential space and could be used as residential space with minimum renovation
The second source of data came New York University’s Furman Center for Urban Studies.
The research uses the ‘building class’ field in the 2016 PLUTO dataset to identify hotels, two-character code established by the Department of City Planning based on data from the Department of Finance that
describes the building’s majority use. The full list of hotel classes is as follows:40
H1. Luxury Type - Built Prior to 1960 H2. Luxury Type - Built After 1960 H3. Transient Occupancy-Midtown Mn Area H4. Motels H5. Private Club, Luxury Type H6. Apartment Hotels H7. Apartment Hotels-Co-op Owned H8. Dormitories H9. Miscellaneous HB. Stylish Full Service Luxury Hotel* HH. Shared Facilities Budget Hotel* HR. Affordable Shared Room Housing* HS. Long-term Fully Equipped Units* * = Added in 2014
Some of the city-defined hotel classes are for uses not traditionally considered hotel uses in a ‘popular’ sense. Specifically, the report was concerned with residential units meant for students or other types of short-term housing tied to facilities. To ensure none of these unit types and that no hotels could be misconstrued as long-term housing for residents, the report removed the following 2016 PLUTO classifications from the analysis:
H6- Apartment Hotels H7- Apartment Hotels-Co-op Owned H8- Dormitory HR- Affordable Shared Room Housing
Finally, the report also removed from the research any buildings for which PLUTO did not have 2010 data.
For the preexisting residential area and units lost analysis, this report assessed 2016 hotels that reported residential area in 2010, excluding one building that reported just 3 square feet of residential area in 2010. The analysis also excluded any building which reported zero residential space in 2016 but a non-zero residential unit number, which can indicate missing data.41
To better understand these impacts in specific New York City neighborhoods, the borough and
16

Community District of the building, a field also reported in PLUTO, was isolated. This allows a direct comparison to the statistics generated by New York University’s Furman Center for Urban Studies.
For the opportunity-cost analysis (i.e. the total potential market-rate and affordable housing units that could have been created) the report assessed changes in the total building floor area in 2016 hotels compared to the same 2010 characteristic. The additional exclusions described for the preexisting residential area and units lost analysis was not performed as those fields were not part of the potential affordable housing analysis.
The PLUTO analyses conducted in this report can be considered conservative for the following reasons:
• It only compares the 2016 PLUTO dataset to the 2010 PLUTO dataset. Hotel and hotel room construction has been booming since at least 2007.
• It removes buildings with an H6-H8 or HR building class in 2016. Some of these buildings may actually be what are traditionally considered hotels.
• It relies on the ‘building class’ field in the 2016 PLUTO dataset to identify hotels. While buildings can have multiple uses, PLUTO assigns only building class based on the use with the greatest square footage. Some hotels located in mixed-use buildings may not be the use with the greatest square footage.
• Having zero residential area but a non-zero residential unit count doesn’t necessarily indicate missing data. Some of these buildings may have lost preexisting residential space or units.
17

Borough Community District
Majority Use 2010
Residential Area 2010
Residential Units 2010
Majority Use 2016
Residential Area 2016
Residential Units 2016
Brooklyn
1 F4 8,732 11 H9 0 02 H2 25,000 247 H2 0 03 D1 11,232 33 HB 0 06 H9 12,625 43 H3 0 06 I9 24,771 1 H3 0 06 C5 29,672 81 H3 0 07 C0 2,625 3 H3 0 07 D1 24,062 46 H3 0 07 H9 24,066 0 H3 0 0
10 D9 17,880 20 H3 0 016 C0 3,039 3 H3 0 0
Manhattan
1 H2 300,000 0 H2 0 02 S4 4,829 4 H3 0 02 C4 5,223 4 H3 0 03 V1 2,200 0 H3 10,356 03 H9 6,764 3 H2 6,764 33 K9 8,000 7 H1 7,403 83 O9 17,176 33 H3 17,741 244 O9 6,542 8 H2 36,794 454 H2 15,000 9 H1 14,000 95 H9 1,800 6 H3 1,800 45 C4 4,009 6 H2 0 05 H3 5,810 4 HB 5,810 45 H9 14,270 44 H3 14,270 305 H3 14,859 0 H1 14,859 75 D6 25,669 29 H3 0 05 D1 50,349 51 HS 0 07 C5 15,290 40 HS 0 07 D1 26,026 63 HS 0 07 H6 26,334 93 H3 0 07 H9 37,200 62 H3 37,200 62
APPENDIX B:HOTEL DEVELOPMENTS RESULTING IN LOSS OF RESIDENTIAL HOUSING
18

Queens
1 K4 1,950 2 H3 0 01 C3 2,352 4 H3 0 01 H3 2,451 0 H3 0 01 B9 2,836 2 H3 0 01 H9 42,473 0 H3 0 02 H9 25,450 0 H4 0 02 H9 31,520 0 HB 0 07 B2 1,176 2 H9 0 07 B2 1,920 2 H9 0 07 S5 2,600 5 H9 0 07 H9 5,500 4 H3 5500 6
12 H9 31,700 0 H4 0 0Total 922,982 975 172,497 202
APPENDIX BHOTEL DEVELOPMENTS RESULTING IN LOSS OF RESIDENTIAL HOUSING, (cont.)
APPENDIX C: NEW SPACE IN BUILDINGS WITH HOTEL USE IN 2016, POTENTIAL AFFORDABLE UNITS
2016 Majority Use
Total Building Area
in 2010
Total Building Area
in 2016
New Building Space
50% of New Building Space
80% for Market-Rate
Housing
750 sq. ft. Market-Rate
Units
20% for Affordable Housing
750 sq. ft. Affordable
Units
H1 17,520,443 17,527,123 6,680 3,340 2,672 4 668 1
H2 13,208,780 16,713,769 3,504,989 1,752,495 1,401,996 1,869 350,499 467
H3 10,879,749 13,283,210 2,403,461 1,201,731 961,384 1,282 240,346 320
H4 2,332,434 2,337,346 4,912 2,456 1,965 3 491 1
H5 1,371,302 1,380,627 9,325 4,663 3,730 5 933 1
H9 1,418,992 2,343,528 924,536 462,268 369,814 493 92,454 123
HB 3,043,672 3,426,367 382,695 191,348 153,078 204 38,270 51
HH 388,419 396,726 8,307 4,154 3,323 4 831 1
HS 2,162,812 2,188,469 25,657 12,829 10,263 14 2,566 3
Grand Total 52,326,603 59,597,165 7,270,562 3,635,281 2,908,225 3,878 727,056 969
19

APPENDIX D: PLUTO FIELDS USED IN ANALYSISBorough (Borough) Tax Block (Block) Tax Lot (Lot) Community District (CD) Census Tract (CT2010) Census Block (CB2010) School District (SchoolDist) City Council District (Council) Zip Code (ZipCode) Fire Company (FireComp) Police Precinct (PolicePrct) Health Area (HealthArea)Sanitation District Boro (SanitBoro)Sanitation District Number (SanitDist)Sanitation Subsection (SanitSub)Address (Address) Zoning, Zoning District 1 (ZoneDist1)Zoning, Zoning District 2 (ZoneDist2)Zoning, Zoning District 3 (ZoneDist3)Zoning, Zoning District 4 (ZoneDist4)Zoning, Commercial Overlay 1 (Overlay1) Zoning, Commercial Overlay 2 (Overlay2) Zoning, Special Purpose District 1 (SPDist1) Zoning, Special Purpose District 2 (SPDist2)Zoning, Limited Height District (LtdHeight)Zoning, All Components 1 (AllZoning1)Zoning, All Components 2 (AllZoning2)Units, Residential (UnitsRes) Units, Residential And Non-Residential (UnitsTotal)Lot Frontage (LotFront)Lot Depth (LotDepth)Building Frontage (BldgFront) Building Depth (BldgDepth)Extension Code (Ext) Proximity Code (ProxCode)Irregular Lot Code (IrrlotCode) Lot Type (LotType)Basement Type/Grade (BsmtCode) Assessed Value, Land (AssessLand)Assessed Value, Total (AssessTot)Exempt Value, Land (ExemptLand)Exempt Value, Total (ExemptTot) Year Built (YearBuilt)Year Built Code (BuiltCode) Year Altered 1 (YearAlter1)
Year Altered 2 (YearAlter2)Historic District Name (HistDist)Landmark Name (Landmark) Built Floor Area Ratio - FAR (BuiltFAR)Maximum Allowable Residential Far (ResidFAR)Maximum Allowable Commercial FAR (CommFAR)Maximum Allowable Facility FAR (FacilFAR) Boro Code (BoroCode) Borough, Tax Block & Lot (BBL) Unique IDCondominium Number (CondoNo)Census Tract 2 (Tract2010) X Coordinate (XCoord)Y Coordinate (YCoord)Zoning Map # (ZoneMap)41Zoning Map Code (ZmCode)Sanborn Map # (Sanborn)Tax Map # (Taxmap)E-Designation Number (EDesigNum)Apportionment Bbl (APPBBL) Apportionment Date (APPDate) Pluto - Base Map Indicator (PlutoMapI)Version Number (Version)Zoning, Split Boundary Indicator (SplitZone)Building Class (BldgClass)Land Use Category (LandUse)Easements, Number Of (Easements)Ownership, Type Of Ownership Code (OwnerType) Ownership, Owner Name (OwnerName)Lot Area (LotArea) Floor Area, Total Building (BldgArea)Floor Area, Commercial (ComArea)Floor Area, Residential (ResArea)Floor Area, Office (OfficeArea)Floor Area, Retail (RetailArea) Floor Area, Garage (GarageArea)Floor Area, Storage (StrgeArea) Floor Area, Factory (FactryArea)Floor Area, Other (OtherArea)Floor Area, Total Building Source Code (AreaSource) Buildings, Number Of (NumBldgs) Floors, Number Of (NumFloors)$221.3B (See Table E-8).
20
ENDNOTES1 New York City Rent Guidelines Board, “2010 Housing Supply Report” and “2015 Housing Supply Report” 2 Affordable rental units defined as 120 percent of the area median income (AMI). “State of New York City’s Housing and Neighborhoods – New York City Neighborhood Statistics,” New York University’s Furman Center for Urban Studies, May 20163 “Hotel Development in NYC: 2014 to 2019,” NYC & Company, June 15, 20164 “Hotel Development in NYC: 2014 to 2019,” NYC & Company, June 15, 20165 Cushman & Wakefield hotel broker Tom McConnell. “NYC Adds Thousands of Hotel Rooms for Gotham-Wide Guest Surge,” The New York Post, January 15, 2015 6 New York City’s mandatory inclusionary housing program requires at least 20 percent of units to be affordable in new developments that are beneficiaries of new housing capacity. Depending on the area, the city requires as much as 30 percent of new building space to be dedicated to affordable housing. See “Mandatory Inclusionary Housing”; “Mandatory Inclusionary Housing Program Summary,” Housing New York, accessed August 20167 As of December 2015, the average one-bedroom apartment in New York City was 750 square feet, but some are as small as 265 square feet. “NYC Fits Micro Apartments into Housing Picture,” The Daily Mail, December 28, 20158 “At World’s Leading Travel Trade Show NYC & Company Unveils Tourism Forecast of 59.7 Million Visitors in 2016,” NYC & Company Press Release, March 9, 2016 9 “Mayor de Blasio and NYC & Company Announce ‘Road To 10 Million More Visitors’,” Office of The Mayor Press Release, March 18, 201510 For reference, the increase from 2010 to 2015 was approximately 22%.11 ‘Hotel Development in NYC: 2014 to 2019,’ NYC & Company, June 15, 201612 A market research firm recently concluded that, “New York’s hotel market is still adding supply faster than demand can keep up.” See “A Closer Look at NYC’s Hotel Rate Conundrum,” Duetto Research Assistant Director of Content Mark Brandau, July 27, 201613 Cushman & Wakefield hotel broker Tom McConnell. “NYC Adds Thousands of Hotel Rooms for Gotham-Wide Guest Surge,” The New York Post, January 14 “A Closer Look at NYC’s Hotel Rate Conundrum,” Duetto Research Assistant Director of Content Mark Brandau, July 27, 201615 While the city as a whole has continued to add residential space during this period, it would have added more space had hotel development not cannibalized land and buildings that were already being or could have been used for permanent housing.16 “The Hotel Industry in New York City,” Office of the State Comptroller, June 201617 “The Hotel Industry in New York City,” Office of the State Comptroller, June 2016; “Hotel Development in NYC: 2014 to 2019,” NYC & Company, June 15, 201618 “Hyatt House New York Chelsea,” accessed September 5, 201619 Open date according to Smith Travel Research. “Comfort Inn Red Hook,” accessed September 5, 201620 “NYPD helps feds bust two brothers posing as hotels,” New York Post, October 15, 201521 “Flushing Hotel & Development Portfolio,” Massey Knakal Realty Services, accessed September 5, 201622 New York City’s mandatory inclusionary housing program requires at least 20 percent of units to be affordable in new developments that are beneficiaries of new housing capacity. Depending on the area, the city requires as much as 30 percent of new building space to be dedicated to affordable housing. See “Mandatory Inclusionary Housing”; Housing New York, accessed September 5, 201623 As of December 2015 the average one-bedroom apartment in New York City was 750 square feet, but some are as small as 265 square feet. “NYC Fits Micro Apartments into Housing Picture,” The Daily Mail, December 28, 201524 The median rent in Manhattan was $1,533 in 2014 and the median sales price of a condo was $1.275 million in 2015, the highest of any borough. “State of New York City’s Housing and Neighborhoods – New York City Neighborhood Statistics,” New York University Furman Center for Urban Studies, May 2016.25 The zoning “loophole” is not limited to hotels. Many manufacturing zones are also open to big box stores like Ikea and Costco, waste transfer stations, and office buildings. As the City Council noted, “In virtually all cases, each of these uses can typically generate a higher return per square foot for the landowner than most industrial uses.” See New York City Council, “Engines of Opportunity: Reinvigorating New York City’s Manufacturing Zones for the 21st Century,” (Nov. 2014); Pratt Center for Community Development, “Protecting New York’s Threatened Manufacturing Space”26 “De Blasio compromises on hotel conversions, industry threatens suit,” Politico New York, May 12, 2015; “City Council passes hotel conversion bill,” The Real Deal, May 15, 201527 “De Blasio compromises on hotel conversions, industry threatens suit,” Politico New York, May 12, 201528 “Court shuts down REBNY’s opposition to hotel conversion law,” The Real Deal, June 24, 201629 Association for Neighborhood & Housing Development, “Land Use Reform: Critical to NYC’s Industrial Future,” (28 Oct. 2015).30 “Engines of Opportunity.”31 Id.32 Eli Rosenberg, “How NYC’s Decade of Rezoning Changed the City of Industry,” Curbed (16 Jan. 2014).33 “Hotel Development in NYC: Room for Improvement,” Pratt Center for Community Development, February 201534 “Battery Maritime Building to get a new life, again,” Politico New York, March 16, 201635 Quoted in Matthew Hale Smith, Sunshine and Shadow in New York, J.B. Burr: New York, N.Y., 1868, p.11736 NYC Department of Finance, “Annual Report: The New York City Property Tax: FY 2015,” (May 2015)37 The Mayor announced that he would work with the City Council to create a new special permit that will be required for any hotel developments in M1 districts within industrial business zones (IBZs). See: “Action Plan to Grow 21st Century Industrial Jobs in NYC,” (3 Nov. 2015)38 A-8704(C)/S-6340(A)39 “PLUTO and MapPLUTO Archive,” NYC Department of City Planning, accessed September 5, 2016.40 “PLUTO Data Dictionary,” Appendix C, NYC Department of City Planning, March 201641 “A residential floor area of zero can mean it is either not available or not applicable.” March 2016 PLUTO Data Dictionary, accessed September 5, 2016.
21

members
22