household energy efficiency study · household energy efficiency study ... i know where to find...
TRANSCRIPT

Household Energy Efficiency Study
JAN 2013
HOUSEHOLD ENERGY EFFICIENCY STUDY
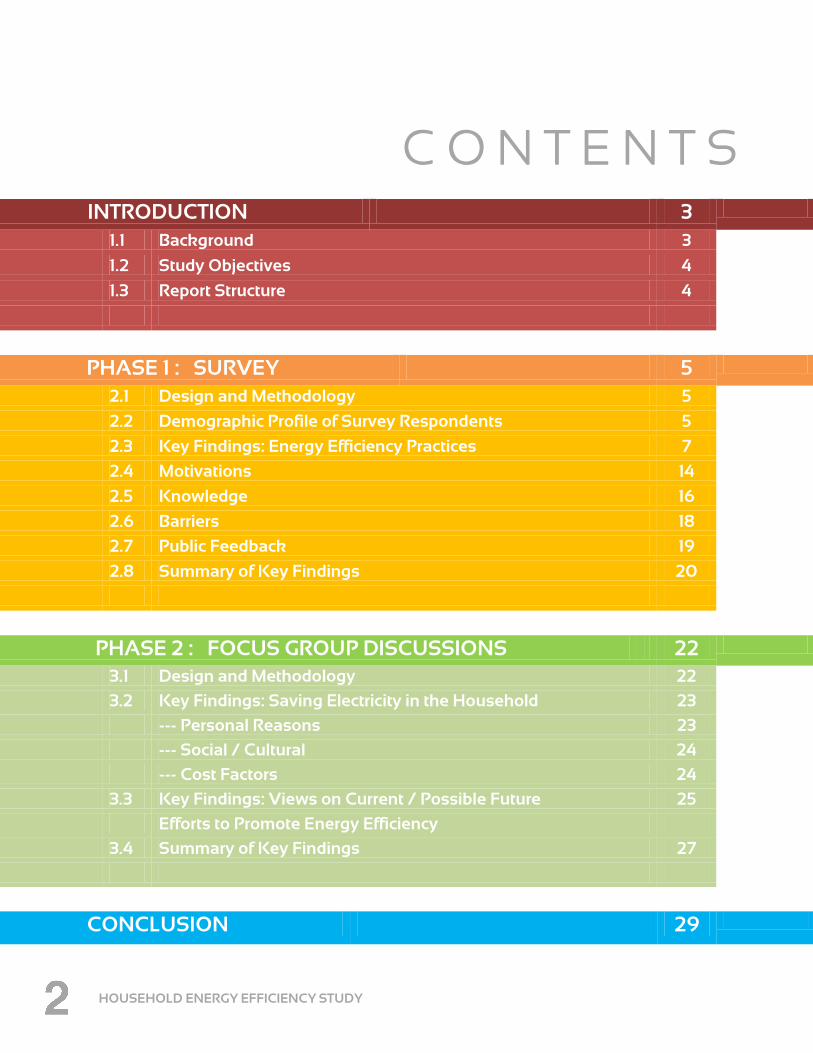
C O N T E N T S
INTRODUCTION 3
1.1 Background 3
1.2 Study Objectives 4
1.3 Report Structure 4
PHASE 1 : SURVEY 5
2.1 Design and Methodology 5
2.2 Demographic Profile of Survey Respondents 5
2.3 Key Findings: Energy Efficiency Practices 7
2.4 Motivations 14
2.5 Knowledge 16
2.6 Barriers 18
2.7 Public Feedback 19
2.8 Summary of Key Findings 20
PHASE 2 : FOCUS GROUP DISCUSSIONS 22
3.1 Design and Methodology 22
3.2 Key Findings: Saving Electricity in the Household 23
--- Personal Reasons 23
--- Social / Cultural 24
--- Cost Factors 24
3.3 Key Findings: Views on Current / Possible Future 25
Efforts to Promote Energy Efficiency
3.4 Summary of Key Findings 27
CONCLUSION 29
HOUSEHOLD ENERGY EFFICIENCY STUDY
1.1. Background
INTRODUCTION

HOUSEHOLD ENERGY EFFICIENCY STUDY
1.2. Study Objectives
1.3. Report Structure

HOUSEHOLD ENERGY EFFICIENCY STUDY
2.1. Design and Methodology
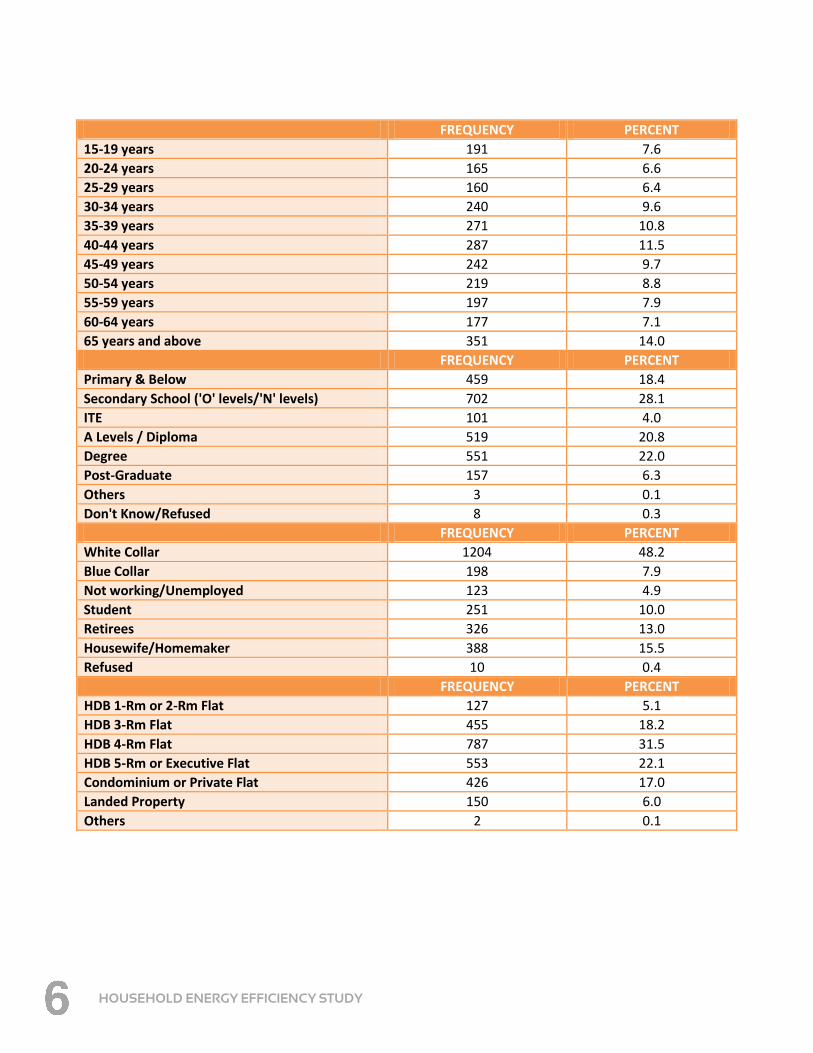
2.2. Demographic Profile of Survey Respondents
Table 2.2.1. Demographic Profile
FREQUENCY PERCENT
Male 1212 48.5
Female 1288 51.5
FREQUENCY PERCENT
Singapore Citizens 2110 84.4
Permanent Residents 390 15.6
FREQUENCY PERCENT
Chinese 1756 70.2
Malay 319 12.8
Indian 292 11.7
Others 133 5.3
FREQUENCY PERCENT
Single 717 28.7
Married, with children 1508 60.3
Married, without children 174 7.0
Separated/Divorced/Widowed 93 3.7
Refused 8 0.3
PHASE 1 : SURVEY
HOUSEHOLD ENERGY EFFICIENCY STUDY
FREQUENCY PERCENT
15-19 years 191 7.6
20-24 years 165 6.6
25-29 years 160 6.4
30-34 years 240 9.6
35-39 years 271 10.8
40-44 years 287 11.5
45-49 years 242 9.7
50-54 years 219 8.8
55-59 years 197 7.9
60-64 years 177 7.1
65 years and above 351 14.0
FREQUENCY PERCENT
Primary & Below 459 18.4
Secondary School ('O' levels/'N' levels) 702 28.1
ITE 101 4.0
A Levels / Diploma 519 20.8
Degree 551 22.0
Post-Graduate 157 6.3
Others 3 0.1
Don't Know/Refused 8 0.3
FREQUENCY PERCENT
White Collar 1204 48.2
Blue Collar 198 7.9
Not working/Unemployed 123 4.9
Student 251 10.0
Retirees 326 13.0
Housewife/Homemaker 388 15.5
Refused 10 0.4
FREQUENCY PERCENT
HDB 1-Rm or 2-Rm Flat 127 5.1
HDB 3-Rm Flat 455 18.2
HDB 4-Rm Flat 787 31.5
HDB 5-Rm or Executive Flat 553 22.1
Condominium or Private Flat 426 17.0
Landed Property 150 6.0
Others 2 0.1

HOUSEHOLD ENERGY EFFICIENCY STUDY
2.3. Key Findings: Energy Efficiency Practices Energy Efficiency Practices
Figure 2.3.1. Awareness of electricity saving practices (%)
REFRIGERATOR
LIGHTING , TELEVISION , FAN
49.1%
50.9%
Do not overload the refrigerator
Aware
Not Aware
38.6%
61.4%
Cool hot food before placing them in the refrigerator
Aware
Not Aware
75.5%
24.5%
Switch appliances off at the socket when not in use
Aware
Not Aware
47.1%
52.9%
Reduce consumption
Aware
Not Aware

HOUSEHOLD ENERGY EFFICIENCY STUDY
COMPUTER
WATER HEATER
68.6%
31.4%
Switch off the computer if it is not going to be in use for a long period
Aware
Not Aware
27.4%
72.6%
Enable power management features on the computer, e.g. sleep or
hibernation mode
Aware
Not Aware
32.7%
67.3%
Reduce consumption
Aware
Not Aware
81.8%
18.2%
Only switch on the heater before showering, and switch off after use
Aware
Not Aware
36.4%
63.6%
Reduce energy consumption by taking cooler or shorter showers,
etc.
Aware
Not Aware

HOUSEHOLD ENERGY EFFICIENCY STUDY
AIR-CONDITIONER
51.4%
48.6%
Use a fan instead of the air-conditioner
Aware
Not Aware
36.4%
63.6%
Turn on the air-conditioner for a shorter period
Aware
Not Aware
33.2%
66.8%
Set air-conditioning temperature at 25 degrees Celsius
Aware
Not Aware
HOUSEHOLD ENERGY EFFICIENCY STUDY
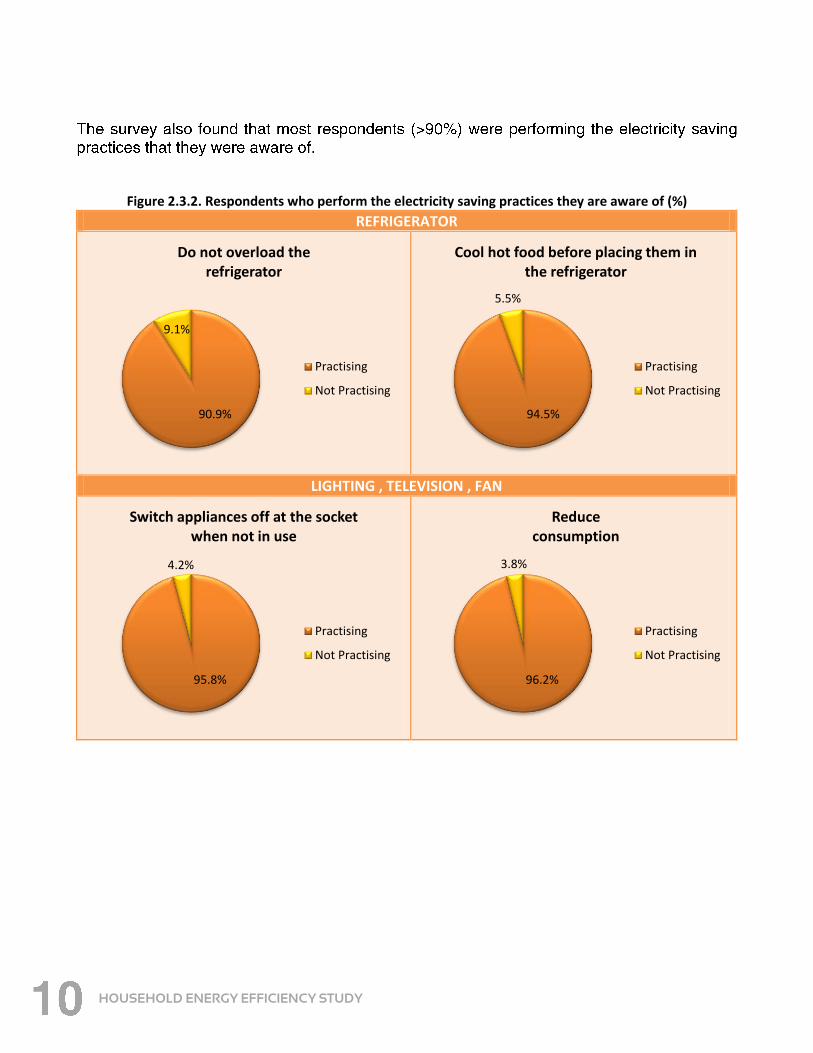
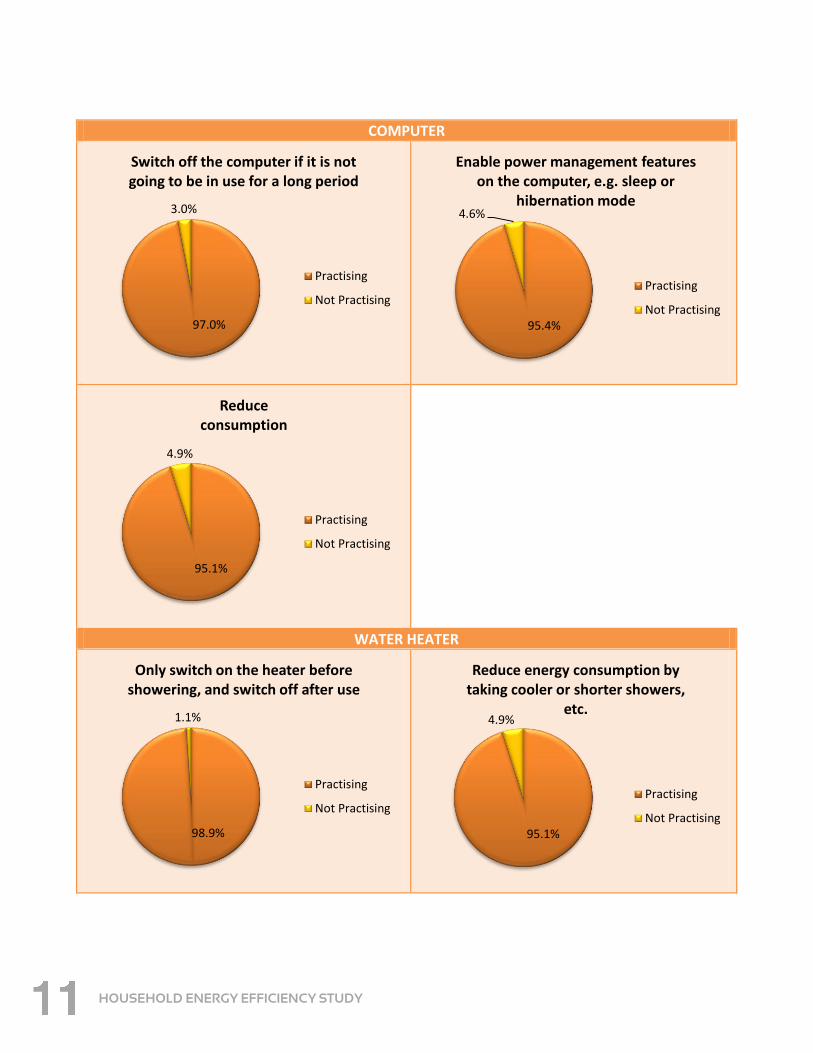
Figure 2.3.2. Respondents who perform the electricity saving practices they are aware of (%)
REFRIGERATOR
LIGHTING , TELEVISION , FAN
90.9%
9.1%
Do not overload the refrigerator
Practising
Not Practising
94.5%
5.5%
Cool hot food before placing them in the refrigerator
Practising
Not Practising
95.8%
4.2%
Switch appliances off at the socket when not in use
Practising
Not Practising
96.2%
3.8%
Reduce consumption
Practising
Not Practising
HOUSEHOLD ENERGY EFFICIENCY STUDY
COMPUTER
WATER HEATER
97.0%
3.0%
Switch off the computer if it is not going to be in use for a long period
Practising
Not Practising
95.4%
4.6%
Enable power management features on the computer, e.g. sleep or
hibernation mode
Practising
Not Practising
95.1%
4.9%
Reduce consumption
Practising
Not Practising
98.9%
1.1%
Only switch on the heater before showering, and switch off after use
Practising
Not Practising
95.1%
4.9%
Reduce energy consumption by taking cooler or shorter showers,
etc.
Practising
Not Practising
HOUSEHOLD ENERGY EFFICIENCY STUDY
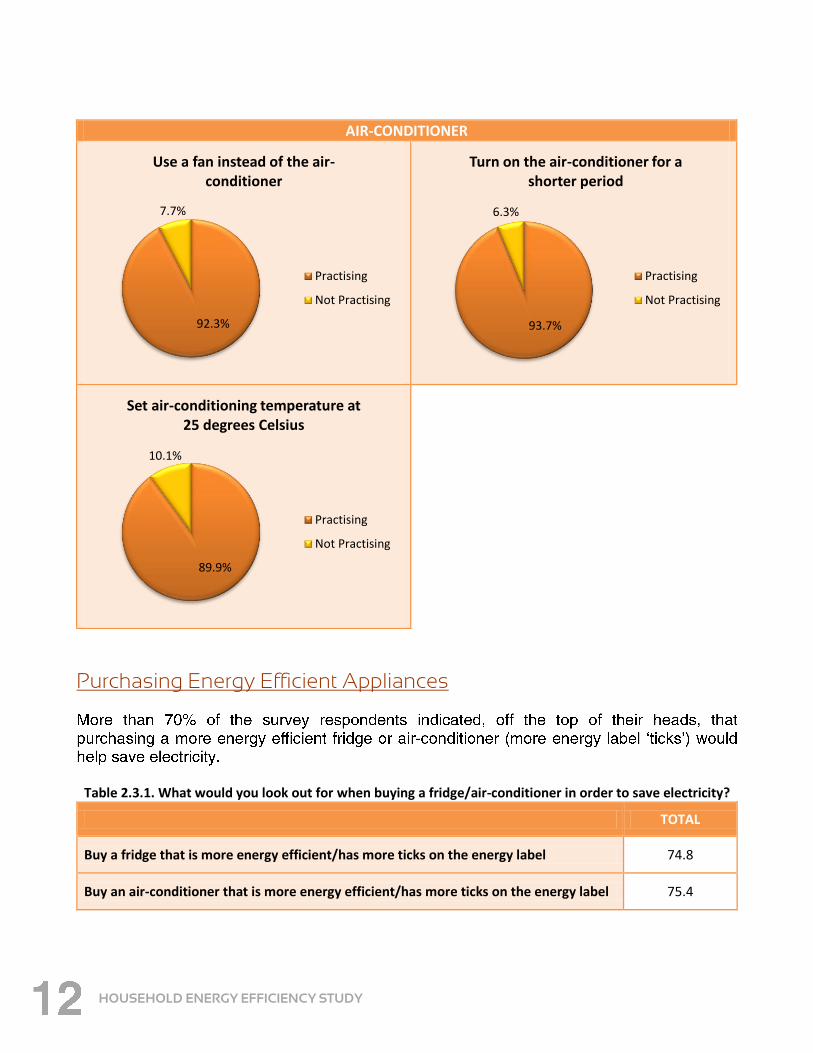
AIR-CONDITIONER
Purchasing Energy Efficient Appliances
Table 2.3.1. What would you look out for when buying a fridge/air-conditioner in order to save electricity?
TOTAL
Buy a fridge that is more energy efficient/has more ticks on the energy label 74.8
Buy an air-conditioner that is more energy efficient/has more ticks on the energy label 75.4
92.3%
7.7%
Use a fan instead of the air-conditioner
Practising
Not Practising
93.7%
6.3%
Turn on the air-conditioner for a shorter period
Practising
Not Practising
89.9%
10.1%
Set air-conditioning temperature at 25 degrees Celsius
Practising
Not Practising

HOUSEHOLD ENERGY EFFICIENCY STUDY
Use of Energy Saving Appliances
Table 2.3.2. Use of CFL/LED lights (%)
TOTAL
Use of CFL / LED lights 79.6
Table 2.3.3. Aware that the use of CFL/LED lights help save electricity (%)
HOUSEHOLDS USING CFL/LED LIGHTS
Aware 94.8
Not Aware 5.2
Table 2.3.4. Use of instant water heater (%)
TOTAL
Use of Instant Water Heater 63.9
Table 2.3.5. Aware that the use of instant water heaters help save electricity (%)
HOUSEHOLDS USING INSTANT WATER HEATER
Aware 87.0
Not Aware 13.0
Table 2.3.6. Use of thermos flask (%)
TOTAL
Usage of Thermos Flask 40.6
HOUSEHOLD ENERGY EFFICIENCY STUDY
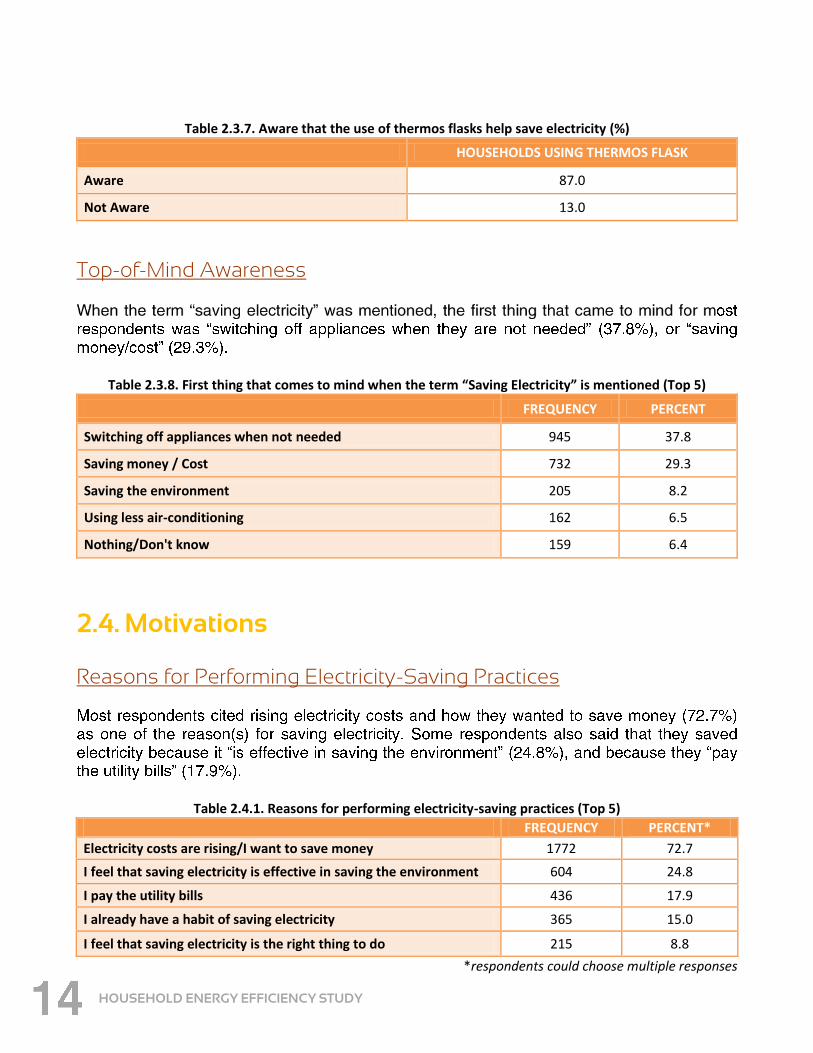
Table 2.3.7. Aware that the use of thermos flasks help save electricity (%)
HOUSEHOLDS USING THERMOS FLASK
Aware 87.0
Not Aware 13.0
Top-of-Mind Awareness
Table 2.3.8. First thing that comes to mind when the term “Saving Electricity” is mentioned (Top 5)
FREQUENCY PERCENT
Switching off appliances when not needed 945 37.8
Saving money / Cost 732 29.3
Saving the environment 205 8.2
Using less air-conditioning 162 6.5
Nothing/Don't know 159 6.4
2.4. Motivations Reasons for Performing Electricity-Saving Practices
Table 2.4.1. Reasons for performing electricity-saving practices (Top 5)
FREQUENCY PERCENT*
Electricity costs are rising/I want to save money 1772 72.7
I feel that saving electricity is effective in saving the environment 604 24.8
I pay the utility bills 436 17.9
I already have a habit of saving electricity 365 15.0
I feel that saving electricity is the right thing to do 215 8.8
*respondents could choose multiple responses

HOUSEHOLD ENERGY EFFICIENCY STUDY
Reasons for Not Performing Electricity-Saving Practices
Table 2.4.2. Reasons for not performing electricity-saving practices (Top 5)
FREQUENCY PERCENT*
It is inconvenient/not easy to do 115 34.2
Don't Know 74 22.0
I need to maintain my quality of life 53 15.8
My family does not practise electricity conservation 36 10.7
My friends do not practise electricity conservation 30 8.9
*respondents could choose multiple responses
Influencers of Electricity Saving Behaviour
Table 2.4.3. Influencers of electricity-saving behaviour (Top 5)
FREQUENCY PERCENT*
No one 1467 58.7
Mother/Mother in law 377 15.1
Father/Father in law 335 13.4
Spouse 288 11.5
Children 151 6.0
*respondents could choose multiple responses
Encouraging Others to Save Electricity
Table 2.4.4. Will you encourage others to save electricity? (%)
TOTAL
Yes 85.6
No 14.4

HOUSEHOLD ENERGY EFFICIENCY STUDY
Table 2.4.5. Who would you encourage to save electricity? (Top 5)
FREQUENCY PERCENT*
Family members 1858 86.8
Friend 957 44.7
Colleague 255 11.9
Neighbour 149 7.0
Relatives 49 2.3
*respondents could choose multiple responses
2.5. Knowledge
Perceived Knowledge With Regard to Electricity-Saving Practices
Table 2.5.1. Perceived knowledge with regard to electricity saving practices (1 strongly disagree – 7 strongly agree)
MEAN
I know how to save electricity 5.71
I know where to find information on electricity saving tips 5.04
There is a lack of information on how to save electricity 4.23
On average, respondents agreed that they knew how to save electricity (mean score 5.71), and somewhat agreed that they knew where they could find information on how to save electricity (mean score 5.04). The responses, however, suggested that respondents were divided on whether there was a lack of information on how to save electricity (mean score 4.23).

HOUSEHOLD ENERGY EFFICIENCY STUDY
Perceived Knowledge With Regard to Energy Efficient Products
Table 2.5.2. Perceived knowledge with regard to energy efficient products
(1 strongly disagree – 7 strongly agree)
MEAN
I do not know how to identify energy efficient products 3.03
5.73
5.40
I do not know which appliances use more electricity
3.61
Perceived Level of Electricity Consumption
Table 2.5.3. Perceived level of electricity consumption (1 strongly disagree – 7 strongly agree)
MEAN
I use less electricity than most people 4.62
My household uses less electricity than other households 4.49
know how much it costs to use each appliance, I would save more If I electricity
Using energy efficient appliances will save money in the long run
The mean scores for the statements “I do not know how to identify energy efficient products” and “I do not know which appliances use more electricity” were 3.03 and 3.61 respectively. This suggested that respondents knew how to identify energy efficient products and knew which appliances consumed more electricity.
The survey results also suggested that on average respondents agreed that using energy efficient appliances would save them money in the long run (mean score 5.73), and agreed that they would be motivated to save more electricity if they knew how much it costs to use an appliance (mean score 5.40).
On average, respondents somewhat agreed that they used less electricity as compared to most other people (mean score 4.62), and that their households used less electricity as compared to others (mean score 4.49).
HOUSEHOLD ENERGY EFFICIENCY STUDY
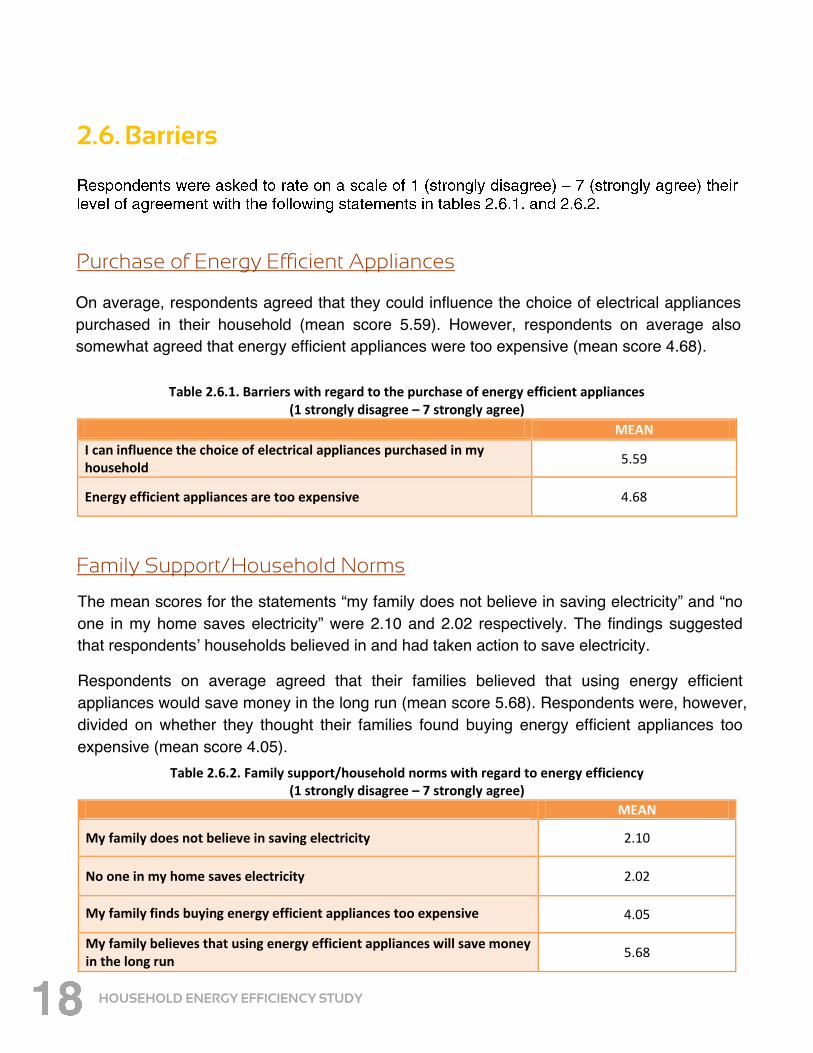
2.6. Barriers
Purchase of Energy Efficient Appliances
Table 2.6.1. Barriers with regard to the purchase of energy efficient appliances (1 strongly disagree – 7 strongly agree)
MEAN
I can influence the choice of electrical appliances purchased in my household
5.59
Energy efficient appliances are too expensive 4.68
Family Support/Household Norms
Table 2.6.2. Family support/household norms with regard to energy efficiency (1 strongly disagree – 7 strongly agree)
MEAN
My family does not believe in saving electricity 2.10
No one in my home saves electricity 2.02
4.05
My family believes that using energy efficient appliances will save money in the long run
5.68
energy efficient appliances too expensive My family finds buying
On average, respondents agreed that they could influence the choice of electrical appliances purchased in their household (mean score 5.59). However, respondents on average also somewhat agreed that energy efficient appliances were too expensive (mean score 4.68).
The mean scores for the statements “my family does not believe in saving electricity” and “no one in my home saves electricity” were 2.10 and 2.02 respectively. The findings suggested that respondentsʼ households believed in and had taken action to save electricity.
Respondents on average agreed that their families believed that using energy efficient appliances would save money in the long run (mean score 5.68). Respondents were, however, divided on whether they thought their families found buying energy efficient appliances too expensive (mean score 4.05).
HOUSEHOLD ENERGY EFFICIENCY STUDY
2.7. Public Feedback Suggested Government Initiatives to Encourage Energy Saving
Table 2.7.1. Suggested government initiatives to encourage energy saving (Top 5)
FREQUENCY PERCENT*
Provide incentives (e.g. monetary/voucher rewards/rebates) 1032 41.3
Advertise more on media (e.g. TV) 913 36.5
Have more campaigns/initiatives on electricity saving practices 507 20.3
Provide more information on electricity saving practices 274 11.0
There is nothing they can do to encourage me to save electricity / Already doing enough
196 7.8
*respondents could choose multiple responses
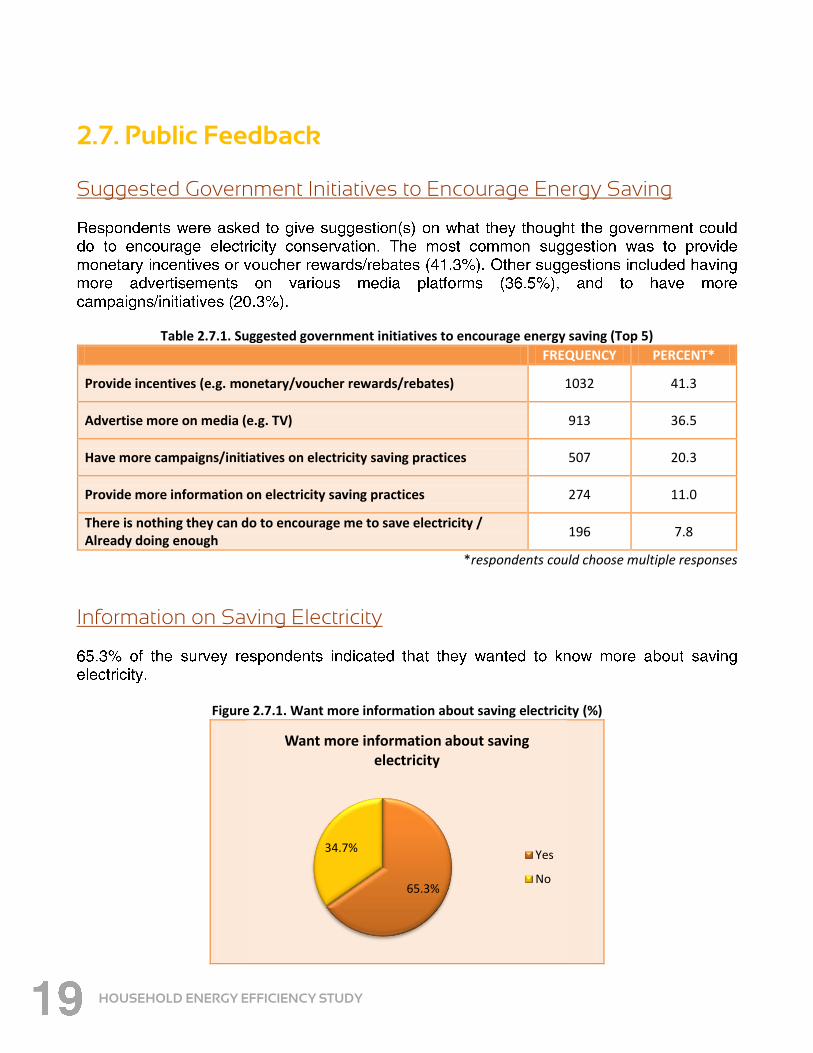
Information on Saving Electricity
Figure 2.7.1. Want more information about saving electricity (%)
65.3%
34.7%
Want more information about saving electricity
Yes
No
HOUSEHOLD ENERGY EFFICIENCY STUDY
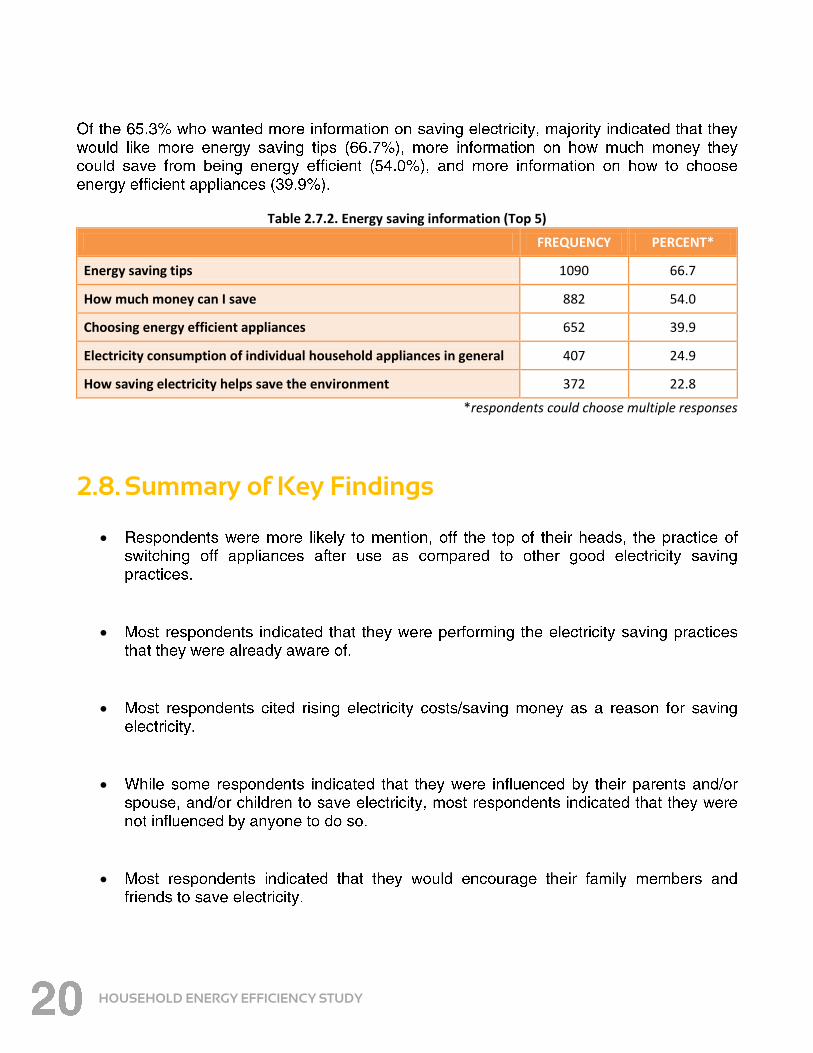
Table 2.7.2. Energy saving information (Top 5)
FREQUENCY PERCENT*
Energy saving tips 1090 66.7
How much money can I save 882 54.0
Choosing energy efficient appliances 652 39.9
Electricity consumption of individual household appliances in general 407 24.9
How saving electricity helps save the environment 372 22.8
*respondents could choose multiple responses
2.8. Summary of Key Findings
HOUSEHOLD ENERGY EFFICIENCY STUDY
Respondents agreed that they would be more motivated to save electricity if they knew how much it costs to use an appliance.

HOUSEHOLD ENERGY EFFICIENCY STUDY
3.1. Design and Methodology
PHASE 2 : FOCUS GROUP DISCUSSIONS

HOUSEHOLD ENERGY EFFICIENCY STUDY
3.2. Key Findings: Saving Electricity in the Household
Personal Reasons
Saving money
Electricity consumption as a personal “need”

HOUSEHOLD ENERGY EFFICIENCY STUDY
Force of habit
Social/Cultural
Household role
Cost factors
Affordability of energy efficient appliances
HOUSEHOLD ENERGY EFFICIENCY STUDY
3.3. Key Findings: Views on current / possible future efforts to promote energy efficiency
Campaign messages
Mandatory Energy Labelling Scheme (MELS)
Mobile phone apps

HOUSEHOLD ENERGY EFFICIENCY STUDY
Electricity consumption graphs
Community efforts to promote energy efficiency
Incentive schemes
HOUSEHOLD ENERGY EFFICIENCY STUDY
3.4. Summary of Key Findings
(MELS) was usef ul.

HOUSEHOLD ENERGY EFFICIENCY STUDY

HOUSEHOLD ENERGY EFFICIENCY STUDY
Raising awareness of other good energy consumption practices
Providing more information on the running cost of appliances
Promoting responsible energy use
Mediating the cost of energy efficiency appliances
CONCLUSION

HOUSEHOLD ENERGY EFFICIENCY STUDY
Des
ign
ed b
y Ta
ihei
( d
esig
n@
taih
ei.c
om
.sg
)