energy consumption of major household …...highlights energy consumption of major household...
TRANSCRIPT

Energy Consumption of Major Household AppliancesShipped in Canada
Trends for 1990-2004December 2006

Recycled paper
The digital mosaic of Canada which appears on the cover of this publication is produced by NaturalResources Canada (Canada Centre for Remote Sensing), and is a composite of individual satellite images.The colours reflect differences in the density of vegetation cover: bright green for dense vegetation in thehumid southern regions; yellow for semi-arid and mountainous regions; brown for the far north wherevegetation cover is very sparse; and white for the Arctic regions.
Published by the authority of the Minister of Natural Resources CanadaGovernment of Canada
Natural Resources Canada's Office of Energy EfficiencyLeading Canadians to Energy Efficiency at Home, at Work and on the Road
Energy Consumption of Major Household Appliances Shipped in CanadaCat. No. M141-16/2004E-PDFISBN 978-0-662-45276-8
© Her Majesty the Queen in Right of Canada, 2006
To obtain additional copies of this or other free publications on energy efficiency, please contact
Energy PublicationsOffice of Energy EfficiencyNatural Resources CanadaSt. Joseph CommunicationsOrder Processing Unit1165 Kenaston StreetPO Box 9809 Station TOttawa ON K1G 6S1Tel.: 1-800-387-2000 (toll-free)Fax: 613-740-3114TTY: 613-996-4397 (teletype for the hearing-impaired)
You can also view or order most Office of Energy Efficiency publications on-line.Visit our Virtual Library at oee.nrcan.gc.ca/publications.The Office of Energy Efficiency’s Web site is at oee.nrcan.gc.ca.

Since 1996, as part of the National Energy UseDatabase (NEUD) initiative, Natural ResourcesCanada’s Office of Energy Efficiency (OEE) hasbeen receiving from members of the CanadianAppliance Manufacturers Association (CAMA) their annual Canadian appliance shipment data,by model, for the six major household appliance categories – refrigerators, freezers, electric ranges,dishwashers, clothes washers and electric clothesdryers. According to CAMA, these manufacturersrepresent well over 90 percent of the Canadianmarket for five of the appliance groups.1
Each model’s shipments, provided by CAMA, were matched to their associated unit energy consumption (UEC) ratings found in the EnerGuideAppliance Directory database (http://oee.nrcan.gc.ca/Publications/infosource/Pub/appliances/index.cfm?attr=4). The annual shipment-weightedaverage UEC was then calculated for each appli-ance category. This report details the results of theanalysis on the estimated shipment-weighted average UEC, in kilowatt hours per year, of the sixmajor household appliance categories shipped inCanada between 1990 and 2004. It also providesdata on the annual distribution of shipments byUEC range for the six types of appliances duringthe same period.
This is the fifth in the series of such reports2
published by the OEE. Readers may observedifferences between this report and previousreports. The differences are due to updates,changes in the number of data contributors,new appliance categories/types and a change inthe methodology (described later in the report).Also, participating manufacturers have nowprovided their shipment data broken down by
region/province and by channel (retail versusbuilder), allowing regional analysis for the firsttime, thereby assisting in monitoring the successof regional programs. For the first report, therewere only four data contributors; for this report,there are eight. The OEE plans to publish updatedreports at regular intervals. To further improve thequality and representation of new appliance energyefficiency data in Canada, the OEE is exploringoptions to improve the coverage of the Canadianmarket through ongoing discussions with CAMAand other appliance manufacturers.
The OEE would like to thank the participatingmanufacturers and CAMA for their co-operationin this project.
The data gathered through this report will deepenour knowledge of the various aspects of energyconsumption with respect to appliances. The datawill also enable Natural Resources Canada to developand fine-tune its programs, designed to supportCanadians as they seek to achieve greater energyefficiency and reduce their greenhouse gasemissions.
If you would like to learn more about the OEE’sservices and programs, contact us by e-mail [email protected].
For further information on this report, contact
Diane LindiaDemand Policy and Analysis DivisionOffice of Energy Efficiency Natural Resources Canada580 Booth StreetOttawa ON K1A 0E4Tel.: 613-995-9195Fax: 613-947-0535
FOREWORD
FOREWORD
Energy Consumption of Major Household Appliances Shipped in Canada i
1 Information on market share for freezers is not available.2 The first report was based on 1990–1997 data; the second
report, 1990–1999 data; the third report, 1990–2001 data; and the fourth report, 1990–2003 data.
To obtain additional copies of this report or otherreports published by the Demand Policy andAnalysis Division, visit our Web site atoee.nrcan.gc.ca/statistics/publications.
Readers may also contact
Energy PublicationsOffice of Energy EfficiencyNatural Resources Canadac/o St. Joseph CommunicationsOrder Processing Unit1165 Kenaston StreetPO Box 9809, Station TOttawa ON K1G 6S1Tel.: 1-800-387-2000Fax: 613-740-3114TTY: 613-996-4397 (teletype for the hearing-impaired)In the National Capital Region, call 613-995-2943.
When ordering, please quote the catalogue num-ber and ISBN associated with each title.
FOREWORD
ii Trends for 1990-2004
HIGHLIGHTS
Energy Consumption of Major Household Appliances Shipped in Canada iii
The energy efficiency of almost all major house-hold appliances3 on the market improveddramatically between 1990 and 2004. Electricranges were the only exception.4 Largely responsi-ble for the improvement were the significantresearch and development activities carried out byappliance manufacturers and three initiativesauthorized under the 1992 Energy Efficiency Act: theminimum energy performance standards (MEPS)contained in the Energy Efficiency Regulations, theEnerGuide for Equipment program and the ENERGY STAR® initiative. Also responsible for theimprovement were an increase in consumer aware-ness and various incentives and rebates offered bythe federal, provincial and municipal governmentsand utilities, details of which can be found in theDirectory of Energy Efficiency and AlternativeEnergy Programs in Canada (oee.nrcan.gc.ca/programs-directory) or on the ENERGY STAR Web site (oee.nrcan.gc.ca/energystar/english/consumers/rebate.cfm).
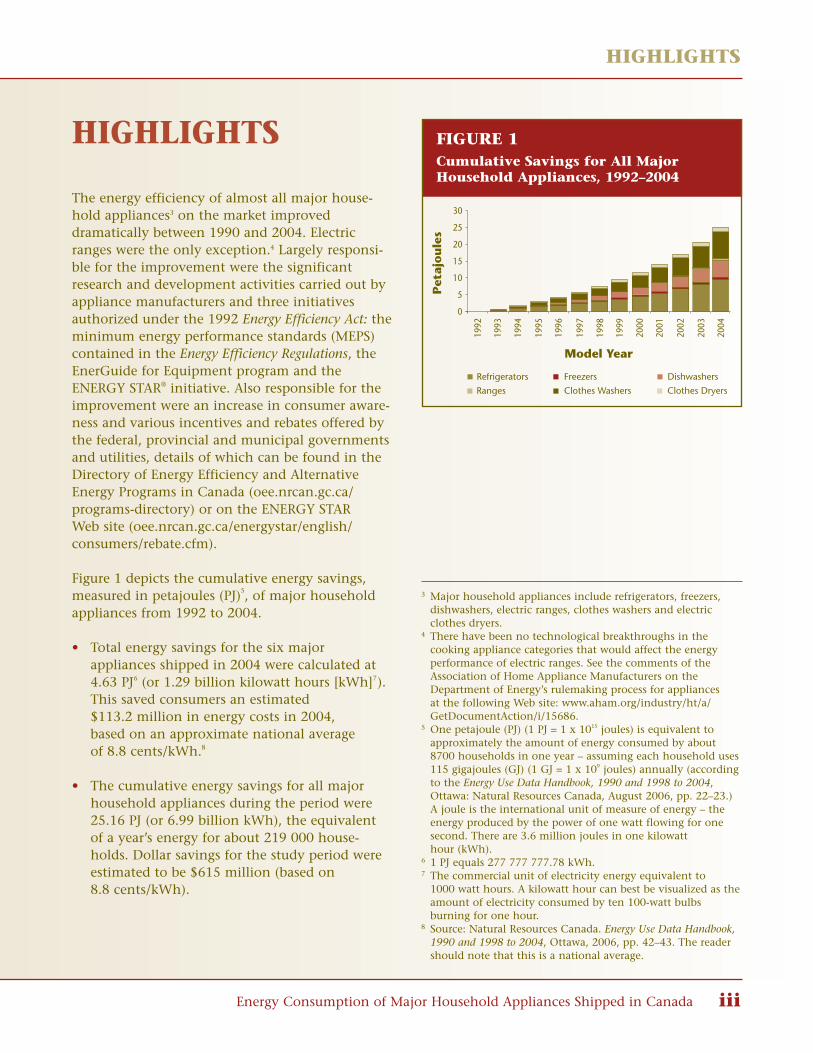
Figure 1 depicts the cumulative energy savings,measured in petajoules (PJ)5, of major householdappliances from 1992 to 2004.
• Total energy savings for the six major appliances shipped in 2004 were calculated at 4.63 PJ6 (or 1.29 billion kilowatt hours [kWh]7).This saved consumers an estimated $113.2 million in energy costs in 2004, based on an approximate national average of 8.8 cents/kWh.8
• The cumulative energy savings for all major household appliances during the period were 25.16 PJ (or 6.99 billion kWh), the equivalent of a year’s energy for about 219 000 house-holds. Dollar savings for the study period were estimated to be $615 million (based on 8.8 cents/kWh).
HIGHLIGHTS
3 Major household appliances include refrigerators, freezers, dishwashers, electric ranges, clothes washers and electric clothes dryers.
4 There have been no technological breakthroughs in the cooking appliance categories that would affect the energy performance of electric ranges. See the comments of the Association of Home Appliance Manufacturers on the Department of Energy’s rulemaking process for appliancesat the following Web site: www.aham.org/industry/ht/a/GetDocumentAction/i/15686.
5 One petajoule (PJ) (1 PJ = 1 x 10¹⁵ joules) is equivalent to approximately the amount of energy consumed by about 8700 households in one year – assuming each household uses115 gigajoules (GJ) (1 GJ = 1 x 10⁹ joules) annually (accordingto the Energy Use Data Handbook, 1990 and 1998 to 2004,Ottawa: Natural Resources Canada, August 2006, pp. 22–23.)A joule is the international unit of measure of energy – the energy produced by the power of one watt flowing for one second. There are 3.6 million joules in one kilowatt hour (kWh).
6 1 PJ equals 277 777 777.78 kWh.7 The commercial unit of electricity energy equivalent to
1000 watt hours. A kilowatt hour can best be visualized as theamount of electricity consumed by ten 100-watt bulbs burning for one hour.
8 Source: Natural Resources Canada. Energy Use Data Handbook, 1990 and 1998 to 2004, Ottawa, 2006, pp. 42–43. The reader should note that this is a national average.
Model Year
Refrigerators Freezers Dishwashers
Ranges Clothes Washers Clothes Dryers
1992
1993
1994
1995
1996
1997
1998
1999
2000
2001
2002
2003
2004
Pet
ajo
ule
s
0
5
10
15
20
25
30
Fig A1.epsFIGURE 1Cumulative Savings for All MajorHousehold Appliances, 1992–2004
• Among major appliances, refrigerators producedthe largest cumulative energy savings, 9.58 PJ (or 2.66 billion kWh) from 1992 to 2004.
• Electric ranges produced the least cumulative energy savings, 0.66 PJ (or 183.33 million kWh)over the period.
• Although this is the first report that contains analysis for retail versus builder shipments by region/province, it was found that, for all majorhousehold appliances, shipments to builders in British Columbia and the Territories were higher and those to builders in Quebec were lower than to the other regions. This finding will be further monitored in future reports.
• There were no discernable trends as to whether final retail or builder consumers were choosing more-energy-efficient appliances.
It is important to acknowledge at this point thatonly upon the disposal9 of older appliances, suchas the second refrigerator in the basement, willenergy-efficient products continue to have a signif-icant impact on consumers’ energy bills andenergy savings. If consumers keep using the oldermodels as a second appliance in the home, themaximum amount of energy savings and green-house gas emission reductions available are notgoing to be realized. According to the 2003 Surveyof Household Energy Use,10 approximately 765 000Canadian households did not dispose of their previous refrigerator when they acquired a new one.
HIGHLIGHTS
iv Trends for 1990-2004
9 Be sure to choose an environmentally friendly option when disposing of an appliance. Appliance recycling programs are available in many Canadian communities. Consult your Yellow Pages or call your municipality to find out what programs exist and how appliances are collected in your area.Or, consult the Canadian Metals Recycling Database at www.recycle.nrcan.gc.ca to find Canadian companies involved in the recycling of appliances or “white goods.”
10 Natural Resources Canada. 2003 Survey of Household Energy Use, Detailed Statistical Report, Ottawa, 2006, p. 59.
CONTENTS
Energy Consumption of Major Household Appliances Shipped in Canada v
CONTENTS
FOREWORD . . . . . . . . . . . . . . . . . . . . . . . . . . . . . . . . . . . . . . . . . . . . . . . . . . . . . . . . . . . . . . . . . . . . . . . . . i
HIGHLIGHTS . . . . . . . . . . . . . . . . . . . . . . . . . . . . . . . . . . . . . . . . . . . . . . . . . . . . . . . . . . . . . . . . . . . . . . . iii
LIST OF TABLES . . . . . . . . . . . . . . . . . . . . . . . . . . . . . . . . . . . . . . . . . . . . . . . . . . . . . . . . . . . . . . . . . . . . viii
LIST OF FIGURES . . . . . . . . . . . . . . . . . . . . . . . . . . . . . . . . . . . . . . . . . . . . . . . . . . . . . . . . . . . . . . . . . . . . x
INTRODUCTION . . . . . . . . . . . . . . . . . . . . . . . . . . . . . . . . . . . . . . . . . . . . . . . . . . . . . . . . . . . . . . . . . . . . . 1
MINIMUM ENERGY PERFORMANCE STANDARDS (MEPS) AND THE ENERGY EFFICIENCY REGULATIONS . . . . . . . . . . . . . . . . . . . . . . . . . . . . . . . . . . . . . . . . . . . . . . . . . . 2
ENERGY STAR® . . . . . . . . . . . . . . . . . . . . . . . . . . . . . . . . . . . . . . . . . . . . . . . . . . . . . . . . . . . . . . . . . . . . . 3
THE ROLE OF THE MEMBERS OF THE CANADIAN APPLIANCE MANUFACTURERS ASSOCIATION (CAMA) . . . . . . . . . . . . . . . . . . . . . . . . . . . . . . . . . . . . . . . . . . . . . . . 5
1 REFRIGERATORS . . . . . . . . . . . . . . . . . . . . . . . . . . . . . . . . . . . . . . . . . . . . . . . . . . . . . . . . . . . . . . . . . . . 71.1 2004 Market Snapshot . . . . . . . . . . . . . . . . . . . . . . . . . . . . . . . . . . . . . . . . . . . . . . . . . . . . . . . . . . 8
1.2 Distribution of Shipments . . . . . . . . . . . . . . . . . . . . . . . . . . . . . . . . . . . . . . . . . . . . . . . . . . . . . . . 91.2.1 Distribution by Type . . . . . . . . . . . . . . . . . . . . . . . . . . . . . . . . . . . . . . . . . . . . . . . . . . . . . 91.2.2 Distribution by Type, by Region/Province . . . . . . . . . . . . . . . . . . . . . . . . . . . . . . . . . . . 101.2.3 Distribution by Volume . . . . . . . . . . . . . . . . . . . . . . . . . . . . . . . . . . . . . . . . . . . . . . . . . 111.2.4 Distribution by Volume, by Region/Province . . . . . . . . . . . . . . . . . . . . . . . . . . . . . . . . .121.2.5 Distribution by Average Annual Unit Energy Consumption per Cubic Foot . . . . . . . .131.2.6 Distribution by Average Annual Unit Energy Consumption per Cubic Foot,
by Region/Province . . . . . . . . . . . . . . . . . . . . . . . . . . . . . . . . . . . . . . . . . . . . . . . . . . . . .151.2.7 Distribution by Channel, by Region/Province . . . . . . . . . . . . . . . . . . . . . . . . . . . . . . . .15
1.3 Energy Consumption . . . . . . . . . . . . . . . . . . . . . . . . . . . . . . . . . . . . . . . . . . . . . . . . . . . . . . . . . .161.3.1 Average Annual Unit Energy Consumption by Model Year . . . . . . . . . . . . . . . . . . . . . .161.3.2 Average Annual Unit Energy Consumption by Volume . . . . . . . . . . . . . . . . . . . . . . . . .161.3.3 Average Annual Unit Energy Consumption by Channel,
by Region/Province, 2004 . . . . . . . . . . . . . . . . . . . . . . . . . . . . . . . . . . . . . . . . . . . . . . . . 17
1.4 Energy Savings . . . . . . . . . . . . . . . . . . . . . . . . . . . . . . . . . . . . . . . . . . . . . . . . . . . . . . . . . . . . . . . 18
1.5 Refrigerators Summary . . . . . . . . . . . . . . . . . . . . . . . . . . . . . . . . . . . . . . . . . . . . . . . . . . . . . . . . .19
2 FREEZERS2.1 2004 Market Snapshot . . . . . . . . . . . . . . . . . . . . . . . . . . . . . . . . . . . . . . . . . . . . . . . . . . . . . . . . . 20
2.2 Distribution of Shipments . . . . . . . . . . . . . . . . . . . . . . . . . . . . . . . . . . . . . . . . . . . . . . . . . . . . . . 212.2.1 Distribution by Type . . . . . . . . . . . . . . . . . . . . . . . . . . . . . . . . . . . . . . . . . . . . . . . . . . . . 212.2.2 Distribution by Type, by Region/Province . . . . . . . . . . . . . . . . . . . . . . . . . . . . . . . . . . . 22

CONTENTS
vi Trends for 1990-2004
2.2.3 Distribution by Average Annual Unit Energy Consumption per Cubic Foot . . . . . . . . 232.2.4 Distribution by Average Annual Unit Energy Consumption per Cubic Foot, by
Region/Province . . . . . . . . . . . . . . . . . . . . . . . . . . . . . . . . . . . . . . . . . . . . . . . . . . . . . . . 242.2.5 Distribution by Channel, by Region/Province . . . . . . . . . . . . . . . . . . . . . . . . . . . . . . . . 25
2.3 Energy Consumption . . . . . . . . . . . . . . . . . . . . . . . . . . . . . . . . . . . . . . . . . . . . . . . . . . . . . . . . . 252.3.1 Average Annual Unit Energy Consumption by Model Year . . . . . . . . . . . . . . . . . . . . . 25
2.4 Energy Savings . . . . . . . . . . . . . . . . . . . . . . . . . . . . . . . . . . . . . . . . . . . . . . . . . . . . . . . . . . . . . . . 26
2.5 Freezers Summary . . . . . . . . . . . . . . . . . . . . . . . . . . . . . . . . . . . . . . . . . . . . . . . . . . . . . . . . . . . . 26
3 DISHWASHERS . . . . . . . . . . . . . . . . . . . . . . . . . . . . . . . . . . . . . . . . . . . . . . . . . . . . . . . . . . . . . . . . . . . . 273.1 2004 Market Snapshot . . . . . . . . . . . . . . . . . . . . . . . . . . . . . . . . . . . . . . . . . . . . . . . . . . . . . . . . . 27
3.2 Distribution of Shipments . . . . . . . . . . . . . . . . . . . . . . . . . . . . . . . . . . . . . . . . . . . . . . . . . . . . . . 273.2.1 Distribution by Average Annual Unit Energy Consumption . . . . . . . . . . . . . . . . . . . . 273.2.2 Distribution by Average Annual Unit Energy Consumption, by Region/Province . . . 283.2.3 Distribution by Channel, by Region/Province . . . . . . . . . . . . . . . . . . . . . . . . . . . . . . . . 29
3.3 Energy Consumption . . . . . . . . . . . . . . . . . . . . . . . . . . . . . . . . . . . . . . . . . . . . . . . . . . . . . . . . . 293.3.1 Average Annual Unit Energy Consumption by Model Year . . . . . . . . . . . . . . . . . . . . . 293.3.2 Average Annual Unit Energy Consumption by Channel,
by Region/Province, 2004 . . . . . . . . . . . . . . . . . . . . . . . . . . . . . . . . . . . . . . . . . . . . . . . . 30
3.4 Energy Savings . . . . . . . . . . . . . . . . . . . . . . . . . . . . . . . . . . . . . . . . . . . . . . . . . . . . . . . . . . . . . . . 30
3.5 Dishwashers Summary . . . . . . . . . . . . . . . . . . . . . . . . . . . . . . . . . . . . . . . . . . . . . . . . . . . . . . . . 31
4 ELECTRIC RANGES . . . . . . . . . . . . . . . . . . . . . . . . . . . . . . . . . . . . . . . . . . . . . . . . . . . . . . . . . . . . . . . . 324.1 2004 Market Snapshot . . . . . . . . . . . . . . . . . . . . . . . . . . . . . . . . . . . . . . . . . . . . . . . . . . . . . . . . . 32
4.2 Distribution of Shipments . . . . . . . . . . . . . . . . . . . . . . . . . . . . . . . . . . . . . . . . . . . . . . . . . . . . . . 324.2.1 Distribution by Type . . . . . . . . . . . . . . . . . . . . . . . . . . . . . . . . . . . . . . . . . . . . . . . . . . . . 324.2.2 Distribution by Type, by Region/Province . . . . . . . . . . . . . . . . . . . . . . . . . . . . . . . . . . . 334.2.3 Distribution by Average Annual Unit Energy Consumption . . . . . . . . . . . . . . . . . . . . 344.2.4 Distribution by Average Annual Unit Energy Consumption, by Region/Province . . . 354.2.5 Distribution by Channel, by Region/Province . . . . . . . . . . . . . . . . . . . . . . . . . . . . . . . . 36
4.3 Energy Consumption . . . . . . . . . . . . . . . . . . . . . . . . . . . . . . . . . . . . . . . . . . . . . . . . . . . . . . . . . 364.3.1 Average Annual Unit Energy Consumption by Model Year . . . . . . . . . . . . . . . . . . . . . 364.3.2 Average Annual Unit Energy Consumption by Channel,
by Region/Province, 2004 . . . . . . . . . . . . . . . . . . . . . . . . . . . . . . . . . . . . . . . . . . . . . . . . 37
4.4 Energy Savings . . . . . . . . . . . . . . . . . . . . . . . . . . . . . . . . . . . . . . . . . . . . . . . . . . . . . . . . . . . . . . . 37
4.5 Electric Ranges Summary . . . . . . . . . . . . . . . . . . . . . . . . . . . . . . . . . . . . . . . . . . . . . . . . . . . . . . 38
CONTENTS
Energy Consumption of Major Household Appliances Shipped in Canada vii
5 CLOTHES WASHERS . . . . . . . . . . . . . . . . . . . . . . . . . . . . . . . . . . . . . . . . . . . . . . . . . . . . . . . . . . . . . . . 395.1 2004 Market Snapshot . . . . . . . . . . . . . . . . . . . . . . . . . . . . . . . . . . . . . . . . . . . . . . . . . . . . . . . . . 39
5.2 Distribution of Shipments . . . . . . . . . . . . . . . . . . . . . . . . . . . . . . . . . . . . . . . . . . . . . . . . . . . . . . 395.2.1 Distribution by Type . . . . . . . . . . . . . . . . . . . . . . . . . . . . . . . . . . . . . . . . . . . . . . . . . . . . 395.2.2 Distribution by Type, by Region/Province . . . . . . . . . . . . . . . . . . . . . . . . . . . . . . . . . . . 405.2.3 Distribution by Average Annual Unit Energy Consumption . . . . . . . . . . . . . . . . . . . . 405.2.4 Distribution by Average Annual Unit Energy Consumption, by Region/Province . . . 415.2.5 Distribution by Channel, by Region/Province . . . . . . . . . . . . . . . . . . . . . . . . . . . . . . . . 42
5.3 Energy Consumption . . . . . . . . . . . . . . . . . . . . . . . . . . . . . . . . . . . . . . . . . . . . . . . . . . . . . . . . . 425.3.1 Average Annual Unit Energy Consumption by Model Year . . . . . . . . . . . . . . . . . . . . . 425.3.2 Average Annual Unit Energy Consumption by Channel,
by Region/Province, 2004 . . . . . . . . . . . . . . . . . . . . . . . . . . . . . . . . . . . . . . . . . . . . . . . . 43
5.4 Energy Savings . . . . . . . . . . . . . . . . . . . . . . . . . . . . . . . . . . . . . . . . . . . . . . . . . . . . . . . . . . . . . . . 43
5.5 Clothes Washers Summary . . . . . . . . . . . . . . . . . . . . . . . . . . . . . . . . . . . . . . . . . . . . . . . . . . . . . 44
6 ELECTRIC CLOTHES DRYERS . . . . . . . . . . . . . . . . . . . . . . . . . . . . . . . . . . . . . . . . . . . . . . . . . . . . . . . 456.1 2004 Market Snapshot . . . . . . . . . . . . . . . . . . . . . . . . . . . . . . . . . . . . . . . . . . . . . . . . . . . . . . . . . 45
6.2 Distribution of Shipments . . . . . . . . . . . . . . . . . . . . . . . . . . . . . . . . . . . . . . . . . . . . . . . . . . . . . . 456.2.1 Distribution by Average Annual Unit Energy Consumption . . . . . . . . . . . . . . . . . . . . 456.2.2 Distribution by Average Annual Unit Energy Consumption, by Region/Province . . . 466.2.3 Distribution by Channel, by Region/Province . . . . . . . . . . . . . . . . . . . . . . . . . . . . . . . . 47
6.3 Energy Consumption . . . . . . . . . . . . . . . . . . . . . . . . . . . . . . . . . . . . . . . . . . . . . . . . . . . . . . . . . 476.3.1 Average Annual Unit Energy Consumption by Model Year . . . . . . . . . . . . . . . . . . . . . 476.3.2 Average Annual Unit Energy Consumption by Channel,
by Region/Province, 2004 . . . . . . . . . . . . . . . . . . . . . . . . . . . . . . . . . . . . . . . . . . . . . . . . 48
6.4 Energy Savings . . . . . . . . . . . . . . . . . . . . . . . . . . . . . . . . . . . . . . . . . . . . . . . . . . . . . . . . . . . . . . . 48
6.5 Electric Clothes Dryers Summary . . . . . . . . . . . . . . . . . . . . . . . . . . . . . . . . . . . . . . . . . . . . . . . . 49
7 SUMMARY OF HOUSEHOLD APPLIANCES . . . . . . . . . . . . . . . . . . . . . . . . . . . . . . . . . . . . . . . . . . . . 507.1 Total Energy Savings . . . . . . . . . . . . . . . . . . . . . . . . . . . . . . . . . . . . . . . . . . . . . . . . . . . . . . . . . . 50
APPENDIX A Methodology . . . . . . . . . . . . . . . . . . . . . . . . . . . . . . . . . . . . . . . . . . . . . . . . . . . . . . . . 52
APPENDIX B Definitions . . . . . . . . . . . . . . . . . . . . . . . . . . . . . . . . . . . . . . . . . . . . . . . . . . . . . . . . . 57
APPENDIX C Tables . . . . . . . . . . . . . . . . . . . . . . . . . . . . . . . . . . . . . . . . . . . . . . . . . . . . . . . . . . . . . . 59
LIST OF TABLES
viii Trends for 1990-2004
LIST OF TABLES
Table 1.1 Refrigerator Market, 2004 . . . . . . . . . . . . . . . . . . . . . . . . . . . . . . . . . . . . . . . . . . . . . . . . . . . . . . 7Table 1.2 Distribution of Refrigerators by Type . . . . . . . . . . . . . . . . . . . . . . . . . . . . . . . . . . . . . . . . . . . . . 9Table 1.3 Distribution of Refrigerators by Volume . . . . . . . . . . . . . . . . . . . . . . . . . . . . . . . . . . . . . . . . . 11Table 1.4 Distribution of Refrigerators by Average Annual Unit Energy
Consumption per Cubic Foot . . . . . . . . . . . . . . . . . . . . . . . . . . . . . . . . . . . . . . . . . . . . . . . . . 14
Table 2.1 Distribution of Freezers by Type . . . . . . . . . . . . . . . . . . . . . . . . . . . . . . . . . . . . . . . . . . . . . . . . 21Table 2.2 Distribution of Freezers by Average Annual Unit Energy Consumption per Cubic Foot . . . . 23
Table 3.1 Distribution of Dishwashers by Average Annual Unit Energy Consumption . . . . . . . . . . . . . 27
Table 4.1 Distribution of Electric Ranges by Type . . . . . . . . . . . . . . . . . . . . . . . . . . . . . . . . . . . . . . . . . . 32Table 4.2 Distribution of Electric Ranges by Average Annual Unit Energy Consumption . . . . . . . . . . . 34
Table 5.1 Distribution of Clothes Washers by Type . . . . . . . . . . . . . . . . . . . . . . . . . . . . . . . . . . . . . . . . 39Table 5.2 Distribution of Clothes Washers by Average Annual Unit Energy Consumption . . . . . . . . . 40
Table 6.1 Distribution of Electric Clothes Dryers by Average Annual Unit Energy Consumption . . . . 45
Table C.A.1 ENERGY STAR® Qualified Appliances as a Percentage of Total Shipments in Canada, 1999–2004 . . . . . . . . . . . . . . . . . . . . . . . . . . . . . . . . . . . . . . . . . . . . . . 59
Table C.A.2 ENERGY STAR® Qualified Appliances as a Percentage of Total Shipments, by Region/Province, 2004 . . . . . . . . . . . . . . . . . . . . . . . . . . . . . . . . . . . . . . . . . . . . . . . . . . . . . 59
Table C.1 Distribution of Refrigerators by Type, by Region/Province, 2004 . . . . . . . . . . . . . . . . . . . . . . 60Table C.2 Distribution of Refrigerators by Volume, by Region/Province, 2004 . . . . . . . . . . . . . . . . . . . 60Table C.3 Distribution of Refrigerators for Retail Shipments by Volume,
by Region/Province, 2004 . . . . . . . . . . . . . . . . . . . . . . . . . . . . . . . . . . . . . . . . . . . . . . . . . . . . . 61Table C.4 Distribution of Refrigerators for Builder Shipments by Volume,
by Region/Province, 2004 . . . . . . . . . . . . . . . . . . . . . . . . . . . . . . . . . . . . . . . . . . . . . . . . . . . . . 61Table C.5 Distribution of Refrigerators by Average Annual Unit Energy
Consumption per Cubic Foot, by Region/Province, 2004 . . . . . . . . . . . . . . . . . . . . . . . . . . . . 62Table C.6 Distribution of Refrigerators by Channel, by Region/Province, 2004 . . . . . . . . . . . . . . . . . . . 62Table C.7 Average Annual Unit Energy Consumption of Refrigerators by Model Year . . . . . . . . . . . . . 63Table C.8 Average Annual Unit Energy Consumption of Refrigerators by Volume . . . . . . . . . . . . . . . . 63Table C.9 Average Annual Unit Energy Consumption per Cubic Foot of Refrigerators by Volume . . . . 64Table C.10 Average Annual Unit Energy Consumption of Refrigerators by Channel,
by Region/Province, 2004 . . . . . . . . . . . . . . . . . . . . . . . . . . . . . . . . . . . . . . . . . . . . . . . . . . . . . 64Table C.11 Distribution of Refrigerators Consuming Less Than 40 kWh/cu. ft./yr., 2004 . . . . . . . . . . . . 65Table C.12 Energy Savings for Refrigerators, 1992–2004 . . . . . . . . . . . . . . . . . . . . . . . . . . . . . . . . . . . . . . 65Table C.13 Distribution of Freezers by Type, by Region/Province, 2004 . . . . . . . . . . . . . . . . . . . . . . . . . . 66

LIST OF TABLES
Energy Consumption of Major Household Appliances Shipped in Canada ix
Table C.14 Distribution of Freezers by Average Annual Unit Energy Consumption per Cubic Foot, by Region/Province, 2004 . . . . . . . . . . . . . . . . . . . . . . . . . . . . 66
Table C.15 Distribution of Freezers by Channel, by Region/Province, 2004 . . . . . . . . . . . . . . . . . . . . . . 67Table C.16 Average Annual Unit Energy Consumption of Freezers by Model Year . . . . . . . . . . . . . . . . . 67Table C.17 Energy Savings for Freezers, 1992–2004 . . . . . . . . . . . . . . . . . . . . . . . . . . . . . . . . . . . . . . . . . . 68Table C.18 Distribution of Dishwashers by Average Annual Unit Energy
Consumption, by Region/Province, 2004 . . . . . . . . . . . . . . . . . . . . . . . . . . . . . . . . . . . . . . . . 68Table C.19 Distribution of Dishwashers by Channel, by Region/Province, 2004 . . . . . . . . . . . . . . . . . . . 69Table C.20 Average Annual Unit Energy Consumption of Dishwashers by Model Year . . . . . . . . . . . . . 69Table C.21 Average Annual Unit Energy Consumption of Dishwashers by
Channel, by Region/Province, 2004 . . . . . . . . . . . . . . . . . . . . . . . . . . . . . . . . . . . . . . . . . . . . . 70Table C.22 Energy Savings for Dishwashers, 1992–2004 . . . . . . . . . . . . . . . . . . . . . . . . . . . . . . . . . . . . . . 70Table C.23 Distribution of Electric Ranges by Type, by Region/Province, 2004 . . . . . . . . . . . . . . . . . . . . 71Table C.24 Distribution of Electric Ranges by Average Annual Unit Energy
Consumption, by Region/Province, 2004 . . . . . . . . . . . . . . . . . . . . . . . . . . . . . . . . . . . . . . . . 71Table C.25 Distribution of Electric Ranges by Channel, by Region/Province, 2004 . . . . . . . . . . . . . . . . . 72Table C.26 Average Annual Unit Energy Consumption of Electric Ranges by Model Year . . . . . . . . . . . 72Table C.27 Average Annual Unit Energy Consumption of Electric Ranges by
Channel, by Region/Province, 2004 . . . . . . . . . . . . . . . . . . . . . . . . . . . . . . . . . . . . . . . . . . . . . 73Table C.28 Energy Savings for Electric Ranges, 1992–2004 . . . . . . . . . . . . . . . . . . . . . . . . . . . . . . . . . . . . 73Table C.29 Distribution of Clothes Washers by Type, by Region/Province, 2004 . . . . . . . . . . . . . . . . . . 74Table C.30 Distribution of Clothes Washers by Average Annual Unit Energy
Consumption, by Region/Province, 2004 . . . . . . . . . . . . . . . . . . . . . . . . . . . . . . . . . . . . . . . . 74Table C.31 Distribution of Clothes Washers by Channel, by Region/Province, 2004 . . . . . . . . . . . . . . . 75Table C.32 Average Annual Unit Energy Consumption of Clothes Washers by Model Year . . . . . . . . . . 75Table C.33 Average Annual Unit Energy Consumption of Clothes Washers by
Channel, by Region/Province, 2004 . . . . . . . . . . . . . . . . . . . . . . . . . . . . . . . . . . . . . . . . . . . . . 76Table C.34 Energy Savings for Clothes Washers, 1992–2004 . . . . . . . . . . . . . . . . . . . . . . . . . . . . . . . . . . . 76Table C.35 Distribution of Electric Clothes Dryers by Average Annual Unit Energy
Consumption, by Region/Province, 2004 . . . . . . . . . . . . . . . . . . . . . . . . . . . . . . . . . . . . . . . . 77Table C.36 Distribution of Electric Clothes Dryers by Channel, by Region/Province, 2004 . . . . . . . . . . 77Table C.37 Average Annual Unit Energy Consumption of Electric Clothes Dryers by Model Year . . . . . 78Table C.38 Average Annual Unit Energy Consumption of Electric Clothes Dryers by
Channel, by Region/Province, 2004 . . . . . . . . . . . . . . . . . . . . . . . . . . . . . . . . . . . . . . . . . . . . . 78Table C.39 Energy Savings for Electric Clothes Dryers, 1992–2004 . . . . . . . . . . . . . . . . . . . . . . . . . . . . . 79Table C.40 Energy Savings for All Majors Appliances, 1992–2004 . . . . . . . . . . . . . . . . . . . . . . . . . . . . . . 79
LIST OF FIGURES
x Trends for 1990-2004
LIST OF FIGURES
Figure 1 Cumulative Savings for All Major Household Appliances, 1992–2004 . . . . . . . . . . . . . . . . . iiiFigure 2 ENERGY STAR® Qualified Appliances as a Percentage of Total
Shipments in Canada, 1999–2004 . . . . . . . . . . . . . . . . . . . . . . . . . . . . . . . . . . . . . . . . . . . . . . 4Figure 3 ENERGY STAR® Qualified Appliances as a Percentage of Total
Shipments, by Region/Province, 2004 . . . . . . . . . . . . . . . . . . . . . . . . . . . . . . . . . . . . . . . . . . . 5
Figure 1.1 Distribution of Refrigerators by Type for 1990 and 2004 . . . . . . . . . . . . . . . . . . . . . . . . . . . . 10Figure 1.2 Distribution of Refrigerators by Type, by Region/Province, 2004 . . . . . . . . . . . . . . . . . . . . . 10Figure 1.3 Distribution of Refrigerators by Volume for 1990 and 2004 . . . . . . . . . . . . . . . . . . . . . . . . . 12Figure 1.4 Distribution of Refrigerators by Volume, by Region/Province, 2004 . . . . . . . . . . . . . . . . . . . 12Figure 1.5 Distribution of Refrigerators by Volume, by Channel, 2004 . . . . . . . . . . . . . . . . . . . . . . . . . 13Figure 1.6 Distribution of Refrigerators by Average Annual Unit Energy
Consumption per Cubic Foot for 1990 and 2004 . . . . . . . . . . . . . . . . . . . . . . . . . . . . . . . . . 14Figure 1.7 Distribution of Refrigerators by Annual Unit Energy
Consumption per Cubic Foot, by Region/Province, 2004 . . . . . . . . . . . . . . . . . . . . . . . . . . . 15Figure 1.8 Distribution of Refrigerators by Channel, by Region/Province, 2004 . . . . . . . . . . . . . . . . . . 15Figure 1.9 Average Annual Unit Energy Consumption of Refrigerators by Model Year . . . . . . . . . . . . . 16Figure 1.10 Average Annual Unit Energy Consumption of Refrigerators by Volume . . . . . . . . . . . . . . . . 16Figure 1.11 Average Annual Unit Energy Consumption per Cubic Foot of
Refrigerators by Volume . . . . . . . . . . . . . . . . . . . . . . . . . . . . . . . . . . . . . . . . . . . . . . . . . . . . . 17Figure 1.12 Average Annual Unit Energy Consumption of Refrigerators by
Channel, by Region/Province, 2004 . . . . . . . . . . . . . . . . . . . . . . . . . . . . . . . . . . . . . . . . . . . . 17Figure 1.13 Distribution of Refrigerators Consuming Less Than 40 kWh/cu. ft./yr, 2004 . . . . . . . . . . . . 18Figure 1.14 Energy Savings for Refrigerators, 1992–2004 . . . . . . . . . . . . . . . . . . . . . . . . . . . . . . . . . . . . . 18Figure 1.15 Cumulative Energy Savings for Refrigerators, 1992–2004 . . . . . . . . . . . . . . . . . . . . . . . . . . . 19
Figure 2.1 Distribution of Freezers by Type for 1990 and 2004 . . . . . . . . . . . . . . . . . . . . . . . . . . . . . . . 22Figure 2.2 Distribution of Freezers by Type, by Region/Province, 2004 . . . . . . . . . . . . . . . . . . . . . . . . . 22Figure 2.3 Distribution of Freezers by Average Annual Unit Energy
Consumption per Cubic Foot for 1990 and 2004 . . . . . . . . . . . . . . . . . . . . . . . . . . . . . . . . . 24Figure 2.4 Distribution of Freezers by Average Annual Unit Energy
Consumption per Cubic Foot by Region/Province, 2004 . . . . . . . . . . . . . . . . . . . . . . . . . . . 24Figure 2.5 Distribution of Freezers by Channel, by Region/Province, 2004 . . . . . . . . . . . . . . . . . . . . . . 25Figure 2.6 Average Annual Unit Energy Consumption of Freezers by Model Year . . . . . . . . . . . . . . . . . 25Figure 2.7 Energy Savings for Freezers, 1992–2004 . . . . . . . . . . . . . . . . . . . . . . . . . . . . . . . . . . . . . . . . . 26Figure 2.8 Cumulative Energy Savings for Freezers, 1992–2004 . . . . . . . . . . . . . . . . . . . . . . . . . . . . . . . 26
Figure 3.1 Distribution of Dishwashers by Average Annual Unit Energy Consumption for 1990 and 2004 . . . . . . . . . . . . . . . . . . . . . . . . . . . . . . . . . . . . . . . . . . . . . . 28
Figure 3.2 Distribution of Dishwashers by Average Annual Unit Energy Consumption, by Region/Province, 2004 . . . . . . . . . . . . . . . . . . . . . . . . . . . . . . . . . . . . . . . . 28

LIST OF FIGURES
Energy Consumption of Major Household Appliances Shipped in Canada xi
Figure 3.3 Distribution of Dishwashers by Channel, by Region/Province, 2004 . . . . . . . . . . . . . . . . . . 29Figure 3.4 Average Annual Unit Energy Consumption of Dishwashers by Model Year . . . . . . . . . . . . . 29Figure 3.5 Average Annual Unit Energy Consumption of Dishwashers by
Channel, by Region/Province, 2004 . . . . . . . . . . . . . . . . . . . . . . . . . . . . . . . . . . . . . . . . . . . . 30Figure 3.6 Energy Savings for Dishwashers, 1992–2004 . . . . . . . . . . . . . . . . . . . . . . . . . . . . . . . . . . . . . 30Figure 3.7 Cumulative Energy Savings for Dishwashers, 1992–2004 . . . . . . . . . . . . . . . . . . . . . . . . . . . 31
Figure 4.1 Distribution of Electric Ranges by Type for 1990 and 2004 . . . . . . . . . . . . . . . . . . . . . . . . . . 33Figure 4.2 Distribution of Electric Ranges by Type, by Region/Province, 2004 . . . . . . . . . . . . . . . . . . . 33Figure 4.3 Distribution of Electric Ranges by Average Annual Unit Energy
Consumption for 1990 and 2004 . . . . . . . . . . . . . . . . . . . . . . . . . . . . . . . . . . . . . . . . . . . . . . 35Figure 4.4 Distribution of Electric Ranges by Average Annual Unit Energy
Consumption, by Region/Province, 2004 . . . . . . . . . . . . . . . . . . . . . . . . . . . . . . . . . . . . . . . . 35Figure 4.5 Distribution of Electric Ranges by Channel, by Region/Province, 2004 . . . . . . . . . . . . . . . . 36Figure 4.6 Average Annual Unit Energy Consumption of Electric Ranges by Model Year . . . . . . . . . . . 36Figure 4.7 Average Annual Unit Energy Consumption of Electric Ranges by
Channel, by Region/Province, 2004 . . . . . . . . . . . . . . . . . . . . . . . . . . . . . . . . . . . . . . . . . . . . 37Figure 4.8 Energy Savings for Electric Ranges, 1992–2004 . . . . . . . . . . . . . . . . . . . . . . . . . . . . . . . . . . . 37Figure 4.9 Cumulative Energy Savings for Electric Ranges, 1992–2004 . . . . . . . . . . . . . . . . . . . . . . . . . 38
Figure 5.1 Distribution of Clothes Washers by Type, by Region/Province, 2004 . . . . . . . . . . . . . . . . . . 40Figure 5.2 Distribution of Clothes Washers by Average Annual Unit Energy
Consumption for 1990 and 2004 . . . . . . . . . . . . . . . . . . . . . . . . . . . . . . . . . . . . . . . . . . . . . . 41Figure 5.3 Distribution of Clothes Washers by Average Annual Unit Energy
Consumption, by Region/Province, 2004 . . . . . . . . . . . . . . . . . . . . . . . . . . . . . . . . . . . . . . . . 41Figure 5.4 Distribution of Clothes Washers by Channel, by Region/Province, 2004 . . . . . . . . . . . . . . . 42Figure 5.5 Average Annual Unit Energy Consumption of Clothes Washers by Model Year . . . . . . . . . 42Figure 5.6 Average Annual Unit Energy Consumption of Clothes Washers by
Channel, by Region/Province, 2004 . . . . . . . . . . . . . . . . . . . . . . . . . . . . . . . . . . . . . . . . . . . . 43Figure 5.7 Energy Savings for Clothes Washers, 1992–2004 . . . . . . . . . . . . . . . . . . . . . . . . . . . . . . . . . . 43Figure 5.8 Cumulative Energy Savings for Clothes Washers, 1992–2004 . . . . . . . . . . . . . . . . . . . . . . . . 44
Figure 6.1 Distribution of Electric Clothes Dryers by Average Annual Unit Energy Consumption for 1990 and 2004 . . . . . . . . . . . . . . . . . . . . . . . . . . . . . . . . . . . . . . . . . . . . . . 46
Figure 6.2 Distribution of Electric Clothes Dryers by Average Annual Unit Energy Consumption, by Region/Province, 2004 . . . . . . . . . . . . . . . . . . . . . . . . . . . . . . . . . . . . . . . . 46
Figure 6.3 Distribution of Electric Clothes Dryers by Channel, by Region/Province, 2004 . . . . . . . . . . 47Figure 6.4 Average Annual Unit Energy Consumption of Electric Clothes Dryers by Model Year . . . . 47Figure 6.5 Average Annual Unit Energy Consumption of Electric Clothes Dryers by
Channel, by Region/Province, 2004 . . . . . . . . . . . . . . . . . . . . . . . . . . . . . . . . . . . . . . . . . . . . 48Figure 6.6 Energy Savings for Electric Clothes Dryers, 1992–2004 . . . . . . . . . . . . . . . . . . . . . . . . . . . . . 48Figure 6.7 Cumulative Energy Savings for Electric Clothes Dryers, 1992–2004 . . . . . . . . . . . . . . . . . . . 49
Figure 7.1 Energy Savings for All Major Appliances, 1992–2004 . . . . . . . . . . . . . . . . . . . . . . . . . . . . . . 50Figure 7.2 Cumulative Energy Savings for All Major Appliances, 1992–2004 . . . . . . . . . . . . . . . . . . . . 51
Figure A.1 Retirement Function for Aging Appliances . . . . . . . . . . . . . . . . . . . . . . . . . . . . . . . . . . . . . . . 56Figure A.2 Energy Savings for All Appliances With and Without Retirement Factor . . . . . . . . . . . . . . . 56

INTRODUCTION
INTRODUCTION
1 Trends for 1990-2004
11 Natural Resources Canada. 2003 Survey of Household Energy Use, Detailed Statistical Report, Ottawa, 2006.
This report outlines changes in the energy use anddistribution of major household appliances from1990 to 2004. It is based on the shipments for thatperiod of the six major household appliance categories in Canada: refrigerators, freezers, dish-washers, electric ranges, clothes washers andelectric clothes dryers. The data are collectedthrough the co-operation of the CanadianAppliance Manufacturers Association (CAMA).
Readers should note that the quantity and profileof new appliances closely reflect Canadian purchases. Most retailers rely on a distributionstrategy that responds quickly to consumerdemand (just-in-time inventory). In fact, retailerskeep inventory as low as possible. For this reason,we believe that the shipment data in this reportclosely reflect the purchasing behaviour of consumers.
In 2004, Statistics Canada conducted a Survey ofHousehold Energy Use (SHEU-2003)
11on behalf of
the Office of Energy Efficiency (OEE) of NaturalResources Canada (NRCan). The survey collecteddata for 2003 on the energy and physical charac-teristics of private dwellings in Canada and on the household use of energy resources and, amongothers, the use of appliances. Some of the findingsof SHEU-2003 are related to the analysis and discussions in this report.
Each chapter in this report covers a specific type of appliance:
• refrigerators (Chapter 1) • freezers (Chapter 2)• dishwashers (Chapter 3)• electric ranges (Chapter 4) • clothes washers (Chapter 5) • electric clothes dryers (Chapter 6)
Finally, Chapter 7 discusses the overall energy savings achieved from improvements to theseappliances.
Appendix A describes the database preparationprocess conducted by Electro-Federation Canadaand the methodology used by the analysts to sum-marize the data. Specific definitions of the varioustypes of appliances are given in Appendix B.Finally, detailed tables are provided in Appendix C.
The chapter dealing with refrigerators is moredetailed than the others. Even though there ismuch diversity in the types and sizes of refrigera-tors, we have grouped them together to calculatethe average annual unit energy consumption(UEC) for all refrigerators by model year. However,because both size and energy consumption are soimportant in such analysis, we advise readers toalso look further at the analysis of refrigerators byUEC per cubic foot (Section 1.2.5).
Because of restrictions in the market informationavailable, the freezer shipment data are not ascomprehensive as data for the other appliancesand should be used with caution.
This latest report also includes some regional/provincial shipment data, as well as retail versusbuilder (channel) breakdown. Retail shipmentsinclude those by Canadian manufacturers toCanadian retailers, government agencies, utilitiesand other consumers. Builder shipments includethose to home builders, motels, governments, trailer manufacturers and property management.Readers should be aware that this data show theregion/province to which the appliances were orig-inally shipped. It is possible that some applianceswere eventually sold in a different province. Theextent of this redistribution is unknown butbelieved to be small.
INTRODUCTION
Energy Consumption of Major Household Appliances Shipped in Canada 2
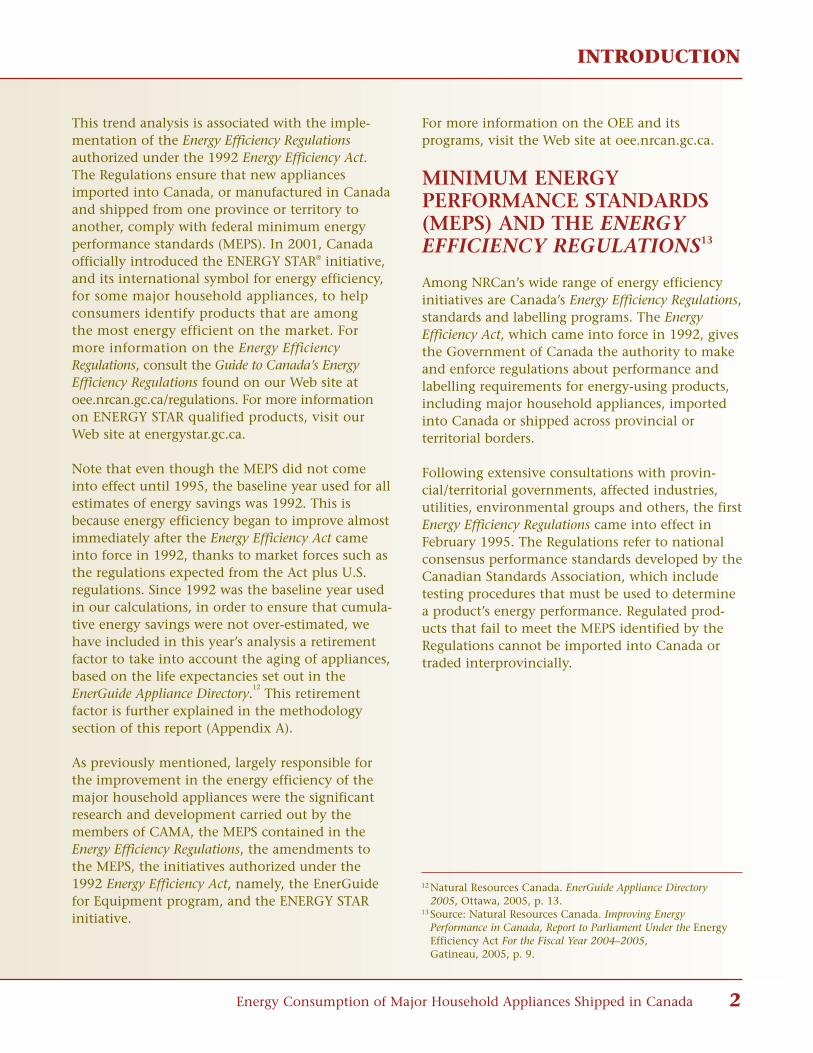
This trend analysis is associated with the imple-mentation of the Energy Efficiency Regulationsauthorized under the 1992 Energy Efficiency Act.The Regulations ensure that new appliancesimported into Canada, or manufactured in Canadaand shipped from one province or territory toanother, comply with federal minimum energyperformance standards (MEPS). In 2001, Canadaofficially introduced the ENERGY STAR® initiative,and its international symbol for energy efficiency,for some major household appliances, to help consumers identify products that are amongthe most energy efficient on the market. Formore information on the Energy EfficiencyRegulations, consult the Guide to Canada’s EnergyEfficiency Regulations found on our Web site atoee.nrcan.gc.ca/regulations. For more informationon ENERGY STAR qualified products, visit our Web site at energystar.gc.ca.
Note that even though the MEPS did not comeinto effect until 1995, the baseline year used for allestimates of energy savings was 1992. This isbecause energy efficiency began to improve almostimmediately after the Energy Efficiency Act cameinto force in 1992, thanks to market forces such asthe regulations expected from the Act plus U.S.regulations. Since 1992 was the baseline year usedin our calculations, in order to ensure that cumula-tive energy savings were not over-estimated, wehave included in this year’s analysis a retirementfactor to take into account the aging of appliances,based on the life expectancies set out in theEnerGuide Appliance Directory.
12This retirement
factor is further explained in the methodologysection of this report (Appendix A).
As previously mentioned, largely responsible forthe improvement in the energy efficiency of themajor household appliances were the significantresearch and development carried out by the members of CAMA, the MEPS contained in theEnergy Efficiency Regulations, the amendments tothe MEPS, the initiatives authorized under the1992 Energy Efficiency Act, namely, the EnerGuidefor Equipment program, and the ENERGY STAR initiative.
For more information on the OEE and its programs, visit the Web site at oee.nrcan.gc.ca.
MINIMUM ENERGYPERFORMANCE STANDARDS(MEPS) AND THE ENERGYEFFICIENCY REGULATIONS13
Among NRCan’s wide range of energy efficiencyinitiatives are Canada’s Energy Efficiency Regulations,standards and labelling programs. The EnergyEfficiency Act, which came into force in 1992, givesthe Government of Canada the authority to makeand enforce regulations about performance andlabelling requirements for energy-using products,including major household appliances, importedinto Canada or shipped across provincial or territorial borders.
Following extensive consultations with provin-cial/territorial governments, affected industries,utilities, environmental groups and others, the firstEnergy Efficiency Regulations came into effect inFebruary 1995. The Regulations refer to nationalconsensus performance standards developed by theCanadian Standards Association, which includetesting procedures that must be used to determinea product’s energy performance. Regulated prod-ucts that fail to meet the MEPS identified by theRegulations cannot be imported into Canada ortraded interprovincially.
12 Natural Resources Canada. EnerGuide Appliance Directory 2005, Ottawa, 2005, p. 13.
13 Source: Natural Resources Canada. Improving Energy Performance in Canada, Report to Parliament Under the EnergyEfficiency Act For the Fiscal Year 2004–2005,Gatineau, 2005, p. 9.
INTRODUCTION
3 Trends for 1990-2004
14 Natural Resources Canada. EnerGuide Appliance Directory 2005, Ottawa, 2005.
NRCan regularly amends the Regulations tostrengthen the minimum energy performancerequirements for prescribed products where themarket has been transformed to a higher level ofefficiency. In preparing amendments to theRegulations, NRCan analyses the impact of theproposed amendment on society, the economyand the environment. For further information onthe Energy Efficiency Regulations, please refer to theWeb site at oee.nrcan.gc.ca/regulations.
Canada’s Energy Efficiency Act and Energy EfficiencyRegulations support a number of labelling initia-tives. They require that an EnerGuide label bedisplayed on major electrical household appli-ances, showing the consumer the estimated annualenergy consumption of the product in kilowatthours and comparing it with the most efficientand least efficient models of the same class and size.
EnerGuide directories with energy ratings formajor appliances are published each year and distributed to consumers, retailers and appliancesalespeople. Up-to-date searchable lists of modelsare also available on the NRCan Web site.Regularly conducted surveys indicate that over 50 percent of Canadians are aware of theEnerGuide label.
Responding to a desire by Canadians to have alabelling system designed to identify the best performers, Canada officially introduced, in 2001,ENERGY STAR®, the international symbol for ener-gy efficiency. ENERGY STAR began in the UnitedStates, through its Environmental ProtectionAgency (EPA), and has expanded internationally.The Office of Energy Efficiency signed an adminis-trative arrangement with the U.S. EPA and the U.S.Department of Energy to become the official custo-dian of the program for Canada. Canada becamethe fifth country to join the ENERGY STAR program, joining Australia, New Zealand,Japan and Taiwan. The European Union is nowalso a signatory of ENERGY STAR.
ENERGY STAR®
The ENERGY STAR® symbol isa simple way for consumersto identify products that areamong the most energy effi-cient on the market. Onlyappliance manufacturers andretailers whose products meet
the ENERGY STAR criteria can label their appli-ances with this symbol. The ENERGY STARspecifications get revised as federally regulatedMEPS increase in stringency.14
Refrigerators
The ENERGY STAR level for refrigerators increasedin stringency in 2004. Refrigerators must be atleast 15 percent more efficient than the MEPS inCanada’s Energy Efficiency Regulations to qualify for the ENERGY STAR mark. Before 2004, the performance level was 10 percent.
ENERGY STAR qualified refrigerators typically havea more energy-efficient compressor and betterinsulation than conventional models. They mayalso have an “energy saver” switch that allows theconsumer to adjust how much energy the refriger-ator uses to keep food fresh.
Freezers
ENERGY STAR qualified standard-size freezers mustexceed the MEPS by at least 10 percent. Compactfreezer models must exceed the MEPS by at least20 percent.
Dishwashers
Dishwashers must exceed the MEPS by at least 25 percent to qualify for the ENERGY STAR mark.
INTRODUCTION
Energy Consumption of Major Household Appliances Shipped in Canada 4
Many ENERGY STAR dishwashers use “smart” sen-sors that adjust the wash cycle and the amount ofwater to match the load. They may also have an internal heater to boost the temperature ofincoming water.
Clothes Washers
The ENERGY STAR level for clothes washersincreased in stringency in 2004. Standard-sizedclothes washers must be at least 36 percent moreefficient than the MEPS and must have a modifiedenergy factor (MEF) of at least 40.21 L/kWh/cycleto qualify for the ENERGY STAR mark. This energy efficiency level was raised from the 2003 minimum of 35.68 L/kWh/cycle.
The MEF indicates that the calculation takes intoaccount the amount of energy used by the dryer toremove moisture content. ENERGY STAR qualifiedclothes washers must have advanced design fea-tures that deliver cleaning performance whileusing less energy and 30 to 50 percent less water.The washer extracts more water from clothes during the spin cycle. This reduces the drying time and saves energy.
The ENERGY STAR symbol is becoming more readily recognized by the Canadian appliance purchaser. The next section analyses trends inENERGY STAR shipments.
Penetration Rate15 of ENERGY STAR Qualified Appliances
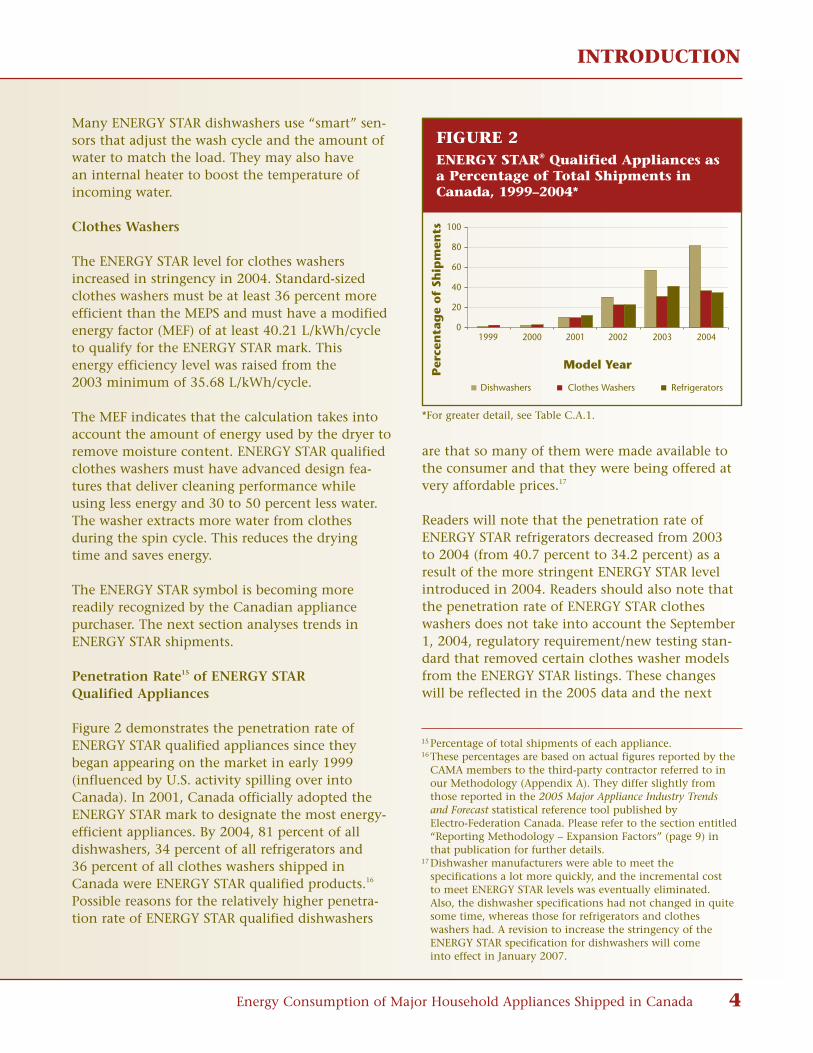
Figure 2 demonstrates the penetration rate ofENERGY STAR qualified appliances since theybegan appearing on the market in early 1999(influenced by U.S. activity spilling over intoCanada). In 2001, Canada officially adopted theENERGY STAR mark to designate the most energy-efficient appliances. By 2004, 81 percent of alldishwashers, 34 percent of all refrigerators and 36 percent of all clothes washers shipped inCanada were ENERGY STAR qualified products.16
Possible reasons for the relatively higher penetra-tion rate of ENERGY STAR qualified dishwashers
are that so many of them were made available tothe consumer and that they were being offered atvery affordable prices.17
Readers will note that the penetration rate ofENERGY STAR refrigerators decreased from 2003 to 2004 (from 40.7 percent to 34.2 percent) as aresult of the more stringent ENERGY STAR levelintroduced in 2004. Readers should also note thatthe penetration rate of ENERGY STAR clotheswashers does not take into account the September1, 2004, regulatory requirement/new testing stan-dard that removed certain clothes washer modelsfrom the ENERGY STAR listings. These changeswill be reflected in the 2005 data and the next
15 Percentage of total shipments of each appliance.16 These percentages are based on actual figures reported by the
CAMA members to the third-party contractor referred to in our Methodology (Appendix A). They differ slightly from those reported in the 2005 Major Appliance Industry Trends and Forecast statistical reference tool published by Electro-Federation Canada. Please refer to the section entitled“Reporting Methodology – Expansion Factors” (page 9) in that publication for further details.
17 Dishwasher manufacturers were able to meet the specifications a lot more quickly, and the incremental cost to meet ENERGY STAR levels was eventually eliminated. Also, the dishwasher specifications had not changed in quitesome time, whereas those for refrigerators and clothes washers had. A revision to increase the stringency of the ENERGY STAR specification for dishwashers will come into effect in January 2007.
Model Year
Dishwashers Clothes Washers Refrigerators
Per
cen
tag
e o
f Sh
ipm
ents
0
20
40
60
80
100
1999 2000 2001 2002 2003 2004
Fig A2.eps
FIGURE 2 ENERGY STAR® Qualified Appliances asa Percentage of Total Shipments inCanada, 1999–2004*
*For greater detail, see Table C.A.1.

INTRODUCTION
5 Trends for 1990-2004
18 Source: Canadian Appliance Manufacturers Association, a division of Electro-Federation Canada, 5800 Explorer Drive, Suite 200, Mississauga ON L4W 5K9 (www.electrofed.com).
19 Large, durable consumer goods usually finished in white, e.g. refrigerators, clothes washers, dryers.
20 Natural Resources Canada. 2003 Survey of Household Energy Use, Detailed Statistical Report, Ottawa, 2006, p. 59.
report. Since the initiative only recently included freezers, we have not included it in our analysis at this time.
Penetration Rate by Region/Province, 2004
Figure 3 shows the breakdown by region/province for each appliance category covered bythe ENERGY STAR initiative in 2004 (excludingfreezers). The tendencies remained quite constantthroughout the country, with the penetration rateof all three ENERGY STAR appliances being slightlyhigher in Ontario. Please note that, for confiden-tiality reasons, we have not shown the rate forclothes washers for the Atlantic provinces.
THE ROLE OF THE MEMBERSOF THE CANADIAN APPLIANCEMANUFACTURERSASSOCIATION (CAMA)18
Canadian Appliance Manufacturers Association(CAMA) members understand the important rolethey must play in minimizing the effects house-hold appliances have on the environment.Developing, producing and marketing more-energy-efficient products to aid in reducing con-sumer energy use and harmful greenhouse gasemissions is just one of these roles. They alsoacknowledge the importance of recycling andproperly disposing of white goods
19products
and their packaging.
The recycling rate for end-of-life appliances inCanada is considered to be relatively high due tothe number of municipal recycling initiativesavailable, as well as to the significant level of valu-able materials that comprise most householdappliances (e.g. steel, aluminum, copper, zinc,plastics). However, it is difficult to put a number tooverall national or regional recovery rates becausethere is no national mechanism for tracking whitegoods recovery and recycling. As noted earlier,according to the 2003 Survey of Household EnergyUse,
20approximately 765 000 Canadians did not
dispose of their previous refrigerator when theyacquired a new one. As the issue is truly a North
American concern, CAMA has formed a jointworking group with the U.S. Association of HomeAppliance Manufacturers to develop new solutionsto a growing issue.
The significant reduction in appliance energy consumption over the years has resulted from thecombined efforts of the appliance industry, gov-ernments, retailers and consumers. The minimumefficiency standards have contributed to the lower-ing of peak electricity demand, and to cost savingsto consumers. The benefit to society of more-efficient appliances will continue as the existingstock of major appliances in Canadian homes is replaced.
Region
Dishwashers Refrigerators Clothes Washers
Per
cen
tag
e o
f Sh
ipm
ents
Canada Atlantic Quebec Ontario Prairies BritishColumbia
andTerritories
0
20
40
60
80
100
Fig A3.eps
FIGURE 3 ENERGY STAR® Qualified Appliances asa Percentage of Total Shipments, byRegion/Province, 2004*
*For greater detail, see Table C.A.2.
INTRODUCTION
Energy Consumption of Major Household Appliances Shipped in Canada 6
CAMA and its member companies take environ-mental issues very seriously and have takensignificant steps to minimize the impact house-hold appliances have on the environment whilemeeting consumer needs. Examples of improve-ments by the appliance manufacturers, inconjunction with their material and componentsuppliers, are as follows:
Refrigerators and freezers• Condensers, compressors, evaporators, fan
motors, door seals, foam insulation.
Dishwashers• Insulation, spray arms, filtering systems,
availability of an air-dry cycle.
Electric ranges• Improvements have been limited, as
conventional cooking requires high heat. Improvements in insulation and venting.
Clothes washers• Sensors, motors, mixing valves, promotion
of cold water wash, adding front-loading clothes washers to manufacturers’ product lines.
Clothes dryers• Automatic termination controls eliminating
over-drying, more effective water extraction in the washing machine.

CHAPTER 1 REFRIGERATORS
1 REFRIGERATORS
7 Trends for 1990-2004
Refrigerators are available in various sizes and witha variety of different features, all of which affectenergy consumption. This is why EnerGuidegroups refrigerators according to type and size,enabling you to compare the energy consumptionof similar models. The following are the defini-tions of the various types of refrigerators:
Refrigerators without automatic defrost
Type 1 Refrigerators and refrigerator-freezers with manual defrost
Type 2 Refrigerator-freezers with partial automatic defrost
Refrigerators with automatic defrost
Type 3 Refrigerator-freezers with automatic defrost, with top-mounted freezer, without through-the-door ice service and all-refrigerators21 withautomatic defrost
Type 4 Refrigerator-freezers with automatic defrost, with side-mounted freezer, without through-the-door ice service
Type 5 Refrigerator-freezers with automatic defrost, with bottom-mounted freezer, without through-the-door ice service
Type 6 Refrigerator-freezers with automatic defrost, with top-mounted freezer and through-the-door ice service
Type 7 Refrigerator-freezers with automatic defrost, with side-mounted freezer and through-the-door ice service
Refrigerators – compact
Type 11 Compact refrigerators and refrigerator-freezers with manual defrost
Type 12 Compact refrigerators and refrigerator-freezers with partial automatic defrost
Type 13 Compact refrigerator-freezers with automatic defrost and with top-mounted freezer as well as compact all-refrigerator models with automatic defrost
Type 14 Compact refrigerator-freezers with automatic defrost with side-mounted freezer
Type 15 Compact refrigerator-freezers with automatic defrost with bottom-mounted freezer
21 The term “all-refrigerators” refers to models that have nofreezer compartment.
*Due to rounding, the numbers may not add up.
TABLE 1.1Refrigerator Market, 2004
Market Share (%)
Type of Refrigerator1 0.02 0.03 66.44 1.95 15.56 0.17 11.011 4.512 0.013 0.514 0.015 0.0
100.0
Through-the-Door Ice Service 11.0
Type of Freezer*Top-mounted 67.0Side-mounted 12.9Bottom-mounted 15.5Without freezer 4.5
100.0

CHAPTER 1 REFRIGERATORS
Energy Consumption of Major Household Appliances Shipped in Canada 8
1.1 2004 Market Snapshot
In 2004, as in all studied years since 1990, Type 3refrigerators (those with top-mounted freezers andautomatic defrost) were by far the most populartype in Canada, accounting for 66.4 percent of allrefrigerators shipped on the Canadian market. Theshipment-weighted average annual unit energyconsumption (UEC) of all refrigerators shipped in 2004 was 478 kilowatt hours (kWh). The mostpopular size category, 16.5 to 18.4 cubic feet (cu. ft.), accounted for 39 percent of the market.
As noted earlier, the ENERGY STAR® level for refrigerators increased in stringency in 2004.Over 34 percent of the refrigerator models onthe market that year qualified for ENERGY STAR,exceeding the minimum energy performance standards (MEPS) by at least 15 percent. This proportion, however, is down from the previousyear (40.7 percent), likely due to these more stringent specifications.
There has been a substantial improvement
in the energy efficiency of refrigerators
since 1990. By 2004, 82.6 percent
of refrigerators consumed less than
30 kWh/cu. ft./yr., even though a trend
toward larger refrigerators had emerged.
Refrigerators with a volume between
16.5 and 18.4 cu. ft. remained the most
popular, on average accounting for
39.2 percent of the market in 2004.
From 1990 to 2004, the largest
refrigerators (those with a volume of at
least 20.5 cu. ft.) more than quadrupled
in market share – rising from 5.1 to
23.5 percent. In 1990, refrigerators larger
than 16.4 cu. ft. consumed on average
more than 1000 kWh of electricity per year.
By 2004, refrigerators that size consumed
less than half as much energy, and some
of the largest units (28.5 to 30.4 cu. ft.)
consumed, on average, only 627 kWh of
electricity per year.
CHAPTER 1 REFRIGERATORS
9 Trends for 1990-2004
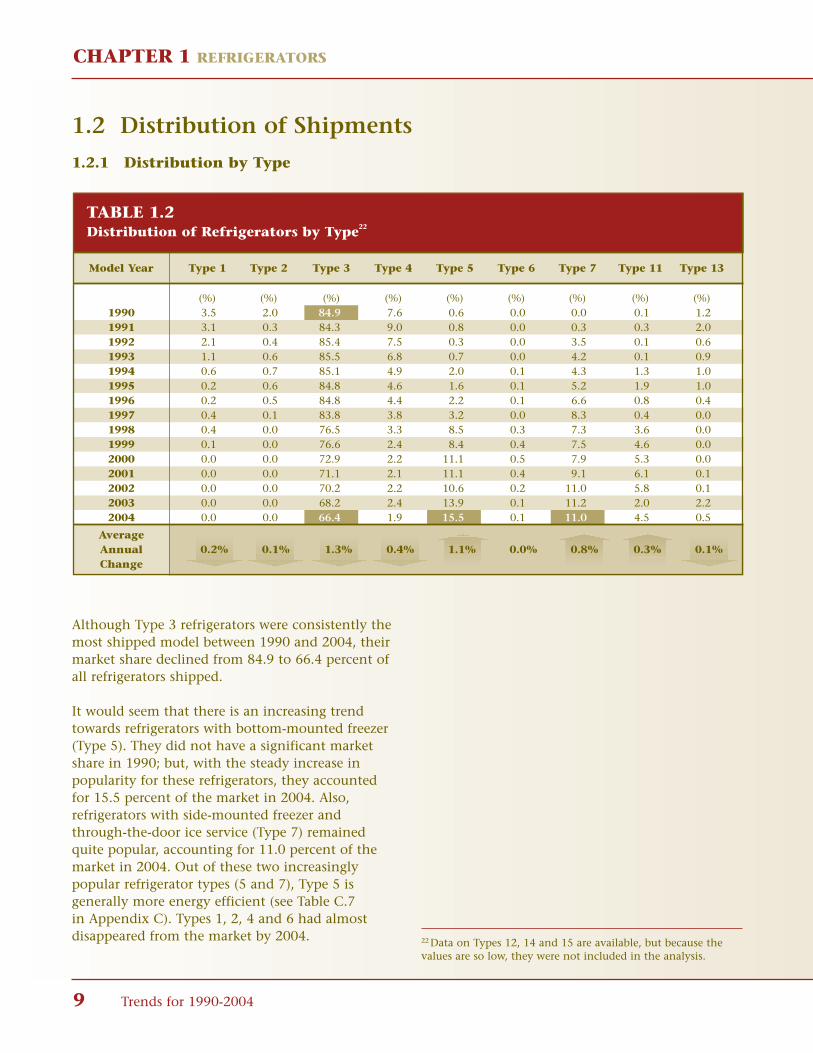
Although Type 3 refrigerators were consistently themost shipped model between 1990 and 2004, theirmarket share declined from 84.9 to 66.4 percent ofall refrigerators shipped.
It would seem that there is an increasing trendtowards refrigerators with bottom-mounted freezer(Type 5). They did not have a significant marketshare in 1990; but, with the steady increase inpopularity for these refrigerators, they accountedfor 15.5 percent of the market in 2004. Also, refrigerators with side-mounted freezer andthrough-the-door ice service (Type 7) remainedquite popular, accounting for 11.0 percent of themarket in 2004. Out of these two increasingly popular refrigerator types (5 and 7), Type 5 is generally more energy efficient (see Table C.7in Appendix C). Types 1, 2, 4 and 6 had almost disappeared from the market by 2004.
1.2 Distribution of Shipments
1.2.1 Distribution by Type
22 Data on Types 12, 14 and 15 are available, but because thevalues are so low, they were not included in the analysis.
TABLE 1.2Distribution of Refrigerators by Type22
Model Year Type 1 Type 2 Type 3 Type 4 Type 5 Type 6 Type 7 Type 11 Type 13
(%) (%) (%) (%) (%) (%) (%) (%) (%)1990 3.5 2.0 84.9 7.6 0.6 0.0 0.0 0.1 1.21991 3.1 0.3 84.3 9.0 0.8 0.0 0.3 0.3 2.01992 2.1 0.4 85.4 7.5 0.3 0.0 3.5 0.1 0.61993 1.1 0.6 85.5 6.8 0.7 0.0 4.2 0.1 0.91994 0.6 0.7 85.1 4.9 2.0 0.1 4.3 1.3 1.01995 0.2 0.6 84.8 4.6 1.6 0.1 5.2 1.9 1.01996 0.2 0.5 84.8 4.4 2.2 0.1 6.6 0.8 0.41997 0.4 0.1 83.8 3.8 3.2 0.0 8.3 0.4 0.01998 0.4 0.0 76.5 3.3 8.5 0.3 7.3 3.6 0.01999 0.1 0.0 76.6 2.4 8.4 0.4 7.5 4.6 0.02000 0.0 0.0 72.9 2.2 11.1 0.5 7.9 5.3 0.02001 0.0 0.0 71.1 2.1 11.1 0.4 9.1 6.1 0.12002 0.0 0.0 70.2 2.2 10.6 0.2 11.0 5.8 0.12003 0.0 0.0 68.2 2.4 13.9 0.1 11.2 2.0 2.22004 0.0 0.0 66.4 1.9 15.5 0.1 11.0 4.5 0.5
AverageAnnual 0.2% 0.1% 1.3% 0.4% 1.1% 0.0% 0.8% 0.3% 0.1%Change

CHAPTER 1 REFRIGERATORS
Energy Consumption of Major Household Appliances Shipped in Canada 10
1.2.2 Distribution by Type, byRegion/Province
As previously mentioned, Type 3 refrigerators(those with top-mounted freezers and automaticdefrost) remained the most shipped model in2004, with the national average being at 66.4 percent. Figure 1.2 illustrates the distributionof the various types of refrigerators throughout theregions/provinces. Type 3 refrigerators were mostpopular in the Atlantic provinces, whereas Type 5(those with bottom-mounted freezers and auto-matic defrost) were more popular in Quebec (18.8 percent), Ontario and the western provinces(13 to 14 percent). Type 7 (those with side-mounted freezers, automatic defrost, and through-the-door ice service) were also more popular inOntario and the western provinces (13 to 14 percent).
Region
Per
cen
tag
e o
f Sh
ipm
ents
Canada Atlantic Quebec Ontario Prairies BritishColumbia
andTerritories
0
20
40
60
80
100
Type 3 Type 5 Type 7
Type 11 Others (Types 4, 6, 12, 13)
Fig 1.2.eps
*For greater detail, see Table C.1.
FIGURE 1.2Distribution of Refrigerators by Type, by Region/Province, 2004*
FIGURE 1.1Distribution of Refrigerators by Type for 1990 and 2004
Type 110.1%
Type 13.5%
Type 22.0%
Type 131.2%
Type 47.6%
Type 384.9%
Type 70.0%
Type 50.6%
Type 60.0% Type 7
11.0%
Type 114.5%
Type 130.5%
Type 10.0%
Type 20.0%
Type 366.4%
Type 41.9%
Type 515.5%
Type 60.1%
1990 2004
CHAPTER 1 REFRIGERATORS
11 Trends for 1990-2004
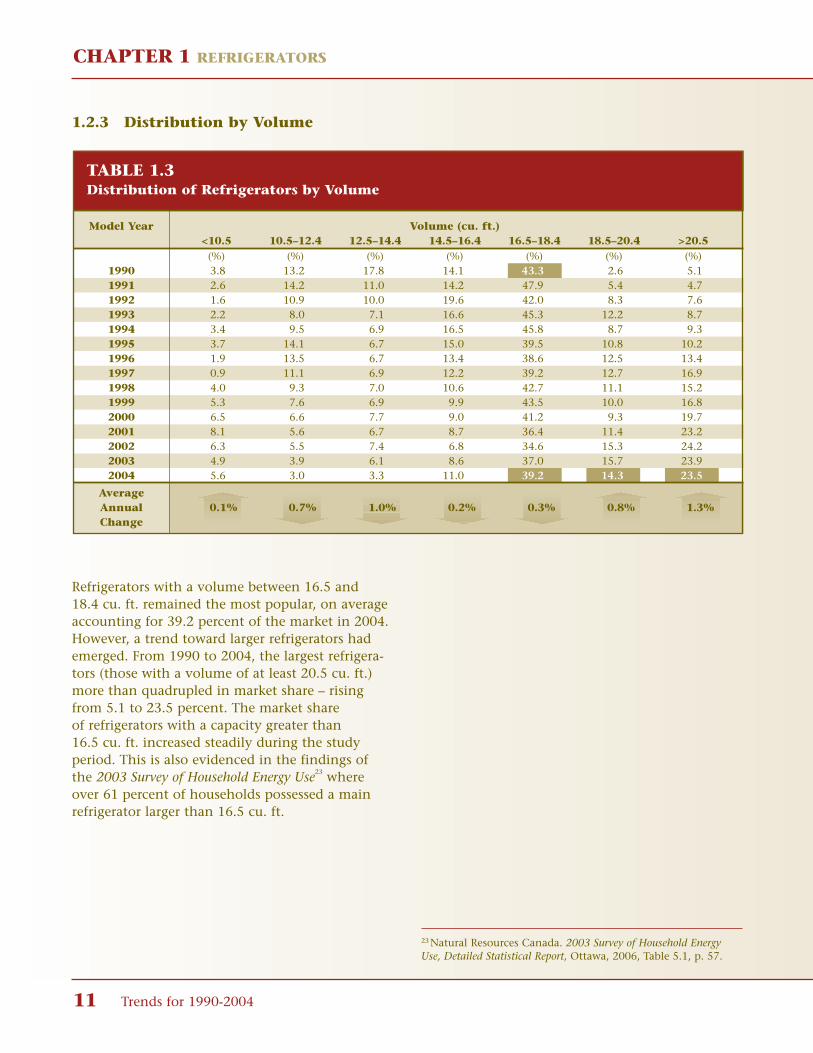
Refrigerators with a volume between 16.5 and 18.4 cu. ft. remained the most popular, on averageaccounting for 39.2 percent of the market in 2004.However, a trend toward larger refrigerators hademerged. From 1990 to 2004, the largest refrigera-tors (those with a volume of at least 20.5 cu. ft.)more than quadrupled in market share – risingfrom 5.1 to 23.5 percent. The market share of refrigerators with a capacity greater than 16.5 cu. ft. increased steadily during the studyperiod. This is also evidenced in the findings ofthe 2003 Survey of Household Energy Use23 whereover 61 percent of households possessed a mainrefrigerator larger than 16.5 cu. ft.
1.2.3 Distribution by Volume
23 Natural Resources Canada. 2003 Survey of Household EnergyUse, Detailed Statistical Report, Ottawa, 2006, Table 5.1, p. 57.
TABLE 1.3Distribution of Refrigerators by Volume
Model Year Volume (cu. ft.)<10.5 10.5–12.4 12.5–14.4 14.5–16.4 16.5–18.4 18.5–20.4 >20.5
(%) (%) (%) (%) (%) (%) (%)1990 3.8 13.2 17.8 14.1 43.3 2.6 5.11991 2.6 14.2 11.0 14.2 47.9 5.4 4.71992 1.6 10.9 10.0 19.6 42.0 8.3 7.61993 2.2 8.0 7.1 16.6 45.3 12.2 8.71994 3.4 9.5 6.9 16.5 45.8 8.7 9.31995 3.7 14.1 6.7 15.0 39.5 10.8 10.21996 1.9 13.5 6.7 13.4 38.6 12.5 13.41997 0.9 11.1 6.9 12.2 39.2 12.7 16.91998 4.0 9.3 7.0 10.6 42.7 11.1 15.21999 5.3 7.6 6.9 9.9 43.5 10.0 16.82000 6.5 6.6 7.7 9.0 41.2 9.3 19.72001 8.1 5.6 6.7 8.7 36.4 11.4 23.22002 6.3 5.5 7.4 6.8 34.6 15.3 24.22003 4.9 3.9 6.1 8.6 37.0 15.7 23.92004 5.6 3.0 3.3 11.0 39.2 14.3 23.5
AverageAnnual 0.1% 0.7% 1.0% 0.2% 0.3% 0.8% 1.3%Change
CHAPTER 1 REFRIGERATORS
Energy Consumption of Major Household Appliances Shipped in Canada 12
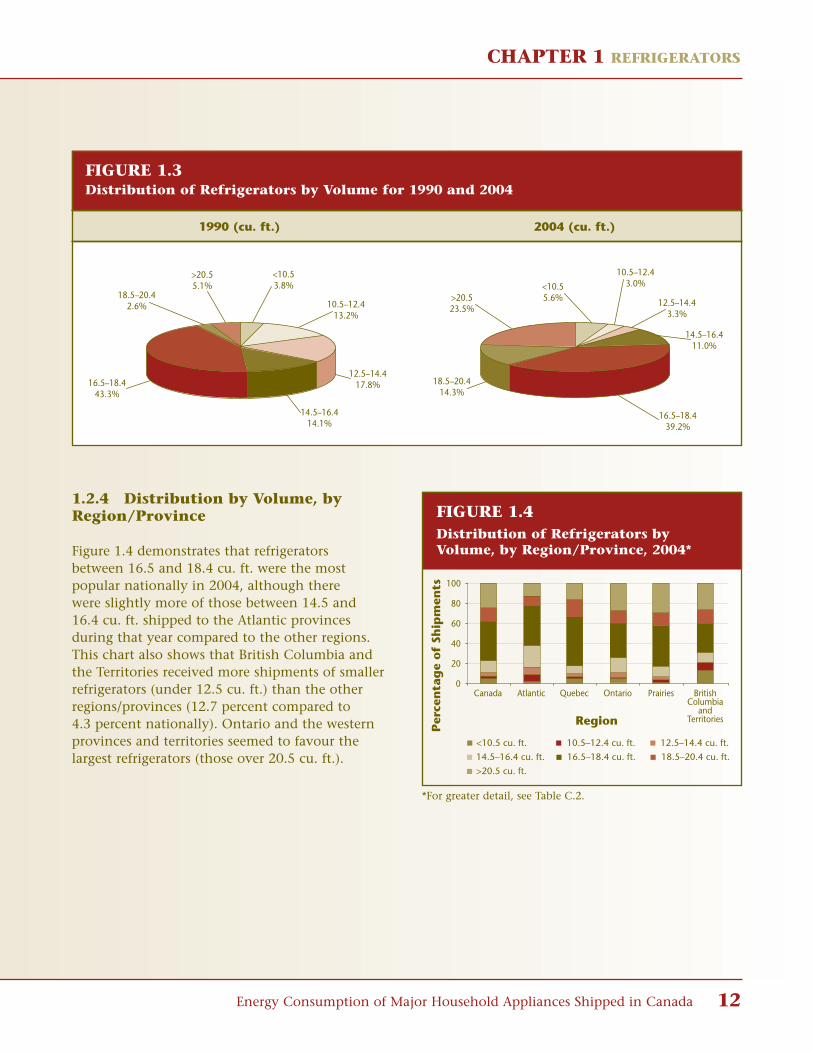
1.2.4 Distribution by Volume, byRegion/Province
Figure 1.4 demonstrates that refrigerators between 16.5 and 18.4 cu. ft. were the most popular nationally in 2004, although there were slightly more of those between 14.5 and 16.4 cu. ft. shipped to the Atlantic provinces during that year compared to the other regions.This chart also shows that British Columbia andthe Territories received more shipments of smallerrefrigerators (under 12.5 cu. ft.) than the otherregions/provinces (12.7 percent compared to 4.3 percent nationally). Ontario and the westernprovinces and territories seemed to favour thelargest refrigerators (those over 20.5 cu. ft.).
Region
Per
cen
tag
e o
f Sh
ipm
ents
Canada Atlantic Quebec Ontario Prairies BritishColumbia
andTerritories
0
20
40
60
80
100
<10.5 cu. ft. 10.5–12.4 cu. ft. 12.5–14.4 cu. ft.
14.5–16.4 cu. ft.
>20.5 cu. ft.
16.5–18.4 cu. ft. 18.5–20.4 cu. ft.
Fig 1.4.eps
*For greater detail, see Table C.2.
FIGURE 1.4Distribution of Refrigerators by Volume, by Region/Province, 2004*
FIGURE 1.3Distribution of Refrigerators by Volume for 1990 and 2004
<10.53.8%
10.5–12.413.2%
12.5–14.417.8%
14.5–16.414.1%
16.5–18.443.3%
18.5–20.42.6%
>20.55.1%
18.5–20.414.3%
16.5–18.439.2%
>20.523.5%
<10.55.6%
14.5–16.411.0%
12.5–14.43.3%
10.5–12.43.0%
1990 (cu. ft.) 2004 (cu. ft.)

CHAPTER 1 REFRIGERATORS
13 Trends for 1990-2004
Figure 1.5 compares the national breakdown of the distribution of refrigerators for the retail andbuilder trade. Although the most popular size of refrigerator in both cases was that between 16.5 and 18.4 cu. ft., retail shipments of refrigera-tors over 18.4 cu. ft. were higher (41.5 percent)than those shipped for the builder trade (20.5 percent). This chart also shows that buildershipments of refrigerators between 14.5 and 16.4 cu. ft. were higher (23.8 percent) than those shipped for retail sales (8.2 percent).
The channel (retail versus builder) data alsoshowed that retail shipments of refrigerators under 10.5 cu. ft. were quite high in BritishColumbia and the Territories (19.4 percent compared to 6.7 percent nationally). Similarly,retail shipments of refrigerators between 14.5 and16.4 cu. ft. were higher in the Atlantic provinces(22 percent compared to 8.2 percent nationally).Shipments of refrigerators between 10.5 and 12.4 cu. ft. to the builder trade were somewhathigher in the Atlantic provinces and Quebec (20.2 percent and 23.4 percent, respectively, compared to 10.2 percent nationally). Shipmentsof the largest refrigerators (those over 20.5 cu. ft.)to the builder trade were highest in the Prairies
FIGURE 1.5Distribution of Refrigerators by Volume, by Channel, 2004
16.5–18.4 cu. ft.39.9%
18.5–20.4 cu. ft.16.5%
>20.5 cu. ft.25.0% <10.5 cu. ft.
6.7%
14.5–16.4 cu. ft.8.2%
10.5–12.4 cu. ft.1.5% 12.5–14.4 cu. ft.
2.2% 12.5–14.4 cu. ft.8.7%
16.5–18.4 cu. ft.36.3%
18.5–20.4 cu. ft.4.1%
>20.5 cu. ft.16.4%
<10.5 cu. ft.0.5%
10.5–12.4 cu. ft.10.2%
14.5–16.4 cu. ft.23.8%
Retail Builder
and British Columbia and the Territories (23.4 percent and 29 percent, respectively, compared to 16.4 nationally). For greater detail,see Tables C.3 and C.4 in Appendix C.
1.2.5 Distribution by Average Annual Unit Energy Consumption per Cubic Foot
Refrigerators are becoming more efficient, thankslargely to the ongoing efforts of manufacturers,the MEPS and the amendment to the MEPS in2001. It is interesting to note in Table 1.4 andFigure 1.6 that, since this amendment to theMEPS, which occurred in 2001, there has been asubstantial improvement in the energy efficiencyof refrigerators. By 2004, 82.6 percent of refrigera-tors consumed less than 30 kWh/cu. ft./yr., eventhough there was a definite trend towards largercapacity, as illustrated in Table 1.3.
Also responsible for the trend in purchaseof more-energy-efficient refrigerators arethe various initiatives and incentives offeredby the federal, provincial and municipalgovernments and utilities.

CHAPTER 1 REFRIGERATORS
Energy Consumption of Major Household Appliances Shipped in Canada 14
FIGURE 1.6Distribution of Refrigerators by Average Annual Unit Energy Consumption per Cubic Foot for 1990 and 2004
50–59.915.3%
60–69.960.2%
70–79.915.4%
40–49.93.9%
80–89.93.0%
<300.0%
30–39.91.5%
>900.7%
<3082.6%
30–39.911.0%
>900.7%
80–89.93.0%
60–69.90.2%
40–49.91.3%
70–79.91.2%
50–59.90.2%
1990 (kWh/cu. ft./yr.) 2004 (kWh/cu. ft./yr.)
TABLE 1.4Distribution of Refrigerators by Average Annual Unit Energy Consumption per Cubic Foot
Model Year kWh/cu. ft./yr.<30 30–39.9 40–49.9 50–59.9 60–69.9 70–79.9 80–89.9 > 90(%) (%) (%) (%) (%) (%) (%) (%)
1990 0.0 1.5 3.9 15.3 60.2 15.4 3.0 0.71991 0.0 2.9 10.7 26.9 41.3 12.2 3.6 2.41992 0.0 4.8 26.9 33.2 16.0 10.4 4.0 4.81993 0.1 51.0 29.7 9.1 1.4 4.2 1.9 2.61994 0.4 70.9 22.4 4.0 0.0 0.0 1.7 0.61995 2.8 63.3 29.3 1.6 0.0 0.1 2.5 0.51996 6.6 60.0 31.2 0.9 0.1 0.0 0.7 0.41997 6.9 60.4 31.4 0.9 0.1 0.0 0.2 0.11998 5.9 62.4 27.1 0.8 0.0 0.6 2.9 0.21999 8.4 61.2 25.0 0.6 0.2 0.7 3.4 0.62000 12.2 57.4 23.6 0.9 0.4 0.7 3.6 1.22001 44.5 34.5 12.7 1.3 0.8 4.0 0.7 1.52002 64.3 26.6 3.1 0.2 0.0 3.9 0.2 1.72003 78.4 15.5 1.6 0.2 0.2 2.8 0.2 1.02004 82.6 11.0 1.3 0.2 0.2 1.2 3.0 0.7
AverageAnnual 5.9% 0.7% 0.2% 1.1% 4.3% 1.0% 0.0% 0.0%Change

CHAPTER 1 REFRIGERATORS
15 Trends for 1990-2004
1.2.6 Distribution by Average AnnualUnit Energy Consumption per Cubic Foot, by Region/Province
In 2004, 82.6 percent of all refrigerators shipped in Canada consumed less than 30 kWh/cu. ft.Figure 1.7 shows that consumers in BritishColumbia and the Territories had a slight prefer-ence towards more energy-intensive refrigerators in 2004, compared with the rest of the country;27.4 percent of refrigerators shipped there con-sumed more than 30 kWh/cu. ft. This could beattributed to the fact that they have a higher per-centage of compact refrigerator shipments thanother regions, which have been found to be lessenergy efficient (see Figure 1.11).
1.2.7 Distribution by Channel, byRegion/Province
Figure 1.8 demonstrates the proportion of refriger-ators shipped for retail sales24 versus those shippedfor builder sales.25 It shows that, for Canada as awhole, approximately 81.4 percent of all refrigera-tors were categorized as retail shipments, whereas18.6 percent of them were tagged as builder ship-ments. The chart also outlines the differences inthis proportion for the regions/provinces, with theAtlantic provinces and British Columbia and theTerritories having a substantially larger builder representation than the rest of the country.Shipments of refrigerators to builders in Quebecwere relatively low (6.3 percent) compared to therest of the country.
Region
Per
cen
tag
e o
f Sh
ipm
ents
Canada Atlantic Quebec Ontario Prairies BritishColumbia
andTerritories
0
20
40
60
80
100
<30 kWh/cu. ft./yr. 30–39.9 kWh/cu. ft./yr.
40–49.9 kWh/cu. ft./yr. 50–59.9 kWh/cu. ft./yr.>60 kWh/cu. ft./yr.
Fig 1.7.eps
FIGURE 1.7 Distribution of Refrigerators by AverageAnnual Unit Energy Consumption perCubic Foot, by Region/Province, 2004*
*For greater detail, see Table C.5.
Region
Per
cen
tag
e o
f Sh
ipm
ents
Canada Atlantic Quebec Ontario Prairies BritishColumbia
andTerritories
0
20
40
60
80
100
Builder Retail
FIGURE 1.8 Distribution of Refrigerators byChannel, by Region/Province, 2004*
*For greater detail, see Table C.6.
24 Retail sales include those by Canadian manufacturers andimporters and/or their branches and distributors to Canadianretailers, government agencies, utilities and other consumers,but do not include sales to branches or to other CanadianAppliance Manufacturers Association member companies.25 Builder sales include those to home, row house or apartmentbuilders; motels; governments; trailer manufacturers and property management.

CHAPTER 1 REFRIGERATORS
Energy Consumption of Major Household Appliances Shipped in Canada 16
1.3 Energy Consumption
1.3.1 Average Annual Unit EnergyConsumption by Model Year
As mentioned earlier, even though there is muchdiversity in types and sizes of refrigerators, wehave grouped them all together to calculate theaverage UEC for all refrigerators by model year (see Figure 1.9). Overall, the UEC decreased by478.5 kWh during the study period. Readersshould note the significant decrease in UEC from2000 to 2004 (161.8 kWh/yr.), which coincideswith the 2001 amendment to the MEPS. For analysis of the distribution of refrigerators by average annual UEC by type, see Table C.7 inAppendix C. Because size is so important in suchanalysis, we advise the readers to also look furtherat the distribution of refrigerators by averageannual UEC per cubic foot by volume (Table C.8in Appendix C).
1.3.2 Average Annual Unit EnergyConsumption by Volume
The energy performance of refrigerators improvedremarkably between 1990 and 2004. As illustratedin Figure 1.10, the larger the volume, the greater thedecrease in average annual UEC. The average annualUEC of refrigerators with volumes below 5 cu. ft.remained relatively unchanged during the period.
In 1990, refrigerators larger than 16.4 cu. ft. consumed on average more than 1000 kWh ofelectricity per year. By 2004, refrigerators that sizeconsumed less than half as much energy, andsome of the largest units (28.5 to 30.4 cu. ft.) consumed, on average, only 627 kWh of electricity per year.
The gap between the average annual UEC of thelargest and smallest units narrowed between 1990and 2004. When the period began, the differencebetween the average annual UEC of the largest andsmallest units was over 1000 kWh. By 2004, withmanufacturers improving the energy efficiency oflarger models, the difference had shrunk to about275 kWh.
Model Year
kW
h/y
r.
0
200
400
600
800
1000
1200
1990
1992
1994
1996
1998
2000
2002
2004
1991
1993
1995
1997
1999
2001
2003
Fig 1.9.eps
FIGURE 1.9 Average Annual Unit EnergyConsumption of Refrigerators by Model Year*
*For greater detail, see Table C.7.
Volume (cu. ft.)
kW
h/y
r.
0
200
400
600
800
1000
1200
1400
1600
0 5 10 15 20 25 30 35
1990 2004
Fig 1.10.eps
*For greater detail, see Table C.8.
FIGURE 1.10 Average Annual Unit EnergyConsumption of Refrigerators by Volume*
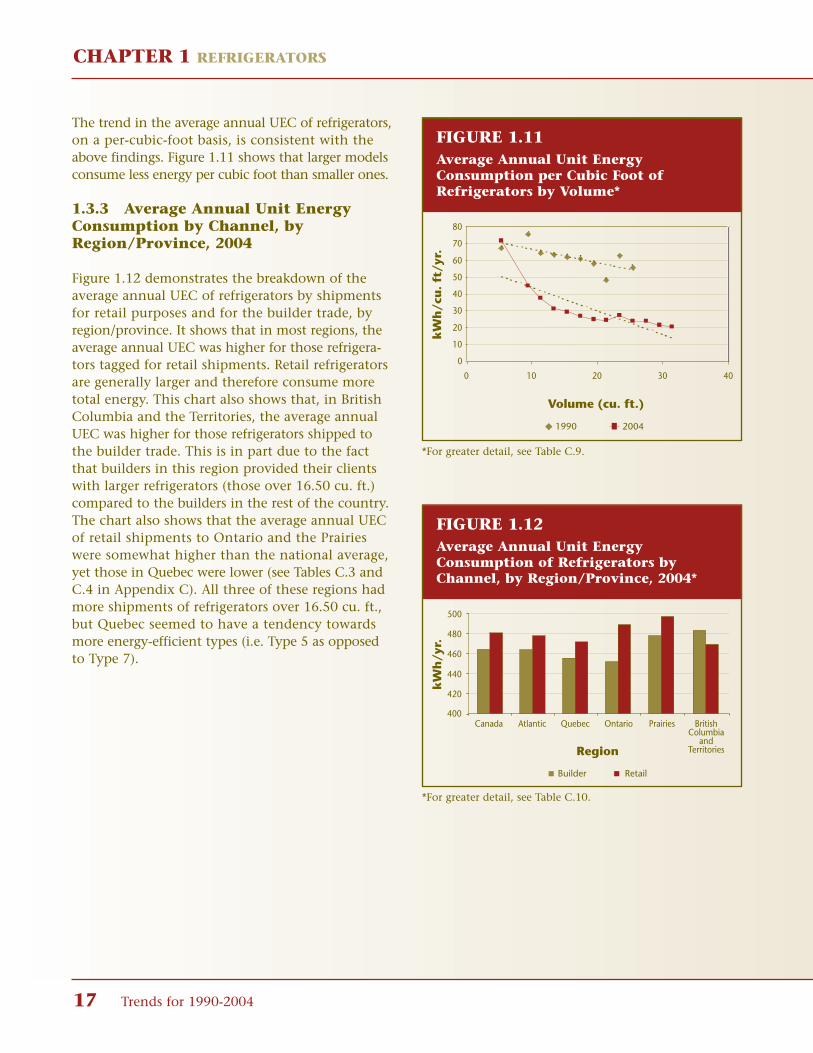
CHAPTER 1 REFRIGERATORS
17 Trends for 1990-2004
The trend in the average annual UEC of refrigerators,on a per-cubic-foot basis, is consistent with theabove findings. Figure 1.11 shows that larger modelsconsume less energy per cubic foot than smaller ones.
1.3.3 Average Annual Unit EnergyConsumption by Channel, byRegion/Province, 2004
Figure 1.12 demonstrates the breakdown of theaverage annual UEC of refrigerators by shipmentsfor retail purposes and for the builder trade, byregion/province. It shows that in most regions, theaverage annual UEC was higher for those refrigera-tors tagged for retail shipments. Retail refrigeratorsare generally larger and therefore consume moretotal energy. This chart also shows that, in BritishColumbia and the Territories, the average annualUEC was higher for those refrigerators shipped tothe builder trade. This is in part due to the factthat builders in this region provided their clientswith larger refrigerators (those over 16.50 cu. ft.)compared to the builders in the rest of the country.The chart also shows that the average annual UECof retail shipments to Ontario and the Prairieswere somewhat higher than the national average,yet those in Quebec were lower (see Tables C.3 andC.4 in Appendix C). All three of these regions hadmore shipments of refrigerators over 16.50 cu. ft.,but Quebec seemed to have a tendency towardsmore energy-efficient types (i.e. Type 5 as opposedto Type 7).
Volume (cu. ft.)
kW
h/c
u.
ft/y
r.
0
10
20
30
40
50
60
70
80
0 10 20 30 40
1990 2004
FIGURE 1.11 Average Annual Unit EnergyConsumption per Cubic Foot ofRefrigerators by Volume*
*For greater detail, see Table C.9.
Region
kW
h/y
r.
Canada Atlantic Quebec Ontario Prairies BritishColumbia
andTerritories
400
420
440
460
480
500
Builder Retail
Fig 1.12.eps
FIGURE 1.12 Average Annual Unit EnergyConsumption of Refrigerators byChannel, by Region/Province, 2004*
*For greater detail, see Table C.10.
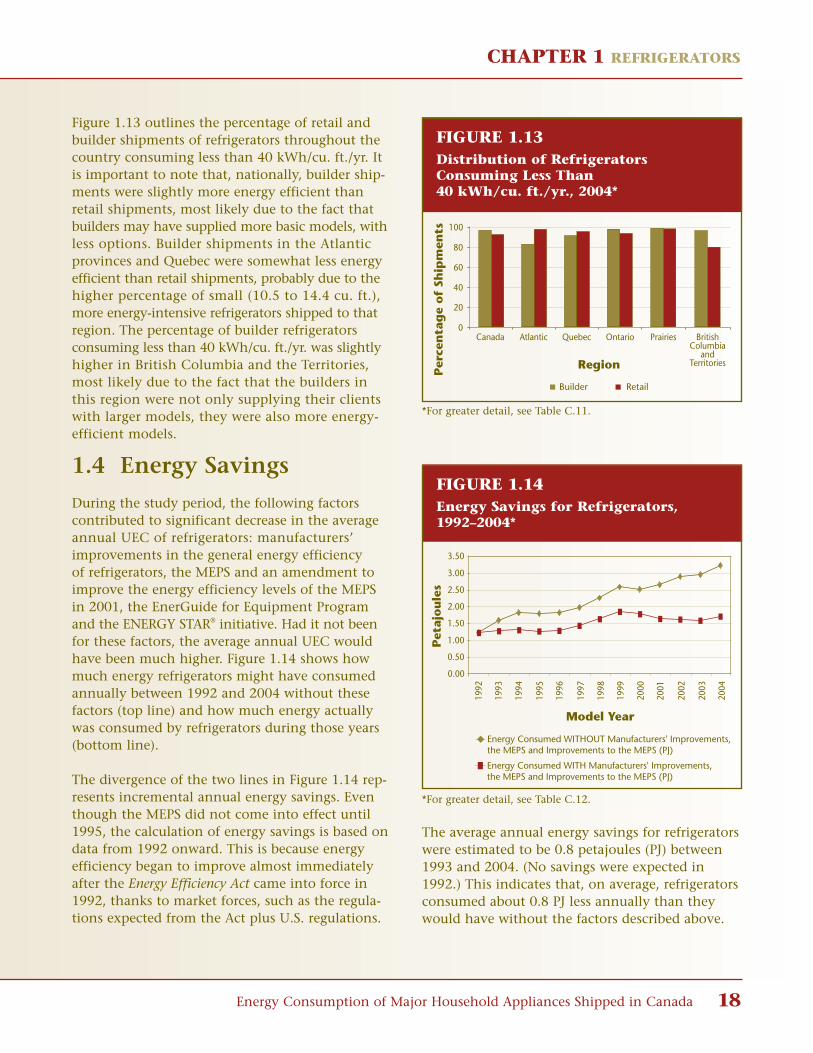
CHAPTER 1 REFRIGERATORS
Energy Consumption of Major Household Appliances Shipped in Canada 18
Figure 1.13 outlines the percentage of retail andbuilder shipments of refrigerators throughout thecountry consuming less than 40 kWh/cu. ft./yr. Itis important to note that, nationally, builder ship-ments were slightly more energy efficient thanretail shipments, most likely due to the fact thatbuilders may have supplied more basic models, withless options. Builder shipments in the Atlanticprovinces and Quebec were somewhat less energyefficient than retail shipments, probably due to thehigher percentage of small (10.5 to 14.4 cu. ft.),more energy-intensive refrigerators shipped to thatregion. The percentage of builder refrigeratorsconsuming less than 40 kWh/cu. ft./yr. was slightlyhigher in British Columbia and the Territories,most likely due to the fact that the builders inthis region were not only supplying their clientswith larger models, they were also more energy-efficient models.
1.4 Energy Savings
During the study period, the following factorscontributed to significant decrease in the averageannual UEC of refrigerators: manufacturers’improvements in the general energy efficiencyof refrigerators, the MEPS and an amendment toimprove the energy efficiency levels of the MEPSin 2001, the EnerGuide for Equipment Programand the ENERGY STAR® initiative. Had it not beenfor these factors, the average annual UEC wouldhave been much higher. Figure 1.14 shows howmuch energy refrigerators might have consumedannually between 1992 and 2004 without thesefactors (top line) and how much energy actuallywas consumed by refrigerators during those years(bottom line).
The divergence of the two lines in Figure 1.14 rep-resents incremental annual energy savings. Eventhough the MEPS did not come into effect until1995, the calculation of energy savings is based ondata from 1992 onward. This is because energyefficiency began to improve almost immediatelyafter the Energy Efficiency Act came into force in1992, thanks to market forces, such as the regula-tions expected from the Act plus U.S. regulations.
Region
Per
cen
tag
e o
f Sh
ipm
ents
Canada Atlantic Quebec Ontario Prairies BritishColumbia
andTerritories
0
20
40
60
80
100
Builder Retail
Fig 1.13.eps
FIGURE 1.13 Distribution of RefrigeratorsConsuming Less Than 40 kWh/cu. ft./yr., 2004*
*For greater detail, see Table C.11.
The average annual energy savings for refrigeratorswere estimated to be 0.8 petajoules (PJ) between1993 and 2004. (No savings were expected in1992.) This indicates that, on average, refrigeratorsconsumed about 0.8 PJ less annually than theywould have without the factors described above.
Model Year
Pet
ajo
ule
s
0.00
0.50
1.00
1.50
2.00
2.50
3.00
3.50
Energy Consumed WITHOUT Manufacturers' Improvements, the MEPS and Improvements to the MEPS (PJ)
Energy Consumed WITH Manufacturers' Improvements, the MEPS and Improvements to the MEPS (PJ)
1992
1993
1994
1995
1996
1997
1998
1999
2000
2001
2002
2003
2004
Fig 1.14.eps
FIGURE 1.14Energy Savings for Refrigerators,1992–2004*
*For greater detail, see Table C.12.
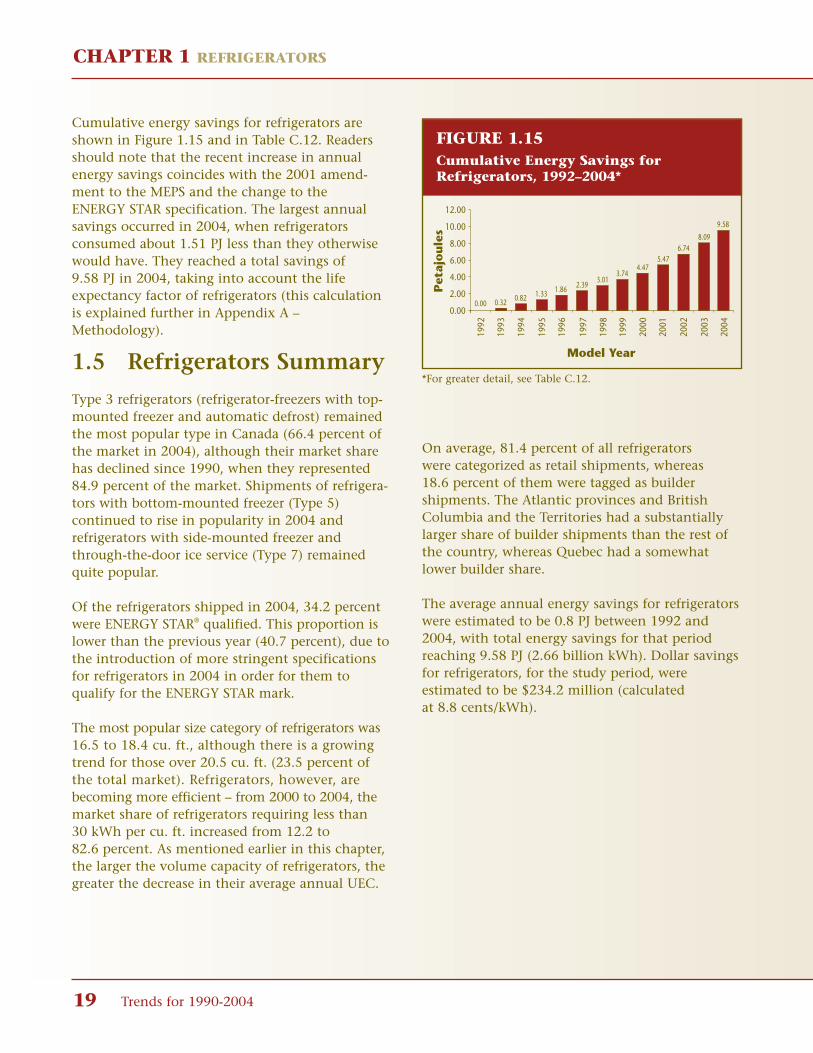
CHAPTER 1 REFRIGERATORS
19 Trends for 1990-2004
Cumulative energy savings for refrigerators areshown in Figure 1.15 and in Table C.12. Readersshould note that the recent increase in annualenergy savings coincides with the 2001 amend-ment to the MEPS and the change to the ENERGY STAR specification. The largest annualsavings occurred in 2004, when refrigerators consumed about 1.51 PJ less than they otherwisewould have. They reached a total savings of 9.58 PJ in 2004, taking into account the lifeexpectancy factor of refrigerators (this calculationis explained further in Appendix A –Methodology).
1.5 Refrigerators Summary
Type 3 refrigerators (refrigerator-freezers with top-mounted freezer and automatic defrost) remainedthe most popular type in Canada (66.4 percent ofthe market in 2004), although their market sharehas declined since 1990, when they represented84.9 percent of the market. Shipments of refrigera-tors with bottom-mounted freezer (Type 5)continued to rise in popularity in 2004 and refrigerators with side-mounted freezer andthrough-the-door ice service (Type 7) remainedquite popular.
Of the refrigerators shipped in 2004, 34.2 percentwere ENERGY STAR® qualified. This proportion islower than the previous year (40.7 percent), due tothe introduction of more stringent specificationsfor refrigerators in 2004 in order for them to qualify for the ENERGY STAR mark.
The most popular size category of refrigerators was16.5 to 18.4 cu. ft., although there is a growingtrend for those over 20.5 cu. ft. (23.5 percent ofthe total market). Refrigerators, however, arebecoming more efficient – from 2000 to 2004, themarket share of refrigerators requiring less than 30 kWh per cu. ft. increased from 12.2 to 82.6 percent. As mentioned earlier in this chapter,the larger the volume capacity of refrigerators, thegreater the decrease in their average annual UEC.
Model Year
1992
1993
1994
1995
1996
1997
1998
1999
2000
2001
2002
2003
2004
Pet
ajo
ule
s
0.00
2.00
4.00
6.00
8.00
10.00
12.00
0.00 0.32 0.82 1.33 1.86 2.393.01
3.744.47
5.476.74
8.09
9.58
Fig 1.15.eps
FIGURE 1.15Cumulative Energy Savings forRefrigerators, 1992–2004*
*For greater detail, see Table C.12.
On average, 81.4 percent of all refrigerators were categorized as retail shipments, whereas 18.6 percent of them were tagged as builder shipments. The Atlantic provinces and BritishColumbia and the Territories had a substantiallylarger share of builder shipments than the rest ofthe country, whereas Quebec had a somewhatlower builder share.
The average annual energy savings for refrigeratorswere estimated to be 0.8 PJ between 1992 and2004, with total energy savings for that periodreaching 9.58 PJ (2.66 billion kWh). Dollar savingsfor refrigerators, for the study period, were estimated to be $234.2 million (calculated at 8.8 cents/kWh).

Energy Consumption of Major Household Appliances Shipped in Canada 20
CHAPTER 2 FREEZERS
2 FREEZERS
Freezers are available in various sizes and styles, allof which affect energy consumption. This is whyEnerGuide groups freezers according to type,enabling you to compare the energy consumptionof similar models. As noted earlier, because ofrestrictions in the market information available,the freezer shipment data are not as comprehen-sive as they are for the other appliances andshould be used with caution.
Upright freezers
Type 8 Upright freezers with manual defrostType 9 Upright freezers with automatic defrost
Chest freezers
Type 10 Chest freezers and all other freezers
Compact freezers
Type 16 Compact upright freezers with manual defrost
Type 17 Compact upright freezers with automatic defrost
Type 18 Compact chest freezers and all other freezers
2.1 2004 Market Snapshot
Type 10 freezers were the most popular in 2004,accounting for 45.5 percent of all freezers shippedin Canada. Their shipment-weighted averageannual unit energy consumption (UEC) was 344 kilowatt hours (kWh).
Freezers were included in the ENERGY STARinitiative in 2003. More detailed data regardingqualified freezers will be included in futureanalyses, as they become more readily available.
The energy efficiency of freezers improved
steadily between 1990 and 2004. In 1990,
almost all freezers required more than
50 kWh per year to freeze each cubic foot
of space. With steady improvements in
energy efficiency, by 2004, 77.7 percent
of all freezers required less than
40 kWh per year to freeze each
cubic foot of space.
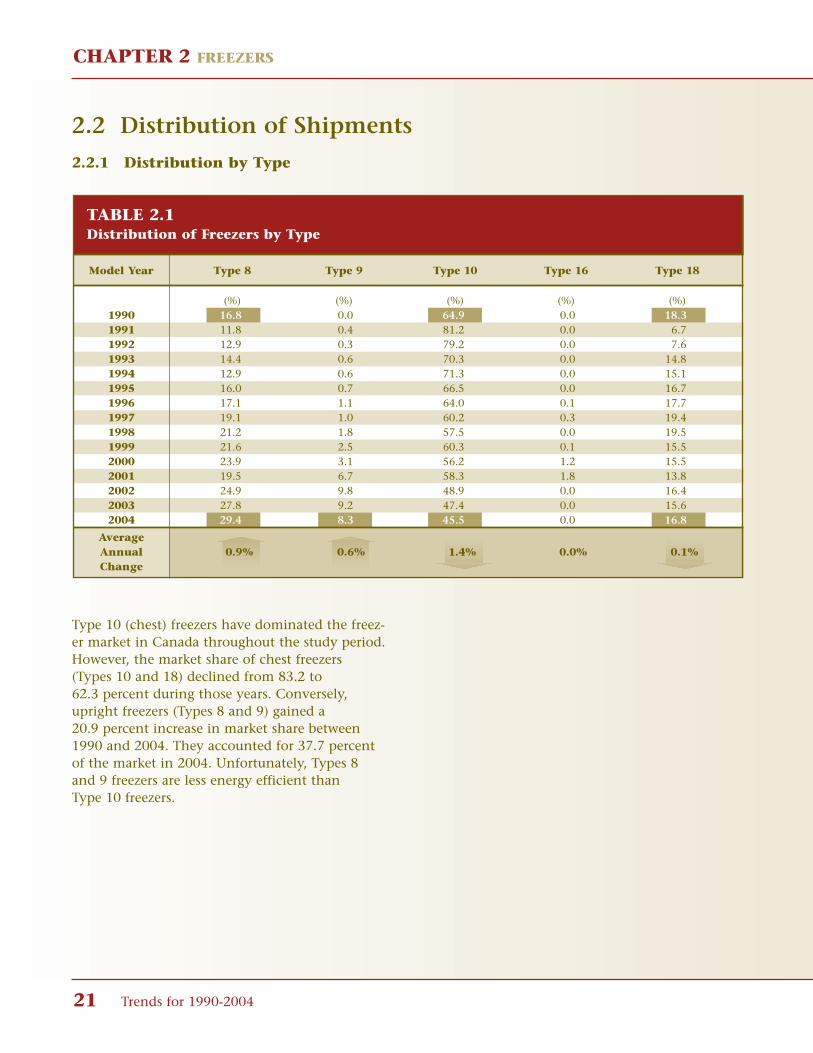
CHAPTER 2 FREEZERS
21 Trends for 1990-2004
Type 10 (chest) freezers have dominated the freez-er market in Canada throughout the study period.However, the market share of chest freezers (Types 10 and 18) declined from 83.2 to 62.3 percent during those years. Conversely,upright freezers (Types 8 and 9) gained a 20.9 percent increase in market share between1990 and 2004. They accounted for 37.7 percent of the market in 2004. Unfortunately, Types 8 and 9 freezers are less energy efficient than Type 10 freezers.
2.2 Distribution of Shipments
2.2.1 Distribution by Type
TABLE 2.1Distribution of Freezers by Type
Model Year Type 8 Type 9 Type 10 Type 16 Type 18
(%) (%) (%) (%) (%)1990 16.8 0.0 64.9 0.0 18.31991 11.8 0.4 81.2 0.0 6.71992 12.9 0.3 79.2 0.0 7.61993 14.4 0.6 70.3 0.0 14.81994 12.9 0.6 71.3 0.0 15.11995 16.0 0.7 66.5 0.0 16.71996 17.1 1.1 64.0 0.1 17.71997 19.1 1.0 60.2 0.3 19.41998 21.2 1.8 57.5 0.0 19.51999 21.6 2.5 60.3 0.1 15.52000 23.9 3.1 56.2 1.2 15.52001 19.5 6.7 58.3 1.8 13.82002 24.9 9.8 48.9 0.0 16.42003 27.8 9.2 47.4 0.0 15.62004 29.4 8.3 45.5 0.0 16.8
AverageAnnual 0.9% 0.6% 1.4% 0.0% 0.1%Change

CHAPTER 2 FREEZERS
Energy Consumption of Major Household Appliances Shipped in Canada 22
2.2.2 Distribution by Type, byRegion/Province
Figure 2.2 shows that, although Type 10 freezerswere the most popular type on average nationally,some regions favoured different types. For exam-ple, Quebec seemed to favour Type 8 (upright withmanual defrost) freezers. A similar trend is foundin Table 5.5 of the 2003 Survey of Household EnergyUse,26 showing that upright freezers were popularin Quebec. Also, the table shows that uprightfreezers are less popular in the Atlantic provinces,as also demonstrated in Figure 2.2.
Type 10 freezers remained the most energy-efficient freezers on the market, followed by Type 8.
Region
Per
cen
tag
e o
f Sh
ipm
ents
Canada Atlantic Quebec Ontario Prairies BritishColumbia
andTerritories
0
20
40
60
80
100
Type 8 Type 9 Type 10 Type 18
Fig 2.2.eps
*For greater detail, see Table C.13.
FIGURE 2.2Distribution of Freezers by Type, byRegion/Province, 2004*
FIGURE 2.1 Distribution of Freezers by Type for 1990 and 2004
1990
Type 90.0%
Type 816.8%
Type 1818.3%
Type 160.0%
Type 1064.9%
Type 829.4%
Type 98.3%
Type 1045.5%
Type 160.0%
Type 1816.8%
1990 2004
26 Natural Resources Canada. 2003 Survey of Household EnergyUse, Detailed Statistical Report, Ottawa, 2005, p. 69.

CHAPTER 2 FREEZERS
23 Trends for 1990-2004
The energy efficiency of freezers improved steadilybetween 1990 and 2004. In 1990, almost all freez-ers required more than 50 kWh per year to freezeeach cubic foot (cu. ft.) of space. With steadyimprovements in energy efficiency, thanks largelyto the 2001 amendment to the minimum energyperformance standards (MEPS), by 2004, 77.7 percent of all freezers required less than 40 kWh per year to freeze each cubic foot of space.
2.2.3 Distribution by Average Annual Unit EnergyConsumption per Cubic Foot
At the beginning of the study period, freezers withan average annual UEC between 70 and 79.9 kWhper cu. ft. per year dominated the market, accountingfor 38.3 percent of the market. By comparison, freezers in 2004 most commonly consumedbetween 30 and 39.9 kWh per cu. ft. annually.
TABLE 2.2Distribution of Freezers by Average Annual Unit Energy Consumption per Cubic Foot
Model Year kWh/cu. ft./yr.20–29.9 30–39.9 40–49.9 50–59.9 60–69.9 70–79.9 >80
(%) (%) (%) (%) (%) (%) (%)1990 0.0 0.0 0.9 32.1 19.3 38.3 9.41991 0.0 28.3 20.3 31.2 4.1 15.9 0.31992 3.1 18.9 58.3 15.0 4.5 0.3 0.01993 16.5 57.0 16.5 8.4 1.6 0.0 0.01994 15.4 39.0 34.9 9.0 1.9 0.0 0.01995 12.7 39.6 41.2 5.4 1.2 0.0 0.01996 12.4 40.4 37.0 10.3 0.0 0.0 0.01997 11.7 36.7 39.0 12.0 0.0 0.6 0.01998 11.0 34.6 43.1 11.3 0.0 0.0 0.01999 10.8 42.3 37.0 9.6 0.0 0.3 0.02000 10.0 37.6 41.3 8.8 0.0 2.3 0.02001 17.5 36.3 38.2 3.9 0.0 4.0 0.02002 26.7 47.5 24.9 0.8 0.0 0.0 0.02003 28.6 47.4 23.2 0.8 0.0 0.0 0.02004 28.9 48.8 22.3 0.1 0.0 0.0 0.0
AverageAnnual 2.1% 3.5% 1.5% 2.3% 1.4% 2.7% 0.7%Change

CHAPTER 2 FREEZERS
Energy Consumption of Major Household Appliances Shipped in Canada 24
2.2.4 Distribution by Average AnnualUnit Energy Consumption per CubicFoot, by Region/Province
Figure 2.4 demonstrates that nationally, in 2004,freezers most commonly consumed between 30 and 39.9 kWh per cu. ft. However, the Atlanticprovinces, the Prairies, and British Columbia andthe Territories seemed to favour freezers consum-ing less than 30 kWh per cu. ft. These regions hada higher percentage of chest freezers (Type 10),which are less energy intensive.
FIGURE 2.3Distribution of Freezers by Average Annual Unit Energy Consumption per Cubic Footfor 1990 and 2004
>809.4%
40–49.90.9%
20–29.90.0% 30–39.9
0.0%50–59.932.1%
60–69.919.3%
70–79.938.3%
40–49.922.3%
20–29.928.9%
30–39.948.8%
70–79.90.0%
60–69.90.0%
50–59.90.1%
>800.0%
1990 (kWh/cu. ft./yr.) 2004 (kWh/cu. ft./yr.)
Per
cen
tag
e o
f Sh
ipm
ents
Canada Atlantic Quebec Ontario Prairies BritishColumbia
andTerritories
0
20
40
60
80
100
Region
20–29.9 kWh/cu. ft./yr. 30–39.9 kWh/cu. ft./yr.
40–49.9 kWh/cu. ft./yr. 50–59.9 kWh/cu. ft./yr.
Fig 2.4.eps
FIGURE 2.4 Distribution of Freezers by AverageAnnual Unit Energy Consumption perCubic Foot, by Region/Province, 2004*
*For greater detail, see Table C.14.

CHAPTER 2 FREEZERS
25 Trends for 1990-2004
2.2.5 Distribution by Channel, byRegion/Province
Figure 2.5 illustrates the proportion of freezersshipped for retail sales versus those shipped for the building trade. It shows that, for Canada as awhole, approximately 98.2 percent of all freezerswere categorized as retail shipments, whereas only1.8 percent were tagged for builder shipments. Thechart also outlines the differences in this propor-tion for the regions/provinces, with the westernones having a somewhat larger builder shipmentrepresentation that the rest of the country (5 percent for the Prairies and 15.5 percent for British Columbia and the Territories).
2.3 Energy Consumption
2.3.1 Average Annual Unit EnergyConsumption by Model Year
Freezers became significantly more energy efficientbetween 1990 and 2004. As Figure 2.6 shows, theaverage annual UEC decreased significantly in 1991and then decreased gradually until 1997. After1997, the average annual UEC held steady. Overall,the average annual UEC decreased by 47.8 percent,or 341 kWh, during the study period.
Region
Per
cen
tag
e o
f Sh
ipm
ents
Canada Atlantic Quebec Ontario Prairies BritishColumbia
andTerritories
0
20
40
60
80
100
Builder Retail
Fig 2.5.eps
FIGURE 2.5 Distribution of Freezers by Channel, byRegion/Province, 2004*
*For greater detail, see Table C.15.
Model Year
1990
1991
1992
1993
1994
1995
1996
1997
1998
1999
2000
2001
2002
2003
2004
kW
h/y
r.
0
100
200
300
400
500
600
700
800
Fig 2.6.eps
FIGURE 2.6 Average Annual Unit EnergyConsumption of Freezers by Model Year*
*For greater detail, see Table C.16.

CHAPTER 2 FREEZERS
Energy Consumption of Major Household Appliances Shipped in Canada 26
2.4 Energy Savings
It is estimated that annual freezer energy consumption was slightly lower between 1993 and 2004 than it would have been without theMEPS, the amendment to the MEPS in 200127
and a general improvement in energy efficiency.
As with refrigerators, the difference between thetwo lines in Figure 2.7 represents the incrementalannual energy savings.
The average annual energy savings for freezerswere estimated to be 0.06 petajoules (PJ) from1993 to 2004. (No savings were expected for 1992.)
The largest annual energy savings occurred in 2004when freezers consumed about 0.08 PJ less than theyotherwise might have. This increase coincides withthe introduction of freezers into the ENERGY STAR®
initiative and the 2001 amendment to the MEPS.
Cumulative energy savings grew steadily between1992 and 2004 to reach 0.68 PJ in 2004. Theseenergy savings are shown in Figure 2.8.
2.5 Freezers Summary
Type 10 freezers (chest freezers) continued to bethe most popular type in 2004 (45.5 percent of themarket), although Types 8 and 9 (upright freezerswith manual and automatic defrost) grew in popu-larity, accounting for 37.7 percent of the market.
The energy efficiency of freezers improved steadilybetween 1990 and 2004 – by 2004, 99.9 percent ofall freezers required less than 50 kWh per year tofreeze each cubic foot of space; whereas in 1990,almost all freezers required more than 50 kWh peryear. The average annual energy savings for freez-ers were estimated to be 0.06 PJ between 1993 and2004, with total energy savings for that periodreaching 0.68 PJ (188.89 million kWh). Dollarsavings for freezers, for the study period, were estimated to be $16.6 million (calculated at 8.8 cents/kWh).
27 The effective date for freezers was July 1, 2001.
Model Year
Pet
ajo
ule
s
0.00
0.10
0.20
0.30
0.40
0.50
Energy Consumed WITHOUT Manufacturers' Improvements, the MEPS and Improvements to the MEPS (PJ)
Energy Consumed WITH Manufacturers' Improvements, the MEPS and Improvements to the MEPS (PJ)
1992
1993
1994
1995
1996
1997
1998
1999
2000
2001
2002
2003
2004
Fig 2.7.epsFIGURE 2.7 Energy Savings for Freezers, 1992–2004*
*For greater detail, see Table C.17.
Model Year
1992
1993
1994
1995
1996
1997
1998
1999
2000
2001
2002
2003
2004
Pet
ajo
ule
s
0.000.04
0.090.14
0.180.23
0.290.35
0.400.45
0.530.60
0.68
0.00
0.10
0.20
0.30
0.40
0.50
0.60
0.70
0.80
Fig 2.8.eps
FIGURE 2.8 Cumulative Energy Savings for Freezers,1992–2004*
*For greater detail, see Table C.17.
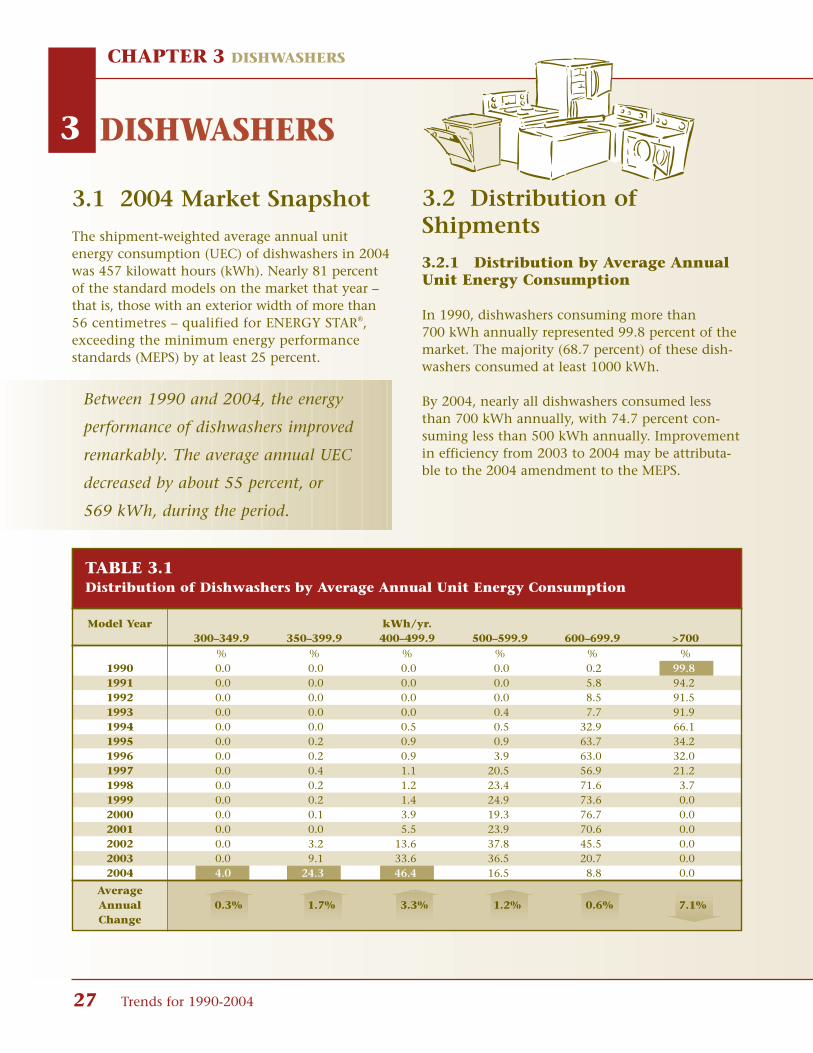
CHAPTER 3 DISHWASHERS
3 DISHWASHERS
27 Trends for 1990-2004
3.1 2004 Market Snapshot
The shipment-weighted average annual unit energy consumption (UEC) of dishwashers in 2004was 457 kilowatt hours (kWh). Nearly 81 percentof the standard models on the market that year –that is, those with an exterior width of more than56 centimetres – qualified for ENERGY STAR®,exceeding the minimum energy performancestandards (MEPS) by at least 25 percent.
3.2 Distribution ofShipments
3.2.1 Distribution by Average AnnualUnit Energy Consumption
In 1990, dishwashers consuming more than 700 kWh annually represented 99.8 percent of themarket. The majority (68.7 percent) of these dish-washers consumed at least 1000 kWh.
By 2004, nearly all dishwashers consumed lessthan 700 kWh annually, with 74.7 percent con-suming less than 500 kWh annually. Improvementin efficiency from 2003 to 2004 may be attributa-ble to the 2004 amendment to the MEPS.
Between 1990 and 2004, the energy
performance of dishwashers improved
remarkably. The average annual UEC
decreased by about 55 percent, or
569 kWh, during the period.
TABLE 3.1Distribution of Dishwashers by Average Annual Unit Energy Consumption
Model Year kWh/yr.300–349.9 350–399.9 400–499.9 500–599.9 600–699.9 >700
% % % % % %1990 0.0 0.0 0.0 0.0 0.2 99.81991 0.0 0.0 0.0 0.0 5.8 94.21992 0.0 0.0 0.0 0.0 8.5 91.51993 0.0 0.0 0.0 0.4 7.7 91.91994 0.0 0.0 0.5 0.5 32.9 66.11995 0.0 0.2 0.9 0.9 63.7 34.21996 0.0 0.2 0.9 3.9 63.0 32.01997 0.0 0.4 1.1 20.5 56.9 21.21998 0.0 0.2 1.2 23.4 71.6 3.71999 0.0 0.2 1.4 24.9 73.6 0.02000 0.0 0.1 3.9 19.3 76.7 0.02001 0.0 0.0 5.5 23.9 70.6 0.02002 0.0 3.2 13.6 37.8 45.5 0.02003 0.0 9.1 33.6 36.5 20.7 0.02004 4.0 24.3 46.4 16.5 8.8 0.0
AverageAnnual 0.3% 1.7% 3.3% 1.2% 0.6% 7.1%Change

CHAPTER 3 DISHWASHERS
Energy Consumption of Major Household Appliances Shipped in Canada 28
In 2004, 74.7 percent of all dishwashers shipped in Canada consumed less than500 kWh. Figure 3.2 shows that althoughthere were minor fluctuations in consumptionfigures throughout the country, there weresimilar tendencies from one region to another.
3.2.2 Distribution by Average Annual Unit EnergyConsumption, by Region/Province
FIGURE 3.1Distribution of Dishwashers by Average Annual Unit Energy Consumption for 1990 and 2004
600–699.90.2%
500–599.90.0%
300–349.90.0%
>70099.8%
400–499.90.0%
350–399.90.0%
400–499.946.4%
350–399.924.3%
300–349.94.0%
500–599.916.5%
600–699.98.8%
>7000.0%
1990 (kWh/yr.) 2004 (kWh/yr.)
Region
Per
cen
tag
e o
f Sh
ipm
ents
Canada Atlantic Quebec Ontario Prairies BritishColumbia
andTerritories
0
20
40
60
80
100
300–349.9 kWh/yr. 350–399.9 kWh/yr.
400–499.9 kWh/yr. 500–599.9 kWh/yr.600–699.9 kWh/yr.
Fig 3.2.eps
FIGURE 3.2 Distribution of Dishwashers by AverageAnnual Unit Energy Consumption, byRegion/Province, 2004*
*For greater detail, see Table C.18.
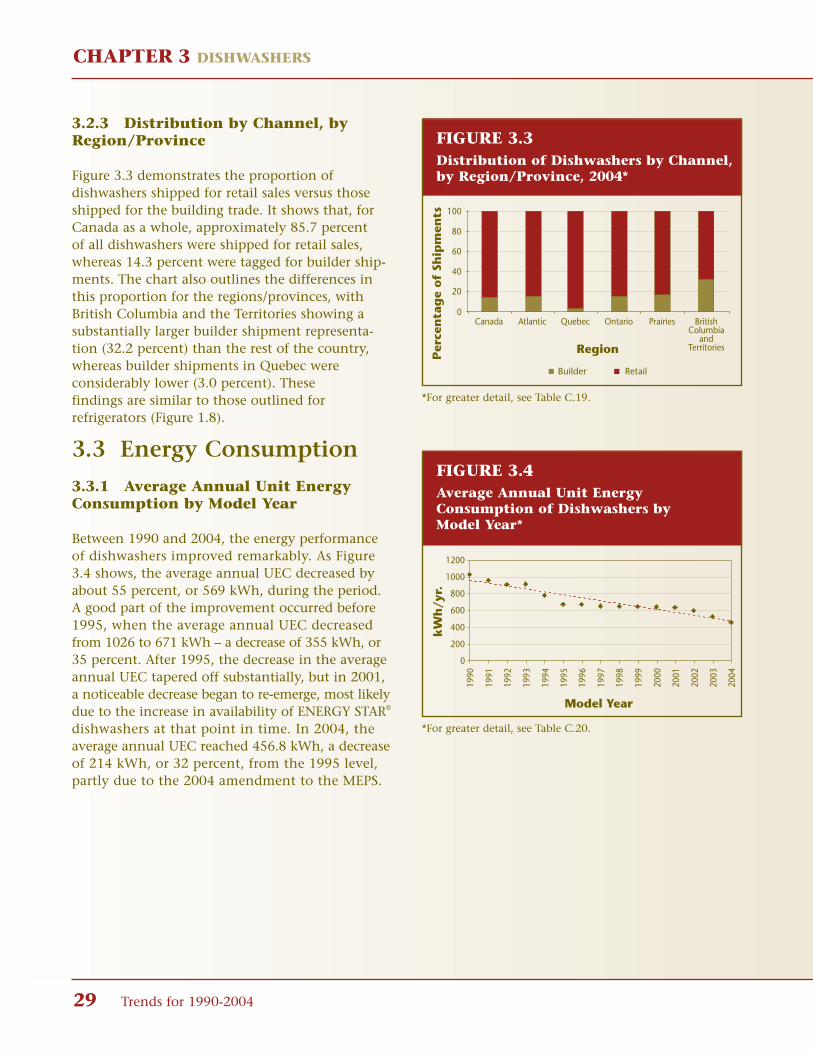
CHAPTER 3 DISHWASHERS
29 Trends for 1990-2004
3.2.3 Distribution by Channel, byRegion/Province
Figure 3.3 demonstrates the proportion of dishwashers shipped for retail sales versus thoseshipped for the building trade. It shows that, forCanada as a whole, approximately 85.7 percent of all dishwashers were shipped for retail sales,whereas 14.3 percent were tagged for builder ship-ments. The chart also outlines the differences inthis proportion for the regions/provinces, withBritish Columbia and the Territories showing asubstantially larger builder shipment representa-tion (32.2 percent) than the rest of the country,whereas builder shipments in Quebec were considerably lower (3.0 percent). These findings are similar to those outlined for refrigerators (Figure 1.8).
3.3 Energy Consumption
3.3.1 Average Annual Unit EnergyConsumption by Model Year
Between 1990 and 2004, the energy performanceof dishwashers improved remarkably. As Figure3.4 shows, the average annual UEC decreased byabout 55 percent, or 569 kWh, during the period.A good part of the improvement occurred before1995, when the average annual UEC decreasedfrom 1026 to 671 kWh – a decrease of 355 kWh, or35 percent. After 1995, the decrease in the averageannual UEC tapered off substantially, but in 2001,a noticeable decrease began to re-emerge, most likelydue to the increase in availability of ENERGY STAR®
dishwashers at that point in time. In 2004, theaverage annual UEC reached 456.8 kWh, a decreaseof 214 kWh, or 32 percent, from the 1995 level,partly due to the 2004 amendment to the MEPS.
RegionPer
cen
tag
e o
f Sh
ipm
ents
Canada Atlantic Quebec Ontario Prairies BritishColumbia
andTerritories
0
20
40
60
80
100
Builder Retail
Fig 3.3.eps
FIGURE 3.3Distribution of Dishwashers by Channel,by Region/Province, 2004*
*For greater detail, see Table C.19.
Model Year
1990
1991
1992
1993
1994
1995
1996
1997
1998
1999
2000
2001
2002
2003
2004
kW
h/y
r.
0
200
400
600
800
1000
1200
Fig 3.4.eps
FIGURE 3.4Average Annual Unit EnergyConsumption of Dishwashers by Model Year*
*For greater detail, see Table C.20.

CHAPTER 3 DISHWASHERS
Energy Consumption of Major Household Appliances Shipped in Canada 30
3.3.2 Average Annual Unit EnergyConsumption by Channel, byRegion/Province, 2004
Figure 3.5 demonstrates the breakdown of theaverage annual UEC of dishwashers by shipmentsfor retail purposes and for the builder trade, byregion/province. It shows that the average annualUEC was higher for those dishwashers tagged forretail sales, especially in British Columbia and theTerritories, where the average annual UEC for retailshipments was 472.6 kWh/yr. compared with434.6 kWh/yr. for builder shipments. The differencemay be due to builders purchasing more energy-efficient models, or to the extra options/featuresincluded with the dishwashers tagged for retail sales.
3.4 Energy Savings
Figure 3.6 shows how much energy dishwashersmight have consumed annually between 1992 and2004 without the factors previously outlined (topline) and how much energy actually was con-sumed by refrigerators during those years (bottom line).
The average annual energy savings for dishwasherswere estimated to be 0.42 petajoules (PJ) from1993 to 2004. (No savings were expected for 1992.)The largest annual energy savings occurred in2004, when dishwashers consumed 0.97 PJ lessthan they otherwise might have. This increase inenergy savings is due, in part, to the 2004 amend-ment to the MEPS.
Region
kW
h/y
r.
Canada Atlantic Quebec Ontario Prairies BritishColumbia
andTerritories
400
420
440
460
480
Builder Retail
Fig 3.5.eps
FIGURE 3.5Average Annual Unit EnergyConsumption of Dishwashers byChannel, by Region/Province, 2004*
*For greater detail, see Table C.21.
Model Year
Pet
ajo
ule
s
0.00
0.40
0.80
1.20
1.60
2.00
2.40
Energy Consumed WITHOUT Manufacturers' Improvements and the MEPS (PJ)
Energy Consumed WITH Manufacturers' Improvements and the MEPS (PJ)
1992
1993
1994
1995
1996
1997
1998
1999
2000
2001
2002
2003
2004
Fig 3.6.eps
FIGURE 3.6Energy Savings for Dishwashers, 1992–2004*
*For greater detail, see Table C.22.
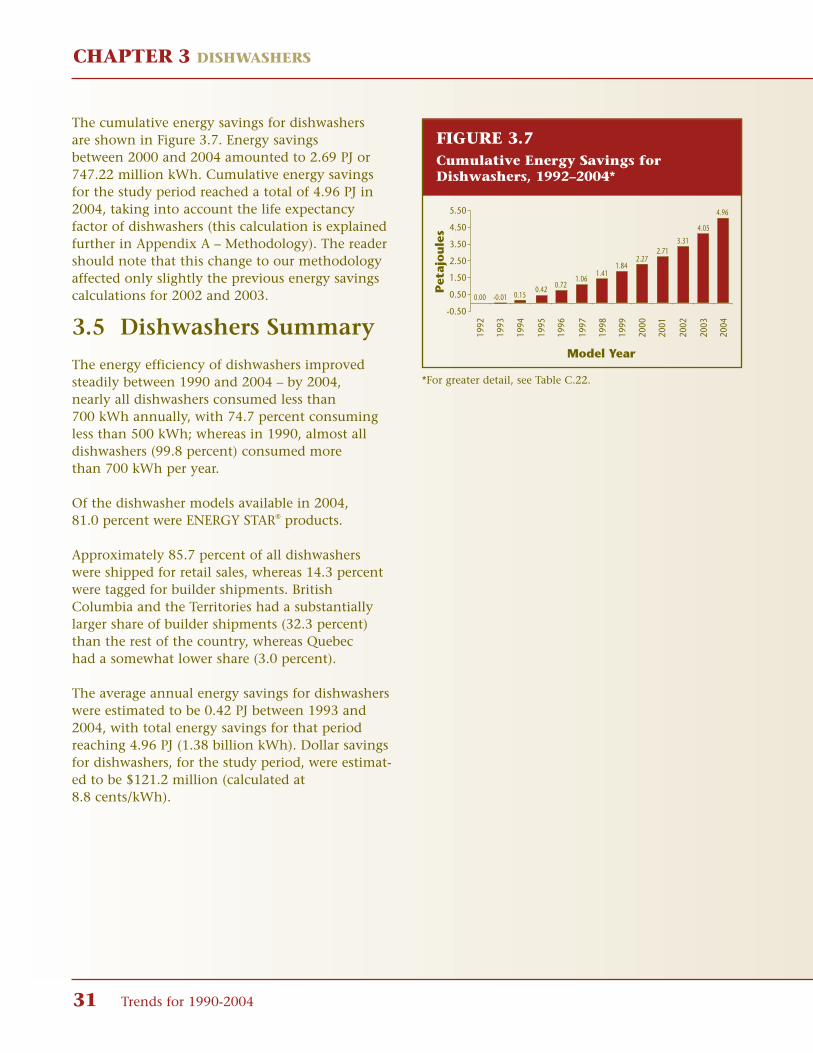
CHAPTER 3 DISHWASHERS
31 Trends for 1990-2004
The cumulative energy savings for dishwashersare shown in Figure 3.7. Energy savings between 2000 and 2004 amounted to 2.69 PJ or 747.22 million kWh. Cumulative energy savingsfor the study period reached a total of 4.96 PJ in2004, taking into account the life expectancy factor of dishwashers (this calculation is explainedfurther in Appendix A – Methodology). The readershould note that this change to our methodologyaffected only slightly the previous energy savingscalculations for 2002 and 2003.
3.5 Dishwashers Summary
The energy efficiency of dishwashers improvedsteadily between 1990 and 2004 – by 2004, nearly all dishwashers consumed less than 700 kWh annually, with 74.7 percent consuming less than 500 kWh; whereas in 1990, almost alldishwashers (99.8 percent) consumed more than 700 kWh per year.
Of the dishwasher models available in 2004, 81.0 percent were ENERGY STAR® products.
Approximately 85.7 percent of all dishwasherswere shipped for retail sales, whereas 14.3 percentwere tagged for builder shipments. BritishColumbia and the Territories had a substantiallylarger share of builder shipments (32.3 percent)than the rest of the country, whereas Quebec had a somewhat lower share (3.0 percent).
The average annual energy savings for dishwasherswere estimated to be 0.42 PJ between 1993 and2004, with total energy savings for that periodreaching 4.96 PJ (1.38 billion kWh). Dollar savingsfor dishwashers, for the study period, were estimat-ed to be $121.2 million (calculated at 8.8 cents/kWh).
Model Year
1992
1993
1994
1995
1996
1997
1998
1999
2000
2001
2002
2003
2004
Pet
ajo
ule
s
-0.50
0.50
1.50
2.50
3.50
4.50
5.50
0.00 -0.01 0.150.42 0.72
1.061.41
1.842.27
2.713.31
4.05
4.96
Fig 3.7.eps
FIGURE 3.7Cumulative Energy Savings forDishwashers, 1992–2004*
*For greater detail, see Table C.22.
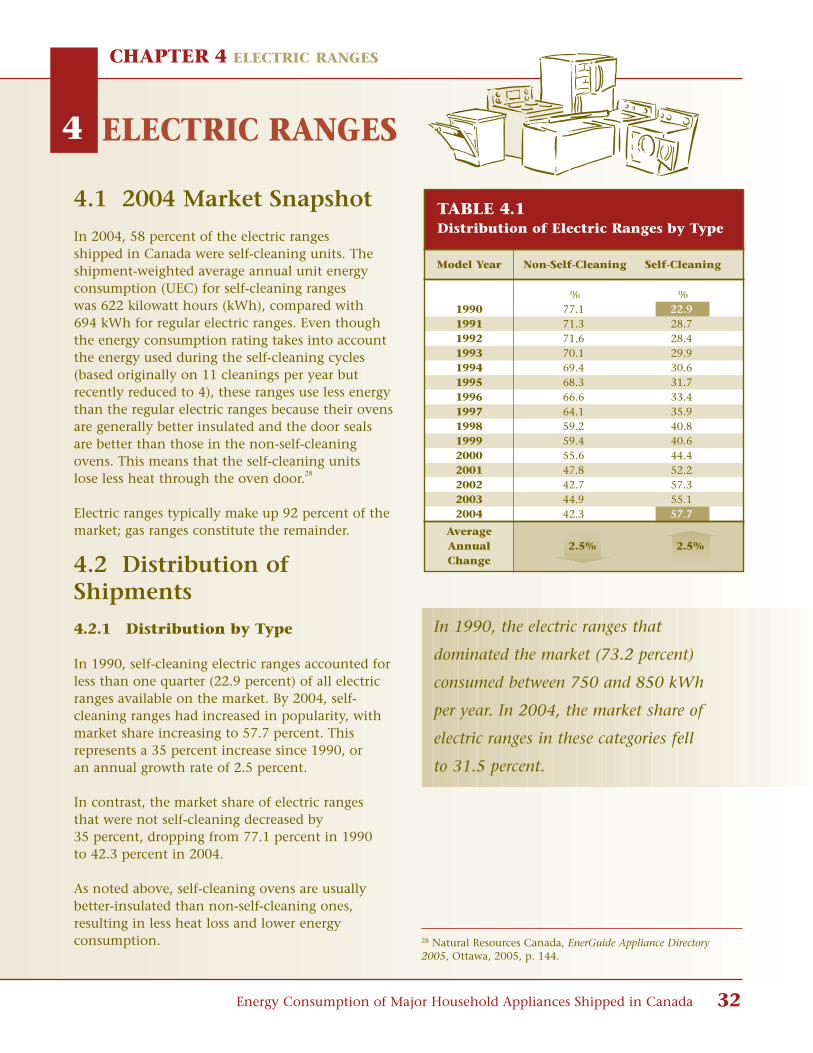
Energy Consumption of Major Household Appliances Shipped in Canada 32
CHAPTER 4 ELECTRIC RANGES
4 ELECTRIC RANGES
4.1 2004 Market Snapshot
In 2004, 58 percent of the electric ranges shipped in Canada were self-cleaning units. Theshipment-weighted average annual unit energyconsumption (UEC) for self-cleaning ranges was 622 kilowatt hours (kWh), compared with 694 kWh for regular electric ranges. Even thoughthe energy consumption rating takes into accountthe energy used during the self-cleaning cycles(based originally on 11 cleanings per year butrecently reduced to 4), these ranges use less energythan the regular electric ranges because their ovensare generally better insulated and the door sealsare better than those in the non-self-cleaningovens. This means that the self-cleaning units lose less heat through the oven door.28
Electric ranges typically make up 92 percent of themarket; gas ranges constitute the remainder.
4.2 Distribution ofShipments
4.2.1 Distribution by Type
In 1990, self-cleaning electric ranges accounted forless than one quarter (22.9 percent) of all electricranges available on the market. By 2004, self-cleaning ranges had increased in popularity, withmarket share increasing to 57.7 percent. This represents a 35 percent increase since 1990, or an annual growth rate of 2.5 percent.
In contrast, the market share of electric ranges that were not self-cleaning decreased by 35 percent, dropping from 77.1 percent in 1990 to 42.3 percent in 2004.
As noted above, self-cleaning ovens are usuallybetter-insulated than non-self-cleaning ones,resulting in less heat loss and lower energy consumption. 28 Natural Resources Canada, EnerGuide Appliance Directory
2005, Ottawa, 2005, p. 144.
TABLE 4.1Distribution of Electric Ranges by Type
Model Year Non-Self-Cleaning Self-Cleaning
% %1990 77.1 22.91991 71.3 28.71992 71.6 28.41993 70.1 29.91994 69.4 30.61995 68.3 31.71996 66.6 33.41997 64.1 35.91998 59.2 40.81999 59.4 40.62000 55.6 44.42001 47.8 52.22002 42.7 57.32003 44.9 55.12004 42.3 57.7
AverageAnnual 2.5% 2.5%Change
In 1990, the electric ranges that
dominated the market (73.2 percent)
consumed between 750 and 850 kWh
per year. In 2004, the market share of
electric ranges in these categories fell
to 31.5 percent.

CHAPTER 4 ELECTRIC RANGES
33 Trends for 1990-2004
4.2.2 Distribution by Type, byRegion/Province
As previously mentioned, self-cleaning ranges have substantially increased their market shareduring the study period, with the national average in 2004 being at 57.7 percent. Figure 4.2demonstrates the proportion of self-cleaning ver-sus non-self-cleaning throughout the country. TheAtlantic provinces had fewer shipments of self-cleaning electric ranges (46.3 percent) comparedwith the rest of the country.
FIGURE 4.1 Distribution of Electric Ranges by Type for 1990 and 2004
Non-Self-Cleaning77.1%
Self-Cleaning22.9%
Non-Self-Cleaning42.3%
Self-Cleaning57.7%
1990 2004
RegionPer
cen
tag
e o
f Sh
ipm
ents
Canada Atlantic Quebec Ontario Prairies BritishColumbia
andTerritories
0
20
40
60
80
100
Self-Cleaning Non-Self-Cleaning
Fig 4.2.eps
FIGURE 4.2Distribution of Electric Ranges by Type,by Region/Province, 2004*
*For greater detail, see Table C.23.

CHAPTER 4 ELECTRIC RANGES
Energy Consumption of Major Household Appliances Shipped in Canada 34
4.2.3 Distribution by Average Annual Unit EnergyConsumption
In 1990, the electric ranges that dominated the market (73.2 percent) consumed between 750 and 850 kWh per year. In 2004, the market share of electric ranges in these categories fell to 31.5 percent. By 2003, there was also a consider-able increase in market share of electric ranges that consumed less than 600 kWh, reaching 41.1 percent in 2004. This is most likely due to a new testing method and energy consumption standard introduced in October 2003.29
29 Natural Resources Canada. EnerGuide Appliance Directory,2005, Ottawa, 2005, p. 144.
TABLE 4.2Distribution of Electric Ranges by Average Annual Unit Energy Consumption
Model Year kWh/yr.<500 500–599.9 600–649.9 650–699.9 700–749.9 750–799.9 800–849.9 >850
% % % % % % % %1990 3.8 0.0 0.0 0.5 13.8 30.8 42.4 8.71991 0.0 0.0 0.0 0.8 15.9 27.6 54.0 1.81992 0.0 0.0 0.0 0.0 15.0 58.1 26.5 0.31993 0.0 0.0 0.0 0.1 18.4 42.8 38.5 0.21994 0.0 0.0 0.1 1.7 32.2 28.5 37.4 0.11995 0.0 0.0 0.1 3.3 35.0 22.5 39.2 0.01996 0.0 0.0 0.0 3.2 27.6 26.4 42.8 0.01997 0.0 0.0 0.0 3.6 27.6 29.0 39.8 0.01998 0.0 0.0 0.0 8.6 23.3 30.6 37.4 0.01999 0.0 0.0 0.0 15.3 28.2 31.6 24.9 0.02000 0.0 0.0 0.0 14.3 30.9 29.5 25.3 0.02001 0.0 0.0 0.0 15.0 27.3 29.2 28.5 0.02002 0.0 0.0 0.0 15.9 30.4 33.5 20.2 0.02003 12.5 5.4 0.4 7.9 30.0 27.3 16.5 0.02004 27.8 13.3 4.8 3.8 18.8 19.5 12.0 0.0
AverageAnnual 1.7% 0.9% 0.3% 0.2% 0.4% 0.8% 2.2% 0.6%Change

CHAPTER 4 ELECTRIC RANGES
35 Trends for 1990-2004
4.2.4 Distribution by Average AnnualUnit Energy Consumption, byRegion/Province
In 2004, 41.1 percent of all electric ranges shippedin Canada consumed less than 600 kWh/yr. Figure 4.4 shows that the percentage of these ship-ments was slightly higher in Quebec (45.9 percent)and the Prairies (47.0 percent). The Atlanticprovinces (61.4 percent) and British Columbia andthe Territories (63.8 percent) seemed to favour more energy-intensive ranges (those consumingmore than 700 kWh/yr.).
FIGURE 4.3Distribution of Electric Ranges by Average Annual Unit Energy Consumption for 1990 and 2004
750–79930.8%
800–84942.4%
>8508.7%
700–74913.8%
650–6990.5%
500–5990.0%
<5003.8%
600–6490.0%
500–59913.3%
600–6494.8%
<50027.8%
>8500.0%
800–84912.0%
750–79919.5%
650–6993.8%
700–74918.8%
1990 (kWh/yr.) 2004 (kWh/yr.)
Region
Per
cen
tag
e o
f Sh
ipm
ents
Canada Atlantic Quebec Ontario Prairies BritishColumbia
andTerritories
0
20
40
60
80
100
<500 kWh/yr. 500–599.9 kWh/yr. 600–649.9 kWh/yr.
650–699.9 kWh/yr.
800–849.9 kWh/yr.
700–749.9 kWh/yr. 750–799.9 kWh/yr.
Fig 4.4.eps
FIGURE 4.4 Distribution of Electric Ranges byAverage Annual Unit EnergyConsumption, by Region/Province, 2004*
*For greater detail, see Table C.24.

CHAPTER 4 ELECTRIC RANGES
Energy Consumption of Major Household Appliances Shipped in Canada 36
4.2.5 Distribution by Channel, byRegion/Province
Figure 4.5 illustrates the proportion of electricranges shipped for retail sales versus those shippedfor the building trade. It shows that, for Canada asa whole, approximately 78.5 percent of all electricranges were categorized as retail shipments, where-as 21.5 percent were tagged for builder shipments.The chart also outlines the differences in this proportion for the regions/provinces, with, onceagain, British Columbia and the Territories havinga larger builder shipment representation andQuebec having a smaller builder shipment representation than the rest of the country. As evidenced with the previous appliances, morebuilders in British Columbia and the Territoriesprovided the appliances for their home buyerscompared to builders in the rest of the country.Our data also show that, on average, 37 percent ofbuilder shipments were self-cleaning ranges, whichare more energy efficient than regular ranges,although in British Columbia and the Territories,this proportion was 48 percent.
4.3 Energy Consumption
4.3.1 Average Annual Unit EnergyConsumption by Model Year
Between 1990 and 2002, the energy consumptionof electric ranges remained relatively unchanged.The decrease in average annual UEC, as illustratedin Figure 4.6, was about 1 percent, or 9 kWh.However, in 2003 and 2004, the average annualUEC decreased substantially, due to a 2003amendment to the minimum energy performancestandards (MEPS), which is attributable to a newreference standard for electric ranges having beenput into place in 2003. This resulted in the reduc-tion of the annual energy consumption for allmodels. This decrease may not reflect anyimprovement in energy efficiency of those models.
RegionPer
cen
tag
e o
f Sh
ipm
ents
Canada Atlantic Quebec Ontario Prairies BritishColumbia
andTerritories
0
20
40
60
80
100
Builder Retail
Fig 4.5.eps
FIGURE 4.5Distribution of Electric Ranges byChannel, by Region/Province, 2004*
*For greater detail, see Table C.25.
Model Year
1990
1991
1992
1993
1994
1995
1996
1997
1998
1999
2000
2001
2002
2003
2004
kW
h/y
r.
550
600
650
700
750
800
850
900
950
1000
Fig 4.6.eps
FIGURE 4.6 Average Annual Unit EnergyConsumption of Electric Ranges byModel Year*
*For greater detail, see Table C.26.
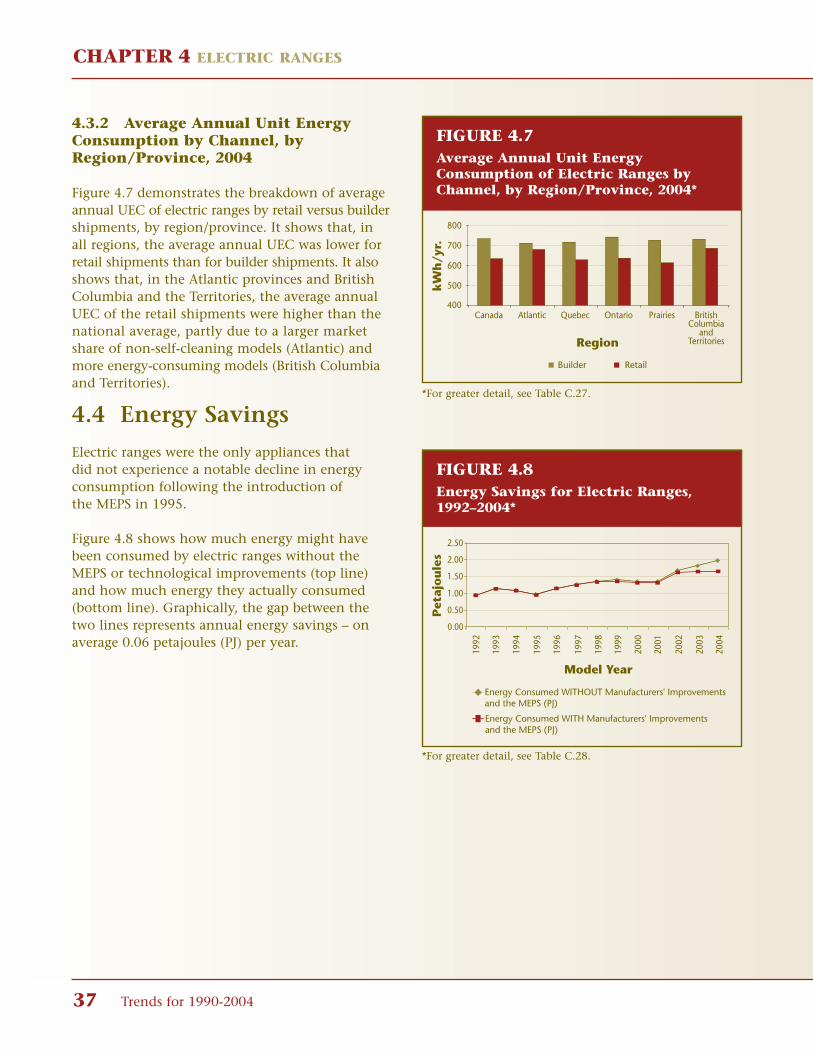
CHAPTER 4 ELECTRIC RANGES
37 Trends for 1990-2004
4.3.2 Average Annual Unit EnergyConsumption by Channel, byRegion/Province, 2004
Figure 4.7 demonstrates the breakdown of averageannual UEC of electric ranges by retail versus buildershipments, by region/province. It shows that, inall regions, the average annual UEC was lower forretail shipments than for builder shipments. It alsoshows that, in the Atlantic provinces and BritishColumbia and the Territories, the average annualUEC of the retail shipments were higher than thenational average, partly due to a larger marketshare of non-self-cleaning models (Atlantic) andmore energy-consuming models (British Columbiaand Territories).
4.4 Energy Savings
Electric ranges were the only appliances that did not experience a notable decline in energyconsumption following the introduction of the MEPS in 1995.
Figure 4.8 shows how much energy might havebeen consumed by electric ranges without theMEPS or technological improvements (top line)and how much energy they actually consumed(bottom line). Graphically, the gap between thetwo lines represents annual energy savings – onaverage 0.06 petajoules (PJ) per year.
Region
kW
h/y
r.
Canada Atlantic Quebec Ontario Prairies BritishColumbia
andTerritories
400
500
600
700
800
Builder Retail
Fig 4.7.eps
FIGURE 4.7Average Annual Unit EnergyConsumption of Electric Ranges byChannel, by Region/Province, 2004*
*For greater detail, see Table C.27.
Model Year
Pet
ajo
ule
s
0.00
0.50
1.00
1.50
2.00
2.50
Energy Consumed WITHOUT Manufacturers' Improvements and the MEPS (PJ)
Energy Consumed WITH Manufacturers' Improvements and the MEPS (PJ)
1992
1993
1994
1995
1996
1997
1998
1999
2000
2001
2002
2003
2004
Fig 4.8.epsFIGURE 4.8Energy Savings for Electric Ranges,1992–2004*
*For greater detail, see Table C.28.
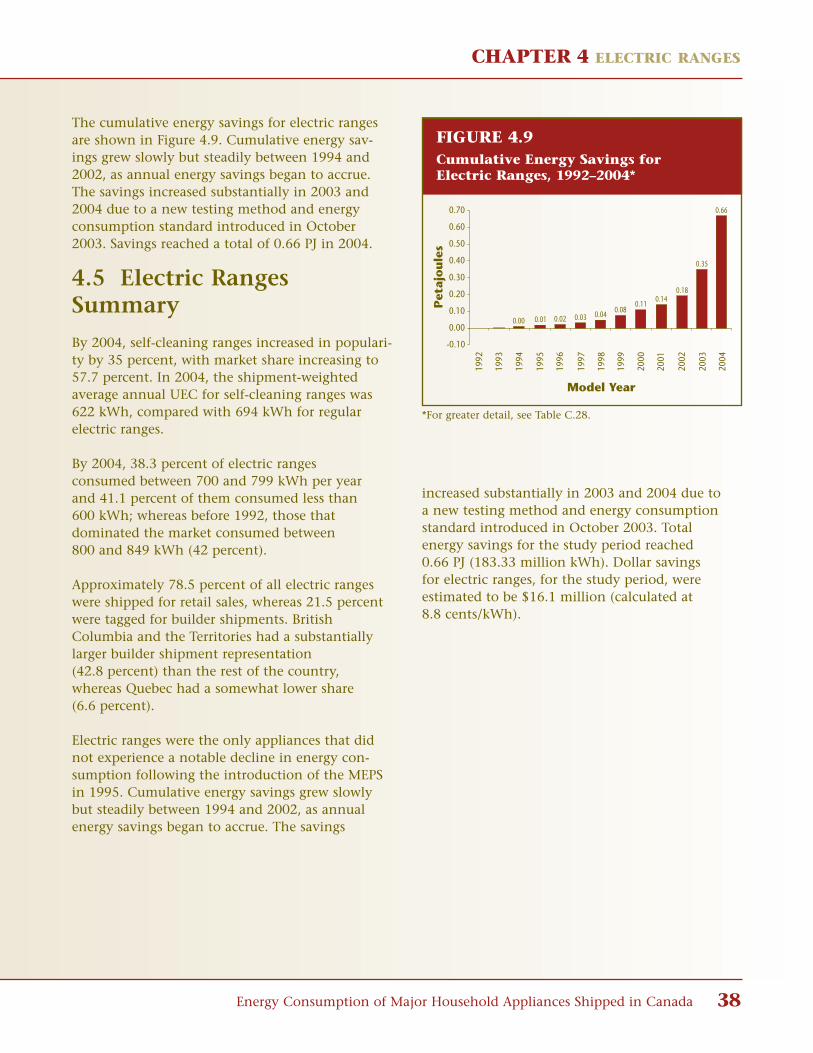
CHAPTER 4 ELECTRIC RANGES
Energy Consumption of Major Household Appliances Shipped in Canada 38
The cumulative energy savings for electric rangesare shown in Figure 4.9. Cumulative energy sav-ings grew slowly but steadily between 1994 and2002, as annual energy savings began to accrue.The savings increased substantially in 2003 and2004 due to a new testing method and energy consumption standard introduced in October2003. Savings reached a total of 0.66 PJ in 2004.
4.5 Electric RangesSummary
By 2004, self-cleaning ranges increased in populari-ty by 35 percent, with market share increasing to57.7 percent. In 2004, the shipment-weightedaverage annual UEC for self-cleaning ranges was622 kWh, compared with 694 kWh for regularelectric ranges.
By 2004, 38.3 percent of electric ranges consumed between 700 and 799 kWh per year and 41.1 percent of them consumed less than 600 kWh; whereas before 1992, those that dominated the market consumed between 800 and 849 kWh (42 percent).
Approximately 78.5 percent of all electric rangeswere shipped for retail sales, whereas 21.5 percentwere tagged for builder shipments. BritishColumbia and the Territories had a substantiallylarger builder shipment representation (42.8 percent) than the rest of the country, whereas Quebec had a somewhat lower share (6.6 percent).
Electric ranges were the only appliances that didnot experience a notable decline in energy con-sumption following the introduction of the MEPSin 1995. Cumulative energy savings grew slowlybut steadily between 1994 and 2002, as annualenergy savings began to accrue. The savings
Model Year
1992
1993
1994
1995
1996
1997
1998
1999
2000
2001
2002
2003
2004
Pet
ajo
ule
s
0.00 0.01 0.02 0.03 0.04 0.080.11
0.140.18
0.35
0.66
-0.10
0.00
0.10
0.20
0.30
0.40
0.50
0.60
0.70
Fig 4.9.eps
FIGURE 4.9Cumulative Energy Savings forElectric Ranges, 1992–2004*
*For greater detail, see Table C.28.
increased substantially in 2003 and 2004 due toa new testing method and energy consumption standard introduced in October 2003. Total energy savings for the study period reached 0.66 PJ (183.33 million kWh). Dollar savings for electric ranges, for the study period, were estimated to be $16.1 million (calculated at 8.8 cents/kWh).

CHAPTER 5 CLOTHES WASHERS
5 CLOTHES WASHERS
39 Trends for 1990-2004
5.1 2004 Market Snapshot
In 2004, 29 percent of the clothes washers shippedin Canada were front-loading units. The shipment-weighted average annual unit energy consumption(UEC) of front-loading clothes washers was 258 kilowatt hours (kWh), compared with 702 kWh for top-loading ones.
As noted earlier, the ENERGY STAR® level for stan-dard clothes washes increased in stringency in2004. Over 36 percent of the standard models onthe market that year qualified for ENERGY STAR,exceeding the minimum energy performancestandards (MEPS) by at least 36 percent and havinga modified energy factor (MEF) of at least 40.21L/kWh/cycle.30
5.2 Distribution ofShipments
5.2.1 Distribution by Type
Although front-loading washers have been in usefor many years – most often in commercial laun-dries, appliance manufacturers have more recentlydeveloped new models of front-loading washers,which are designed for domestic use. Overall,front-loading clothes washers are more energy efficient, using about 40 percent less water per load and 50 percent less energy than top-loading washers.31
Table 5.1 demonstrates the increase in popularity offront-loading models versus traditional top-loadingones since 2001 (the first year that shipment datafor front-loading clothes washers were available),with market share increasing to 29.2 percent in2004. This represents a 13.5 percent increase since2001, or an annual growth rate of 4.5 percent.
30 Natural Resources Canada. EnerGuide Appliance Directory2005, Ottawa, 2005, p. 192.31 Ibid.
TABLE 5.1Distribution of Clothes Washers by Type
Model Year Front-Loading Top-LoadingClothes Washers Clothes Washers
% %2001 15.7 84.32002 16.8 83.22003 21.5 78.52004 29.2 70.8
AverageAnnual 4.5% 4.5%Change
In 1990, 98.2 percent of the clothes wash-
ers shipped used more than
800 kWh per year. By 2004, 64.8 percent of
all clothes washers consumed less than
700 kWh. This significant improvement
is partly due to the 2004 amendment to
the MEPS (announced in 2003), and the
increase in popularity of front-loading
models.
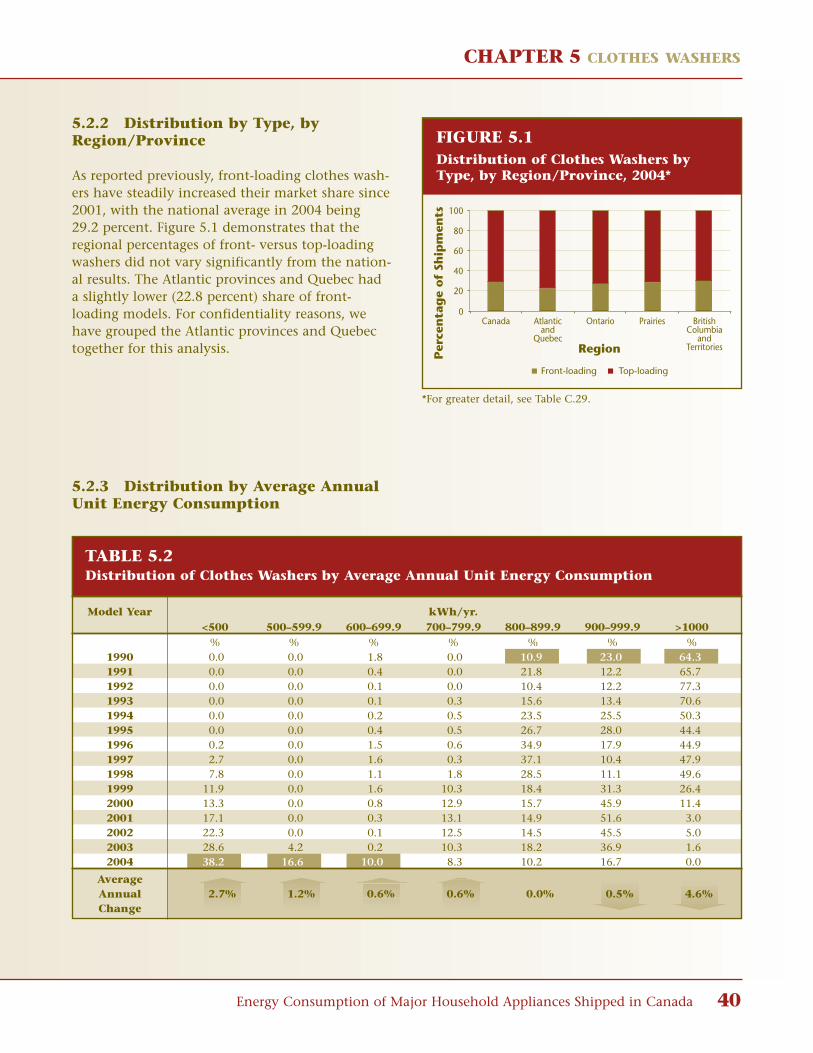
CHAPTER 5 CLOTHES WASHERS
Energy Consumption of Major Household Appliances Shipped in Canada 40
5.2.2 Distribution by Type, byRegion/Province
As reported previously, front-loading clothes wash-ers have steadily increased their market share since2001, with the national average in 2004 being 29.2 percent. Figure 5.1 demonstrates that theregional percentages of front- versus top-loadingwashers did not vary significantly from the nation-al results. The Atlantic provinces and Quebec hada slightly lower (22.8 percent) share of front-loading models. For confidentiality reasons, wehave grouped the Atlantic provinces and Quebectogether for this analysis.
5.2.3 Distribution by Average AnnualUnit Energy Consumption
RegionPer
cen
tag
e o
f Sh
ipm
ents
Canada Atlanticand
Quebec
Ontario Prairies BritishColumbia
andTerritories
0
20
40
60
80
100
Front-loading Top-loading
Fig 5.1.eps
FIGURE 5.1Distribution of Clothes Washers byType, by Region/Province, 2004*
*For greater detail, see Table C.29.
TABLE 5.2Distribution of Clothes Washers by Average Annual Unit Energy Consumption
Model Year kWh/yr.<500 500–599.9 600–699.9 700–799.9 800–899.9 900–999.9 >1000
% % % % % % %1990 0.0 0.0 1.8 0.0 10.9 23.0 64.31991 0.0 0.0 0.4 0.0 21.8 12.2 65.71992 0.0 0.0 0.1 0.0 10.4 12.2 77.31993 0.0 0.0 0.1 0.3 15.6 13.4 70.61994 0.0 0.0 0.2 0.5 23.5 25.5 50.31995 0.0 0.0 0.4 0.5 26.7 28.0 44.41996 0.2 0.0 1.5 0.6 34.9 17.9 44.91997 2.7 0.0 1.6 0.3 37.1 10.4 47.91998 7.8 0.0 1.1 1.8 28.5 11.1 49.61999 11.9 0.0 1.6 10.3 18.4 31.3 26.42000 13.3 0.0 0.8 12.9 15.7 45.9 11.42001 17.1 0.0 0.3 13.1 14.9 51.6 3.02002 22.3 0.0 0.1 12.5 14.5 45.5 5.02003 28.6 4.2 0.2 10.3 18.2 36.9 1.62004 38.2 16.6 10.0 8.3 10.2 16.7 0.0
AverageAnnual 2.7% 1.2% 0.6% 0.6% 0.0% 0.5% 4.6%Change

CHAPTER 5 CLOTHES WASHERS
41 Trends for 1990-2004
As shown in Table 5.2, the energy consumption ofclothes washers improved significantly during thestudy period. In 1990, 98.2 percent of the clotheswashers shipped used more than 800 kWh peryear. By 2004, 64.8 percent of all clothes washersconsumed less than 700 kWh (compared to 33.0 percent in 2003). This significant improve-ment is partly due to the 2004 amendment to theMEPS (announced in 2003), and the increase inpopularity of front-loading models.
5.2.4 Distribution by Average AnnualUnit Energy Consumption, byRegion/Province
In 2004, 64.8 percent of all clothes washersshipped in Canada consumed less than 700 kWh.Figure 5.3 shows the distribution tendenciesthroughout the regions/provinces. Ontario and the Prairies had the lowest market share of clotheswashers consuming more than 900 kWh/yr. TheAtlantic provinces and Quebec had the lowestmarket share of those consuming less than 500 kWh/yr. However, based on findings in theSHEU-03,32 the Atlantic region and Quebec had thehighest percentage of households with a clotheswasher that washed and rinsed with cold water,
FIGURE 5.2 Distribution of Clothes Washers by Average Annual Unit Energy Consumption for 1990 and 2004
>100064.3%
700–799.90.0%
800–899.910.9%
900–999.923.0%
600–699.91.8%500–599.9
0.0%<5000.0%
<50038.2%
>10000.0%
900–999.916.7%
800–899.910.2%
700–799.98.3%
600–699.910.0%
500–599.916.6%
1990 (kWh/yr.) 2004 (kWh/yr.)
Per
cen
tag
e o
f Sh
ipm
ents
Canada Atlanticand
Quebec
Ontario Prairies BritishColumbia
andTerritories
0
20
40
60
80
100
Region
<500 kWh/yr. 500–599.9 kWh/yr. 600–699.9 kWh/yr.
700–799.9 kWh/yr. 800–899.9 kWh/yr. 900–999.9 kWh/yr.
Fig 5.3.eps
FIGURE 5.3 Distribution of Clothes Washers byAverage Annual Unit EnergyConsumption, by Region/Province, 2004*
*For greater detail, see Table C.30.
at 86 and 84 percent, respectively. Even though these regions had relatively less energy-efficientclothes washers, they seemed to have more energy-efficient clothes washing habits than other regions.
32 Natural Resources Canada. 2003 Survey of Household EnergyUse, Summary Report, Chart 43, Ottawa, 2006, p. 23.
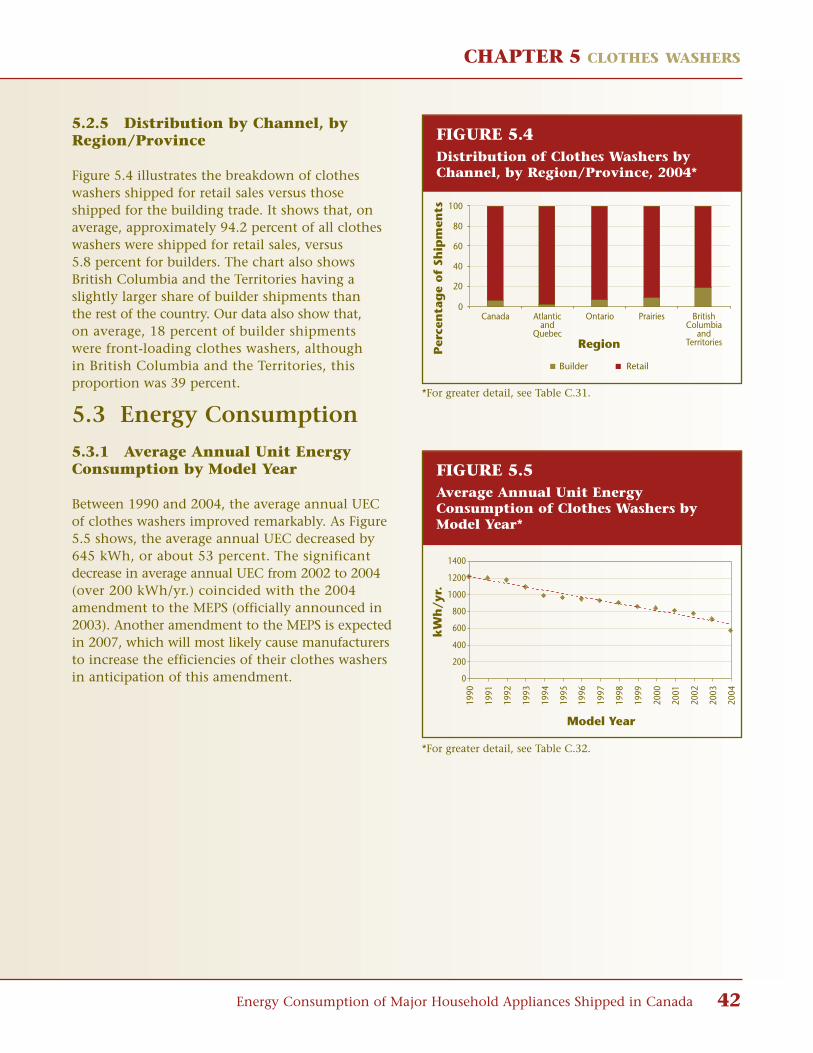
CHAPTER 5 CLOTHES WASHERS
Energy Consumption of Major Household Appliances Shipped in Canada 42
5.2.5 Distribution by Channel, byRegion/Province
Figure 5.4 illustrates the breakdown of clotheswashers shipped for retail sales versus thoseshipped for the building trade. It shows that, onaverage, approximately 94.2 percent of all clotheswashers were shipped for retail sales, versus 5.8 percent for builders. The chart also showsBritish Columbia and the Territories having aslightly larger share of builder shipments thanthe rest of the country. Our data also show that, on average, 18 percent of builder shipmentswere front-loading clothes washers, althoughin British Columbia and the Territories, thisproportion was 39 percent.
5.3 Energy Consumption
5.3.1 Average Annual Unit EnergyConsumption by Model Year
Between 1990 and 2004, the average annual UECof clothes washers improved remarkably. As Figure5.5 shows, the average annual UEC decreased by645 kWh, or about 53 percent. The significantdecrease in average annual UEC from 2002 to 2004(over 200 kWh/yr.) coincided with the 2004amendment to the MEPS (officially announced in2003). Another amendment to the MEPS is expectedin 2007, which will most likely cause manufacturersto increase the efficiencies of their clothes washersin anticipation of this amendment.
Per
cen
tag
e o
f Sh
ipm
ents
Canada Atlanticand
Quebec
Ontario Prairies BritishColumbia
andTerritories
0
20
40
60
80
100
Region
Builder Retail
Fig 5.4.eps
FIGURE 5.4Distribution of Clothes Washers byChannel, by Region/Province, 2004*
*For greater detail, see Table C.31.
Model Year
1990
1991
1992
1993
1994
1995
1996
1997
1998
1999
2000
2001
2002
2003
2004
kW
h/y
r.
0
200
400
600
800
1000
1200
1400
Fig 5.5.eps
FIGURE 5.5Average Annual Unit EnergyConsumption of Clothes Washers byModel Year*
*For greater detail, see Table C.32.
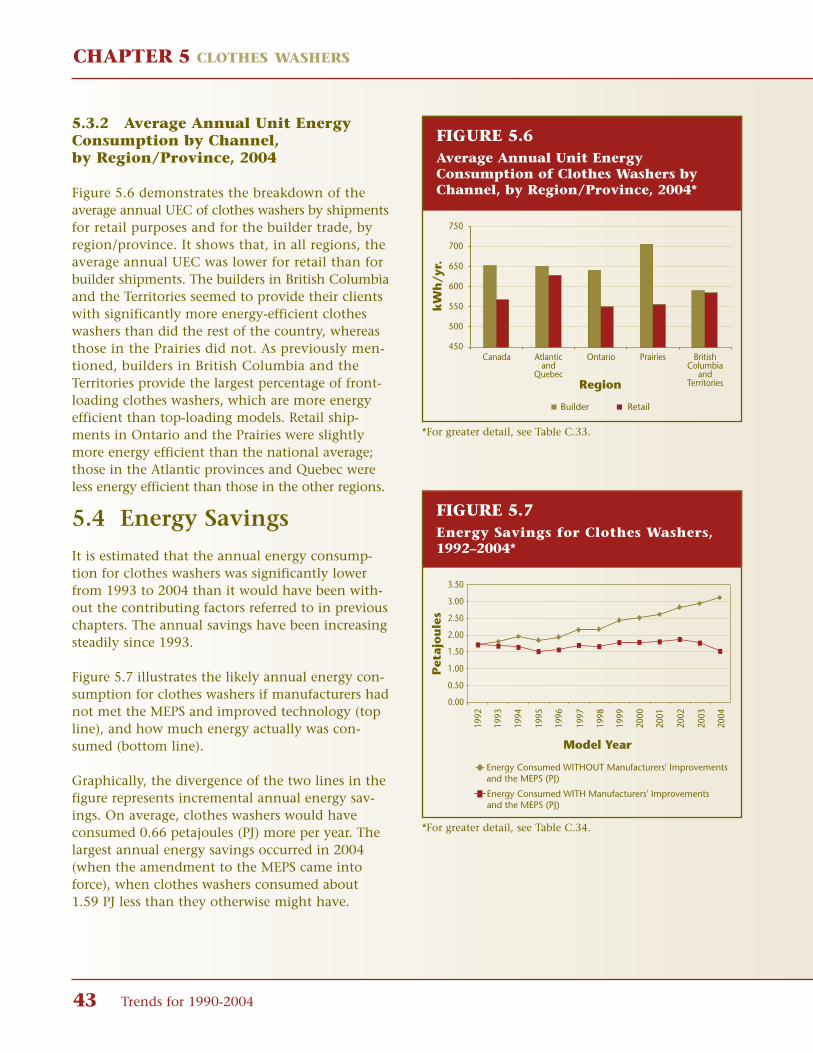
CHAPTER 5 CLOTHES WASHERS
43 Trends for 1990-2004
5.3.2 Average Annual Unit EnergyConsumption by Channel, by Region/Province, 2004
Figure 5.6 demonstrates the breakdown of theaverage annual UEC of clothes washers by shipmentsfor retail purposes and for the builder trade, byregion/province. It shows that, in all regions, theaverage annual UEC was lower for retail than forbuilder shipments. The builders in British Columbiaand the Territories seemed to provide their clientswith significantly more energy-efficient clotheswashers than did the rest of the country, whereasthose in the Prairies did not. As previously men-tioned, builders in British Columbia and theTerritories provide the largest percentage of front-loading clothes washers, which are more energyefficient than top-loading models. Retail ship-ments in Ontario and the Prairies were slightlymore energy efficient than the national average;those in the Atlantic provinces and Quebec wereless energy efficient than those in the other regions.
5.4 Energy Savings
It is estimated that the annual energy consump-tion for clothes washers was significantly lowerfrom 1993 to 2004 than it would have been with-out the contributing factors referred to in previouschapters. The annual savings have been increasingsteadily since 1993.
Figure 5.7 illustrates the likely annual energy con-sumption for clothes washers if manufacturers hadnot met the MEPS and improved technology (topline), and how much energy actually was con-sumed (bottom line).
Graphically, the divergence of the two lines in thefigure represents incremental annual energy sav-ings. On average, clothes washers would haveconsumed 0.66 petajoules (PJ) more per year. Thelargest annual energy savings occurred in 2004(when the amendment to the MEPS came intoforce), when clothes washers consumed about 1.59 PJ less than they otherwise might have.
450
500
550
600
650
700
750
kW
h/y
r.
Canada Atlanticand
Quebec
Ontario Prairies BritishColumbia
andTerritoriesRegion
Builder Retail
Fig 5.6.eps
FIGURE 5.6Average Annual Unit EnergyConsumption of Clothes Washers byChannel, by Region/Province, 2004*
*For greater detail, see Table C.33.
Model Year
Pet
ajo
ule
s
0.00
0.50
1.00
1.50
2.00
2.50
3.00
3.50
Energy Consumed WITHOUT Manufacturers' Improvements and the MEPS (PJ)
Energy Consumed WITH Manufacturers' Improvements and the MEPS (PJ)
1992
1993
1994
1995
1996
1997
1998
1999
2000
2001
2002
2003
2004
Fig 5.7.eps
FIGURE 5.7Energy Savings for Clothes Washers,1992–2004*
*For greater detail, see Table C.34.
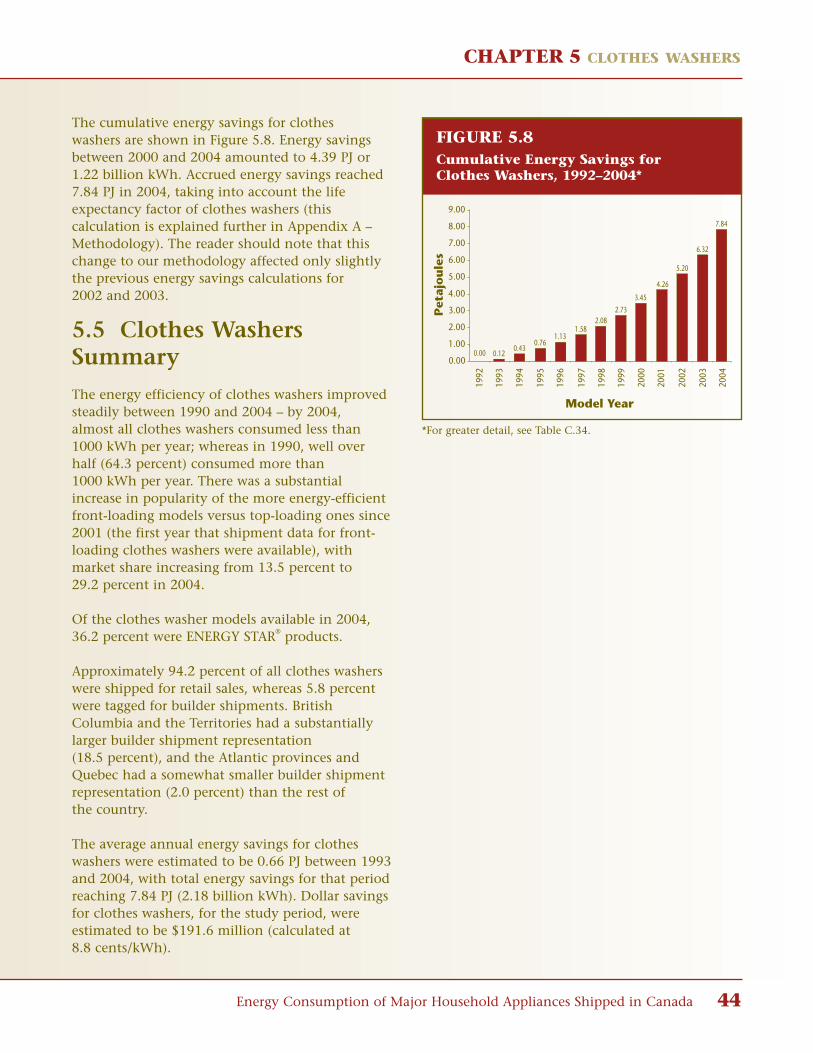
CHAPTER 5 CLOTHES WASHERS
Energy Consumption of Major Household Appliances Shipped in Canada 44
The cumulative energy savings for clothes washers are shown in Figure 5.8. Energy savingsbetween 2000 and 2004 amounted to 4.39 PJ or1.22 billion kWh. Accrued energy savings reached7.84 PJ in 2004, taking into account the lifeexpectancy factor of clothes washers (this calculation is explained further in Appendix A –Methodology). The reader should note that thischange to our methodology affected only slightlythe previous energy savings calculations for 2002 and 2003.
5.5 Clothes WashersSummary
The energy efficiency of clothes washers improvedsteadily between 1990 and 2004 – by 2004, almost all clothes washers consumed less than1000 kWh per year; whereas in 1990, well overhalf (64.3 percent) consumed more than 1000 kWh per year. There was a substantialincrease in popularity of the more energy-efficientfront-loading models versus top-loading ones since2001 (the first year that shipment data for front-loading clothes washers were available), withmarket share increasing from 13.5 percent to 29.2 percent in 2004.
Of the clothes washer models available in 2004,36.2 percent were ENERGY STAR® products.
Approximately 94.2 percent of all clothes washerswere shipped for retail sales, whereas 5.8 percentwere tagged for builder shipments. BritishColumbia and the Territories had a substantiallylarger builder shipment representation (18.5 percent), and the Atlantic provinces andQuebec had a somewhat smaller builder shipmentrepresentation (2.0 percent) than the rest of the country.
The average annual energy savings for clotheswashers were estimated to be 0.66 PJ between 1993and 2004, with total energy savings for that periodreaching 7.84 PJ (2.18 billion kWh). Dollar savingsfor clothes washers, for the study period, were estimated to be $191.6 million (calculated at 8.8 cents/kWh).
Model Year
1992
1993
1994
1995
1996
1997
1998
1999
2000
2001
2002
2003
2004
Pet
ajo
ule
s
0.00
1.00
2.00
3.00
4.00
5.00
6.00
7.00
8.00
9.00
0.00 0.120.43
0.761.13
1.582.08
2.73
3.45
4.26
5.20
6.32
7.84
Fig 5.8.eps
FIGURE 5.8Cumulative Energy Savings forClothes Washers, 1992–2004*
*For greater detail, see Table C.34.

CHAPTER 6 ELECTRIC CLOTHES DRYERS
6 ELECTRIC CLOTHES DRYERS
45 Trends for 1990-2004
6.1 2004 Market Snapshot
In 2004, the shipment-weighted average annualunit energy consumption (UEC) of all electricclothes dryers was 912 kilowatt hours (kWh) per year.
Electric clothes dryers typically make up 96 percent of the market; gas clothes dryers constitute the remainder.
6.2 Distribution ofShipments
6.2.1 Distribution by Average AnnualUnit Energy Consumption
Between 1990 and 2004, electric clothes dryersexhibited steady improvements in energy efficien-cy. The consumption level of over 1050 kWh peryear, which dominated the market (66.5 percent)in 1990, had almost disappeared by 2004. In 2004,75.3 percent of electric clothes dryers consumedbetween 900 and 949 kWh.
There was a significant improvement in
energy efficiency of clothes dryers from
1991 to 1993, when the average annual
UEC decreased from 1109 to 929 kWh.
After 1993, the average annual UEC
remained relatively constant.
TABLE 6.1Distribution of Electric Clothes Dryers by Average Annual Unit Energy Consumption
Model Year kWh/yr.<800 800–899.9 900–949.9 950–999.9 1000–1049.9 >1050
% % % % % %1990 4.7 7.8 14.4 0.0 6.6 66.51991 5.3 0.2 30.0 22.6 15.4 26.51992 4.4 28.9 37.5 13.6 4.6 11.01993 4.1 28.9 53.6 0.1 7.1 6.11994 4.3 24.0 54.6 0.0 14.9 2.21995 3.2 16.2 68.5 0.8 10.0 1.31996 4.2 11.8 82.8 1.1 0.2 0.01997 4.9 12.9 80.7 1.4 0.0 0.01998 3.2 8.8 87.0 1.0 0.0 0.01999 2.7 7.2 88.3 1.8 0.0 0.02000 2.7 7.7 84.6 5.0 0.0 0.02001 2.3 4.3 87.1 6.3 0.0 0.02002 2.5 5.2 85.5 6.7 0.0 0.02003 2.7 10.0 77.0 10.3 0.0 0.02004 4.0 4.4 75.3 16.3 0.0 0.0
AverageAnnual 0.0% 0.2% 4.3% 1.2% 0.5% 4.8%Change
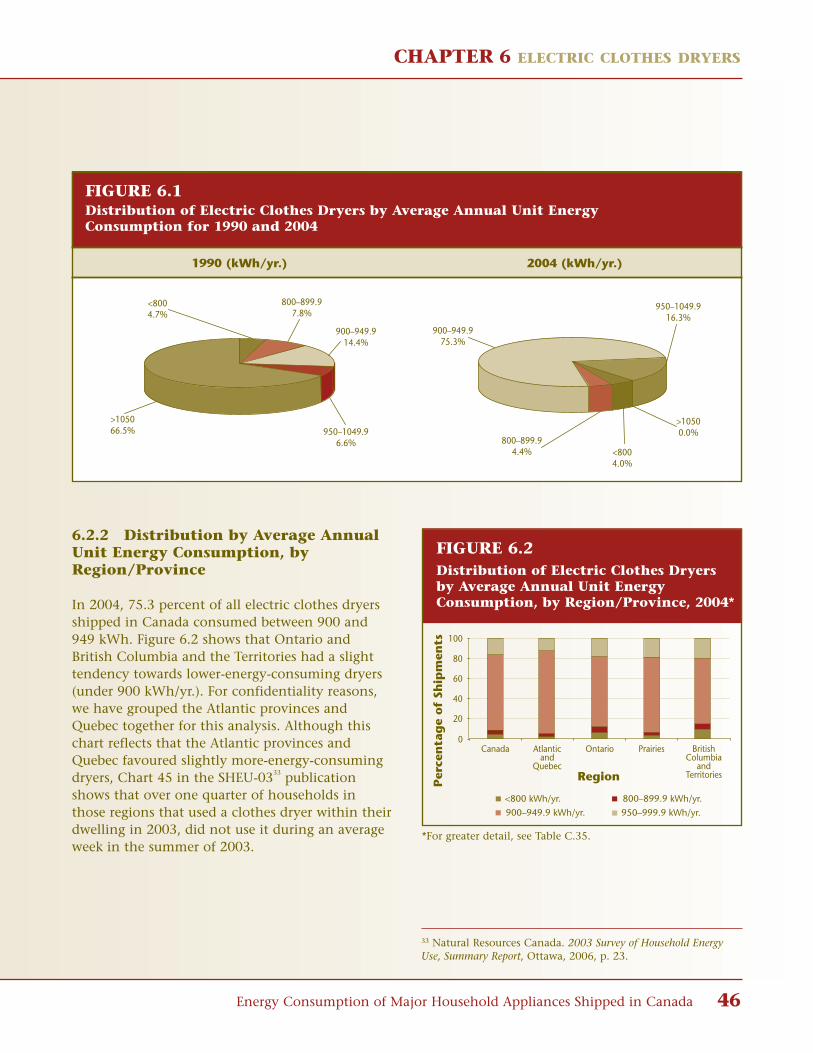
CHAPTER 6 ELECTRIC CLOTHES DRYERS
Energy Consumption of Major Household Appliances Shipped in Canada 46
6.2.2 Distribution by Average AnnualUnit Energy Consumption, byRegion/Province
In 2004, 75.3 percent of all electric clothes dryersshipped in Canada consumed between 900 and949 kWh. Figure 6.2 shows that Ontario andBritish Columbia and the Territories had a slighttendency towards lower-energy-consuming dryers(under 900 kWh/yr.). For confidentiality reasons,we have grouped the Atlantic provinces andQuebec together for this analysis. Although thischart reflects that the Atlantic provinces andQuebec favoured slightly more-energy-consumingdryers, Chart 45 in the SHEU-0333 publicationshows that over one quarter of households inthose regions that used a clothes dryer within theirdwelling in 2003, did not use it during an averageweek in the summer of 2003.
FIGURE 6.1Distribution of Electric Clothes Dryers by Average Annual Unit Energy Consumption for 1990 and 2004
>105066.5%
<8004.7%
800–899.97.8%
900–949.914.4%
950–1049.96.6%
<8004.0%
>10500.0%
950–1049.916.3%
800–899.94.4%
900–949.975.3%
1990 (kWh/yr.) 2004 (kWh/yr.)
Per
cen
tag
e o
f Sh
ipm
ents
Canada Atlanticand
Quebec
Ontario Prairies BritishColumbia
andTerritories
0
20
40
60
80
100
Region
<800 kWh/yr. 800–899.9 kWh/yr.
900–949.9 kWh/yr. 950–999.9 kWh/yr.
Fig 6.2.eps
FIGURE 6.2 Distribution of Electric Clothes Dryersby Average Annual Unit EnergyConsumption, by Region/Province, 2004*
*For greater detail, see Table C.35.
33 Natural Resources Canada. 2003 Survey of Household EnergyUse, Summary Report, Ottawa, 2006, p. 23.
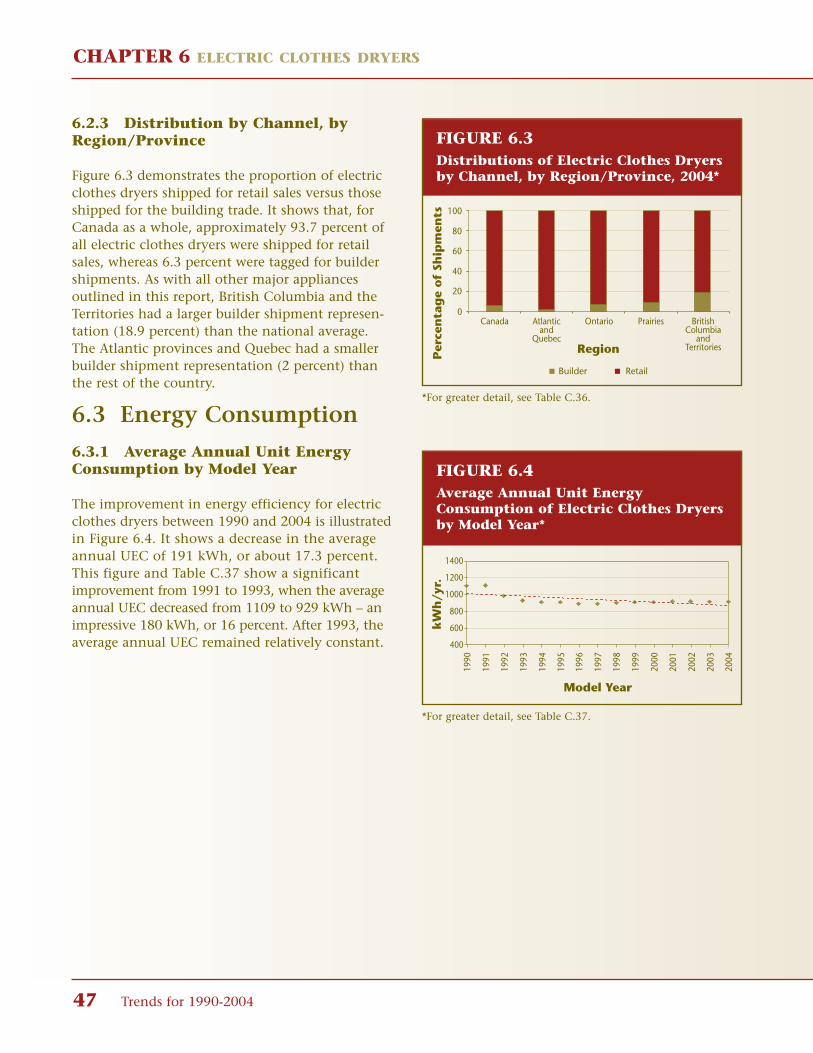
CHAPTER 6 ELECTRIC CLOTHES DRYERS
47 Trends for 1990-2004
6.2.3 Distribution by Channel, byRegion/Province
Figure 6.3 demonstrates the proportion of electricclothes dryers shipped for retail sales versus thoseshipped for the building trade. It shows that, forCanada as a whole, approximately 93.7 percent ofall electric clothes dryers were shipped for retailsales, whereas 6.3 percent were tagged for buildershipments. As with all other major appliances outlined in this report, British Columbia and theTerritories had a larger builder shipment represen-tation (18.9 percent) than the national average.The Atlantic provinces and Quebec had a smallerbuilder shipment representation (2 percent) thanthe rest of the country.
6.3 Energy Consumption
6.3.1 Average Annual Unit EnergyConsumption by Model Year
The improvement in energy efficiency for electricclothes dryers between 1990 and 2004 is illustratedin Figure 6.4. It shows a decrease in the averageannual UEC of 191 kWh, or about 17.3 percent.This figure and Table C.37 show a significantimprovement from 1991 to 1993, when the averageannual UEC decreased from 1109 to 929 kWh – animpressive 180 kWh, or 16 percent. After 1993, theaverage annual UEC remained relatively constant.
Per
cen
tag
e o
f Sh
ipm
ents
Canada Atlanticand
Quebec
Ontario Prairies BritishColumbia
andTerritories
0
20
40
60
80
100
Region
Builder Retail
Fig 6.3.epsFIGURE 6.3Distributions of Electric Clothes Dryersby Channel, by Region/Province, 2004*
*For greater detail, see Table C.36.
Model Year
1990
1991
1992
1993
1994
1995
1996
1997
1998
1999
2000
2001
2002
2003
2004
kW
h/y
r.
400
600
800
1000
1200
1400
Fig 6.4.epsFIGURE 6.4Average Annual Unit EnergyConsumption of Electric Clothes Dryersby Model Year*
*For greater detail, see Table C.37.

CHAPTER 6 ELECTRIC CLOTHES DRYERS
Energy Consumption of Major Household Appliances Shipped in Canada 48
6.3.2 Average Annual Unit EnergyConsumption by Channel, byRegion/Province, 2004
Figure 6.5 demonstrates the breakdown of theaverage annual UEC of electric clothes dryers byshipments for retail purposes and for the buildertrade, by region/province. It shows that, in allregions, the average annual UEC was higher forretail shipments than for builder shipments. Theaverage annual UEC for builder shipments waslowest in Ontario (817.1 kWh/yr.); the averageannual UEC for retail shipments was lowest inBritish Columbia and the Territories (892.1 kWh/yr.).
6.4 Energy Savings
It is estimated that from 1993 to 2004, the annualenergy consumption of electric clothes dryers waslower than it would have been had manufacturersnot met the minimum energy performance standards (MEPS) or improved energy efficiency.Figure 6.6 shows how much energy might havebeen consumed annually by electric clothes dryerswithout the contributing factors (top line) andhow much energy they actually consumed (bottom line).
Graphically, the gap between the two lines represents incremental annual energy savings – on average, 0.12 petajoules (PJ) per year. Thelargest annual energy savings occurred in 2004,when electric clothes dryers consumed 0.16 PJ less than they otherwise might have.
700
750
800
850
900
950
kW
h/y
r.
Canada Atlanticand
Quebec
Ontario Prairies BritishColumbia
andTerritoriesRegion
Builder Retail
Fig 6.5.eps
FIGURE 6.5Average Annual Unit EnergyConsumption of Electric Clothes Dryersby Channel, by Region/Province, 2004*
*For greater detail, see Table C.38.
Model Year
Pet
ajo
ule
s
0.00
0.50
1.00
1.50
2.00
2.50
Energy Consumed WITHOUT Manufacturers' Improvements and the MEPS (PJ)
Energy Consumed WITH Manufacturers' Improvements and the MEPS (PJ)
1992
1993
1994
1995
1996
1997
1998
1999
2000
2001
2002
2003
2004
Fig 6.6.eps
FIGURE 6.6Energy Savings for Electric ClothesDryers, 1992–2004*
*For greater detail, see Table C.39.
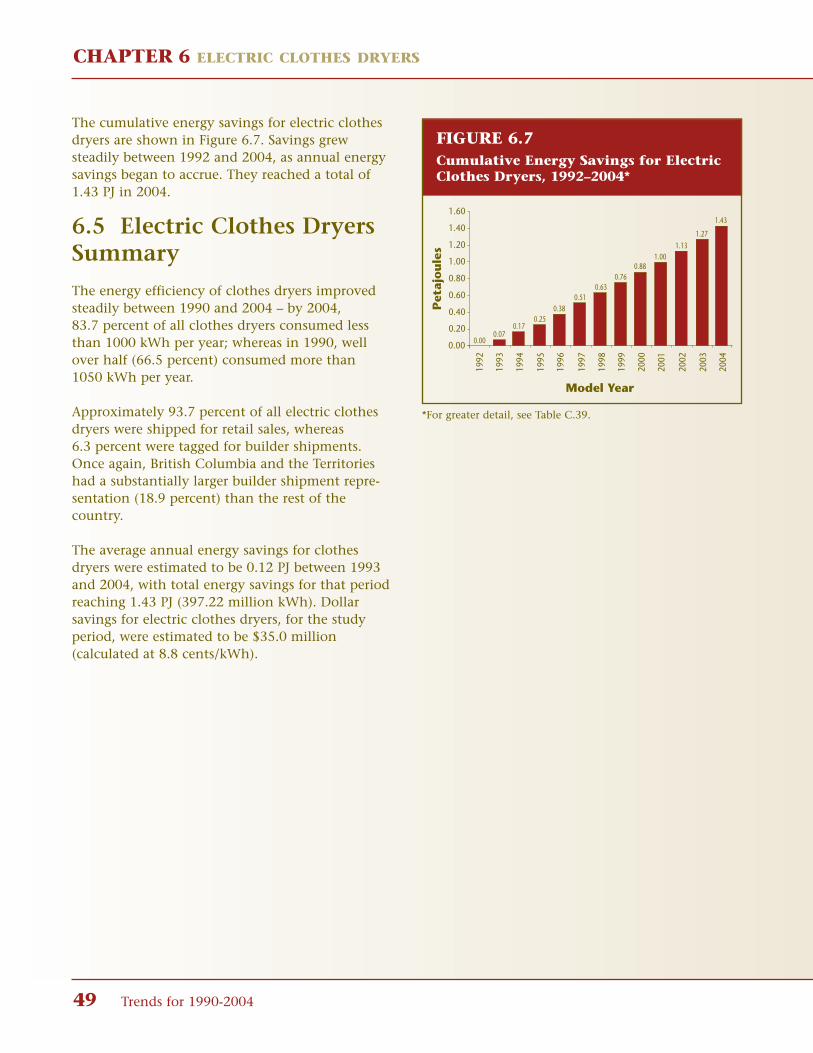
CHAPTER 6 ELECTRIC CLOTHES DRYERS
49 Trends for 1990-2004
The cumulative energy savings for electric clothesdryers are shown in Figure 6.7. Savings grewsteadily between 1992 and 2004, as annual energysavings began to accrue. They reached a total of1.43 PJ in 2004.
6.5 Electric Clothes DryersSummary
The energy efficiency of clothes dryers improvedsteadily between 1990 and 2004 – by 2004, 83.7 percent of all clothes dryers consumed lessthan 1000 kWh per year; whereas in 1990, wellover half (66.5 percent) consumed more than 1050 kWh per year.
Approximately 93.7 percent of all electric clothesdryers were shipped for retail sales, whereas 6.3 percent were tagged for builder shipments.Once again, British Columbia and the Territorieshad a substantially larger builder shipment repre-sentation (18.9 percent) than the rest of thecountry.
The average annual energy savings for clothes dryers were estimated to be 0.12 PJ between 1993and 2004, with total energy savings for that periodreaching 1.43 PJ (397.22 million kWh). Dollar savings for electric clothes dryers, for the studyperiod, were estimated to be $35.0 million (calculated at 8.8 cents/kWh).
Model Year
1992
1993
1994
1995
1996
1997
1998
1999
2000
2001
2002
2003
2004
Pet
ajo
ule
s
0.00
0.20
0.40
0.60
0.80
1.00
1.20
1.40
1.60
0.000.07
0.170.25
0.380.51
0.630.76
0.881.00
1.131.27
1.43
Fig 6.7.eps
FIGURE 6.7Cumulative Energy Savings for ElectricClothes Dryers, 1992–2004*
*For greater detail, see Table C.39.
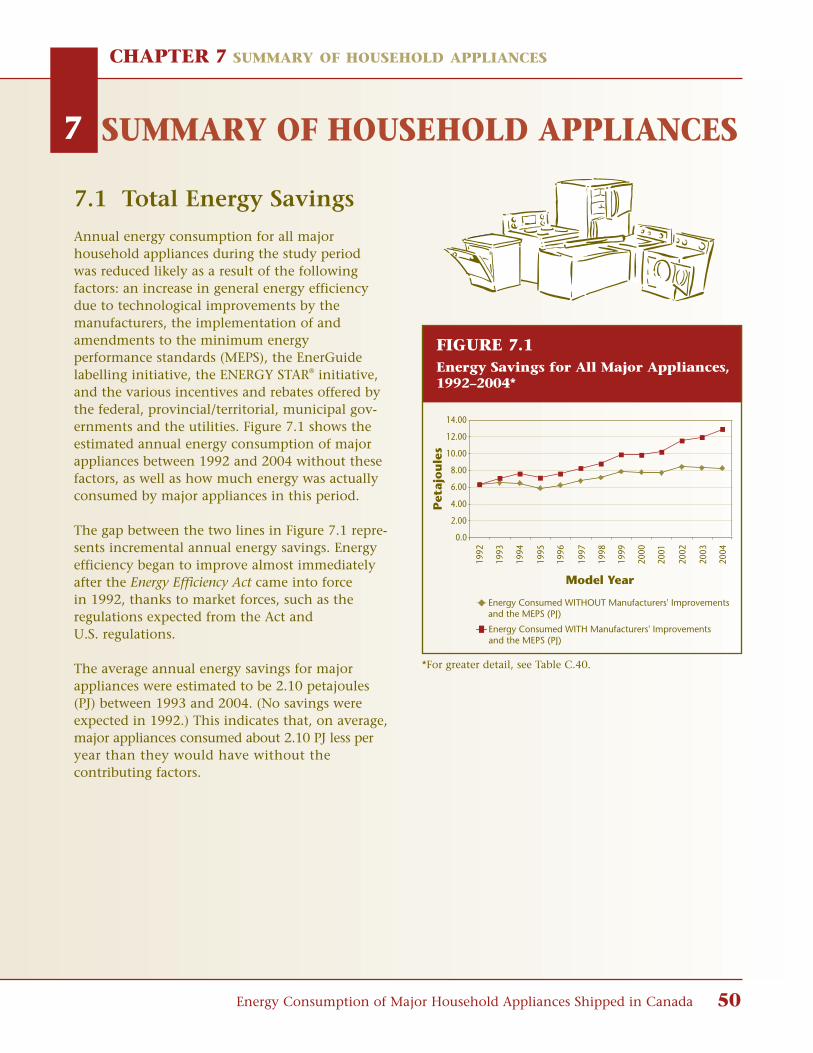
Energy Consumption of Major Household Appliances Shipped in Canada 50
CHAPTER 7 SUMMARY OF HOUSEHOLD APPLIANCES
7 SUMMARY OF HOUSEHOLD APPLIANCES
7.1 Total Energy Savings
Annual energy consumption for all major household appliances during the study period was reduced likely as a result of the following factors: an increase in general energy efficiencydue to technological improvements by the manufacturers, the implementation of and amendments to the minimum energy performance standards (MEPS), the EnerGuidelabelling initiative, the ENERGY STAR® initiative,and the various incentives and rebates offered bythe federal, provincial/territorial, municipal gov-ernments and the utilities. Figure 7.1 shows theestimated annual energy consumption of majorappliances between 1992 and 2004 without thesefactors, as well as how much energy was actuallyconsumed by major appliances in this period.
The gap between the two lines in Figure 7.1 repre-sents incremental annual energy savings. Energyefficiency began to improve almost immediatelyafter the Energy Efficiency Act came into force in 1992, thanks to market forces, such as the regulations expected from the Act and U.S. regulations.
The average annual energy savings for majorappliances were estimated to be 2.10 petajoules(PJ) between 1993 and 2004. (No savings wereexpected in 1992.) This indicates that, on average,major appliances consumed about 2.10 PJ less per year than they would have without the contributing factors.
Model Year
Pet
ajo
ule
s
0.0
2.00
4.00
6.00
8.00
10.00
12.00
14.00
Energy Consumed WITHOUT Manufacturers' Improvements and the MEPS (PJ)
Energy Consumed WITH Manufacturers' Improvements and the MEPS (PJ)
1992
1993
1994
1995
1996
1997
1998
1999
2000
2001
2002
2003
2004
Fig 7.1.eps
FIGURE 7.1Energy Savings for All Major Appliances,1992–2004*
*For greater detail, see Table C.40.
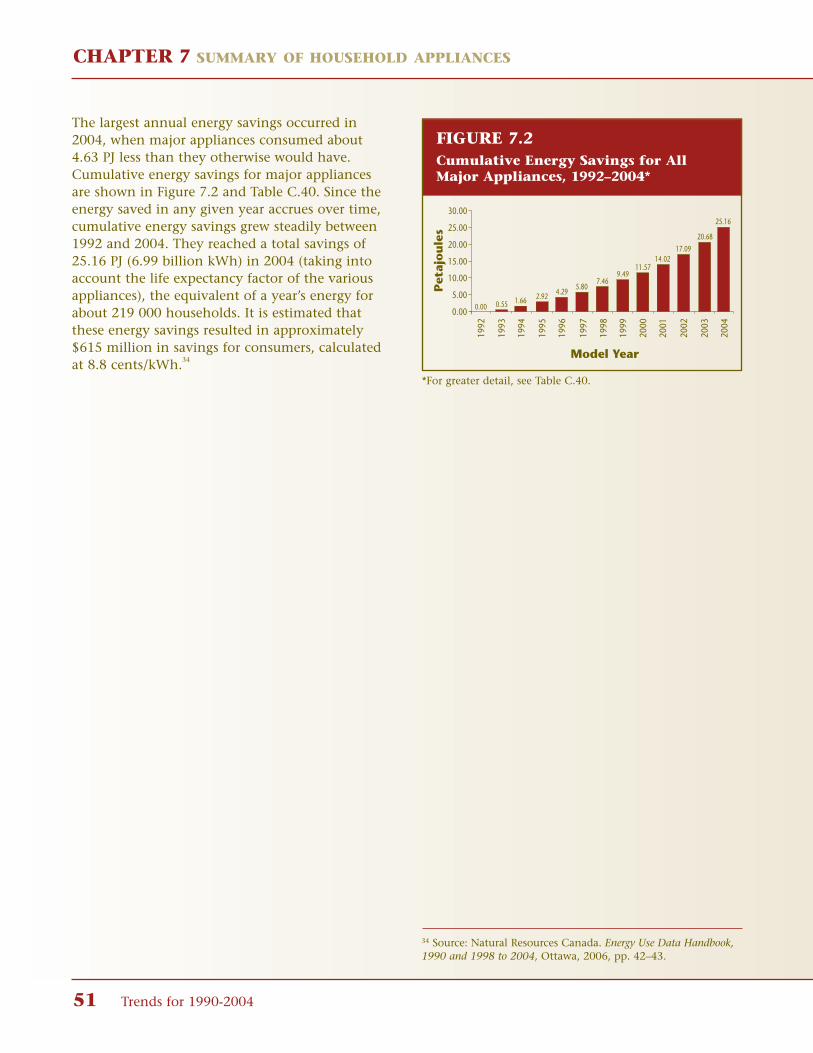
CHAPTER 7 SUMMARY OF HOUSEHOLD APPLIANCES
51 Trends for 1990-2004
The largest annual energy savings occurred in2004, when major appliances consumed about4.63 PJ less than they otherwise would have.Cumulative energy savings for major appliancesare shown in Figure 7.2 and Table C.40. Since theenergy saved in any given year accrues over time,cumulative energy savings grew steadily between1992 and 2004. They reached a total savings of25.16 PJ (6.99 billion kWh) in 2004 (taking intoaccount the life expectancy factor of the variousappliances), the equivalent of a year’s energy forabout 219 000 households. It is estimated thatthese energy savings resulted in approximately$615 million in savings for consumers, calculatedat 8.8 cents/kWh.34 Model Year
1992
1993
1994
1995
1996
1997
1998
1999
2000
2001
2002
2003
2004
Pet
ajo
ule
s
0.00
5.00
10.00
15.00
20.00
25.00
30.0025.16
20.68
17.0914.02
11.579.49
7.465.80
4.292.921.660.550.00
Fig 7.2.epsFIGURE 7.2Cumulative Energy Savings for AllMajor Appliances, 1992–2004*
*For greater detail, see Table C.40.
34 Source: Natural Resources Canada. Energy Use Data Handbook,1990 and 1998 to 2004, Ottawa, 2006, pp. 42–43.

Energy Consumption of Major Household Appliances Shipped in Canada 52
Appendix A METHODOLOGY
APPENDIX A METHODOLOGY
A.1 Data Preparation
A.1.1 Introduction
In an ongoing effort to improve the monitoring of trends in Canadian energy use, NaturalResources Canada’s (NRCan’s) Office of EnergyEfficiency proposed an annual data collectionarrangement with members of the CanadianAppliance Manufacturers Association (CAMA) in 1996, as part of the National Energy UseDatabase (NEUD) initiative.
Under this agreement, CAMA members con-tributed their annual shipment data for sixappliance categories – refrigerators, freezers, elec-tric ranges, dishwashers, clothes washers andelectric clothes dryers – for analysis. To keep eachappliance manufacturer’s data confidential, appli-ance manufacturers suggested that a third partyreceive and prepare the database in a format inwhich no one (other than the third party) coulddetermine the shipment data for an individualmodel or manufacturer. NRCan retained the servic-es of Electro-Federation Canada (EFC), chosen byCAMA, as the third party to receive the data.
For the collection of 2004 data, the manufacturersagreed to provide data on their shipments byprovince/region and by distribution channel(builder versus retailer) where possible. This hasallowed a more detailed analysis of the distribu-tion and the energy efficiency of the appliancesand their energy efficiency.
The following sections describe the database preparation process conducted by EFC.
The data presented in this report combine shipment figures from the major appliance manufacturers in Canada with the energy useinformation contained in NRCan’s annualEnerGuide Appliance Directory. Analysts fromEFC matched the model number from the
manufacturer with the corresponding model in theEnerGuide Appliance Directory. Thus, they arrived atthe total energy consumption represented by allshipments of that model within each year. Thenthey aggregated these figures by province/regionand channel as well as for the whole of Canadato provide the data presented in this report. Theyproduced separate aggregated data for ENERGYSTAR® models, where appropriate.
The analysts used standard database and spread-sheet software to assemble the data, manipulatedthem as required and passed them to NRCan foranalysis and report generation. For the reportingstages, they stripped all data of any informationthat could identify the manufacturer or the model number.
A.1.2 Manufacturers’ Data
NRCan sent initial letters to the appliance manu-facturers, requesting annual shipment data foreach model of refrigerator, freezer, electric range,dishwasher, clothes washer and electric clothesdryer on the Canadian market from 1990 to 2004.When the project began in 1996, only three manu-facturers provided shipment data. The number ofdata contributors increased to eight in 2004, cover-ing the vast majority of appliance models sold inCanada. NRCan is approaching additional manu-facturers in order to improve the coverage forfuture data collection.
Manufacturers sent the data in various electronicand printed formats. EFC converted the electronicdata to a common database format. The analystskey-edited the printed reports and then convertedthem to the same format.
The data consisted of the appliance type, model number and number of shipments (byprovince/region and channel, where possible, for2004 data onwards) in each year. Manufacturerssupplied individual files for each year. As each

Appendix A METHODOLOGY
53 Trends for 1990-2004
manufacturer provided data in a different format,the analysts harmonized and amalgamated thefiles to produce a single file for all models, byappliance type, province/region, channel andmodel year.
The nature of the freezer market prevented EFCfrom obtaining a model-by-model breakdown ofshipments. Instead, the analysts received totalshipments and average energy use by freezer type.NRCan used this information to generate the freezer reports.
A.1.3 EnerGuide Data
The analysts used the size, type and unit energyinformation from NRCan’s EnerGuide ratings foreach appliance to calculate the shipment-weightedenergy use of each appliance type. Also, theEnerGuide was used to identify which models were listed as ENERGY STAR.
A.1.4 Data Matching
Analysts from EFC matched the manufacturer’sdata for each model with the corresponding energy consumption data from the EnerGuideAppliance Directory for that model. They then multiplied the manufacturer’s shipments for eachmodel by the corresponding EnerGuide model’senergy rating. This gave the shipment-weightedtotal energy consumption for that model. Eachappliance category (e.g. refrigerator, dishwasher)and type and size category (as defined in theEnerGuide books, e.g. type 7 refrigerators, self-cleaning ranges, front-loading clothes washers) wasthen subtotalled so that the average consumptioncould be worked out.
The EnerGuide Appliance Directory shows the basicmodel numbers available on the Canadian market.Many slight model variants have the same energyrating, so the listings use symbols (such as * and #)to indicate model families. As some model num-bers have additional prefixes or suffixes to indicatefeatures (e.g. colour, door-swing) that do not affectenergy use, there were relatively few direct one-to-one matches.
Analysts needed to manipulate the data to perform pattern matching. They wrote programsto compare the model numbers supplied by themanufacturers with those in the EnerGuideAppliance Directory. When a match was found, the corresponding energy consumption figure andthe information on the type from the EnerGuideAppliance Directory were added to the record for the annual shipments of the model.
Because there were many combinations of charac-ter substitution, the analysts adopted a method towork from the closest matches to the least likelymatches. Matches in which only one character differed were flagged and removed. Attempts werethen made with a difference of two characters, and so on.
The analysts developed reasonability tests toensure the integrity of the data-matching process.For example, if the manufacturer’s model numbercontained many characters but was matched by amodel in the EnerGuide Appliance Directory that hadconsiderably fewer characters, the model wasflagged for manual checking. They also realizedthat manufacturers might re-use the same numbersfor different models after several years. For exam-ple, 128 models of refrigerators in the filecontaining 1980 to 1993 data from the EnerGuideAppliance Directory have the same model number asthose in the 1997 file, but with different energyratings. They flagged these models for special treat-ment. During the matching process, analystsapplied “reasonability” criteria. For example, amodel would be checked manually if its shipmentswere reported more than three years after the lasttime the corresponding model appeared in theEnerGuide list or if the EnerGuide model numbercontained considerably fewer characters than themanufacturer’s.
Some difficulties occurred when the model num-ber in NRCan’s EnerGuide Appliance Directorydiffered from the actual model numbers used bythe manufacturers in their internal shipmentrecording systems. In some cases, for example,
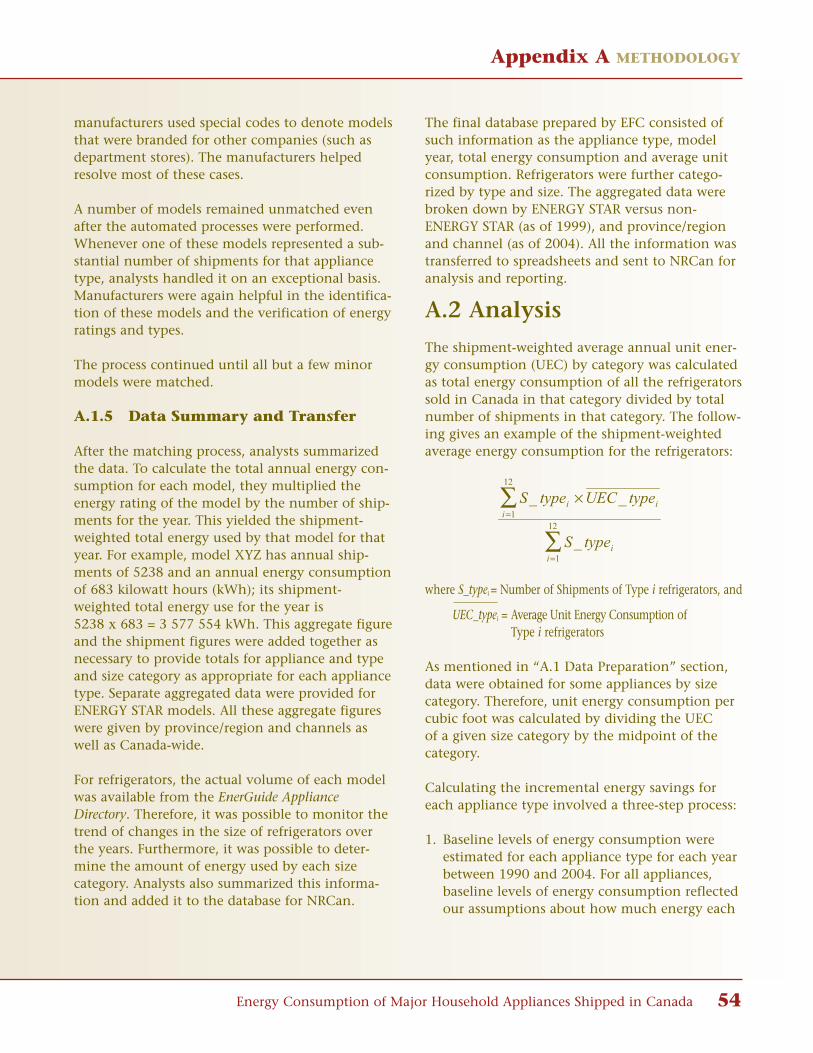
Appendix A METHODOLOGY
Energy Consumption of Major Household Appliances Shipped in Canada 54
manufacturers used special codes to denote modelsthat were branded for other companies (such asdepartment stores). The manufacturers helpedresolve most of these cases.
A number of models remained unmatched evenafter the automated processes were performed.Whenever one of these models represented a sub-stantial number of shipments for that appliancetype, analysts handled it on an exceptional basis.Manufacturers were again helpful in the identifica-tion of these models and the verification of energyratings and types.
The process continued until all but a few minormodels were matched.
A.1.5 Data Summary and Transfer
After the matching process, analysts summarizedthe data. To calculate the total annual energy con-sumption for each model, they multiplied theenergy rating of the model by the number of ship-ments for the year. This yielded the shipment-weighted total energy used by that model for thatyear. For example, model XYZ has annual ship-ments of 5238 and an annual energy consumptionof 683 kilowatt hours (kWh); its shipment-weighted total energy use for the year is 5238 x 683 = 3 577 554 kWh. This aggregate figureand the shipment figures were added together asnecessary to provide totals for appliance and typeand size category as appropriate for each appliancetype. Separate aggregated data were provided forENERGY STAR models. All these aggregate figureswere given by province/region and channels aswell as Canada-wide.
For refrigerators, the actual volume of each modelwas available from the EnerGuide ApplianceDirectory. Therefore, it was possible to monitor thetrend of changes in the size of refrigerators overthe years. Furthermore, it was possible to deter-mine the amount of energy used by each sizecategory. Analysts also summarized this informa-tion and added it to the database for NRCan.
The final database prepared by EFC consisted ofsuch information as the appliance type, modelyear, total energy consumption and average unitconsumption. Refrigerators were further catego-rized by type and size. The aggregated data werebroken down by ENERGY STAR versus non-ENERGY STAR (as of 1999), and province/regionand channel (as of 2004). All the information wastransferred to spreadsheets and sent to NRCan foranalysis and reporting.
A.2 Analysis
The shipment-weighted average annual unit ener-gy consumption (UEC) by category was calculatedas total energy consumption of all the refrigeratorssold in Canada in that category divided by totalnumber of shipments in that category. The follow-ing gives an example of the shipment-weightedaverage energy consumption for the refrigerators:
where S_typei = Number of Shipments of Type i refrigerators, and
UEC_typei = Average Unit Energy Consumption ofType i refrigerators
As mentioned in “A.1 Data Preparation” section,data were obtained for some appliances by size category. Therefore, unit energy consumption percubic foot was calculated by dividing the UEC of a given size category by the midpoint of the category.
Calculating the incremental energy savings foreach appliance type involved a three-step process:
1. Baseline levels of energy consumption were estimated for each appliance type for each year between 1990 and 2004. For all appliances, baseline levels of energy consumption reflected our assumptions about how much energy each

Appendix A METHODOLOGY
55 Trends for 1990-2004
appliance type would have consumed withoutthe energy efficiency improvements madeby manufacturers and the minimum energyperformance standards (MEPS). To estimatebaseline levels of energy consumption, weassumed the following:
• Without the implementation of Canada’sEnergy Efficiency Regulations andgeneral energy efficiency improvementsmade by manufacturers, the unit energyconsumption for all appliance types wouldhave remained constant at the 1992 levels.
• The number of units shipped would have remained the same between 1990 and 2004even in the absence of the general efficiency improvements made by manufacturers and the implementation of the Energy Efficiency Regulations.
Even though the MEPS were not introduced until1995, the baseline year used for all estimates ofenergy savings was 1992. This is because energyefficiency began to improve almost immediatelyafter the Energy Efficiency Act came into force in1992, thanks to market forces, such as the regula-tions expected from the Act plus U.S. regulations.
2. “Actual” or current levels of consumption for all appliances were calculated in an identical fashion. The average annual unit energy consumption for each appliance type for each model year was used, instead of holding it constant at 1992 levels, to determine the actual levels of energy consumption.
3. Incremental energy savings for all appliances were then calculated as the difference between baseline and actual levels of energy consumption.
Since 1992 was the baseline year used in our calculations, we included in this year’s analysis aretirement function to take into account the agingof the appliances, based on the life expectanciesset out in the 2005 EnerGuide Appliance Directory.35
The method for calculating the cumulative energysavings for each appliance type changed slightlyfor this report, in order to avoid overestimatingthe actual energy savings. It involved using theaverage life expectancy, annual shipment dataand annual incremental energy savings for eachappliance type. Average life expectancy and annualshipment data for each appliance type were usedto estimate the annual stock of each appliancetype in use. This estimate was then applied to theannual incremental unit energy savings for eachappliance type (shipment-weighted UEC for 1992,less the shipment-weighted UEC for each year) tocalculate the cumulative energy savings. The readershould note that this change to our methodologyaffected only slightly the previous energy savingscalculations for earlier years (dishwashers andclothes washers for 2002 and 2003).
This calculation was a four-step process.
1. The average life expectancy of each appliance type was assumed to be the industry average reported in the 2005 EnerGuide Appliance Directory:
a. refrigerators – 17 yearsb. freezers – 21 yearsc. electric ranges – 18 yearsd. dishwashers – 13 yearse. clothes washers – 14 yearsf. clothes dryers – 18 years
2. A retirement function was used to estimate the retirement rate of each appliance type. In this linear function no appliances retire in the first two-thirds (0.67) of their average life expectancy and all units are retired by four-thirds (1.33) of their average life expectancy. The equations for the retirement function are as follows:
a. if age < {2/3 * (average life expectancy)}, 100 percent survive
b. if age > {4/3 * (average life expectancy)}, 0 percent survive
c. otherwise, {2 – age * 1.5/(average life expectancy)} survive
35 Natural Resources Canada. EnerGuide Appliance Directory2005, Ottawa, 2005, p. 13.

Appendix A METHODOLOGY
Energy Consumption of Major Household Appliances Shipped in Canada 56
This retirement function is demonstrated in thefollowing chart.
3. The rate of retirement was applied to the annual shipments of each appliance type to estimate the total stock of appliances in use for each year since our baseline year of 1992.
4. The total stock of appliances for each year since 1992 was separated into categories based on the year the appliances were shipped. Cumulative energy savings were then calculated by multiplying the annual shipments that make up the stock by the incremental unit energy savings for each corresponding year.
As noted below, this new function only slightlychanged energy savings calculations for previousyears (dishwashers and clothes washers for 2002and 2003). The following chart demonstratesthe changes.
Age of Appliance/Average Life Expectancy
Per
cen
tag
e o
f A
pp
lian
ceSh
ipm
ents
in
Use
(St
ock
)
0.00 0.33 0.67 1.00 1.330
25
50
75
100
FIGURE A.1Retirement Function for Aging Appliances
Model Year
1992
1993
1994
1995
1996
1997
1998
1999
2000
2001
2002
2003
2004
Cu
mu
lati
ve E
ner
gy
Savi
ng
s (P
J)
0.00
5.00
10.00
15.00
20.00
25.00
30.00
Total With Retirement Factor Total Without Retirement Factor
FIGURE A.2Energy Savings for All Appliances With and Without Retirement Factor
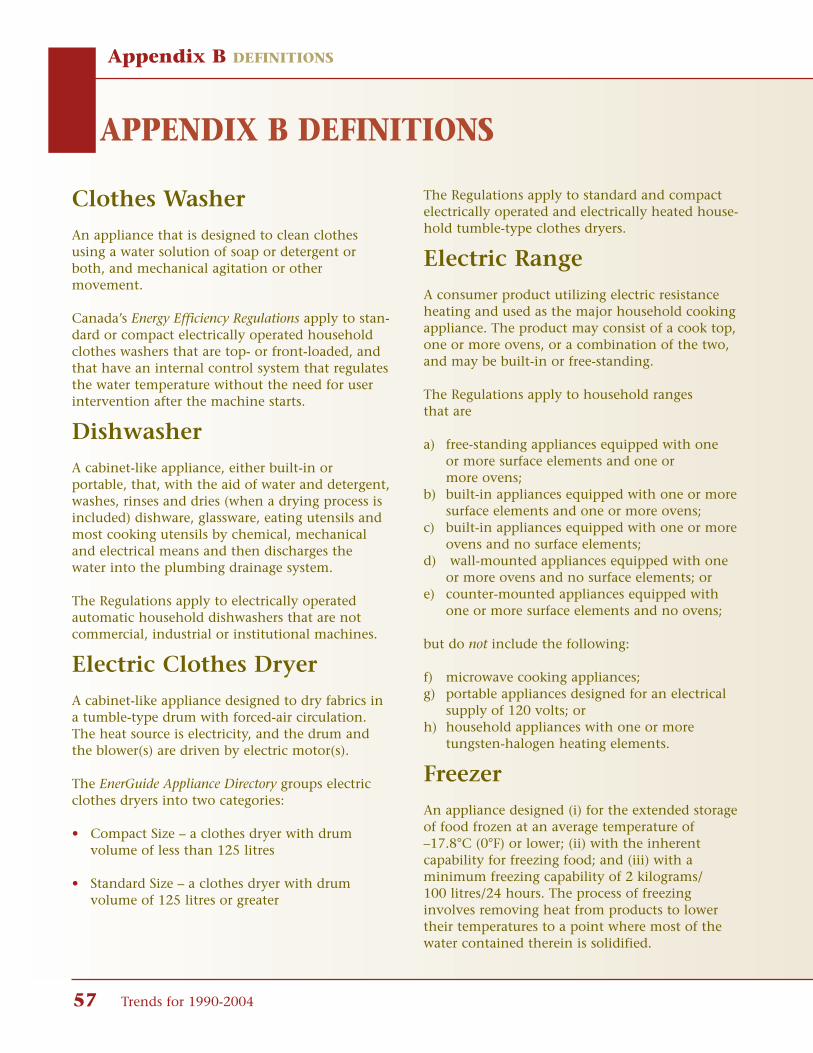
Appendix B DEFINITIONS
APPENDIX B DEFINITIONS
57 Trends for 1990-2004
Clothes WasherAn appliance that is designed to clean clothesusing a water solution of soap or detergent orboth, and mechanical agitation or other movement.
Canada’s Energy Efficiency Regulations apply to stan-dard or compact electrically operated householdclothes washers that are top- or front-loaded, andthat have an internal control system that regulatesthe water temperature without the need for userintervention after the machine starts.
DishwasherA cabinet-like appliance, either built-in orportable, that, with the aid of water and detergent,washes, rinses and dries (when a drying process isincluded) dishware, glassware, eating utensils andmost cooking utensils by chemical, mechanicaland electrical means and then discharges the water into the plumbing drainage system.
The Regulations apply to electrically operatedautomatic household dishwashers that are notcommercial, industrial or institutional machines.
Electric Clothes DryerA cabinet-like appliance designed to dry fabrics ina tumble-type drum with forced-air circulation.The heat source is electricity, and the drum andthe blower(s) are driven by electric motor(s).
The EnerGuide Appliance Directory groups electricclothes dryers into two categories:
• Compact Size – a clothes dryer with drum volume of less than 125 litres
• Standard Size – a clothes dryer with drum volume of 125 litres or greater
The Regulations apply to standard and compactelectrically operated and electrically heated house-hold tumble-type clothes dryers.
Electric RangeA consumer product utilizing electric resistanceheating and used as the major household cookingappliance. The product may consist of a cook top,one or more ovens, or a combination of the two,and may be built-in or free-standing.
The Regulations apply to household ranges that are
a) free-standing appliances equipped with one or more surface elements and one or more ovens;
b) built-in appliances equipped with one or more surface elements and one or more ovens;
c) built-in appliances equipped with one or more ovens and no surface elements;
d) wall-mounted appliances equipped with one or more ovens and no surface elements; or
e) counter-mounted appliances equipped with one or more surface elements and no ovens;
but do not include the following:
f) microwave cooking appliances;g) portable appliances designed for an electrical
supply of 120 volts; orh) household appliances with one or more
tungsten-halogen heating elements.
FreezerAn appliance designed (i) for the extended storageof food frozen at an average temperature of–17.8°C (0°F) or lower; (ii) with the inherent capability for freezing food; and (iii) with a minimum freezing capability of 2 kilograms/100 litres/24 hours. The process of freezinginvolves removing heat from products to lowertheir temperatures to a point where most of thewater contained therein is solidified.

Appendix B DEFINITIONS
Energy Consumption of Major Household Appliances Shipped in Canada 58
In 2004, freezers were typically built as eithervertical models or chest models, and groupedinto the following types:
Type 8 Upright freezers with manual defrostType 9 Upright freezers with automatic defrostType 10 Chest freezers and all other freezersType 16 Compact upright freezers with
manual defrostType 17 Compact upright freezers with
automatic defrostType 18 Compact chest freezers and all
other freezers
The Regulations apply to household freezers thathave a capacity of not more than 850 litres (30 cubic feet).
Refrigerator
An appliance that consists of one or more com-partments, with at least one of the compartmentsdesigned for the refrigerated storage of foods attemperatures above 0°C (32°F) and, if the model isa refrigerator-freezer, with at least one of the com-partments designed for the freezing and storage offrozen foods at or below an average temperature of –15°C (5°F) and typically capable of beingadjusted by the user to a temperature at or below–17.8°C (0°F). The refrigerator with a freezer compartment is capable of maintaining simultane-ously an average freezer temperature <–15°C (5°F)and an average fresh food compartment temperature > 0°C < 5°C (> 32°F < 41°F).
In 2004, refrigerators as per the EnerGuide ApplianceDirectory were grouped under the following maincategories:
Type 1 Refrigerators and refrigerator-freezers with manual defrost
Type 2 Refrigerator-freezers with partial automatic defrost
Type 3 Refrigerator-freezers with automatic defrost, with top-mounted freezer and without through-the-door ice service, as well as all refrigerators without freezers but with automatic defrost
Type 4 Refrigerator-freezers with automatic defrost, with side-mounted freezer and without through-the-door ice service
Type 5 Refrigerator-freezers with automatic defrost, with bottom-mounted freezer and without through-the-door ice service
Type 6 Refrigerator-freezers with automatic defrost, with top-mounted freezer and with through-the-door ice service
Type 7 Refrigerator-freezers with automatic defrost, with side-mounted freezer and with through-the-door ice service
Type 11 Compact refrigerators and refrigerator-freezers with manual defrost
Type 12 Compact refrigerators and refrigerator-freezers with partial automatic defrost
Type 13 Compact refrigerator-freezers with automatic defrost with top mounted freezer and compact all-refrigerators36
with automatic defrostType 14 Compact refrigerator-freezers with
automatic defrost with side-mounted freezer
Type 15 Compact refrigerator-freezers with automatic defrost with bottom-mounted freezer
The Regulations apply to household refrigeratorsor combination refrigerator-freezers that have a capacity of not more than 1100 litres (39 cubic feet), with the exception of refrigeratorsthat employ an absorption refrigeration system.
36 The term “all-refrigerators” refers to models that have nofreezer compartment.

Appendix C TABLES
APPENDIX C TABLES
59 Trends for 1990-2004
TABLE C.A.1ENERGY STAR® Qualified Appliances as a Percentage of Total Shipments in Canada, 1999–2004
Appliance 1999 2000 2001 2002 2003 2004
(%) (%) (%) (%) (%) (%)
Dishwashers 0.6 1.6 9.7 29.8 56.5 81.0Clothes Washers 1.9 2.2 9.2 22.1 30.6 36.2Refrigerators – – 11.4 22.3 40.7 34.2
TABLE C.A.2ENERGY STAR® Qualified Appliances as a Percentage of Total Shipments,by Region/Province, 2004
Region Dishwashers Refrigerators Clothes Washers
(%) (%) (%)
Canada 81.0 34.2 36.2Atlantic 75.4 23.3 –Quebec 81.3 36.9 29.9Ontario 83.3 38.6 37.6Prairies 78.4 33.0 36.2British Columbiaand Territories 79.5 29.3 36.4

Appendix C TABLES
Energy Consumption of Major Household Appliances Shipped in Canada 60
TABLE C.1Distribution of Refrigerators by Type, by Region/Province, 2004
Region Type 3 Type 5 Type 7 Type 11 Others(Types 4, 6, 12, 13)
% % % % %Canada 66.4 15.5 11.0 4.5 2.5Atlantic 83.2 6.4 8.0 1.1 1.3Quebec 69.5 18.8 6.1 3.2 2.5Ontario 64.5 14.6 13.8 3.9 3.3Prairies 69.2 13.6 14.4 0.5 2.3British Columbiaand Territories 59.6 13.6 13.2 11.0 2.7
TABLE C.2Distribution of Refrigerators by Volume, by Region/Province, 2004
Volume (cu. ft.)
Region <10.5 10.5–12.4 12.5–14.4 14.5–16.4 16.5–18.4 18.5–20.4 >20.5cu. ft. cu. ft. cu. ft. cu. ft. cu. ft. cu. ft. cu. ft.
(%) (%) (%) (%) (%) (%) (%)Canada 4.3 2.6 3.6 11.7 39.5 14.0 24.2Atlantic 1.9 6.4 7.8 21.4 40.3 9.4 12.9Quebec 4.3 2.0 2.8 8.0 48.9 17.3 16.7Ontario 4.4 1.3 4.7 14.8 34.6 12.9 27.3Prairies 0.6 2.8 3.0 10.5 40.8 12.7 29.6British Columbiaand Territories 12.7 7.6 0.8 9.3 29.1 13.8 26.7

Appendix C TABLES
61 Trends for 1990-2004
TABLE C.3Distribution of Refrigerators for Retail Shipments by Volume, by Region/Province, 2004
Volume (cu. ft.)
Region <10.5 10.5–12.4 12.5–14.4 14.5–16.4 16.5–18.4 18.5–20.4 >20.5cu. ft. cu. ft. cu. ft. cu. ft. cu. ft. cu. ft. cu. ft.
(%) (%) (%) (%) (%) (%) (%)Canada 6.7 1.5 2.2 8.2 39.9 16.5 25.0Atlantic 1.2 3.1 6.5 22.0 41.7 10.9 14.7Quebec 4.5 0.6 2.5 7.0 49.5 18.4 17.5Ontario 5.7 0.4 1.8 9.1 35.7 15.3 32.0Prairies 0.7 0.9 3.1 8.9 39.7 15.4 31.2British Columbiaand Territories 19.4 2.8 0.7 10.3 24.2 17.2 25.4
TABLE C.4Distribution of Refrigerators for Builder Shipments by Volume, by Region/Province, 2004
Volume (cu. ft.)
Region <10.5 10.5–12.4 12.5–14.4 14.5–16.4 16.5–18.4 18.5–20.4 >20.5cu. ft. cu. ft. cu. ft. cu. ft. cu. ft. cu. ft. cu. ft.
(%) (%) (%) (%) (%) (%) (%)Canada 0.5 10.2 8.7 23.8 36.3 4.1 16.4Atlantic 4.9 20.2 13.2 18.9 34.6 3.2 5.1Quebec 0.3 23.4 7.6 22.2 40.2 0.7 5.5Ontario 0.1 4.5 14.7 34.5 30.8 4.6 10.9Prairies 0.3 9.9 2.7 17.0 44.8 1.9 23.4British Columbiaand Territories 0.8 16.2 0.9 7.6 37.9 7.6 29.0
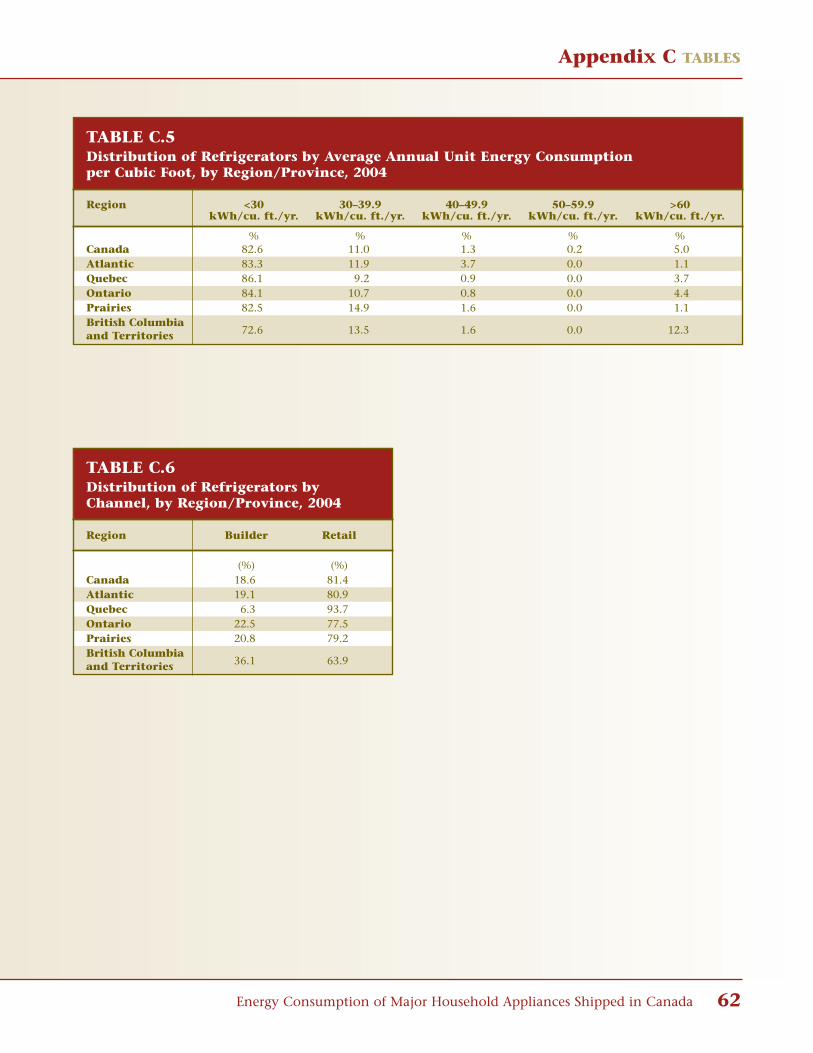
Appendix C TABLES
Energy Consumption of Major Household Appliances Shipped in Canada 62
TABLE C.5Distribution of Refrigerators by Average Annual Unit Energy Consumptionper Cubic Foot, by Region/Province, 2004
Region <30 30–39.9 40–49.9 50–59.9 >60kWh/cu. ft./yr. kWh/cu. ft./yr. kWh/cu. ft./yr. kWh/cu. ft./yr. kWh/cu. ft./yr.
% % % % %Canada 82.6 11.0 1.3 0.2 5.0Atlantic 83.3 11.9 3.7 0.0 1.1Quebec 86.1 9.2 0.9 0.0 3.7Ontario 84.1 10.7 0.8 0.0 4.4Prairies 82.5 14.9 1.6 0.0 1.1British Columbiaand Territories 72.6 13.5 1.6 0.0 12.3
TABLE C.6Distribution of Refrigerators byChannel, by Region/Province, 2004
Region Builder Retail
(%) (%)Canada 18.6 81.4Atlantic 19.1 80.9Quebec 6.3 93.7Ontario 22.5 77.5Prairies 20.8 79.2British Columbiaand Territories 36.1 63.9
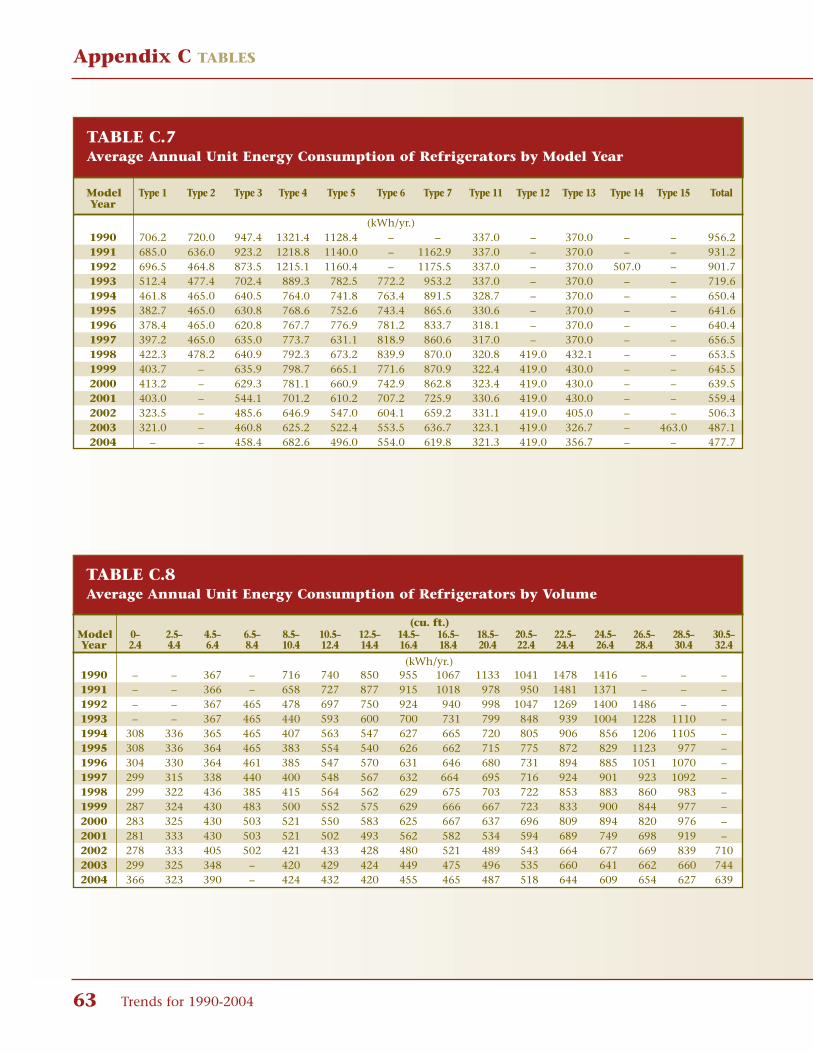
Appendix C TABLES
63 Trends for 1990-2004
TABLE C.7Average Annual Unit Energy Consumption of Refrigerators by Model Year
Model Type 1 Type 2 Type 3 Type 4 Type 5 Type 6 Type 7 Type 11 Type 12 Type 13 Type 14 Type 15 TotalYear
(kWh/yr.)1990 706.2 720.0 947.4 1321.4 1128.4 – – 337.0 – 370.0 – – 956.21991 685.0 636.0 923.2 1218.8 1140.0 – 1162.9 337.0 – 370.0 – – 931.21992 696.5 464.8 873.5 1215.1 1160.4 – 1175.5 337.0 – 370.0 507.0 – 901.71993 512.4 477.4 702.4 889.3 782.5 772.2 953.2 337.0 – 370.0 – – 719.61994 461.8 465.0 640.5 764.0 741.8 763.4 891.5 328.7 – 370.0 – – 650.41995 382.7 465.0 630.8 768.6 752.6 743.4 865.6 330.6 – 370.0 – – 641.61996 378.4 465.0 620.8 767.7 776.9 781.2 833.7 318.1 – 370.0 – – 640.41997 397.2 465.0 635.0 773.7 631.1 818.9 860.6 317.0 – 370.0 – – 656.51998 422.3 478.2 640.9 792.3 673.2 839.9 870.0 320.8 419.0 432.1 – – 653.51999 403.7 – 635.9 798.7 665.1 771.6 870.9 322.4 419.0 430.0 – – 645.52000 413.2 – 629.3 781.1 660.9 742.9 862.8 323.4 419.0 430.0 – – 639.52001 403.0 – 544.1 701.2 610.2 707.2 725.9 330.6 419.0 430.0 – – 559.42002 323.5 – 485.6 646.9 547.0 604.1 659.2 331.1 419.0 405.0 – – 506.32003 321.0 – 460.8 625.2 522.4 553.5 636.7 323.1 419.0 326.7 – 463.0 487.12004 – – 458.4 682.6 496.0 554.0 619.8 321.3 419.0 356.7 – – 477.7
TABLE C.8Average Annual Unit Energy Consumption of Refrigerators by Volume
Model 0– 2.5– 4.5– 6.5– 8.5– 10.5– 12.5– 14.5– 16.5– 18.5– 20.5– 22.5– 24.5– 26.5– 28.5– 30.5–Year 2.4 4.4 6.4 8.4 10.4 12.4 14.4 16.4 18.4 20.4 22.4 24.4 26.4 28.4 30.4 32.4
1990 – – 367 – 716 740 850 955 1067 1133 1041 1478 1416 – – –1991 – – 366 – 658 727 877 915 1018 978 950 1481 1371 – – –1992 – – 367 465 478 697 750 924 940 998 1047 1269 1400 1486 – –1993 – – 367 465 440 593 600 700 731 799 848 939 1004 1228 1110 –1994 308 336 365 465 407 563 547 627 665 720 805 906 856 1206 1105 –1995 308 336 364 465 383 554 540 626 662 715 775 872 829 1123 977 –1996 304 330 364 461 385 547 570 631 646 680 731 894 885 1051 1070 –1997 299 315 338 440 400 548 567 632 664 695 716 924 901 923 1092 –1998 299 322 436 385 415 564 562 629 675 703 722 853 883 860 983 –1999 287 324 430 483 500 552 575 629 666 667 723 833 900 844 977 –2000 283 325 430 503 521 550 583 625 667 637 696 809 894 820 976 –2001 281 333 430 503 521 502 493 562 582 534 594 689 749 698 919 –2002 278 333 405 502 421 433 428 480 521 489 543 664 677 669 839 7102003 299 325 348 – 420 429 424 449 475 496 535 660 641 662 660 7442004 366 323 390 – 424 432 420 455 465 487 518 644 609 654 627 639
(kWh/yr.)
(cu. ft.)

Appendix C TABLES
Energy Consumption of Major Household Appliances Shipped in Canada 64
TABLE C.10Average Annual Unit EnergyConsumption of Refrigerators byChannel, by Region/Province, 2004
Region Builder Retail
(kWh/yr.)Canada 464.3 480.7Atlantic 463.8 477.8Quebec 455.6 471.7Ontario 451.9 489.0Prairies 477.8 497.1British Columbiaand Territories 483.3 469.2
TABLE C.9Average Annual Unit Energy Consumption per Cubic Foot of Refrigerators by Volume
Model 4.5– 6.5– 8.5– 10.5– 12.5– 14.5– 16.5– 18.5– 20.5– 22.5– 24.5– 26.5– 28.5– 30.5–Year 6.4 8.4 10.4 12.4 14.4 16.4 18.4 20.4 22.4 24.4 26.4 28.4 30.4 32.4
1990 67 – 76 65 63 62 61 58 49 63 56 – – –1991 67 – 70 64 65 59 58 50 44 63 54 – – –1992 67 62 51 61 56 60 54 51 49 54 55 54 – –1993 67 62 47 52 45 45 42 41 40 40 39 45 38 –1994 67 62 43 49 41 41 38 37 38 39 34 44 38 –1995 67 62 41 48 40 41 38 37 36 37 33 41 33 –1996 67 62 41 48 42 41 37 35 34 38 35 38 36 –1997 62 59 42 48 42 41 38 36 33 39 35 34 37 –1998 80 52 44 49 42 41 39 36 34 36 35 31 33 –1999 79 65 53 48 43 41 38 34 34 36 35 31 33 –2000 79 67 55 48 43 40 38 33 32 35 35 30 33 –2001 79 68 55 44 37 36 33 27 28 29 29 25 31 –2002 74 67 45 38 32 31 30 25 25 28 27 24 28 232003 64 – 44 38 32 29 27 26 25 28 25 24 22 242004 72 – 45 38 31 29 27 25 24 27 24 24 21 20
cu. ft.
(kWh/yr.)

Appendix C TABLES
65 Trends for 1990-2004
TABLE C.11Distribution of RefrigeratorsConsuming Less Than40 kWh/cu. ft./yr., 2004
Region Builder Retail
% %
Canada 96.9 92.8Atlantic 83.0 98.0Quebec 91.6 95.6Ontario 98.2 93.8Prairies 98.9 98.4British Columbiaand Territories 96.6 80.2
TABLE C.12Energy Savings for Refrigerators, 1992–2004
(PJ) (PJ) (PJ) (PJ)1992 1.22 1.22 0.00 0.001993 1.59 1.27 0.32 0.321994 1.80 1.30 0.50 0.821995 1.77 1.26 0.51 1.331996 1.80 1.28 0.52 1.861997 1.96 1.43 0.53 2.391998 2.24 1.63 0.62 3.011999 2.58 1.84 0.73 3.742000 2.51 1.78 0.73 4.472001 2.63 1.63 1.00 5.472002 2.88 1.62 1.26 6.742003 2.93 1.59 1.35 8.092004 3.23 1.72 1.51 9.58
Energy Consumed Energy ConsumedWITHOUT WITH Manufacturers' Annual Cumulative
Model Manufacturers' Improvements, Energy Energy SavingsYear Improvements, the the MEPS and Savings (with retirement factor)
MEPS and Improvements Improvementsto the MEPS to the MEPS
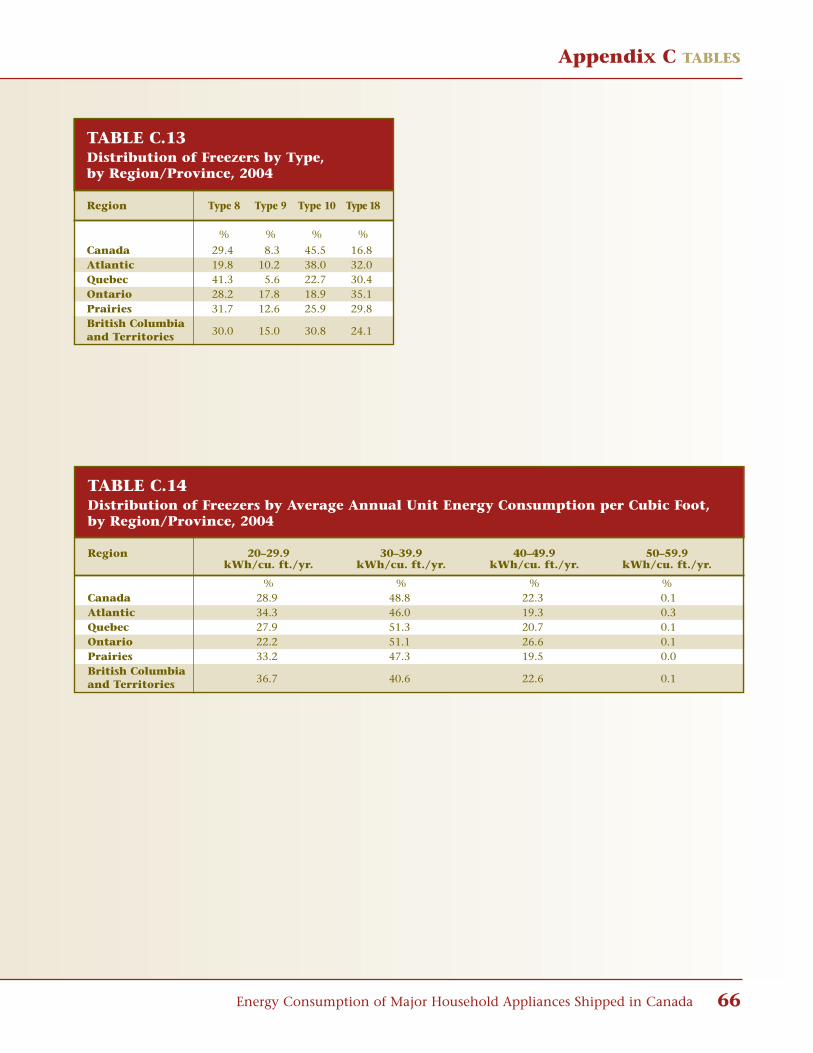
Appendix C TABLES
Energy Consumption of Major Household Appliances Shipped in Canada 66
TABLE C.13Distribution of Freezers by Type,by Region/Province, 2004
Region Type 8 Type 9 Type 10 Type 18
% % % %
Canada 29.4 8.3 45.5 16.8Atlantic 19.8 10.2 38.0 32.0Quebec 41.3 5.6 22.7 30.4Ontario 28.2 17.8 18.9 35.1Prairies 31.7 12.6 25.9 29.8British Columbiaand Territories 30.0 15.0 30.8 24.1
TABLE C.14Distribution of Freezers by Average Annual Unit Energy Consumption per Cubic Foot,by Region/Province, 2004
Region 20–29.9 30–39.9 40–49.9 50–59.9kWh/cu. ft./yr. kWh/cu. ft./yr. kWh/cu. ft./yr. kWh/cu. ft./yr.
% % % %Canada 28.9 48.8 22.3 0.1Atlantic 34.3 46.0 19.3 0.3Quebec 27.9 51.3 20.7 0.1Ontario 22.2 51.1 26.6 0.1Prairies 33.2 47.3 19.5 0.0British Columbiaand Territories 36.7 40.6 22.6 0.1
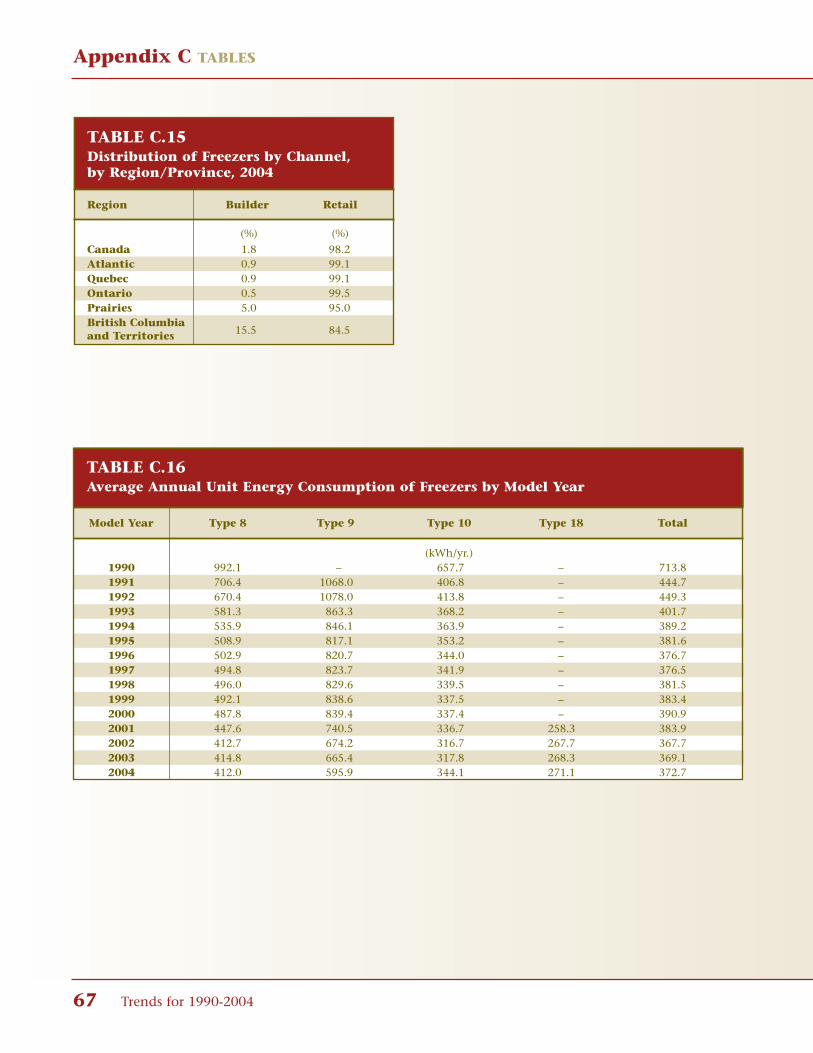
Appendix C TABLES
67 Trends for 1990-2004
TABLE C.15Distribution of Freezers by Channel,by Region/Province, 2004
Region Builder Retail
(%) (%)
Canada 1.8 98.2Atlantic 0.9 99.1Quebec 0.9 99.1Ontario 0.5 99.5Prairies 5.0 95.0British Columbiaand Territories 15.5 84.5
TABLE C.16Average Annual Unit Energy Consumption of Freezers by Model Year
Model Year Type 8 Type 9 Type 10 Type 18 Total
(kWh/yr.)1990 992.1 – 657.7 – 713.81991 706.4 1068.0 406.8 – 444.71992 670.4 1078.0 413.8 – 449.31993 581.3 863.3 368.2 – 401.71994 535.9 846.1 363.9 – 389.21995 508.9 817.1 353.2 – 381.61996 502.9 820.7 344.0 – 376.71997 494.8 823.7 341.9 – 376.51998 496.0 829.6 339.5 – 381.51999 492.1 838.6 337.5 – 383.42000 487.8 839.4 337.4 – 390.92001 447.6 740.5 336.7 258.3 383.92002 412.7 674.2 316.7 267.7 367.72003 414.8 665.4 317.8 268.3 369.12004 412.0 595.9 344.1 271.1 372.7

Appendix C TABLES
Energy Consumption of Major Household Appliances Shipped in Canada 68
TABLE C.17Energy Savings for Freezers, 1992–2004
(PJ) (PJ) (PJ) (PJ)1992 0.36 0.36 0.00 0.001993 0.38 0.34 0.04 0.041994 0.37 0.32 0.05 0.091995 0.32 0.28 0.05 0.141996 0.28 0.24 0.05 0.181997 0.31 0.26 0.05 0.231998 0.38 0.32 0.06 0.291999 0.40 0.34 0.06 0.352000 0.37 0.33 0.05 0.402001 0.38 0.32 0.06 0.452002 0.41 0.34 0.07 0.532003 0.40 0.33 0.07 0.602004 0.45 0.37 0.08 0.68
Energy Consumed Energy ConsumedWITHOUT WITH Manufacturers' Annual Cumulative
Model Manufacturers' Improvements, Energy Energy SavingsYear Improvements, the the MEPS and Savings (with retirement factor)
MEPS and Improvements Improvementsto the MEPS to the MEPS
TABLE C.18Distribution of Dishwashers by Average Annual Unit Energy Consumption,by Region/Province, 2004
Region 300–349.9 350–399.9 400–499.9 500–599.9 600–699.9kWh/yr. kWh/yr. kWh/yr. kWh/yr. kWh/yr.
(%) (%) (%) (%) (%)Canada 4.0 24.3 46.4 16.5 8.8Atlantic 9.0 21.3 37.6 17.6 14.5Quebec 4.0 28.0 43.0 17.7 7.5Ontario 4.6 22.7 48.5 16.4 7.8Prairies 2.7 23.5 48.5 15.5 9.8British Columbiaand Territories 3.4 24.1 45.6 16.1 10.9
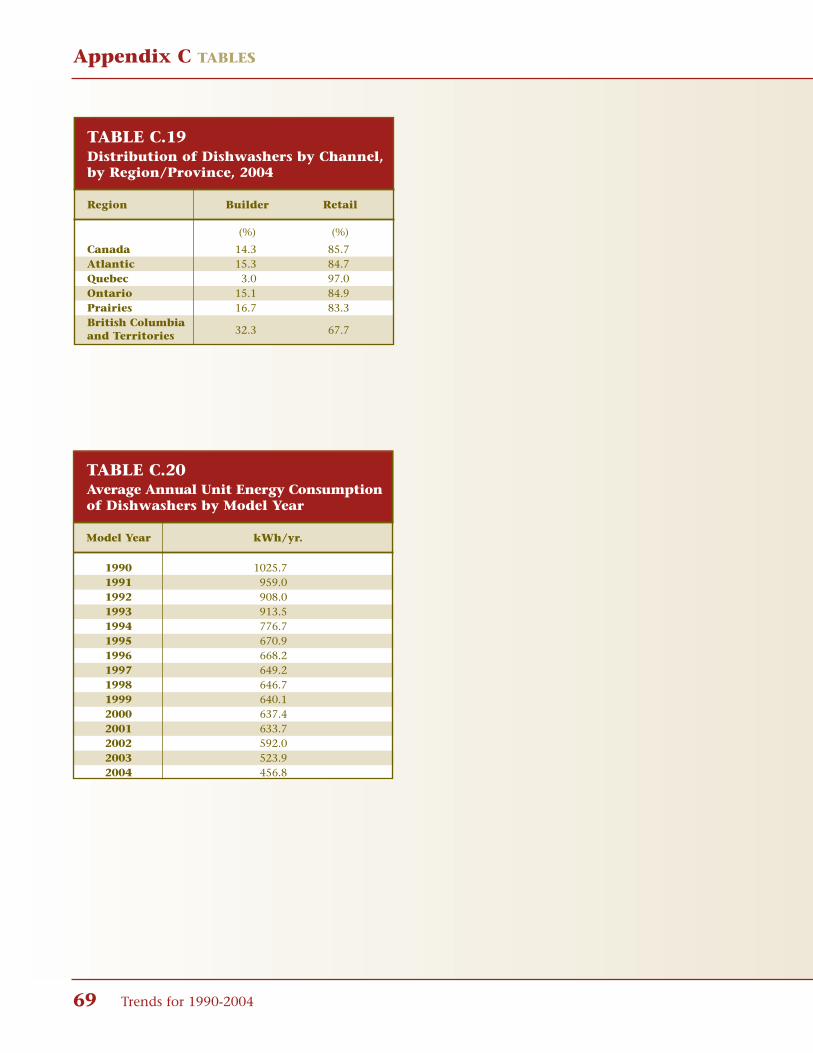
Appendix C TABLES
69 Trends for 1990-2004
TABLE C.19Distribution of Dishwashers by Channel,by Region/Province, 2004
Region Builder Retail
(%) (%)
Canada 14.3 85.7Atlantic 15.3 84.7Quebec 3.0 97.0Ontario 15.1 84.9Prairies 16.7 83.3British Columbiaand Territories 32.3 67.7
TABLE C.20Average Annual Unit Energy Consumptionof Dishwashers by Model Year
Model Year kWh/yr.
1990 1025.71991 959.01992 908.01993 913.51994 776.71995 670.91996 668.21997 649.21998 646.71999 640.12000 637.42001 633.72002 592.02003 523.92004 456.8
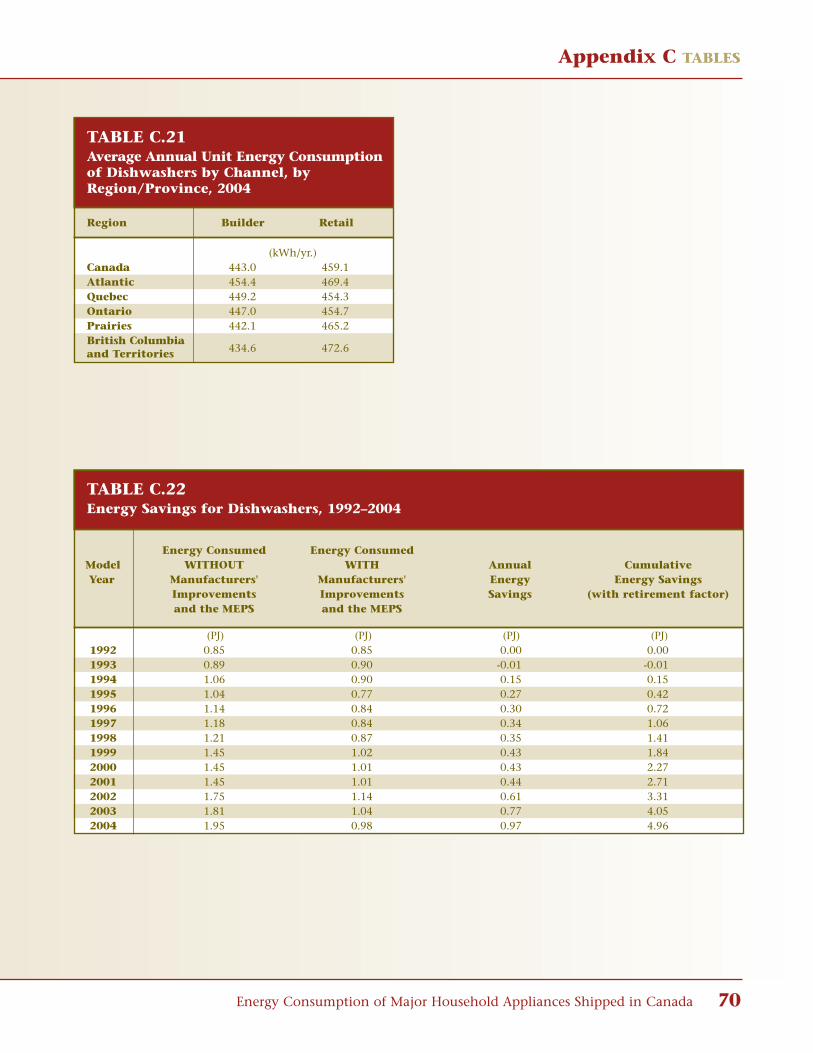
Appendix C TABLES
Energy Consumption of Major Household Appliances Shipped in Canada 70
TABLE C.21Average Annual Unit Energy Consumptionof Dishwashers by Channel, byRegion/Province, 2004
Region Builder Retail
(kWh/yr.)Canada 443.0 459.1Atlantic 454.4 469.4Quebec 449.2 454.3Ontario 447.0 454.7Prairies 442.1 465.2British Columbiaand Territories 434.6 472.6
TABLE C.22Energy Savings for Dishwashers, 1992–2004
(PJ) (PJ) (PJ) (PJ)1992 0.85 0.85 0.00 0.001993 0.89 0.90 -0.01 -0.011994 1.06 0.90 0.15 0.151995 1.04 0.77 0.27 0.421996 1.14 0.84 0.30 0.721997 1.18 0.84 0.34 1.061998 1.21 0.87 0.35 1.411999 1.45 1.02 0.43 1.842000 1.45 1.01 0.43 2.272001 1.45 1.01 0.44 2.712002 1.75 1.14 0.61 3.312003 1.81 1.04 0.77 4.052004 1.95 0.98 0.97 4.96
Energy Consumed Energy ConsumedModel WITHOUT WITH Annual CumulativeYear Manufacturers' Manufacturers' Energy Energy Savings
Improvements Improvements Savings (with retirement factor)and the MEPS and the MEPS

Appendix C TABLES
71 Trends for 1990-2004
TABLE C.23Distribution of Electric Ranges by Type,by Region/Province, 2004
Region Self- Non-Self-Cleaning Cleaning
% %Canada 57.7 42.3Atlantic 46.3 53.7Quebec 59.6 40.4Ontario 55.7 44.3Prairies 60.3 39.7British Columbiaand Territories 59.3 40.7
TABLE C.24Distribution of Electric Ranges by Average Annual Unit Energy Consumption,by Region/Province, 2004
Region <500 500–599.9 600–649.9 650–699.9 700–749.9 750–799.9 800–849.9kWh/yr. kWh/yr. kWh/yr. kWh/yr. kWh/yr. kWh/yr. kWh/yr.
% % % % % % %Canada 27.8 13.3 4.8 3.8 18.8 19.5 12.0Atlantic 18.4 14.6 2.3 3.3 14.9 24.6 22.0Quebec 30.9 15.0 4.1 4.1 18.1 16.0 11.8Ontario 25.9 12.3 5.0 4.6 17.8 21.7 12.7Prairies 32.3 14.7 5.0 2.3 18.8 17.8 9.1British Columbiaand Territories 19.3 7.1 6.8 3.0 28.6 23.6 11.6

Appendix C TABLES
Energy Consumption of Major Household Appliances Shipped in Canada 72
TABLE C.25Distribution of Electric Ranges byChannel, by Region/Province, 2004
Region Builder Retail
(%) (%)
Canada 21.5 78.5Atlantic 19.5 80.5Quebec 6.6 93.4Ontario 28.2 71.8Prairies 22.6 77.4British Columbiaand Territories 42.8 57.2
TABLE C.26Average Annual Unit Energy Consumptionof Electric Ranges by Model Year
Model Year Non-Self Self- Total-Cleaning Cleaning
(kWh/yr.)1990 785.7 726.8 772.21991 787.4 755.1 778.11992 788.3 754.1 778.61993 795.2 751.5 782.11994 785.4 746.6 773.61995 778.3 756.4 771.31996 780.3 762.5 774.41997 780.2 758.5 772.41998 778.5 759.6 770.81999 770.3 741.8 758.72000 770.7 746.3 759.92001 785.7 741.2 762.52002 783.9 735.2 756.02003 732.1 691.0 709.42004 694.1 622.4 652.7
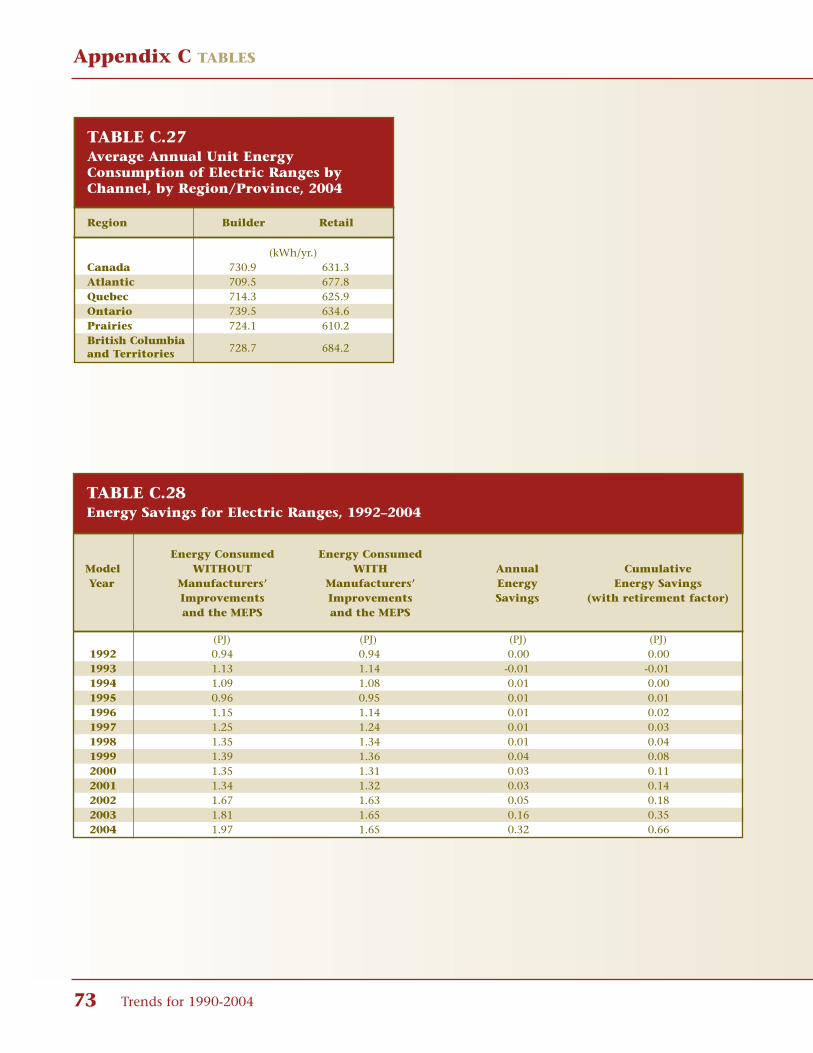
Appendix C TABLES
73 Trends for 1990-2004
TABLE C.27Average Annual Unit EnergyConsumption of Electric Ranges byChannel, by Region/Province, 2004
Region Builder Retail
(kWh/yr.)Canada 730.9 631.3Atlantic 709.5 677.8Quebec 714.3 625.9Ontario 739.5 634.6Prairies 724.1 610.2British Columbiaand Territories 728.7 684.2
TABLE C.28Energy Savings for Electric Ranges, 1992–2004
(PJ) (PJ) (PJ) (PJ)1992 0.94 0.94 0.00 0.001993 1.13 1.14 -0.01 -0.011994 1.09 1.08 0.01 0.001995 0.96 0.95 0.01 0.011996 1.15 1.14 0.01 0.021997 1.25 1.24 0.01 0.031998 1.35 1.34 0.01 0.041999 1.39 1.36 0.04 0.082000 1.35 1.31 0.03 0.112001 1.34 1.32 0.03 0.142002 1.67 1.63 0.05 0.182003 1.81 1.65 0.16 0.352004 1.97 1.65 0.32 0.66
Energy Consumed Energy ConsumedModel WITHOUT WITH Annual CumulativeYear Manufacturers’ Manufacturers’ Energy Energy Savings
Improvements Improvements Savings (with retirement factor)and the MEPS and the MEPS

Appendix C TABLES
Energy Consumption of Major Household Appliances Shipped in Canada 74
TABLE C.29Distribution of Clothes Washersby Type, by Region/Province, 2004
Region Front- Top-Loading Loading
% %Canada 29.2 70.8Atlanticand Quebec
22.8 77.2
Ontario 27.7 72.3Prairies 28.9 71.1British Columbiaand Territories 30.2 69.8
TABLE C.30Distribution of Clothes Washers by Average Annual Unit Energy Consumption,by Region/Province, 2004
Region <500 500–599.9 600–699.9 700–799.9 800–899.9 900–999.9 >1000kWh/yr. kWh/yr. kWh/yr. kWh/yr. kWh/yr. kWh/yr. kWh/yr.
% % % % % % %Canada 38.2 16.6 10.0 8.3 10.2 16.7 0.0Atlanticand Quebec
29.2 19.9 8.5 8.7 11.6 22.1 0.0
Ontario 40.7 16.5 11.6 6.9 9.9 14.3 0.0Prairies 38.0 16.5 10.0 9.1 12.0 14.3 0.0British Columbiaand Territories 38.8 11.0 16.8 7.4 5.7 20.3 0.0

Appendix C TABLES
75 Trends for 1990-2004
Table C.31Distribution of Clothes Washers byChannel, by Region/Province, 2004
Region Builder Retail
(%) (%)Canada 5.8 94.2Atlanticand Quebec
2.0 98.0
Ontario 6.4 93.6Prairies 8.5 91.5British Columbiaand Territories 18.5 81.5
TABLE C.32Average Annual Unit Energy Consumptionof Clothes Washers by Model Year
(kWh/yr.)1990 – – 1218.01991 – – 1197.41992 – – 1175.51993 – – 1094.11994 – – 989.11995 – – 965.91996 – – 948.71997 – – 930.11998 – – 903.31999 288.09 912.96 859.92000 274.23 922.66 838.32001 286.96 904.65 810.12002 300.55 871.06 779.22003 274.77 826.94 708.42004 258.41 702.31 572.9
Model Front- Top- TotalYear Loading Loading

Appendix C TABLES
Energy Consumption of Major Household Appliances Shipped in Canada 76
TABLE C.33Average Annual Unit Energy Consumptionof Clothes Washers by Channel, byRegion/Province, 2004
Region Builder Retail
(kWh/yr.)Canada 653.0 568.0Atlanticand Quebec
651.1 629.0
Ontario 641.0 550.7Prairies 706.3 556.0British Columbiaand Territories 590.7 585.3
TABLE C.34Energy Savings for Clothes Washers, 1992–2004
(PJ) (PJ) (PJ) (PJ)1992 1.70 1.70 0.00 0.001993 1.80 1.67 0.12 0.121994 1.94 1.64 0.31 0.431995 1.84 1.51 0.33 0.761996 1.93 1.56 0.37 1.131997 2.14 1.69 0.45 1.581998 2.16 1.66 0.50 2.081999 2.43 1.78 0.65 2.732000 2.50 1.78 0.72 3.452001 2.60 1.79 0.81 4.262002 2.81 1.87 0.95 5.202003 2.92 1.76 1.16 6.322004 3.10 1.51 1.59 7.84
Energy Consumed Energy ConsumedModel WITHOUT WITH Annual CumulativeYear Manufacturers' Manufacturers' Energy Energy Savings
Improvements Improvements Savings (with retirement factor)and the MEPS and the MEPS
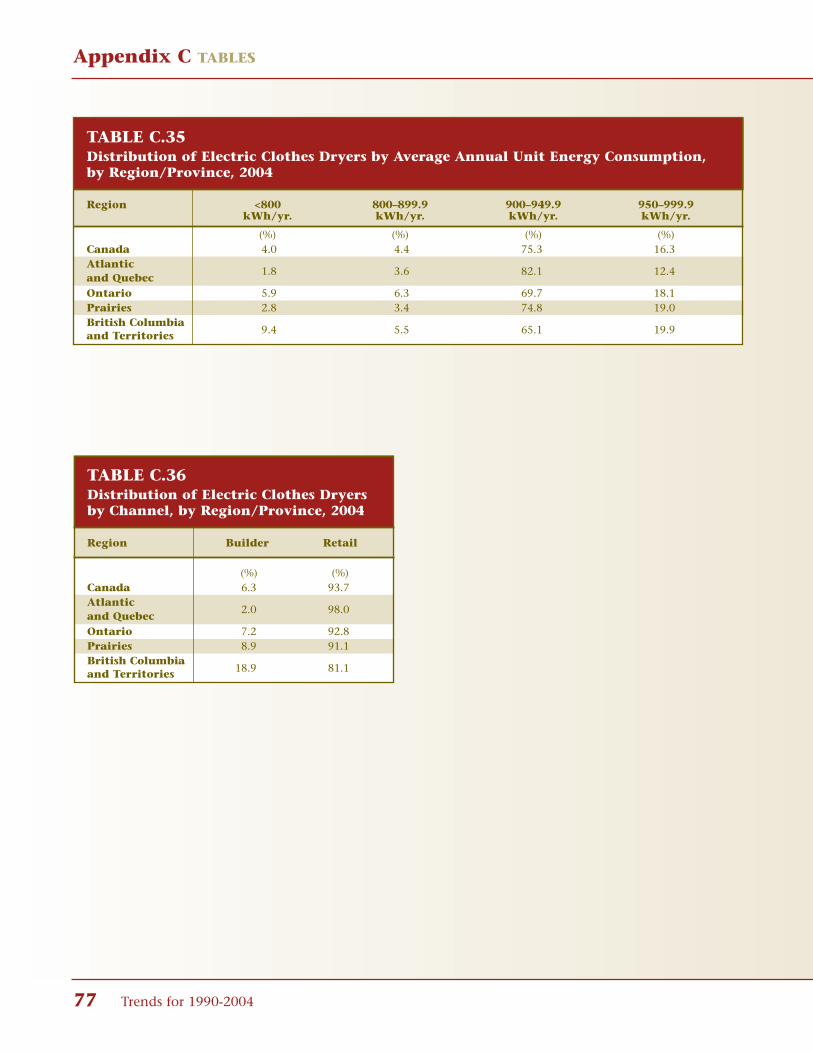
Appendix C TABLES
77 Trends for 1990-2004
TABLE C.35Distribution of Electric Clothes Dryers by Average Annual Unit Energy Consumption,by Region/Province, 2004
Region <800 800–899.9 900–949.9 950–999.9kWh/yr. kWh/yr. kWh/yr. kWh/yr.
(%) (%) (%) (%)Canada 4.0 4.4 75.3 16.3Atlanticand Quebec
1.8 3.6 82.1 12.4
Ontario 5.9 6.3 69.7 18.1Prairies 2.8 3.4 74.8 19.0British Columbiaand Territories 9.4 5.5 65.1 19.9
TABLE C.36Distribution of Electric Clothes Dryersby Channel, by Region/Province, 2004
Region Builder Retail
(%) (%)Canada 6.3 93.7Atlanticand Quebec
2.0 98.0
Ontario 7.2 92.8Prairies 8.9 91.1British Columbiaand Territories 18.9 81.1

Appendix C TABLES
Energy Consumption of Major Household Appliances Shipped in Canada 78
TABLE C.37Average Annual Unit Energy Consumptionof Electric Clothes Dryers by Model Year
Model Year kWh/yr.
1990 1102.61991 1108.71992 983.31993 928.51994 910.41995 909.11996 887.41997 887.31998 900.21999 907.52000 909.82001 916.32002 915.62003 914.22004 911.9
TABLE C.38Average Annual Unit Energy Consumptionof Electric Clothes Dryers by Channel,by Region/Province, 2004
Region Builder Retail
(kWh/yr.)Canada 843.1 916.5Atlanticand Quebec
836.2 924.1
Ontario 817.1 907.7Prairies 870.1 923.6British Columbiaand Territories 851.3 892.1

Appendix C TABLES
79 Trends for 1990-2004
TABLE C.39Energy Savings for Electric Clothes Dryers 1992–2004
(PJ) (PJ) (PJ) (PJ)1992 1.23 1.23 0.00 0.001993 1.27 1.20 0.07 0.071994 1.31 1.21 0.10 0.171995 1.15 1.07 0.09 0.251996 1.27 1.15 0.12 0.381997 1.39 1.26 0.14 0.511998 1.41 1.29 0.12 0.631999 1.59 1.47 0.12 0.762000 1.64 1.52 0.12 0.882001 1.73 1.62 0.12 1.002002 1.96 1.82 0.13 1.132003 2.02 1.88 0.14 1.272004 2.18 2.02 0.16 1.43
Energy Consumed Energy ConsumedModel WITHOUT WITH Annual CumulativeYear Manufacturers' Manufacturers' Energy Energy Savings
Improvements Improvements Savings (with retirement factor)and the MEPS and the MEPS
TABLE C.40Energy Savings for All Major Appliances, 1992–2004
(PJ) (PJ) (PJ) (PJ)1992 6.30 6.30 0.00 0.001993 7.05 6.51 0.55 0.551994 7.57 6.45 1.12 1.661995 7.09 5.84 1.26 2.921996 7.58 6.21 1.37 4.291997 8.23 6.72 1.51 5.801998 8.75 7.10 1.66 7.461999 9.84 7.81 2.03 9.492000 9.81 7.73 2.08 11.572001 10.15 7.70 2.45 14.022002 11.49 8.41 3.08 17.092003 11.90 8.25 3.65 20.682004 12.88 8.25 4.63 25.16
Energy Consumed Energy ConsumedModel WITHOUT WITH Annual CumulativeYear Manufacturers' Manufacturers' Energy Energy Savings
Improvements Improvements Savings (with retirement factor)and the MEPS and the MEPS