how does graduate education affect inventive … · · 2018-03-20† this study is conducted as a...
TRANSCRIPT
DPRIETI Discussion Paper Series 18-E-016
How does Graduate Education Affect Inventive Performance? Evidence from undergraduates' choices during recessions
ONISHI KoichiroOsaka Institute of Technology
NAGAOKA SadaoRIETI
The Research Institute of Economy, Trade and Industryhttp://www.rieti.go.jp/en/

1
RIETI Discussion Paper Series 18-E-016
March 2018
How does Graduate Education Affect Inventive Performance? Evidence from undergraduates’ choices during recessions†
ONISHI Koichiro
Osaka Institute of Technology
NAGAOKA Sadao
RIETI/Tokyo Keizai University
Abstract: This paper investigates the effects of graduate education on inventive performance, as well
as the underlying mechanisms, using inventor life-cycle data to focus on the factors affecting the
capability of an inventor to absorb and combine diverse external knowledge. In order to control for
endogeneity in the choice of graduate education, we use as an instrument the unemployment rate of
college graduates in the year preceding the graduation of the focal inventor, as well as in the academic
field in which the inventor is specialized. Our first-stage estimation results show that a college student
who graduates under adverse labor market conditions chooses much more frequently to pursue a
graduate degree. This instrument is also likely to satisfy the exclusion restriction, since our dependent
variables are long-run inventor activities. We find that graduate education induced by this instrument
significantly enhances inventive performance, as measured by the level and scope of forward citations
and the number of patent applications. It also significantly enhances the scope of knowledge exploited
for inventive processes, both in the use of scientific knowledge as well as in the scope of knowledge
cited in the prior patent literature.
Keywords: Invention, Graduate education, Knowledge exploitation, Patent, Recession
JEL Classifications: O31, O34, I21
† This study is conducted as a part of the project “Study on Industrial Innovation Capability and Innovation Infrastructure” undertaken at the Research Institute of Economy, Trade and Industry (RIETI). Financial support from JSPS KAKENHI Grant Number JP15K03486 and JP26285055 is gratefully acknowledged. We acknowledge comments received from Adam Jaffe, Shoko Haneda, Hidehiko Ichimura, Masayo Kani, Masatoshi Kato, Yoichiro Nishimura, Hiroyuki Odagiri, Yoshimi Okada, Yosuke Okada, Jun Suzuki, Naotoshi Tukada, Tetsuo Wada, Isamu Yamauchi, Makoto Yano, and the other participants in the RIETI seminar. We also gratefully thank Norimasa Sugiyama, who constructed the database of PhD holders.
RIETI Discussion Papers Series aims at widely disseminating research results in the form of professional
papers, thereby stimulating lively discussion. The views expressed in the papers are solely those of the
author(s), and neither represent those of the organization to which the author(s) belong(s) nor the
Research Institute of Economy, Trade and Industry.

2
1. Introduction
Human resources are often seen as the central pillar of the creation of inventions and, therefore, of
knowledge-based economic growth. On the theoretical front, endogenous growth theory identifies the
number of highly educated persons in a society as a key determinant of the growth rate (as pioneered
by Romer 1990). Many countries, including emerging as well as developed countries, have expanded
graduate education programs (master’s and PhD courses) based on this view (OECD 2016, p.146).
Despite the widespread belief in graduate education’s role in enhancing inventive performance, there
is surprisingly little empirical support for this conjecture1 . Furthermore, existing studies have not
focused on how graduate education programs affect inventors’ skills and their innovation processes.
To fill these gaps, we analyze the effects of graduate education not only on inventive
productivity, but also on the scope of knowledge sources that inventors use in their inventive processes.
We expect that obtaining higher education enhances their inventive performance. We also expect that
graduate education improves their inventive process by enabling them to learn how to absorb and
combine knowledge from more diverse sources. The ability to absorb scientific advances seems to be
of particular importance as a determinant of the innovative capability of a firm (Cohen and Levinthal
1990; March 1991). Further, since innovation is often based on recombinations of existing knowledge
(Schumpeter 1934; Weitzman 1998), one can expect that the inventive performance of the better
educated will be higher than those with less education, if the former can combine existing knowledge
more effectively. On the other hand, successful technologies and ideas have often been noted to arise
without being influenced by existing science or knowledge (Price 1965).
To confirm these expectations, we focus on detailed Japanese inventor information derived
from the RIETI Inventor Survey. We gathered all the available life-cycle patent applications these
inventors had applied for the Japan Patent Office in order to capture the histories of their inventive
activities. The two databases are then matched using inventor’s name, address and other details. We
obtain the data on individuals’ final educational degrees and their demographic information mainly
from the RIETI Inventor Survey. Further, we measure the scope of knowledge that inventors utilize
and their inventive performance using patent applications and their citation data, which are commonly
recognized as useful indicators. One advantage of using Japanese patent data is that typical Japanese
companies have a much higher patenting propensity than their US counterparts (Cohen et al. 2002);
also, the JPO publishes all patent applications, like the EPO, but in contrast with the USPTO. Therefore,
we can more easily trace the profiles of inventors’ inventive activities than is possible with other patent
data sources2.
1 One notable exception is Toivanen and Väänänen (2016), but they focus on undergraduates rather than graduates or PhDs. 2 A comparison of similar studies that gather inventors’ overall life-cycle patents shows that the number of patents per inventor in our sample is 39.1, which is much higher than 14.7 in Hoisl (2007) using EPO patent data and 1.2–1.4 in Toivanen and Väänänen (2012), using data on US patent applications made by Finnish inventors. The number of patents per inventor depends on the time window on which a study focuses. For example, Toivanen and Väänänen (2012) used 1988–1996, which is half the length of our study period, covering 1991–2007. Consequently, the mean of patenting in our study is more than 40 times larger than that of their study.

3
Obtaining causal evidence on such educational effects is challenging, because the choice of
level of education by an individual is endogenous to the unobserved characteristics of each such person.
We expect that individuals with high ability will generally choose higher levels of education, due to
the higher returns they anticipate from this investment. To control for this endogeneity, we propose to
use as an instrument the unemployment rate of college graduates in the year preceding the graduation
of the focal inventor, as well as within the academic field in which the inventor is specialized3 .
Choosing to go to graduate school seems to be an important choice for college graduates who face a
negative labor market situation at the time of graduation, since they can occupy their time with
graduate school until the labor market recovers. Prior studies found that labor market conditions affect
enrolment for graduate school and PhD courses in the US (Bedard and Herman 2006; Johnson 2013;
Shu et al. 2012). Further, Kondo (2007) finds a negative correlation between labor market conditions
and the propensity to go to college of high school students in Japan. Thus, we can expect that labor
market conditions for college graduates significantly influence the probability that college graduates
go to graduate schools. This instrument, based on the labor market conditions at the time of college
graduation, is also likely to satisfy the exclusion restriction for the long-run inventive activities studied,
since we use a common window (1992 to 2007) for assessing the long-run inventive outputs of all
inventors, using cohort dummies4. Our study provides several validations of this exclusion restriction.
In the estimation, we find that higher unemployment rates at that age and in that field
significantly increased the inventor’s choice of seeking a graduate degree. Further, this finding satisfies
robustness checks5. After controlling for the endogeneity of the choice for graduate school education,
we find that graduate education significantly enhanced invention performance, measured by the level
and the scope of forward citations (referred to as the “generality” of a patent) and the number of patent
applications. It also significantly enhanced the scope of knowledge exploited for inventions,
comprising the use of scientific knowledge as well as the scope of the technical knowledge disclosed
in prior patent documents (“originality”). These results indicate that a government policy supporting
students who wish to acquire higher degrees will have a substantial impact on national innovative
capability. Interestingly, our study suggests that a recession has a positive impact on future innovative
performance through encouraging students to enter graduate school. The results also suggest that
employing graduates with higher degrees will strengthen the capability of a firm to absorb broader
3 This idea is borrowed from labor economics literature (Heckman, Lochner and Todd 2006; Neumark 2002). Heckman et al. (2006) proposed the local unemployment rate as an attractive instrument for years of education in a wage equation, since this variable affects the opportunity cost for further education, but not the long-term income performance. 4 While a temporary demand-side shock to the college graduate labor market would affect the educational choice of a college graduate, this study assesses inventors’ performances based on their patent applications made from 1992 to 2007, a common window for all inventors under our study. Thus, most of the focal inventors face a common external environment in terms of market demand and technological opportunity. As a result, such temporary demand-side shocks will significantly affect the long-run performance of an inventor, relative to that of an inventor with only an undergraduate degree, only through the choice of going to a graduate school. 5 We find similar results using local labor market conditions as an instrument as a robustness check. Our preferred instrument is the unemployment rate for the corresponding academic subject level, because the college graduate labor market is essentially national. At the same time, however, we do find that local labor market conditions also affect undergraduate students’ choices.

4
knowledge, as well as enhancing its inventive productivity.
The rest of the paper is organized as follows. The next section provides a brief review of the
literature on the relationship between education and inventive activities. Section 3 describes the data
and section 4 provides estimation methods. Section 5 presents the results, while section 6 discusses
the results and explains the conclusions.
2. Brief review of prior literature
Attaining graduate education seems to enhance the understanding of inventors of the knowledge stock
available and improve their ability to explore ideas and new knowledge, including greater familiarity
with the research tools available to address frontier research questions. As Jones (2009) indicated, if
the “burden of knowledge” has become a critical barrier against successful innovation, inventors must
spend more time or money to acquire state-of-the-art technology and training to absorb different
technological knowledge. Attending a master’s or PhD program may be one important channel for
achieving this. Stephan (2011) comprehensively discussed how PhDs working in industry contribute
to economic growth, quoting the former president of the National Academy of Sciences saying that
“the real agents of technology transfer from university laboratory were the students who took jobs in
the local biotech industry.” Thus, one can expect that corporate researchers with PhDs contribute to
bring fresh knowledge from scientific communities to industry (Cockburn and Henderson 1998). In
this view, graduate education will increase inventive performance by accumulating existing
knowledge and enhancing absorptive ability with respect to scientific knowledge.
Only a few studies explore the relationship between attaining advanced education and
subsequent research output. Mariani and Romanelli (2007) and Kim, Lee and Marschke (2004) find
that inventors with PhD degrees make significantly greater numbers of patent applications, compared
with those with high school degrees. However, Hoisl (2007) shows that PhD inventors do not generate
more patent applications than non-PhDs, in terms of the life-cycle productivity of inventors. With
respect to quality, Schettino, Sterlacchini and Venturini (2008) report that patent quality increases with
the level of education. In contrast, Mariani and Romanelli (2007) find that there is no significant
difference in the level of citations per patent across education levels. Further, Shu et al. (2012) find
that the labor market conditions at graduation of MIT students affect their subsequent patent output;
and conclude that this positive correlation comes from their intensive accumulation of human capital
after graduation, such as attending graduate school, although they do not directly assess the effects of
graduate education. Finally, Onishi and Nagaoka (2012) use life-cycle data of Japanese inventors and
find that inventors who attained graduate degrees have higher productivity in terms of patent quantity
and quality. Unfortunately, since the above studies do not address the endogeneity of educational
choice, the positive correlation between graduate degree and higher patent productivity might have
come from inventors’ innate ability or from omitted variables affecting both attaining a PhD degree
and patent outputs.
Recently, Toivanen and Väänänen (2016) use Finnish inventor level data to analyze whether

5
increased opportunities for engineering university education through establishing technical
universities have enhanced the propensity to patent in Finland. They use the geographical distance to
university engineering education and its policy-induced reduction over time as the instruments driving
educational choice and controlling for its endogeneity. The results show significant causal effects of
university education on patent numbers and quality. Surprisingly, their study also shows a negative
selection bias: that is, those who have a high innate propensity for invention have a lower propensity
to study at a technical university. However, importantly, it remains to be investigated whether such
findings can be extended to graduate education, to establish whether obtaining graduate degrees by
college graduates is a more crucial issue for inventive activities than obtaining college degrees by high
school graduates, as well as assessing how graduate education enhances inventive performance.
As for the effects of education on knowledge consolidation, Gruber, Harhoff and Hoisl
(2013) empirically show that inventors with a scientific education tend to generate inventions that
recombine knowledge across technological domains more than inventors with an engineering
education. Further, they also find that inventors with higher educational attainment (especially PhDs)
have higher ability and skill to recombine different technologies, irrespective of the field of education.
Giuri and Mariani (2013) show that PhD holders gain more knowledge from geographically far distant
places than do less educated inventors. Unfortunately, these studies fail to rule out the possibility that
such correlations are driven by the endogenous choices of students with higher innate ability to choose
to obtain higher levels of education. Our study fills this gap by considering the causality between
advanced education and the utilization of knowledge sources.
3. Data
To examine the effect of educational attainment on inventive performance, we captured detailed
individual information and developed an invention life-cycle profile database for more than 2,300
Japanese inventors. The data on inventor-level information (level of education, field of study,
employment year, and gender) came from the RIETI Inventor Survey. This survey sent questionnaires
to quasi-randomly selected patent inventors requesting their demographic information as well as
details of their inventive processes6. The patents selected for the survey were applied for in the period
1995–2002. The effective response rate of the survey is 30.9% and 5,278 inventors responded. We
also gathered the entire stock of patent applications of these inventors in their life-cycle up to 2014
and matched the survey responses to this patent database, based on the inventor’s name, address, and
patent applicant information. We obtained the patent data from the IIP patent database, which covers
6 Around 70% of the focal patents are selected from triadic patents (granted in the US and applied for both in Japan and at the European Patent Office), which accounted for less than 10% of the patent applications in Japan. The rest are selected from non-triadic patents, which is close to a pure random sampling of the population. This indicates that the survey oversamples the respondent inventors having high ability. For a more detailed description of the sampling method, see Nagaoka and Tsukada (2007).

6
all patent applications made to the Japan Patent Office since 19647. To identify the patents invented
by the focal inventors in the survey—that is, to treat a unique person by avoiding persons with the
same name—we focus on inventors whose name are rare, judged by using the telephone directory8.
We define a name as rare if it is listed only once in the telephone directory. Further, we used only those
patent applications whose inventor’s name appears for only one company. This procedure makes
disambiguation very tight, because the probability of different persons with same name appearing
more than once in a particular company is then quite low, given that such a name appears nowhere
else. To confirm our procedure, we manually checked whether all patents gathered are matched to
genuine inventors based on the survey and patent information.
We exclude inventors who graduated with two years of college or less from our sample,
because we cannot specify their academic subject in the survey. We also exclude inventors who
qualified for their PhD degree only through their PhD dissertation, because they need neither to enter
PhD programs nor to obtain any formal education from graduate school. Further, some samples were
dropped in the process where the survey was matched to the unemployment rate data of college
students, which is commonly available from 1970. In order to match the unemployment rate of
graduates across the inventors’ subjects, we had to drop a few inventors whose subjects could not be
matched to a database for academic subjects. We also dropped some inventors who were born after
1970, because they have not had much time to obtain higher degrees. After this process, our final
sample is 2,308, among which bachelor’s degree holders account for 47%, master’s degree holders for
44%, and PhD holders for 9% (see Table A1).
To measure the patent output performance and the knowledge sources involved in the related
inventive activities, we use two patent citation datasets. One is prior patent documents cited by
inventors (not by patent examiners) in their patent documents. The other is non-patent literature cited
by them in the documents. These two datasets are all collected by a text-mining procedure from text
databases of patent documents. We obtain these noteworthy data from Alife-Lab9. Unfortunately, since
the text database is only available from patents that were disclosed after around 1991, we have to limit
the patent outputs collected to those years since 1992. Further, we place an upper bound on the year
of application to 2007 in order to solve the truncation problem involved with the use of forward
citations; this procedure means we can use a five-year citing period for all patent applications in
counting the frequencies of forward citations. That is, our time interval for aggregating inventors’
overall patent outputs for the following econometric analysis is the period from 1992 to 2007, which
forms a common window for all inventors under our study. Thus, most of the focal inventors face a
common external environment in terms of market demand and technological opportunities10. Finally,
7 The IIP patent database is provided by the Institute of Intellectual Property (IIP). This database includes bibliographic information on patents applied for at the Japan Patent Office. The database was first described by Goto and Motohashi (2007) and has been updated almost yearly by the IIP. The version we use in the study includes patent applications up to 2014. 8 We use the 2002 edition of the database provided by Nippon Telegraph and Telephone Corporation (NTT). 9 This database is available at: www.alife-lab.co.jp/patdb/construction.html. 10 A large majority (around 80%) of the inventors entered the labor market before the window period. Even if we use a
7
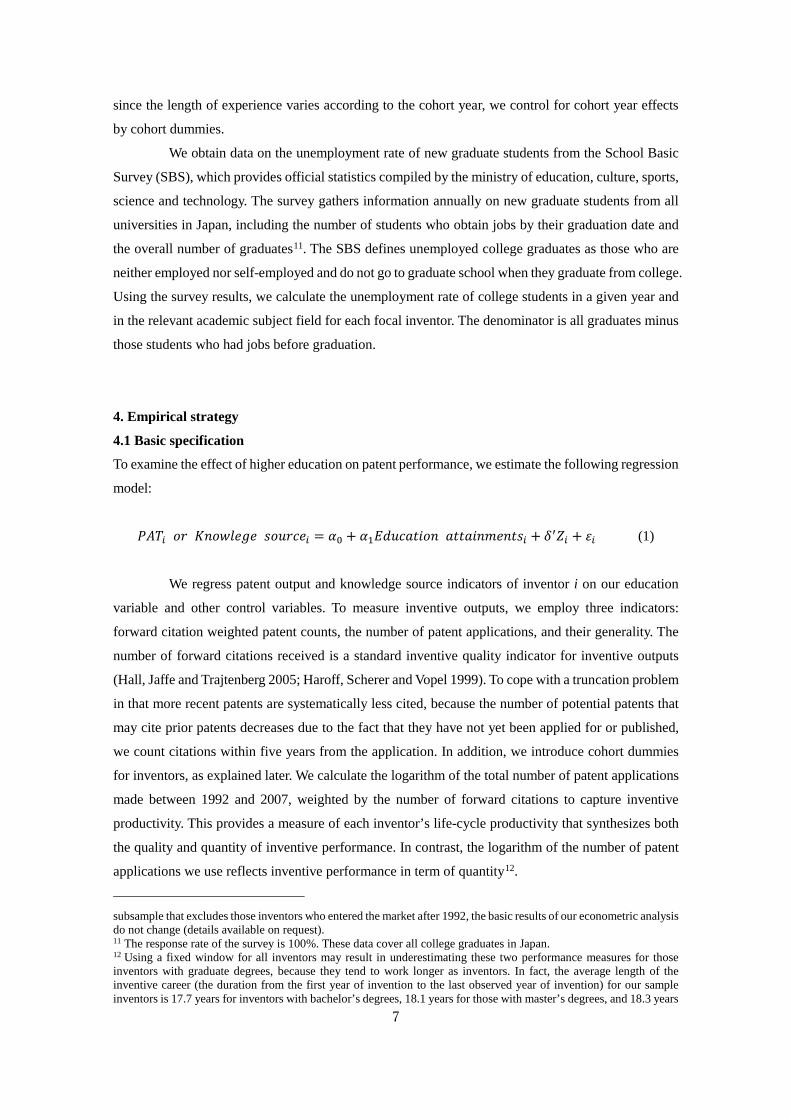
since the length of experience varies according to the cohort year, we control for cohort year effects
by cohort dummies.
We obtain data on the unemployment rate of new graduate students from the School Basic
Survey (SBS), which provides official statistics compiled by the ministry of education, culture, sports,
science and technology. The survey gathers information annually on new graduate students from all
universities in Japan, including the number of students who obtain jobs by their graduation date and
the overall number of graduates11. The SBS defines unemployed college graduates as those who are
neither employed nor self-employed and do not go to graduate school when they graduate from college.
Using the survey results, we calculate the unemployment rate of college students in a given year and
in the relevant academic subject field for each focal inventor. The denominator is all graduates minus
those students who had jobs before graduation.
4. Empirical strategy
4.1 Basic specification
To examine the effect of higher education on patent performance, we estimate the following regression
model:
𝑃𝑃𝑃𝑃𝑃𝑃𝑖𝑖 𝑜𝑜𝑜𝑜 𝐾𝐾𝐾𝐾𝑜𝑜𝐾𝐾𝐾𝐾𝐾𝐾𝐾𝐾𝐾𝐾 𝑠𝑠𝑜𝑜𝑠𝑠𝑜𝑜𝑠𝑠𝐾𝐾𝑖𝑖 = 𝛼𝛼0 + 𝛼𝛼1𝐸𝐸𝐸𝐸𝑠𝑠𝑠𝑠𝐸𝐸𝐸𝐸𝐸𝐸𝑜𝑜𝐾𝐾 𝐸𝐸𝐸𝐸𝐸𝐸𝐸𝐸𝐸𝐸𝐾𝐾𝑎𝑎𝐾𝐾𝐾𝐾𝐸𝐸𝑠𝑠𝑖𝑖 + 𝛿𝛿′𝑍𝑍𝑖𝑖 + 𝜀𝜀𝑖𝑖 (1)
We regress patent output and knowledge source indicators of inventor i on our education
variable and other control variables. To measure inventive outputs, we employ three indicators:
forward citation weighted patent counts, the number of patent applications, and their generality. The
number of forward citations received is a standard inventive quality indicator for inventive outputs
(Hall, Jaffe and Trajtenberg 2005; Haroff, Scherer and Vopel 1999). To cope with a truncation problem
in that more recent patents are systematically less cited, because the number of potential patents that
may cite prior patents decreases due to the fact that they have not yet been applied for or published,
we count citations within five years from the application. In addition, we introduce cohort dummies
for inventors, as explained later. We calculate the logarithm of the total number of patent applications
made between 1992 and 2007, weighted by the number of forward citations to capture inventive
productivity. This provides a measure of each inventor’s life-cycle productivity that synthesizes both
the quality and quantity of inventive performance. In contrast, the logarithm of the number of patent
applications we use reflects inventive performance in term of quantity12.
subsample that excludes those inventors who entered the market after 1992, the basic results of our econometric analysis do not change (details available on request). 11 The response rate of the survey is 100%. These data cover all college graduates in Japan. 12 Using a fixed window for all inventors may result in underestimating these two performance measures for those inventors with graduate degrees, because they tend to work longer as inventors. In fact, the average length of the inventive career (the duration from the first year of invention to the last observed year of invention) for our sample inventors is 17.7 years for inventors with bachelor’s degrees, 18.1 years for those with master’s degrees, and 18.3 years

8
The generality variable we use is the variable obtained by squaring the share of forward
citations made by patents across diversified technological areas in the total number of forward citations,
then summing the resulting numbers (i.e., obtaining the Herfindahl index) and finally subtracting this
sum from one, first introduced by Trajtenberg, Jaffe and Henderson (1997). We use the International
Patent Classification (IPC) subclass classification to capture technological areas. This variable
becomes low if the citations for the patent come from narrow technological areas. A higher generality
score shows that a patent had a broader impact on subsequent inventive activities.
We define the following three variables to capture the scope of knowledge source indicators:
the ratio of patents citing non-patent literature, the originality, and the self-citation rate. We first
calculate the ratio of the number of patents citing non-patent literature to the number of patents. A
significant number of inventors cite non-patent literature in their patent documents to clarify their
inventions. This literature almost entirely comprises scientific journals (Narin, Hamilton and Olivastro
1997; Meyer 2000; Tamada et al. 2006). If highly educated inventors have more capability to absorb
scientific knowledge for their inventive activities, they will cite more scientific literature in their
patents than others. One of the important roles of higher education is to develop the capability of the
students to understand scientific advances, and the cutting edge of such knowledge is generally
embodied in the scientific literature. We argue that non-patent literature cited in a patent is one
appropriate indicator to measure the outcome of higher education attainments13.
The originality is calculated by the same procedure as for the generality indicator, but using
backward citations. This index is low if a patent mostly cites patent literature in the same technological
area and is high in cases where a patent cites prior patent literature across many technological areas.
This variable is often used to measure the extent of recombination of knowledge across different
technology domains. If highly educated inventors obtain knowledge from broader technological areas,
educational attainment will be positively associated with this variable.
We use the external citations per patent to capture utilization by the focal inventor of the
relevant knowledge held by external inventors during the inventive process. Allen (1984) emphasized
that researchers often gain information by communicating with external researchers. This variable
captures these absorptions of external knowledge. We calculate it as the number of citations made to
patents of other companies relative to all citations. Thus, if inventors cite more external patents in their
patents, this indicator becomes high and vice versa.
We use two education attainment variables in equation (1). One is to count formal education
years above college for each degree; a master’s course is two years and a PhD course is five years.
The baseline is a bachelor’s degree. We further use a master’s degree or higher dummy, which has the
value one if the inventor attends master’s or PhD programs, otherwise zero. This variable captures the
for those with PhDs, if we do not impose the window (1992 to 2007). As is shown in Table A1, these values decline to 13.7 years, 13.5, years, and 12.7 years respectively once we impose the window. However, the effects are not so large, although a bias from this source works against us finding the positive effects of graduate education on inventive performance. 13 However, since this measure varies by technological area, we will control for major technology areas.

9
average effect of advanced degrees.
We use the following covariates to control for spurious correlations between inventive
performance and level of education. First, we use cohort dummies based on the first year of
employment, to control for experience effects on inventive performance as well as truncation effects
of forward citations. This also controls for variations in general economic conditions for inventive
activities across cohorts of inventors. Further, we use a female dummy that is set to one if an inventor
is female, otherwise zero. Finally, we also use six major technological area dummies, based on the
focal patents in the survey in the estimations, to control for the effects of the variations of technological
opportunities on incentives for higher education, as well as on the propensity to cite scientific literature.
The importance of scientific knowledge as a source of invention is different across technological areas;
for example, scientific journals are more important in life sciences than in mechanical areas, and the
probability of an inventor acquiring graduate degrees is also higher in the former area.
4.2 Identification
Since students with high innate ability are more likely to gain from higher education, they are more
likely to pursue graduate education. If this is the case, the positive association between education and
inventive productivity may not come from education, but from ability. This endogenous choice
problem will distort the OLS estimator for equation (1). To obtain a consistent estimator, the
instrumental variable approach is appropriate. As we have discussed above, we use the unemployment
rate of college graduates in academic subject j in year t as an instrument, as shown in the following
first stage equation:
𝐸𝐸𝐸𝐸𝑠𝑠𝑠𝑠𝐸𝐸𝐸𝐸𝐸𝐸𝑜𝑜𝐾𝐾 𝐸𝐸𝐸𝐸𝐸𝐸𝐸𝐸𝐸𝐸𝐾𝐾𝑎𝑎𝐾𝐾𝐾𝐾𝐸𝐸𝑠𝑠𝑖𝑖 = 𝛾𝛾0 + 𝛾𝛾1𝑈𝑈𝐾𝐾𝐾𝐾𝑎𝑎𝑈𝑈𝐾𝐾𝑜𝑜𝑈𝑈𝑎𝑎𝐾𝐾𝐾𝐾𝐸𝐸 𝑜𝑜𝐸𝐸𝐸𝐸𝐾𝐾 𝑜𝑜𝑜𝑜 𝐸𝐸ℎ𝐾𝐾 𝑠𝑠𝑜𝑜𝐾𝐾𝐾𝐾𝐾𝐾𝐾𝐾𝐾𝐾 𝐾𝐾𝑜𝑜𝐸𝐸𝐸𝐸𝑠𝑠𝐸𝐸𝐸𝐸𝐾𝐾𝑠𝑠𝑗𝑗𝑗𝑗
+𝛿𝛿′𝑍𝑍𝑖𝑖 + 𝜖𝜖𝑖𝑖𝑗𝑗𝑗𝑗 (2)
We use 33 academic subjects as j14, belonging to four major academic subjects (engineering, natural
science, health science and agriculture) and others15. The students’ decision year as t is given by the
year when the focal inventor is 21 years old. We assume that college students decide to go to graduate
school or enter the labor market at the age of 21 years, when typical college students have one year
before their college graduations. In other words, we assume that the students forecast the next year’s
labor market based on the current market situation. This seem a very reasonable assumption in Japan,
because the majority of students enter the university at 18 years of age and graduate when they are 22
years old16. Further, since entrance examinations for graduate schools take place in the first half of the
14 The list of subjects and the sample are presented in Table A2; 98.8% of inventors are from four major academic subjects in the sample. 15 The unemployment rate for each academic subject is an aggregated rate for all universities (the SBS does not provide data at university level). This is suitable as an instrument that is supposed to measure overall labor market conditions. 16 For example, more than 94% students who enrolled at universities in 1980 (the middle generation of our sample) graduated high school in 1980 or 1979, and 86% of them graduated four years later, according to the SBS. That is,

10
graduation year, they need to choose before the last year of graduation. Thus, our assumption seems
reasonable under the Japanese education system.
The instrument for education attainment must satisfy the two conditions that it is correlated
with education, while being uncorrelated with the error terms of the second-stage equation for
inventive performance and knowledge combination. Intuitively, the labor market conditions of an
inventor in the decision year affect the student’s choice on whether to enter the labor market or to go
to a graduate school; and previous studies empirically confirm this relationship (Bedard and Herman
2006; Johnson 2013; Kondo 2007; Shu et al. 2012). In addition, we have designed the dataset and its
specification so that we can assume that the labor market situation that students encountered at 21
years of age affects future inventive activities only through the students’ education choice (exclusion
restriction). First, it is important to note that the unemployment rates used as instruments are for
college graduates who are one year older than those in our sample; since the Japanese education system
does not have any grade-skipping programs, the instrument is not affected by our sample inventors’
behavior.
One potential threat to this assumption is that the unemployment rate of college graduates
from a given academic subject may be correlated with the students’ ability in studying this subject or
with future technological opportunities generated from scientific advances in that academic area. For
an example, an academic subject experiencing rapid scientific progress may attract capable students
or may provide education that would enable the exploitation of greater technological opportunities in
the future. While college students are more likely to pursue graduate degrees in such academic subjects,
unemployment may also be high due to the lag between scientific advances and industrial investment.
In this case, a high unemployment rate may be correlated with high future inventive activities through
inventor ability or future technological opportunities. To control for such correlations between labor
market conditions and inventor ability across academic subjects, we normalized the unemployment variable using the average 𝜇𝜇𝑗𝑗 and standard deviation 𝜎𝜎𝑗𝑗 for unemployment rate in each subject j as
follows:
𝑁𝑁𝑜𝑜𝑜𝑜𝑎𝑎𝐸𝐸𝐾𝐾𝐸𝐸𝑁𝑁𝐾𝐾𝐸𝐸 𝑠𝑠𝐾𝐾𝐾𝐾𝑎𝑎𝑈𝑈𝐾𝐾𝑜𝑜𝑈𝑈𝑎𝑎𝐾𝐾𝐾𝐾𝐸𝐸 𝑜𝑜𝐸𝐸𝐸𝐸𝐾𝐾 𝑜𝑜𝑜𝑜 𝐸𝐸ℎ𝐾𝐾 𝐾𝐾𝑜𝑜𝐸𝐸𝐸𝐸𝑠𝑠𝐸𝐸𝐸𝐸𝐾𝐾𝑠𝑠𝑗𝑗𝑗𝑗 =
𝑈𝑈𝑈𝑈𝑈𝑈𝑈𝑈𝑈𝑈𝑈𝑈𝑈𝑈𝑈𝑈𝑈𝑈𝑈𝑈𝑈𝑈𝑗𝑗 𝑟𝑟𝑟𝑟𝑗𝑗𝑈𝑈 𝑈𝑈𝑜𝑜 𝑗𝑗ℎ𝑈𝑈 𝑔𝑔𝑟𝑟𝑟𝑟𝑔𝑔𝑔𝑔𝑟𝑟𝑗𝑗𝑈𝑈𝑔𝑔𝑗𝑗𝑗𝑗−𝜇𝜇𝑗𝑗𝜎𝜎𝑗𝑗
(3)
The instrument for education for each academic subject thus has a standardized variation across years
after controlling for the average level of unemployment rate of each academic field. In addition to
normalization, we introduce a trend for each academic subject and also substitute the instruments
based on academic subjects by those based on regional variations in our robustness analysis (section
5.3).
almost all high school students go to college immediately after graduation, and most of them graduate college in four years.

11
The second potential source of correlations between the labor market situation that students
encounter before graduation and future inventive activities is that companies might hire graduates of
higher ability in a recession, or students with higher ability may be more able to find new inventor
jobs under the bad economy, if hiring is limited. If the inventors who graduated during the recession
were positively selected above the others, they would be more productive even if they did not attend
graduate school; this will bring an upward bias in the IV estimation. On the other hand, if hiring
practice for researchers is stable across business cycles, or if there exists significant ex-post mobility
of workers across jobs, the number and the ability of the inventors who have college degrees could be
independent on the labor market situation at their graduation. Focusing on this issue, Shu et al. (2012)
use data on MIT students to show that the unemployment rate at graduation does not affect whether a
graduate ultimately becomes an inventor or not; and this rate affects future inventive outputs only
through human capital accumulation.
To assess this possibility in Japan, we regressed the number of inventors aggregated for each
cohort of college graduates on the unemployment rate in the year preceding graduation. The
estimations additionally include the time trend and its square to control for the variation of population
size in each cohort. We also include academic field dummies to control for inherent differences in the
numbers of inventors across fields. The results are presented in Table A3. We do not find any
significant correlation between the two variables 17 . This also verifies that recession in the year
preceding graduation does not affect students’ long-run probability of ultimately becoming an inventor
in Japan, consistent with the results of Shu et al. (2012). Furthermore, to assess the average quality of
inventors with only a bachelor’s degree across economic conditions in Japan18, we estimated a reduced
form regression for the invention performance of inventors with bachelor’s degrees in the sample. If
college graduates with higher capability tend to become inventors during recessions, the
unemployment rate of college students should be positively associated with the absorption of broader
knowledge sources and patent productivity. We do not find such correlations, as will be reported in
Table 9 in section 5.3.
Finally, it is important to note that the estimator of our IV method is best interpreted as the
local average treatment effect (LATE) rather than the average treatment effect (ATE), as suggested by
Imbens and Angrist (1994), because the impact of the unemployment rate of college graduates on
attainment of advanced education is likely to be heterogeneous across them. That is, our estimator for
graduate education presents the average effect for the compliers who reacted to the labor market
condition, and otherwise, they had chosen to enter the labor market.
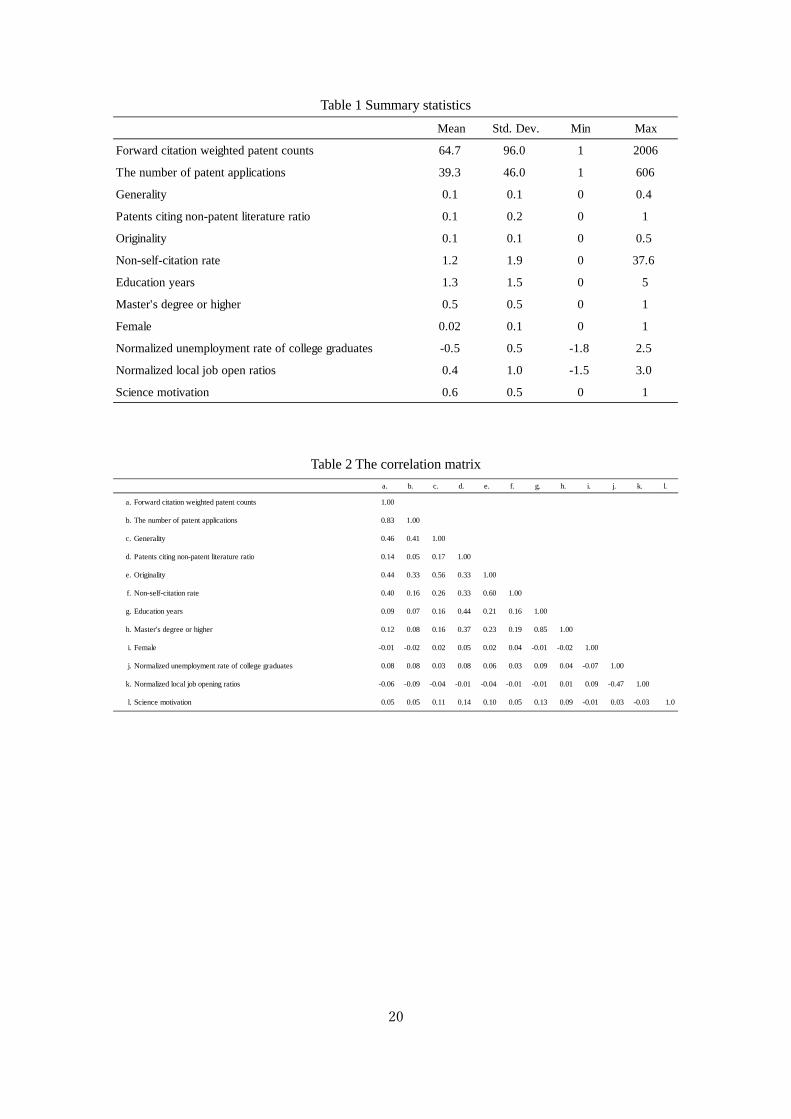
Tables 1 and 2 show the summary statistics and the correlation matrix between major
variables, respectively.
17 We use all respondents of the RIETI inventor survey, rather than the estimation sample, to count the number of inventors in each year and field. 18 This concern is important in Japan too, since existing studies find that recession has long-term effects on the careers of such graduates in Japan (Kondo 2007; Genda, Kondo and Ohta 2010).

12
5. Results
5.1 Inventive performance
Table 3 reports the results of OLS and IV estimations for inventive outputs across educational
attainments, controlling for the cohort dummies (the employment year dummies) and six major
technological area dummies. We use two education level indicators (one for graduate education years
and another for master’s degree or higher), and three dependent variables (the number of patents
weighted by the number of forward citations, the number of patent applications, and the generality
indicator) to capture the potential impacts of variations in education attainment on inventive
performance. In the OLS estimation, the two education variables are all strongly significant and
positive for these three dependent variables in columns (1), (3), (5), (7), (9), and (11).
As we explained above, these estimated coefficients will be biased by the inventors’ own
choices with respect to their level of education, although we can still use these results as benchmarks
for assessing the selection bias in the OLS regression. Our instrument for education attainment will
overcome the endogenous selection problem of education. Table 4 shows the results of the first stage
of the instrumental variable estimation. The dependent variables are the two education indicators. The
normalized unemployment rate of college graduates is positively correlated with higher education
attainment in columns (1) and (2), indicating that when students perceive that many senior students
cannot find jobs by their graduation, they tend to choose graduate education programs. These results
strongly support our prediction that college graduates avoid entering the job market during a recession.
One major concern in IV methods is a weak instrument problem. In order to confirm whether the weak
instrument problem is serious or not, we also show the F statistics testing for weak instruments. The
F statistics are 40.9 for education year and 33.2 for master’s degree or higher dummy, showing that
the weak instrument problem is not serious in the estimations. Overall, we do not have to be concerned
about weak instruments.
The results for the second stages of the scope of knowledge sources are shown in columns
(2), (4), (6), (8), (10), and (12) of Table 3. The first stages of the estimation are equivalent to the results
of Table 4. The coefficients for the education year and master’s degree or higher dummy are all positive
and strongly significant for forward citation weighted patent counts and the number of patent
applications in columns (2), (4), (6), and (8). This indicates that highly educated inventors have higher
patent productivity in terms of both simple patent counts and quality-adjusted patent counts, even after
controlling for endogeneity issues. Further, education variables are also significantly positive for
generality in columns (10) and (12), indicating that inventors with higher education degrees affect
broader technological domains through knowledge spillover than do inventors with lower educational
attainments.
Interestingly, the comparison between OLS and IV estimations in Table 3 shows that the
coefficients for education year and master’s degree and higher dummies in the IV estimations are

13
slightly higher than those in the OLS estimations. This is similar to a finding in a study regarding the
choice of going to college in Finland reported by Toivanen and Väänänen (2016), who focused on the
differences between inventors with high school or less education and those with university degrees,
although the negative selection in our estimations is much smaller than in their results and perhaps
more plausible19. They interpret a negative selection bias in OLS estimations as indicating that “those
who have a high innate propensity for invention have a lower propensity to study at a technical
university.” Our explanation of such negative selection for graduate education by corporate inventors
with ability is as follows. We ordinarily expect positive selection (students with higher innate
capability will choose graduate education), since such students can gain more from graduate education.
However, this scenario may only hold for undergraduate students who wish to pursue academic careers.
Our sample does not cover these students. The best undergraduate students who intend to pursue
industrial research careers may wish to find jobs in private firms immediately after college graduation.
Japanese companies mainly recruited college graduates even as corporate researchers until 1990s.
Large private companies in Japan often provide more excellent environments for researchers in terms
of budgets and apparatus than do universities. They also often encourage excellent young corporate
researchers to obtain PhDs based on work done in the firms20. In this situation, students with better
capability may have found good industrial research jobs upon college graduation, while less capable
students may have tended to choose to go to graduate school, bringing a negative selection bias in the
OLS regression for corporate researchers.
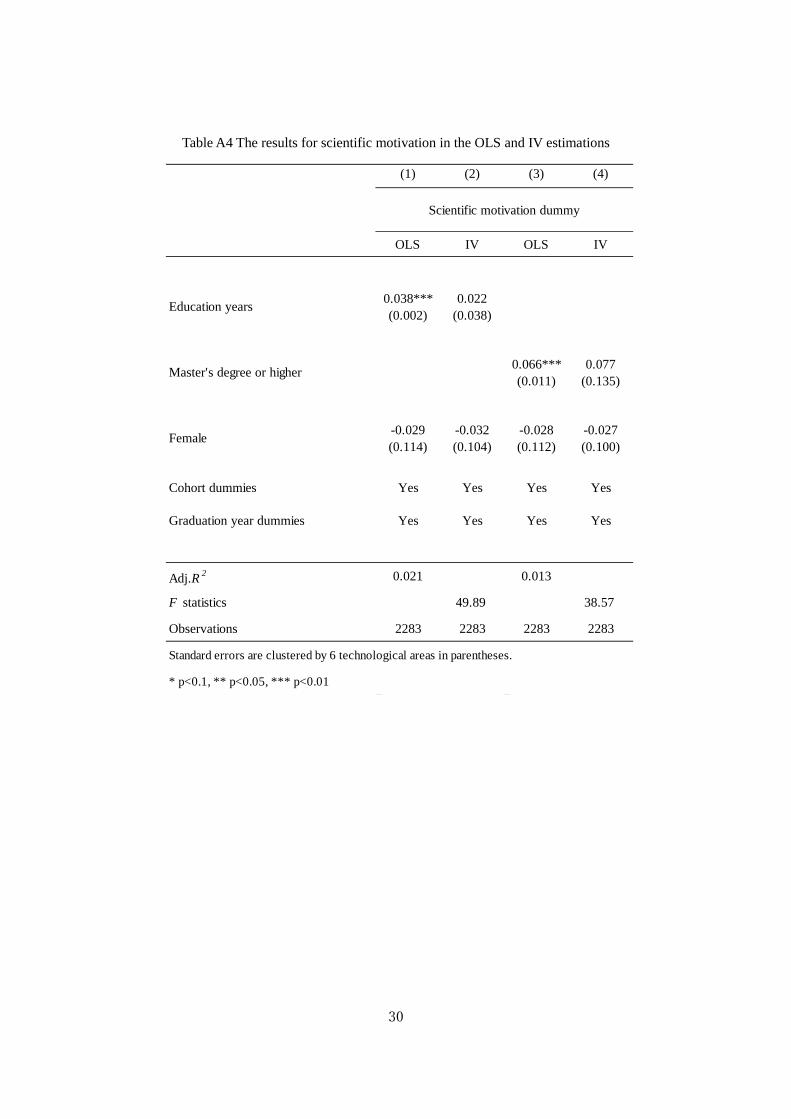
Interestingly, students who chose to go to graduate school during recessions are likely to
have somewhat weaker intrinsic motivation for science than others. Table A4 shows the results using
the strength of their scientific motivation for their focal patents as the dependent variable in the IV
estimation. Since the RIETI Inventor Survey provides information about their motives for initiating
research projects, in the form of a five-point Likert scale for Scientific motivation behind the focal
patent, we constructed a dummy variable such that if inventor chose “very highly motivated” or
“highly motivated,” the variable is set to one, otherwise to zero. The education variables are positive
and highly significant for this dummy variable in the OLS estimations. In contrast, these variables are
no longer significant in the IV estimations. This shows that the inventors who went to graduate school
due to recession have lower scientific motivation than the others. These results provide support for the
findings of Roach and Sauermann (2010) that PhD holders with a weak taste for science tend to choose
careers in industry. This suggests that students with high innate ability, but a lower taste for science,
went to graduate school during the recession.
5.2 Scope of knowledge sources and the first-stage estimations
19 Toivanen and Väänänen (2016) find an increase of between two and three times for the university degree dummy in IV estimations compared with the results of OLS estimations. 20 Onishi and Nagaoka (2012) find that PhD holders who obtained their degree only by dissertation have similar patent productivity to formal PhDs over the inventors’ life-cycle perspective in Japan.

14
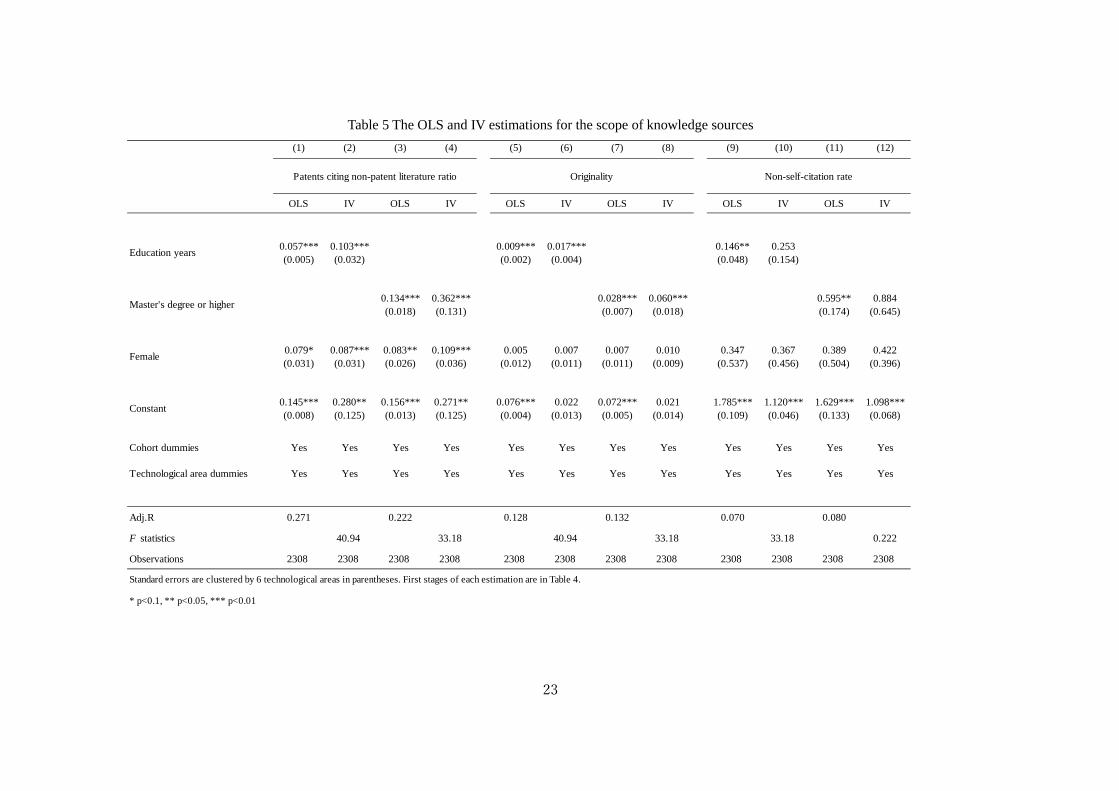
Next, we examine the effect of education attainment on the scope of knowledge sources exploited in
inventive activities. Table 5 reports the results for three knowledge exploitation indicators (the ratio of
patents citing non-patent literature, the originality indicator, and the non-self-citation rate), using both
OLS and IV estimations. The two education variables are all positive and highly significant for patents
citing non-patent literature ratio in columns (1)–(4). This shows that inventors with higher degrees
exploit the scientific literature significantly more for its inventive qualities, thanks in causal terms to
higher education. Further, the education variables are also significantly positive for originality (more
diverse combinations of knowledge embodied in patent literature) in columns (5)–(8), showing that
highly educated inventors exploit knowledge from broader technological domains than do less
educated ones. In contrast, while the non-self-citation rate is positively associated with all education
attainments in OLS estimation, this variable become insignificant in IV estimation. We do not find
that inventors with higher degrees adopt outside knowledge more than inside knowledge. Taken
together, inventors with more than bachelor’s degrees are more likely to combine scientific and
technological knowledge from broader sources in their inventive processes, even after controlling for
the selection bias.
We also find that the coefficients for education in IV are much higher than those in OLS
estimations, showing that over the entire business cycle, inventors attaining advanced education due
to weak labor market conditions exploit broader external knowledge (more scientific knowledge and
broader technological knowledge) in their inventive processes than do average inventors who go to
graduate school or PhD programs.
5.3 Robustness check
To assess the robustness of our findings, we conducted a number of robustness checks. One looks at
the effects of variations of trends across academic subjects. The rate of unemployment for college
students could be affected by long-term technological or industry trends, rather than temporary
business shocks. Technologically stagnant academic fields or academic sectors catering for declining
industries attract less capable students, while college graduates from such sectors tend to have high
unemployment. Thus, variations in such trends can drive both the variations in unemployment rate of
college graduates and the inventive performance of inventors across academic subjects, irrespective
of the level of graduate education. This results in spurious correlations between IVs and the error terms
in equation (1). To cope with this concern, we added time trends for each subject to equation (1) with
IVs in Table 6. The results are very similar to those in Tables 3 and 5. Interestingly, the non-self-
citation rate turns to be significant and positive in columns (11) and (12) in Table 6.
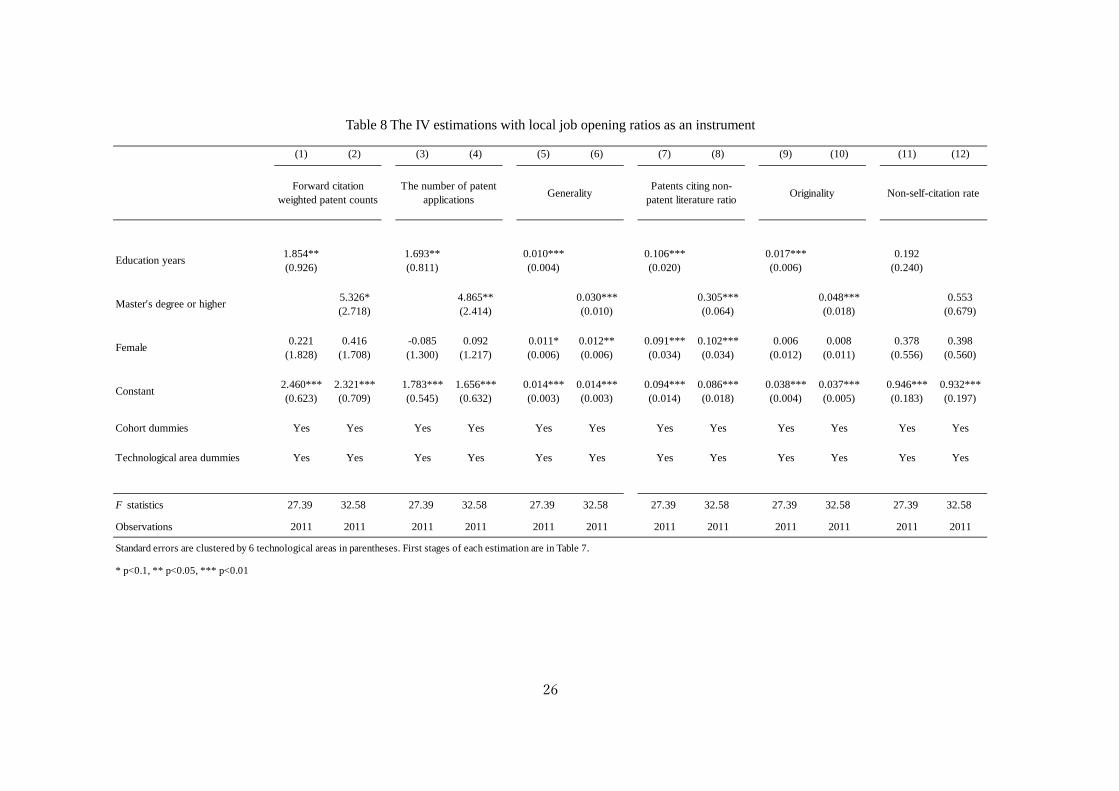
Further, we also use the active job opening ratio at the regional level as an instrument. The
job opening ratios in the regions are obtained from the report of the Employment Service Agency21.
Our data are obtained from 47 regions in Japan. We normalize these by subtracting the average job
21 Our sample becomes small since we do not find old data on job opening ratios at regional level.

15
opening ratio in each region from the variable and dividing the values by their standard deviation. This
process controls for time-invariant heterogeneity across regions. In the first stages, the local job
opening ratios are all significant and negative for education variables, as reported in Table 7. A
recession at the local level affects undergraduates’ educational choices. Further, F statistics against
weak instruments are high in two estimations (education year: 27.4, and master’s degree and higher:
32.6). Table 8 shows the results in the second stages. The results remain similar to those in Tables 3
and 5. These results confirm that a recession affects graduates’ choices for educational attainment, and
their education level also affects their future invention productivity and their knowledge sources.
Finally, the unemployment rate of college graduates may be directly associated with patent
outputs, because only students with high innate ability can obtain jobs as inventors during a recession,
and this may create an upward bias for the coefficients of education variables in IV estimations. To
examine whether superior students selectively become inventors in a bad economy, we estimate a
reduced form of equations (1) and (2), using only the sample of inventors with bachelor’s degrees. If
better undergraduates become inventors during a recession, the unemployment rate of college
graduates will become significant and positive in such estimations. As shown in Table 9, the
coefficients for the unemployment rate are small and insignificant. This shows that unemployment
rate is not directly associated with patent outputs and knowledge utilization of these inventors with
bachelor’s degrees as final degrees. That is, the average quality of college graduates in recessions is
not different to that in other periods.
6. Conclusion
This paper investigated the effects of graduate education on the absorption of a diverse range of
knowledge sources and on inventive performance, using inventor life-cycle data. To control for the
endogeneity of educational attainments, we use the unemployment rate of college graduates in the year
prior to that of graduation in their academic subjects as an instrument. Our estimation results show
that a higher unemployment rate at that time and in a given academic field significantly increases the
probability of inventors choosing to graduate school, including PhD programs. In particular, university
students tend to go to graduate education during a recession. We find that the inventive productivities
of inventors with higher graduate education induced by this instrument are higher than those with less
education, in terms of both simple and quality-adjusted patent counts; and highly educated inventors
also tend to affect sequential inventions in broader technological areas. We further find that these
inventors cite a wider range of scientific literature and more diverse fields of prior patents. These
findings are robust to the replacement of instruments based on variations among academic fields by
those based on regional variations.
These results suggest that a policy encouraging students to go to a graduate school in science
and engineering seems to play a significant role as an innovation policy. It genuinely enhances
invention performance; it also enhances the absorptive capability of a firm for handling scientific

16
knowledge and broader technical information. In fact, the positive association between higher
educational attainment and higher productivity and knowledge exploitation understates the genuine
contribution of advanced degrees, given the negative selection effects. This evidence supports the
recent trend of expanding higher education programs in many countries. This trend will accelerate
economic growth in the long run.
Interestingly, our results show that the recession gives students an opportunity to accumulate
new knowledge. Our results depend on the decisions of students to put off entering the labor market
during times of recession, in order to wait for better labor market conditions. The results indicate that
inventors who chose graduate school even for such reasons become high performers on average in the
inventive process. Given such an educational effect on inventive outcomes and negative selection, a
recession contributes to future innovative activities through more choices by capable students for
higher education. While Shu et al. (2012) have empirically shown the possibility of this recession
effect, using unique data, our results improve our understanding of the process in terms of both
causality and detailed knowledge production mechanisms, using an economy-wide sample. The
findings of our study indicate that graduate education will enhance inventive productivity more
effectively than will internal company training systems such as on-the-job training, partly because
highly educated inventors have higher absorptive ability to obtain broader knowledge. This also offers
new evidence to guide firm innovation strategy. Our results suggest that hiring researchers with
advanced graduate degrees leads to strengthening the corporate ability to absorb broader scientific and
technical knowledge. This will contribute to enhancing absorptive capacity to maintain a competitive
advantage at firm level.

17
References
Allen, J.T. (1984) Managing the Flow of Technology, The MIT Press: Cambridge.
Bedard, K. and D.A. Herman (2008) “Who Goes to Graduate/Professional school? The Importance of
Economic Fluctuations, Undergraduate Field, and Ability,” Economics of Education Review
27(5):197-210.
Cockburn, I. and R. Henderson (1998) “Absorptive Capacity, Coauthoring Behavior, and the
Organization of Research in Drug Discovery,” Journal of Industrial Economics 46(2): 157-82.
Cohen, W.M., A. Goto, A. Nagata, R. Nelson and J.P. Walsh (2002) “R&D Spillovers, Patents and the
Incentives to Innovate in Japan and the United States,” Research Policy 31(8-9): 1349-1367.
Cohen, W.M. and D.A. Levinthal (1989) “Innovation and Learning: The Two Faces of R&D,”
Economic Journal 99: 569-596.
Genda, Y., A. Kondo and S. Ohta (2010) “Long-term Effects of a Recession at Labor Market Entry in
Japan and the United States,” Journal of Human Resources 45(1):157-196.
Giuri, P. and M. Mariani (2013) “When Distance Disappears: Inventors, Education, and the Locus of
Knowledge Spillovers,” Review of Economics and Statistics 95(2): 449-463.
Goto, A. and K. Motohashi (2007) “Construction of a Japanese Patent Database and a First Look at
Japanese Patenting Activities,” Research Policy 36(9): 1431-1442.
Gruber, M., D. Harhoff and K. Hoisl (2013) “Knowledge Recombination across Technological
Boundaries: Scientists versus Engineers,” Management Science 59(4): 837-851.
Hall, B.H., A.B. Jaffe and M. Tratjenberg (2005) “Market Value and Patent Citations,” RAND Journal
of Economics 36: 16-38.
Harhoff, D., F. Narin, F.M. Scherer and K. Vopel (1999) “Citation Frequency and the Value of Patented
Inventions,” Review of Economics and Statistics 81: 511-515.
Heckman, J.J., L.J. Lochner and P.E. Todd (2006) “Earnings Functions, Rate of Returns and Treatment
Effects: The Mincer Equation and Beyond,” E.A. Hanushek and F. Welch eds. Handbook of the
Economics of Education, Volume 1, North Holland, pp.307-458.
Hoisl, K. (2007) “Tracing Mobile Inventors: The Causality between Inventor Mobility and Inventor
Productivity,” Research Policy 36: 619-636.
Imbens, G. and J. Angrist (1994) “Identification and Estimation of Local Average Treatment Effects,”
Econometrica 62(2): 467-75.
Jones, B.F. (2009) “The Burden of Knowledge and the ‘Death of the Renaissance Man’: Is Innovation
Getting Harder?” Review of Economic Studies 76: 283-317.
Johnson, M.T. (2013) “The Impact of Business Cycle Fluctuations on Graduate School Enrollment,”
Economics of Education Review 34: 122-134.
Kim, J., S.J. Lee and G. Marschke (2004) “Research Scientist Productivity and Firm Size: Evidence
from Panel Data on Inventors,” Working Paper, SUNY Albany.
Kondo, A. (2007) “Does the First Job Really Matter? State Dependency in Employment Status in
Japan,” Journal of Japanese and International Economics 21: 379-402.

18
March, J.G. (1991) “Exploration and Exploitation in Organizational Learning,” Organizational
Science 2(1): 71-87.
Mariani, M. and M. Romannelli, M. (2007), “Stacking’ and ‘Picking’ Inventions: The Patenting
Behavior of European Inventors,” Research Policy 36: 1128–1142.
Meyer, M. (2000) “Does Science Push Technology? Patents Citing Scientific Literature,” Research
Policy 29(3): 409-434.
Nagaoka, S. and N. Tsukada (2007) “Innovation Process in Japan: Findings From the RIETI Inventors
Survey,” RIETI Discussion Paper 07-J-046.
Narin, F., K.S. Hamilton and D. Olivastro (1997) “The Increasing Linkage Between U.S. Technology
and Public Science,” Research Policy 26(3): 317-330.
Neumark, D. (2002) “Youth Labor Markets in the United States: Shopping Around vs. Staying Put,”
Review of Economics and Statistics 84(3): 462-482.
OECD (2016) OECD Science, Technology and Innovation Outlook 2016, OECD Publishing: Paris.
Onishi, K. and S. Nagaoka (2012) “Life-cycle Productivity of Industrial Inventors: Education and
Other Determinants,” RIETI Discussion Paper 12-E-059.
Price, D.J. de Solla (1965) “Is Technology Independent of Science?” Technology and Culture 6(4):
553-568.
Romer, P.M. (1990) “Endogenous Technological Change,” Journal of Political Economy 98(5): 71-
102.
Roach, M. and H. Sauermann (2010) “A Taste for Science? PhD Scientists’ Academic Orientation and
Self-selection into Research Careers in Industry,” Research Policy 39(3): 422-434.
Schettino, F., A. Sterlacchini and F. Venturini (2008) “Inventive Productivity and Patent Quality:
Evidence from Italian Inventors,” MPRA Paper 7765.
Schumpeter, J.A. (1977) The Theory of Economic Development: An Inquiry into Profits, Capital,
Credit, Interest and the Business Cycle, translated from the German by Y. Shionoya, S. Touhata
and I. Nakayama, Iwanami: Tokyo.
Shu, P., D. Acemoglu, S. Stern, R. Romano and L. Snover (2012) “The Long-term Impact of Business
Cycles on Innovation: Evidence from the Massachusetts Institute of Technology,” MIT working
paper.
Stephan, P. (2011) How Economics Shapes Science, Harvard University Press: Cambridge.
Tamada, S., S. Naito, K. Genba, F. Kodama, J. Suzuki and A. Goto (2006) “Science Linkage and UIC,”
in A. Goto and T. Tamada eds. Japan’s National Innovation System: Rebuilding and Engine of
Growth, University of Tokyo Press: Tokyo.
Toivanen, O. and L. Väänänen (2012) “Return to Inventors,” Review of Economics and Statistics 94:
1173-1190.
Toivanen, O. and L. Väänänen (2016) “Education and Invention,” Review of Economics and Statistics
98(2): 382-396.
Trajtenberg, M., R. Henderson and A. Jaffe (1997) “University Versus Corporate Patents: A Window

19
on the Basicness of Invention,” Economics of Innovation and New Technology 5(1): 19-50.
Weitzman L.M. (1998) “Recombinant Growth,” Quarterly Journal of Economics 133(2): 33-360.
20
Table 1 Summary statistics
Table 2 The correlation matrix
Mean Std. Dev. Min Max
Forward citation weighted patent counts 64.7 96.0 1 2006
The number of patent applications 39.3 46.0 1 606
Generality 0.1 0.1 0 0.4
Patents citing non-patent literature ratio 0.1 0.2 0 1
Originality 0.1 0.1 0 0.5
Non-self-citation rate 1.2 1.9 0 37.6
Education years 1.3 1.5 0 5
Master's degree or higher 0.5 0.5 0 1
Female 0.02 0.1 0 1
Normalized unemployment rate of college graduates -0.5 0.5 -1.8 2.5
Normalized local job open ratios 0.4 1.0 -1.5 3.0
Science motivation 0.6 0.5 0 1
a. b. c. d. e. f. g. h. i. j. k. l.
a. Forward citation weighted patent counts 1.00
b. The number of patent applications 0.83 1.00
c. Generality 0.46 0.41 1.00
d. Patents citing non-patent literature ratio 0.14 0.05 0.17 1.00
e. Originality 0.44 0.33 0.56 0.33 1.00
f. Non-self-citation rate 0.40 0.16 0.26 0.33 0.60 1.00
g. Education years 0.09 0.07 0.16 0.44 0.21 0.16 1.00
h. Master's degree or higher 0.12 0.08 0.16 0.37 0.23 0.19 0.85 1.00
i. Female -0.01 -0.02 0.02 0.05 0.02 0.04 -0.01 -0.02 1.00
j. Normalized unemployment rate of college graduates 0.08 0.08 0.03 0.08 0.06 0.03 0.09 0.04 -0.07 1.00
k. Normalized local job opening ratios -0.06 -0.09 -0.04 -0.01 -0.04 -0.01 -0.01 0.01 0.09 -0.47 1.00
l. Science motivation 0.05 0.05 0.11 0.14 0.10 0.05 0.13 0.09 -0.01 0.03 -0.03 1.0

21
Table 3 The OLS and IV estimations for the inventive performance
(1) (2) (3) (4) (5) (6) (7) (8) (9) (10) (11) (12)
OLS IV OLS IV OLS IV OLS IV OLS IV OLS IV
1.320** 1.571** 1.031** 1.339*** 0.006*** 0.006**(0.387) (0.616) (0.331) (0.468) (0.001) (0.003)
4.050** 5.496** 3.135** 4.683*** 0.016*** 0.022**(1.117) (2.335) (0.952) (1.709) (0.004) (0.010)
0.224 0.270 0.442 0.608 -0.184 -0.128 -0.018 0.160 0.011 0.011* 0.011* 0.012**(2.011) (1.739) (1.908) (1.544) (1.467) (1.279) (1.399) (1.164) (0.006) (0.006) (0.005) (0.006)
13.467*** 5.266*** 13.026*** 5.129** 11.063*** 4.505*** 10.740*** 4.388*** 0.058*** 0.014** 0.059*** 0.013**(0.731) (1.982) (0.806) (2.012) (0.622) (1.587) (0.684) (1.605) (0.002) (0.006) (0.003) (0.006)
Cohort dummies Yes Yes Yes Yes Yes Yes Yes Yes Yes Yes Yes Yes
Technological area dummies Yes Yes Yes Yes Yes Yes Yes Yes Yes Yes Yes Yes
Adj.R 2 0.062 0.063 0.058 0.059 0.066 0.058
F statistics 40.94 33.18 40.94 33.18 40.94 33.18
Observations 2308 2308 2308 2308 2308 2308 2308 2308 2308 2308 2308 2308
* p<0.1, ** p<0.05, *** p<0.01
Standard errors are clustered by 6 technological areas in parentheses. First stages of each estimation are in Table 4.
Female
Constant
Education years
Master's degree or higher
Forward citation weighted patent counts The number of patent applications Generality

22
Table 4 The result of first-stage estimations
(1) (2)
Educationyears MD or higher
0.507*** 0.145***(0.079) (0.025)
-0.137 -0.101(0.124) (0.095)
0.829** 0.262**(0.326) (0.119)
Cohort dummies Yes Yes
Technological area dummies Yes Yes
F statistics 40.94 33.18
Observations 2308 2308
Standard errors are clustered by 6 technological areas in parentheses.
* p<0.1, ** p<0.05, *** p<0.01
Female
Normalized unemployment rateof college graduates
Constant
23
Table 5 The OLS and IV estimations for the scope of knowledge sources
(1) (2) (3) (4) (5) (6) (7) (8) (9) (10) (11) (12)
OLS IV OLS IV OLS IV OLS IV OLS IV OLS IV
0.057*** 0.103*** 0.009*** 0.017*** 0.146** 0.253(0.005) (0.032) (0.002) (0.004) (0.048) (0.154)
0.134*** 0.362*** 0.028*** 0.060*** 0.595** 0.884(0.018) (0.131) (0.007) (0.018) (0.174) (0.645)
0.079* 0.087*** 0.083** 0.109*** 0.005 0.007 0.007 0.010 0.347 0.367 0.389 0.422(0.031) (0.031) (0.026) (0.036) (0.012) (0.011) (0.011) (0.009) (0.537) (0.456) (0.504) (0.396)
0.145*** 0.280** 0.156*** 0.271** 0.076*** 0.022 0.072*** 0.021 1.785*** 1.120*** 1.629*** 1.098***(0.008) (0.125) (0.013) (0.125) (0.004) (0.013) (0.005) (0.014) (0.109) (0.046) (0.133) (0.068)
Cohort dummies Yes Yes Yes Yes Yes Yes Yes Yes Yes Yes Yes Yes
Technological area dummies Yes Yes Yes Yes Yes Yes Yes Yes Yes Yes Yes Yes
Adj.R 0.271 0.222 0.128 0.132 0.070 0.080
F statistics 40.94 33.18 40.94 33.18 33.18 0.222
Observations 2308 2308 2308 2308 2308 2308 2308 2308 2308 2308 2308 2308
* p<0.1, ** p<0.05, *** p<0.01
Patents citing non-patent literature ratio Originality Non-self-citation rate
Female
Constant
Standard errors are clustered by 6 technological areas in parentheses. First stages of each estimation are in Table 4.
Master's degree or higher
Education years

24
Table 6 The IV estimations with time trends across academic subjects
(1) (2) (3) (4) (5) (6) (7) (8) (9) (10) (11) (12)
2.812*** 1.034** 0.011*** 0.115*** 0.026*** 0.465**(0.450) (0.328) (0.004) (0.027) (0.005) (0.187)
3.873** 7.138*** 0.015*** 0.361*** 0.081*** 1.455**(1.116) (1.154) (0.004) (0.100) (0.021) (0.699)
0.086 0.066 -0.432 0.503 0.007 0.007 0.070** 0.103** 0.001 0.008 0.131 0.262(1.964) (2.165) (1.684) (1.546) (0.007) (0.007) (0.035) (0.045) (0.010) (0.012) (0.334) (0.304)
4.710*** 12.152*** 10.240*** 4.134*** 0.010*** 0.051*** 0.267* 0.268** 0.013*** 0.013** 0.908*** 0.909***(1.272) (0.767) (0.577) (1.272) (0.002) (0.004) (0.137) (0.129) (0.004) (0.006) (0.251) (0.220)
Cohort dummies Yes Yes Yes Yes Yes Yes Yes Yes Yes Yes Yes Yes
Technological area dummies Yes Yes Yes Yes Yes Yes Yes Yes Yes Yes Yes Yes
Academic subject time trends Yes Yes Yes Yes Yes Yes Yes Yes Yes Yes Yes Yes
F statistics 41.61 30.93 41.61 30.93 41.61 30.93 41.61 30.93 41.61 30.93 41.61 30.93
Observations 2308 2308 2308 2308 2308 2308 2308 2308 2308 2308 2308 2308
Standard errors are clustered by 6 technological areas in parentheses.
* p<0.1, ** p<0.05, *** p<0.01
The number of patentapplications Generality
Patents citing non-patentliterature ratio Originality Non-self-citation rate
Education years
Master's degree or higher
Female
Constant
Forward citation weightedpatent counts

25
Table 7 The result of first-stage estimations using local job opening ratios as an instrument
(1) (2)
Educationyears MD or higher
-0.264*** -0.092***(0.050) (0.016)
-0.163 -0.093(0.132) (0.095)
0.710*** 0.273***(0.010) (0.005)
Cohort dummies Yes Yes
Technological area dummies Yes Yes
F statistics 27.39 32.58
Observations 2011 2011
Standard errors are clustered by 6 technological areas in parentheses.
* p<0.1, ** p<0.05, *** p<0.01
Normalized local job openingratios
Female
Constant
26
Table 8 The IV estimations with local job opening ratios as an instrument
(1) (2) (3) (4) (5) (6) (7) (8) (9) (10) (11) (12)
1.854** 1.693** 0.010*** 0.106*** 0.017*** 0.192(0.926) (0.811) (0.004) (0.020) (0.006) (0.240)
5.326* 4.865** 0.030*** 0.305*** 0.048*** 0.553(2.718) (2.414) (0.010) (0.064) (0.018) (0.679)
0.221 0.416 -0.085 0.092 0.011* 0.012** 0.091*** 0.102*** 0.006 0.008 0.378 0.398(1.828) (1.708) (1.300) (1.217) (0.006) (0.006) (0.034) (0.034) (0.012) (0.011) (0.556) (0.560)
2.460*** 2.321*** 1.783*** 1.656*** 0.014*** 0.014*** 0.094*** 0.086*** 0.038*** 0.037*** 0.946*** 0.932***(0.623) (0.709) (0.545) (0.632) (0.003) (0.003) (0.014) (0.018) (0.004) (0.005) (0.183) (0.197)
Cohort dummies Yes Yes Yes Yes Yes Yes Yes Yes Yes Yes Yes Yes
Technological area dummies Yes Yes Yes Yes Yes Yes Yes Yes Yes Yes Yes Yes
F statistics 27.39 32.58 27.39 32.58 27.39 32.58 27.39 32.58 27.39 32.58 27.39 32.58
Observations 2011 2011 2011 2011 2011 2011 2011 2011 2011 2011 2011 2011
* p<0.1, ** p<0.05, *** p<0.01
Originality Non-self-citation rate
Standard errors are clustered by 6 technological areas in parentheses. First stages of each estimation are in Table 7.
Female
Constant
Forward citationweighted patent counts
The number of patentapplications Generality
Education years
Master's degree or higher
Patents citing non-patent literature ratio

27
Table 9 The OLS results for reduced form estimations with inventors with bachelor’s degrees
(1) (2) (3) (4) (5) (6)
Forward citationweighted patent
counts
The number ofpatent applications Generality
Patents citing non-patent literature
ratioOriginality
Non-self-citationrate
0.059 0.090 0.000 0.015 0.003 -0.018(0.655) (0.531) (0.005) (0.016) (0.004) (0.127)
-0.380 -1.013 0.005 0.077 0.014 1.048(3.242) (2.498) (0.010) (0.070) (0.026) (1.043)
16.307*** 13.179*** 0.071*** 0.286*** 0.107*** 2.441***(0.302) (0.248) (0.003) (0.009) (0.002) (0.072)
Cohort dummies Yes Yes Yes Yes Yes Yes
Technological area dummies Yes Yes Yes Yes Yes Yes
Adj.R 2 0.06 0.06 0.02 0.13 0.11 0.05
Observations 998 998 998 998 998 998
Standard errors are clustered by 6 technological areas in parentheses. The estimation sample is limited for BA holders.
* p<0.1, ** p<0.05, *** p<0.01
Normalized unemployment rate ofcollege graduates
Female
Constant

28
Table A1 Summary statistics by education
Table A2 Academic subjects
NAvereage
Patenting terms
Forward citationweighted patent
counts
The number ofpatent applications Generality
Patents citing non-patent literature
ratioOriginality
Non-self-citationrate
13.70 51.18 34.64 0.04 0.07 0.03 0.79(2.38) (69.66) (44.09) (0.05) (0.13) (0.05) (1.01)
13.49 75.84 42.67 0.06 0.19 0.06 1.55(2.44) (117.05) (47.31) (0.05) (0.23) (0.08) (2.43)
12.74 82.02 47.49 0.08 0.42 0.08 1.52(2.85) (92.11) (47.51) (0.06) (0.30) (0.08) (1.93)
Standard deviation is in parentheses.
Bachelor's degree 1,093
Master's degree 1,016
PhD degree 199
Major academic subject Academic subject N
Engineering Mechanical Engineering 463
Applied Physics 77
Applied Chemistry 399
Metallurgical engineering 80
Management engineering 10
Nuclear Engineering 11
Craftsmanship 1
Aviation engineering 10
Mining studies 1
Textile engineering 23
Vessel engineering 11
Telecommunications Engineering 539
Civil engineering / construction engineering 16
Other engineering 238
Science Physics 99
Biology 15
Mathematics 12
Chemistry 130
Other science 34
Health science Pharmacy 21
Dentistry 2
Medicine 10
Other health science 2
Agriculture Agriculture 1
Agrochemical chemistry 37
Agricultural engineering 7
Forest Industry 22
Fisheries Science 5
Veterinary medicine / Animal husbandry 5
Others Other natural science 15
Commerce / Economics 2
Law / Political Science 4
Other Social science 6

29
Table A3 The OLS results for determination of the number of sampled inventors
The number of inventors
-0.66(0.451)
150.20***(28.689)
-0.04***(0.007)
Academic field dummies Yes
Adj.R 2 0.84
Observations 452
* p<0.1, ** p<0.05, *** p<0.01
Normalized unemployment rate ofcollege graduates
Time trend
Time trend^2
Robust standard errors are in parentheses. The number ofinventors is that they were 21 years old in year t and in academicsubject j .
30
Table A4 The results for scientific motivation in the OLS and IV estimations
(1) (2) (3) (4)
OLS IV OLS IV
0.038*** 0.022(0.002) (0.038)
0.066*** 0.077(0.011) (0.135)
-0.029 -0.032 -0.028 -0.027(0.114) (0.104) (0.112) (0.100)
Cohort dummies Yes Yes Yes Yes
Graduation year dummies Yes Yes Yes Yes
Adj.R 2 0.021 0.013
F statistics 49.89 38.57
Observations 2283 2283 2283 2283
Standard errors are clustered by 6 technological areas in parentheses.
* p<0.1, ** p<0.05, *** p<0.01
Female
Education years
Master's degree or higher
Scientific motivation dummy