how india’s solar and wind policies enabled its energy
TRANSCRIPT

A Decade in Review
How Indiarsquos Solar and Wind Policies Enabled its Energy Transition
Harsha V Rao and Disha Agarwal
Report April 2021
Centre forEnergy Finance
An initiative supported by
How Indiarsquos Solar and Wind Policies Enabled its Energy Transition A Decade in Review
Image iStock
Over the last ten years India has demonstrated a functional RE pathway to the world As it sets out to become a renewable energy powerhouse by 2030 it is essential that we review thejourney and draw lessons that can take us there
CEEW ReportApril 2021
ceewin
A Decade in Review
How Indiarsquos Solar and Wind Policies Enabled its
Energy Transition
Harsha V Rao and Disha Agarwal
Centre forEnergy Finance
An initiative supported by
How Indiarsquos Solar and Wind Policies Enabled its Energy Transition A Decade in Review
Copyright copy 2021 Council on Energy Environment and Water (CEEW)
Open access Some rights reserved This work is licenced under the Creative Commons Attribution-
Non-commercial 40 International (CC BY-NC 40) licence To view the full licence visit www
creativecommonsorglicences by-nc40legalcode
Suggested citation Rao Harsha V and Disha Agarwal 2021 How Indiarsquos Solar and Wind Policies Enabled its Energy
Transition A Decade in Review New Delhi Council on Energy Environment and Water
Disclaimer The views expressed in this work are those of the authors and do not necessarily reflect the views and
policies of the Council on Energy Environment and Water
The viewsanalysis expressed in this report do not necessarily reflect the views of Shakti Sustainable
Energy Foundation The Foundation also does not guarantee the accuracy of any data included in this
publication nor does it accept any responsibility for the consequences of its use For private circulation
only
Cover images iStock
Peer reviewers Divyam Nagpal Programme Officer-Energy Access International Renewable Energy Agencyrsquos (IRENA)
Knowledge Policy and Finance Centre Paramita Sahoo Head - Policy Advocacy The Tata Power
Company Limited Pustav Joshi Climate Change Policy and Negotiations Lead UK Trade Economics and
Prosperity Foreign Commonwealth Office Government of UK Vibhuti Garg Energy Economist Institute
for Energy Economics and Financial Analysis (IEEFA) Deepak Sriram Krishnan Associate Director Energy
WRI India and Praveen Golash Senior General Manager Avaada Energy Pvt Ltd
Publication team Alina Sen (CEEW) The Clean Copy Twig Designs and Friends Digital
Acknowledgments The authors of this study would like to thank Shakti Sustainable Energy Foundation (SSEF) for their
support to carry out this study
We are obliged to the peer reviewers of this report who provided critical comments and inputs and
helped improve the draft substantially We thank Gandhar Ukidve and Sachin Zachariah both Research
Analysts at CEEW for their research inputs We are further grateful for the constant guidance and inputs
of Vaibhav Pratap Singh Senior Analyst CEEW-Centre for Energy Finance (CEEW-CEF) and Kanika
Chawla formerly Director CEEW-CEF And finally we thank Alina Sen and the Outreach team at CEEW for
the publishing and outreach of this study
Organisations The Council on Energy Environment and Water (CEEW) is one of Asiarsquos leading not-for-profit policy
research institutions The Council uses data integrated analysis and strategic outreach to explain ndash and
change ndash the use reuse and misuse of resources It prides itself on the independence of its high-quality
research develops partnerships with public and private institutions and engages with wider public In
2021 CEEW once again featured extensively across ten categories in the 2020 Global Go To Think Tank
Index Report The Council has also been consistently ranked among the worldrsquos top climate change think
tanks Follow us on Twitter CEEWIndia for the latest updates
Shakti Sustainable Energy Foundation seeks to facilitate Indiarsquos transition to a sustainable energy
future by aiding the design and implementation of policies in the following areas clean power energy
efficiency sustainable urban transport climate change mitigation and clean energy finance
Council on Energy Environment and Water Sanskrit Bhawan A-10 Qutab Institutional Area Aruna Asaf Ali Marg New Delhi - 110067 India
About CEEW
The Council on Energy Environment and Water (CEEW) is one of Asiarsquos leading not-for-profit policy research institutions The Council uses data integrated analysis and strategic outreach to explain mdash and change mdash the use reuse and misuse of resources The Council addresses pressing global challenges through an integrated and internationally focused approach It prides itself on the independence of its high-quality research develops partnerships with public and private institutions and engages with the wider public
The Councilrsquos illustrious Board comprises Mr Jamshyd Godrej (Chairperson) Mr Tarun Das Dr Anil Kakodkar Mr S Ramadorai Mr Montek Singh Ahluwalia Dr Naushad Forbes Ambassador Nengcha Lhouvum Mukhopadhaya and Dr Janmejaya Sinha The 100 plus executive team is led by Dr Arunabha Ghosh CEEW is certified as a Great Place To Workreg
In 2021 CEEW once again featured extensively across ten categories in the 2020 Global Go To Think Tank Index Report including being ranked as South Asiarsquos top think tank (15th globally) in our category for the eighth year in a row CEEW has also been ranked as South Asiarsquos top energy and resource policy think tank for the third year running It has consistently featured among the worldrsquos best managed and independent think tanks and twice among the worldrsquos 20 best climate think tanks In ten years of operations The Council has engaged in 278 research projects published 212 peer-reviewed books policy reports and papers created 100+ new databases or improved access to data advised governments around the world nearly 700 times promoted bilateral and multilateral initiatives on 80+ occasions and organised 350+ seminars and conferences In July 2019 Minister Dharmendra Pradhan and Dr Fatih Birol (IEA) launched the CEEW Centre for Energy Finance In August 2020 Powering Livelihoods mdash a CEEW and Villgro initiative for rural start-ups mdash was launched by Minister Mr Piyush Goyal Dr Rajiv Kumar (NITI Aayog) and HE Ms Damilola Ogunbiyi (SEforAll) The Councilrsquos major contributions include The 584-page National Water Resources Framework Study for Indiarsquos 12th Five Year Plan the first independent evaluation of the National Solar Mission Indiarsquos first report on global governance submitted to the National Security Adviser irrigation reform for Bihar the birth of the Clean Energy Access Network work for the PMO on accelerated targets for renewables power sector reforms environmental clearances Swachh Bharat pathbreaking work for the Paris Agreement the HFC deal the aviation emissions agreement and international climate technology cooperation the concept and strategy for the International Solar Alliance (ISA) the Common Risk Mitigation Mechanism (CRMM) critical minerals for Make in India modelling uncertainties across 200+ scenarios for Indiarsquos low-carbon pathways Indiarsquos largest multidimensional energy access survey (ACCESS) climate geoengineering governance circular economy of water and waste and the flagship event Energy Horizons It recently published Jobs Growth and Sustainability A New Social Contract for Indiarsquos Recovery
The Councilrsquos current initiatives include A go-to-market programme for decentralised renewable energy-powered livelihood appliances examining country-wide residential energy consumption patterns raising consumer engagement on power issues piloting business models for solar rooftop adoption developing a renewable energy project performance dashboard green hydrogen for industry decarbonisation state-level modelling for energy and climate policy reallocating water for faster economic growth creating a democratic demand for clean air raising consumer awareness on sustainable cooling and supporting Indiarsquos electric vehicle and battery ambitions It also analyses the energy transition in emerging economies including Indonesia South Africa Sri Lanka and Viet Nam
The Council has a footprint in 21 Indian states working extensively with state governments and grassroots NGOs It is supporting power sector reforms in Uttar Pradesh and Tamil Nadu scaling up solar-powered irrigation in Chhattisgarh supporting climate action plans in Gujarat and Madhya Pradesh evaluating community-based natural farming in Andhra Pradesh examining crop residue burning in Punjab and promoting solar rooftops in Delhi and Bihar
How Indiarsquos Solar and Wind Policies Enabled its Energy Transition A Decade in Review
Harsha V Rao harsharaoceewin
Harsha researches the legal and regulatory framework of the energy sector Before joining The Council she worked as a litigation lawyer in Delhi She has also worked with the project finance team of a leading law firm in India
Disha Agarwal dishaagarwalceewin
Disha co-manages The Councilrsquos Renewable Energy Programme She works on legislative policy and regulatory frameworks at the intersection of power and renewables She has experience in strategy development renewable energy policy and market analyses stakeholder management and collaborations grant-making and fund-raising Before joining The Council she was with Shakti Sustainable Energy Foundation leading programmes on renewables and climate policy during her tenure
The authors
ldquoRenewable energy already makes sense We should now take steps to deepen the market and make it more flexiblerdquo
ldquoIndia is set to become a renewable energy powerhouse over this decade This is when we need to adopt pathways to reducing the sectorrsquos reliance on policiesrdquo
How Indiarsquos Solar and Wind Policies Enabled its Energy Transition A Decade in Review
Image iStock
This study focuses on the evolving policies and risks in Indiarsquos utility-scale solar and wind energy sector and mitigating strategies used at various points in time
Contents
Executive summary
2 Evolution of Central policies
21 Pre-2010 ndash private-sector participation and prioritising renewables 22 Post-2010 policies for solar 23 Impact of other policies on project deployment 24 Solar Park Scheme 25 Post-2010 policies for wind 26 Policy assessment
3 Renewable purchase obligations ndash a regulatory mechanism for creating demand
31 Setting RPO targets 32 Compliance with RPO 33 Causes of under-achievement
4 Policy evolution in RE-rich states
41 Policies pre-2014 42 Policies post- 2014
5 Policy evolution in RE-deficit states
6 Looking back to look ahead
References
Judicial orders cited
1 Introduction
11 Methodology 12 Institutional framework
1
24
5
27
49
54
60
17
12
27
5
14
34
1918
43
81011
22
i
How Indiarsquos Solar and Wind Policies Enabled its Energy Transition A Decade in Review
Tables
Table ES1 Spheres of influence of the Centre and states
Table 1 The institutional structure of the power sector
Table 2 Evolution of central policies for utility-scale wind and solar energy ndash 2010ndash2019
Table 3 Snapshot of VGF schemes
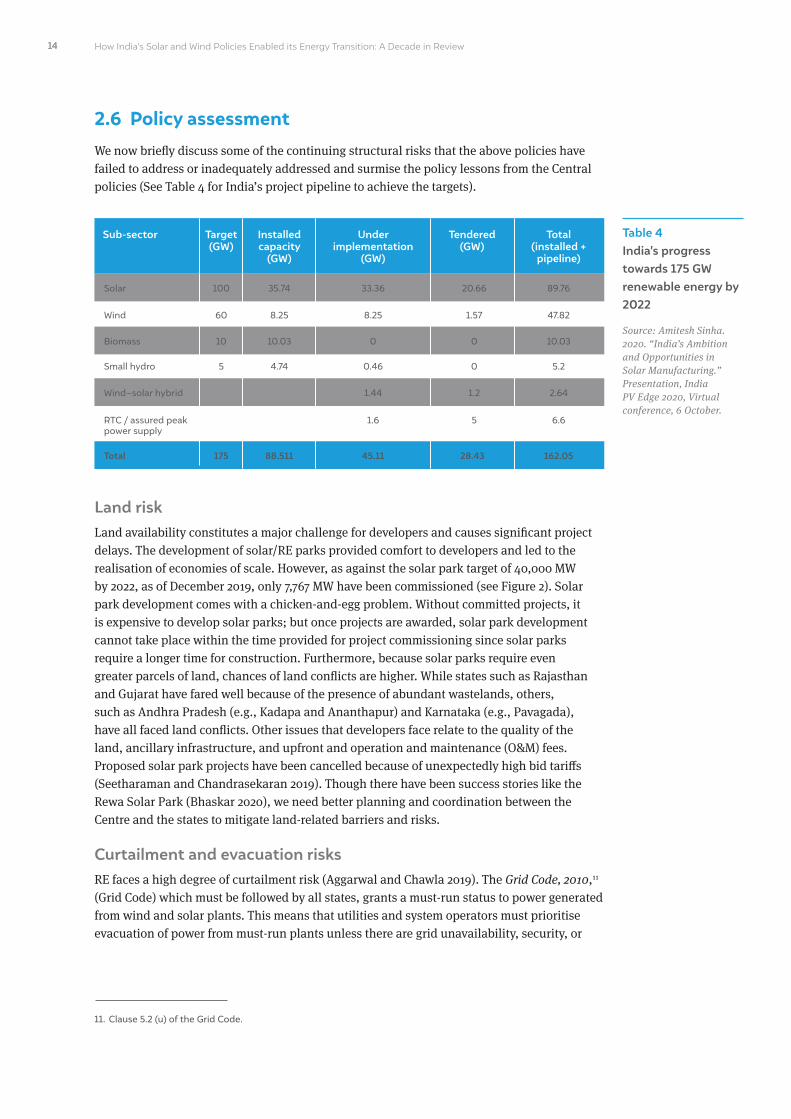
Table 4 Indiarsquos progress towards 175 GW renewable energy by 2022
Table 5 MoP trajectory for RPO
Table 6 Resource-rich states are also the highest buyers of RECs
Table 7 REC floor prices and forbearance prices have consistently fallen
Table 8 Average size of a registered plant as of FY 2018
Table 9 Targets specified under policies and actual achievements
Table 10 2010ndash2014 Developments that held back RE deployment and associated risks that remained
Table 11 Timeline of the key events in the AP story
Table 12 Banking charges and conditions across RE-rich states
Figures
Figure ES1 Pace of capacity addition in wind and solar projects has slowed down
Figure ES2 Policy focus of the states
Figure ES3 Developments across project deployment and operations
Figure ES4 Lessons from policy evolution
Figure ES5 Varied and evolving challenges for RE growth
Figure ES6 Signals of disruption of the existing business models of investors
Figure 1 The rate of growth in solar and wind capacity addition is slowing down (2008ndash2020)
Figure 2 The pace of solar park development under the Central scheme has been slow (31 December 2019)
Figure 3 Competitive bidding in wind brought down the tariffs significantly
Figure 4 Compliance with RPOs is uneven among states and discoms
Figure 5 RECs consistently remain unsold in the market
Figure 6 The registration of new projects under the REC mechanism has reduced
Figure 7 RE resource potential is concentrated in western and southern India
Figure 8 Solar and wind capacity increased rapidly 2014 onwards
Figure 9 Average module (multicrystalline) prices have continiously declined (2011ndash2019)
Figure 10 Solar tariffs discovered in Indian auctions
Figure 11 Gujarat saw the largest wind capacity additions among the wind-rich states (2016ndash2020)
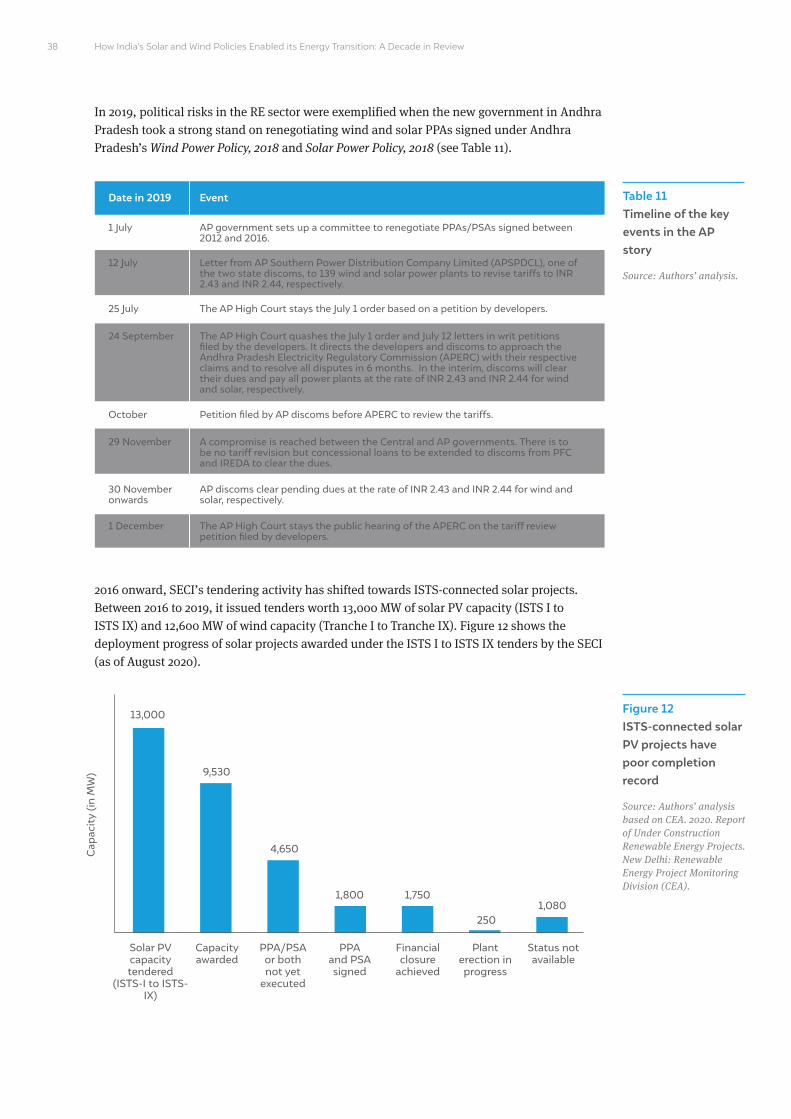
Figure 12 ISTS-connected solar PV projects have poor completion record
Figure 13 The rate of commissioning of wind projects has been slow (August 2020)
ii
4
678
10
14
19
22
23
24
2930
34
38
42
ii
iv
v
viii
vii
viii
2
12
13
20
21
23
27
31
35
36
37
38
39
Acronyms
AAPERC Andhra Pradesh Electricity Regulatory Commission
APPC average power purchase cost
APSPDCL Andhra Pradesh Southern Power Distribution Company Limited
AD accelerated depreciation
APTEL Appellate Tribunal of Electricity
BERC Bihar Electricity Regulatory Commission
BREDA Bihar Renewable Energy Development Authority
CAG Comptroller and Auditor General of India
CEA Central Electricity Authority
CERC Central Electricity Regulatory Commission
COVID-19 coronavirus disease 2019
CPP captive power plants
CST central sales tax
DCR domestic content requirement
DRE distributed renewable energy
EA Electricity Act 2003
FiT feed-in tariffs
FY financial year
GBI generation-based incentive
GERC Gujarat Electricity Regulatory Commission
GST goods and services tax
GUVNL Gujarat Urja Vikas Nigam Limited
GW giga watt
IEGC Indian Electricity Grid Code
INR Indian rupee
InSTS intra-state transmission system
IRP integrated resource planning
ISTS inter-state transmission system
KERC Karnataka Electricity Regulatory Commission
KPCL Karnataka Power Corporation Limited
KREDL Karnataka Renewable Energy Development Limited
LC letter of credit
LTA long-term access
MERC Maharashtra Electricity Regulatory Commission
MNRE Ministry of New and Renewable Energy
MoP Ministry of Power
MoSPI Ministry of Statistics and Programme Implementation
How Indiarsquos Solar and Wind Policies Enabled its Energy Transition A Decade in Review
MPERC Madhya Pradesh Electricity Regulatory Commission
MSEDCL Maharashtra State Electricity Distribution Company Limited
MW mega watt
MWh mega watt-hour
NAPCC National Action Plan on Climate Change
NLDC National Load Despatch Centre
NREDCAP New and Renewable Energy Development Corporation of AP Limited
NSM National Solar Mission
NTP National Tariff Policy
NVVN NTPC Vidyut Vyapar Nigam Limited
OampM operation and maintenance
OEMs original equipment manufacturers
PGCIL Power Grid Corporation of India Limited
PIB Press Information Bureau
POSOCO Power System Operation Corporation Limited
PPA power purchase agreement
PSA power sale agreement
PSERC Punjab State Electricity Regulatory Commission
PSM payment security mechanism
PSPCL Punjab State Power Corporation Limited
PV photovoltaic
RBI Reserve Bank of India
RE renewable energy
REC renewable energy certificate
RERC Rajasthan Electricity Regulatory Commission
RES renewable energy sources
RPO renewable purchase obligation
SECI Solar Energy Corporation of India Limited
SERC state electricity regulatory commission
STU state transmission utility
TOD time of day
TSERC Telangana State Electricity Regulatory Commission
TNERC Tamil Nadu Electricity Regulatory Commission
UPERC Uttar Pradesh Electricity Regulatory Commission
UPNEDA Uttar Pradesh New and Renewable Energy Development Agency
VAT value-added tax
VGF viability gap funding
WTO World Trade Organisation
Executive summary
In 2015 India announced ambitious targets for renewable energymdash175 GW by 2022mdashone of the largest expansion initiatives in the world Just four years later at the United
Nations Climate Action Summit 2019 the Prime Minister of India pledged to increase Indiarsquos renewable energy (RE) capacity to 450 GW by 2030 (PIB 2019) Indiarsquos journey to reaching these targets is at a critical juncture The pace of capacity addition in utility-scale wind and solar power which saw a rapid increase during 2014ndash2017 has since slowed down (Figure ES1)
Image iStock
i
How Indiarsquos Solar and Wind Policies Enabled its Energy Transition A Decade in Review
Figure ES1 Pace of capacity addition in wind and solar projects has slowed down
Source CEA 2019 Growth
of Electricity Sector in
India From 1947-2019
New Delhi CEA MoP
CEA 2020 All India
Installed Capacity as on 31
December 2019 New Delhi
CEA
Private investment has shaped deployment trajectories so far Today solar and wind technologies have advanced supply chains have strengthened and expertise has developed Despite the highs and lows investor confidence in Indiarsquos RE sector continues to remain robust Further many factors favour investments in RE It has proved itself to be resilient in times of crisis including the COVID-19 induced shocks in 2020 There are strong signals that RE is a preferred choice not just because of its green attributes but because of its favourable cost economics for all stakeholders
Evolving policies at the Central and state level have played a significant role in building investor confidence From our study of the evolution of the sector we learn that the initial policies were instrumental in propelling RE growth Every time a roadblock emerged India has been successful in testing and identifying alternate approaches and solutions Some of these innovative approaches include tariff bundling encouraging solar parks to benefit from economies of scale creating payment security mechanisms to address counterparty risks encouraging solarndashwind hybrid parks to improve utilisation factors testing and introducing protocols and mechanisms such as security constrained economic dispatch (SCED) a real-time market (RTM) market based economic dispatch (MBED) and a green term-ahead market (GTAM) to optimise grid integration costs etc However a mixture of legacy issues and recent developments threaten the current business models and existing policies may no longer be sufficient to ensure continued growth of the sector
Both the Central government and the state governments have different spheres of influence (Table ES1) affecting the power sector Hence both Central and state policies need to be studied to understand the functioning and evolution of the sector
Table ES1 Spheres of influence of the Centre and states
Source Authorsrsquo analysis
STATES
Set the broader policy direction for the electricity sector under the Electricity Act 2003 (EA)
Primary responsibility and control over the national grid Setting technical standards for the grid to be maintained by the states
Set bidding guidelines for power procurement
Set renewable purchase obligations (RPOs)
Operate with independence within the overarching framework set by the Centre
Directly influence land availability grid connectivity and build-out of intra-state transmission and distribution infrastructure Determine applicable charges to use infrastructure
Power procurement for supply to consumers
Set tariffs and cross-subsidy levels that affect end consumer and hence consumption of power
CENTRE
ii
Growth rate (wind) Growth rate (solar)
0 0
5000 10
10000 20Inst
alle
d c
apac
ity
(MW
)
Gro
wth
rat
e
1500030
2000040
2500050
3000060
35000
70
40000
80
90
2012-13 2013-14 2014-15 2015-16 2016-17 2017-18 2018-19 2019-20
Wind capacity Solar capacity
9
79
14
56
11
42
81 8276
1521
5 5
30
6
24
Note Figures for 2019-20 are only up to December 2019
iiiExecutive summary
Central policies kickstarting solar but leaving wind behindThe initial drivers for RE capacity addition were fiscal financial and tax incentives like accelerated depreciation generation-based incentives and feed-in tariffs (FiTs) determined by state commissions Wind turbine manufacturers were the first movers The de-licensing of generation under the Electricity Act 2003 (EA) set the stage for private investments in RE However the introduction of the National Solar Mission (NSM) in 2010 brought about a massive jump in solar capacity addition and turned the spotlight to utility-scale RE projects The NSM addressed offtake and payment risks with creditworthy trading intermediaries signing long-term power purchase agreements (PPAs) with project proponents The payment and offtake risks arose from the higher costs of solar power as opposed to prevailing conventional power tariffs and poor financial health of distribution companies or discoms (primary bulk procurers of power) The NSM progressed from a FiT regime to competitive bidding and was successful in increasing solar capacity deployment in the country from just 2 MW in 2007ndash08 to 3744 MW in 2014ndash15 (CEA 2019)
Competitive bidding also became mandatory for wind power from 2017 However it did not see the same level of success as solar While tariffs did come down the rate of growth of wind capacity also reduced (see Figure ES1) because the low tariffs disrupted the business model of existing players who were also equipment manufacturers The future trajectory of wind deployment remains to be seen with solar tariffs continuously falling and the evolution of the models adopted by independent RE power producers
Critical requirements that Central policies have not fully tackled are those of timely procurement of suitable land timely construction of evacuation and transmission facilities and minimising curtailment These are also the areas in which states have significant roles and authority The Ministry of New and Renewable Energy (MNRE) introduced the Solar Park Scheme in 2017 to address land-related issues and fast-track deployment through land aggregation and access to the Central transmission network However the schemersquos target of setting up at least 50 solar parks by 2022 is still distant (MNRE 2020) It has been unable to solve coordination issues and the ability of the Centre in developing schemes to address land issues is limited
Inadequate demand creation mechanisms
Initially in the absence of cost-competitive tariffs large buyers of power were mandated to purchase RE through renewable purchase obligations (RPO) under the National Tariff Policy 2006 in a bid to create demand for RE The EA authorises state regulators to set their own targets and regulations on RPOs In subsequent years the Ministry of Power (MoP) and the MNRE made multiple attempts to nudge states to set higher RPO targets and ensure strict compliance However our analysis shows that there have been considerable lags in both
How Indiarsquos Solar and Wind Policies Enabled its Energy Transition A Decade in Review iv
Figure ES2 State concerns that remain unaddressed in Central policies till 2014 and beyond
Source Authorsrsquo analysis
We find that the reasons for middling compliance with RPO targets are
bull Mismatch between the incentives for a RE-rich state to host an RE power plant and a RE-deficit state to buy either power or RE certificates (RECs) from these power plants This has resulted in RE-rich states having the highest compliance with RPOs while RE-deficit states do not see sufficient benefits or strict enforcement to be pushed to fully comply with their RPOs This has in turn affected the ability of even RE-rich states to increase their rates of deployment and RPO compliance
bull Enforcement mechanisms are weak A framework for regular monitoring of compliance is absent Enforcement of RPO by state regulators is not strict enough
Currently apart from setting up inter-state projects there are no other mechanisms to equitably share the costs of hosting RE projects to supply power to other states Further despite RE tariffs attaining grid parity investors continue to rely on RPOs for demand creation indicating deeper causes obstructing further RE penetration in markets Inadequate compliance of Central policies by states also point to certain legitimate state concerns that may not have been addressed (Figure ES2)
Centre and states have different drivers for promoting REWe also note that the main drivers for promoting RE are slightly different for the Centre and the states While the Centre initially emphasised energy security and climate change mitigation the states were keen to obtain the benefits of private investment and job creation It is only lately that the Centre has also emphasised the job creation and domestic manufacturing potential in RE
Most RE-deficit states are inclined to meet their RPO targets mostly through local deployment even if the local deployment is inadequate to meet the targets This is particularly true for solar which is a more abundant and widespread resource throughout the country State-level RPO regulations compliance provisions participation in REC markets and achievement levels demonstrate this However with stricter enforcement measures and falling tariffs the inter-state transmission system (ISTS) procurement of wind and solar power has seen a rise
Hosting RE plant attracts additional balancing costs This means states do not have incentive to host plants for self-consumption as well as export RE power unless directly connected to the central grid (partially addressed)
Severe financial stress on discoms leading to inability in spending towards compliance of RPOs or maintaining payment security (continues to be unaddressed)
Inadequate representation of state concerns before the Centre for policy making setting national objectives setting RPO targets etc (continues to be unaddressed)
Different drivers for the Centre and the states to incentivize RE
Energy security and climate change drives the Centre while investments job creation and resulting cost of system operation matter for the states (partially addressed)
vExecutive summary
Lack of enthusiasm of states in the high-tariff era
State-level institutions have the power and responsibility to ease land procurement for projects facilitate connectivity to the grid enable the construction of transmission infrastructure and ensure offtake of the power generated from the plants From our analysis of the RE policies of eight RE-rich states and three RE-deficit states we find that policies vary widely on these fronts (Figure ES3)
Pre-2014 when RE tariffs were still quite high the policies of even the RE-rich states did not provide a lot of support to private investors in the sector The responsibility of obtaining land was placed on the developers themselves Even though the states notified their own RE policies they did not meet their targets States like Gujarat and Rajasthan saw considerable capacity deployment under the NSM in this period owing to the easy availability of land and high wind and solar potential Charanka Solar Park in Gujarat set up in 2012 was successful in attracting investors This inspired the push towards establishing more solar parks in the country Because evacuation infrastructure was inadequate state policies required developers to finance and construct the required infrastructure at least till the interconnection point
Figure ES3 Developments across project deployment and operations
Source Authorsrsquo analysis
The RE-rich states covered are Andhra Pradesh Gujarat Karnataka Madhya Pradesh Maharashtra Rajasthan Tamil Nadu and Telangana and the RE-deficit states covered are Bihar Punjab and Uttar Pradesh
HIGH
TARIFF ERA
LOW
TARIFF ERA
RE-rich states
Responsibility on developers
Success of Charanka solar park inspired solar park policy
Developers required to construct evacuation infrastructure upto grid connection point
Feed-in-tariff
Procurement for use only within the state
High curtailment High curtailment
High curtailment
Older RE PPA renegotiations
Low utility-scale RE capacity Evacuation constraints visible in few instances
No policy focus
No policy focus
Feed-in-tariff
Decentralised power emphasised
Competitive bidding
Export of power outside the state begins to be promoted
Fewer new PPAs being signed
Competitive bidding
No focus on inter-state power purchase but procurement from central intermediaries has increased
Fewer new PPAs being signed
Solar parks and facilitation of land procurement
Land availability remains a concern especially for wind
States participating in Centre led transmission infrastructure development However progress is slow
Facilitation of land procurement by state agencies
However land availability remains a concern
No policy focus
RE-rich statesRE-deficit states RE-deficit states
LAND
GRID CONNECTION
POWER PROCUREMENT
MODE
PROJECT OPERATION
How Indiarsquos Solar and Wind Policies Enabled its Energy Transition A Decade in Review
However beyond the interconnection point transmission infrastructure continues to remain a challenge This coupled with the financial difficulties of the distribution utilities led to the severe curtailment of RE power The state policies only incentivised RE project development that supplies power to their own state discoms Some states like Maharashtra Karnataka and Andhra Pradesh even made it mandatory to sell electricity only to discoms within their borders and obligated entities within the state
Lowering tariffs corresponded with increased state promotion of RE but legacy issues came in the way The year 2014 marked the beginning of a significant departure from the past Many developments favoured the RE sector and Central and state policies found greater synergy As RE tariffs fell steeply states moved to incentivise large-scale projects including solar parks They sought to capitalise on investor interest in this sector and states like Andhra Pradesh extended the incentives available to other industry like land allotment facilitation of clearances tax incentives etc to RE power plants There was a shift in focus from setting up projects for self-consumption to supporting projects for the export of power to other states Rajasthan Maharashtra and Andhra Pradesh provided developers with incentives such as time bound open access approval facilitating land procurement exemption on charges etc for setting up inter-state projects States also turned their attention to facilitating deployment and many policies tasked their state agencies with facilitating revenue land procurement for the planned and systematic development of projects
However the PPAs signed in the high-tariff era have become a sore thumb for RE-rich states These agreements which were signed for 20ndash25 years must be honoured by discoms even though cheaper power is available States attempted to push back against these obligations as early as 2014 when Gujarat moved to renegotiate tariffs Andhra Pradesh made the most recent attempt in 2019 These moves by states have added to the set of risks to be mitigated In all these cases the states were ultimately unsuccessful in renegotiating tariffs as their actions were struck down in courts or due to interventions by the Central Government However states continue to employ other means like curtailment to reduce their obligations under expensive contracts Considering that the state bears these costs at the end we need a more equitable solution that can ensure a fair transition for all players without creating uncertainty for investors
In RE-deficit states state policies emphasised decentralised power as opposed to utility-scale projects Their primary drivers were the RPO targets and the potential for private investment For example Punjab and Bihar focused on ensuring payment security and ease of doing business in their states The existing policies of RE-deficit states do not exhibit intention to increase their inter-state purchase of RE for example they do not lay out any roadmap or explicit commitment of procuring power from any of the trading intermediaries like Solar Energy Corporation of India Limited (SECI) or from other states to meet their RPOs Any purchase made is unplanned and this prevents RE-rich states and intermediaries from accurately forecasting demand
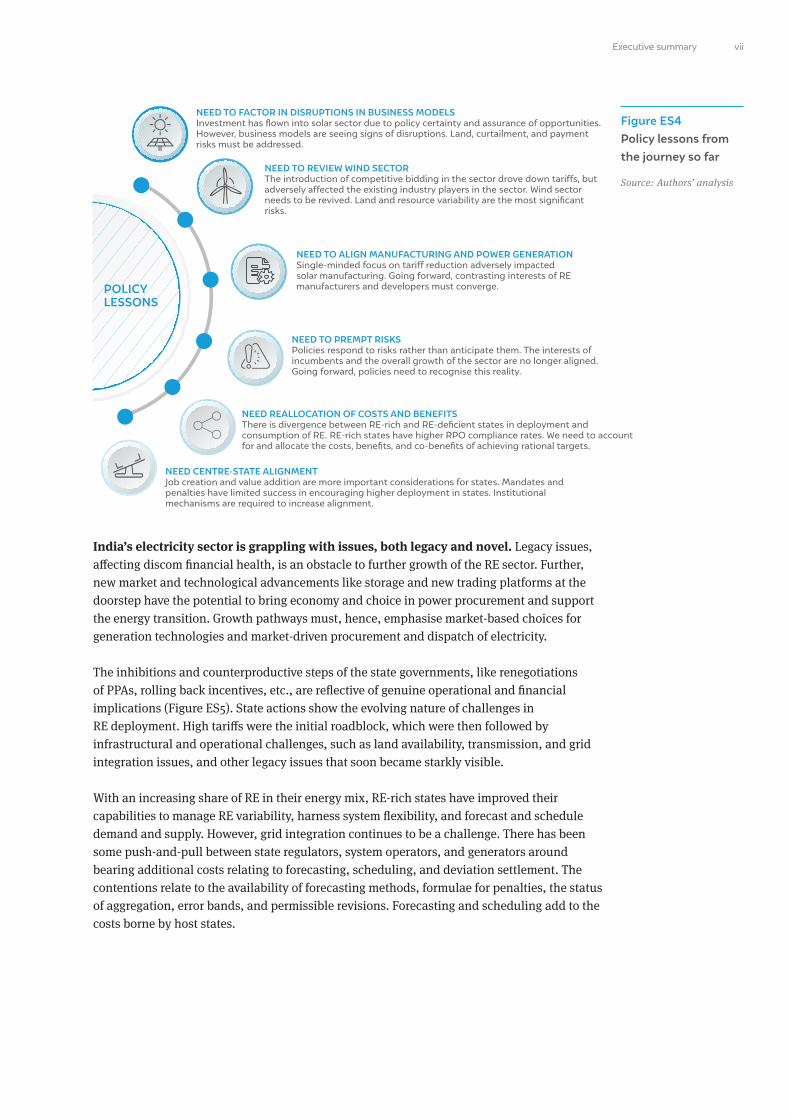
Varied and evolving challenges have to be tackled to achieve 450 GW RE target by 2030The existing policies have resulted in tremendous outcomes though short of the targets we set for ourselves As we advance in our energy transition journey it is apt that we incorporate the policy lessons from the journey so far (Figure ES4)
vivivi
Indiarsquos electricity sector is grappling with issues both legacy and novel Legacy issues affecting discom financial health is an obstacle to further growth of the RE sector Further new market and technological advancements like storage and new trading platforms at the doorstep have the potential to bring economy and choice in power procurement and support the energy transition Growth pathways must hence emphasise market-based choices for generation technologies and market-driven procurement and dispatch of electricity
The inhibitions and counterproductive steps of the state governments like renegotiations of PPAs rolling back incentives etc are reflective of genuine operational and financial implications (Figure ES5) State actions show the evolving nature of challenges in RE deployment High tariffs were the initial roadblock which were then followed by infrastructural and operational challenges such as land availability transmission and grid integration issues and other legacy issues that soon became starkly visible
With an increasing share of RE in their energy mix RE-rich states have improved their capabilities to manage RE variability harness system flexibility and forecast and schedule demand and supply However grid integration continues to be a challenge There has been some push-and-pull between state regulators system operators and generators around bearing additional costs relating to forecasting scheduling and deviation settlement The contentions relate to the availability of forecasting methods formulae for penalties the status of aggregation error bands and permissible revisions Forecasting and scheduling add to the costs borne by host states
viiExecutive summary
Figure ES4 Policy lessons from the journey so far
Source Authorsrsquo analysis
NEED TO FACTOR IN DISRUPTIONS IN BUSINESS MODELSInvestment has flown into solar sector due to policy certainty and assurance of opportunities However business models are seeing signs of disruptions Land curtailment and payment risks must be addressed
NEED CENTRE-STATE ALIGNMENTJob creation and value addition are more important considerations for states Mandates and penalties have limited success in encouraging higher deployment in states Institutional mechanisms are required to increase alignment
NEED TO REVIEW WIND SECTORThe introduction of competitive bidding in the sector drove down tariffs but adversely affected the existing industry players in the sector Wind sector needs to be revived Land and resource variability are the most significant risks
NEED REALLOCATION OF COSTS AND BENEFITSThere is divergence between RE-rich and RE-deficient states in deployment and consumption of RE RE-rich states have higher RPO compliance rates We need to account for and allocate the costs benefits and co-benefits of achieving rational targets
NEED TO ALIGN MANUFACTURING AND POWER GENERATIONSingle-minded focus on tariff reduction adversely impacted solar manufacturing Going forward contrasting interests of RE manufacturers and developers must converge
NEED TO PREMPT RISKSPolicies respond to risks rather than anticipate them The interests of incumbents and the overall growth of the sector are no longer aligned Going forward policies need to recognise this reality
POLICY LESSONS
viiExecutive summary
How Indiarsquos Solar and Wind Policies Enabled its Energy Transition A Decade in Review
Policies must pre-empt risks and support transition to a market-driven sectorGoing forward policy decisions must enable the overall growth of the sector rather than target scale through incumbent models The incumbent business models and market mechanisms are at the cusp of disruptions caused due to natural market progression technological advancement and discomsrsquo responses in meeting their challenges (Figure ES6)
Figure ES6 Signals of disruption to the existing business models of investors
Source Authorsrsquo analysis
Figure ES5 Operational and financial challenges in increasing RErsquos share in the energy mix
Source Authorsrsquo analysis
Managing intermittency through forecasting scheduling etc
Land and infrastructure availability and cost
RE growth
Cost-benefit allocation between RE-rich and RE-poor states
Transmission network availability access and cost
Legacy issues expensive PPAs fixed cost payment etc
viiiviiiviii
Distance between our targets and distribution companiesrsquo capacity to offtake eg SECI unable to find buyers This affects growth potential of project developers
Increased adoption of distributed RE including rooftop solar by commercial and industrial players will lead to discoms losing out on high paying consumers further affecting finances
Impact of storage technologies on discom procurement Storage can help manage intermittency and reduce power procurement needs of discoms
Increase in additional costs that developers need to factor in to promote manufacturing RE-waste management managing RE variability etc
States pushing back on their obligations eg Andhra Pradesh attempting to renegotiate contracts This affects financials of existing projects and risk perception for new projects
Changing profile of investors ndash higher returns expectations market consolidation and exit of smaller players Only a few players currently occupy the field with the exit of smaller entities
Developments like MBED RTM GTAM etc show that electricity markets are transitioning towards more short-term and flexible markets Current model of long-term agreements will be unsustainable
Unlocking the demand for RE and capitalising on the immense opportunity that it presents requires innovative solutions that account for legacy issues and yet are forward looking The policies must anticipate these changes and prepare for them while investors need to hedge their bets and modify ways of doing business to continue to lead the energy transition
We recommend the following changes to the policy framework These are based on policy lessons from the study of the sectorrsquos evolution and anticipate the power sector transition that is upon us
bull Centrendashstate and inter-state alignment is essential Collaboration and coordination need to be prioritised instead of mandates and penalties Costs and benefits for all actors must be clearly accounted for An institutional framework must be created that increases Centrendashstate and intrandashstate coordination cooperation and engagement Resource planning budgetary allocations and policy priorities should be outcomes of these formalised processes
bull Institutional framework must build in planning coordination and analytical requirements Data collection management and analysis should be systematic Monitoring and reporting practices should be robust and continuous
bull Addressing counterparty risks will require transformation of RE procurement models Market mechanisms allow for the cost recovery and benefit sharing Capacity deployment must happen based on market mechanisms and market determined price signals PPA terms must reduce and sole priority in power procurement should be efficiency and flexibility for discoms Power procurement as a mechanism to support RE or any future technology will not be sustainable in India till discom finances are sorted out
bull Contrasting interests of RE manufacturers and developers must converge Supply chains must be diverse and resilient to shocks Investors must innovate and policy must support backward and forward integration in RE supply chains
bull Accelerating the flow of capital into the sector requires new investment models that can tap into diverse sources of finance and simultaneously enable the transition of the energy markets
ixExecutive summary ixExecutive summary ixExecutive summary
How Indiarsquos Solar and Wind Policies Enabled its Energy Transition A Decade in Review
Image iStock
Between 2016 and 2018 solar capacity in RE-rich states tripled recording a consecutive year-on-year growth rate of more than 70 per cent
From approximately 21 GW of utility-scale solar and wind capacity at the end of financial year (FY) 2012 (1 GW solar and 20 GW wind) India achieved 70 GW capacity by 31
September 2020 (32 GW ground-mounted solar and 38 GW wind) (MNRE 2020b) This growth story is undoubtedly remarkable Solar and wind energy have also proved to be resilient in times of crisis including during the COVID-19 pandemic in 2020 and have continued to attract investment and attention from policymakers
However the story of Indiarsquos solar and wind power generation is at a critical juncture The rate of growth of capacity addition has been slowing down (see Figure 1) Indiarsquos path to reaching an installed capacity of 160 GW by 2022 (100 GW for solar and 60 GW for wind) and 450 GW by 2030 is hindered by complex challenges They arise from the precarious financial health of distribution companies (discoms) (Garg and Shah 2020) the investment required to build associated infrastructure the dynamics of increasing market penetration of renewable energy (RE) while making fixed cost payments for thermal projects (PEG 2018) direct and indirect energy subsidies in favour of conventional fuels1 and difficulties in balancing the priorities of the Centre and states (Tongia Harish and Walawalkar 2018) Some of these challenges are not new especially the discom crisis and those of inadequate infrastructure However their impact on the growth of RE is significant For instance discoms are finding it challenging to continue to pay fixed costs for thermal assets while complying with the must-run status of RE Forecasting and scheduling are now critical for the integration of variable RE power with the grid These challenges in consuming the power generated from RE plants dissuades discoms from increasing their RE portfolio and hampers revenue from operating assets and further capacity addition These issues must be addressed on a priority basis to scale up RE capacity deployment and utilisation levels New technologies like storage new market platforms and a growing realisation of the benefits of decentralising power generation also have the potential to impact the utility-scale sector in new and unexpected ways
1 Introduction
1
1 These subsidies include oil and gas subsidies and coal subsidies by way of concessional taxes non-compliance or non-enforcement of pollution regulations direct benefit transfers on consumption public distribution at subsidised rates etc (Garg Viswanathan et al 2020)
Storage new market platforms and a realisation of the benefits of decentralising power generation have the potential to impact the utility-scale sector in new and unexpected ways
How Indiarsquos Solar and Wind Policies Enabled its Energy Transition A Decade in Review 2
Figure 1 The rate of growth in solar and wind capacity addition is slowing down (2008ndash2020)
Source CEA 2019 Growth of Electricity Sector in India From 1947-2019 New Delhi CEA MoP CEA 2020 All India Installed Capacity as on 31 December 2019 New Delhi CEA
Before we embark on a policy analysis to determine the best tools to address the above challenges we look back and study the sectorrsquos evolution and evaluate the policiesrsquo impact on RE As RE growth slows and faces newer challenges it is the right time to conduct such an analysis Such an exercise will enable us to understand what are the gaps in the existing policies that need to be mended to adapt to the changing dynamics and yet achieve our objectives The legislative architecture along with a diversity of stakeholders and their objectives and interests makes power sector policymaking and governance a complex space Therefore policy evaluation can be done through multiple lenses This study focuses on the evolving risks for project developers in the bulk RE procurement market and the policy response of the Centre and states to those risks
We focus on the bulk power procurement market because RE growth has been led by utility-scale wind and solar energy projects over this decade with discoms being the largest power purchasers2 While there are dedicated schemes and programmes for the scaling up of other renewable energy sources as well as for distributed RE (DRE) they are of a different nature than those of utility-scale RE since they operate at a more decentralised level3 Further the levels of risk and the challenges facing private investors are markedly different for utility-scale solar and wind on the one hand and distributed and other RE resources on the other However we will briefly discuss the impact of growth of DRE on utility-scale RE in our last section
11 MethodologyWe collated all Central and state policy documents from 2009ndash2019 We then created a comprehensive framework to review each Central and state policy For each policy we recorded the key drivers stated purpose and objectives targets key features and incentives provided budgetary outlays (if any) institutional arrangements beneficiaries stated reasons for amendments and risks that the policy intended to mitigate For Central policies we also identified the role required of the state governments The framework helped us examine the
2 Though the rooftop industry continues to mature with multiple market players innovative business models and new financing structures
3 This is a consequence of the failure to establish competitive markets for RE even though it is among the aims of the Electricity Act 2003 (EA) The gap in the official data which does not capture captive power projects demonstrates this failure
Wind capacity (in MW) Solar capacity (in MW)
0
5000
10000 76679344
1064712807
1689718485
2104323354
26777
3562637746
3404632280
2 2 6 32 941 1686 26323744
6763
21651
28181 34812
1228915000
20000
25000
30000
35000
40000
200
7-0
8
200
8-0
9
200
9-10
2010
-11
Year
Cap
acit
y (in
MW
)
2011
-12
2012
-13
2013
-14
2019
-20
2018
-19
2017
-18
2016
-17
2015
-16
2014
-15
2
This study focuses on the evolving risks for project developers in the bulk RE procurement market and the policy response of the Centre and states to those risks
3Introduction
alignment between Central and state objectives and targets and inconsistencies between and within the policies The key features of the policies we studied are set out in Tables A4ndashA6 of the Annexure We also conducted extensive secondary research to assess the actual performance of these policies actions and developments on the ground and the risks that they addressed
Our study contributes to policy research as it combines a national-level analysis with a close examination of the policies and their impacts at the state level RE resources are not uniformly spread across the country and some states have performed better than others We cover the following RE-rich and RE-poor states in this study
Solar and wind-rich states
bull Andhra Pradesh
bull Gujarat
bull Karnataka
bull Madhya Pradesh
bull Maharashtra
bull Rajasthan
bull Tamil Nadu
bull Telangana
Solar and wind-deficit states
bull Bihar
bull Punjab
bull Uttar Pradesh
The RE-rich states are the top eight in terms of resource potential and capacity addition in wind or solar power or both For the RE-poor areas we have picked states that are not only deficit in solar and wind but also lack alternative power sources like hydro or coal though they have biomass-based power capacity In all these states the power supply position access to energy and power sector infrastructure have evolved over the last decade
In this report we begin by briefly mapping out the institutional framework of the power sector to understand the different agencies that implement andor hinder the implementation of these policies We then trace the evolution of the Central policies which largely focus on supply-side risks Next we evaluate the demand-side measure renewable purchase obligations (RPOs) Subsequently we trace the key drivers and policy focus and evaluate policy performance first in the RE-rich states and then in the RE-deficit states For the state-level analysis we divide our assessment into policies pre- and post-2014 since 2014 marked a departure from the previous years in policymaking activity and its consequences We assess the policies based on the risks they were successful in addressing the risks that they left unaddressed and how they measure up to the next generation of challenges We conclude by pointing to the points of transformation of the sector and the nature of required policy focus going forward
We assess the policies based their success in addressing risks the risks they left unaddressed and how they measure up to the next generation of challenges
How Indiarsquos Solar and Wind Policies Enabled its Energy Transition A Decade in Review
12 Institutional framework The long history of policymaking in the power and RE sector has led to a proliferation of agencies and bodies (see Table 1) The legislative architecture under the Electricity Act 2003 (EA) allows states to autonomously undertake activities such as target-setting framing and enforcing regulations developing and implementing policy and setting up institutional mechanisms
However the Central Government sets the policy direction through its National Electricity Policy the National Tariff Policy and the National Electricity Plan which the state governments and regulators are required to follow These policy documents cover electricity planning project bidding and procurement tariff structures RPOs and optimum utilisation of resources and infrastructure
The Central Electricity Regulatory Commission (CERC) and state electricity regulatory commissions (SERCs) have parallel jurisdictions and functions with respect to promoting the generation of RE tariff determination and dispute resolution Typically CERC does not have the authority to provide policy guidance or issue directions to the SERCs However SERCs are bound by the technical rules guidelines and standards set by the CERC in the Indian Electricity Grid Code (IEGC) based on which they prepare their own state grid codes
Table 1 The institutional structure of the power sector
Source Authorsrsquo analysis
Regional and State Union Territory level
Central
Ministries
Statutory autonomous bodies
Regulators
Operating entities
Ministry of Power (MoP)ndashNodal ministry for the power sector Prepares the National Electricity Policy the National Tariff Policy and the National Electricity Plan
Ministry of New and Renewable Energy (MNRE)ndash Nodal ministry for increasing RE deployment in the country
Central Electricity Authority (CEA)
National Load Dispatch Centre (NLDC)
Bureau of Energy Efficiency (BEE)
Power Financial Corporation (PFC) REC Limited Indian Renewable Energy Development Agency (IREDA)ndash Provide financing and implement schemes for RE projects
National Institute of Wind Energy (NIWE) National Institute of Solar Energy (NISE) Central Power Research Institute (CPRI) etcndash Research and development institutes to estimate RE potential in the country and evaluate the latest technologies in power generation
Central Electricity Regulatory Commission (CERC)ndash Tariff determination dispute resolution preparing the Grid Code and Supply Code (to be followed by the operating entities) promote RE etc
Appellate Tribunal for Electricity (APTEL)ndash Appellate body for dispute resolution
Generation utilities eg NTPC NHPC Damodar Valley Corporation (DVC)
Transmission utilityndash Power Grid Corporation of India Limited (PGCIL)
Independent power producersndash projects connected to the Central grid
TradingMarket entitiesndash NTPC Vidyut Vyapar Nigam (NVVN) Solar Energy Corporation of India (SECI) etc
Relevant energy departments and ministries of the states union territories (UT)
Regional Load Dispatch Centres (RLDC)
Regional Power Committees
State Load Dispatch Centres (SLDC)
state nodal agencies (SNAs)ndash implement RE schemes and oversee RE deployment at the state
State Electricity Regulatory Commissions (SERC) and Joint Electricity Regulatory Commissions ( JERC)ndashTariff determination dispute resolution preparing the grid code and supply code (to be followed by the operating entities) promote RE etc
Generation utilitiesndash state-owned generators
Transmission utilities
Distribution utilities
Independent power producersndash projects connected to state grids
Tradingmarket entities
4
The trajectories of wind and solar have been varied yet have affected each other Often similar policies have had widely varying impact on wind and solar This section briefly
describes the policy scenario pre-2010 and then narrates the policy evolution in the last decade (See Table 2 for brief description of the policies) The section concludes with the assessment and lessons from this journey
21 Pre-2010 ndash private-sector participation and prioritising renewables The initial drivers for new and renewable energy were the successive oil crises in the 1980s that compelled the government to reduce the countryrsquos dependence on imported oil and focus on alternative sources of power RE was also one of the strategies to combat climate change
2 Evolution of Central policies
Image iStock
5
How Indiarsquos Solar and Wind Policies Enabled its Energy Transition A Decade in Review
The government has made accelerated depreciation (AD) of 100 per cent available for both wind and solar power generation since 1994 to incentivise RE capacity deployment
The enactment of the EA also intended to transform the state-controlled electricity sector into a competitive electricity market with private players regulated by the state (Kumar and Chatterjee 2012) Promoting environmentally benign policies is a stated objective of the EA and it envisages renewable sources of energy as a significant contributor to the electricity mix The de-licensing of electricity generation under the EA and the mandating of power procurement through competitive bidding under the National Tariff Policy 2006 (NTP 2006) were game-changing reforms towards increasing private-sector investments in power generation The NTP 2006 permitted discoms to procure RE at tariffs fixed by their respective SERCs also called feed-in tariffs (FiTs)4 The SERCs determined the FiTs based on their tariff determination regulations Central regulations in turn guided these regulations The CERC notified the first guidelines for tariff determination in 2009 [(CERC (Terms and Conditions for Tariff Determination from Renewable Energy Sources) Regulations 2009) (Tariff Determination Regulations)] The first generic tariff order determined utility-scale solar PV tariff of INR 1844 and wind power tariffs of INR 563 490 417 and 375 (for Wind Zones 1 2 3 and 4 respectively)5
The policiesrsquo cumulative effect was that by 2010 RE accounted for 97 per cent of the available installed power generation capacity in the country (MoP 2010) This capacity was mainly wind energy and bagasse-based cogeneration6 Successful demonstration projects led by the ministry and collaborations with global technology providers were key triggers of establishment of domestic manufacturing and supply chain in India (Ganesan et al 2014) The AD incentive was particularly useful for private entities who set up distributed and small-scale wind turbines to avail of it This domestic demand also supported development of wind manufacturing capacity in India (Sud 2015 Idam Infra 2016)
Solar power however was lagging Despite the available incentives there were no immediate responses from investors developers and most state governments primarily due to high technology costs Till March 2010 solar capacity remained at 6 MW Subsequently significant policy actions leading to cost reductions and investment commitments marked an upward growth trajectory (see Figure 1)
Table 2 Evolution of Central policies for utility-scale wind and solar energy ndash 2010ndash2019
Source Authorsrsquo analysis
Risks and barriers targeted to be mitigated benefits TechnologyPolicyscheme
Promotion of RE competitive bidding and RPO in National Tariff Policy 2006
National Solar Mission 2010
National Action Plan on Climate Change 2008
Wind
Solar
Creating demand for expensive RE power through RPOs
Policy certainty and continued government support for promotion of RE
Managing offtake risk by signing long-term power purchase agreements (PPA) and providing payment security
Policy certainty and continued government support for promotion of RE
Creating demand for expensive RE power through RPOs
Policy certainty and continued government support for promotion of RE
4 This flexibility was required because RE tariffs at this time could not be compared to those of conventional power However the NTP 2006 also noted that RE power would eventually have to compete with power from other sources at their full cost
5 Order dated 3 December 2009 issued by CERC in Petition No 2842009 titled Determination of Generic Levellised Generation Tariff httpwwwcercindgovin2009November09284-2009_final_3rdDecember09pdf
6 Due to its economic co-benefits bagasse-based cogeneration developed mostly in the sugar producing regions of India
6
Table 2 contdRisks and barriers targeted to be mitigated benefits
TechnologyPolicyScheme
GBI for grid interactive wind power projects 2009 and 2013
NSM Phase II Batch I 2013 (VGF Scheme)
Scheme for solar park development 2014
National Tariff Policy 2016
Commencement of competitive bidding in wind 2016
MNRErsquos policy for re-powering wind projects 2016
Financial incentives for setting up wind power projects
Managing offtake risk by signing long-term PPAs and providing payment security
Low tariffs for discoms through competitive bidding
Financial support for project developers
Delay and roadblocks in land identification aggregation and acquisition
Delays in obtaining approvals and clearances
Risk of conflict with environment or social impact assessment
Lowering cost of supporting infrastructure and services
Creating demand for RE by setting common national trajectory for RErsquos share in consumption
Managing offtake risk by signing long-term PPAs and providing payment security
Low tariffs for discoms through competitive bidding
Support to utilize wind resources efficiently
NSM Phase I Batch II (Bundling scheme) 2011
Green Energy Corridor project 2013
NSM Phase II Batch III 2015
NSM Phase II Batch IV (State specific VGF scheme) 2016
MoPrsquos order on waiver of inter-state transmission charges and losses 2016
Competitive bidding guidelines for solar 2017
Managing offtake risk by signing long-term PPAs and providing payment security
Lowering tariff for discoms by bundling thermal and solar power
Addressing transmission risk and offtake risk by reducing congestion on grid
Managing offtake risk by signing long-term PPAs and providing payment security
Low tariffs for discoms through competitive bidding
Managing offtake risk by signing long-term PPAs and providing payment security
Low tariffs for discoms through competitive bidding
Financial support for project developers
Financial incentive for export of power outside the state
Managing offtake risk by signing long-term PPAs and providing payment security
Low tariffs for discoms through competitive bidding
Must-run status in Grid Code 2010
Introduction of renewable energy certificates (REC) 2010
Addressing transmission and curtailment risk
Creating mechanism to broaden the demand base
7Evolution of Central policies
How Indiarsquos Solar and Wind Policies Enabled its Energy Transition A Decade in Review
22 Post-2010 policies for solar The Jawaharlal Nehru National Solar Mission (NSM) notified in January 2010 was a turning point in the RE story The NSM was one of eight missions developed as part of Indiarsquos National Action Plan on Climate Change (NAPCC) Its primary objective was to develop and deploy solar energy technologies including utility-scale distributed solar and solar thermal energy It targeted the entire ecosystem of solar energy deployment and included measures to support research and development human resource development the increase of technical capacity and awareness of these technologies Such measures included providing technical assistance training customs and excise duty concessionsexemptions on capital equipment critical materials components and project imports ease of doing business and enabling domestic manufacturing through exemptions and incentives The NSM laid out a phase-wise approach until 2022 that brought about policy certainty
The risks for investors and financiers were considerable The upfront costs were high while returns were not guaranteed (since the technology had not yet proven its track record within India) Further even if discoms were willing to sign power purchase agreements (PPAs) low connectivity and transmission capacity hindered offtake However more significant was the payment risk arising due to the poor financial health of discoms The payment risk adds as much as 107 per cent of the additional risk premium to the cost of debt (Atal and Shrimali 2018)
To counteract the payment risk the NSM devised an arrangement whereby NVVN (NTPC Limitedrsquos trading arm) would purchase power from the solar developer for onward sale to state discoms under a power sale agreement (PSA) The standard PSA included a clause stating that in case the discom failed to make timely payments NVVN could invoke the tripartite agreement signed by the Central Government the relevant state government and the Reserve Bank of India (RBI)7
The NSM envisaged that the key driver for promoting solar power would be the RPO mechanism with the FiT and PPA duration determined by the CERC It aimed to achieve parity of solar and coal tariffs by 2030
NSM was to be implemented in three phases The target for Phase I which lasted till 2013 was 1000 MW The initial target of 20 GW was increased to 100 GW in 2015 to be achieved by December 2022 As of November 2020 3691049 MW of solar power capacity has been installed (MNRE 2020b)
Competitive bidding guidelines for wind 2017
Managing offtake risk by signing long-term PPAs and providing payment security
Low tariffs for discoms through competitive bidding
MoP and MNRErsquos order on opening and maintaining adequate LC as PSM under PPAs by distribution licensees 2019
Addressing payment risk from discoms
7 Article 648 of the Standard Draft PSA between NVVN and Distribution Utility (2010) httpwwwnvvncoinDRAFT20PSA_NVVN-Discom_March2029202010pdf In case a state discom defaulted on any payment obligations NVVN could invoke this agreement and the pending dues could be routed to it through the RBI The Centre can then deduct the relevant amount from the annual fund transfers from the Centre to the state which is the most significant source of state government revenue
Table 2 contd
88
Phase IThe guidelines to operationalise the first phase of NSM were notified in July 2010 Many projects had already begun construction before this notification Such projects were permitted to migrate to the NSM and sign PPAs with NVVN The NSM selected fresh projects based on the discounts that the developers were offering on CERC-approved tariffs applicable as of the date of submission of their applications These projects needed to be commissioned within 12 months of the developers signing the PPA In Phase I the NVVN could bundle unallocated conventional power procured from the NTPC and sell it to discoms to average the tariffs
For payment security the standard PSA required the buying utility to open a six-month letter of credit (LC) backed by an escrow account in favour of NVVN Further under an order dated 30 June 2011 the MNRE created a separate payment security fund of INR 486 crore However despite the implicit state guarantee transaction advisers suggested that investors be cautious The standard PPA was not considered bankable (Sustainability Outlook 2010 Jog 2013) High project costs and unproven technology increased the risk Developers were also concerned that the PPA prices could be reduced during its duration
Additionally domestic content requirement (DCR) that required polycrystalline photovoltaic (PV) cells and modules being used to be manufactured in India was imposed on NSM projects The DCR distorted the market towards other PV technologies like thin film (Paliwal and Hamberg 2015) and adversely affected the existing manufacturing base in India that predominantly manufactured polycrystalline PV DCR would have constrained developersrsquo technology choices and did not benefit the domestic manufacturers (Ganesan et al 2014)
The government eventually withdrew DCR after failing to defend the move before the World Trade Organisation (WTO) in a dispute initiated by the United States of America in 2013 on grounds that DCR was discriminatory against imports under the lsquoNational Treatmentrsquo principle (WTO 2016)
Phase I was successful in achieving its target of installed capacity of 1000 MW of grid connected power It also served to demonstrate the technology and the intermediary arrangement under the NSM However even before the Phase II guidelines were notified developers and financiers raised concerns about delayed payments To manage this risk the lenders demanded that NVVN be made a beneficiary of the tripartite agreement (Jog 2013)
Phase II
The Solar Energy Corporation of India Limited (SECI) was designated as the implementing agency for Phase II SECI a public-sector company is an electricity trading licensee and signs PPAs with developers to purchase power for on-sale to discoms and other consumers In February 2017 SECI became a beneficiary of the tripartite agreement between the Government of India state governments and the Reserve Bank of India Consequently ICRA Limited (a credit rating agency) enhanced SECIrsquos credit rating from AA- to AA+ This increased the bankability of SECI projects SECI was required to create a payment security fund of INR 500 crore to cover for three monthsrsquo payment By 2014 SECI received bids worth 2170 MW under reverse bidding conducted by it and signed PPAs and PSAs with state discoms (SECI 2014) Phase II focused on providing viability gap funding (VGF) to project developers However the utility of the VGF initiative is questionable as the actual expenditure of the committed funds progressively declined across the various schemes (see Table 3) After the notification of the
9Evolution of Central policies 9Evolution of Central policies
JNNSM Phase I was successful in achieving its target of 1000 MW grid-connected power However developers and financiers raised concerns about delayed payments even before the notification of Phase II guidelines
How Indiarsquos Solar and Wind Policies Enabled its Energy Transition A Decade in Review
Table 3 Snapshot of VGF schemes
Source Authorrsquos adaptation from MNRE 2020 Annual Report 2019ndash20 New Delhi MNRE and SECI 2019 8th Annual Report 2018ndash19 New Delhi SECI
Allotted and commissioned capacity
VGF per MW Estimated expenditure (in INR crore)
Actual expenditure (in INR crore)
Bidding parameter
TariffYear NSM Phase II batch
2013
2016
2015
750 MW Batch I
Phase II Batch IV
2000 MWBatch III
Discount on VGF
Discount on VGF or tariffAfter 2017 ndash only tariff
Discount on VGF or tariff
INR 545 per kWh INR 475 with AD
No fixed tariff
INR 443 per kWh for the first year annual escalation of INR 005 kWh for the next 20 years with the maximum tariff capped at INR 643 kWh
680 MW
Awarded 3420 MW (as on 31 December 2019)2470 MW capacity commissioned in the states of Gujarat Odisha Maharashtra Rajasthan UP Andhra Pradesh (Kadapa Solar Park) and Karnataka (Pavagada Solar Park) (as on 31 December 2019)
Awarded 2155 MW2295 MW capacity reported as commissioned in the states of Andhra Pradesh Chhattisgarh Karnataka Maharashtra and Uttar Pradesh at both solar park and non-solar park locations (as on 31 December 2019)
The lower of INR 25 crore and 30 per cent of project cost
INR 1 crore for open category
125 for DCR projects
The lower of INR 25 crore and 30 per cent of project cost
1875
5050
1875
742
19163
742
Phase III Phase III of the NSM is currently underway The target is to achieve 100 GW of cumulative solar capacity by 2022 The bidding is conducted under the Solar Bidding Guidelines Various intermediary procurers are participating in conducting the auctions including SECI NTPC and NHPC Limited As of March 2020 solar capacity of 2135 GW was under various stages of implementation and 3127 GW was under different stages of bidding (ETEnergyWorld 2020)
23 Impact of other policies on project deploymentAfter the high-growth period of 2016ndash2018 capacity addition slowed in 2018ndash19 which was a cause for concern It represents a break in the growth momentum There are multiple contributory factors for the slowdown
Guidelines for Tariff Based Competitive Bidding Process for Procurement of Power from Grid Connected Solar PV Power Projects (Solar Bidding Guidelines) in 2017 tariff became the sole bidding parameter and VGF fell into disuse
1010
The introduction of the Goods and Services Tax (GST) in 2017 created considerable confusion and administrative challenges8 It decelerated the growth momentum and raised project costs by 10ndash15 per cent (Soman et al 2019) The imposition of safeguard duties on imports of solar cells and modules from China and Malaysia was introduced in 2018 Eventually these costs were made good to the project developers by their PPA counterparties under the lsquochange-in-lawrsquo clause of the PPA However the uncertainty surrounding its timeline increased cost of procuring components from exempted jurisdictions and litigations before the regulatory commissions to get the duty adjudged as change-in-law added to the costs of under-construction projects and delayed new projects (Thomas 2018 Jai 2018) Payment delays by discoms renegotiation threats curtailment tariff ceilings on bids etc also caused many investors to delay their investment decisions and many SECI tenders were undersubscribed (Buckley and Shah 2020 Chatterjee 2019) Tariff ceilings were removed by MNRE in March 2020 to revive investor interest
Lately SECI has struggled to find buyers for the auctioned capacity For example under a manufacturing-linked solar auction conducted in January 2020 SECI is yet to sign the PPA even after 10 months of awarding the project because it is unable to find buyers for the power (Reuters 2020) This development shows the signs of stress and limits to the NSM model for RE growth
24 Solar Park Scheme
Land procurement in India is hugely complicated with challenges ranging from the legal to the political (TERI 2017) For developers private procurement is expensive and time-consuming This is evidenced by the consecutively increasing time limit for obtaining possession under the NSM In Phase I 180 days was the time limit in Phase II Batch I the time limit was increased to 210 days and currently developers must show possession only at the time of commissioning the project
As the number of RE projects increases we are witnessing more acute problems in relation to the acquisition of land (Tenddulkar 2019) Land is however a state subject and the Centre has limited scope to enable easier land procurement To facilitate economies of scale and support systematic planning and deployment in 2014 the MNRE launched a first-of-its-kind scheme to develop ultra-mega solar parks In 2017 the target under the scheme was enhanced from 20000 MW to 40000 MW with an objective to set up at least 50 solar parks by 2022 (MNRE 2020a) Under this scheme solar park developers can acquire land obtain the necessary permissions and build the required infrastructure including evacuation infrastructure for the capacity to be housed within the park As of December 2019 the MNRE had approved 39 solar parks with a total capacity of 22879 MW across 17 states (MNRE 2020a)
8 The GST is supposed to be an integrated tax on both goods and services In the earlier tax regime goods and services were taxed separately (exciseimport dutiesVAT on goods and service tax on services) For RE the cells and modules are taxed at 5 per cent while services attract an 18 per cent GST rate However for RE works contracts (ie the engineering procurement and construction contracts) the supply of equipment necessary for setting up a power plant and the service component (ie the actual setting up of the plant) are difficult to segregate The government eventually fixed a 7030 ratio for the goods and services components of the contracts respectively (William 2020)
11Evolution of Central policies 11Evolution of Central policies
After an impressive growth period between 2016ndash18 various factors in addition to counterparty risks such as introduction of GST and safeguard duties on imported cells and modules led to change-in law cases delaying projects as well as investor decisions
How Indiarsquos Solar and Wind Policies Enabled its Energy Transition A Decade in Review
25 Post-2010 policies for wind The NSM defined solar power development while wind policies followed a separate trajectory till late 2016 The flip-flops of the Central Government in withdrawing and re-introducing benefits such as AD and generation-based incentives (GBI) had adverse effects on wind capacity addition 100 per cent AD was introduced in 1994 AD was reduced to 80 per cent in 2002 GBI was introduced in 2010 Both AD and GBI lapsed in 2012 but were reintroduced in 2013
Wind power was brought into the competitive bidding regime with the 2016 interstate transmission system (ISTS) wind scheme for 1000 MW and the notification of the Guidelines for Tariff Based Competitive Bidding Process for Procurement of Power from Grid Connected Wind Power Projects in 2017 (Wind Bidding Guidelines) SECI floated the first tender for ISTS wind in OctoberNovember 2016 it concluded in February 2017 and PTC India Limited signed the PPAs (Saumy 2017)9 The bidding procedure and guidelines were similar to those conducted for solar energy It helped bring tariffs down from INR 416ndash602 FiT to INR 346 (see Figure 3) The primary reason for the lower tariff was reduced counterparty risk (CRISIL 2017) with competition driving down tariffs even lower
Figure 2 The pace of solar park development under the Central scheme has been slow (as on 31 December 2019)
Source Authorsrsquo adaptation from MNRE 2020 Annual Report 2019-20 New Delhi MNRE
9 Order dated 3 December 2019 issued by CERC in Petition No 340AT2019 titled PTC India Ltd v SECI and Ors httpwwwcercindgovin2019orders340-AT-2019pdf
0
5000
10000
40000
22879
103207767
15000
20000
25000
30000
35000
40000
45000
50000
Solar park status
Target capacity
Approved capacity
Capacity of fully or partially
operational parks
Commissioned capacity
Cap
acit
y (in
MW
)
12
Figure 3 Competitive bidding in wind brought down the tariffs significantly
Sources FiT orders Order dated 15 May 2014 issued by CERC in Petition No SM3542013 (Suo-Motu) titled Determination of generic levellised generation tariff for the FY 2014-15 Order dated 31 March 2015 issued by CERC in Petition No SM0042015(Suo-Motu) titled Determination of generic levellised generation tariff for the FY 2015 - 16 Order dated 30 March 2016 issued by CERC in Petition No SM032016 (Suo-Motu) titled Determination of levellised generic tariff for FY 2016-17 Auction tariffs from India RE Navigator 2020 ldquoAuction Resultsrdquo Accessed November 28 2020 httpsindia-re-navigatorcomwind
After the discovery of these lower tariffs even under-construction projects were brought within the bidding regime or else their tariffs were renegotiated The reduced tariffs led to reduced margins and concerns that the existing thriving ecosystem which was driven by original equipment manufacturers (OEMs) is collapsing10 After 2017 there was a sharp decrease in the rate of growth of capacity additions (see Figure 1) leading to unsold inventory with the OEMs Discoms were no longer willing to sign PPAs on FiTs and the pace of bidding failed to keep up with expectations
Further because of the low tariffs it has become essential that the developers set up projects in high wind density sites Land has hence become the most crucial element of investment decisions in wind However state policies have not been very conducive in this aspect The consequent delays in setting up projects is further affecting wind OEMs (Dutt Arboleya and Gonzalez 2020) Since the introduction of competitive bidding in wind 191 GW has been auctioned but only 145 GW has been awarded In 2020 the wind bids have been linked to storage blended with solar or been part of hybrid projects Bidding was particularly constrained in 2019 were 5400 MW was tendered but only 2720 MW was awarded (India RE Navigator 2020)
10 This is evidenced by the stressed balance sheets of major wind OEMs including Suzlon and Inox and the exit of Senvion from the Indian market The number of OEMs has reduced from 14 to 5 (Arora 2019) Thin margins are a feature of the entire RE sector however specifically in case of wind competitive bidding and the resulting low tariffs caused a disruption to the existing ecosystem of the industry
0
1
2
576 598 601
346264 243 244 2513
4
5
6
7
FiT 2014ndash15
FiT 2015ndash16
FiT 2016ndash17
SECI February
2017
SECI October
2017
GUVNL December
2017
SECI February
2018
SECI April 2018
CERC determined FiT Auction
Tari
ff (I
NR
per
kW
h)
13Evolution of Central policies
How Indiarsquos Solar and Wind Policies Enabled its Energy Transition A Decade in Review
Land riskLand availability constitutes a major challenge for developers and causes significant project delays The development of solarRE parks provided comfort to developers and led to the realisation of economies of scale However as against the solar park target of 40000 MW by 2022 as of December 2019 only 7767 MW have been commissioned (see Figure 2) Solar park development comes with a chicken-and-egg problem Without committed projects it is expensive to develop solar parks but once projects are awarded solar park development cannot take place within the time provided for project commissioning since solar parks require a longer time for construction Furthermore because solar parks require even greater parcels of land chances of land conflicts are higher While states such as Rajasthan and Gujarat have fared well because of the presence of abundant wastelands others such as Andhra Pradesh (eg Kadapa and Ananthapur) and Karnataka (eg Pavagada) have all faced land conflicts Other issues that developers face relate to the quality of the land ancillary infrastructure and upfront and operation and maintenance (OampM) fees Proposed solar park projects have been cancelled because of unexpectedly high bid tariffs (Seetharaman and Chandrasekaran 2019) Though there have been success stories like the Rewa Solar Park (Bhaskar 2020) we need better planning and coordination between the Centre and the states to mitigate land-related barriers and risks
Curtailment and evacuation risksRE faces a high degree of curtailment risk (Aggarwal and Chawla 2019) The Grid Code 201011
(Grid Code) which must be followed by all states grants a must-run status to power generated from wind and solar plants This means that utilities and system operators must prioritise evacuation of power from must-run plants unless there are grid unavailability security or
11 Clause 52 (u) of the Grid Code
141414
26 Policy assessmentWe now briefly discuss some of the continuing structural risks that the above policies have failed to address or inadequately addressed and surmise the policy lessons from the Central policies (See Table 4 for Indiarsquos project pipeline to achieve the targets)
Table 4 Indiarsquos progress towards 175 GW renewable energy by 2022
Source Amitesh Sinha 2020 ldquoIndiarsquos Ambition and Opportunities in Solar Manufacturingrdquo Presentation India PV Edge 2020 Virtual conference 6 October
Under implementation
(GW)
Tendered (GW)
Total (installed +
pipeline)
Target (GW)
Installed capacity
(GW)
Sub-sector
Solar
Biomass
Total
Windndashsolar hybrid
Wind
Small hydro
RTC assured peak power supply
100
10
175
60
5
3574
1003
88511 4511 2843 16205
825
474
3336
0
144
825
046
16
2066
0
12
157
0
5
8976
1003
264
4782
52
66
safety constraints However commercial considerations grid unavailability and technical grid security concerns lead to curtailment which translates to revenue loss for developers Curtailment could contribute to 14 per cent of the risk premia (Atal and Shrimali 2018)
In the early set of PPAs there was no provision to compensate generators in case of backdown of power However the Solar Bidding Guidelines and the Wind Bidding Guidelines incorporated provisions that require the power purchaser to compensate the generator in case of backdown for reasons other than technical constraints However must-run status has not been as effective as intended and the risk of curtailment persists
Further as RE deployment grows problems arising out of the inadequacies of the evacuation infrastructure assume greater proportions The problem is compounded by the need for transmission infrastructure to be in place before an RE project is conceptualised because the infrastructure takes up to five years to complete while RE projects typically take between 12ndash18 months to launch (H Singh 2017)
A functioning ISTS is also essential as it helps diffuse the costs and benefits of RE across the country and can enable effective implementation of the RPO Hence inter-state transmission charges and losses have been exempted since 2016 and will continue to be exempted till June 2023 Policymakers recognised this problem early on and PGCIL proposed a transmission plan for the envisaged RE capacity in 2011 dubbed the Green Energy Corridor A loan-plus-grant mechanism was devised to fund inter- and intra-state transmission corridors in 2015 However this programme does not address the incentive problem ndash it requires the states to cooperate and take the initiative to submit project proposals for obtaining grants provide last-mile connectivity and improve their own transmission infrastructure There is not enough incentive for RE-rich states to spend money to build the required infrastructure There is no clear accounting or evidence of the benefits that a RE-rich state government will receive if it allocates money and human resources for this purpose
Further there is no transparent data published on curtailment duration curtailing entities and reasons for curtailment So far generators have pooled their data and been able to demonstrate evidence of curtailment However no one knows the exact reasons for such curtailment It is hence difficult to analyse the predominant causes and accordingly frame a policy response
Payment riskAs we have just discussed assured offtake at a fixed tariff for the lifetime of the project helped investors tide over the risks of adopting a new and untested technology and helped increase the scale of these projects
While payment obligations were assured on-time payments remain a concern Delayed payments affect investor returns and project cash-flows adversely Most PPAs have provisions that require the purchaser to create a payment security mechanism (PSM) Opening letters of credit (LC) is the most common PSM However there is widespread non-compliance of this provision SECI had not created any LC under any of its PPAs (though it has a good track record of payment) (Economic Times 2019) As a solution in June 2019 the MoP directed the NLDC and the SLDC to dispatch power only after an LC had been opened for the power
15Evolution of Central policies 15Evolution of Central policies 15Evolution of Central policies
Any transmission infrastructure expansion programme needs to solve for the incentive problem facing the states
How Indiarsquos Solar and Wind Policies Enabled its Energy Transition A Decade in Review
being scheduled The discom would also be liable to pay full tariff on the power that is not scheduled The concerned discom was also precluded from purchasing power from the power exchange and getting a short term open-access (STOA) (MoP 2019) This move essentially brought system operators into contract enforcement which ideally should be beyond their remit Apart from this drawback in the design according to feedback from the developers the move did not change anything on the ground However it has had only one year of effective operation since once COVID-19 struck MoP partially rolled back the directive till 30 June 2020 and permitted scheduling of power even if the PSM was reduced by 50 per cent (MoP 2020b)
Policy lessonsThe success story so far has made India a dominant force in the RE space globally It was able to leverage its growing market and even take leadership on global initiatives like the International Solar Alliance After the implementation of the NSM solar power deployment increased exponentially Further the competitive bidding regime introduced first in solar and then for wind was successful in driving down tariffs
However existing policies are not sufficient to address risks arising from the structural pathologies of the electricity sector and the changing nature of barriers and risks With RE prices falling it may seem that RE procurement would be the natural choice for discoms However discoms hold-out on signing PPAs with the expectation that tariffs would fall even further with each passing auction (Prasad 2020) Deep-rooted issues such as the procurerrsquos obligation to pay fixed costs under long-term PPAs inadequate demand-supply planning and skewed fuel subsidies distort the market Further policies that burden the discoms further like the LC requirement have no real impact on the ground
Tying discoms down in long-duration PPAs reduces their ability to respond to new market developments and forces them to procure at above-market costs posing a greater risk for the sector in the long term While these policies may work for project developers in the short term they do not make the most commercial sense for discoms The fixed cost payment issue is one such example Technologies like storage and introduction of market platforms have the potential of bringing in economic efficiencies in discom procurement strategies (CERC 2018) Hence a variation in procurement strategy for discoms is imminent and policies must enable them Such variation is already visible in the thermal markets where MoP has commenced medium-term power procurement Resistance from incumbent market players is expected and must be addressed for a transition that works for all stakeholders
Further the policy framework till now has a serious gap in data collection and transparency There is lack of data on project-specific information on generation technology selection etc Detailed data on these aspects could have informed policy activity on cost and technology bringing in greater efficiencies The Centre has the mandate to formulate policy in this regard and must make up for the lost time
161616
India is a strong force in the global RE space However existing policies are not sufficient to address the deep-rooted issues and evolving nature of risks inhibiting a natural transition to RE
The NSM Solar Park Policy and other fiscal incentives are supply-side measures targeted at reducing investment risks However a measure to create demand was essential because
RE was considerably more expensive than conventional power in 2010 Demand for RE was created through the RPO mechanism
The EA enabled state regulators to specify a minimum purchase obligation Section 86(1)(e) of the EA requires the SERCs to ldquopromote cogeneration and generation of electricity from
3 Renewable purchase obligations ndash a regulatory mechanism for creating demand
Image iStock
171717
How Indiarsquos Solar and Wind Policies Enabled its Energy Transition A Decade in Review
renewable sources of energy by providing suitable measures for connectivity with the grid and sale of electricity to any person and also specify for purchase of electricity from such sources a percentage of the total consumption of electricity in the area of a distribution licenseerdquo
The NTP 2006 required the SERCs to fix the RPOs ldquotaking into account availability of such resources in the region and its impact on retail tariffsrdquo In the absence of any fixed target or specific obligation only a few states notified the purchase obligations The initial movers were Gujarat (2005) Kerala (2006) Rajasthan (2007) and Madhya Pradesh (2008)
Fixed targets were set for the first time under the NAPCC which prescribed that RE (including bioenergy and small hydro) should account for 5 per cent of total grid purchase in 2010 which would increase to 15 per cent by 2020 with a one per cent increase each year In 2011 the NTP 2006 was amended to include a minimum RPO of 025 per cent for solar power by the end of 2012ndash2013 and 3 per cent by 2022
During 2010ndash2012 many states notified their respective RPO regulations This activity was most likely driven by the increased government and investor focus on RE after the introduction of the NSM The obligated entities ie the entities on whom the RPOs were imposed were discoms captive consumers and open-access consumers
The policymakers were however cognisant of resource variability across the different states To bridge the resource gap and ensure sustained demand for RE they enabled the issuance and trading of renewable energy certificates (REC) Under the REC mechanism registered RE generators receive one REC against one MWh of energy they produce12 The power component is sold separately to discoms and open-access consumers at the average power purchase cost (APPC) or a mutually agreed price respectively The RECs are categorised into solar and non-solar RPOs These RECs can be put up for sale in power exchanges where they can be bought by obligated entities and voluntary buyers or retained by the generator to meet their own RPOs (the latter was allowed from 2013) The CERC periodically fixes a floor price and forbearance price and the trading occurs within this price band
31 Setting RPO targets
The RPO targets notified by states are set out in Table A1 in the Annexure As is evident statesrsquo RE ambition varies widely and there was considerable variance between them and the NAPCC targets Karnataka Tamil Nadu Maharashtra and Rajasthan set relatively high targets while Andhra Pradesh Bihar Madhya Pradesh and Uttar Pradesh set quite low targets
The trajectory set out in the NAPCC did not have any legally binding value on the SERCs and the states were technically free to determine their RE targets However their targets were inadequate to achieve national policy objectives
To address the inadequacy of the RPO targets the NTP was revised in 2016 enabling the Ministry of Power (MoP) to notify a common trajectory from 2016ndash17 to 2018ndash19 The MoP has notified the RPO trajectory up to FY 2021ndash22 (Table 5) (MoP 2016 2018) Since then states must align their trajectories to that set by the Central Government
12 The detailed procedure for all matters relating to RECs is set out in the CERC (Terms and Conditions for Recognition and Issuance of Renewable Energy Certificates for Renewable Energy Generation) Regulations 2010 (REC Regulations) The first solar and non-solar RECs were issued in May 2012 and March 2011 respectively
18
In the absence of any fixed target or specific obligation before 2010 only a few states notified the purchase obligations The initial movers were Gujarat (2005) Kerala (2006) Rajasthan (2007) and Madhya Pradesh (2008)
13 The petition was filed under Section 121 of the Electricity Act 2003 which empowers the tribunal to issue orders instructions or directions to the appropriate commission for the performance of its statutory functions
Till January 2017 only three states ndash Andhra Pradesh Madhya Pradesh and Rajasthan ndash had issued draft regulations specifying a trajectory in line with the one prescribed by the MoP (MNRE 2017) In 2017 Karnataka revised their official policy targets from 2000 MW to 6000 MW of solar power to match the RPO trajectories set by the MoP (The Hindu 2017) Till March 2020 only nine states had aligned their RPO trajectories with that of the MoP (MoP 2020a) The remaining states are yet to either notify their 2021ndash22 trajectories or align them with the Central trajectory While Maharashtra has not aligned its targets it provides incentives of INR 025 per kWh above the state prescribed RPO for procurement up to the MoP target
32 Compliance with RPOThe obligated entities can comply with their RPOs through two routes direct procurement (FiTcompetitive bidding) and purchasing RECs from power exchanges
State regulations typically contain provisions for monitoring compliance which require the obligated entities to submit information to the state nodal agencies and the nodal agencies are required to file periodic compliance reports with the SERC The SERC can also initiate suo moto proceedings to verify compliance
In cases of non-compliance SERCs are typically required to direct the obligated entities to deposit such amounts as the SERC may determine in a separate fund which will then be used to purchase RECs and develop transmission infrastructure However certain provisions ndash like permitting target revision fungibility between solar and non-solar RPOs and carrying forward the RPOs ndash are specific to the states SERCs can also revise the RPOs in case of constraints in the availability of renewable energy A snapshot of the provisions can be found in Table A2 in the Annexure
As early as 2013 power producers filed a petition before the Appellate Tribunal of Electricity (APTEL)13 claiming that various state discoms and obligated entities were not complying with the RPO regulations The petition arose due to the failure of state commissions to implement their RPO regulations The petitioners submitted that the SERCs frequently allowed deferment carry-over and exemptions of the obligations and did not enforce compliance by directing purchase of RECs despite their availability The MNRE also submitted that discoms made inadequate provisions for compliance while the SERCs did not invoke penal provisions to enforce compliance It further submitted that the SERCs did not seek RPO compliance reports in accordance with the regulations and that many had not even announced their long-term RPO trajectories The CERC submitted that the REC market had a large unsold inventory of non-solar RECs that were being traded at floor prices It further noted that the demand for RECs is largely driven by very few private distribution licensees and few captiveopen-access customers meanwhile the state discoms generally do not purchase RECs to fulfil their RPOs
Table 5 MoP trajectory for RPO
Source MoP 2016 Guidelines for Long-term RPO Growth Trajectory of Renewable Purchase Obligations (RPOs) for Non-solar as well as Solar Order No 2332016-RampR New Delhi MoP 22 July MoP 2018 Long-term RPO Growth Trajectory of Renewable Purchase Obligations (RPOs) for Solar and Non-solar for a Period of Three Years ie 2019ndash20 to 2021ndash22 Order No 23032016ndashRampR New Delhi MoP 14 June
2016ndash17 2017ndash18 2018ndash19 2019ndash20 2020ndash21 2021ndash22Category
Non-Solar
Solar
Total
875
275
115
95
475
1425
1025
675
17
1025
725
175
1025
875
19
105
105
21
19Renewable purchase obligations ndash a regulatory mechanism for creating demand
How Indiarsquos Solar and Wind Policies Enabled its Energy Transition A Decade in Review
The SERCs used the provisions built by them in the RPO regulations to allow non-compliances to occur The APTEL directed the SERCs to strictly enforce compliance and use the provisions sparingly and in accordance with the spirit of the mandate
Variance in compliance within states
The MNRE has consistently been urging states to align their RPO trajectories with that of the Central Government and ensure strict compliance In August 2019 the MNRE sought APTELrsquos intervention to nudge SERCs to enforce and align RPOs and not to allow any waivers or carrying forward (MoP 2020a) In 2019ndash20 some RE-rich states including Maharashtra Gujarat Tamil Nadu Rajasthan and Telangana fell short of meeting their RPO targets Apart from Andhra Pradesh Rajasthan Karnataka and more recently Tamil Nadu no other state has met their RPO targets (MoP 2020a) Figure 4 compares the RPO compliance situation across 2015ndash16 and 2017ndash18 of Tamil Nadu Maharashtra Bihar and Punjab and is representative of the compliance situation across the country
Figure 4 Compliance with RPOs is uneven among states and discoms
Source Authorsrsquo adaptation from Order dated 11 August 2017 issued by the TNERC in TP No1 of 2017 titled Determination of Tariff for Generation and Distribution Order dated 27 March 2019 issued by the MERC in Case No36 of 2019 titled Case for Verification of compliance of Renewable Purchase Obligation targets by Maharashtra State Electricity Distribution Co Ltd for FY 2017-18 Order dated 2 April 2019 issued by the MERC in Case No37 of 2019 titled Case for Verification of compliance of Renewable Purchase Obligation targets by Brihanmumbai Electric Supply amp Transport Undertaking for FY 2017-18 Order dated 2 April 2019 issued by the MERC in Case No38 of 2019 titled Case for Verification of compliance of Renewable Purchase Obligation targets by Tata Power Co LtdndashDistribution) for FY 2017-18 Order dated 4 April 2019 issued by the MERC in Case No39 of 2019 titled Case for Verification of compliance of Renewable Purchase Obligation targets by Adani Electricity Mumbai Limited for FY 2017-18 Order dated 23 October 2017 issued by the PSERC titled Annual Revenue Requirement and Determination of tariff for MYT control period from FY 2017-18 to FY 2019-20 and for True up of FY 2015-16 Order dated 19 April 2018 issued by the PSERC in Petition titled True up of FY 2016-17 Annual Performance Review ndashAPR) for FY 2017-18 and Determining the Annual Revenue Requirement ndashARR) for FY 2018-19 Order dated 27 May 2019 issued by the PSERC in Petition No 02 of 2019 titled True up of FY 2017-2018 Annual Performance Review ndashAPR) for FY 2018-19 Approval of Revised Annual Revenue Requirement ndashARR) and Determination of Tariff for FY 2019-20 Order dated 25 February 2019 issued by the BERC in Case No 40 and 48 of 2018 and Case No 41 and 47 of 2018 titled Tariff Order for FY 2019-20 for NBPDCL and SBPDCL Order dated 24 March 2017 issued by the BERC in Case No 45 of 2016 titled Tariff Order for FY 2017-18 for NBPDCL Order dated 24 March 2017 issued by the BERC in Case No 46 of 2016 titled Tariff Order for FY 2017-18 for SBPDCL Order dated 21 March 2018 issued by the BERC in Case No 40 of 2017 titled Tariff Order for FY 2018-19 for NBPDCL Order dated 21 March 2018 issued by the BERC in Case No 41 of 2017 titled Tariff Order for FY 2018-19 for SBPDCL
0
300
250
200
150
100
50
Tamil Nadu Maharashtra Bihar Punjab
TANGEDCO Tata SBPDCL PSPCLNBPDCLAdani MSEDCL BEST
States and discoms
2015-16 Solar
2016-17 Non-solar
2015-16 Non-solar
2017-18 Solar
2016-17 Solar
2017-18 Non-solar
RP
O c
omp
lianc
e (in
per
cen
t)
20
Karnataka and Tamil Nadu which set ambitious targets have high rates of compliance However Madhya Pradesh and Uttar Pradesh were unable to reach their ambitious targets Andhra Pradesh Gujarat Maharashtra and Rajasthan set modest targets with relatively high compliance levels The other states were unable to accomplish even their low targets The Comptroller and Auditor General of India (CAG) in their analysis of RPO compliance in 24 states between 2010ndash11 and 2013ndash2014 noted that non-compliance was more common among the RE resource-deficit states (CAG 2015 chap 2) This trend in non-compliance by the states has remained largely unchanged since then
In most cases the RPO served as a ceiling on deployment rather than a fillip Most RE-rich states limited discomsrsquo procurement of wind and solar power up to the RPOs targets notified by their respective SERCs The RPO regulation of Gujarat explicitly required the discoms to source RE from within their areas of supply Similarly the Bihar RPO regulation requires discoms to meet their RPOs from sources within their state Discoms can source power from outside the state only in case of shortfall within the state Further there is no indication or incentive in the state RE policies for discoms to exceed the RPO targets Grid integration concerns and the technical limitations to RE powerrsquos sale to other states restrict RE deployment
Participation in the REC market mechanism
The trading mechanism instituted for RECs in the power exchanges has not led to its uptake as there has been a consistently high number of unredeemed RECs (see Figure 5) In addition developers installed only around 2266 MW of RE capacity in 2010ndash2017 under the REC mechanism
Figure 5 RECs consistently remain unsold in the market
Source Authorsrsquo adaptation from REC Registry of India 2020 ldquoMonth-wise RECs Reportrdquo REC Registry of India Accessed 30 November httpswwwrecregistryindianicinindexphppublicsrecs
The REC market has not adequately boosted compliance with the RPO regime Up to 2014 only 477 per cent of the RPO compliance was through the REC route (CAG 2015 chap 2) For resource-deficit states to meet their RPOs through RECs a higher number of resource-deficit states should constitute the buyers ndash which however is not the case (see Table 6) Instead the data shows that resource-rich states are also the highest buyers of RECs
Note The closing balance is the balance in December of each year
0
20000000
15000000
10000000
5000000
2013 2014 2018 20192015 2016 2017
RECs issued RECs redeemed Closing balance
21Renewable purchase obligations ndash a regulatory mechanism for creating demand
How Indiarsquos Solar and Wind Policies Enabled its Energy Transition A Decade in Review
Another noteworthy fact is that among the large buyers ie Maharashtra and Gujarat there is significant private-sector participation In Gujarat private discoms make the most REC purchases The other significant chunk of buyers are the union territories which fall within the Central Governmentrsquos purview and for this reason may be more enthusiastic in their use of the REC mechanism (POSOCO 2018)
It appears that the factors behind participation in the REC market are independent of resource availability and utilisation
33 Causes of under-achievement
The possible causes of under-achievement of the REC mechanism in boosting RPO compliance are discussed below
Declining number of sellers
The SERCs have contended in the past that developers stand to gain supernormal profits by setting up REC projects since they are entitled to normal tariffs plus the REC price Analyses also anticipated that the high floor prices could provide windfall gains to developers (A Singh 2010)
However this did not hold true in practice Though there was an initial spurt in the number of projects that were registered under the mechanism as solar and wind tariffs continued to fall the registration of new projects under the REC mechanism reduced (see Figure 6) There is a clear preference for FiTauctions over the REC route Of the total 85908 MW of RE capacity (including all types of RES) in India as of 31 December 2019 (MNRE 2020a) only 4046 MW was registered under the REC mechanism (REC Registry of India 2020b) (see Table A3 of the Annexure for the number of projects registered in the selected states)
Table 6 Resource-rich states are also the highest buyers of RECs
Source Authorsrsquo adaptation from POSOCO 2018 Renewable Energy Certificate Mechanism in India Key Learnings Data Analysis and Way Forward New Delhi POSOCO NLDC
Share of total RECs purchased by state entities (total RECs redeemed up to
2017ndash18 are 37043171) (in per cent)
Share of total RECs purchased by the state discom (total RECs purchased
by all discoms up to 2017ndash18 are 22499976) (in per cent)
State
Maharashtra
Gujarat
Rajasthan
Bihar
Madhya Pradesh
Punjab
Tamil Nadu
Karnataka
Andhra Pradesh
Uttar Pradesh
307
133
62
46
44
33
19
17
16
04
44
131
0
75
0
39
0
0
0
0
22
Cashflow for REC projects
In the early 2010s there was still a wide gap between the APPC and solar and wind tariffs It would have been risky to register as a REC project since REC prices would be discovered in energy exchanges within the approved bands The floor price is calculated by determining the gap between the minimum requirement and the APPC This minimum requirement is an estimation that considers OampM expenses interest on term loans working capital and repayment terms it is fixed to ensure the economic viability of the project However these numbers are estimated based on prevailing rates as opposed to historic rates Hence the prices have expectedly and consistently fallen (see Table 7) the floor price has reached zero This would impact the cashflows of a project registered when the costs were high
Figure 6 The registration of new projects under the REC mechanism has reduced
Source Authorsrsquo analysis of data published by POSOCO 2018 Renewable Energy Certificate Mechanism in India Key Learnings Data Analysis and Way Forward New Delhi POSOCO NLDC
Table 7 REC floor prices and forbearance prices have consistently fallen
Non-solar (INR MWh)
Floor price Floor priceForbearance price Forbearance price
Solar (INR MWh)
1500
1500
1000
0
3900
3300
3000
1000
12000
9300
1000
0
17000
13400
2400
1000
1 June 2010ndashFY 2012
1 April 2012ndashFY 2017
1 April 2017ndashFY 2020
1 July 2020ndash30 June 2021
Control period
Source Order dated 1 June 2010 issued by the CERC in Petition No 992010 (Suo Motu) titled Determination of Forbearance and Floor Price for the REC Framework Order dated 23 August 2011 issued by the CERC in Petition No 1422011 (Suo Motu) titled Determination of Forbearance and Floor Price for the REC Framework to be Applicable from 1st April 2012 Order dated 30 March 2017 issued by the CERC in Petition No 02SM2017 titled Determination of Forbearance and Floor Price for the REC framework to be Applicable from 1st April 2017 Order dated 17 June 2020 issued by the CERC in Petition No 05SM2020 titled Determination of Forbearance and Floor Price for the REC Framework
Capacity Noof projects
0 0
200 50
400100
600
800150
1000 200
1200 250
2010
-11
Year
Cap
acit
y (M
W)
Num
ber
of r
egis
tere
d p
roje
cts
2011
-12
2012
-13
2013
-14
2017
-18
2016
-17
2015
-16
2014
-15
23Renewable purchase obligations ndash a regulatory mechanism for creating demand
The declining trend of the market price of the REC (see Table 7) shows that buyers are unwilling to pay a higher price and that there is significant uncertainty surrounding the expected returns on investment
How Indiarsquos Solar and Wind Policies Enabled its Energy Transition A Decade in Review
Table 8 Average size of a registered plant as of FY 2018
SourceAuthorsrsquo analysis of data published by POSOCO 2018 Renewable Energy Certificate Mechanism in India Key Learnings Data Analysis and Way Forward New Delhi POSOCO NLDC
Maximum capacity (MW)
Minimum capacity (MW)
Average capacity (MW)
No of projects
Total capacity (in MW)
1900
504
010
023
204
525
360
413
736
2167
Solar PV
Wind
RE source
For projects developed after the fall in costs the situation has reversed The APPC in most cases may be higher or equal to solar and wind tariffs If any new projects are registered under the REC regime today they could sell power to the host discoms at the APPC (or SERC-notified tariffs) and RECs thus sold can help an obligated entity meet its RPO
Cost for host discomsstatesThe responsibility and cost of balancing power from REC projects (the cost of maintaining system balance due to injection of variable power in the grid) fall on the host state This could limit the number of REC projects the state would host for the availability of other obligated entities
For RE-deficit states it would be more commercially viable to procure RECs to meet their RPOs (they will incur conventional power purchase costs plus REC costs) and avoid the balancing costs associated with procuring RE directly However data shows that discoms do not avail of this route to meet their RPOs This may be due to behavioural resistance to shift to REC or due to the indifferent enforcement of RPOs
Cost for other obligated entitiesInitially there was considerable resistance from open access and captive consumers to the RPO obligations imposed upon them The dispute was eventually settled by the Supreme Court in Hindustan Zinc Limited v RERC14 in which the Court held such imposition to be valid Open-access consumers have the freedom to switch to grid purchase in which case they do not need to comply with RPOs separately
Regulatory gapsThe REC market is a lsquocompliance marketrsquo ie the demand for RECs arises from a legal mandate and is not organic demand15 In this context non-compliance can result from the following situations
14 Judgment dated 13 May 2015 issued by the Supreme Court of India in Civil Appeal No 4417 of 2015 httpswwwrecregistryindianicinpdfREC_RegulationSupreme_Court_Judgement_regarding_RPO_Compliancepdf
15 The voluntary component of the REC market is the exception However its share is only 01 percent of the REC market (POSOCO 2018)
24
This would especially affect larger projectsrsquo participation in the REC mechanism Investors prefer projects with PPAs as they offer assured returns over a longer duration This is also indicated by data on the average size of projects registered under the REC mechanism (Table 8)
Regulatory uncertainty
As discussed above RPO regulations allow carrying forward exemptions etc which create demand uncertainty Other regulatory causes also contribute to commercial uncertainty Initially the life of the REC was only one year after which it expired if not redeemed These expired RECs generated no returns on investment for investors This would have dissuaded many investors from setting up REC projects The validity period was subsequently increased to two years by the CERC through an order dated 11 February 2013 however this did not give investors sufficient confidence Commercial uncertainty was further exacerbated by the fact that demand was also not certain due to the low RPO targets set by states before the MoP set a common trajectory for all in 2016
Inadequate enforcement
There was no unified framework for monitoring RPO compliance on an on-going basis until the MNRE announced the constitution of the RPO compliance cell in 2019 The SERCs are relatively lenient with regards to non-compliance For example they permit the carrying forward of shortfall16 and the use of the previous yearrsquos surplus to meet shortfalls in the next year17 There have also been delays in reviews of compliance For example compliance for the period FY 2015ndash16 was finally determined by the Gujarat Electricity Regulatory Commission (GERC) on 26 December 2019 While there are generic penalties prescribed in the EA for contravention of regulations made under the EA it is difficult to imagine that the SERCs would be highly inclined to strictly invoke these provisions against their own state discoms
Inability of the obligated entities to comply with the mandate
While non-enforceability and regulatory gaps lead to non-compliance the practical reason is that RPOs and RECs are an additional cost burden for discoms which are already under severe financial stress Further many inefficient thermal projects continue to operate to their technical minimum to provide the baseload which limits the extent of RE procurement Certain states have indicated that they would be willing to purchase RECs provided they find an offtaker for the thermal capacity that is already contracted by the discoms Many states which were earlier in a power deficit situation but have now become power surplus states find it difficult to meet the current RPO levels and have no incentives to raise their RE ambitions
16 Order dated 4 August 2015 issued by the GERC in suo motu Petition Nos 1307 of 2013 and 1312 of 2013 titled Suo-motu Proceedings in Petition Nos 1307 of 2013 and 1312 of 2013 in Pursuance of Honrsquoble APTEL Direction Contained in Order Dated 16042015 in Appeal Nos 258 of 2013 and 21 of 2014 and the Order Dated 14052015 in IA No 187 of 2015 Accessed 22 October 2020 httpswwwgercinorgwp-contentuploadsdocumenten_1438799511pdf
17 Order dated 4 April 2019 issued by the MERC in Case No 39 of 2019 titled Case for Verification of Compliance of Renewable Purchase Obligation Targets by Adani Electricity Mumbai Limited for FY 2017ndash18
25Renewable purchase obligations ndash a regulatory mechanism for creating demand
RPO compliance for FY 2015ndash16 was finally determined by the Gujarat Electricity Regulatory Commission (GERC) on 26 December 2019
How Indiarsquos Solar and Wind Policies Enabled its Energy Transition A Decade in Review 188
Image iStock
India must implement a comprehensive market reforms roadmap with an intent to remove current inefficiencies while designing a market architecture that minimises total system costs in the future
27
The southern and western states of India have a long history of RE development since RE resources are concentrated in these states (Figure 7) These states attracted investments in
solar and wind energy well before the launch of NAPCC and the NSM This section recounts the journey of RE policies in states that have high solar and wind energy potential The RE-rich states covered are Andhra Pradesh Gujarat Karnataka Madhya Pradesh Maharashtra Rajasthan Tamil Nadu and Telangana
41 Policies pre-2014 In January 2009 Gujarat became the first Indian state to launch a solar power policy (Economic Times 2010) In 2012ndash13 over 40 per cent of Tamil Nadursquos total capacity was based on wind power (TN Energy Department 2012) well before the Government of India adopted the ambitious target of 175 GW RE capacity by 2022 including 60 GW wind
In the first phase of NSM Karnataka Power Corporation Limited (KPCL) was the first state-owned utility to be found eligible for the development of a solar project (Deloitte 2015) Rajasthan attracted a slew of projects primarily because of abundant land and resource availability In 2011 Karnataka was the first southern state to introduce an exclusive policy for the development of solar energy
4 Policy evolution in RE-rich states
Figure 7 RE resource potential is concentrated in western and southern India
Source Authorsrsquo analysis based on data from MNRE 2020 Annual Report 2019-20 New Delhi MNRE
Note Wind potential is at 120 m above ground level
Solar potential (GW)
088 0114231 14256
Wind potential (GW)
How Indiarsquos Solar and Wind Policies Enabled its Energy Transition A Decade in Review 28
Key driversThrough 2010ndash14 the underlying policy motivations across RE-rich states were increasing energy access closing demand-supply gaps increasing industrial productivity utilising local resources for power generation garnering private investments creating employment opportunities through project deployment and local manufacturing responding to local environmental challenges and addressing climate change risks
Policy focusIn most of the initial policies support was provided in the form of FiTsbundled tariffs The power was sold through long-term PPAs to state discoms or to NVVN under NSM bundling schemes However we observed shortfalls in administrative and institutional mechanisms like negligible support for land acquisition and approvals and clearance processes lack of strengthening of evacuation infrastructure to tap the best sites no provisions for building knowledge and capacity in key implementing entities and no requirement for improved data collection and communication to aid industryrsquos decision-making and project planning The challenges of the distribution sector also impacted the progress of the sector during the implementation of the NSM Policies therefore failed to create an enabling environment and were not adequate to attract significant investors in the RE business Accordingly these policies attracted a poor response in many RE-rich states For example
bull In Andhra Pradesh only 13184 MW of solar PV capacity was commissioned till FY 2014 against the 2000 MW of solar capacity envisaged under Andhra Pradeshrsquos Solar Power Policy 2012
bull In Tamil Nadu only 13258 MW of solar PV was installed over 2012ndash15 against a target of 3000 MW in Tamil Nadu Solar Policy 2012
bull Karnatakarsquos Renewable Energy Policy 2009ndash14 enabled the addition of 102108 MW during the five-year policy period against a target of 4200 MW
Performance of policies During 2012ndash2014 several states failed to achieve NSM and their state policy targets within the stated time (Stromsta 2012) (See Table 9) States such as Rajasthan Andhra Pradesh and Tamil Nadu conducted auctions in 2013 but there were delays in signing PPAs Gujarat was the only state that adopted the FiT system under its solar policy that was much more attractive than NSM and other state policies Even then there were time overruns Rajasthan auctioned 75 MW of solar capacity in March 2013 However elections in the state delayed land allocation processes (Sengupta 2013) In December 2012 Tamil Nadu conducted a 1000 MW auction out of which only 698 MW was awarded at INR 648 per unit This may reflect investorsrsquo risk perception of the discom finances and operations in the state (TNN 2013)
Project deployment in most states was below the target capacity under the policies
29Policy evolution in RE-rich states
Table 9 Targets specified under policies and achievements
Source Authorsrsquo analysisRPO achievement figures from MoP 2020 Agenda Background Conference of Power and Renewable Energy Ministers of States and UTs 3 July 2020 New Delhi 3 July
Capacity achievement figures from CSO Energy Statistics 2010 New Delhi MoSPI CSO Energy Statistics 2012 New Delhi MoSPI CSO Energy Statistics 2013 New Delhi MoSPI CSO Energy Statistics 2014 New Delhi MoSPI CSO Energy Statistics 2015 New Delhi MoSPI CSO Energy Statistics 2016 New Delhi MoSPI CSO Energy Statistics 2017 New Delhi MoSPI CSO Energy Statistics 2018 New Delhi MoSPI CSO Energy Statistics 2019 New Delhi MoSPI CSO Energy Statistics 2020 New Delhi MoSPI MNRE 2019 Annual Report New Delhi MNRE
Windsolar policy and year Targets in policy Achievement against targets
Solar Power Policy 2012
Solar Power Policy 2015
Wind Power Policy 2015
Solar Power Policy 2018
Wind Power Policy 2018
SolarndashWind Hybrid Policy 2018
Wind Power Policy 2007
Solar Power Policy 2009
Wind Power Policy 2013
Solar Power Policy 2015
Wind Power Policy 2016
Policy for Implementation of Solar Power Based Projects 2012
Wind Power Project Policy 2012
New and Renewable Sources of Energy Policy 2012
Policy for Promotion of New and Renewable Energy Sources 2011
Policy for Promotion of New and Renewable Energy Sources 2017
Karnataka Renewable Energy Policy 2009
Solar Policy 2011
Karnataka Solar Policy 2014
Karnataka Renewable Energy Policy 2016
New Policy for Power Generation from Non-Conventional Sources 2008
Comprehensive Policy for Grid Connected Power Projects based on New and Renewable (Non-conventional) Energy Sources 2015
Rajasthan Solar Energy Policy 2011
Policy for Promoting Generation of Electricity from Wind 2012
Rajasthan Solar Energy Policy 2014
Rajasthan Solar Energy Policy 2019
Rajasthan Wind and Hybrid
Energy Policy 2019
5000 MW
5000 MW additional capacity in 5 years
No targets but discoms required to purchase power up to their RPOs
No targets but discoms required to purchase power up to their RPOs
10 per cent of the capacity portfolio by 2022
1969 MW grid-connected solar
(total solar target is 2969 MW solar)
200 MW (including solar thermal)
Additional 2000 MW between 2014ndash2021
4400 MW additional wind capacity between 2016ndash2022
2000 MW of wind
7500 MW solar till 2020
5000 MW wind till 2020
Target of 10000ndash12000 MW in next 10ndash12 years
300 MW (2013ndash14) 400 MW (2014ndash15) and 500 MW (2015ndash16)
25000 MW
24 GW utility-scale solar by 2025
2000 MW wind for RPO by 2025
Target is only for discom purchase
355902 MW total solar capacity as of December 2019
276355 MW total solar and 735922 MW total wind capacity as of December 2019
For 2019ndash20 solar RPO compliance is 462 per cent and non-solar RPO compliance is 12257 per cent
251989 MW wind and 223748 MW solar as of December 2019
For 2019ndash20 solar RPO compliance is 847 per cent and non-solar RPO compliance is 71 per cent
9471 MW solar as of December 2019
14935 MW total solar capacity as of December 2019
31 MW total solar capacity in FY 2014
724392 MW solar added between FY 2014 and December 2019
188425 MW wind added between FY 2016 and December 2019
4446 MW total wind capacity in FY 2015
500033 MW wind and
166342 MW solar as of December 2019
484421 MW solar as of December 2019
10025 MW (in 2013ndash14) 5241 MW (in 2014ndash15) and 68495 MW (2015ndash16) of wind capacity
484421 MW total solar and 429972 MW total wind as of December 2019
Andhra Pradesh
Gujarat
Madhya Pradesh
Punjab
Bihar
Karnataka
Maharashtra
Rajasthan
State
How Indiarsquos Solar and Wind Policies Enabled its Energy Transition A Decade in Review
Table 9 contd Windsolar policy and year
Targets in policy
Achievement against the targets
Tamil Nadu Solar Policy 2012
Tamil Nadu Solar Policy 2019
Solar Power Policy 2013
Solar Power Policy 2017
Telangana Solar Power Policy 2015
Telangana Wind Power Policy 2016
3000 MW by 2015
9000 MW by 2023
500 MW by 2017
Target up to the RPO
No target
No target
14258 MW total solar capacity in FY 2015
378836 MW solar as of December 2019
33673 MW solar by 2017
10451 MW solar by December 2019 Solar RPO compliance for 2019ndash20 is 305 per cent
362075 MW solar and 1281 MW wind as of December 2019
Tamil Nadu
Uttar Pradesh
Telangana
State
By 2013 Gujarat had installed over 850 MW of solar PV projects the largest capacity in India at that time However the holding company of discoms in Gujarat ndash Gujarat Urja Vikas Nigam Limited (GUVNL) ndash moved to renegotiate the tariffs specified under the signed PPAs citing excessive profits to developersinvestors (Balan 2014) Although GUVNLrsquos attempt was struck down by the APTEL this was the first time that the risks related to contract sanctity emerged in the Indian market which hurt business and investor confidence
As a result of the withdrawal of AD in 2012 and delays in the re-introduction of the GBI wind power deployment rates also declined in 2013 Without the AD or GBI the tariff of a typical new wind power plant was in the range of INR 4 to 5 per unit (for lsquoZone 2rsquo and above sites) Due to this sudden policy gap the market collapsed from 3 GW in 2011 to below 2 GW in 2012 and 2013 (CAG 2015 chap 4)
Figure 8 depicts the growth of solar and wind capacity across states This clearly shows that total capacity started to increase more rapidly 2014 onwards Wind power on the other hand grew at a constant pace till 2012 after which it plateaued for a couple of years and it again picked up in 2016 and 2017 After 2017 wind deployments slowed down again
30
Note The capacity achievement figures include only grid connected capacity while the targets may include decentralised capacity
Figure 8 Solar and wind capacity increased rapidly 2014 onwards
Sources Authorsrsquo analysis based on CSO Energy Statistics 2010 New Delhi MoSPI CSO Energy Statistics 2012 New Delhi MoSPI CSO Energy Statistics 2013 New Delhi MoSPI CSO Energy Statistics 2014 New Delhi MoSPI CSO Energy Statistics 2015 New Delhi MoSPI CSO Energy Statistics 2016 New Delhi MoSPI CSO Energy Statistics 2017 New Delhi MoSPI CSO Energy Statistics 2018 New Delhi MoSPI CSO Energy Statistics 2019 New Delhi MoSPI CSO Energy Statistics 2020 New Delhi MoSPI MNRE 2020 Annual Report 2019ndash2020 New Delhi MNRE
Policies for project planning and development phasesSeveral initial policies assigned the full responsibility for project planning and construction to developers This included locating and acquiring suitable land conducting resource assessments obtaining all clearances and permissions and bearing the cost of ensuring connectivity to the nearest evacuation point Although some policies did talk about single-window clearance through state nodal agencies the portal or facility was non-functional on the ground Some state policies for example Gujarat Solar Policy 2009 Andhra Pradesh Solar Policy 2012 Andhra Pradesh Wind Policy 2015 and Karnataka RE Policy 2009ndash14 did include enabling provisions for the facilitation of revenuebarren lands
bull Gujarat developed the first solar park in the country in 2012 ndash Charanka Solar Park ndash that houses around 600 MW capacity and provides the required infrastructure for projects
0
0
10000
10000
20000
20000
30000
30000
40000
40000
50000
50000
60000
60000
70000
80000
70000
200
820
08
200
920
09
2010
2010
2011
2011
Solar capacity growth
Wind capacity growth
Cap
acit
y (in
MW
)C
apac
ity
(in M
W)
2012
2012
2013
2013
2014
2014
2020
2020
2019
2019
2018
2018
2017
2017
2016
2016
2015
2015
AP
AP
Telangana
Telangana
Rajasthan
Rajasthan
Maharashtra
Maharashtra
Total
Total
Gujarat
Gujarat
Tamil Nadu
Tamil Nadu
Madhya Pradesh
Madhya Pradesh
Karnataka
Karnataka
31Policy evolution in RE-rich states
How Indiarsquos Solar and Wind Policies Enabled its Energy Transition A Decade in Review
bull The New and Renewable Energy Development Corporation of AP Limited (NREDCAP) in Andhra Pradesh worked with the statersquos revenue department to procure land in advance and sign long-term leases with the developers at predetermined rates
bull In Karnataka 10 per cent of barren government lands reserved for industrial use were allocated to Karnataka Renewable Energy Development Limited (KREDL) for RE development KREDL could sub-lease the identified revenue barren or panchayat lands to project developers for 30 years No procedure was specified for the selection of developers and allotment of land to them Therefore this later led to land banking by wind developers As per the state policy KREDL was supposed to undertake wind resource assessment studies identify potential sites and notify land parcels as reserved for wind project development
Many policies did not specify the application procedures to be followed by the project developers For example Tamil Nadu Energy Departmentrsquos Policy Note 2012ndash13 was totally silent on land allocation criteria ndash for land owned by the statersquos revenue department and for private lands (TN Energy Department 2012) Hence almost the entire wind capacity in the state is installed on private lands The criteria for allotting land developed by state nodal agencies (SNA) or special purpose vehicles (SPVs) was not articulated ndash whether it was first-come-first-served basis or a robust assessment framework for leasing land or a system that prioritised certain project categories The arrangements under which the land could be allotted to developers were mainly land-lease-based However the policies were not clear on how these lease values will be determined Mostly these rates were linked to market prices which could increase significantly owing to land-use patterns and the limited availability of land
The land-related provisions in state wind policies or their silence on those aspects led to developersmanufacturers acquiring huge tracts of private land in wind-rich states which they could retain while carrying out wind resource assessments (Naidu 2013) They started implementing the project once the desired infrastructure came up or once they struck a deal with the offtaker As a result the per MW capital costs were high because of a huge component of land premiums that were built into it However this could be considered a way to address the risks wind developers had to bear at that time
Grid connectivity policiesAccording to the Grid Code for intra-state networks the state transmission utility (STU) or discom is responsible for strengthening grid infrastructure to evacuate RE power and bears the associated costs It is also responsible for extending the grid up to the pooling sub-station However given the financial health of discoms and some STUs these steps were rarely taken States took to ad-hoc arrangements to establish grid connection For example in Gujarat the following solution was adopted the STU provided the necessary equipment for connecting projects to the grid while the developers provided the workforce and the required finances This arrangement was then followed by many other RE-rich states Thereafter the parkzone approach was promoted under several later policies
As per the CERC (Grant of Connectivity Long-term Access and Medium-term Open Access in Inter-state Transmission and Related Matters) Regulations 2009 renewable energy plants of
323232
Many policies did not specify the application procedures to be followed by the project developers
more than 50 MW could connect to the ISTS to take advantage of reduced congestion in the higher-voltage grid but no wind or solar plant availed of that option till as late as 2018 This could have been because project development frameworks and power sale contracts were signed with local entities Or under the point of connection transmission pricing (on a MW basis) the charges on wind projects may have been a burden as their capacity utilisation factors are lower than that of thermal power plants Further at that time and even now PGCIL substations are often far from wind farm sites resulting in high connectivity costs for developers
Policies addressing project operations and power procurementMost policies provided for power procurement by discoms from wind and solar plants through long-term PPAs to meet the RPOs Many states in 2012ndash14 experienced power shortages Therefore RE was also considered an option to meet the demand of large commercial and industrial units in these states For example the Karnataka Electricity Regulatory Commission (KERC) notified a fixed-term concessional open-access regime for solar energy including exemption from wheeling and banking charges and cross-subsidy surcharge for the first 10 years of operation for solar projects that did not fall under the REC mechanism However this was rolled back in 201818 Many other states offered incentives and exemptions such as nil or minimal wheeling and transmission charges for wheeling of power consumed within the state cross-subsidy surcharge exemption for open access obtained for third-party sales within the state exemption from paying electricity duties for sale to discoms andor for captive consumption and third-party sale within the state and different arrangements for banking of RE power
It appeared that most RE-rich states preferred RE plants to sell power to discoms or third parties or serve captive demand within the state itself For example
bull Maharashtrarsquos New Policy for Power Generation from Non-Conventional Sources 2008 required developers availing the benefits of the policy to sell 50 per cent of the electricity generated from the plant to the discom ndash Maharashtra State Electricity Distribution Company Limited (MSEDCL) ndash at the Maharashtra Electricity Regulatory Commission (MERC)-approved rate under the PPA and the remaining 50 per cent only within the state
bull Karnatakarsquos Renewable Energy Policy 2009ndash14 required RE plants to sell electricity to discoms under PPAs approved by KERC or use it for captive purposes There was no mention of third parties within the state who could buy RE power through open access
bull Andhra Pradeshrsquos Solar Policy 2012 captures only intra-state sale of power to discoms or third party
CurtailmentFollowing the Grid Code the must-run status of RE plants was adopted by states in their respective grid codes However inadequate grid availability has been a challenge in RE-rich states more so in the period 2009ndash2014 In Tamil Nadu wind generation increases significantly during the monsoons (AprilndashSeptember) when power demand is also relatively low Before 2014 the intra-state grid was unable to absorb the excess generation due to low demand and could not transmit it to other regions because of limited inter-connections with
18 Order dated 14 May 2018 issued by the KERC in matter no S032017 titled In the Matter of Revision of Wheeling and Banking Charges for Renewable Power Projects httpskredlinfoingeneralwheeling20and20banking20charges2014052017pdf
33Policy evolution in RE-rich states 33Policy evolution in RE-rich states 33Policy evolution in RE-rich states
During 2012ndash14 many states experienced power shortages Therefore RE was also considered an option to meet the demand of large commercial and industrial units
How Indiarsquos Solar and Wind Policies Enabled its Energy Transition A Decade in Review
Table 10 2010ndash2014 Developments that held back RE deployment and associated risks that remained
Note Authorsrsquo analysis
Corresponding risks
Inadequate support for land procurement
Lack of evacuation infrastructure and delays in grid connectivity
Mismatch between national targets and state RPO trajectories low RPO compliance
Poor credit profile of state discoms
Uncertainty in incentives ndash lapsing and withdrawal of GBI and AD
Curtailment of power
No provisions for RE sale outside the state
Delay in commissioning leading to cost overrun
National targets at risk restricted marketsdemand
Offtake risk payment risk
Cashflow risks
Offtake risk
Restricted marketsdemand
Inadequate support for land procurement
Inhibitors
42 Policies post- 2014 From 2014 onwards the Indian market witnessed a steep fall in solar tariffs owing to a variety of reasons ranging from domestic factors to global developments The NSM was successful in signalling Indiarsquos commitment towards solar development Although the rate of installation was slow during 2012ndash2014 and risks and inhibitors continued (Table 10) investor outlook remained positive
Key driversAs power deficits in states reduced demand grew slower than expected and solar tariffs declined drastically In response most RE-rich states developed policies with the intent of ensuring state-level energy security meeting agricultural and domestic loads through solar and aiming to become investment-friendly destinations In addition creating employment opportunities through project deployment as well as local manufacturing and responding to local environmental challenges and addressing climate change risks remained some of the commonly stated drivers across these states
Policy focusMost policies starting 2014ndash15 included provisions to facilitate the development of large-scale solar parks in a systematic and structured manner with the help of SECI Instead of individual states conducting their own auctions to procure solar power and meet their solar RPOs states preferred to buy power through SECI while continuing to procure wind power directly at preferential tariffs till 2017 Many policies specified clear targets to be achieved over
the national grid This led to the severe curtailment of wind power In 2014 the southern grid was inter-connected with the national grid providing some relief to the southern states but many industry players (Saumy 2019) and the MNRE (Chandrasekaran 2017) have continued to ask states to prevent curtailment of RE power Curtailment for wind power plants averaged around 30ndash35 per cent of generation in the peak season during 2012ndash15 (Jhawar 2020)
34
a five-year period Most policies at least on paper aimed to mitigate project development counterparty and operations-related risks in the sector to lower the cost of RE generation in their respective states Progressive policies such as the Andhra Pradeshrsquos Solar Power Policy 2015 and Wind Power Policy 2018 provided deemed industry status to RE projects and explicitly accorded them must-run status Unlike in the pre-2014 era these policies acknowledged the need to facilitate the sale of RE power outside the state For example
bull The Rajasthan Solar Energy Policy 2014 aimed to meet the energy requirements of Rajasthan as well as India
bull Maharashtrarsquos Comprehensive Policy for Grid-connected Power Projects Based on New and Renewable (Non-conventional) Energy Sources 2015 aimed to facilitate the sale of renewable power outside the state once the statersquos RPOs were met The policy even included a provision for deemed open access for the sale of energy within or outside the state if permission is not granted within the period specified in the MERC regulations It also gave RE projects the option to terminate their existing PPA with the state discom and opt for open access
bull APrsquos Solar Power Policy 2018 provided transmission and distribution charge exemptions for inter-state wheeling of power (which was later rolled back through an amendment)
bull APrsquos Renewable Energy Export Policy 2020 aimed to facilitate the leasing of land for setting up RE power plants and manufacturing facilities and to export power to other states
The reason for this shift in focus is that RE-rich states would want to utilise their abundant land and resource potential to attract huge private-sector investments generate revenues for the exchequer and create local jobs but would not be able to absorb all the generation within the state to meet their own demand
Global market developmentsApart from reduced risk perceptions due to stronger institutional mechanisms developersrsquo expectation of fall in solar module prices also drove them to place extremely aggressive bids in the auctions (Deign 2017) Solar module prices witnessed an overall drop in prices (see Figure 9) However even small fluctuations in module prices can affect project economics adversely
35Policy evolution in RE-rich states
Unlike in the pre-2014 era the policies now acknowledged the need to facilitate the sale of RE power outside the state
Figure 9 Average module (multicrystalline) prices have declined (2011ndash2019)
Source IEA 2020 ldquoEvolution of Solar PV Module Cost by Data Source 1970-2020rdquo 30 June Accessed 28 November 2020 httpswwwieaorgdata-and-statisticschartsevolution-of-solar-pv-module-cost-by-data-source-1970-2020
0
1412
0908 08
0706
05
0302
12
1
08
06
04
02
201320122011 2014 2018 20192015 2016 2017
USD
per
Wat
t
How Indiarsquos Solar and Wind Policies Enabled its Energy Transition A Decade in Review 36
There were short periods when module prices increased during 2017ndash2020 due to various reasons such as China slashing its subsidies reduced polysilicon supply in China module suppliers demanding price renegotiation and supply chain disruptions due to the COVID-19 pandemic (Bridge to India 2017) Excessive reliance on imported modules and largely from a single country makes the projects vulnerable to geopolitics and domestic policies intended to promote domestic manufacturing (Chawla 2020)
Wind tariffs declined following the initial rounds of bidding however the decline was not at the same pace as that of solar Even as discovered tariffs kept declining and were comparable with or even lower than tariffs of thermal projects RPOs remained the key driver and the primary Central Government lever for states to increase their RE uptake This is primarily because of the additional cost implications for discoms as they balance the increased variability in the system while being tied-up in long-term thermal PPAs
Performance of policiesAlthough all the policies seemed to be favourable and directed towards providing an enabling environment for RE development on-ground implementation and compliance remained weak which was the main reason for the prevailing risks in the sector Almost all RE-rich states like Tamil Nadu Andhra Pradesh Gujarat Karnataka Rajasthan and Maharashtra have made policy and regulatory decisions on electricity matters that have often been inconsistent with national policies and priorities They have made retrospective changes to policies threatened to renege on existing PPAs delayed payments to RE generators and curtailed RE power
One main reason for these inconsistent and ad-hoc actions was the drastic and rapid decline in solar tariffs starting 2014 (see Figure 10) The wind sector too transitioned to competitive bidding in late 2016 because of the success of reverse auctions in reducing solar tariffs While competition and reduced tariffs were desirable outcomes for Central policies it led to states losing confidence in RE PPAs signed at higher tariffs as compared to the lower tariffs discovered in subsequent auctions This not only led to the re-negotiation of PPAs but also delayed the procurement of new RE capacity in anticipation of further declines in tariffs
On the other hand the policies helped advance the setting up of solar parks which was a comforting factor for developers and investors and one of the contributing factors for
Figure 10 Solar tariffs discovered in Indian auctions
Source India RE Navigator 2020 ldquoAuction Resultsrdquo Accessed November 28 2020 httpsindia-re-navigatorcomwind
0
1210
864
2
2010
-13
2014
2018
2019
2020
2015
2016
2017
Central State
INR
kW
h
37Policy evolution in RE-rich states
bringing down tariffs However there were execution bottlenecks on the ground Project development was delayed because tenders were concluded while the park infrastructure was still under construction
Amongst the RE-rich states Karnataka has been a consistent performer for solar Under the Karnataka Solar Policy 2014ndash2021 it has recorded the largest solar capacity deployments in the country in 2017 2018 and 2019 In 2017 Karnataka installed more than 2 GW of large-scale solar and contributed to almost 25 per cent of the total capacity addition in India in that year By March 2019 with over 53 GW Karnataka had the highest installed capacity of utility-scale solar with a pipeline of around 28 GW Other state policies that have attracted investments include those of Rajasthan Andhra Pradesh Tamil Nadu and Maharashtra In 2018 these five states had more than 80 per cent of the countryrsquos utility-scale solar capacity
Meanwhile after SECI successfully concluded two auctions for wind energy in 2017 resulting in reduced tariffs many wind-rich states shifted to competitive bidding with SERC-determined generic tariffs as the tariff ceiling During 2017 states such as Gujarat and Tamil Nadu auctioned additional wind capacity to meet their non-solar RPO targets (Saurabh 2017) Seven wind-rich states installed 55 GW of wind capacity in 2016ndash17 (Raikar 2018) However in 2017ndash18 and 2018ndash19 the total wind installed capacity declined substantially to just around 18 GW and 14 GW respectively (IWTMF 2019) Low tariffs were quoted in initial bids but the subsequent tenders were undersubscribed most likely because the tariff ceilings were financially not feasible The main reasons for states not being able to achieve their wind policy targets were the conditions and risks that reverse auctions failed to address (i) wind resource is more concentrated than solar and high wind density sites are getting exhausted (ii) ISTS is not plannedavailable for moderatehigh wind sites (iii) bearing the costs associated with connecting to the nearest ISTS sub-station or connecting to STU networks instead adds to the risks and the resultant tariffs face tough competition from solarAmongst wind-rich states Gujarat led wind deployment in the country during 2016ndash2020 followed by Andhra Pradesh Karnataka and Tamil Nadu Figure 11 shows the annual wind capacity addition in these states
Karnataka has recorded the largest solar capacity deployments in the country in 2017 2018 and 2019
Figure 11 Gujarat saw the largest wind capacity additions among the wind-rich states (2016ndash2020)
Source Authorsrsquo analysis based on CSO Energy Statistics 2018 New Delhi MoSPI CSO Energy Statistics 2019 New Delhi MoSPI CSO Energy Statistics 2020 New Delhi MoSPI MNRE 2020 Annual Report 2019ndash2020 New Delhi MNRE
0
2000
1000
500
2500
3000
3500
4000
4500
5000
FY 2017
248 336772
316
1286
59
46087
123502
273
857
348
1303
882
2187
FY 2018 FY 2019 FY 2020
Cap
acit
y (in
MW
)
Andhra PradeshGujaratTamil Nadu Karnataka
How Indiarsquos Solar and Wind Policies Enabled its Energy Transition A Decade in Review
In 2019 political risks in the RE sector were exemplified when the new government in Andhra Pradesh took a strong stand on renegotiating wind and solar PPAs signed under Andhra Pradeshrsquos Wind Power Policy 2018 and Solar Power Policy 2018 (see Table 11)
Table 11 Timeline of the key events in the AP story
Source Authorsrsquo analysis
Date in 2019 Event
1 July
24 September
29 November
25 July
October
30 November onwards
1 December
12 July
AP government sets up a committee to renegotiate PPAsPSAs signed between 2012 and 2016
The AP High Court quashes the July 1 order and July 12 letters in writ petitions filed by the developers It directs the developers and discoms to approach the Andhra Pradesh Electricity Regulatory Commission (APERC) with their respective claims and to resolve all disputes in 6 months In the interim discoms will clear their dues and pay all power plants at the rate of INR 243 and INR 244 for wind and solar respectively
A compromise is reached between the Central and AP governments There is to be no tariff revision but concessional loans to be extended to discoms from PFC and IREDA to clear the dues
The AP High Court stays the July 1 order based on a petition by developers
Petition filed by AP discoms before APERC to review the tariffs
AP discoms clear pending dues at the rate of INR 243 and INR 244 for wind and solar respectively
The AP High Court stays the public hearing of the APERC on the tariff review petition filed by developers
Letter from AP Southern Power Distribution Company Limited (APSPDCL) one of the two state discoms to 139 wind and solar power plants to revise tariffs to INR 243 and INR 244 respectively
2016 onward SECIrsquos tendering activity has shifted towards ISTS-connected solar projects Between 2016 to 2019 it issued tenders worth 13000 MW of solar PV capacity (ISTS I to ISTS IX) and 12600 MW of wind capacity (Tranche I to Tranche IX) Figure 12 shows the deployment progress of solar projects awarded under the ISTS I to ISTS IX tenders by the SECI (as of August 2020)
Figure 12 ISTS-connected solar PV projects have poor completion record
Source Authorsrsquo analysis based on CEA 2020 Report of Under Construction Renewable Energy Projects New Delhi Renewable Energy Project Monitoring Division (CEA)
Solar PV capacity tendered
(ISTS-I to ISTS-IX)
13000
9530
4650
1800 17501080
250
Capacity awarded
PPAPSA or both not yet
executed
PPA and PSA signed
Financial closure
achieved
Plant erection in progress
Status not available
Cap
acit
y (in
MW
)
38
As is evident almost 50 per cent of the capacity that has been awarded is still awaiting closure of power purchase andor power sale agreements This implies that state discoms are not coming forward to offtake power from projects already awarded leaving developers and investors in a lurch For the capacity for which PPAs and PSAs have already been signed there have been significant delays because the required transmissionevacuation infrastructure is not ready and long-term access (LTA) to transmission has not been operationalised The COVID-19 pandemic has further impacted the construction of transmission lines increased delays and depressed electricity demand across the country Because of the lockdown enforced to curb the spread of the pandemic the MNRE had granted blanket extension of the scheduled commissioning timelines
For wind projects too the rate of commissioning has been rather slow (Figure 13) Most of the awarded projects will be coming up in Gujarat (Kutch) There were roadblocks with respect to the land allocation policy in Gujarat because of which no progress could be made Few projects are likely to come up in other host states such as Tamil Nadu Karnataka Maharashtra Madhya Pradesh and Kerala While the recent tenders (tranches VI to VIII) were undersubscribed several projects awarded earlier are facing delays due to non-readiness of transmission infrastructure and some projects have terminated their PPAs citing non-viability of projects at the discovered rates due to time and cost overruns Notably wind-rich sites are intrinsically more concentrated than solar logistically as well as resource-wise Therefore unless the sites are identified and prepared and transmission networks are appropriately planned strengthened in advance deployment would be slow One more option being tested is the windndashsolar hybrid or the blending approach and a bidding process akin to case I bidding in the conventional power sector to ease out on transmission variability and land-related risks
39Policy evolution in RE-rich states
Figure 13 The rate of commissioning of wind projects has been slow (August 2020)
Source Authorsrsquo analysis based on CEA 2020 Report of Under Construction Renewable Energy Projects New Delhi Renewable Energy Project Monitoring Division (CEA) CEA 2019 Summary of Solar and Wind Power projects (Commissioned and Under Construction) of SECI New Delhi Renewable Energy Project Monitoring Division (CEA)
Tendered (ISTS Tranche I to IX)
13400
9361
2085
Awarded Commissioned
Win
d c
apac
ity
(in M
W)
Policies facilitating land procurementThe MNRErsquos solar park scheme encourage states to develop solar parks to solve land procurement and connectivity problems All state policies encourage deployment in parks Most policies provide for designating solar power park developers (SPPDs) The SPPDs may be a state government-designated agency or a joint venture company (JVC) between a state-
How Indiarsquos Solar and Wind Policies Enabled its Energy Transition A Decade in Review 40
designated agency and SECI or a JVC between a state-designated agency and private agency or a private agency
The states under their respective solarRE policies have provided the necessary support and arrangements for developing the parks and projects have been successfully commissioned in the parks that are operational However there have been some challenges in developing these parks including problems in land acquisition by the SPPDs and mismatch in timelines for development activities and setting up of solar projects For example developers are facing several challenges with permissions clearances and approvals at the Kadapa Solar Park in Andhra Pradesh where the letters of award were issued in August 2018 but two years hence developers have yet not been able to begin any work there
For non-solar park projects land procurement is typically the generatorsrsquo responsibility particularly for projects set on private lands The Karnataka Renewable Energy Policy 2016ndash22 was the only policy that assigned the responsibility of identifying suitable land banks to the state nodal agency Andhra Pradeshrsquos Wind Power Policy 2018 and Solar Power Policy 2018 had entrusted NREDCAP with the responsibility of securing government lands However this provision was rolled back in 2019
The wind sector was again at a disadvantage here Most policies except recent solarndashwind hybrid policies did not address land requirements for wind power projects which are typically more concentrated in certain pockets In many cases windy sites were located far from plannedexisting intra- and inter-state networks Further all state policies require wind developers to either procure government land on a lease-hold basis on their own or procure private lands Even in SECIrsquos auction for ISTS-connected wind developers faced difficulties in securing land leases from the state governments and revenue departments For example while Gujarat had announced a wind power policy in 2016 to attract investments it took a policy decision in 2018 to not allocate any land to wind projects auctioned by SECI for exporting power to other states (Tenddulkar 2019) Later in January 2019 Gujarat announced a new land policy for wind solar parks as well as windndashsolar hybrid parks to demarcate land areas where these projects would be allowed
Policies for grid connectivity and project operationsFrom 2014 onward MNRE and SECI started coordinating with other line departments and agencies at the Central level to plan construct and strengthen intra- and inter-state networks To ensure the evacuation of power from 20 GW of wind and solar capacity the Centre sanctioned a project to augment the Intra-State Transmission System (InSTS) in 2015ndash16 STUs in eight RE-rich states ndash Tamil Nadu Rajasthan Karnataka Andhra Pradesh Maharashtra Gujarat Himachal Pradesh and Madhya Pradesh ndash are implementing this project
In 2016 the Ministry of Power waived off inter-state transmission charges and losses for wind and solar projects which is now applicable for projects being commissioned till June 2023 In state-level solarwindRE policies there appears to be some degree of disparity and uncertainty on grid connectivity evacuation forecasting scheduling and sale of power
In state-level policies there appears to be some degree of disparity and uncertainty on grid connectivity evacuation forecasting scheduling and sale of power
41Policy evolution in RE-rich states
bull As of July 2019 15 states had notified their regulations for forecasting scheduling and settlement of deviations for RE broadly in line with the CERC regulations (Srivastava Singhvi and Rustagi 2019) Most of these states permit an error band of (+-) 15 per cent as per CERC regulations In a few states such as in Tamil Nadu the error band is limited to a narrower range of (+-) 10 per cent Even within the same regional load dispatch region the error bands notified by states differ For example Maharashtra permits (+-) 15 per cent deviation while Gujarat allows only (+-) 12 per cent deviation for wind developers
bull Andhra Pradeshrsquos Wind Power Policy 2018 and Solar Power Policy 2018 stated that no transmission and distribution charges will be levied for inter-state wheeling of power Later the policy was amended in November 2019 and the exemptions were rolled back and charges as determined by the APERC were made applicable
bull To discourage open-access transactions of wind power Tamil Nadu increased the cross-subsidy surcharge for open-access consumers from 50 per cent of that for conventional power in 2016 to 60 per cent in 2018 Over the same period it also increased open-access charges from 40 per cent to 50 per cent of that for conventional power Such steps restrict significant new demand for RE amongst large commercial and industrial players by adding to the landed cost of RE power even as RE tariffs become cheaper than discoms tariffs
bull Banking charges for wind and solar vary by state The period of banking is also different for various states (Table 12)
bull Although RE is accorded a must-run status by several policies and grid codes curtailment continues for technical as well as commercial reasons Older projects that have higher tariffs face higher curtailment than newer projects In Tamil Nadu curtailment has reduced from a peak of 30ndash35 per cent to 20ndash25 per cent currently (Jhawar 2020) However it appears that commercial concerns are causing the Andhra Pradesh discoms to curtail RE power despite repeated judicial directions against it (Parikh 2020)
How Indiarsquos Solar and Wind Policies Enabled its Energy Transition A Decade in Review 42
Table 12 Banking charges and conditions across RE-rich states
Source Authorsrsquo adaptation based on MERC (Distribution Open Access) (First Amendment) Regulations 2019 Order No 82020 dated 7 October 2020 issued by the TNERC titled Order on Procurement of Wind Power and Related Issues Order No 22020 dated 30 April 2020 issued by the GERC titled Tariff Framework for Procurement of Power by Distribution Licensees and Others from Wind Turbine Generators and Other Commercial Issues for the State of Gujarat RERC (Terms and Conditions for Tariff Determination from Renewable Energy Sources) Regulations 2020 Order dated 14 May 2018 in matter No S032017 issued by the KERC titled Revision of Wheeling and Banking Charges for Renewable Power Projects
Banking charges Other conditionsBanking period
No banking charges for wind projects
10 per cent of RE banked in kind
14 per cent of input energy
No banking charges
2 per cent of RE banked in kind
2 per cent of the injected energy in kind
No banking allowed
One month
April to March barring peak hours as determined by the discoms
One FY (April to March)
One month
One month
January to June ndash for wind projects
April to September and October to March ndash for solar projects
Monthly settlement for non-REC wind projects
Banking facility not available for third-party sale and REC-based captive power plants (CPP)
Energy banked during the peak time of day (TOD) hours may be drawn during off-peak TOD slots but not vice-versa
The unutilised banked energy at the end of the month up to 10 per cent of the total energy generated in that month to be purchased by discoms at the applicable generic tariffs for the year
Unutilised banked energy at the end of six months to be purchased by discoms at 85 per cent of the applicable generic tariff
The energy banked by non-REC projects during the peak ToD hours can only be drawn during the peak ToD hours
Banking allowed for CPP but not for third-party sales under open access within the state
The unutilised banked energy will lapse at the end of the year
The unutilised banked energy as of March 31 to be encashed at 75 per cent of the applicable wind energy tariff for existing wind energy captive users
Excess generation or unutilised banked energy at the end of the month to be purchased at 75 per cent of the wind energy tariff for captive users For captive REC generators the unutilised banked energy can be encashed at 75 per cent of the pooled cost of power
Gujarat
Rajasthan
Tamil Nadu For wind projects commissioned till 31 March 2018
For wind projects commissioned on or after 1st April 2018
Maharashtra
Karnataka
Andhra Pradesh
State
43
5 Policy evolution in RE-deficit states
Image iStock
As discussed above southern and western states in India have abundant RE and land resources to develop large-scale wind and solar power projects However the northern
states in the Indo-Gangetic plains are densely populated agricultural states The mountain regions in the north have excellent solar resources and are sparsely populated but have forest areas and difficult terrains and low transmission capacities The coal economy is dominant in the eastern states
How Indiarsquos Solar and Wind Policies Enabled its Energy Transition A Decade in Review 44
The policy response to developing large-scale solar and wind has been weak in the non-RE-rich states as compared to RE-rich states Our review accounts for three key states ndash Uttar Pradesh Bihar and Punjab
Key driversThe key drivers for promoting RE were poor power supply in the rural as well as urban area growing energy needs in urban industrial and commercial sectors and the need to comply with RPOs Policies intended to attract private-sector investments improve rural livelihoods and create employment opportunities through grid-connected decentralised RE projects and local manufacturing facilities
Policy focusMost of the initial policies were notified starting late 2012 and largely focused on decentralised RE such as rooftop solar solar irrigation pumps off-grid renewables and other RE resources such as bioenergy For example
bull Punjab New and Renewable Sources Policy 2012 focused on rooftop and decentralisedoff-grid generation waste to energy biomass-based cogeneration and new technologies
bull Uttar Pradeshrsquos solar policies of 2013 and 2017 focused on decentralised solar as well as large-scale grid-connected solar because of wastelands being available in the Bundelkhand region
bull Bihar Policy for Promotion of New and Renewable Energy Sources 2011 focused on biomass and biogas cogeneration projects minimicrosmall hydro wind and solar and municipal solid waste-based projects but with no specific targets
These statesrsquo policies promoted the local deployment of projects There was little emphasis on discoms buying wind and solar power from other states or buy RECs to meet solar and non-solar RPOs which were set relatively low as compared to RE-rich states This may be because the states were keen to attract investments and create jobs in their own states and bolster their own generation capacities rather than depending on other states
Even the recent policies of the RE-deficit states do not demonstrate any intent to purchase powerRECs to meet RPOs particularly the non-solar component
Performance of policiesAmong the RE-deficit states Uttar Pradesh and Punjab are leading in terms of solar deployment They are among the top 10 solar states in the country However their RPO compliance has remained weak In the year 2019ndash20 the compliance level for Uttar Pradesh was only 353 per cent whereas for Punjab it was 438 per cent (MoP 2020a) Uttar Pradesh discoms also rank among the least performing discoms of the country (ICRA Limited and CARE Ratings 2019)
Uttar Pradesh notified two solar policies ndash once in 2013 which was later superseded by a policy in 2017 The 2013 Solar Policy stated a target of 500 MW of solar capacity to be deployed
Policies in RE-deficit states promoted local project deployment with little emphasis on discoms buying wind and solar power from other states or RECs to meet RPOs
45Policy evolution in RE-deficit states
by 2017 This policy was the first of its kind because it had an exclusive budgetary allocation for discoms to procure solar power and for state nodal agencies to effectively administer and implement the policy The policy achieved 420 MW against the target of 500 MW by 2017 but presented some uncertainties such as
bull The duration of power purchase agreements was made 10 years as opposed to the usual practice of 25 years the possibility of extending PPAs beyond the 10-year duration at the prevailing APPC price did exist but this represented an uncertainty for developers
bull Strict enabling provisions for establishing solar parks were missing As a result developers reported delays due to the lack of grid infrastructure and difficulties in allotting ready land inside solar parks
The Uttar Pradesh New and Renewable Energy Development Agency (UPNEDA) initiated a competitive bidding round in March 2013 which led to the discovery of tariffs in the range of INR 801 to INR 933 per unit among the highest for any state during that time These high tariffs may be attributed to real and perceived risks specific to the policy as well as the legacy power sector issues in the state Later there were many instances when UPrsquos distribution companies renegotiated tariffs under the PPAs signed during 2015ndash16 This affected completed and under-construction grid-connected solar projects as well as the investor confidence in the sector
The UP Solar Power Policy 2017 set high targets ndash 10700 MW of installed solar capacity by 2022 out of which 6400 MW should be utility-scale projects Some improvements that were made included PPAs for 25 years facilitative provisions for land procurement additional incentives for projects in the Bundelkhand region and modalities for establishing solar parks Currently 973 MW of large-scale solar projects are in operation and about 17 GW capacity is under development (Ranjan 2020)
Recent tenders by UPNEDA have been cancelled or undersubscribed In July 2018 UPNEDA cancelled a 1 GW tender floated in January citing high tariffs Two tenders of 500 MW each in January and October 2019 were undersubscribed The reasons reported for under-subscription included inadequate gridevacuation infrastructure particularly in the Bundelkhand region and the changes made in the PPA
Punjab under its New and Renewable Sources of Energy (NRSE) Policy 2012 aimed to install 1000 MW solar by 2017 Till FY 2020 it had installed 947 MW (MNRE 2020) Although the policy emphasised installations within the state the potential for large-scale solar power in the state is limited Therefore Punjab has been procuring solar and wind power from ISTS-connected projects to meet its solar and non-solar RPO targets Punjab State Power Corporation Limited (PSPCL) signed long-term agreements with SECI and NTPC and has entered into short-term agreements with wind and solar generators for this purpose
The Bihar Policy for Promotion of New and Renewable Energy Sources 2011 was notified in June 2011 It did not state any specific targets for the segments covered The new policy in 2017 set a target of 2969 MW from solar by 2022 out of which 1000 MW was dedicated to grid-connected rooftop solar Even though this policy was notified in June 2017 it did not explicitly put out the intent to purchase solar and wind power through inter-state transactions or
45Policy evolution in RE-deficit states 45Policy evolution in RE-deficit states
In Uttar Pradesh competitive bidding in early years discovered tariffs that were higher compared to other states signalling the high risk perception amongst the industry
How Indiarsquos Solar and Wind Policies Enabled its Energy Transition A Decade in Review 46
Central procurement through SECI By December 2019 Bihar had installed 341 MW of RE capacity (CEA 2020a) out of which grid-connected solar was 149 MW and the rest was non-solar (small hydro biomass cogeneration etc) In FY 2018ndash19 Bihar discoms procured 10 MW solar and 300 MW wind power through SECIrsquos ISTS-connected projects19 In June 2019 the Bihar Renewable Energy Development Authority (BREDA) issued its first tender for setting up 250 MW of ground-mounted solar projects in the state which was re-issued in December 2019 because the state regulatory commission did not approve the high ceiling tariffs With these efforts however Biharrsquos RPO compliance at the end of March 2020 was 15 per cent with respect to Central trajectories (MoP 2020a)
Grid integrationThe initial policies by these states had some typical provisions regarding grid connectivity and transmission of power Like many other state policies on connectivity Uttar Pradeshrsquos solar power policies as well as Punjabrsquos RE Policy 2012 required developers to lay their own transmission lines to the nearest sub-station at their own cost However the UP government committed to bear all transmission-related expenditure for all solar projects in the Bundelkhand region Under Biharrsquos RE Policy 2017 the state government committed to bear connectivity-related expenditure only in cases where the RE plant is located within 10 km from the nearest sub-station
Transmission chargesPunjabrsquos 2012 policy accorded must-run status to grid-connected renewables and exempted transmission and wheeling charges for intra-state open-access sales for 10 years for RE projects commissioned up to 31 March 2017 No explicit exemptions were provided for inter-state open access unlike Uttar Pradesh which interestingly under its Solar Power Policy 2017 allowed the solar developer to sell power across the country with a 100 per cent waiver of transmission charges ndash a one of its kind provision among policies rolled out by RE-deficit states Biharrsquos RE Policy 2017 provided exemptions for wheeling of power from RE projects put up for captive use or intra-state third-party sales
Incentives for project development and operationsIt is interesting to note that some provisions in these policies were outstanding For example
Offtake and payments
bull Punjab required procurers to clear all payment dues within 60 days with rebate entitlements as incentives for early clearances
bull UP allocated budgetary support for the first 200 MW of solar projects to be payable to discoms to equalise solar and conventional power This support was equivalent to the difference between tariffs discovered for conventional power through case I bidding and the solar power tariffs discovered through reverse bidding
19 Order dated 20 March 2020 in Case No 30 2019 and 312019 issued by the BERC titled Tariff Order Truing up for FY 2018-19 Annual Performance Review for FY 2019-20 Annual Revenue Requirement (ARR) and determination of Retail Tariff for FY 2020-21 for North Bihar Distribution Company Limited (NBPDCL) and South Bihar Distribution Company Limited (SBPDCL) httpsberccoinorderstariffdistributionsbpdcl2216-tariff-order-of-nbpdcl-for-fy-2019-22
Uttar Pradesh under its Solar Power Policy 2017 allowed solar developers to sell power across the country with a 100 waiver of transmission charges
Ease of doing business investor attractiveness facilitation
bull Punjab assigned the Bureau of Investment Promotion the task of granting regulatory clearances and fiscal incentive approvals
bull Punjab extended benefits to RE projects under its Fiscal Incentives for Industrial Promotion Policy 2013 It also provided 50 to 100 per cent exemption on stamp duty property tax and electricity duty
bull Incentives under the Uttar Pradesh State Industrial Policy 2012 applied to power plants based on solar energy
bull All RE plants set up for commercial sale of power were eligible for an additional 30 per cent tax benefit on the approved project cost
bull Bihar established a Renewable Energy Development Fund under the new policy notified in 2017 This fund was supposed to be capitalised through
raquo a one-time facilitation fee of INR 100000 per MW payable during the application process for a project of more than one MW capacity
raquo a RE development cess of 10 paise per unit of power sold in the state by discoms (excluding below poverty line and agricultural consumers) subject to Bihar Electricity Regulatory Commissionrsquos (BERC) approval and
raquo a service charge of 7 per cent payable to BREDA for the execution of RE projects However this seems to be a proposal in the policy and is not executed in practice yet
47Policy evolution in RE-deficit states
How Indiarsquos Solar and Wind Policies Enabled its Energy Transition A Decade in Review 188
Image iStock
Discoms continue to be tied-up with long-term PPAs and most investors continue to base their business projections on Central and state bidding pipelines
49
With the evolving policy landscape at the Central and state level we have seen Indiarsquos renewable energy sector grow tremendously In 2010 the total installed RE capacity
was just about 18 GW which has grown almost five-fold over the decade
As our analysis suggests there were high and low points in this journey Every time a roadblock emerged India has been successful in testing and identifying alternate approaches and solutions Some of these include bundling solar power with conventional power to counter high tariffs in 2010 introducing solar parks when deployment became slow and tough increasing RPO targets to create the necessary demand creating and backing SECI to address counterparty risks accelerating tendering activity to signal a commitment to creating strong pipelines encouraging solarndashwind hybrid parks to improve utilisation factors introducing protocols and mechanisms such as market-based economic dispatch a real-time market and a green term ahead market to optimise grid integration costs With economics favouring RE its share in Indiarsquos electricity mix is only expected to grow
De-risking investments in project development has unquestionably been the focus of the policies thus far However policies have mostly not pre-empted any of the risks but developed through an iterative process that has mostly responded to immediate investor concerns Hence non-compliance with RPO targets by the states was met with centralising target setting and making them even higher the Centre responded to PPA renegotiation attempts by states with intra-se negotiations with the states and financial relief to the concerned states for addressing payment delays by discoms the Centre imposed additional financial liability on the discoms by way of the LC mechanism
Imminent market disruptions Further while CERC and the power exchanges have taken forward looking steps with introducing new market platforms there has yet been no attempt to create avenues for participation of greenbalancing power providers and buyers in these markets The discoms continue to be tied-up with long-term PPAs and most investors continue to base their business projections on Central and state bidding pipelines Other developments that threaten the investorsrsquo current business model include
bull Expectations of returns have increased since early 2019 that indicates that risk perceptions of investors have also increased (investors expect higher returns for riskier investments)
6 Looking back to look ahead
Recent developments threaten investorsrsquo current business models
How Indiarsquos Solar and Wind Policies Enabled its Energy Transition A Decade in Review
There are fewer developers who are cornering a greater share of the projects (Dutt Arboleya and Gonzalez 2020) This could mean that entry barriers to the sector are increasing and the incumbents will have a high stake in maintaining status quo Further the exit of many smaller players by selling their assets indicates that navigating Indiarsquos policy and governance environment remains a challenge (Chandra 2020)
bull Commercial and industrial consumers are increasingly turning to DRE to meet their power needs The MoP has recently floated a plan to create lsquoindustrial hubsrsquo that will have their own power supplier This power supplier is likely to be a private entity given the status of a deemed licensee under the EA (Jai 2020) Further calls for lowering commercial and industrial tariffs are becoming louder in the wake of economic downswing (Financial Express 2020) These developments threaten the principal source of revenue for the discoms and will have a cascading effect on ability of discoms to absorb RE power and invest in grid integration Poor revenues will worsen their ability make payments under the PPAs
bull The increasing competitiveness of DRE also makes them an important source of supply for the power markets Discoms are discovering benefits of economising on total power procurement costs by procuring power from the exchanges (Thomas 2020) If given the flexibility it is likely that discoms would prefer to expand exchange-based procurement rather than signing PPAs for all their projected load
bull The unexpected reduction in wind generation in 2020 by up to 43 per cent during the typical high generation period due to low wind speeds caught project developers and system operators by surprise (Singh and Mohanty 2020) Climate change could bring greater uncertainty and variation in weather patterns Project developers need to be better prepared with rigorous and advanced weatherresource forecasting and tools and techniques to make timely and robust investment and operational decisions
bull End of life waste management is going to be a serious concern very soon Developers might not have factored this into costs and current policies are unclear as to who will be required to bear these costs Developers must pre-emptively focus their attention to waste management and not be unpleasantly surprised when the government eventually wakes up to the challenges (Tyagi and Kuldeep Forthcoming)
Policies must pre-empt risks and support transition to a market-driven sector
We are now entering the next decade which could make India a RE powerhouse A target of 450 GW of RE by 2030 has been set However addressing new and legacy issues of the power sector cost-effectively managing the operations of existing assets while also integrating a large quantum of new renewable capacity are challenges that confront us today
Centrendashstate and inter-state alignment requires collaboration not mandates and penalties
Over the last three years RE costs have fallen significantly At the same time regulations allow the transmission of power from a RE-rich state to any other state in the country or the purchase of RECs for an entity to meet its RPO Despite all the obvious benefits that RE
50
It is likely that discoms would prefer to expand exchange-based procurement rather than signing PPAs for all their projected load
51Looking back to look ahead
resources have to offer states have shown some level of resistance to either deploying or buying more RE power and meeting the national targets We have seen above that states do push back when it does not make commercial sense for them or they are unable to allocate resources to meet national targets Policies so far have not resulted in alignment of Centre-state objectives and actions Further there is no institutional or political platform to bring together Centre and state representatives for collective problem solving The Centre has previously determined national capacity and consumption targets unilaterally without previous consultations and engagement It appears that the current policies and mechanisms must evolve if the gaps between RE-rich and RE-deficit states are to be bridged Some approaches to increase alignment may be
bull Account for all the costs benefits and co-benefits of achieving national targets Subsequently the principles of cost- and benefit-sharing must be established and reflected in Central policies inter-state regulations and market mechanisms to drive states towards meeting national goals and objectives An example of sharing costs may be that RE-deficit states support RE manufacturing industry and make it cost competitive globally This will create a buy-in for RE-deficit states in promoting and adopting RE
bull For long-term clarity directional uniform RPO targets can be set out for all states However states may be given the freedom to choose their own technologyclean energy mix to meet the national target
bull Institutional mechanisms may be devised that bring together the Centre and the states for resolution of issues and greater buy-in of the states towards national objectives
Addressing counterparty risks will require transformation of RE procurement models
While Indiarsquos commitment to RE is strong and sustained the consistent poor financial health of discoms poses significant risks to further growth of the sector These risks include delayed payments power curtailment and contract re-negotiation We have learnt from our policy experience so far that mandates and higher penalties have limited impact Project deployment has decreased despite the Centre taking strict and swift action against errant discoms Fundamental reforms in the distribution sector and market operations will be needed to mitigate these risks For example
bull Increasing the ability of discoms to access cheaper balancing resources
bull Rigorous demand forecasting to identify power purchase requirements under long-term contracts
bull Adopting alternate models such as solar power irrigation pumps or using distributed RE for meeting productive and consumptive loads in rural areas to reduce the subsidycost burden on discoms or urban micro-grids to manage peak loads (Tyagi Kuldeep and Dave 2020)
bull Adopting market-based procurement mechanisms for storage capacities including battery pumped storage hydro resources etc
bull Simplifying and rationalising retail tariff structures and adopting alternate subsidy disbursement mechanisms to ensure revenue recovery
Measures required to improve discom financial health and increase their flexibility in power procurement may not be aligned with the incumbent business models
How Indiarsquos Solar and Wind Policies Enabled its Energy Transition A Decade in Review 52
bull Encouraging enhanced participation in new mechanisms such as market-based economic dispatch of power plants real-time markets ancillary markets etc
However all these measures that are required to improve discom financial health and increase their flexibility in power procurement may not be aligned with the incumbent business models Investors and project developers must adapt to new market contours to stay relevant
Contrasting interests of RE manufacturers and developers must converge
Project developers have viewed policies that have aimed to support domestic manufacturing adversely or indifferently Developers preferred cheaper thin film modules when DCR was part of the NSM as against procuring locally manufactured crystalline modules Project activity slowed down when safeguard duty was introduced Developers have also been arguing against imposition of customs duties that is being demanded by manufacturers
However local manufacturing and backward and forward integration of not only generation equipment but also battery storage is essential for RE sector to be future ready and insure against geopolitical risks Lessons learnt from the COVID-19 pandemic and geopolitical tensions must be internalised Developers and manufacturers must collectively find solutions that work for them They can take cues from the initial days of spread of wind technology Wind technology in India spread through research and demonstration collaborations between countries Equipment manufacturers also expanded into project development that gave them a stake in project activity as well as manufacturing More integrated supply chains and linkages must be explored by developers and manufacturers
Institutional framework ndash planning coordination and analytical requirements
Strong institutions are prerequisites for better performance and coordination Developers must aim to work with both Central and state institutions to create data sharing and information protocols For example there is not enough data to detect reasons for curtailment As we aim to increase the share of RE in the electricity mix strong institutions with clear performance standards and a coordination mechanism are essential The functions roles and responsibilities of key power sector institutions need to evolve with national ambitions For example
bull Strict monitoring and reporting of RE curtailment and the underlying reasons
bull Data and information-sharing protocols and analytical requirements for specific institutions
bull Instituting processes for bottom-up integrated resource planning (IRP) to build an optimal and cost-effective electricity system This will include relevant Central level institutions to develop and disseminate guiding frameworks toolkits and processes that any state can utilise to conduct a robust planning exercise
bull Coordination mechanism to consistently monitor the implementation of policies programmes and plans by institutions
Such new roles and responsibilities must be formally assigned to institutions for reducing
Strong institutions with clear performance standards and a coordination mechanism are essential
53
discretion ensuring greater alignment between the Centre and states enhancing the ease of doing business reducing risks for investors and accelerating the pace of the energy transition
Accelerating the flow of capital into the sector
To achieve Indiarsquos ambitious RE targets for 2030 the country would need an additional investment of USD 199 billion (approximately INR 146 lakh crore) in generation alone Investments in transmission and storage will be over and above this (Singh Dutt and Sidhu 2020) Most of this requirement will need to be met through debt finance It is a challenge to raise such enormous amounts of debt capital when our financial institutions are already crossing the regulatory limits of exposure to the power sector As noted above the sector is seeing robust secondary market activity This has become a crucial source of finance for project developers who hive off operational assets to raise funds for fresh investment Investment trusts in infrastructure (InvIT) that have tax incentives may emerge to be an attractive model for divestment of assets especially for divestment to institutional investors who want predictable returns without managing the assets directly In the power sector transmission assets have been structured as InvITs and helped the promoter retain interest in the project while obtaining additional equity investment
Sectoral and financial policies would need to focus on tapping alternative sources of financing Research by the Council on Energy Environment and Water (CEEW) suggests that the issuance of domestic bonds for refinancing loans can unlock the ability of these institutions to lend to new RE projects According to the research this option may be operationalised by providing a limited period credit enhancement subsidy for domestic RE bond issuances
Looking back to look ahead
How Indiarsquos Solar and Wind Policies Enabled its Energy Transition A Decade in Review
Aggarwal Manu and Kanika Chawla 2019 Grid Integration Guarantee A Financial Buffer to Address Renewable Energy Curtailment New Delhi CEEW httpswwwceewinsitesdefaultfilesCEEW-Grid-Integration-Guarantee-17ul19pdf
Arora Bhanvi 2019 ldquoWhy Indiarsquos Wind Turbine Makers Are Under Stressrdquo Bloomberg Quint 22 August Accessed 12 October 2020 httpswwwbloombergquintcombusinesswhy-indias-wind-turbine-makers-are-under-stress
Balan Premal 2014 ldquoAptel Rejects GUVNLrsquos Bid to Cut Solar Power Tariff in Gujaratrdquo Business Standard 27 August Accessed 12 October 2020 httpswwwbusiness-standardcomarticlecurrent-affairsaptel-rejects-guvnl-s-bid-to-cut-solar-power-tariff-in-gujarat-114082700828_1html
Bhaskar Utpal 2020 ldquoHow Rewa solar park helped Indiarsquos green economy turn a cornerrdquo Mint 10 July Accessed 12 October 2020 httpswwwlivemintcomindustryenergyhow-rewa-solar-park-helped-india-s-green-economy-turn-a-corner-11594352166677html
Bridge to India 2017 ldquoIndian developers caught between a rock and a hard placerdquo 28 August Accessed 26 November 2020 httpbridgetoindiacomindian-developers-caught-rock-hard-place
Buckley Tim and Kashish Shah 2020 Indiarsquos Renewable Energy Policy Headwinds New Delhi IEEFA httpsieefaorgwp-contentuploads202002Indias-Renewable-Energy-Policy-Headwinds_February-2020pdf
CEA 2019a Growth of Electricity Sector in India From 1947-2019 New Delhi CEA MoP
CEA 2019b Summary of Solar and Wind Power projects (Commissioned and Under Construction) of SECI New Delhi Renewable Energy Project Monitoring Division (CEA) httpsceanicinreportsothersplanningrpmSECI20Project_Summarypdf
CEA 2020a All India Installed Capacity as on 31 December 2019 New Delhi CEA httpswwwceanicinreportsmonthlyinstalledcapacity2019installed_capacity-12pdf
CEA 2020b Executive Summary on Power Sector April 2020 New Delhi CEA httpsceanicinwp-contentuploads202006exe_summary-04pdf
CEA 2020c Report of Under Construction Renewable Energy Projects New Delhi Renewable Energy Project Monitoring Division (CEA) httpsceanicinreportsothersplanningrpmunderconstructionpdf
CERC 2018 Discussion Paper on Market Based Economic Dispatch of Electricity Re-designing of Day-ahead Market (DAM) in India New Delhi CERC httpwwwcercindgovin2018draft_regDP31pdf
Chandra Rohit 2020 ldquoCheering a Lap-win in an Unfinished Racerdquo Financial Express 1 December Accessed 1 December 2020 httpswwwfinancialexpresscomopinioncheering-a-lap-win-in-an-unfinished-race2140347
Chandrasekaran Kaavya 2017 ldquoMNRE asks Tamil Nadu to prevent curtailment of solar powerrdquo The Economic Times 9 October Accessed 12 October 2020 httpsmeconomictimescomindustryenergypowermnre-asks-tamil-nadu-to-prevent-curtailment-of-solar-powerarticleshow60997998cms
Chatterjee Anupam 2019 ldquoSolar Tenders Remain Hugely Undersubscribed mdash Herersquos What Caused Tepid Responserdquo Financial Express 4 December Accessed 28 November 2020 httpswwwfinancialexpresscomindustrysolar-tenders-remain-hugely-undersubscribed-heres-what-caused-tepid-response1783670
References
54
55
Chawla Kanika 2020 ldquoIndia-China tensions Will Indiarsquos Energy Transition be a Collateral Damagerdquo Financial Express 1 August Accessed 26 November 2020 httpswwwfinancialexpresscomopinionindia-china-tensions-will-indias-energy-transition-be-a-collateral-damage2041561
Atal Vinit and Gireesh Shrimali 2018 An Assessment of Indiarsquos Energy Choices Financial Performance and Risk Perception New Delhi CPI httpclimatepolicyinitiativeorgwp-contentuploads201805Financial-Performance-and-Risk-Perceptionpdf
CAG 2015 Report of the Comptroller and Auditor General of India on Renewable Energy Sector in India Report No 34 of 2015 New Delhi CAG httpscaggovinuploadsdownload_audit_report2015Union_Civil_Performance_Renewable_Energy_Report_34_2015pdf
CRISIL 2017 ldquoCompetitive Bidding Set to Transform Wind Power Marketrdquo May Accessed 28 November 2020 httpswwwcrisilcomcontentdamcrisilour-analysisviews-and-commentariesinsightsCRISIL-Research-Insights-Competitive-bidding-a-blow-for-wind-power-sector-may2017pdf
CSO Energy Statistics 2010 New Delhi MoSPI
CSO Energy Statistics 2012 New Delhi MoSPI
CSO Energy Statistics 2013 New Delhi MoSPI
CSO Energy Statistics 2014 New Delhi MoSPI
CSO Energy Statistics 2015 New Delhi MoSPI
CSO Energy Statistics 2016 New Delhi MoSPI
CSO Energy Statistics 2017 New Delhi MoSPI
CSO Energy Statistics 2018 New Delhi MoSPI
CSO Energy Statistics 2019 New Delhi MoSPI
CSO Energy Statistics 2020 New Delhi MoSPI
Deign Jason 2017 ldquoIndiarsquos Record-Low Wind and Solar Prices May Not Be Sustainablerdquo Greentech Media 25 September Accessed 26 November 2020 httpswwwgreentechmediacomarticlesreadindias-renewable-energy-auctions-may-not-be-sustainable
Deloitte and CII 2015 ldquoSolar Power in Karnataka Charting the Path for a Bright Futurerdquo Knowledge Paper for CII Karnataka Conference on Power July httpswww2deloittecomcontentdamDeloitteinDocumentsenergy-resourcesin-enr-solar-power-in-karnataka-noexppdf
Dutt Arjun Lucila Arboleya and and Pablo Gonzalez 2020 Clean Energy investment Trends Mapping Project Level Financial Performance Expectations in India New Delhi Paris CEEW and IEA httpscefceewinsolutions-factoryCEEW-CEF-clean-energy-investment-trends-2020pdf
Economic Times 2010 ldquoGujarat Takes the Lead Among States in Solar Powerrdquo The Economic Times 2 November Accessed 12 October 2020 httpseconomictimesindiatimescomspecial-featuregujarat-takes-the-lead-among-states-in-solar-powerarticleshow6855821cmsfrom=mdr
Economic Times 2019 ldquoPower Ministry order on LCs to Face Challenges India Ratingsrdquo Economic Times 18 July Accessed 26 November 2020 httpseconomictimesindiatimescomindustryenergypowerpower-ministry-order-on-lcs-to-face-challenges-india-ratingsarticleshow70279939cmsfrom=mdr
ETEnergyWorld 2020 ldquoGovt plans 20 GW capacity solar tenders till June 2021rdquo ETEnergyworldcom 18 March
References
How Indiarsquos Solar and Wind Policies Enabled its Energy Transition A Decade in Review 56
Accessed 12 October 2020 httpsenergyeconomictimesindiatimescomnewsrenewablegovt-plans-20-gw-capacity-solar-tenders-till-june-202174688993
Financial Express 2020 ldquoLower power tariff can boost Make in India after corona crisisrdquo Financial Express 8 May Accessed 29 November 2020 httpswwwfinancialexpresscomeconomylower-power-tariff-can-boost-make-in-india-after-corona-crisis1951679
Ganesan Karthik Poulami Choudhury Rajeev Palakshappa Rishabh Jain and Sanyukta Raje 2014 Assessing Green Industrial Policy ndash The India Experience New Delhi CEEW httpswwwiisdorggsisitesdefaultfilesrens_gip_indiapdf
Garg Vibhuti and Kashish Shah 2020 The Curious Case of Indiarsquos Discoms New Delhi IEEFA httpsieefaorgwp-contentuploads202008The-Curious-Case-of-Indias-Discoms_August-2020pdf
Garg Vibhuti Balasubramanian Viswanathan Danwant Narayanaswamy Christopher Beaton Karthik Ganesan Shruti Sharma and Richard Bridle 2020 Mapping Indiarsquos Energy Subsidies 2020 Fossil Fuels Renewables and Electric Vehicles Winnipeg IISD httpswwwiisdorgsystemfilespublicationsindia-energy-transition-2020pdf
ICRA Limited and CARE Ratings 2019 State Distribution Utilities Seventh Annual Integrated Rating New Delhi MoP httpspfcindiacomDocumentRepositoryckfinderfilesGoI_InitiativesAnnual_Integrated_Ratings_of_State_DISCOMs7th_Rating_Booklet_Final_13-10-2019pdf
Idam Infra 2016 Procurement of Wind Power Wind Vision India 2032 New Delhi Shakti Sustainable Energy Foundation httpsidaminfracomwp-contentuploads201607Wind-Vision-2032-A-Multi-Stakeholder-Perspectivepdf
IEA 2020 ldquoEvolution of Solar PV Module Cost by Data Source 1970-2020rdquo 30 June Accessed 28 November 2020 httpswwwieaorgdata-and-statisticschartsevolution-of-solar-pv-module-cost-by-data-source-1970-2020
India RE Navigator 2020 ldquoAuction Resultsrdquo Accessed 28 November 2020 httpsindia-re-navigatorcomwind
IRENA 2017 ldquoRenewable Energy Prospects for Indiardquo Working Paper Based on REmap May IRENA httpswwwirenaorg-mediaFilesIRENAAgencyPublication2017MayIRENA_REmap_India_paper_2017pdfla=enamphash=4B737628E6D1E4C7F04551C26B3C3F7EB768281A
IWTMF 2019 ldquoIndia - Wind Power Capacity Installations FY 2018-19rdquo Accessed 28 November 2020 httpsindianwindpowercompdfSTATE-WISE-MONTH-WISE-WIND-INSTALLATIONS-FY-2018-19pdf
Jai Shreya 2018 ldquo35 GW of Solar Tenders in Limbo Thanks to Tax and Regulatory Nigglesrdquo Business Standard 27 February Accessed 28 November 2020 httpswwwbusiness-standardcomarticleeconomy-policy3-5-gw-of-solar-tenders-in-limbo-owing-to-tax-and-regulatory-niggles-118022700346_1html
Jai Shreya 2020 ldquoGovt Plans Separate Electricity Distribution Channel for Industriesrdquo Business Standard 16 November Accessed 28 November 2020 httpswwwbusiness-standardcomarticleeconomy-policygovt-plans-separate-electricity-distribution-channel-for-industries-120111600018_1html
Jhawar Pratha 2020 ldquoRenewable Energy Curtailment is a Banerdquo Down to Earth 17 January Accessed 12 October 2020 httpswwwdowntoearthorginblogenergyrenewable-energy-curtailment-is-a-bane-68857
Jog Sanjay 2013 ldquoBanks Say PPA Structure for Solar Projects not Bankablerdquo Business Standard 20 January Accessed 12 October 2020 httpswwwbusiness-standardcomarticlefinancebanks-say-ppa-structure-for-solar-projects-not-bankable-110083100077_1html
Kapoor Karan Krishan K Pandey AKJain and Ashish Nandan 2014 ldquoEvolution of Solar Energy in India A Reviewrdquo Renewable and Sustainable Energy Reviews (40) 475-487 httpdxdoiorg101016jrser201407118
57References
Kumar Alok and Sushanta Chatterjee 2012 Electricity Sector in India Policy and Regulation New Delhi Oxford University Press
Kumarankandath Aruna 2015 ldquoWTO Rules Against Indiarsquos Domestic Content Requirements in Solar Powerrdquo Down to Earth 3 September Accessed 26 November 2020 httpswwwdowntoearthorginnewsenergywto-rules-against-india-s-domestic-content-requirements-in-solar-power-50977
MNRE 2017 Agenda Note for National Review Meeting of State Principal Secretaries and State Nodal Agencies of Renewable Energy on 23-24 January 2017 httpssolarrooftopgovinnotificationNotification-09012017pdf
MNRE 2019 Annual Report 2018ndash19 New Delhi MNRE httpsmnregovinimgdocumentsuploadsfile_f-1608040317211pdf
MNRE 2020a Annual Report 2019ndash20 New Delhi MNRE httpsmnregovinimgdocumentsuploadsfile_f-1597797108502pdf
MNRE 2020b Physical Progress Achievements Accessed 26 November 2020 httpsmnregovinthe-ministryphysical-progress
Mondal Debapriya 2016 ldquoWTO Ruling on Domestic Content Requirement in Solar A Blessing in Disguiserdquo ETEnergyWorld 26 September Accessed 26 November 2020 httpsenergyeconomictimesindiatimescomnewsrenewablewto-ruling-on-domestic-content-requirement-in-solar-a-blessing-in-disguise54527456
MoP 2010 Annual Report New Delhi MoP httpspowerminnicinsitesdefaultfilesuploadsAnnual_Report_2009-10_Englishpdf
MoP 2016 Guidelines for Long-term RPO Growth Trajectory of Renewable Purchase Obligations (RPOs) for Non-solar as well as Solar Order No 2332016-RampR New Delhi MoP 22 July httpswwwmahaurjacommedadatarporecreportsMoP20on20Long20term20RPO20trajectorypdf
MoP 2018 Long-term RPO Growth Trajectory of Renewable Purchase Obligations (RPOs) for Solar and Non-solar for a Period of Three Years ie 2019ndash20 to 2021ndash22 Order No 23032016ndashRampR New Delhi MoP 14 June httpspowerminnicinsitesdefaultfileswebformnoticesRPO_trajectory_2019-22_Order_dated_14_June_2018pdf
MoP 2019 Opening and Maintaining of Adequate Letter of Credit (LC) as Payment Security Mechanism under Power Purchase Agreements by Distribution Licensees Order No 23222019-RampR New Delhi MoP 28 June httpsmnregovinimgdocumentsuploadsbf4ce66944bd410bb39ef4cf60cbaa6apdf
MoP 2020a Agenda Background Conference of Power and Renewable Energy Ministers of States and UTs 3 July 2020 New Delhi 3 July
MoP 2020b Regarding MoP Order dated 28062019 regarding opening and maintaining of adequate Letter of Credit (LC) as Payment Security Mechanism under Power Purchase Agreements by Distribution Licensees Order No 23222019-RR New Delhi MoP 27 March httpspowerminnicinsitesdefaultfileswebformnoticesFinal_Clarification_to_the_orders_of_MoP_letter_dtd_06042020pdf
Naidu Katya 2013 ldquoSuzlon to Build Land Bankrdquo Business Standard 20 January Accessed 12 October 2020 httpswwwbusiness-standardcomarticlecompaniessuzlon-to-build-land-bank-111112900026_1html
Paliwal Ankur and Jonas Hamberg 2015 ldquoSolar Mission Phase II May Reign in Import of Thinfilmsrdquo Down to Earth 4 July Accessed 26 November 2020 httpswwwdowntoearthorginnewssolar-mission-phase-ii-may-reign-in-import-of-thinfilms-40130
Parikh Anjana 2020 ldquoPOSOCO to Examine Renewable Energy Curtailment Issue in Andhra Pradeshrdquo Mercom 5 February Accessed 26 November 2020 httpsmercomindiacomposoco-examine-renewable-energy-curtailment-issue-andhra-pradesh
How Indiarsquos Solar and Wind Policies Enabled its Energy Transition A Decade in Review 58
PEG 2018 Electricity Distribution Companies in India Preparing for an Uncertain Future Mumbai PEG httpswwwprayaspuneorgpegpublicationsitemdownload892_2d5b1ca58ed382a4ef554ba04f6515dchtml
PIB 2019 ldquo PM Modi addresses Climate Action Summitrdquo Accessed 28 November 2020 httpspibgovinPressReleasePageaspxPRID=1585979
POSOCO 2018 Renewable Energy Certificate Mechanism in India Key Learnings Data Analysis and Way Forward New Delhi POSOCO NLDC httpsposocoinwp-contentuploads201808REC_REPORT_17082018_fPRINTpdf
Prasad Nithin Thomas 2020 ldquoNew Solar Tariff Record of `2kWh Why Did it Go So Lowrdquo Mercom 27 November Accessed 28 November 2020 httpsmercomindiacomnew-solar-tariff-record
Raikar Nitin 2018 ldquoIndian Wind Industry Analytical Report - FY 2017ndash18rdquo Indian Wind Power 4 (1) 32-33 httpswwwindianwindpowercompdfIndian-Wind-Power-April-May-2018pdf
Ranjan Rakesh 2020 ldquoUttar Pradesh to Set Up 600 MW of Solar in a New Renewable Energy Parkrdquo Mercom 19 June Accessed 28 November 2020 httpsmercomindiacomuttar-pradesh-solar-renewable-energy-park
REC Registry of India 2020a ldquoMonth-wise RECs Reportrdquo REC Registry of India Accessed 30 November httpswwwrecregistryindianicinindexphppublicsrecs
REC Registry of India 2020b ldquoRegistered RE Generatorsrdquo REC Registry of India Accessed 30 November HYPERLINK ldquohttpswwwrecregistryindianicinindexphppublicsrecsrdquo httpswwwrecregistryindianicinindexphppublicsregistered_regens
Reuters 2020 ldquoAdani Green Energy Doesnrsquot Have a Guaranteed Buyer for $6 Billion Solar Project in Indiardquo ET Energy World 19 November Accessed 28 November 2020 httpsenergyeconomictimesindiatimescomnewsrenewableadani-green-energy-doesnt-have-a-guaranteed-buyer-for-6-billion-solar-project-in-india79298448
Saumy Prateek 2019 ldquoAfter Tamil Nadu NSEFI Writes to Karnataka About Solar Projects Facing Curtailmentrdquo Mercom 21 June Accessed 12 October 2020 httpsmercomindiacomnsefi-karnataka-solar-curtailment
Saumy Prateek 2017 ldquoPPAS for 1050 MW Wind Projects Signedrdquo Mercom 21 July Accessed 12 October 2020 httpsmercomindiacomppas-1050-mw-wind-projects-signed
Saurabh 2017 ldquoTamil Nadu India Issues 500 Megawatt Wind Energy Tenderrdquo Clean Technica 9 July Accessed 12 October 2020 httpscleantechnicacom20170709tamil-nadu-india-issues-500-megawatt-wind-energy-tender
SECI 2014 3rd Annual Report 2013ndash14 New Delhi SECI httpswwwsecicoinUploadFinacial637268670541938164pdf
SECI 2019 8th Annual Report 2018ndash19 New Delhi SECI httpsmnregovinimgdocumentsuploadsfile_f-1597797108502pdf
Seetharaman G and Kaavya Chandrasekaran 2019 ldquoGovernmentrsquos Solar Park Push is Running Into Land Acquisition and Transmission Challengesrdquo The Economic Times 28 April Accessed 12 October 2020 httpseconomictimesindiatimescomindustryenergypowergovernments-solar-park-push-is-running-into-land-acquisition-and-transmission-challengesarticleshow69074597cmsfrom=mdr
Sengupta Debjoy 2013 ldquoIndian Solar Market Forecasting a Better 2014 after a Lackluster Yearrdquo The Economic Times 20 November Accessed 12 October 2020 httpseconomictimesindiatimescomindustryenergypowerindian-solar-market-forecasting-a-better-2014-after-a-lackluster-yeararticleshow26101929cmsfrom=mdr
Shrimali Gireesh and Sunali Rohra 2012 ldquoIndiarsquos Solar Mission A Reviewrdquo Renewable and Sustainable Energy Reviews (16) 8 6317ndash6332 httpsdoiorg101016jrser201206018
59References
Singh Anoop 2010 ldquoEconomics Regulation and Implementation Strategy for Renewable Energy Certificates in Indiardquo In India Infrastructure Report 2010 edited by Development Finance Company and 3iNetwork 42-57 New Delhi Oxford University Press
Singh Hartek 2017 ldquoWhy Renewable Energy Evacuation Demands a Decisive Pushrdquo ET Energy World 26 December Accessed 12 October 2020 httpsenergyeconomictimesindiatimescomenergy-speakwhy-renewable-energy-evacuation-demands-a-decisive-push2774
Singh Sarita and Shashwat Mohanty 2020 ldquoWind Generation Falls Over 40 in July Initial Assessment Blames Low Wind Speedrdquo ETEnergyWorld 12 August Accessed 28 November 2020 httpsenergyeconomictimesindiatimescomnewsrenewablewind-generation-falls-over-40-in-july-initial-assessment-blames-low-wind-speed77496934
Singh Vaibhav Pratap Arjun Dutt and Gagan Sidhu 2020 RE-Financing Indiarsquos Energy Transition Limited Period Subsidised Credit Enhancement for Domestic RE Bond Issuances New Delhi CEEW
Sinha Amitesh 2020 ldquoIndiarsquos Ambition and Opportunities in Solar Manufacturingrdquo Presentation India PV Edge 2020 Virtual conference 6 October
Soman Abhinav Neil McCulloch Harsimran Kaur and Christopher Beaton 2019 Indiarsquos Energy Transition The Impact of the Goods and Services Tax on Solar Photovoltaic and Coal Power Costs New Delhi IISD
Srivastava Shobhit Surbhi Singhvi and Vinay Rustagi 2019 Forecasting amp Scheduling Regulations Gurugram Bridge to India httpsbridgetoindiacombackendwp-contentuploads202003Policy-brief-Executive-summarypdf
Stromsta Karl-Erik 2012 ldquoIndia may fine most PV projects for delays in messy start to NSMrdquo Recharge 21 February Accessed 12 October 2020 httpswwwrechargenewscomsolarindia-may-fine-most-pv-projects-for-delays-in-messy-start-to-nsm1-1-837485
Sud Tushar Rajneesh Sharma Radhika Sharma and Lucy Kitson 2015 Indiarsquos Accelerated Depreciation Policy for Wind Energy New Delhi IISD
Sustainability Outlook 2010 Negotiating Power Purchase Agreements for Solar Projects 28 July Accessed 12 October 2020 httpwwwsustainabilityoutlookincontentnegotiating-power-purchase-agreements-solar-projects~text=NVVN20has20proposed20a20tripartite20arrangement20for20purchaseand20Power20Purchase20Agreement20with20Solar20Power20Developers
Tenddulkar Suuhas 2019 ldquoGujarat Land Allocation Logjam Threatens Windrsquos Viabilityrdquo Wind Power Monthly 14 January Accessed 12 October 2020 httpswwwwindpowermonthlycomarticle1522808gujarat-land-allocation-logjam-threatens-winds-viability
TERI 2017 Addressing Land Issues for Utility Scale Renewable Energy Deployment in India New Delhi Shakti Sustainable Energy Foundation
The Hindu 2017 ldquoNew Solar Energy Target for Karnataka 6000 MW by 2021rdquo The Hindu 10 January Accessed 12 October 2020 httpswwwthehinducomnewscitiesbangaloreNew-solar-energy-target-for-Karnataka-6000-MW-by-2021article17018234ece
Thomas Tanya 2018 ldquoIndia May Not Reach 100GW Solar Power Target by 2022 Crisil Reportrdquo Mint 13 August Accessed 29 November 2020 httpswwwlivemintcomIndustryHEugjBRI2zsNDyVzB2E1kJIndia-may-not-reach-100GW-solar-power-target-by-2022-Crisilhtml
Thomas Tanya ldquoPower Utilities Turn to Cheaper Exchange Power as Prices Crashrdquo Mint 28 May Accessed 29 November 2020 httpswwwlivemintcomindustryenergypower-utilities-turn-to-cheaper-exchange-power-as-prices-crash-11590636539577html
How Indiarsquos Solar and Wind Policies Enabled its Energy Transition A Decade in Review 60
TN Energy Department 2012 Policy Note 2012-2013 Chennai Energy Department Government of Tamil Nadu httpscmstngovinsitesdefaultfilesdocumentsenergy_7pdf
TNN 2013 ldquoTNrsquos power utility rated worst among 4 southern statesrdquo Times of India 30 March Accessed 12 October 2020 httpstimesofindiaindiatimescomcitychennaiTNs-power-utility-rated-worst-among-4-southern-statesarticleshow19285688cms
Tongia Rahul Santosh Harish and Rahul Walawalkar 2018 Integrating Renewable Energy Into Indiarsquos Grid- Harder Than It Looks New Delhi Brookings India httpswwwbrookingseduwp-contentuploads201811Complexities-of-Integrating-RE-into-Indias-grid2pdf
Tyagi Akanksha and Neeraj Kuldeep Forthcoming Resource Management Strategies for India by Managing Solar PV Module Waste New Delhi CEEW
Tyagi Akanksha Neeraj Kuldeep and Aarushi Dave 2020 Are Urban Microgrids Economically Feasible A Study of Delhirsquos Discom and Consumer Perspectives for BYPL New Delhi CEEW httpswwwceewinsitesdefaultfilesCEEW-Are-urban-microgrids-economically-feassible-29Oct20pdf
William Praveen 2020 ldquoAmbiguities Under the GST Regime for Renewable Energy Sectorrdquo KPMG India Blog 30 January Accessed 12 October 2020 httpshomekpmginenblogshomeposts202001ambiguities-under-the-gst-regime-for-renewable-energy-sectorhtml
WTO 2016 DS456 India mdash Certain Measures Relating to Solar Cells and Solar Modules Accessed 26 November 2020 httpswwwwtoorgenglishtratop_edispu_ecases_eds456_ehtm
Judicial orders cited
Order dated 3 December 2019 issued by CERC in Petition No 340AT2019 titled PTC India Ltd v SECI and Ors httpwwwcercindgovin2019orders340-AT-2019pdf
Order dated 3 December 2009 issued by CERC in Petition No 2842009 titled Determination of Generic Levellised Generation Tariff httpwwwcercindgovin2009November09284ndash2009_final_3rdDecember09pdf
Order dated 15 May 2014 issued by CERC in Petition No SM3542013 (SuondashMotu) titled Determination of Generic Levellised Generation Tariff for the FY 2014ndash15 httpwwwcercindgovin2014ordersSO354pdf
Order dated 31 March 2015 issued by CERC in Petition No SM0042015(SuondashMotu) titled Determination of Generic Levellised Generation Tariff for the FY 2015 ndash 16 httpcercindgovin2015ordersso4pdf
Order dated 30 March 2016 issued by CERC in Petition No SM032016 (SuondashMotu) titled Determination of Levellised Generic Tariff for FY 2016ndash17 httpcercindgovin2016orderssm_3pdf
Order dated 11 August 2017 issued by the TNERC in TP No1 of 2017 titled Determination of Tariff for Generation and Distribution Accessed 25 October 2020 httpwwwtnercgovinordersTariff20Order2020092017TariffOrderTANGEDCOndash11ndash08ndash2017pdf
Order dated 27 March 2019 issued by the MERC in Case No36 of 2019 titled Case for Verification of Compliance of Renewable Purchase Obligation targets by Maharashtra State Electricity Distribution Co Ltd for FY 2017ndash18
Order dated 2 April 2019 issued by the MERC in Case No37 of 2019 titled Case for Verification of Compliance of Renewable Purchase Obligation targets by Brihanmumbai Electric Supply amp Transport Undertaking for FY 2017ndash18
Order dated 2 April 2019 issued by the MERC in Case No38 of 2019 titled Case for Verification of Compliance of Renewable Purchase Obligation targets by Tata Power Co Ltd (Distribution) for FY 2017ndash18
61Judicial orders cited
Order dated 4 April 2019 issued by the MERC in Case No39 of 2019 titled Case for Verification of Compliance of Renewable Purchase Obligation targets by Adani Electricity Mumbai Limited for FY 2017ndash18
Order dated 23 October 2017 issued by the PSERC titled Annual Revenue Requirement and Determination of Tariff for MYT Control Period from FY 2017ndash18 to FY 2019ndash20 and for True up of FY 2015ndash16 Accessed 25 October 2020 httppsercgovinpagesPSPCL-Tariff-Order-Vol-1-2017-18pdf
Order dated 19 April 2018 issued by the PSERC in Petition titled True up of FY 2016ndash17 Annual Performance Review (APR) for FY 2017ndash18 and Determining the Annual Revenue Requirement (ARR) for FY 2018ndash19 Accessed 25 October 2020 httppsercgovinpagesTariff20Order20PSPCL20for20FY202018-19pdf
Order dated 27 May 2019 issued by the PSERC in Petition No 02 of 2019 titled True up of FY 2017ndash2018 Annual Performance Review (APR) for FY 2018ndash19 approval of Revised Annual Revenue Requirement (ARR) and determination of Tariff for FY 2019ndash20 Accessed 25 October 2020 httppsercgovinpagesPSPCL-Tariff-Order-2019-20pdf
Order dated 25 February 2019 issued by the BERC in Case No 40 and 48 of 2018 and Case No 41 and 47 of 2018 titled Tariff Order for FY 2019ndash20 for NBPDCL and SBPDCL Accessed 25 October 2020 httpsberccoinorderstariffdistributionsbpdcl1965-tariff-order-of-sbpdcl-for-fy-2019-20
Order dated 24 March 2017 issued by the BERC in Case No 45 of 2016 titled Tariff Order for FY 2017-18 for NBPDCL Accessed 25 October 2020 httpsberccoinorderstariffdistributionnbpdcl1143-tariff-order-of-nbpdcl-for-fy-2017-18
Order dated 24 March 2017 issued by the BERC in Case No 46 of 2016 titled Tariff Order for FY 2017ndash18 for SBPDCL Accessed 25 October 2020 httpsberccoinorderstariffdistributionsbpdcl1142-tariff-order-of-sbpdcl-for-fy-2017-18
Order dated 21 March 2018 issued by the BERC in Case No 40 of 2017 titled Tariff Order for FY 2018ndash19 for NBPDCL Accessed 25 October 2020 httpsberccoinorderstariffdistributionnbpdcl1447-tariff-order-of-nbpdcl-for-fy-2018-19
Order dated 21 March 2018 issued by the BERC in Case No 41 of 2017 titled Tariff Order for FY 2018ndash19 for SBPDCL Accessed 25 October 2020 httpsberccoinorderstariffdistributionsbpdcl1444-tariff-order-of-sbpdcl-for-fy-2018-19
Order dated 1 June 2010 issued by the CERC in Petition No 992010 (Suo Motu) titled Determination of Forbearance and Floor Price for the REC Framework httpswwwrecregistryindianicinpdfREC_RegulationFinal_Order_on_Forbearnace_and_Floor_Price_for_RECpdf
Order dated 23 August 2011 issued by the CERC in Petition No 1422011 (Suo Motu) titled Determination of Forbearance and Floor Price for the REC Framework to be Applicable from 1st April 2012 httpswwwrecregistryindianicinpdfREC_RegulationOrder_on_Forbearnace__Floor_Price_23-8-2011pdf
Order dated 30 March 2017 issued by the CERC in Petition No 02SM2017 titled Determination of Forbearance and Floor Price for the REC Framework to be Applicable from 1st April 2017 httpswwwrecregistryindianicinpdfREC_RegulationCERC_Order_300317pdf
Order dated 17 June 2020 issued by the CERC in Petition No 05SM2020 titled Determination of Forbearance and Floor Price for the REC Framework httpswwwrecregistryindianicinpdfREC_Regulation5-SM-2020-finalpdf
Judgment dated 13 May 2015 issued by the Supreme Court of India in Civil Appeal No 4417 of 2015 titled Hindustan Zinc Limited v RERC ((2015)12SCC611) httpswwwrecregistryindianicinpdfREC_RegulationSupreme_Court_Judgement_regarding_RPO_Compliancepdf
Order dated 4 August 2015 issued by the GERC in suo motu Petition Nos 1307 of 2013 and 1312 of 2013 titled Suo-motu Proceedings in Petition Nos 1307 of 2013 and 1312 of 2013 in Pursuance of Honrsquoble APTEL Direction Contained in
How Indiarsquos Solar and Wind Policies Enabled its Energy Transition A Decade in Review
Order Dated 16042015 in Appeal Nos 258 of 2013 and 21 of 2014 and the Order Dated 14052015 in IA No 187 of 2015 Accessed 22 October 2020 httpswwwgercinorgwp-contentuploadsdocumenten_1438799511pdf
Order dated 4 April 2019 issued by the MERC in Case No 39 of 2019 titled Case for Verification of Compliance of Renewable Purchase Obligation Targets by Adani Electricity Mumbai Limited for FY 2017ndash18
Order dated 14 May 2018 issued by the KERC in matter no S032017 titled In the Matter of Revision of Wheeling and Banking Charges for Renewable Power Projects Accessed 22 October 2020 httpskredlinfoingeneralwheeling20and20banking20charges2014052017pdf
Order No 82020 dated 7 October 2020 issued by the TNERC titled Order on Procurement of Wind Power and Related Issues Accessed 22 October 2020 httpwwwtnercgovinordersTariff20Order2020092020WindOrder-2007-10-2020pdf
Order No 22020 dated 30 April 2020 issued by the GERC titled Tariff Framework for Procurement of Power by Distribution Licensees and Others from Wind Turbine Generators and Other Commercial Issues for the State of Gujarat Accessed 22 October 2020 httpswwwgetcogujaratcomgetco_newpagesfilesRNCREOrder20No220of20202020issued20by20GERC20pdf
Order dated 20 March 2020 in Case No 30 2019 and 312019 issued by the BERC titled Tariff Order Truing up for FY 2018-19 Annual Performance Review for FY 2019-20 Annual Revenue Requirement (ARR) and Determination of Retail Tariff for FY 2020-21 for North Bihar Distribution Company Limited (NBPDCL) and South Bihar Distribution Company Limited (SBPDCL) Accessed 22 October 2020 httpsberccoinorderstariffdistributionsbpdcl2216-tariff-order-of-nbpdcl-for-fy-2019-22
62
Unlocking the demand for RE and capitalising on the immense opportunity that it presents requires innovative solutions that account for legacy issues and yet are forward looking
Image iStock
How Indiarsquos Solar and Wind Policies Enabled its Energy Transition A Decade in Review
COUNCIL ON ENERGY ENVIRONMENT AND WATER (CEEW)
Sanskrit Bhawan A-10 Qutab Institutional AreaAruna Asaf Ali Marg New Delhi - 110067 IndiaT +91 (0) 11 4073 3300
infoceewin | ceewin | CEEWIndia | ceewindia

How Indiarsquos Solar and Wind Policies Enabled its Energy Transition A Decade in Review
Image iStock
Over the last ten years India has demonstrated a functional RE pathway to the world As it sets out to become a renewable energy powerhouse by 2030 it is essential that we review thejourney and draw lessons that can take us there
CEEW ReportApril 2021
ceewin
A Decade in Review
How Indiarsquos Solar and Wind Policies Enabled its
Energy Transition
Harsha V Rao and Disha Agarwal
Centre forEnergy Finance
An initiative supported by
How Indiarsquos Solar and Wind Policies Enabled its Energy Transition A Decade in Review
Copyright copy 2021 Council on Energy Environment and Water (CEEW)
Open access Some rights reserved This work is licenced under the Creative Commons Attribution-
Non-commercial 40 International (CC BY-NC 40) licence To view the full licence visit www
creativecommonsorglicences by-nc40legalcode
Suggested citation Rao Harsha V and Disha Agarwal 2021 How Indiarsquos Solar and Wind Policies Enabled its Energy
Transition A Decade in Review New Delhi Council on Energy Environment and Water
Disclaimer The views expressed in this work are those of the authors and do not necessarily reflect the views and
policies of the Council on Energy Environment and Water
The viewsanalysis expressed in this report do not necessarily reflect the views of Shakti Sustainable
Energy Foundation The Foundation also does not guarantee the accuracy of any data included in this
publication nor does it accept any responsibility for the consequences of its use For private circulation
only
Cover images iStock
Peer reviewers Divyam Nagpal Programme Officer-Energy Access International Renewable Energy Agencyrsquos (IRENA)
Knowledge Policy and Finance Centre Paramita Sahoo Head - Policy Advocacy The Tata Power
Company Limited Pustav Joshi Climate Change Policy and Negotiations Lead UK Trade Economics and
Prosperity Foreign Commonwealth Office Government of UK Vibhuti Garg Energy Economist Institute
for Energy Economics and Financial Analysis (IEEFA) Deepak Sriram Krishnan Associate Director Energy
WRI India and Praveen Golash Senior General Manager Avaada Energy Pvt Ltd
Publication team Alina Sen (CEEW) The Clean Copy Twig Designs and Friends Digital
Acknowledgments The authors of this study would like to thank Shakti Sustainable Energy Foundation (SSEF) for their
support to carry out this study
We are obliged to the peer reviewers of this report who provided critical comments and inputs and
helped improve the draft substantially We thank Gandhar Ukidve and Sachin Zachariah both Research
Analysts at CEEW for their research inputs We are further grateful for the constant guidance and inputs
of Vaibhav Pratap Singh Senior Analyst CEEW-Centre for Energy Finance (CEEW-CEF) and Kanika
Chawla formerly Director CEEW-CEF And finally we thank Alina Sen and the Outreach team at CEEW for
the publishing and outreach of this study
Organisations The Council on Energy Environment and Water (CEEW) is one of Asiarsquos leading not-for-profit policy
research institutions The Council uses data integrated analysis and strategic outreach to explain ndash and
change ndash the use reuse and misuse of resources It prides itself on the independence of its high-quality
research develops partnerships with public and private institutions and engages with wider public In
2021 CEEW once again featured extensively across ten categories in the 2020 Global Go To Think Tank
Index Report The Council has also been consistently ranked among the worldrsquos top climate change think
tanks Follow us on Twitter CEEWIndia for the latest updates
Shakti Sustainable Energy Foundation seeks to facilitate Indiarsquos transition to a sustainable energy
future by aiding the design and implementation of policies in the following areas clean power energy
efficiency sustainable urban transport climate change mitigation and clean energy finance
Council on Energy Environment and Water Sanskrit Bhawan A-10 Qutab Institutional Area Aruna Asaf Ali Marg New Delhi - 110067 India
About CEEW
The Council on Energy Environment and Water (CEEW) is one of Asiarsquos leading not-for-profit policy research institutions The Council uses data integrated analysis and strategic outreach to explain mdash and change mdash the use reuse and misuse of resources The Council addresses pressing global challenges through an integrated and internationally focused approach It prides itself on the independence of its high-quality research develops partnerships with public and private institutions and engages with the wider public
The Councilrsquos illustrious Board comprises Mr Jamshyd Godrej (Chairperson) Mr Tarun Das Dr Anil Kakodkar Mr S Ramadorai Mr Montek Singh Ahluwalia Dr Naushad Forbes Ambassador Nengcha Lhouvum Mukhopadhaya and Dr Janmejaya Sinha The 100 plus executive team is led by Dr Arunabha Ghosh CEEW is certified as a Great Place To Workreg
In 2021 CEEW once again featured extensively across ten categories in the 2020 Global Go To Think Tank Index Report including being ranked as South Asiarsquos top think tank (15th globally) in our category for the eighth year in a row CEEW has also been ranked as South Asiarsquos top energy and resource policy think tank for the third year running It has consistently featured among the worldrsquos best managed and independent think tanks and twice among the worldrsquos 20 best climate think tanks In ten years of operations The Council has engaged in 278 research projects published 212 peer-reviewed books policy reports and papers created 100+ new databases or improved access to data advised governments around the world nearly 700 times promoted bilateral and multilateral initiatives on 80+ occasions and organised 350+ seminars and conferences In July 2019 Minister Dharmendra Pradhan and Dr Fatih Birol (IEA) launched the CEEW Centre for Energy Finance In August 2020 Powering Livelihoods mdash a CEEW and Villgro initiative for rural start-ups mdash was launched by Minister Mr Piyush Goyal Dr Rajiv Kumar (NITI Aayog) and HE Ms Damilola Ogunbiyi (SEforAll) The Councilrsquos major contributions include The 584-page National Water Resources Framework Study for Indiarsquos 12th Five Year Plan the first independent evaluation of the National Solar Mission Indiarsquos first report on global governance submitted to the National Security Adviser irrigation reform for Bihar the birth of the Clean Energy Access Network work for the PMO on accelerated targets for renewables power sector reforms environmental clearances Swachh Bharat pathbreaking work for the Paris Agreement the HFC deal the aviation emissions agreement and international climate technology cooperation the concept and strategy for the International Solar Alliance (ISA) the Common Risk Mitigation Mechanism (CRMM) critical minerals for Make in India modelling uncertainties across 200+ scenarios for Indiarsquos low-carbon pathways Indiarsquos largest multidimensional energy access survey (ACCESS) climate geoengineering governance circular economy of water and waste and the flagship event Energy Horizons It recently published Jobs Growth and Sustainability A New Social Contract for Indiarsquos Recovery
The Councilrsquos current initiatives include A go-to-market programme for decentralised renewable energy-powered livelihood appliances examining country-wide residential energy consumption patterns raising consumer engagement on power issues piloting business models for solar rooftop adoption developing a renewable energy project performance dashboard green hydrogen for industry decarbonisation state-level modelling for energy and climate policy reallocating water for faster economic growth creating a democratic demand for clean air raising consumer awareness on sustainable cooling and supporting Indiarsquos electric vehicle and battery ambitions It also analyses the energy transition in emerging economies including Indonesia South Africa Sri Lanka and Viet Nam
The Council has a footprint in 21 Indian states working extensively with state governments and grassroots NGOs It is supporting power sector reforms in Uttar Pradesh and Tamil Nadu scaling up solar-powered irrigation in Chhattisgarh supporting climate action plans in Gujarat and Madhya Pradesh evaluating community-based natural farming in Andhra Pradesh examining crop residue burning in Punjab and promoting solar rooftops in Delhi and Bihar
How Indiarsquos Solar and Wind Policies Enabled its Energy Transition A Decade in Review
Harsha V Rao harsharaoceewin
Harsha researches the legal and regulatory framework of the energy sector Before joining The Council she worked as a litigation lawyer in Delhi She has also worked with the project finance team of a leading law firm in India
Disha Agarwal dishaagarwalceewin
Disha co-manages The Councilrsquos Renewable Energy Programme She works on legislative policy and regulatory frameworks at the intersection of power and renewables She has experience in strategy development renewable energy policy and market analyses stakeholder management and collaborations grant-making and fund-raising Before joining The Council she was with Shakti Sustainable Energy Foundation leading programmes on renewables and climate policy during her tenure
The authors
ldquoRenewable energy already makes sense We should now take steps to deepen the market and make it more flexiblerdquo
ldquoIndia is set to become a renewable energy powerhouse over this decade This is when we need to adopt pathways to reducing the sectorrsquos reliance on policiesrdquo
How Indiarsquos Solar and Wind Policies Enabled its Energy Transition A Decade in Review
Image iStock
This study focuses on the evolving policies and risks in Indiarsquos utility-scale solar and wind energy sector and mitigating strategies used at various points in time
Contents
Executive summary
2 Evolution of Central policies
21 Pre-2010 ndash private-sector participation and prioritising renewables 22 Post-2010 policies for solar 23 Impact of other policies on project deployment 24 Solar Park Scheme 25 Post-2010 policies for wind 26 Policy assessment
3 Renewable purchase obligations ndash a regulatory mechanism for creating demand
31 Setting RPO targets 32 Compliance with RPO 33 Causes of under-achievement
4 Policy evolution in RE-rich states
41 Policies pre-2014 42 Policies post- 2014
5 Policy evolution in RE-deficit states
6 Looking back to look ahead
References
Judicial orders cited
1 Introduction
11 Methodology 12 Institutional framework
1
24
5
27
49
54
60
17
12
27
5
14
34
1918
43
81011
22
i
How Indiarsquos Solar and Wind Policies Enabled its Energy Transition A Decade in Review
Tables
Table ES1 Spheres of influence of the Centre and states
Table 1 The institutional structure of the power sector
Table 2 Evolution of central policies for utility-scale wind and solar energy ndash 2010ndash2019
Table 3 Snapshot of VGF schemes
Table 4 Indiarsquos progress towards 175 GW renewable energy by 2022
Table 5 MoP trajectory for RPO
Table 6 Resource-rich states are also the highest buyers of RECs
Table 7 REC floor prices and forbearance prices have consistently fallen
Table 8 Average size of a registered plant as of FY 2018
Table 9 Targets specified under policies and actual achievements
Table 10 2010ndash2014 Developments that held back RE deployment and associated risks that remained
Table 11 Timeline of the key events in the AP story
Table 12 Banking charges and conditions across RE-rich states
Figures
Figure ES1 Pace of capacity addition in wind and solar projects has slowed down
Figure ES2 Policy focus of the states
Figure ES3 Developments across project deployment and operations
Figure ES4 Lessons from policy evolution
Figure ES5 Varied and evolving challenges for RE growth
Figure ES6 Signals of disruption of the existing business models of investors
Figure 1 The rate of growth in solar and wind capacity addition is slowing down (2008ndash2020)
Figure 2 The pace of solar park development under the Central scheme has been slow (31 December 2019)
Figure 3 Competitive bidding in wind brought down the tariffs significantly
Figure 4 Compliance with RPOs is uneven among states and discoms
Figure 5 RECs consistently remain unsold in the market
Figure 6 The registration of new projects under the REC mechanism has reduced
Figure 7 RE resource potential is concentrated in western and southern India
Figure 8 Solar and wind capacity increased rapidly 2014 onwards
Figure 9 Average module (multicrystalline) prices have continiously declined (2011ndash2019)
Figure 10 Solar tariffs discovered in Indian auctions
Figure 11 Gujarat saw the largest wind capacity additions among the wind-rich states (2016ndash2020)
Figure 12 ISTS-connected solar PV projects have poor completion record
Figure 13 The rate of commissioning of wind projects has been slow (August 2020)
ii
4
678
10
14
19
22
23
24
2930
34
38
42
ii
iv
v
viii
vii
viii
2
12
13
20
21
23
27
31
35
36
37
38
39
Acronyms
AAPERC Andhra Pradesh Electricity Regulatory Commission
APPC average power purchase cost
APSPDCL Andhra Pradesh Southern Power Distribution Company Limited
AD accelerated depreciation
APTEL Appellate Tribunal of Electricity
BERC Bihar Electricity Regulatory Commission
BREDA Bihar Renewable Energy Development Authority
CAG Comptroller and Auditor General of India
CEA Central Electricity Authority
CERC Central Electricity Regulatory Commission
COVID-19 coronavirus disease 2019
CPP captive power plants
CST central sales tax
DCR domestic content requirement
DRE distributed renewable energy
EA Electricity Act 2003
FiT feed-in tariffs
FY financial year
GBI generation-based incentive
GERC Gujarat Electricity Regulatory Commission
GST goods and services tax
GUVNL Gujarat Urja Vikas Nigam Limited
GW giga watt
IEGC Indian Electricity Grid Code
INR Indian rupee
InSTS intra-state transmission system
IRP integrated resource planning
ISTS inter-state transmission system
KERC Karnataka Electricity Regulatory Commission
KPCL Karnataka Power Corporation Limited
KREDL Karnataka Renewable Energy Development Limited
LC letter of credit
LTA long-term access
MERC Maharashtra Electricity Regulatory Commission
MNRE Ministry of New and Renewable Energy
MoP Ministry of Power
MoSPI Ministry of Statistics and Programme Implementation
How Indiarsquos Solar and Wind Policies Enabled its Energy Transition A Decade in Review
MPERC Madhya Pradesh Electricity Regulatory Commission
MSEDCL Maharashtra State Electricity Distribution Company Limited
MW mega watt
MWh mega watt-hour
NAPCC National Action Plan on Climate Change
NLDC National Load Despatch Centre
NREDCAP New and Renewable Energy Development Corporation of AP Limited
NSM National Solar Mission
NTP National Tariff Policy
NVVN NTPC Vidyut Vyapar Nigam Limited
OampM operation and maintenance
OEMs original equipment manufacturers
PGCIL Power Grid Corporation of India Limited
PIB Press Information Bureau
POSOCO Power System Operation Corporation Limited
PPA power purchase agreement
PSA power sale agreement
PSERC Punjab State Electricity Regulatory Commission
PSM payment security mechanism
PSPCL Punjab State Power Corporation Limited
PV photovoltaic
RBI Reserve Bank of India
RE renewable energy
REC renewable energy certificate
RERC Rajasthan Electricity Regulatory Commission
RES renewable energy sources
RPO renewable purchase obligation
SECI Solar Energy Corporation of India Limited
SERC state electricity regulatory commission
STU state transmission utility
TOD time of day
TSERC Telangana State Electricity Regulatory Commission
TNERC Tamil Nadu Electricity Regulatory Commission
UPERC Uttar Pradesh Electricity Regulatory Commission
UPNEDA Uttar Pradesh New and Renewable Energy Development Agency
VAT value-added tax
VGF viability gap funding
WTO World Trade Organisation
Executive summary
In 2015 India announced ambitious targets for renewable energymdash175 GW by 2022mdashone of the largest expansion initiatives in the world Just four years later at the United
Nations Climate Action Summit 2019 the Prime Minister of India pledged to increase Indiarsquos renewable energy (RE) capacity to 450 GW by 2030 (PIB 2019) Indiarsquos journey to reaching these targets is at a critical juncture The pace of capacity addition in utility-scale wind and solar power which saw a rapid increase during 2014ndash2017 has since slowed down (Figure ES1)
Image iStock
i
How Indiarsquos Solar and Wind Policies Enabled its Energy Transition A Decade in Review
Figure ES1 Pace of capacity addition in wind and solar projects has slowed down
Source CEA 2019 Growth
of Electricity Sector in
India From 1947-2019
New Delhi CEA MoP
CEA 2020 All India
Installed Capacity as on 31
December 2019 New Delhi
CEA
Private investment has shaped deployment trajectories so far Today solar and wind technologies have advanced supply chains have strengthened and expertise has developed Despite the highs and lows investor confidence in Indiarsquos RE sector continues to remain robust Further many factors favour investments in RE It has proved itself to be resilient in times of crisis including the COVID-19 induced shocks in 2020 There are strong signals that RE is a preferred choice not just because of its green attributes but because of its favourable cost economics for all stakeholders
Evolving policies at the Central and state level have played a significant role in building investor confidence From our study of the evolution of the sector we learn that the initial policies were instrumental in propelling RE growth Every time a roadblock emerged India has been successful in testing and identifying alternate approaches and solutions Some of these innovative approaches include tariff bundling encouraging solar parks to benefit from economies of scale creating payment security mechanisms to address counterparty risks encouraging solarndashwind hybrid parks to improve utilisation factors testing and introducing protocols and mechanisms such as security constrained economic dispatch (SCED) a real-time market (RTM) market based economic dispatch (MBED) and a green term-ahead market (GTAM) to optimise grid integration costs etc However a mixture of legacy issues and recent developments threaten the current business models and existing policies may no longer be sufficient to ensure continued growth of the sector
Both the Central government and the state governments have different spheres of influence (Table ES1) affecting the power sector Hence both Central and state policies need to be studied to understand the functioning and evolution of the sector
Table ES1 Spheres of influence of the Centre and states
Source Authorsrsquo analysis
STATES
Set the broader policy direction for the electricity sector under the Electricity Act 2003 (EA)
Primary responsibility and control over the national grid Setting technical standards for the grid to be maintained by the states
Set bidding guidelines for power procurement
Set renewable purchase obligations (RPOs)
Operate with independence within the overarching framework set by the Centre
Directly influence land availability grid connectivity and build-out of intra-state transmission and distribution infrastructure Determine applicable charges to use infrastructure
Power procurement for supply to consumers
Set tariffs and cross-subsidy levels that affect end consumer and hence consumption of power
CENTRE
ii
Growth rate (wind) Growth rate (solar)
0 0
5000 10
10000 20Inst
alle
d c
apac
ity
(MW
)
Gro
wth
rat
e
1500030
2000040
2500050
3000060
35000
70
40000
80
90
2012-13 2013-14 2014-15 2015-16 2016-17 2017-18 2018-19 2019-20
Wind capacity Solar capacity
9
79
14
56
11
42
81 8276
1521
5 5
30
6
24
Note Figures for 2019-20 are only up to December 2019
iiiExecutive summary
Central policies kickstarting solar but leaving wind behindThe initial drivers for RE capacity addition were fiscal financial and tax incentives like accelerated depreciation generation-based incentives and feed-in tariffs (FiTs) determined by state commissions Wind turbine manufacturers were the first movers The de-licensing of generation under the Electricity Act 2003 (EA) set the stage for private investments in RE However the introduction of the National Solar Mission (NSM) in 2010 brought about a massive jump in solar capacity addition and turned the spotlight to utility-scale RE projects The NSM addressed offtake and payment risks with creditworthy trading intermediaries signing long-term power purchase agreements (PPAs) with project proponents The payment and offtake risks arose from the higher costs of solar power as opposed to prevailing conventional power tariffs and poor financial health of distribution companies or discoms (primary bulk procurers of power) The NSM progressed from a FiT regime to competitive bidding and was successful in increasing solar capacity deployment in the country from just 2 MW in 2007ndash08 to 3744 MW in 2014ndash15 (CEA 2019)
Competitive bidding also became mandatory for wind power from 2017 However it did not see the same level of success as solar While tariffs did come down the rate of growth of wind capacity also reduced (see Figure ES1) because the low tariffs disrupted the business model of existing players who were also equipment manufacturers The future trajectory of wind deployment remains to be seen with solar tariffs continuously falling and the evolution of the models adopted by independent RE power producers
Critical requirements that Central policies have not fully tackled are those of timely procurement of suitable land timely construction of evacuation and transmission facilities and minimising curtailment These are also the areas in which states have significant roles and authority The Ministry of New and Renewable Energy (MNRE) introduced the Solar Park Scheme in 2017 to address land-related issues and fast-track deployment through land aggregation and access to the Central transmission network However the schemersquos target of setting up at least 50 solar parks by 2022 is still distant (MNRE 2020) It has been unable to solve coordination issues and the ability of the Centre in developing schemes to address land issues is limited
Inadequate demand creation mechanisms
Initially in the absence of cost-competitive tariffs large buyers of power were mandated to purchase RE through renewable purchase obligations (RPO) under the National Tariff Policy 2006 in a bid to create demand for RE The EA authorises state regulators to set their own targets and regulations on RPOs In subsequent years the Ministry of Power (MoP) and the MNRE made multiple attempts to nudge states to set higher RPO targets and ensure strict compliance However our analysis shows that there have been considerable lags in both
How Indiarsquos Solar and Wind Policies Enabled its Energy Transition A Decade in Review iv
Figure ES2 State concerns that remain unaddressed in Central policies till 2014 and beyond
Source Authorsrsquo analysis
We find that the reasons for middling compliance with RPO targets are
bull Mismatch between the incentives for a RE-rich state to host an RE power plant and a RE-deficit state to buy either power or RE certificates (RECs) from these power plants This has resulted in RE-rich states having the highest compliance with RPOs while RE-deficit states do not see sufficient benefits or strict enforcement to be pushed to fully comply with their RPOs This has in turn affected the ability of even RE-rich states to increase their rates of deployment and RPO compliance
bull Enforcement mechanisms are weak A framework for regular monitoring of compliance is absent Enforcement of RPO by state regulators is not strict enough
Currently apart from setting up inter-state projects there are no other mechanisms to equitably share the costs of hosting RE projects to supply power to other states Further despite RE tariffs attaining grid parity investors continue to rely on RPOs for demand creation indicating deeper causes obstructing further RE penetration in markets Inadequate compliance of Central policies by states also point to certain legitimate state concerns that may not have been addressed (Figure ES2)
Centre and states have different drivers for promoting REWe also note that the main drivers for promoting RE are slightly different for the Centre and the states While the Centre initially emphasised energy security and climate change mitigation the states were keen to obtain the benefits of private investment and job creation It is only lately that the Centre has also emphasised the job creation and domestic manufacturing potential in RE
Most RE-deficit states are inclined to meet their RPO targets mostly through local deployment even if the local deployment is inadequate to meet the targets This is particularly true for solar which is a more abundant and widespread resource throughout the country State-level RPO regulations compliance provisions participation in REC markets and achievement levels demonstrate this However with stricter enforcement measures and falling tariffs the inter-state transmission system (ISTS) procurement of wind and solar power has seen a rise
Hosting RE plant attracts additional balancing costs This means states do not have incentive to host plants for self-consumption as well as export RE power unless directly connected to the central grid (partially addressed)
Severe financial stress on discoms leading to inability in spending towards compliance of RPOs or maintaining payment security (continues to be unaddressed)
Inadequate representation of state concerns before the Centre for policy making setting national objectives setting RPO targets etc (continues to be unaddressed)
Different drivers for the Centre and the states to incentivize RE
Energy security and climate change drives the Centre while investments job creation and resulting cost of system operation matter for the states (partially addressed)
vExecutive summary
Lack of enthusiasm of states in the high-tariff era
State-level institutions have the power and responsibility to ease land procurement for projects facilitate connectivity to the grid enable the construction of transmission infrastructure and ensure offtake of the power generated from the plants From our analysis of the RE policies of eight RE-rich states and three RE-deficit states we find that policies vary widely on these fronts (Figure ES3)
Pre-2014 when RE tariffs were still quite high the policies of even the RE-rich states did not provide a lot of support to private investors in the sector The responsibility of obtaining land was placed on the developers themselves Even though the states notified their own RE policies they did not meet their targets States like Gujarat and Rajasthan saw considerable capacity deployment under the NSM in this period owing to the easy availability of land and high wind and solar potential Charanka Solar Park in Gujarat set up in 2012 was successful in attracting investors This inspired the push towards establishing more solar parks in the country Because evacuation infrastructure was inadequate state policies required developers to finance and construct the required infrastructure at least till the interconnection point
Figure ES3 Developments across project deployment and operations
Source Authorsrsquo analysis
The RE-rich states covered are Andhra Pradesh Gujarat Karnataka Madhya Pradesh Maharashtra Rajasthan Tamil Nadu and Telangana and the RE-deficit states covered are Bihar Punjab and Uttar Pradesh
HIGH
TARIFF ERA
LOW
TARIFF ERA
RE-rich states
Responsibility on developers
Success of Charanka solar park inspired solar park policy
Developers required to construct evacuation infrastructure upto grid connection point
Feed-in-tariff
Procurement for use only within the state
High curtailment High curtailment
High curtailment
Older RE PPA renegotiations
Low utility-scale RE capacity Evacuation constraints visible in few instances
No policy focus
No policy focus
Feed-in-tariff
Decentralised power emphasised
Competitive bidding
Export of power outside the state begins to be promoted
Fewer new PPAs being signed
Competitive bidding
No focus on inter-state power purchase but procurement from central intermediaries has increased
Fewer new PPAs being signed
Solar parks and facilitation of land procurement
Land availability remains a concern especially for wind
States participating in Centre led transmission infrastructure development However progress is slow
Facilitation of land procurement by state agencies
However land availability remains a concern
No policy focus
RE-rich statesRE-deficit states RE-deficit states
LAND
GRID CONNECTION
POWER PROCUREMENT
MODE
PROJECT OPERATION
How Indiarsquos Solar and Wind Policies Enabled its Energy Transition A Decade in Review
However beyond the interconnection point transmission infrastructure continues to remain a challenge This coupled with the financial difficulties of the distribution utilities led to the severe curtailment of RE power The state policies only incentivised RE project development that supplies power to their own state discoms Some states like Maharashtra Karnataka and Andhra Pradesh even made it mandatory to sell electricity only to discoms within their borders and obligated entities within the state
Lowering tariffs corresponded with increased state promotion of RE but legacy issues came in the way The year 2014 marked the beginning of a significant departure from the past Many developments favoured the RE sector and Central and state policies found greater synergy As RE tariffs fell steeply states moved to incentivise large-scale projects including solar parks They sought to capitalise on investor interest in this sector and states like Andhra Pradesh extended the incentives available to other industry like land allotment facilitation of clearances tax incentives etc to RE power plants There was a shift in focus from setting up projects for self-consumption to supporting projects for the export of power to other states Rajasthan Maharashtra and Andhra Pradesh provided developers with incentives such as time bound open access approval facilitating land procurement exemption on charges etc for setting up inter-state projects States also turned their attention to facilitating deployment and many policies tasked their state agencies with facilitating revenue land procurement for the planned and systematic development of projects
However the PPAs signed in the high-tariff era have become a sore thumb for RE-rich states These agreements which were signed for 20ndash25 years must be honoured by discoms even though cheaper power is available States attempted to push back against these obligations as early as 2014 when Gujarat moved to renegotiate tariffs Andhra Pradesh made the most recent attempt in 2019 These moves by states have added to the set of risks to be mitigated In all these cases the states were ultimately unsuccessful in renegotiating tariffs as their actions were struck down in courts or due to interventions by the Central Government However states continue to employ other means like curtailment to reduce their obligations under expensive contracts Considering that the state bears these costs at the end we need a more equitable solution that can ensure a fair transition for all players without creating uncertainty for investors
In RE-deficit states state policies emphasised decentralised power as opposed to utility-scale projects Their primary drivers were the RPO targets and the potential for private investment For example Punjab and Bihar focused on ensuring payment security and ease of doing business in their states The existing policies of RE-deficit states do not exhibit intention to increase their inter-state purchase of RE for example they do not lay out any roadmap or explicit commitment of procuring power from any of the trading intermediaries like Solar Energy Corporation of India Limited (SECI) or from other states to meet their RPOs Any purchase made is unplanned and this prevents RE-rich states and intermediaries from accurately forecasting demand
Varied and evolving challenges have to be tackled to achieve 450 GW RE target by 2030The existing policies have resulted in tremendous outcomes though short of the targets we set for ourselves As we advance in our energy transition journey it is apt that we incorporate the policy lessons from the journey so far (Figure ES4)
vivivi
Indiarsquos electricity sector is grappling with issues both legacy and novel Legacy issues affecting discom financial health is an obstacle to further growth of the RE sector Further new market and technological advancements like storage and new trading platforms at the doorstep have the potential to bring economy and choice in power procurement and support the energy transition Growth pathways must hence emphasise market-based choices for generation technologies and market-driven procurement and dispatch of electricity
The inhibitions and counterproductive steps of the state governments like renegotiations of PPAs rolling back incentives etc are reflective of genuine operational and financial implications (Figure ES5) State actions show the evolving nature of challenges in RE deployment High tariffs were the initial roadblock which were then followed by infrastructural and operational challenges such as land availability transmission and grid integration issues and other legacy issues that soon became starkly visible
With an increasing share of RE in their energy mix RE-rich states have improved their capabilities to manage RE variability harness system flexibility and forecast and schedule demand and supply However grid integration continues to be a challenge There has been some push-and-pull between state regulators system operators and generators around bearing additional costs relating to forecasting scheduling and deviation settlement The contentions relate to the availability of forecasting methods formulae for penalties the status of aggregation error bands and permissible revisions Forecasting and scheduling add to the costs borne by host states
viiExecutive summary
Figure ES4 Policy lessons from the journey so far
Source Authorsrsquo analysis
NEED TO FACTOR IN DISRUPTIONS IN BUSINESS MODELSInvestment has flown into solar sector due to policy certainty and assurance of opportunities However business models are seeing signs of disruptions Land curtailment and payment risks must be addressed
NEED CENTRE-STATE ALIGNMENTJob creation and value addition are more important considerations for states Mandates and penalties have limited success in encouraging higher deployment in states Institutional mechanisms are required to increase alignment
NEED TO REVIEW WIND SECTORThe introduction of competitive bidding in the sector drove down tariffs but adversely affected the existing industry players in the sector Wind sector needs to be revived Land and resource variability are the most significant risks
NEED REALLOCATION OF COSTS AND BENEFITSThere is divergence between RE-rich and RE-deficient states in deployment and consumption of RE RE-rich states have higher RPO compliance rates We need to account for and allocate the costs benefits and co-benefits of achieving rational targets
NEED TO ALIGN MANUFACTURING AND POWER GENERATIONSingle-minded focus on tariff reduction adversely impacted solar manufacturing Going forward contrasting interests of RE manufacturers and developers must converge
NEED TO PREMPT RISKSPolicies respond to risks rather than anticipate them The interests of incumbents and the overall growth of the sector are no longer aligned Going forward policies need to recognise this reality
POLICY LESSONS
viiExecutive summary
How Indiarsquos Solar and Wind Policies Enabled its Energy Transition A Decade in Review
Policies must pre-empt risks and support transition to a market-driven sectorGoing forward policy decisions must enable the overall growth of the sector rather than target scale through incumbent models The incumbent business models and market mechanisms are at the cusp of disruptions caused due to natural market progression technological advancement and discomsrsquo responses in meeting their challenges (Figure ES6)
Figure ES6 Signals of disruption to the existing business models of investors
Source Authorsrsquo analysis
Figure ES5 Operational and financial challenges in increasing RErsquos share in the energy mix
Source Authorsrsquo analysis
Managing intermittency through forecasting scheduling etc
Land and infrastructure availability and cost
RE growth
Cost-benefit allocation between RE-rich and RE-poor states
Transmission network availability access and cost
Legacy issues expensive PPAs fixed cost payment etc
viiiviiiviii
Distance between our targets and distribution companiesrsquo capacity to offtake eg SECI unable to find buyers This affects growth potential of project developers
Increased adoption of distributed RE including rooftop solar by commercial and industrial players will lead to discoms losing out on high paying consumers further affecting finances
Impact of storage technologies on discom procurement Storage can help manage intermittency and reduce power procurement needs of discoms
Increase in additional costs that developers need to factor in to promote manufacturing RE-waste management managing RE variability etc
States pushing back on their obligations eg Andhra Pradesh attempting to renegotiate contracts This affects financials of existing projects and risk perception for new projects
Changing profile of investors ndash higher returns expectations market consolidation and exit of smaller players Only a few players currently occupy the field with the exit of smaller entities
Developments like MBED RTM GTAM etc show that electricity markets are transitioning towards more short-term and flexible markets Current model of long-term agreements will be unsustainable
Unlocking the demand for RE and capitalising on the immense opportunity that it presents requires innovative solutions that account for legacy issues and yet are forward looking The policies must anticipate these changes and prepare for them while investors need to hedge their bets and modify ways of doing business to continue to lead the energy transition
We recommend the following changes to the policy framework These are based on policy lessons from the study of the sectorrsquos evolution and anticipate the power sector transition that is upon us
bull Centrendashstate and inter-state alignment is essential Collaboration and coordination need to be prioritised instead of mandates and penalties Costs and benefits for all actors must be clearly accounted for An institutional framework must be created that increases Centrendashstate and intrandashstate coordination cooperation and engagement Resource planning budgetary allocations and policy priorities should be outcomes of these formalised processes
bull Institutional framework must build in planning coordination and analytical requirements Data collection management and analysis should be systematic Monitoring and reporting practices should be robust and continuous
bull Addressing counterparty risks will require transformation of RE procurement models Market mechanisms allow for the cost recovery and benefit sharing Capacity deployment must happen based on market mechanisms and market determined price signals PPA terms must reduce and sole priority in power procurement should be efficiency and flexibility for discoms Power procurement as a mechanism to support RE or any future technology will not be sustainable in India till discom finances are sorted out
bull Contrasting interests of RE manufacturers and developers must converge Supply chains must be diverse and resilient to shocks Investors must innovate and policy must support backward and forward integration in RE supply chains
bull Accelerating the flow of capital into the sector requires new investment models that can tap into diverse sources of finance and simultaneously enable the transition of the energy markets
ixExecutive summary ixExecutive summary ixExecutive summary
How Indiarsquos Solar and Wind Policies Enabled its Energy Transition A Decade in Review
Image iStock
Between 2016 and 2018 solar capacity in RE-rich states tripled recording a consecutive year-on-year growth rate of more than 70 per cent
From approximately 21 GW of utility-scale solar and wind capacity at the end of financial year (FY) 2012 (1 GW solar and 20 GW wind) India achieved 70 GW capacity by 31
September 2020 (32 GW ground-mounted solar and 38 GW wind) (MNRE 2020b) This growth story is undoubtedly remarkable Solar and wind energy have also proved to be resilient in times of crisis including during the COVID-19 pandemic in 2020 and have continued to attract investment and attention from policymakers
However the story of Indiarsquos solar and wind power generation is at a critical juncture The rate of growth of capacity addition has been slowing down (see Figure 1) Indiarsquos path to reaching an installed capacity of 160 GW by 2022 (100 GW for solar and 60 GW for wind) and 450 GW by 2030 is hindered by complex challenges They arise from the precarious financial health of distribution companies (discoms) (Garg and Shah 2020) the investment required to build associated infrastructure the dynamics of increasing market penetration of renewable energy (RE) while making fixed cost payments for thermal projects (PEG 2018) direct and indirect energy subsidies in favour of conventional fuels1 and difficulties in balancing the priorities of the Centre and states (Tongia Harish and Walawalkar 2018) Some of these challenges are not new especially the discom crisis and those of inadequate infrastructure However their impact on the growth of RE is significant For instance discoms are finding it challenging to continue to pay fixed costs for thermal assets while complying with the must-run status of RE Forecasting and scheduling are now critical for the integration of variable RE power with the grid These challenges in consuming the power generated from RE plants dissuades discoms from increasing their RE portfolio and hampers revenue from operating assets and further capacity addition These issues must be addressed on a priority basis to scale up RE capacity deployment and utilisation levels New technologies like storage new market platforms and a growing realisation of the benefits of decentralising power generation also have the potential to impact the utility-scale sector in new and unexpected ways
1 Introduction
1
1 These subsidies include oil and gas subsidies and coal subsidies by way of concessional taxes non-compliance or non-enforcement of pollution regulations direct benefit transfers on consumption public distribution at subsidised rates etc (Garg Viswanathan et al 2020)
Storage new market platforms and a realisation of the benefits of decentralising power generation have the potential to impact the utility-scale sector in new and unexpected ways
How Indiarsquos Solar and Wind Policies Enabled its Energy Transition A Decade in Review 2
Figure 1 The rate of growth in solar and wind capacity addition is slowing down (2008ndash2020)
Source CEA 2019 Growth of Electricity Sector in India From 1947-2019 New Delhi CEA MoP CEA 2020 All India Installed Capacity as on 31 December 2019 New Delhi CEA
Before we embark on a policy analysis to determine the best tools to address the above challenges we look back and study the sectorrsquos evolution and evaluate the policiesrsquo impact on RE As RE growth slows and faces newer challenges it is the right time to conduct such an analysis Such an exercise will enable us to understand what are the gaps in the existing policies that need to be mended to adapt to the changing dynamics and yet achieve our objectives The legislative architecture along with a diversity of stakeholders and their objectives and interests makes power sector policymaking and governance a complex space Therefore policy evaluation can be done through multiple lenses This study focuses on the evolving risks for project developers in the bulk RE procurement market and the policy response of the Centre and states to those risks
We focus on the bulk power procurement market because RE growth has been led by utility-scale wind and solar energy projects over this decade with discoms being the largest power purchasers2 While there are dedicated schemes and programmes for the scaling up of other renewable energy sources as well as for distributed RE (DRE) they are of a different nature than those of utility-scale RE since they operate at a more decentralised level3 Further the levels of risk and the challenges facing private investors are markedly different for utility-scale solar and wind on the one hand and distributed and other RE resources on the other However we will briefly discuss the impact of growth of DRE on utility-scale RE in our last section
11 MethodologyWe collated all Central and state policy documents from 2009ndash2019 We then created a comprehensive framework to review each Central and state policy For each policy we recorded the key drivers stated purpose and objectives targets key features and incentives provided budgetary outlays (if any) institutional arrangements beneficiaries stated reasons for amendments and risks that the policy intended to mitigate For Central policies we also identified the role required of the state governments The framework helped us examine the
2 Though the rooftop industry continues to mature with multiple market players innovative business models and new financing structures
3 This is a consequence of the failure to establish competitive markets for RE even though it is among the aims of the Electricity Act 2003 (EA) The gap in the official data which does not capture captive power projects demonstrates this failure
Wind capacity (in MW) Solar capacity (in MW)
0
5000
10000 76679344
1064712807
1689718485
2104323354
26777
3562637746
3404632280
2 2 6 32 941 1686 26323744
6763
21651
28181 34812
1228915000
20000
25000
30000
35000
40000
200
7-0
8
200
8-0
9
200
9-10
2010
-11
Year
Cap
acit
y (in
MW
)
2011
-12
2012
-13
2013
-14
2019
-20
2018
-19
2017
-18
2016
-17
2015
-16
2014
-15
2
This study focuses on the evolving risks for project developers in the bulk RE procurement market and the policy response of the Centre and states to those risks
3Introduction
alignment between Central and state objectives and targets and inconsistencies between and within the policies The key features of the policies we studied are set out in Tables A4ndashA6 of the Annexure We also conducted extensive secondary research to assess the actual performance of these policies actions and developments on the ground and the risks that they addressed
Our study contributes to policy research as it combines a national-level analysis with a close examination of the policies and their impacts at the state level RE resources are not uniformly spread across the country and some states have performed better than others We cover the following RE-rich and RE-poor states in this study
Solar and wind-rich states
bull Andhra Pradesh
bull Gujarat
bull Karnataka
bull Madhya Pradesh
bull Maharashtra
bull Rajasthan
bull Tamil Nadu
bull Telangana
Solar and wind-deficit states
bull Bihar
bull Punjab
bull Uttar Pradesh
The RE-rich states are the top eight in terms of resource potential and capacity addition in wind or solar power or both For the RE-poor areas we have picked states that are not only deficit in solar and wind but also lack alternative power sources like hydro or coal though they have biomass-based power capacity In all these states the power supply position access to energy and power sector infrastructure have evolved over the last decade
In this report we begin by briefly mapping out the institutional framework of the power sector to understand the different agencies that implement andor hinder the implementation of these policies We then trace the evolution of the Central policies which largely focus on supply-side risks Next we evaluate the demand-side measure renewable purchase obligations (RPOs) Subsequently we trace the key drivers and policy focus and evaluate policy performance first in the RE-rich states and then in the RE-deficit states For the state-level analysis we divide our assessment into policies pre- and post-2014 since 2014 marked a departure from the previous years in policymaking activity and its consequences We assess the policies based on the risks they were successful in addressing the risks that they left unaddressed and how they measure up to the next generation of challenges We conclude by pointing to the points of transformation of the sector and the nature of required policy focus going forward
We assess the policies based their success in addressing risks the risks they left unaddressed and how they measure up to the next generation of challenges
How Indiarsquos Solar and Wind Policies Enabled its Energy Transition A Decade in Review
12 Institutional framework The long history of policymaking in the power and RE sector has led to a proliferation of agencies and bodies (see Table 1) The legislative architecture under the Electricity Act 2003 (EA) allows states to autonomously undertake activities such as target-setting framing and enforcing regulations developing and implementing policy and setting up institutional mechanisms
However the Central Government sets the policy direction through its National Electricity Policy the National Tariff Policy and the National Electricity Plan which the state governments and regulators are required to follow These policy documents cover electricity planning project bidding and procurement tariff structures RPOs and optimum utilisation of resources and infrastructure
The Central Electricity Regulatory Commission (CERC) and state electricity regulatory commissions (SERCs) have parallel jurisdictions and functions with respect to promoting the generation of RE tariff determination and dispute resolution Typically CERC does not have the authority to provide policy guidance or issue directions to the SERCs However SERCs are bound by the technical rules guidelines and standards set by the CERC in the Indian Electricity Grid Code (IEGC) based on which they prepare their own state grid codes
Table 1 The institutional structure of the power sector
Source Authorsrsquo analysis
Regional and State Union Territory level
Central
Ministries
Statutory autonomous bodies
Regulators
Operating entities
Ministry of Power (MoP)ndashNodal ministry for the power sector Prepares the National Electricity Policy the National Tariff Policy and the National Electricity Plan
Ministry of New and Renewable Energy (MNRE)ndash Nodal ministry for increasing RE deployment in the country
Central Electricity Authority (CEA)
National Load Dispatch Centre (NLDC)
Bureau of Energy Efficiency (BEE)
Power Financial Corporation (PFC) REC Limited Indian Renewable Energy Development Agency (IREDA)ndash Provide financing and implement schemes for RE projects
National Institute of Wind Energy (NIWE) National Institute of Solar Energy (NISE) Central Power Research Institute (CPRI) etcndash Research and development institutes to estimate RE potential in the country and evaluate the latest technologies in power generation
Central Electricity Regulatory Commission (CERC)ndash Tariff determination dispute resolution preparing the Grid Code and Supply Code (to be followed by the operating entities) promote RE etc
Appellate Tribunal for Electricity (APTEL)ndash Appellate body for dispute resolution
Generation utilities eg NTPC NHPC Damodar Valley Corporation (DVC)
Transmission utilityndash Power Grid Corporation of India Limited (PGCIL)
Independent power producersndash projects connected to the Central grid
TradingMarket entitiesndash NTPC Vidyut Vyapar Nigam (NVVN) Solar Energy Corporation of India (SECI) etc
Relevant energy departments and ministries of the states union territories (UT)
Regional Load Dispatch Centres (RLDC)
Regional Power Committees
State Load Dispatch Centres (SLDC)
state nodal agencies (SNAs)ndash implement RE schemes and oversee RE deployment at the state
State Electricity Regulatory Commissions (SERC) and Joint Electricity Regulatory Commissions ( JERC)ndashTariff determination dispute resolution preparing the grid code and supply code (to be followed by the operating entities) promote RE etc
Generation utilitiesndash state-owned generators
Transmission utilities
Distribution utilities
Independent power producersndash projects connected to state grids
Tradingmarket entities
4
The trajectories of wind and solar have been varied yet have affected each other Often similar policies have had widely varying impact on wind and solar This section briefly
describes the policy scenario pre-2010 and then narrates the policy evolution in the last decade (See Table 2 for brief description of the policies) The section concludes with the assessment and lessons from this journey
21 Pre-2010 ndash private-sector participation and prioritising renewables The initial drivers for new and renewable energy were the successive oil crises in the 1980s that compelled the government to reduce the countryrsquos dependence on imported oil and focus on alternative sources of power RE was also one of the strategies to combat climate change
2 Evolution of Central policies
Image iStock
5
How Indiarsquos Solar and Wind Policies Enabled its Energy Transition A Decade in Review
The government has made accelerated depreciation (AD) of 100 per cent available for both wind and solar power generation since 1994 to incentivise RE capacity deployment
The enactment of the EA also intended to transform the state-controlled electricity sector into a competitive electricity market with private players regulated by the state (Kumar and Chatterjee 2012) Promoting environmentally benign policies is a stated objective of the EA and it envisages renewable sources of energy as a significant contributor to the electricity mix The de-licensing of electricity generation under the EA and the mandating of power procurement through competitive bidding under the National Tariff Policy 2006 (NTP 2006) were game-changing reforms towards increasing private-sector investments in power generation The NTP 2006 permitted discoms to procure RE at tariffs fixed by their respective SERCs also called feed-in tariffs (FiTs)4 The SERCs determined the FiTs based on their tariff determination regulations Central regulations in turn guided these regulations The CERC notified the first guidelines for tariff determination in 2009 [(CERC (Terms and Conditions for Tariff Determination from Renewable Energy Sources) Regulations 2009) (Tariff Determination Regulations)] The first generic tariff order determined utility-scale solar PV tariff of INR 1844 and wind power tariffs of INR 563 490 417 and 375 (for Wind Zones 1 2 3 and 4 respectively)5
The policiesrsquo cumulative effect was that by 2010 RE accounted for 97 per cent of the available installed power generation capacity in the country (MoP 2010) This capacity was mainly wind energy and bagasse-based cogeneration6 Successful demonstration projects led by the ministry and collaborations with global technology providers were key triggers of establishment of domestic manufacturing and supply chain in India (Ganesan et al 2014) The AD incentive was particularly useful for private entities who set up distributed and small-scale wind turbines to avail of it This domestic demand also supported development of wind manufacturing capacity in India (Sud 2015 Idam Infra 2016)
Solar power however was lagging Despite the available incentives there were no immediate responses from investors developers and most state governments primarily due to high technology costs Till March 2010 solar capacity remained at 6 MW Subsequently significant policy actions leading to cost reductions and investment commitments marked an upward growth trajectory (see Figure 1)
Table 2 Evolution of Central policies for utility-scale wind and solar energy ndash 2010ndash2019
Source Authorsrsquo analysis
Risks and barriers targeted to be mitigated benefits TechnologyPolicyscheme
Promotion of RE competitive bidding and RPO in National Tariff Policy 2006
National Solar Mission 2010
National Action Plan on Climate Change 2008
Wind
Solar
Creating demand for expensive RE power through RPOs
Policy certainty and continued government support for promotion of RE
Managing offtake risk by signing long-term power purchase agreements (PPA) and providing payment security
Policy certainty and continued government support for promotion of RE
Creating demand for expensive RE power through RPOs
Policy certainty and continued government support for promotion of RE
4 This flexibility was required because RE tariffs at this time could not be compared to those of conventional power However the NTP 2006 also noted that RE power would eventually have to compete with power from other sources at their full cost
5 Order dated 3 December 2009 issued by CERC in Petition No 2842009 titled Determination of Generic Levellised Generation Tariff httpwwwcercindgovin2009November09284-2009_final_3rdDecember09pdf
6 Due to its economic co-benefits bagasse-based cogeneration developed mostly in the sugar producing regions of India
6
Table 2 contdRisks and barriers targeted to be mitigated benefits
TechnologyPolicyScheme
GBI for grid interactive wind power projects 2009 and 2013
NSM Phase II Batch I 2013 (VGF Scheme)
Scheme for solar park development 2014
National Tariff Policy 2016
Commencement of competitive bidding in wind 2016
MNRErsquos policy for re-powering wind projects 2016
Financial incentives for setting up wind power projects
Managing offtake risk by signing long-term PPAs and providing payment security
Low tariffs for discoms through competitive bidding
Financial support for project developers
Delay and roadblocks in land identification aggregation and acquisition
Delays in obtaining approvals and clearances
Risk of conflict with environment or social impact assessment
Lowering cost of supporting infrastructure and services
Creating demand for RE by setting common national trajectory for RErsquos share in consumption
Managing offtake risk by signing long-term PPAs and providing payment security
Low tariffs for discoms through competitive bidding
Support to utilize wind resources efficiently
NSM Phase I Batch II (Bundling scheme) 2011
Green Energy Corridor project 2013
NSM Phase II Batch III 2015
NSM Phase II Batch IV (State specific VGF scheme) 2016
MoPrsquos order on waiver of inter-state transmission charges and losses 2016
Competitive bidding guidelines for solar 2017
Managing offtake risk by signing long-term PPAs and providing payment security
Lowering tariff for discoms by bundling thermal and solar power
Addressing transmission risk and offtake risk by reducing congestion on grid
Managing offtake risk by signing long-term PPAs and providing payment security
Low tariffs for discoms through competitive bidding
Managing offtake risk by signing long-term PPAs and providing payment security
Low tariffs for discoms through competitive bidding
Financial support for project developers
Financial incentive for export of power outside the state
Managing offtake risk by signing long-term PPAs and providing payment security
Low tariffs for discoms through competitive bidding
Must-run status in Grid Code 2010
Introduction of renewable energy certificates (REC) 2010
Addressing transmission and curtailment risk
Creating mechanism to broaden the demand base
7Evolution of Central policies
How Indiarsquos Solar and Wind Policies Enabled its Energy Transition A Decade in Review
22 Post-2010 policies for solar The Jawaharlal Nehru National Solar Mission (NSM) notified in January 2010 was a turning point in the RE story The NSM was one of eight missions developed as part of Indiarsquos National Action Plan on Climate Change (NAPCC) Its primary objective was to develop and deploy solar energy technologies including utility-scale distributed solar and solar thermal energy It targeted the entire ecosystem of solar energy deployment and included measures to support research and development human resource development the increase of technical capacity and awareness of these technologies Such measures included providing technical assistance training customs and excise duty concessionsexemptions on capital equipment critical materials components and project imports ease of doing business and enabling domestic manufacturing through exemptions and incentives The NSM laid out a phase-wise approach until 2022 that brought about policy certainty
The risks for investors and financiers were considerable The upfront costs were high while returns were not guaranteed (since the technology had not yet proven its track record within India) Further even if discoms were willing to sign power purchase agreements (PPAs) low connectivity and transmission capacity hindered offtake However more significant was the payment risk arising due to the poor financial health of discoms The payment risk adds as much as 107 per cent of the additional risk premium to the cost of debt (Atal and Shrimali 2018)
To counteract the payment risk the NSM devised an arrangement whereby NVVN (NTPC Limitedrsquos trading arm) would purchase power from the solar developer for onward sale to state discoms under a power sale agreement (PSA) The standard PSA included a clause stating that in case the discom failed to make timely payments NVVN could invoke the tripartite agreement signed by the Central Government the relevant state government and the Reserve Bank of India (RBI)7
The NSM envisaged that the key driver for promoting solar power would be the RPO mechanism with the FiT and PPA duration determined by the CERC It aimed to achieve parity of solar and coal tariffs by 2030
NSM was to be implemented in three phases The target for Phase I which lasted till 2013 was 1000 MW The initial target of 20 GW was increased to 100 GW in 2015 to be achieved by December 2022 As of November 2020 3691049 MW of solar power capacity has been installed (MNRE 2020b)
Competitive bidding guidelines for wind 2017
Managing offtake risk by signing long-term PPAs and providing payment security
Low tariffs for discoms through competitive bidding
MoP and MNRErsquos order on opening and maintaining adequate LC as PSM under PPAs by distribution licensees 2019
Addressing payment risk from discoms
7 Article 648 of the Standard Draft PSA between NVVN and Distribution Utility (2010) httpwwwnvvncoinDRAFT20PSA_NVVN-Discom_March2029202010pdf In case a state discom defaulted on any payment obligations NVVN could invoke this agreement and the pending dues could be routed to it through the RBI The Centre can then deduct the relevant amount from the annual fund transfers from the Centre to the state which is the most significant source of state government revenue
Table 2 contd
88
Phase IThe guidelines to operationalise the first phase of NSM were notified in July 2010 Many projects had already begun construction before this notification Such projects were permitted to migrate to the NSM and sign PPAs with NVVN The NSM selected fresh projects based on the discounts that the developers were offering on CERC-approved tariffs applicable as of the date of submission of their applications These projects needed to be commissioned within 12 months of the developers signing the PPA In Phase I the NVVN could bundle unallocated conventional power procured from the NTPC and sell it to discoms to average the tariffs
For payment security the standard PSA required the buying utility to open a six-month letter of credit (LC) backed by an escrow account in favour of NVVN Further under an order dated 30 June 2011 the MNRE created a separate payment security fund of INR 486 crore However despite the implicit state guarantee transaction advisers suggested that investors be cautious The standard PPA was not considered bankable (Sustainability Outlook 2010 Jog 2013) High project costs and unproven technology increased the risk Developers were also concerned that the PPA prices could be reduced during its duration
Additionally domestic content requirement (DCR) that required polycrystalline photovoltaic (PV) cells and modules being used to be manufactured in India was imposed on NSM projects The DCR distorted the market towards other PV technologies like thin film (Paliwal and Hamberg 2015) and adversely affected the existing manufacturing base in India that predominantly manufactured polycrystalline PV DCR would have constrained developersrsquo technology choices and did not benefit the domestic manufacturers (Ganesan et al 2014)
The government eventually withdrew DCR after failing to defend the move before the World Trade Organisation (WTO) in a dispute initiated by the United States of America in 2013 on grounds that DCR was discriminatory against imports under the lsquoNational Treatmentrsquo principle (WTO 2016)
Phase I was successful in achieving its target of installed capacity of 1000 MW of grid connected power It also served to demonstrate the technology and the intermediary arrangement under the NSM However even before the Phase II guidelines were notified developers and financiers raised concerns about delayed payments To manage this risk the lenders demanded that NVVN be made a beneficiary of the tripartite agreement (Jog 2013)
Phase II
The Solar Energy Corporation of India Limited (SECI) was designated as the implementing agency for Phase II SECI a public-sector company is an electricity trading licensee and signs PPAs with developers to purchase power for on-sale to discoms and other consumers In February 2017 SECI became a beneficiary of the tripartite agreement between the Government of India state governments and the Reserve Bank of India Consequently ICRA Limited (a credit rating agency) enhanced SECIrsquos credit rating from AA- to AA+ This increased the bankability of SECI projects SECI was required to create a payment security fund of INR 500 crore to cover for three monthsrsquo payment By 2014 SECI received bids worth 2170 MW under reverse bidding conducted by it and signed PPAs and PSAs with state discoms (SECI 2014) Phase II focused on providing viability gap funding (VGF) to project developers However the utility of the VGF initiative is questionable as the actual expenditure of the committed funds progressively declined across the various schemes (see Table 3) After the notification of the
9Evolution of Central policies 9Evolution of Central policies
JNNSM Phase I was successful in achieving its target of 1000 MW grid-connected power However developers and financiers raised concerns about delayed payments even before the notification of Phase II guidelines
How Indiarsquos Solar and Wind Policies Enabled its Energy Transition A Decade in Review
Table 3 Snapshot of VGF schemes
Source Authorrsquos adaptation from MNRE 2020 Annual Report 2019ndash20 New Delhi MNRE and SECI 2019 8th Annual Report 2018ndash19 New Delhi SECI
Allotted and commissioned capacity
VGF per MW Estimated expenditure (in INR crore)
Actual expenditure (in INR crore)
Bidding parameter
TariffYear NSM Phase II batch
2013
2016
2015
750 MW Batch I
Phase II Batch IV
2000 MWBatch III
Discount on VGF
Discount on VGF or tariffAfter 2017 ndash only tariff
Discount on VGF or tariff
INR 545 per kWh INR 475 with AD
No fixed tariff
INR 443 per kWh for the first year annual escalation of INR 005 kWh for the next 20 years with the maximum tariff capped at INR 643 kWh
680 MW
Awarded 3420 MW (as on 31 December 2019)2470 MW capacity commissioned in the states of Gujarat Odisha Maharashtra Rajasthan UP Andhra Pradesh (Kadapa Solar Park) and Karnataka (Pavagada Solar Park) (as on 31 December 2019)
Awarded 2155 MW2295 MW capacity reported as commissioned in the states of Andhra Pradesh Chhattisgarh Karnataka Maharashtra and Uttar Pradesh at both solar park and non-solar park locations (as on 31 December 2019)
The lower of INR 25 crore and 30 per cent of project cost
INR 1 crore for open category
125 for DCR projects
The lower of INR 25 crore and 30 per cent of project cost
1875
5050
1875
742
19163
742
Phase III Phase III of the NSM is currently underway The target is to achieve 100 GW of cumulative solar capacity by 2022 The bidding is conducted under the Solar Bidding Guidelines Various intermediary procurers are participating in conducting the auctions including SECI NTPC and NHPC Limited As of March 2020 solar capacity of 2135 GW was under various stages of implementation and 3127 GW was under different stages of bidding (ETEnergyWorld 2020)
23 Impact of other policies on project deploymentAfter the high-growth period of 2016ndash2018 capacity addition slowed in 2018ndash19 which was a cause for concern It represents a break in the growth momentum There are multiple contributory factors for the slowdown
Guidelines for Tariff Based Competitive Bidding Process for Procurement of Power from Grid Connected Solar PV Power Projects (Solar Bidding Guidelines) in 2017 tariff became the sole bidding parameter and VGF fell into disuse
1010
The introduction of the Goods and Services Tax (GST) in 2017 created considerable confusion and administrative challenges8 It decelerated the growth momentum and raised project costs by 10ndash15 per cent (Soman et al 2019) The imposition of safeguard duties on imports of solar cells and modules from China and Malaysia was introduced in 2018 Eventually these costs were made good to the project developers by their PPA counterparties under the lsquochange-in-lawrsquo clause of the PPA However the uncertainty surrounding its timeline increased cost of procuring components from exempted jurisdictions and litigations before the regulatory commissions to get the duty adjudged as change-in-law added to the costs of under-construction projects and delayed new projects (Thomas 2018 Jai 2018) Payment delays by discoms renegotiation threats curtailment tariff ceilings on bids etc also caused many investors to delay their investment decisions and many SECI tenders were undersubscribed (Buckley and Shah 2020 Chatterjee 2019) Tariff ceilings were removed by MNRE in March 2020 to revive investor interest
Lately SECI has struggled to find buyers for the auctioned capacity For example under a manufacturing-linked solar auction conducted in January 2020 SECI is yet to sign the PPA even after 10 months of awarding the project because it is unable to find buyers for the power (Reuters 2020) This development shows the signs of stress and limits to the NSM model for RE growth
24 Solar Park Scheme
Land procurement in India is hugely complicated with challenges ranging from the legal to the political (TERI 2017) For developers private procurement is expensive and time-consuming This is evidenced by the consecutively increasing time limit for obtaining possession under the NSM In Phase I 180 days was the time limit in Phase II Batch I the time limit was increased to 210 days and currently developers must show possession only at the time of commissioning the project
As the number of RE projects increases we are witnessing more acute problems in relation to the acquisition of land (Tenddulkar 2019) Land is however a state subject and the Centre has limited scope to enable easier land procurement To facilitate economies of scale and support systematic planning and deployment in 2014 the MNRE launched a first-of-its-kind scheme to develop ultra-mega solar parks In 2017 the target under the scheme was enhanced from 20000 MW to 40000 MW with an objective to set up at least 50 solar parks by 2022 (MNRE 2020a) Under this scheme solar park developers can acquire land obtain the necessary permissions and build the required infrastructure including evacuation infrastructure for the capacity to be housed within the park As of December 2019 the MNRE had approved 39 solar parks with a total capacity of 22879 MW across 17 states (MNRE 2020a)
8 The GST is supposed to be an integrated tax on both goods and services In the earlier tax regime goods and services were taxed separately (exciseimport dutiesVAT on goods and service tax on services) For RE the cells and modules are taxed at 5 per cent while services attract an 18 per cent GST rate However for RE works contracts (ie the engineering procurement and construction contracts) the supply of equipment necessary for setting up a power plant and the service component (ie the actual setting up of the plant) are difficult to segregate The government eventually fixed a 7030 ratio for the goods and services components of the contracts respectively (William 2020)
11Evolution of Central policies 11Evolution of Central policies
After an impressive growth period between 2016ndash18 various factors in addition to counterparty risks such as introduction of GST and safeguard duties on imported cells and modules led to change-in law cases delaying projects as well as investor decisions
How Indiarsquos Solar and Wind Policies Enabled its Energy Transition A Decade in Review
25 Post-2010 policies for wind The NSM defined solar power development while wind policies followed a separate trajectory till late 2016 The flip-flops of the Central Government in withdrawing and re-introducing benefits such as AD and generation-based incentives (GBI) had adverse effects on wind capacity addition 100 per cent AD was introduced in 1994 AD was reduced to 80 per cent in 2002 GBI was introduced in 2010 Both AD and GBI lapsed in 2012 but were reintroduced in 2013
Wind power was brought into the competitive bidding regime with the 2016 interstate transmission system (ISTS) wind scheme for 1000 MW and the notification of the Guidelines for Tariff Based Competitive Bidding Process for Procurement of Power from Grid Connected Wind Power Projects in 2017 (Wind Bidding Guidelines) SECI floated the first tender for ISTS wind in OctoberNovember 2016 it concluded in February 2017 and PTC India Limited signed the PPAs (Saumy 2017)9 The bidding procedure and guidelines were similar to those conducted for solar energy It helped bring tariffs down from INR 416ndash602 FiT to INR 346 (see Figure 3) The primary reason for the lower tariff was reduced counterparty risk (CRISIL 2017) with competition driving down tariffs even lower
Figure 2 The pace of solar park development under the Central scheme has been slow (as on 31 December 2019)
Source Authorsrsquo adaptation from MNRE 2020 Annual Report 2019-20 New Delhi MNRE
9 Order dated 3 December 2019 issued by CERC in Petition No 340AT2019 titled PTC India Ltd v SECI and Ors httpwwwcercindgovin2019orders340-AT-2019pdf
0
5000
10000
40000
22879
103207767
15000
20000
25000
30000
35000
40000
45000
50000
Solar park status
Target capacity
Approved capacity
Capacity of fully or partially
operational parks
Commissioned capacity
Cap
acit
y (in
MW
)
12
Figure 3 Competitive bidding in wind brought down the tariffs significantly
Sources FiT orders Order dated 15 May 2014 issued by CERC in Petition No SM3542013 (Suo-Motu) titled Determination of generic levellised generation tariff for the FY 2014-15 Order dated 31 March 2015 issued by CERC in Petition No SM0042015(Suo-Motu) titled Determination of generic levellised generation tariff for the FY 2015 - 16 Order dated 30 March 2016 issued by CERC in Petition No SM032016 (Suo-Motu) titled Determination of levellised generic tariff for FY 2016-17 Auction tariffs from India RE Navigator 2020 ldquoAuction Resultsrdquo Accessed November 28 2020 httpsindia-re-navigatorcomwind
After the discovery of these lower tariffs even under-construction projects were brought within the bidding regime or else their tariffs were renegotiated The reduced tariffs led to reduced margins and concerns that the existing thriving ecosystem which was driven by original equipment manufacturers (OEMs) is collapsing10 After 2017 there was a sharp decrease in the rate of growth of capacity additions (see Figure 1) leading to unsold inventory with the OEMs Discoms were no longer willing to sign PPAs on FiTs and the pace of bidding failed to keep up with expectations
Further because of the low tariffs it has become essential that the developers set up projects in high wind density sites Land has hence become the most crucial element of investment decisions in wind However state policies have not been very conducive in this aspect The consequent delays in setting up projects is further affecting wind OEMs (Dutt Arboleya and Gonzalez 2020) Since the introduction of competitive bidding in wind 191 GW has been auctioned but only 145 GW has been awarded In 2020 the wind bids have been linked to storage blended with solar or been part of hybrid projects Bidding was particularly constrained in 2019 were 5400 MW was tendered but only 2720 MW was awarded (India RE Navigator 2020)
10 This is evidenced by the stressed balance sheets of major wind OEMs including Suzlon and Inox and the exit of Senvion from the Indian market The number of OEMs has reduced from 14 to 5 (Arora 2019) Thin margins are a feature of the entire RE sector however specifically in case of wind competitive bidding and the resulting low tariffs caused a disruption to the existing ecosystem of the industry
0
1
2
576 598 601
346264 243 244 2513
4
5
6
7
FiT 2014ndash15
FiT 2015ndash16
FiT 2016ndash17
SECI February
2017
SECI October
2017
GUVNL December
2017
SECI February
2018
SECI April 2018
CERC determined FiT Auction
Tari
ff (I
NR
per
kW
h)
13Evolution of Central policies
How Indiarsquos Solar and Wind Policies Enabled its Energy Transition A Decade in Review
Land riskLand availability constitutes a major challenge for developers and causes significant project delays The development of solarRE parks provided comfort to developers and led to the realisation of economies of scale However as against the solar park target of 40000 MW by 2022 as of December 2019 only 7767 MW have been commissioned (see Figure 2) Solar park development comes with a chicken-and-egg problem Without committed projects it is expensive to develop solar parks but once projects are awarded solar park development cannot take place within the time provided for project commissioning since solar parks require a longer time for construction Furthermore because solar parks require even greater parcels of land chances of land conflicts are higher While states such as Rajasthan and Gujarat have fared well because of the presence of abundant wastelands others such as Andhra Pradesh (eg Kadapa and Ananthapur) and Karnataka (eg Pavagada) have all faced land conflicts Other issues that developers face relate to the quality of the land ancillary infrastructure and upfront and operation and maintenance (OampM) fees Proposed solar park projects have been cancelled because of unexpectedly high bid tariffs (Seetharaman and Chandrasekaran 2019) Though there have been success stories like the Rewa Solar Park (Bhaskar 2020) we need better planning and coordination between the Centre and the states to mitigate land-related barriers and risks
Curtailment and evacuation risksRE faces a high degree of curtailment risk (Aggarwal and Chawla 2019) The Grid Code 201011
(Grid Code) which must be followed by all states grants a must-run status to power generated from wind and solar plants This means that utilities and system operators must prioritise evacuation of power from must-run plants unless there are grid unavailability security or
11 Clause 52 (u) of the Grid Code
141414
26 Policy assessmentWe now briefly discuss some of the continuing structural risks that the above policies have failed to address or inadequately addressed and surmise the policy lessons from the Central policies (See Table 4 for Indiarsquos project pipeline to achieve the targets)
Table 4 Indiarsquos progress towards 175 GW renewable energy by 2022
Source Amitesh Sinha 2020 ldquoIndiarsquos Ambition and Opportunities in Solar Manufacturingrdquo Presentation India PV Edge 2020 Virtual conference 6 October
Under implementation
(GW)
Tendered (GW)
Total (installed +
pipeline)
Target (GW)
Installed capacity
(GW)
Sub-sector
Solar
Biomass
Total
Windndashsolar hybrid
Wind
Small hydro
RTC assured peak power supply
100
10
175
60
5
3574
1003
88511 4511 2843 16205
825
474
3336
0
144
825
046
16
2066
0
12
157
0
5
8976
1003
264
4782
52
66
safety constraints However commercial considerations grid unavailability and technical grid security concerns lead to curtailment which translates to revenue loss for developers Curtailment could contribute to 14 per cent of the risk premia (Atal and Shrimali 2018)
In the early set of PPAs there was no provision to compensate generators in case of backdown of power However the Solar Bidding Guidelines and the Wind Bidding Guidelines incorporated provisions that require the power purchaser to compensate the generator in case of backdown for reasons other than technical constraints However must-run status has not been as effective as intended and the risk of curtailment persists
Further as RE deployment grows problems arising out of the inadequacies of the evacuation infrastructure assume greater proportions The problem is compounded by the need for transmission infrastructure to be in place before an RE project is conceptualised because the infrastructure takes up to five years to complete while RE projects typically take between 12ndash18 months to launch (H Singh 2017)
A functioning ISTS is also essential as it helps diffuse the costs and benefits of RE across the country and can enable effective implementation of the RPO Hence inter-state transmission charges and losses have been exempted since 2016 and will continue to be exempted till June 2023 Policymakers recognised this problem early on and PGCIL proposed a transmission plan for the envisaged RE capacity in 2011 dubbed the Green Energy Corridor A loan-plus-grant mechanism was devised to fund inter- and intra-state transmission corridors in 2015 However this programme does not address the incentive problem ndash it requires the states to cooperate and take the initiative to submit project proposals for obtaining grants provide last-mile connectivity and improve their own transmission infrastructure There is not enough incentive for RE-rich states to spend money to build the required infrastructure There is no clear accounting or evidence of the benefits that a RE-rich state government will receive if it allocates money and human resources for this purpose
Further there is no transparent data published on curtailment duration curtailing entities and reasons for curtailment So far generators have pooled their data and been able to demonstrate evidence of curtailment However no one knows the exact reasons for such curtailment It is hence difficult to analyse the predominant causes and accordingly frame a policy response
Payment riskAs we have just discussed assured offtake at a fixed tariff for the lifetime of the project helped investors tide over the risks of adopting a new and untested technology and helped increase the scale of these projects
While payment obligations were assured on-time payments remain a concern Delayed payments affect investor returns and project cash-flows adversely Most PPAs have provisions that require the purchaser to create a payment security mechanism (PSM) Opening letters of credit (LC) is the most common PSM However there is widespread non-compliance of this provision SECI had not created any LC under any of its PPAs (though it has a good track record of payment) (Economic Times 2019) As a solution in June 2019 the MoP directed the NLDC and the SLDC to dispatch power only after an LC had been opened for the power
15Evolution of Central policies 15Evolution of Central policies 15Evolution of Central policies
Any transmission infrastructure expansion programme needs to solve for the incentive problem facing the states
How Indiarsquos Solar and Wind Policies Enabled its Energy Transition A Decade in Review
being scheduled The discom would also be liable to pay full tariff on the power that is not scheduled The concerned discom was also precluded from purchasing power from the power exchange and getting a short term open-access (STOA) (MoP 2019) This move essentially brought system operators into contract enforcement which ideally should be beyond their remit Apart from this drawback in the design according to feedback from the developers the move did not change anything on the ground However it has had only one year of effective operation since once COVID-19 struck MoP partially rolled back the directive till 30 June 2020 and permitted scheduling of power even if the PSM was reduced by 50 per cent (MoP 2020b)
Policy lessonsThe success story so far has made India a dominant force in the RE space globally It was able to leverage its growing market and even take leadership on global initiatives like the International Solar Alliance After the implementation of the NSM solar power deployment increased exponentially Further the competitive bidding regime introduced first in solar and then for wind was successful in driving down tariffs
However existing policies are not sufficient to address risks arising from the structural pathologies of the electricity sector and the changing nature of barriers and risks With RE prices falling it may seem that RE procurement would be the natural choice for discoms However discoms hold-out on signing PPAs with the expectation that tariffs would fall even further with each passing auction (Prasad 2020) Deep-rooted issues such as the procurerrsquos obligation to pay fixed costs under long-term PPAs inadequate demand-supply planning and skewed fuel subsidies distort the market Further policies that burden the discoms further like the LC requirement have no real impact on the ground
Tying discoms down in long-duration PPAs reduces their ability to respond to new market developments and forces them to procure at above-market costs posing a greater risk for the sector in the long term While these policies may work for project developers in the short term they do not make the most commercial sense for discoms The fixed cost payment issue is one such example Technologies like storage and introduction of market platforms have the potential of bringing in economic efficiencies in discom procurement strategies (CERC 2018) Hence a variation in procurement strategy for discoms is imminent and policies must enable them Such variation is already visible in the thermal markets where MoP has commenced medium-term power procurement Resistance from incumbent market players is expected and must be addressed for a transition that works for all stakeholders
Further the policy framework till now has a serious gap in data collection and transparency There is lack of data on project-specific information on generation technology selection etc Detailed data on these aspects could have informed policy activity on cost and technology bringing in greater efficiencies The Centre has the mandate to formulate policy in this regard and must make up for the lost time
161616
India is a strong force in the global RE space However existing policies are not sufficient to address the deep-rooted issues and evolving nature of risks inhibiting a natural transition to RE
The NSM Solar Park Policy and other fiscal incentives are supply-side measures targeted at reducing investment risks However a measure to create demand was essential because
RE was considerably more expensive than conventional power in 2010 Demand for RE was created through the RPO mechanism
The EA enabled state regulators to specify a minimum purchase obligation Section 86(1)(e) of the EA requires the SERCs to ldquopromote cogeneration and generation of electricity from
3 Renewable purchase obligations ndash a regulatory mechanism for creating demand
Image iStock
171717
How Indiarsquos Solar and Wind Policies Enabled its Energy Transition A Decade in Review
renewable sources of energy by providing suitable measures for connectivity with the grid and sale of electricity to any person and also specify for purchase of electricity from such sources a percentage of the total consumption of electricity in the area of a distribution licenseerdquo
The NTP 2006 required the SERCs to fix the RPOs ldquotaking into account availability of such resources in the region and its impact on retail tariffsrdquo In the absence of any fixed target or specific obligation only a few states notified the purchase obligations The initial movers were Gujarat (2005) Kerala (2006) Rajasthan (2007) and Madhya Pradesh (2008)
Fixed targets were set for the first time under the NAPCC which prescribed that RE (including bioenergy and small hydro) should account for 5 per cent of total grid purchase in 2010 which would increase to 15 per cent by 2020 with a one per cent increase each year In 2011 the NTP 2006 was amended to include a minimum RPO of 025 per cent for solar power by the end of 2012ndash2013 and 3 per cent by 2022
During 2010ndash2012 many states notified their respective RPO regulations This activity was most likely driven by the increased government and investor focus on RE after the introduction of the NSM The obligated entities ie the entities on whom the RPOs were imposed were discoms captive consumers and open-access consumers
The policymakers were however cognisant of resource variability across the different states To bridge the resource gap and ensure sustained demand for RE they enabled the issuance and trading of renewable energy certificates (REC) Under the REC mechanism registered RE generators receive one REC against one MWh of energy they produce12 The power component is sold separately to discoms and open-access consumers at the average power purchase cost (APPC) or a mutually agreed price respectively The RECs are categorised into solar and non-solar RPOs These RECs can be put up for sale in power exchanges where they can be bought by obligated entities and voluntary buyers or retained by the generator to meet their own RPOs (the latter was allowed from 2013) The CERC periodically fixes a floor price and forbearance price and the trading occurs within this price band
31 Setting RPO targets
The RPO targets notified by states are set out in Table A1 in the Annexure As is evident statesrsquo RE ambition varies widely and there was considerable variance between them and the NAPCC targets Karnataka Tamil Nadu Maharashtra and Rajasthan set relatively high targets while Andhra Pradesh Bihar Madhya Pradesh and Uttar Pradesh set quite low targets
The trajectory set out in the NAPCC did not have any legally binding value on the SERCs and the states were technically free to determine their RE targets However their targets were inadequate to achieve national policy objectives
To address the inadequacy of the RPO targets the NTP was revised in 2016 enabling the Ministry of Power (MoP) to notify a common trajectory from 2016ndash17 to 2018ndash19 The MoP has notified the RPO trajectory up to FY 2021ndash22 (Table 5) (MoP 2016 2018) Since then states must align their trajectories to that set by the Central Government
12 The detailed procedure for all matters relating to RECs is set out in the CERC (Terms and Conditions for Recognition and Issuance of Renewable Energy Certificates for Renewable Energy Generation) Regulations 2010 (REC Regulations) The first solar and non-solar RECs were issued in May 2012 and March 2011 respectively
18
In the absence of any fixed target or specific obligation before 2010 only a few states notified the purchase obligations The initial movers were Gujarat (2005) Kerala (2006) Rajasthan (2007) and Madhya Pradesh (2008)
13 The petition was filed under Section 121 of the Electricity Act 2003 which empowers the tribunal to issue orders instructions or directions to the appropriate commission for the performance of its statutory functions
Till January 2017 only three states ndash Andhra Pradesh Madhya Pradesh and Rajasthan ndash had issued draft regulations specifying a trajectory in line with the one prescribed by the MoP (MNRE 2017) In 2017 Karnataka revised their official policy targets from 2000 MW to 6000 MW of solar power to match the RPO trajectories set by the MoP (The Hindu 2017) Till March 2020 only nine states had aligned their RPO trajectories with that of the MoP (MoP 2020a) The remaining states are yet to either notify their 2021ndash22 trajectories or align them with the Central trajectory While Maharashtra has not aligned its targets it provides incentives of INR 025 per kWh above the state prescribed RPO for procurement up to the MoP target
32 Compliance with RPOThe obligated entities can comply with their RPOs through two routes direct procurement (FiTcompetitive bidding) and purchasing RECs from power exchanges
State regulations typically contain provisions for monitoring compliance which require the obligated entities to submit information to the state nodal agencies and the nodal agencies are required to file periodic compliance reports with the SERC The SERC can also initiate suo moto proceedings to verify compliance
In cases of non-compliance SERCs are typically required to direct the obligated entities to deposit such amounts as the SERC may determine in a separate fund which will then be used to purchase RECs and develop transmission infrastructure However certain provisions ndash like permitting target revision fungibility between solar and non-solar RPOs and carrying forward the RPOs ndash are specific to the states SERCs can also revise the RPOs in case of constraints in the availability of renewable energy A snapshot of the provisions can be found in Table A2 in the Annexure
As early as 2013 power producers filed a petition before the Appellate Tribunal of Electricity (APTEL)13 claiming that various state discoms and obligated entities were not complying with the RPO regulations The petition arose due to the failure of state commissions to implement their RPO regulations The petitioners submitted that the SERCs frequently allowed deferment carry-over and exemptions of the obligations and did not enforce compliance by directing purchase of RECs despite their availability The MNRE also submitted that discoms made inadequate provisions for compliance while the SERCs did not invoke penal provisions to enforce compliance It further submitted that the SERCs did not seek RPO compliance reports in accordance with the regulations and that many had not even announced their long-term RPO trajectories The CERC submitted that the REC market had a large unsold inventory of non-solar RECs that were being traded at floor prices It further noted that the demand for RECs is largely driven by very few private distribution licensees and few captiveopen-access customers meanwhile the state discoms generally do not purchase RECs to fulfil their RPOs
Table 5 MoP trajectory for RPO
Source MoP 2016 Guidelines for Long-term RPO Growth Trajectory of Renewable Purchase Obligations (RPOs) for Non-solar as well as Solar Order No 2332016-RampR New Delhi MoP 22 July MoP 2018 Long-term RPO Growth Trajectory of Renewable Purchase Obligations (RPOs) for Solar and Non-solar for a Period of Three Years ie 2019ndash20 to 2021ndash22 Order No 23032016ndashRampR New Delhi MoP 14 June
2016ndash17 2017ndash18 2018ndash19 2019ndash20 2020ndash21 2021ndash22Category
Non-Solar
Solar
Total
875
275
115
95
475
1425
1025
675
17
1025
725
175
1025
875
19
105
105
21
19Renewable purchase obligations ndash a regulatory mechanism for creating demand
How Indiarsquos Solar and Wind Policies Enabled its Energy Transition A Decade in Review
The SERCs used the provisions built by them in the RPO regulations to allow non-compliances to occur The APTEL directed the SERCs to strictly enforce compliance and use the provisions sparingly and in accordance with the spirit of the mandate
Variance in compliance within states
The MNRE has consistently been urging states to align their RPO trajectories with that of the Central Government and ensure strict compliance In August 2019 the MNRE sought APTELrsquos intervention to nudge SERCs to enforce and align RPOs and not to allow any waivers or carrying forward (MoP 2020a) In 2019ndash20 some RE-rich states including Maharashtra Gujarat Tamil Nadu Rajasthan and Telangana fell short of meeting their RPO targets Apart from Andhra Pradesh Rajasthan Karnataka and more recently Tamil Nadu no other state has met their RPO targets (MoP 2020a) Figure 4 compares the RPO compliance situation across 2015ndash16 and 2017ndash18 of Tamil Nadu Maharashtra Bihar and Punjab and is representative of the compliance situation across the country
Figure 4 Compliance with RPOs is uneven among states and discoms
Source Authorsrsquo adaptation from Order dated 11 August 2017 issued by the TNERC in TP No1 of 2017 titled Determination of Tariff for Generation and Distribution Order dated 27 March 2019 issued by the MERC in Case No36 of 2019 titled Case for Verification of compliance of Renewable Purchase Obligation targets by Maharashtra State Electricity Distribution Co Ltd for FY 2017-18 Order dated 2 April 2019 issued by the MERC in Case No37 of 2019 titled Case for Verification of compliance of Renewable Purchase Obligation targets by Brihanmumbai Electric Supply amp Transport Undertaking for FY 2017-18 Order dated 2 April 2019 issued by the MERC in Case No38 of 2019 titled Case for Verification of compliance of Renewable Purchase Obligation targets by Tata Power Co LtdndashDistribution) for FY 2017-18 Order dated 4 April 2019 issued by the MERC in Case No39 of 2019 titled Case for Verification of compliance of Renewable Purchase Obligation targets by Adani Electricity Mumbai Limited for FY 2017-18 Order dated 23 October 2017 issued by the PSERC titled Annual Revenue Requirement and Determination of tariff for MYT control period from FY 2017-18 to FY 2019-20 and for True up of FY 2015-16 Order dated 19 April 2018 issued by the PSERC in Petition titled True up of FY 2016-17 Annual Performance Review ndashAPR) for FY 2017-18 and Determining the Annual Revenue Requirement ndashARR) for FY 2018-19 Order dated 27 May 2019 issued by the PSERC in Petition No 02 of 2019 titled True up of FY 2017-2018 Annual Performance Review ndashAPR) for FY 2018-19 Approval of Revised Annual Revenue Requirement ndashARR) and Determination of Tariff for FY 2019-20 Order dated 25 February 2019 issued by the BERC in Case No 40 and 48 of 2018 and Case No 41 and 47 of 2018 titled Tariff Order for FY 2019-20 for NBPDCL and SBPDCL Order dated 24 March 2017 issued by the BERC in Case No 45 of 2016 titled Tariff Order for FY 2017-18 for NBPDCL Order dated 24 March 2017 issued by the BERC in Case No 46 of 2016 titled Tariff Order for FY 2017-18 for SBPDCL Order dated 21 March 2018 issued by the BERC in Case No 40 of 2017 titled Tariff Order for FY 2018-19 for NBPDCL Order dated 21 March 2018 issued by the BERC in Case No 41 of 2017 titled Tariff Order for FY 2018-19 for SBPDCL
0
300
250
200
150
100
50
Tamil Nadu Maharashtra Bihar Punjab
TANGEDCO Tata SBPDCL PSPCLNBPDCLAdani MSEDCL BEST
States and discoms
2015-16 Solar
2016-17 Non-solar
2015-16 Non-solar
2017-18 Solar
2016-17 Solar
2017-18 Non-solar
RP
O c
omp
lianc
e (in
per
cen
t)
20
Karnataka and Tamil Nadu which set ambitious targets have high rates of compliance However Madhya Pradesh and Uttar Pradesh were unable to reach their ambitious targets Andhra Pradesh Gujarat Maharashtra and Rajasthan set modest targets with relatively high compliance levels The other states were unable to accomplish even their low targets The Comptroller and Auditor General of India (CAG) in their analysis of RPO compliance in 24 states between 2010ndash11 and 2013ndash2014 noted that non-compliance was more common among the RE resource-deficit states (CAG 2015 chap 2) This trend in non-compliance by the states has remained largely unchanged since then
In most cases the RPO served as a ceiling on deployment rather than a fillip Most RE-rich states limited discomsrsquo procurement of wind and solar power up to the RPOs targets notified by their respective SERCs The RPO regulation of Gujarat explicitly required the discoms to source RE from within their areas of supply Similarly the Bihar RPO regulation requires discoms to meet their RPOs from sources within their state Discoms can source power from outside the state only in case of shortfall within the state Further there is no indication or incentive in the state RE policies for discoms to exceed the RPO targets Grid integration concerns and the technical limitations to RE powerrsquos sale to other states restrict RE deployment
Participation in the REC market mechanism
The trading mechanism instituted for RECs in the power exchanges has not led to its uptake as there has been a consistently high number of unredeemed RECs (see Figure 5) In addition developers installed only around 2266 MW of RE capacity in 2010ndash2017 under the REC mechanism
Figure 5 RECs consistently remain unsold in the market
Source Authorsrsquo adaptation from REC Registry of India 2020 ldquoMonth-wise RECs Reportrdquo REC Registry of India Accessed 30 November httpswwwrecregistryindianicinindexphppublicsrecs
The REC market has not adequately boosted compliance with the RPO regime Up to 2014 only 477 per cent of the RPO compliance was through the REC route (CAG 2015 chap 2) For resource-deficit states to meet their RPOs through RECs a higher number of resource-deficit states should constitute the buyers ndash which however is not the case (see Table 6) Instead the data shows that resource-rich states are also the highest buyers of RECs
Note The closing balance is the balance in December of each year
0
20000000
15000000
10000000
5000000
2013 2014 2018 20192015 2016 2017
RECs issued RECs redeemed Closing balance
21Renewable purchase obligations ndash a regulatory mechanism for creating demand
How Indiarsquos Solar and Wind Policies Enabled its Energy Transition A Decade in Review
Another noteworthy fact is that among the large buyers ie Maharashtra and Gujarat there is significant private-sector participation In Gujarat private discoms make the most REC purchases The other significant chunk of buyers are the union territories which fall within the Central Governmentrsquos purview and for this reason may be more enthusiastic in their use of the REC mechanism (POSOCO 2018)
It appears that the factors behind participation in the REC market are independent of resource availability and utilisation
33 Causes of under-achievement
The possible causes of under-achievement of the REC mechanism in boosting RPO compliance are discussed below
Declining number of sellers
The SERCs have contended in the past that developers stand to gain supernormal profits by setting up REC projects since they are entitled to normal tariffs plus the REC price Analyses also anticipated that the high floor prices could provide windfall gains to developers (A Singh 2010)
However this did not hold true in practice Though there was an initial spurt in the number of projects that were registered under the mechanism as solar and wind tariffs continued to fall the registration of new projects under the REC mechanism reduced (see Figure 6) There is a clear preference for FiTauctions over the REC route Of the total 85908 MW of RE capacity (including all types of RES) in India as of 31 December 2019 (MNRE 2020a) only 4046 MW was registered under the REC mechanism (REC Registry of India 2020b) (see Table A3 of the Annexure for the number of projects registered in the selected states)
Table 6 Resource-rich states are also the highest buyers of RECs
Source Authorsrsquo adaptation from POSOCO 2018 Renewable Energy Certificate Mechanism in India Key Learnings Data Analysis and Way Forward New Delhi POSOCO NLDC
Share of total RECs purchased by state entities (total RECs redeemed up to
2017ndash18 are 37043171) (in per cent)
Share of total RECs purchased by the state discom (total RECs purchased
by all discoms up to 2017ndash18 are 22499976) (in per cent)
State
Maharashtra
Gujarat
Rajasthan
Bihar
Madhya Pradesh
Punjab
Tamil Nadu
Karnataka
Andhra Pradesh
Uttar Pradesh
307
133
62
46
44
33
19
17
16
04
44
131
0
75
0
39
0
0
0
0
22
Cashflow for REC projects
In the early 2010s there was still a wide gap between the APPC and solar and wind tariffs It would have been risky to register as a REC project since REC prices would be discovered in energy exchanges within the approved bands The floor price is calculated by determining the gap between the minimum requirement and the APPC This minimum requirement is an estimation that considers OampM expenses interest on term loans working capital and repayment terms it is fixed to ensure the economic viability of the project However these numbers are estimated based on prevailing rates as opposed to historic rates Hence the prices have expectedly and consistently fallen (see Table 7) the floor price has reached zero This would impact the cashflows of a project registered when the costs were high
Figure 6 The registration of new projects under the REC mechanism has reduced
Source Authorsrsquo analysis of data published by POSOCO 2018 Renewable Energy Certificate Mechanism in India Key Learnings Data Analysis and Way Forward New Delhi POSOCO NLDC
Table 7 REC floor prices and forbearance prices have consistently fallen
Non-solar (INR MWh)
Floor price Floor priceForbearance price Forbearance price
Solar (INR MWh)
1500
1500
1000
0
3900
3300
3000
1000
12000
9300
1000
0
17000
13400
2400
1000
1 June 2010ndashFY 2012
1 April 2012ndashFY 2017
1 April 2017ndashFY 2020
1 July 2020ndash30 June 2021
Control period
Source Order dated 1 June 2010 issued by the CERC in Petition No 992010 (Suo Motu) titled Determination of Forbearance and Floor Price for the REC Framework Order dated 23 August 2011 issued by the CERC in Petition No 1422011 (Suo Motu) titled Determination of Forbearance and Floor Price for the REC Framework to be Applicable from 1st April 2012 Order dated 30 March 2017 issued by the CERC in Petition No 02SM2017 titled Determination of Forbearance and Floor Price for the REC framework to be Applicable from 1st April 2017 Order dated 17 June 2020 issued by the CERC in Petition No 05SM2020 titled Determination of Forbearance and Floor Price for the REC Framework
Capacity Noof projects
0 0
200 50
400100
600
800150
1000 200
1200 250
2010
-11
Year
Cap
acit
y (M
W)
Num
ber
of r
egis
tere
d p
roje
cts
2011
-12
2012
-13
2013
-14
2017
-18
2016
-17
2015
-16
2014
-15
23Renewable purchase obligations ndash a regulatory mechanism for creating demand
The declining trend of the market price of the REC (see Table 7) shows that buyers are unwilling to pay a higher price and that there is significant uncertainty surrounding the expected returns on investment
How Indiarsquos Solar and Wind Policies Enabled its Energy Transition A Decade in Review
Table 8 Average size of a registered plant as of FY 2018
SourceAuthorsrsquo analysis of data published by POSOCO 2018 Renewable Energy Certificate Mechanism in India Key Learnings Data Analysis and Way Forward New Delhi POSOCO NLDC
Maximum capacity (MW)
Minimum capacity (MW)
Average capacity (MW)
No of projects
Total capacity (in MW)
1900
504
010
023
204
525
360
413
736
2167
Solar PV
Wind
RE source
For projects developed after the fall in costs the situation has reversed The APPC in most cases may be higher or equal to solar and wind tariffs If any new projects are registered under the REC regime today they could sell power to the host discoms at the APPC (or SERC-notified tariffs) and RECs thus sold can help an obligated entity meet its RPO
Cost for host discomsstatesThe responsibility and cost of balancing power from REC projects (the cost of maintaining system balance due to injection of variable power in the grid) fall on the host state This could limit the number of REC projects the state would host for the availability of other obligated entities
For RE-deficit states it would be more commercially viable to procure RECs to meet their RPOs (they will incur conventional power purchase costs plus REC costs) and avoid the balancing costs associated with procuring RE directly However data shows that discoms do not avail of this route to meet their RPOs This may be due to behavioural resistance to shift to REC or due to the indifferent enforcement of RPOs
Cost for other obligated entitiesInitially there was considerable resistance from open access and captive consumers to the RPO obligations imposed upon them The dispute was eventually settled by the Supreme Court in Hindustan Zinc Limited v RERC14 in which the Court held such imposition to be valid Open-access consumers have the freedom to switch to grid purchase in which case they do not need to comply with RPOs separately
Regulatory gapsThe REC market is a lsquocompliance marketrsquo ie the demand for RECs arises from a legal mandate and is not organic demand15 In this context non-compliance can result from the following situations
14 Judgment dated 13 May 2015 issued by the Supreme Court of India in Civil Appeal No 4417 of 2015 httpswwwrecregistryindianicinpdfREC_RegulationSupreme_Court_Judgement_regarding_RPO_Compliancepdf
15 The voluntary component of the REC market is the exception However its share is only 01 percent of the REC market (POSOCO 2018)
24
This would especially affect larger projectsrsquo participation in the REC mechanism Investors prefer projects with PPAs as they offer assured returns over a longer duration This is also indicated by data on the average size of projects registered under the REC mechanism (Table 8)
Regulatory uncertainty
As discussed above RPO regulations allow carrying forward exemptions etc which create demand uncertainty Other regulatory causes also contribute to commercial uncertainty Initially the life of the REC was only one year after which it expired if not redeemed These expired RECs generated no returns on investment for investors This would have dissuaded many investors from setting up REC projects The validity period was subsequently increased to two years by the CERC through an order dated 11 February 2013 however this did not give investors sufficient confidence Commercial uncertainty was further exacerbated by the fact that demand was also not certain due to the low RPO targets set by states before the MoP set a common trajectory for all in 2016
Inadequate enforcement
There was no unified framework for monitoring RPO compliance on an on-going basis until the MNRE announced the constitution of the RPO compliance cell in 2019 The SERCs are relatively lenient with regards to non-compliance For example they permit the carrying forward of shortfall16 and the use of the previous yearrsquos surplus to meet shortfalls in the next year17 There have also been delays in reviews of compliance For example compliance for the period FY 2015ndash16 was finally determined by the Gujarat Electricity Regulatory Commission (GERC) on 26 December 2019 While there are generic penalties prescribed in the EA for contravention of regulations made under the EA it is difficult to imagine that the SERCs would be highly inclined to strictly invoke these provisions against their own state discoms
Inability of the obligated entities to comply with the mandate
While non-enforceability and regulatory gaps lead to non-compliance the practical reason is that RPOs and RECs are an additional cost burden for discoms which are already under severe financial stress Further many inefficient thermal projects continue to operate to their technical minimum to provide the baseload which limits the extent of RE procurement Certain states have indicated that they would be willing to purchase RECs provided they find an offtaker for the thermal capacity that is already contracted by the discoms Many states which were earlier in a power deficit situation but have now become power surplus states find it difficult to meet the current RPO levels and have no incentives to raise their RE ambitions
16 Order dated 4 August 2015 issued by the GERC in suo motu Petition Nos 1307 of 2013 and 1312 of 2013 titled Suo-motu Proceedings in Petition Nos 1307 of 2013 and 1312 of 2013 in Pursuance of Honrsquoble APTEL Direction Contained in Order Dated 16042015 in Appeal Nos 258 of 2013 and 21 of 2014 and the Order Dated 14052015 in IA No 187 of 2015 Accessed 22 October 2020 httpswwwgercinorgwp-contentuploadsdocumenten_1438799511pdf
17 Order dated 4 April 2019 issued by the MERC in Case No 39 of 2019 titled Case for Verification of Compliance of Renewable Purchase Obligation Targets by Adani Electricity Mumbai Limited for FY 2017ndash18
25Renewable purchase obligations ndash a regulatory mechanism for creating demand
RPO compliance for FY 2015ndash16 was finally determined by the Gujarat Electricity Regulatory Commission (GERC) on 26 December 2019
How Indiarsquos Solar and Wind Policies Enabled its Energy Transition A Decade in Review 188
Image iStock
India must implement a comprehensive market reforms roadmap with an intent to remove current inefficiencies while designing a market architecture that minimises total system costs in the future
27
The southern and western states of India have a long history of RE development since RE resources are concentrated in these states (Figure 7) These states attracted investments in
solar and wind energy well before the launch of NAPCC and the NSM This section recounts the journey of RE policies in states that have high solar and wind energy potential The RE-rich states covered are Andhra Pradesh Gujarat Karnataka Madhya Pradesh Maharashtra Rajasthan Tamil Nadu and Telangana
41 Policies pre-2014 In January 2009 Gujarat became the first Indian state to launch a solar power policy (Economic Times 2010) In 2012ndash13 over 40 per cent of Tamil Nadursquos total capacity was based on wind power (TN Energy Department 2012) well before the Government of India adopted the ambitious target of 175 GW RE capacity by 2022 including 60 GW wind
In the first phase of NSM Karnataka Power Corporation Limited (KPCL) was the first state-owned utility to be found eligible for the development of a solar project (Deloitte 2015) Rajasthan attracted a slew of projects primarily because of abundant land and resource availability In 2011 Karnataka was the first southern state to introduce an exclusive policy for the development of solar energy
4 Policy evolution in RE-rich states
Figure 7 RE resource potential is concentrated in western and southern India
Source Authorsrsquo analysis based on data from MNRE 2020 Annual Report 2019-20 New Delhi MNRE
Note Wind potential is at 120 m above ground level
Solar potential (GW)
088 0114231 14256
Wind potential (GW)
How Indiarsquos Solar and Wind Policies Enabled its Energy Transition A Decade in Review 28
Key driversThrough 2010ndash14 the underlying policy motivations across RE-rich states were increasing energy access closing demand-supply gaps increasing industrial productivity utilising local resources for power generation garnering private investments creating employment opportunities through project deployment and local manufacturing responding to local environmental challenges and addressing climate change risks
Policy focusIn most of the initial policies support was provided in the form of FiTsbundled tariffs The power was sold through long-term PPAs to state discoms or to NVVN under NSM bundling schemes However we observed shortfalls in administrative and institutional mechanisms like negligible support for land acquisition and approvals and clearance processes lack of strengthening of evacuation infrastructure to tap the best sites no provisions for building knowledge and capacity in key implementing entities and no requirement for improved data collection and communication to aid industryrsquos decision-making and project planning The challenges of the distribution sector also impacted the progress of the sector during the implementation of the NSM Policies therefore failed to create an enabling environment and were not adequate to attract significant investors in the RE business Accordingly these policies attracted a poor response in many RE-rich states For example
bull In Andhra Pradesh only 13184 MW of solar PV capacity was commissioned till FY 2014 against the 2000 MW of solar capacity envisaged under Andhra Pradeshrsquos Solar Power Policy 2012
bull In Tamil Nadu only 13258 MW of solar PV was installed over 2012ndash15 against a target of 3000 MW in Tamil Nadu Solar Policy 2012
bull Karnatakarsquos Renewable Energy Policy 2009ndash14 enabled the addition of 102108 MW during the five-year policy period against a target of 4200 MW
Performance of policies During 2012ndash2014 several states failed to achieve NSM and their state policy targets within the stated time (Stromsta 2012) (See Table 9) States such as Rajasthan Andhra Pradesh and Tamil Nadu conducted auctions in 2013 but there were delays in signing PPAs Gujarat was the only state that adopted the FiT system under its solar policy that was much more attractive than NSM and other state policies Even then there were time overruns Rajasthan auctioned 75 MW of solar capacity in March 2013 However elections in the state delayed land allocation processes (Sengupta 2013) In December 2012 Tamil Nadu conducted a 1000 MW auction out of which only 698 MW was awarded at INR 648 per unit This may reflect investorsrsquo risk perception of the discom finances and operations in the state (TNN 2013)
Project deployment in most states was below the target capacity under the policies
29Policy evolution in RE-rich states
Table 9 Targets specified under policies and achievements
Source Authorsrsquo analysisRPO achievement figures from MoP 2020 Agenda Background Conference of Power and Renewable Energy Ministers of States and UTs 3 July 2020 New Delhi 3 July
Capacity achievement figures from CSO Energy Statistics 2010 New Delhi MoSPI CSO Energy Statistics 2012 New Delhi MoSPI CSO Energy Statistics 2013 New Delhi MoSPI CSO Energy Statistics 2014 New Delhi MoSPI CSO Energy Statistics 2015 New Delhi MoSPI CSO Energy Statistics 2016 New Delhi MoSPI CSO Energy Statistics 2017 New Delhi MoSPI CSO Energy Statistics 2018 New Delhi MoSPI CSO Energy Statistics 2019 New Delhi MoSPI CSO Energy Statistics 2020 New Delhi MoSPI MNRE 2019 Annual Report New Delhi MNRE
Windsolar policy and year Targets in policy Achievement against targets
Solar Power Policy 2012
Solar Power Policy 2015
Wind Power Policy 2015
Solar Power Policy 2018
Wind Power Policy 2018
SolarndashWind Hybrid Policy 2018
Wind Power Policy 2007
Solar Power Policy 2009
Wind Power Policy 2013
Solar Power Policy 2015
Wind Power Policy 2016
Policy for Implementation of Solar Power Based Projects 2012
Wind Power Project Policy 2012
New and Renewable Sources of Energy Policy 2012
Policy for Promotion of New and Renewable Energy Sources 2011
Policy for Promotion of New and Renewable Energy Sources 2017
Karnataka Renewable Energy Policy 2009
Solar Policy 2011
Karnataka Solar Policy 2014
Karnataka Renewable Energy Policy 2016
New Policy for Power Generation from Non-Conventional Sources 2008
Comprehensive Policy for Grid Connected Power Projects based on New and Renewable (Non-conventional) Energy Sources 2015
Rajasthan Solar Energy Policy 2011
Policy for Promoting Generation of Electricity from Wind 2012
Rajasthan Solar Energy Policy 2014
Rajasthan Solar Energy Policy 2019
Rajasthan Wind and Hybrid
Energy Policy 2019
5000 MW
5000 MW additional capacity in 5 years
No targets but discoms required to purchase power up to their RPOs
No targets but discoms required to purchase power up to their RPOs
10 per cent of the capacity portfolio by 2022
1969 MW grid-connected solar
(total solar target is 2969 MW solar)
200 MW (including solar thermal)
Additional 2000 MW between 2014ndash2021
4400 MW additional wind capacity between 2016ndash2022
2000 MW of wind
7500 MW solar till 2020
5000 MW wind till 2020
Target of 10000ndash12000 MW in next 10ndash12 years
300 MW (2013ndash14) 400 MW (2014ndash15) and 500 MW (2015ndash16)
25000 MW
24 GW utility-scale solar by 2025
2000 MW wind for RPO by 2025
Target is only for discom purchase
355902 MW total solar capacity as of December 2019
276355 MW total solar and 735922 MW total wind capacity as of December 2019
For 2019ndash20 solar RPO compliance is 462 per cent and non-solar RPO compliance is 12257 per cent
251989 MW wind and 223748 MW solar as of December 2019
For 2019ndash20 solar RPO compliance is 847 per cent and non-solar RPO compliance is 71 per cent
9471 MW solar as of December 2019
14935 MW total solar capacity as of December 2019
31 MW total solar capacity in FY 2014
724392 MW solar added between FY 2014 and December 2019
188425 MW wind added between FY 2016 and December 2019
4446 MW total wind capacity in FY 2015
500033 MW wind and
166342 MW solar as of December 2019
484421 MW solar as of December 2019
10025 MW (in 2013ndash14) 5241 MW (in 2014ndash15) and 68495 MW (2015ndash16) of wind capacity
484421 MW total solar and 429972 MW total wind as of December 2019
Andhra Pradesh
Gujarat
Madhya Pradesh
Punjab
Bihar
Karnataka
Maharashtra
Rajasthan
State
How Indiarsquos Solar and Wind Policies Enabled its Energy Transition A Decade in Review
Table 9 contd Windsolar policy and year
Targets in policy
Achievement against the targets
Tamil Nadu Solar Policy 2012
Tamil Nadu Solar Policy 2019
Solar Power Policy 2013
Solar Power Policy 2017
Telangana Solar Power Policy 2015
Telangana Wind Power Policy 2016
3000 MW by 2015
9000 MW by 2023
500 MW by 2017
Target up to the RPO
No target
No target
14258 MW total solar capacity in FY 2015
378836 MW solar as of December 2019
33673 MW solar by 2017
10451 MW solar by December 2019 Solar RPO compliance for 2019ndash20 is 305 per cent
362075 MW solar and 1281 MW wind as of December 2019
Tamil Nadu
Uttar Pradesh
Telangana
State
By 2013 Gujarat had installed over 850 MW of solar PV projects the largest capacity in India at that time However the holding company of discoms in Gujarat ndash Gujarat Urja Vikas Nigam Limited (GUVNL) ndash moved to renegotiate the tariffs specified under the signed PPAs citing excessive profits to developersinvestors (Balan 2014) Although GUVNLrsquos attempt was struck down by the APTEL this was the first time that the risks related to contract sanctity emerged in the Indian market which hurt business and investor confidence
As a result of the withdrawal of AD in 2012 and delays in the re-introduction of the GBI wind power deployment rates also declined in 2013 Without the AD or GBI the tariff of a typical new wind power plant was in the range of INR 4 to 5 per unit (for lsquoZone 2rsquo and above sites) Due to this sudden policy gap the market collapsed from 3 GW in 2011 to below 2 GW in 2012 and 2013 (CAG 2015 chap 4)
Figure 8 depicts the growth of solar and wind capacity across states This clearly shows that total capacity started to increase more rapidly 2014 onwards Wind power on the other hand grew at a constant pace till 2012 after which it plateaued for a couple of years and it again picked up in 2016 and 2017 After 2017 wind deployments slowed down again
30
Note The capacity achievement figures include only grid connected capacity while the targets may include decentralised capacity
Figure 8 Solar and wind capacity increased rapidly 2014 onwards
Sources Authorsrsquo analysis based on CSO Energy Statistics 2010 New Delhi MoSPI CSO Energy Statistics 2012 New Delhi MoSPI CSO Energy Statistics 2013 New Delhi MoSPI CSO Energy Statistics 2014 New Delhi MoSPI CSO Energy Statistics 2015 New Delhi MoSPI CSO Energy Statistics 2016 New Delhi MoSPI CSO Energy Statistics 2017 New Delhi MoSPI CSO Energy Statistics 2018 New Delhi MoSPI CSO Energy Statistics 2019 New Delhi MoSPI CSO Energy Statistics 2020 New Delhi MoSPI MNRE 2020 Annual Report 2019ndash2020 New Delhi MNRE
Policies for project planning and development phasesSeveral initial policies assigned the full responsibility for project planning and construction to developers This included locating and acquiring suitable land conducting resource assessments obtaining all clearances and permissions and bearing the cost of ensuring connectivity to the nearest evacuation point Although some policies did talk about single-window clearance through state nodal agencies the portal or facility was non-functional on the ground Some state policies for example Gujarat Solar Policy 2009 Andhra Pradesh Solar Policy 2012 Andhra Pradesh Wind Policy 2015 and Karnataka RE Policy 2009ndash14 did include enabling provisions for the facilitation of revenuebarren lands
bull Gujarat developed the first solar park in the country in 2012 ndash Charanka Solar Park ndash that houses around 600 MW capacity and provides the required infrastructure for projects
0
0
10000
10000
20000
20000
30000
30000
40000
40000
50000
50000
60000
60000
70000
80000
70000
200
820
08
200
920
09
2010
2010
2011
2011
Solar capacity growth
Wind capacity growth
Cap
acit
y (in
MW
)C
apac
ity
(in M
W)
2012
2012
2013
2013
2014
2014
2020
2020
2019
2019
2018
2018
2017
2017
2016
2016
2015
2015
AP
AP
Telangana
Telangana
Rajasthan
Rajasthan
Maharashtra
Maharashtra
Total
Total
Gujarat
Gujarat
Tamil Nadu
Tamil Nadu
Madhya Pradesh
Madhya Pradesh
Karnataka
Karnataka
31Policy evolution in RE-rich states
How Indiarsquos Solar and Wind Policies Enabled its Energy Transition A Decade in Review
bull The New and Renewable Energy Development Corporation of AP Limited (NREDCAP) in Andhra Pradesh worked with the statersquos revenue department to procure land in advance and sign long-term leases with the developers at predetermined rates
bull In Karnataka 10 per cent of barren government lands reserved for industrial use were allocated to Karnataka Renewable Energy Development Limited (KREDL) for RE development KREDL could sub-lease the identified revenue barren or panchayat lands to project developers for 30 years No procedure was specified for the selection of developers and allotment of land to them Therefore this later led to land banking by wind developers As per the state policy KREDL was supposed to undertake wind resource assessment studies identify potential sites and notify land parcels as reserved for wind project development
Many policies did not specify the application procedures to be followed by the project developers For example Tamil Nadu Energy Departmentrsquos Policy Note 2012ndash13 was totally silent on land allocation criteria ndash for land owned by the statersquos revenue department and for private lands (TN Energy Department 2012) Hence almost the entire wind capacity in the state is installed on private lands The criteria for allotting land developed by state nodal agencies (SNA) or special purpose vehicles (SPVs) was not articulated ndash whether it was first-come-first-served basis or a robust assessment framework for leasing land or a system that prioritised certain project categories The arrangements under which the land could be allotted to developers were mainly land-lease-based However the policies were not clear on how these lease values will be determined Mostly these rates were linked to market prices which could increase significantly owing to land-use patterns and the limited availability of land
The land-related provisions in state wind policies or their silence on those aspects led to developersmanufacturers acquiring huge tracts of private land in wind-rich states which they could retain while carrying out wind resource assessments (Naidu 2013) They started implementing the project once the desired infrastructure came up or once they struck a deal with the offtaker As a result the per MW capital costs were high because of a huge component of land premiums that were built into it However this could be considered a way to address the risks wind developers had to bear at that time
Grid connectivity policiesAccording to the Grid Code for intra-state networks the state transmission utility (STU) or discom is responsible for strengthening grid infrastructure to evacuate RE power and bears the associated costs It is also responsible for extending the grid up to the pooling sub-station However given the financial health of discoms and some STUs these steps were rarely taken States took to ad-hoc arrangements to establish grid connection For example in Gujarat the following solution was adopted the STU provided the necessary equipment for connecting projects to the grid while the developers provided the workforce and the required finances This arrangement was then followed by many other RE-rich states Thereafter the parkzone approach was promoted under several later policies
As per the CERC (Grant of Connectivity Long-term Access and Medium-term Open Access in Inter-state Transmission and Related Matters) Regulations 2009 renewable energy plants of
323232
Many policies did not specify the application procedures to be followed by the project developers
more than 50 MW could connect to the ISTS to take advantage of reduced congestion in the higher-voltage grid but no wind or solar plant availed of that option till as late as 2018 This could have been because project development frameworks and power sale contracts were signed with local entities Or under the point of connection transmission pricing (on a MW basis) the charges on wind projects may have been a burden as their capacity utilisation factors are lower than that of thermal power plants Further at that time and even now PGCIL substations are often far from wind farm sites resulting in high connectivity costs for developers
Policies addressing project operations and power procurementMost policies provided for power procurement by discoms from wind and solar plants through long-term PPAs to meet the RPOs Many states in 2012ndash14 experienced power shortages Therefore RE was also considered an option to meet the demand of large commercial and industrial units in these states For example the Karnataka Electricity Regulatory Commission (KERC) notified a fixed-term concessional open-access regime for solar energy including exemption from wheeling and banking charges and cross-subsidy surcharge for the first 10 years of operation for solar projects that did not fall under the REC mechanism However this was rolled back in 201818 Many other states offered incentives and exemptions such as nil or minimal wheeling and transmission charges for wheeling of power consumed within the state cross-subsidy surcharge exemption for open access obtained for third-party sales within the state exemption from paying electricity duties for sale to discoms andor for captive consumption and third-party sale within the state and different arrangements for banking of RE power
It appeared that most RE-rich states preferred RE plants to sell power to discoms or third parties or serve captive demand within the state itself For example
bull Maharashtrarsquos New Policy for Power Generation from Non-Conventional Sources 2008 required developers availing the benefits of the policy to sell 50 per cent of the electricity generated from the plant to the discom ndash Maharashtra State Electricity Distribution Company Limited (MSEDCL) ndash at the Maharashtra Electricity Regulatory Commission (MERC)-approved rate under the PPA and the remaining 50 per cent only within the state
bull Karnatakarsquos Renewable Energy Policy 2009ndash14 required RE plants to sell electricity to discoms under PPAs approved by KERC or use it for captive purposes There was no mention of third parties within the state who could buy RE power through open access
bull Andhra Pradeshrsquos Solar Policy 2012 captures only intra-state sale of power to discoms or third party
CurtailmentFollowing the Grid Code the must-run status of RE plants was adopted by states in their respective grid codes However inadequate grid availability has been a challenge in RE-rich states more so in the period 2009ndash2014 In Tamil Nadu wind generation increases significantly during the monsoons (AprilndashSeptember) when power demand is also relatively low Before 2014 the intra-state grid was unable to absorb the excess generation due to low demand and could not transmit it to other regions because of limited inter-connections with
18 Order dated 14 May 2018 issued by the KERC in matter no S032017 titled In the Matter of Revision of Wheeling and Banking Charges for Renewable Power Projects httpskredlinfoingeneralwheeling20and20banking20charges2014052017pdf
33Policy evolution in RE-rich states 33Policy evolution in RE-rich states 33Policy evolution in RE-rich states
During 2012ndash14 many states experienced power shortages Therefore RE was also considered an option to meet the demand of large commercial and industrial units
How Indiarsquos Solar and Wind Policies Enabled its Energy Transition A Decade in Review
Table 10 2010ndash2014 Developments that held back RE deployment and associated risks that remained
Note Authorsrsquo analysis
Corresponding risks
Inadequate support for land procurement
Lack of evacuation infrastructure and delays in grid connectivity
Mismatch between national targets and state RPO trajectories low RPO compliance
Poor credit profile of state discoms
Uncertainty in incentives ndash lapsing and withdrawal of GBI and AD
Curtailment of power
No provisions for RE sale outside the state
Delay in commissioning leading to cost overrun
National targets at risk restricted marketsdemand
Offtake risk payment risk
Cashflow risks
Offtake risk
Restricted marketsdemand
Inadequate support for land procurement
Inhibitors
42 Policies post- 2014 From 2014 onwards the Indian market witnessed a steep fall in solar tariffs owing to a variety of reasons ranging from domestic factors to global developments The NSM was successful in signalling Indiarsquos commitment towards solar development Although the rate of installation was slow during 2012ndash2014 and risks and inhibitors continued (Table 10) investor outlook remained positive
Key driversAs power deficits in states reduced demand grew slower than expected and solar tariffs declined drastically In response most RE-rich states developed policies with the intent of ensuring state-level energy security meeting agricultural and domestic loads through solar and aiming to become investment-friendly destinations In addition creating employment opportunities through project deployment as well as local manufacturing and responding to local environmental challenges and addressing climate change risks remained some of the commonly stated drivers across these states
Policy focusMost policies starting 2014ndash15 included provisions to facilitate the development of large-scale solar parks in a systematic and structured manner with the help of SECI Instead of individual states conducting their own auctions to procure solar power and meet their solar RPOs states preferred to buy power through SECI while continuing to procure wind power directly at preferential tariffs till 2017 Many policies specified clear targets to be achieved over
the national grid This led to the severe curtailment of wind power In 2014 the southern grid was inter-connected with the national grid providing some relief to the southern states but many industry players (Saumy 2019) and the MNRE (Chandrasekaran 2017) have continued to ask states to prevent curtailment of RE power Curtailment for wind power plants averaged around 30ndash35 per cent of generation in the peak season during 2012ndash15 (Jhawar 2020)
34
a five-year period Most policies at least on paper aimed to mitigate project development counterparty and operations-related risks in the sector to lower the cost of RE generation in their respective states Progressive policies such as the Andhra Pradeshrsquos Solar Power Policy 2015 and Wind Power Policy 2018 provided deemed industry status to RE projects and explicitly accorded them must-run status Unlike in the pre-2014 era these policies acknowledged the need to facilitate the sale of RE power outside the state For example
bull The Rajasthan Solar Energy Policy 2014 aimed to meet the energy requirements of Rajasthan as well as India
bull Maharashtrarsquos Comprehensive Policy for Grid-connected Power Projects Based on New and Renewable (Non-conventional) Energy Sources 2015 aimed to facilitate the sale of renewable power outside the state once the statersquos RPOs were met The policy even included a provision for deemed open access for the sale of energy within or outside the state if permission is not granted within the period specified in the MERC regulations It also gave RE projects the option to terminate their existing PPA with the state discom and opt for open access
bull APrsquos Solar Power Policy 2018 provided transmission and distribution charge exemptions for inter-state wheeling of power (which was later rolled back through an amendment)
bull APrsquos Renewable Energy Export Policy 2020 aimed to facilitate the leasing of land for setting up RE power plants and manufacturing facilities and to export power to other states
The reason for this shift in focus is that RE-rich states would want to utilise their abundant land and resource potential to attract huge private-sector investments generate revenues for the exchequer and create local jobs but would not be able to absorb all the generation within the state to meet their own demand
Global market developmentsApart from reduced risk perceptions due to stronger institutional mechanisms developersrsquo expectation of fall in solar module prices also drove them to place extremely aggressive bids in the auctions (Deign 2017) Solar module prices witnessed an overall drop in prices (see Figure 9) However even small fluctuations in module prices can affect project economics adversely
35Policy evolution in RE-rich states
Unlike in the pre-2014 era the policies now acknowledged the need to facilitate the sale of RE power outside the state
Figure 9 Average module (multicrystalline) prices have declined (2011ndash2019)
Source IEA 2020 ldquoEvolution of Solar PV Module Cost by Data Source 1970-2020rdquo 30 June Accessed 28 November 2020 httpswwwieaorgdata-and-statisticschartsevolution-of-solar-pv-module-cost-by-data-source-1970-2020
0
1412
0908 08
0706
05
0302
12
1
08
06
04
02
201320122011 2014 2018 20192015 2016 2017
USD
per
Wat
t
How Indiarsquos Solar and Wind Policies Enabled its Energy Transition A Decade in Review 36
There were short periods when module prices increased during 2017ndash2020 due to various reasons such as China slashing its subsidies reduced polysilicon supply in China module suppliers demanding price renegotiation and supply chain disruptions due to the COVID-19 pandemic (Bridge to India 2017) Excessive reliance on imported modules and largely from a single country makes the projects vulnerable to geopolitics and domestic policies intended to promote domestic manufacturing (Chawla 2020)
Wind tariffs declined following the initial rounds of bidding however the decline was not at the same pace as that of solar Even as discovered tariffs kept declining and were comparable with or even lower than tariffs of thermal projects RPOs remained the key driver and the primary Central Government lever for states to increase their RE uptake This is primarily because of the additional cost implications for discoms as they balance the increased variability in the system while being tied-up in long-term thermal PPAs
Performance of policiesAlthough all the policies seemed to be favourable and directed towards providing an enabling environment for RE development on-ground implementation and compliance remained weak which was the main reason for the prevailing risks in the sector Almost all RE-rich states like Tamil Nadu Andhra Pradesh Gujarat Karnataka Rajasthan and Maharashtra have made policy and regulatory decisions on electricity matters that have often been inconsistent with national policies and priorities They have made retrospective changes to policies threatened to renege on existing PPAs delayed payments to RE generators and curtailed RE power
One main reason for these inconsistent and ad-hoc actions was the drastic and rapid decline in solar tariffs starting 2014 (see Figure 10) The wind sector too transitioned to competitive bidding in late 2016 because of the success of reverse auctions in reducing solar tariffs While competition and reduced tariffs were desirable outcomes for Central policies it led to states losing confidence in RE PPAs signed at higher tariffs as compared to the lower tariffs discovered in subsequent auctions This not only led to the re-negotiation of PPAs but also delayed the procurement of new RE capacity in anticipation of further declines in tariffs
On the other hand the policies helped advance the setting up of solar parks which was a comforting factor for developers and investors and one of the contributing factors for
Figure 10 Solar tariffs discovered in Indian auctions
Source India RE Navigator 2020 ldquoAuction Resultsrdquo Accessed November 28 2020 httpsindia-re-navigatorcomwind
0
1210
864
2
2010
-13
2014
2018
2019
2020
2015
2016
2017
Central State
INR
kW
h
37Policy evolution in RE-rich states
bringing down tariffs However there were execution bottlenecks on the ground Project development was delayed because tenders were concluded while the park infrastructure was still under construction
Amongst the RE-rich states Karnataka has been a consistent performer for solar Under the Karnataka Solar Policy 2014ndash2021 it has recorded the largest solar capacity deployments in the country in 2017 2018 and 2019 In 2017 Karnataka installed more than 2 GW of large-scale solar and contributed to almost 25 per cent of the total capacity addition in India in that year By March 2019 with over 53 GW Karnataka had the highest installed capacity of utility-scale solar with a pipeline of around 28 GW Other state policies that have attracted investments include those of Rajasthan Andhra Pradesh Tamil Nadu and Maharashtra In 2018 these five states had more than 80 per cent of the countryrsquos utility-scale solar capacity
Meanwhile after SECI successfully concluded two auctions for wind energy in 2017 resulting in reduced tariffs many wind-rich states shifted to competitive bidding with SERC-determined generic tariffs as the tariff ceiling During 2017 states such as Gujarat and Tamil Nadu auctioned additional wind capacity to meet their non-solar RPO targets (Saurabh 2017) Seven wind-rich states installed 55 GW of wind capacity in 2016ndash17 (Raikar 2018) However in 2017ndash18 and 2018ndash19 the total wind installed capacity declined substantially to just around 18 GW and 14 GW respectively (IWTMF 2019) Low tariffs were quoted in initial bids but the subsequent tenders were undersubscribed most likely because the tariff ceilings were financially not feasible The main reasons for states not being able to achieve their wind policy targets were the conditions and risks that reverse auctions failed to address (i) wind resource is more concentrated than solar and high wind density sites are getting exhausted (ii) ISTS is not plannedavailable for moderatehigh wind sites (iii) bearing the costs associated with connecting to the nearest ISTS sub-station or connecting to STU networks instead adds to the risks and the resultant tariffs face tough competition from solarAmongst wind-rich states Gujarat led wind deployment in the country during 2016ndash2020 followed by Andhra Pradesh Karnataka and Tamil Nadu Figure 11 shows the annual wind capacity addition in these states
Karnataka has recorded the largest solar capacity deployments in the country in 2017 2018 and 2019
Figure 11 Gujarat saw the largest wind capacity additions among the wind-rich states (2016ndash2020)
Source Authorsrsquo analysis based on CSO Energy Statistics 2018 New Delhi MoSPI CSO Energy Statistics 2019 New Delhi MoSPI CSO Energy Statistics 2020 New Delhi MoSPI MNRE 2020 Annual Report 2019ndash2020 New Delhi MNRE
0
2000
1000
500
2500
3000
3500
4000
4500
5000
FY 2017
248 336772
316
1286
59
46087
123502
273
857
348
1303
882
2187
FY 2018 FY 2019 FY 2020
Cap
acit
y (in
MW
)
Andhra PradeshGujaratTamil Nadu Karnataka
How Indiarsquos Solar and Wind Policies Enabled its Energy Transition A Decade in Review
In 2019 political risks in the RE sector were exemplified when the new government in Andhra Pradesh took a strong stand on renegotiating wind and solar PPAs signed under Andhra Pradeshrsquos Wind Power Policy 2018 and Solar Power Policy 2018 (see Table 11)
Table 11 Timeline of the key events in the AP story
Source Authorsrsquo analysis
Date in 2019 Event
1 July
24 September
29 November
25 July
October
30 November onwards
1 December
12 July
AP government sets up a committee to renegotiate PPAsPSAs signed between 2012 and 2016
The AP High Court quashes the July 1 order and July 12 letters in writ petitions filed by the developers It directs the developers and discoms to approach the Andhra Pradesh Electricity Regulatory Commission (APERC) with their respective claims and to resolve all disputes in 6 months In the interim discoms will clear their dues and pay all power plants at the rate of INR 243 and INR 244 for wind and solar respectively
A compromise is reached between the Central and AP governments There is to be no tariff revision but concessional loans to be extended to discoms from PFC and IREDA to clear the dues
The AP High Court stays the July 1 order based on a petition by developers
Petition filed by AP discoms before APERC to review the tariffs
AP discoms clear pending dues at the rate of INR 243 and INR 244 for wind and solar respectively
The AP High Court stays the public hearing of the APERC on the tariff review petition filed by developers
Letter from AP Southern Power Distribution Company Limited (APSPDCL) one of the two state discoms to 139 wind and solar power plants to revise tariffs to INR 243 and INR 244 respectively
2016 onward SECIrsquos tendering activity has shifted towards ISTS-connected solar projects Between 2016 to 2019 it issued tenders worth 13000 MW of solar PV capacity (ISTS I to ISTS IX) and 12600 MW of wind capacity (Tranche I to Tranche IX) Figure 12 shows the deployment progress of solar projects awarded under the ISTS I to ISTS IX tenders by the SECI (as of August 2020)
Figure 12 ISTS-connected solar PV projects have poor completion record
Source Authorsrsquo analysis based on CEA 2020 Report of Under Construction Renewable Energy Projects New Delhi Renewable Energy Project Monitoring Division (CEA)
Solar PV capacity tendered
(ISTS-I to ISTS-IX)
13000
9530
4650
1800 17501080
250
Capacity awarded
PPAPSA or both not yet
executed
PPA and PSA signed
Financial closure
achieved
Plant erection in progress
Status not available
Cap
acit
y (in
MW
)
38
As is evident almost 50 per cent of the capacity that has been awarded is still awaiting closure of power purchase andor power sale agreements This implies that state discoms are not coming forward to offtake power from projects already awarded leaving developers and investors in a lurch For the capacity for which PPAs and PSAs have already been signed there have been significant delays because the required transmissionevacuation infrastructure is not ready and long-term access (LTA) to transmission has not been operationalised The COVID-19 pandemic has further impacted the construction of transmission lines increased delays and depressed electricity demand across the country Because of the lockdown enforced to curb the spread of the pandemic the MNRE had granted blanket extension of the scheduled commissioning timelines
For wind projects too the rate of commissioning has been rather slow (Figure 13) Most of the awarded projects will be coming up in Gujarat (Kutch) There were roadblocks with respect to the land allocation policy in Gujarat because of which no progress could be made Few projects are likely to come up in other host states such as Tamil Nadu Karnataka Maharashtra Madhya Pradesh and Kerala While the recent tenders (tranches VI to VIII) were undersubscribed several projects awarded earlier are facing delays due to non-readiness of transmission infrastructure and some projects have terminated their PPAs citing non-viability of projects at the discovered rates due to time and cost overruns Notably wind-rich sites are intrinsically more concentrated than solar logistically as well as resource-wise Therefore unless the sites are identified and prepared and transmission networks are appropriately planned strengthened in advance deployment would be slow One more option being tested is the windndashsolar hybrid or the blending approach and a bidding process akin to case I bidding in the conventional power sector to ease out on transmission variability and land-related risks
39Policy evolution in RE-rich states
Figure 13 The rate of commissioning of wind projects has been slow (August 2020)
Source Authorsrsquo analysis based on CEA 2020 Report of Under Construction Renewable Energy Projects New Delhi Renewable Energy Project Monitoring Division (CEA) CEA 2019 Summary of Solar and Wind Power projects (Commissioned and Under Construction) of SECI New Delhi Renewable Energy Project Monitoring Division (CEA)
Tendered (ISTS Tranche I to IX)
13400
9361
2085
Awarded Commissioned
Win
d c
apac
ity
(in M
W)
Policies facilitating land procurementThe MNRErsquos solar park scheme encourage states to develop solar parks to solve land procurement and connectivity problems All state policies encourage deployment in parks Most policies provide for designating solar power park developers (SPPDs) The SPPDs may be a state government-designated agency or a joint venture company (JVC) between a state-
How Indiarsquos Solar and Wind Policies Enabled its Energy Transition A Decade in Review 40
designated agency and SECI or a JVC between a state-designated agency and private agency or a private agency
The states under their respective solarRE policies have provided the necessary support and arrangements for developing the parks and projects have been successfully commissioned in the parks that are operational However there have been some challenges in developing these parks including problems in land acquisition by the SPPDs and mismatch in timelines for development activities and setting up of solar projects For example developers are facing several challenges with permissions clearances and approvals at the Kadapa Solar Park in Andhra Pradesh where the letters of award were issued in August 2018 but two years hence developers have yet not been able to begin any work there
For non-solar park projects land procurement is typically the generatorsrsquo responsibility particularly for projects set on private lands The Karnataka Renewable Energy Policy 2016ndash22 was the only policy that assigned the responsibility of identifying suitable land banks to the state nodal agency Andhra Pradeshrsquos Wind Power Policy 2018 and Solar Power Policy 2018 had entrusted NREDCAP with the responsibility of securing government lands However this provision was rolled back in 2019
The wind sector was again at a disadvantage here Most policies except recent solarndashwind hybrid policies did not address land requirements for wind power projects which are typically more concentrated in certain pockets In many cases windy sites were located far from plannedexisting intra- and inter-state networks Further all state policies require wind developers to either procure government land on a lease-hold basis on their own or procure private lands Even in SECIrsquos auction for ISTS-connected wind developers faced difficulties in securing land leases from the state governments and revenue departments For example while Gujarat had announced a wind power policy in 2016 to attract investments it took a policy decision in 2018 to not allocate any land to wind projects auctioned by SECI for exporting power to other states (Tenddulkar 2019) Later in January 2019 Gujarat announced a new land policy for wind solar parks as well as windndashsolar hybrid parks to demarcate land areas where these projects would be allowed
Policies for grid connectivity and project operationsFrom 2014 onward MNRE and SECI started coordinating with other line departments and agencies at the Central level to plan construct and strengthen intra- and inter-state networks To ensure the evacuation of power from 20 GW of wind and solar capacity the Centre sanctioned a project to augment the Intra-State Transmission System (InSTS) in 2015ndash16 STUs in eight RE-rich states ndash Tamil Nadu Rajasthan Karnataka Andhra Pradesh Maharashtra Gujarat Himachal Pradesh and Madhya Pradesh ndash are implementing this project
In 2016 the Ministry of Power waived off inter-state transmission charges and losses for wind and solar projects which is now applicable for projects being commissioned till June 2023 In state-level solarwindRE policies there appears to be some degree of disparity and uncertainty on grid connectivity evacuation forecasting scheduling and sale of power
In state-level policies there appears to be some degree of disparity and uncertainty on grid connectivity evacuation forecasting scheduling and sale of power
41Policy evolution in RE-rich states
bull As of July 2019 15 states had notified their regulations for forecasting scheduling and settlement of deviations for RE broadly in line with the CERC regulations (Srivastava Singhvi and Rustagi 2019) Most of these states permit an error band of (+-) 15 per cent as per CERC regulations In a few states such as in Tamil Nadu the error band is limited to a narrower range of (+-) 10 per cent Even within the same regional load dispatch region the error bands notified by states differ For example Maharashtra permits (+-) 15 per cent deviation while Gujarat allows only (+-) 12 per cent deviation for wind developers
bull Andhra Pradeshrsquos Wind Power Policy 2018 and Solar Power Policy 2018 stated that no transmission and distribution charges will be levied for inter-state wheeling of power Later the policy was amended in November 2019 and the exemptions were rolled back and charges as determined by the APERC were made applicable
bull To discourage open-access transactions of wind power Tamil Nadu increased the cross-subsidy surcharge for open-access consumers from 50 per cent of that for conventional power in 2016 to 60 per cent in 2018 Over the same period it also increased open-access charges from 40 per cent to 50 per cent of that for conventional power Such steps restrict significant new demand for RE amongst large commercial and industrial players by adding to the landed cost of RE power even as RE tariffs become cheaper than discoms tariffs
bull Banking charges for wind and solar vary by state The period of banking is also different for various states (Table 12)
bull Although RE is accorded a must-run status by several policies and grid codes curtailment continues for technical as well as commercial reasons Older projects that have higher tariffs face higher curtailment than newer projects In Tamil Nadu curtailment has reduced from a peak of 30ndash35 per cent to 20ndash25 per cent currently (Jhawar 2020) However it appears that commercial concerns are causing the Andhra Pradesh discoms to curtail RE power despite repeated judicial directions against it (Parikh 2020)
How Indiarsquos Solar and Wind Policies Enabled its Energy Transition A Decade in Review 42
Table 12 Banking charges and conditions across RE-rich states
Source Authorsrsquo adaptation based on MERC (Distribution Open Access) (First Amendment) Regulations 2019 Order No 82020 dated 7 October 2020 issued by the TNERC titled Order on Procurement of Wind Power and Related Issues Order No 22020 dated 30 April 2020 issued by the GERC titled Tariff Framework for Procurement of Power by Distribution Licensees and Others from Wind Turbine Generators and Other Commercial Issues for the State of Gujarat RERC (Terms and Conditions for Tariff Determination from Renewable Energy Sources) Regulations 2020 Order dated 14 May 2018 in matter No S032017 issued by the KERC titled Revision of Wheeling and Banking Charges for Renewable Power Projects
Banking charges Other conditionsBanking period
No banking charges for wind projects
10 per cent of RE banked in kind
14 per cent of input energy
No banking charges
2 per cent of RE banked in kind
2 per cent of the injected energy in kind
No banking allowed
One month
April to March barring peak hours as determined by the discoms
One FY (April to March)
One month
One month
January to June ndash for wind projects
April to September and October to March ndash for solar projects
Monthly settlement for non-REC wind projects
Banking facility not available for third-party sale and REC-based captive power plants (CPP)
Energy banked during the peak time of day (TOD) hours may be drawn during off-peak TOD slots but not vice-versa
The unutilised banked energy at the end of the month up to 10 per cent of the total energy generated in that month to be purchased by discoms at the applicable generic tariffs for the year
Unutilised banked energy at the end of six months to be purchased by discoms at 85 per cent of the applicable generic tariff
The energy banked by non-REC projects during the peak ToD hours can only be drawn during the peak ToD hours
Banking allowed for CPP but not for third-party sales under open access within the state
The unutilised banked energy will lapse at the end of the year
The unutilised banked energy as of March 31 to be encashed at 75 per cent of the applicable wind energy tariff for existing wind energy captive users
Excess generation or unutilised banked energy at the end of the month to be purchased at 75 per cent of the wind energy tariff for captive users For captive REC generators the unutilised banked energy can be encashed at 75 per cent of the pooled cost of power
Gujarat
Rajasthan
Tamil Nadu For wind projects commissioned till 31 March 2018
For wind projects commissioned on or after 1st April 2018
Maharashtra
Karnataka
Andhra Pradesh
State
43
5 Policy evolution in RE-deficit states
Image iStock
As discussed above southern and western states in India have abundant RE and land resources to develop large-scale wind and solar power projects However the northern
states in the Indo-Gangetic plains are densely populated agricultural states The mountain regions in the north have excellent solar resources and are sparsely populated but have forest areas and difficult terrains and low transmission capacities The coal economy is dominant in the eastern states
How Indiarsquos Solar and Wind Policies Enabled its Energy Transition A Decade in Review 44
The policy response to developing large-scale solar and wind has been weak in the non-RE-rich states as compared to RE-rich states Our review accounts for three key states ndash Uttar Pradesh Bihar and Punjab
Key driversThe key drivers for promoting RE were poor power supply in the rural as well as urban area growing energy needs in urban industrial and commercial sectors and the need to comply with RPOs Policies intended to attract private-sector investments improve rural livelihoods and create employment opportunities through grid-connected decentralised RE projects and local manufacturing facilities
Policy focusMost of the initial policies were notified starting late 2012 and largely focused on decentralised RE such as rooftop solar solar irrigation pumps off-grid renewables and other RE resources such as bioenergy For example
bull Punjab New and Renewable Sources Policy 2012 focused on rooftop and decentralisedoff-grid generation waste to energy biomass-based cogeneration and new technologies
bull Uttar Pradeshrsquos solar policies of 2013 and 2017 focused on decentralised solar as well as large-scale grid-connected solar because of wastelands being available in the Bundelkhand region
bull Bihar Policy for Promotion of New and Renewable Energy Sources 2011 focused on biomass and biogas cogeneration projects minimicrosmall hydro wind and solar and municipal solid waste-based projects but with no specific targets
These statesrsquo policies promoted the local deployment of projects There was little emphasis on discoms buying wind and solar power from other states or buy RECs to meet solar and non-solar RPOs which were set relatively low as compared to RE-rich states This may be because the states were keen to attract investments and create jobs in their own states and bolster their own generation capacities rather than depending on other states
Even the recent policies of the RE-deficit states do not demonstrate any intent to purchase powerRECs to meet RPOs particularly the non-solar component
Performance of policiesAmong the RE-deficit states Uttar Pradesh and Punjab are leading in terms of solar deployment They are among the top 10 solar states in the country However their RPO compliance has remained weak In the year 2019ndash20 the compliance level for Uttar Pradesh was only 353 per cent whereas for Punjab it was 438 per cent (MoP 2020a) Uttar Pradesh discoms also rank among the least performing discoms of the country (ICRA Limited and CARE Ratings 2019)
Uttar Pradesh notified two solar policies ndash once in 2013 which was later superseded by a policy in 2017 The 2013 Solar Policy stated a target of 500 MW of solar capacity to be deployed
Policies in RE-deficit states promoted local project deployment with little emphasis on discoms buying wind and solar power from other states or RECs to meet RPOs
45Policy evolution in RE-deficit states
by 2017 This policy was the first of its kind because it had an exclusive budgetary allocation for discoms to procure solar power and for state nodal agencies to effectively administer and implement the policy The policy achieved 420 MW against the target of 500 MW by 2017 but presented some uncertainties such as
bull The duration of power purchase agreements was made 10 years as opposed to the usual practice of 25 years the possibility of extending PPAs beyond the 10-year duration at the prevailing APPC price did exist but this represented an uncertainty for developers
bull Strict enabling provisions for establishing solar parks were missing As a result developers reported delays due to the lack of grid infrastructure and difficulties in allotting ready land inside solar parks
The Uttar Pradesh New and Renewable Energy Development Agency (UPNEDA) initiated a competitive bidding round in March 2013 which led to the discovery of tariffs in the range of INR 801 to INR 933 per unit among the highest for any state during that time These high tariffs may be attributed to real and perceived risks specific to the policy as well as the legacy power sector issues in the state Later there were many instances when UPrsquos distribution companies renegotiated tariffs under the PPAs signed during 2015ndash16 This affected completed and under-construction grid-connected solar projects as well as the investor confidence in the sector
The UP Solar Power Policy 2017 set high targets ndash 10700 MW of installed solar capacity by 2022 out of which 6400 MW should be utility-scale projects Some improvements that were made included PPAs for 25 years facilitative provisions for land procurement additional incentives for projects in the Bundelkhand region and modalities for establishing solar parks Currently 973 MW of large-scale solar projects are in operation and about 17 GW capacity is under development (Ranjan 2020)
Recent tenders by UPNEDA have been cancelled or undersubscribed In July 2018 UPNEDA cancelled a 1 GW tender floated in January citing high tariffs Two tenders of 500 MW each in January and October 2019 were undersubscribed The reasons reported for under-subscription included inadequate gridevacuation infrastructure particularly in the Bundelkhand region and the changes made in the PPA
Punjab under its New and Renewable Sources of Energy (NRSE) Policy 2012 aimed to install 1000 MW solar by 2017 Till FY 2020 it had installed 947 MW (MNRE 2020) Although the policy emphasised installations within the state the potential for large-scale solar power in the state is limited Therefore Punjab has been procuring solar and wind power from ISTS-connected projects to meet its solar and non-solar RPO targets Punjab State Power Corporation Limited (PSPCL) signed long-term agreements with SECI and NTPC and has entered into short-term agreements with wind and solar generators for this purpose
The Bihar Policy for Promotion of New and Renewable Energy Sources 2011 was notified in June 2011 It did not state any specific targets for the segments covered The new policy in 2017 set a target of 2969 MW from solar by 2022 out of which 1000 MW was dedicated to grid-connected rooftop solar Even though this policy was notified in June 2017 it did not explicitly put out the intent to purchase solar and wind power through inter-state transactions or
45Policy evolution in RE-deficit states 45Policy evolution in RE-deficit states
In Uttar Pradesh competitive bidding in early years discovered tariffs that were higher compared to other states signalling the high risk perception amongst the industry
How Indiarsquos Solar and Wind Policies Enabled its Energy Transition A Decade in Review 46
Central procurement through SECI By December 2019 Bihar had installed 341 MW of RE capacity (CEA 2020a) out of which grid-connected solar was 149 MW and the rest was non-solar (small hydro biomass cogeneration etc) In FY 2018ndash19 Bihar discoms procured 10 MW solar and 300 MW wind power through SECIrsquos ISTS-connected projects19 In June 2019 the Bihar Renewable Energy Development Authority (BREDA) issued its first tender for setting up 250 MW of ground-mounted solar projects in the state which was re-issued in December 2019 because the state regulatory commission did not approve the high ceiling tariffs With these efforts however Biharrsquos RPO compliance at the end of March 2020 was 15 per cent with respect to Central trajectories (MoP 2020a)
Grid integrationThe initial policies by these states had some typical provisions regarding grid connectivity and transmission of power Like many other state policies on connectivity Uttar Pradeshrsquos solar power policies as well as Punjabrsquos RE Policy 2012 required developers to lay their own transmission lines to the nearest sub-station at their own cost However the UP government committed to bear all transmission-related expenditure for all solar projects in the Bundelkhand region Under Biharrsquos RE Policy 2017 the state government committed to bear connectivity-related expenditure only in cases where the RE plant is located within 10 km from the nearest sub-station
Transmission chargesPunjabrsquos 2012 policy accorded must-run status to grid-connected renewables and exempted transmission and wheeling charges for intra-state open-access sales for 10 years for RE projects commissioned up to 31 March 2017 No explicit exemptions were provided for inter-state open access unlike Uttar Pradesh which interestingly under its Solar Power Policy 2017 allowed the solar developer to sell power across the country with a 100 per cent waiver of transmission charges ndash a one of its kind provision among policies rolled out by RE-deficit states Biharrsquos RE Policy 2017 provided exemptions for wheeling of power from RE projects put up for captive use or intra-state third-party sales
Incentives for project development and operationsIt is interesting to note that some provisions in these policies were outstanding For example
Offtake and payments
bull Punjab required procurers to clear all payment dues within 60 days with rebate entitlements as incentives for early clearances
bull UP allocated budgetary support for the first 200 MW of solar projects to be payable to discoms to equalise solar and conventional power This support was equivalent to the difference between tariffs discovered for conventional power through case I bidding and the solar power tariffs discovered through reverse bidding
19 Order dated 20 March 2020 in Case No 30 2019 and 312019 issued by the BERC titled Tariff Order Truing up for FY 2018-19 Annual Performance Review for FY 2019-20 Annual Revenue Requirement (ARR) and determination of Retail Tariff for FY 2020-21 for North Bihar Distribution Company Limited (NBPDCL) and South Bihar Distribution Company Limited (SBPDCL) httpsberccoinorderstariffdistributionsbpdcl2216-tariff-order-of-nbpdcl-for-fy-2019-22
Uttar Pradesh under its Solar Power Policy 2017 allowed solar developers to sell power across the country with a 100 waiver of transmission charges
Ease of doing business investor attractiveness facilitation
bull Punjab assigned the Bureau of Investment Promotion the task of granting regulatory clearances and fiscal incentive approvals
bull Punjab extended benefits to RE projects under its Fiscal Incentives for Industrial Promotion Policy 2013 It also provided 50 to 100 per cent exemption on stamp duty property tax and electricity duty
bull Incentives under the Uttar Pradesh State Industrial Policy 2012 applied to power plants based on solar energy
bull All RE plants set up for commercial sale of power were eligible for an additional 30 per cent tax benefit on the approved project cost
bull Bihar established a Renewable Energy Development Fund under the new policy notified in 2017 This fund was supposed to be capitalised through
raquo a one-time facilitation fee of INR 100000 per MW payable during the application process for a project of more than one MW capacity
raquo a RE development cess of 10 paise per unit of power sold in the state by discoms (excluding below poverty line and agricultural consumers) subject to Bihar Electricity Regulatory Commissionrsquos (BERC) approval and
raquo a service charge of 7 per cent payable to BREDA for the execution of RE projects However this seems to be a proposal in the policy and is not executed in practice yet
47Policy evolution in RE-deficit states
How Indiarsquos Solar and Wind Policies Enabled its Energy Transition A Decade in Review 188
Image iStock
Discoms continue to be tied-up with long-term PPAs and most investors continue to base their business projections on Central and state bidding pipelines
49
With the evolving policy landscape at the Central and state level we have seen Indiarsquos renewable energy sector grow tremendously In 2010 the total installed RE capacity
was just about 18 GW which has grown almost five-fold over the decade
As our analysis suggests there were high and low points in this journey Every time a roadblock emerged India has been successful in testing and identifying alternate approaches and solutions Some of these include bundling solar power with conventional power to counter high tariffs in 2010 introducing solar parks when deployment became slow and tough increasing RPO targets to create the necessary demand creating and backing SECI to address counterparty risks accelerating tendering activity to signal a commitment to creating strong pipelines encouraging solarndashwind hybrid parks to improve utilisation factors introducing protocols and mechanisms such as market-based economic dispatch a real-time market and a green term ahead market to optimise grid integration costs With economics favouring RE its share in Indiarsquos electricity mix is only expected to grow
De-risking investments in project development has unquestionably been the focus of the policies thus far However policies have mostly not pre-empted any of the risks but developed through an iterative process that has mostly responded to immediate investor concerns Hence non-compliance with RPO targets by the states was met with centralising target setting and making them even higher the Centre responded to PPA renegotiation attempts by states with intra-se negotiations with the states and financial relief to the concerned states for addressing payment delays by discoms the Centre imposed additional financial liability on the discoms by way of the LC mechanism
Imminent market disruptions Further while CERC and the power exchanges have taken forward looking steps with introducing new market platforms there has yet been no attempt to create avenues for participation of greenbalancing power providers and buyers in these markets The discoms continue to be tied-up with long-term PPAs and most investors continue to base their business projections on Central and state bidding pipelines Other developments that threaten the investorsrsquo current business model include
bull Expectations of returns have increased since early 2019 that indicates that risk perceptions of investors have also increased (investors expect higher returns for riskier investments)
6 Looking back to look ahead
Recent developments threaten investorsrsquo current business models
How Indiarsquos Solar and Wind Policies Enabled its Energy Transition A Decade in Review
There are fewer developers who are cornering a greater share of the projects (Dutt Arboleya and Gonzalez 2020) This could mean that entry barriers to the sector are increasing and the incumbents will have a high stake in maintaining status quo Further the exit of many smaller players by selling their assets indicates that navigating Indiarsquos policy and governance environment remains a challenge (Chandra 2020)
bull Commercial and industrial consumers are increasingly turning to DRE to meet their power needs The MoP has recently floated a plan to create lsquoindustrial hubsrsquo that will have their own power supplier This power supplier is likely to be a private entity given the status of a deemed licensee under the EA (Jai 2020) Further calls for lowering commercial and industrial tariffs are becoming louder in the wake of economic downswing (Financial Express 2020) These developments threaten the principal source of revenue for the discoms and will have a cascading effect on ability of discoms to absorb RE power and invest in grid integration Poor revenues will worsen their ability make payments under the PPAs
bull The increasing competitiveness of DRE also makes them an important source of supply for the power markets Discoms are discovering benefits of economising on total power procurement costs by procuring power from the exchanges (Thomas 2020) If given the flexibility it is likely that discoms would prefer to expand exchange-based procurement rather than signing PPAs for all their projected load
bull The unexpected reduction in wind generation in 2020 by up to 43 per cent during the typical high generation period due to low wind speeds caught project developers and system operators by surprise (Singh and Mohanty 2020) Climate change could bring greater uncertainty and variation in weather patterns Project developers need to be better prepared with rigorous and advanced weatherresource forecasting and tools and techniques to make timely and robust investment and operational decisions
bull End of life waste management is going to be a serious concern very soon Developers might not have factored this into costs and current policies are unclear as to who will be required to bear these costs Developers must pre-emptively focus their attention to waste management and not be unpleasantly surprised when the government eventually wakes up to the challenges (Tyagi and Kuldeep Forthcoming)
Policies must pre-empt risks and support transition to a market-driven sector
We are now entering the next decade which could make India a RE powerhouse A target of 450 GW of RE by 2030 has been set However addressing new and legacy issues of the power sector cost-effectively managing the operations of existing assets while also integrating a large quantum of new renewable capacity are challenges that confront us today
Centrendashstate and inter-state alignment requires collaboration not mandates and penalties
Over the last three years RE costs have fallen significantly At the same time regulations allow the transmission of power from a RE-rich state to any other state in the country or the purchase of RECs for an entity to meet its RPO Despite all the obvious benefits that RE
50
It is likely that discoms would prefer to expand exchange-based procurement rather than signing PPAs for all their projected load
51Looking back to look ahead
resources have to offer states have shown some level of resistance to either deploying or buying more RE power and meeting the national targets We have seen above that states do push back when it does not make commercial sense for them or they are unable to allocate resources to meet national targets Policies so far have not resulted in alignment of Centre-state objectives and actions Further there is no institutional or political platform to bring together Centre and state representatives for collective problem solving The Centre has previously determined national capacity and consumption targets unilaterally without previous consultations and engagement It appears that the current policies and mechanisms must evolve if the gaps between RE-rich and RE-deficit states are to be bridged Some approaches to increase alignment may be
bull Account for all the costs benefits and co-benefits of achieving national targets Subsequently the principles of cost- and benefit-sharing must be established and reflected in Central policies inter-state regulations and market mechanisms to drive states towards meeting national goals and objectives An example of sharing costs may be that RE-deficit states support RE manufacturing industry and make it cost competitive globally This will create a buy-in for RE-deficit states in promoting and adopting RE
bull For long-term clarity directional uniform RPO targets can be set out for all states However states may be given the freedom to choose their own technologyclean energy mix to meet the national target
bull Institutional mechanisms may be devised that bring together the Centre and the states for resolution of issues and greater buy-in of the states towards national objectives
Addressing counterparty risks will require transformation of RE procurement models
While Indiarsquos commitment to RE is strong and sustained the consistent poor financial health of discoms poses significant risks to further growth of the sector These risks include delayed payments power curtailment and contract re-negotiation We have learnt from our policy experience so far that mandates and higher penalties have limited impact Project deployment has decreased despite the Centre taking strict and swift action against errant discoms Fundamental reforms in the distribution sector and market operations will be needed to mitigate these risks For example
bull Increasing the ability of discoms to access cheaper balancing resources
bull Rigorous demand forecasting to identify power purchase requirements under long-term contracts
bull Adopting alternate models such as solar power irrigation pumps or using distributed RE for meeting productive and consumptive loads in rural areas to reduce the subsidycost burden on discoms or urban micro-grids to manage peak loads (Tyagi Kuldeep and Dave 2020)
bull Adopting market-based procurement mechanisms for storage capacities including battery pumped storage hydro resources etc
bull Simplifying and rationalising retail tariff structures and adopting alternate subsidy disbursement mechanisms to ensure revenue recovery
Measures required to improve discom financial health and increase their flexibility in power procurement may not be aligned with the incumbent business models
How Indiarsquos Solar and Wind Policies Enabled its Energy Transition A Decade in Review 52
bull Encouraging enhanced participation in new mechanisms such as market-based economic dispatch of power plants real-time markets ancillary markets etc
However all these measures that are required to improve discom financial health and increase their flexibility in power procurement may not be aligned with the incumbent business models Investors and project developers must adapt to new market contours to stay relevant
Contrasting interests of RE manufacturers and developers must converge
Project developers have viewed policies that have aimed to support domestic manufacturing adversely or indifferently Developers preferred cheaper thin film modules when DCR was part of the NSM as against procuring locally manufactured crystalline modules Project activity slowed down when safeguard duty was introduced Developers have also been arguing against imposition of customs duties that is being demanded by manufacturers
However local manufacturing and backward and forward integration of not only generation equipment but also battery storage is essential for RE sector to be future ready and insure against geopolitical risks Lessons learnt from the COVID-19 pandemic and geopolitical tensions must be internalised Developers and manufacturers must collectively find solutions that work for them They can take cues from the initial days of spread of wind technology Wind technology in India spread through research and demonstration collaborations between countries Equipment manufacturers also expanded into project development that gave them a stake in project activity as well as manufacturing More integrated supply chains and linkages must be explored by developers and manufacturers
Institutional framework ndash planning coordination and analytical requirements
Strong institutions are prerequisites for better performance and coordination Developers must aim to work with both Central and state institutions to create data sharing and information protocols For example there is not enough data to detect reasons for curtailment As we aim to increase the share of RE in the electricity mix strong institutions with clear performance standards and a coordination mechanism are essential The functions roles and responsibilities of key power sector institutions need to evolve with national ambitions For example
bull Strict monitoring and reporting of RE curtailment and the underlying reasons
bull Data and information-sharing protocols and analytical requirements for specific institutions
bull Instituting processes for bottom-up integrated resource planning (IRP) to build an optimal and cost-effective electricity system This will include relevant Central level institutions to develop and disseminate guiding frameworks toolkits and processes that any state can utilise to conduct a robust planning exercise
bull Coordination mechanism to consistently monitor the implementation of policies programmes and plans by institutions
Such new roles and responsibilities must be formally assigned to institutions for reducing
Strong institutions with clear performance standards and a coordination mechanism are essential
53
discretion ensuring greater alignment between the Centre and states enhancing the ease of doing business reducing risks for investors and accelerating the pace of the energy transition
Accelerating the flow of capital into the sector
To achieve Indiarsquos ambitious RE targets for 2030 the country would need an additional investment of USD 199 billion (approximately INR 146 lakh crore) in generation alone Investments in transmission and storage will be over and above this (Singh Dutt and Sidhu 2020) Most of this requirement will need to be met through debt finance It is a challenge to raise such enormous amounts of debt capital when our financial institutions are already crossing the regulatory limits of exposure to the power sector As noted above the sector is seeing robust secondary market activity This has become a crucial source of finance for project developers who hive off operational assets to raise funds for fresh investment Investment trusts in infrastructure (InvIT) that have tax incentives may emerge to be an attractive model for divestment of assets especially for divestment to institutional investors who want predictable returns without managing the assets directly In the power sector transmission assets have been structured as InvITs and helped the promoter retain interest in the project while obtaining additional equity investment
Sectoral and financial policies would need to focus on tapping alternative sources of financing Research by the Council on Energy Environment and Water (CEEW) suggests that the issuance of domestic bonds for refinancing loans can unlock the ability of these institutions to lend to new RE projects According to the research this option may be operationalised by providing a limited period credit enhancement subsidy for domestic RE bond issuances
Looking back to look ahead
How Indiarsquos Solar and Wind Policies Enabled its Energy Transition A Decade in Review
Aggarwal Manu and Kanika Chawla 2019 Grid Integration Guarantee A Financial Buffer to Address Renewable Energy Curtailment New Delhi CEEW httpswwwceewinsitesdefaultfilesCEEW-Grid-Integration-Guarantee-17ul19pdf
Arora Bhanvi 2019 ldquoWhy Indiarsquos Wind Turbine Makers Are Under Stressrdquo Bloomberg Quint 22 August Accessed 12 October 2020 httpswwwbloombergquintcombusinesswhy-indias-wind-turbine-makers-are-under-stress
Balan Premal 2014 ldquoAptel Rejects GUVNLrsquos Bid to Cut Solar Power Tariff in Gujaratrdquo Business Standard 27 August Accessed 12 October 2020 httpswwwbusiness-standardcomarticlecurrent-affairsaptel-rejects-guvnl-s-bid-to-cut-solar-power-tariff-in-gujarat-114082700828_1html
Bhaskar Utpal 2020 ldquoHow Rewa solar park helped Indiarsquos green economy turn a cornerrdquo Mint 10 July Accessed 12 October 2020 httpswwwlivemintcomindustryenergyhow-rewa-solar-park-helped-india-s-green-economy-turn-a-corner-11594352166677html
Bridge to India 2017 ldquoIndian developers caught between a rock and a hard placerdquo 28 August Accessed 26 November 2020 httpbridgetoindiacomindian-developers-caught-rock-hard-place
Buckley Tim and Kashish Shah 2020 Indiarsquos Renewable Energy Policy Headwinds New Delhi IEEFA httpsieefaorgwp-contentuploads202002Indias-Renewable-Energy-Policy-Headwinds_February-2020pdf
CEA 2019a Growth of Electricity Sector in India From 1947-2019 New Delhi CEA MoP
CEA 2019b Summary of Solar and Wind Power projects (Commissioned and Under Construction) of SECI New Delhi Renewable Energy Project Monitoring Division (CEA) httpsceanicinreportsothersplanningrpmSECI20Project_Summarypdf
CEA 2020a All India Installed Capacity as on 31 December 2019 New Delhi CEA httpswwwceanicinreportsmonthlyinstalledcapacity2019installed_capacity-12pdf
CEA 2020b Executive Summary on Power Sector April 2020 New Delhi CEA httpsceanicinwp-contentuploads202006exe_summary-04pdf
CEA 2020c Report of Under Construction Renewable Energy Projects New Delhi Renewable Energy Project Monitoring Division (CEA) httpsceanicinreportsothersplanningrpmunderconstructionpdf
CERC 2018 Discussion Paper on Market Based Economic Dispatch of Electricity Re-designing of Day-ahead Market (DAM) in India New Delhi CERC httpwwwcercindgovin2018draft_regDP31pdf
Chandra Rohit 2020 ldquoCheering a Lap-win in an Unfinished Racerdquo Financial Express 1 December Accessed 1 December 2020 httpswwwfinancialexpresscomopinioncheering-a-lap-win-in-an-unfinished-race2140347
Chandrasekaran Kaavya 2017 ldquoMNRE asks Tamil Nadu to prevent curtailment of solar powerrdquo The Economic Times 9 October Accessed 12 October 2020 httpsmeconomictimescomindustryenergypowermnre-asks-tamil-nadu-to-prevent-curtailment-of-solar-powerarticleshow60997998cms
Chatterjee Anupam 2019 ldquoSolar Tenders Remain Hugely Undersubscribed mdash Herersquos What Caused Tepid Responserdquo Financial Express 4 December Accessed 28 November 2020 httpswwwfinancialexpresscomindustrysolar-tenders-remain-hugely-undersubscribed-heres-what-caused-tepid-response1783670
References
54
55
Chawla Kanika 2020 ldquoIndia-China tensions Will Indiarsquos Energy Transition be a Collateral Damagerdquo Financial Express 1 August Accessed 26 November 2020 httpswwwfinancialexpresscomopinionindia-china-tensions-will-indias-energy-transition-be-a-collateral-damage2041561
Atal Vinit and Gireesh Shrimali 2018 An Assessment of Indiarsquos Energy Choices Financial Performance and Risk Perception New Delhi CPI httpclimatepolicyinitiativeorgwp-contentuploads201805Financial-Performance-and-Risk-Perceptionpdf
CAG 2015 Report of the Comptroller and Auditor General of India on Renewable Energy Sector in India Report No 34 of 2015 New Delhi CAG httpscaggovinuploadsdownload_audit_report2015Union_Civil_Performance_Renewable_Energy_Report_34_2015pdf
CRISIL 2017 ldquoCompetitive Bidding Set to Transform Wind Power Marketrdquo May Accessed 28 November 2020 httpswwwcrisilcomcontentdamcrisilour-analysisviews-and-commentariesinsightsCRISIL-Research-Insights-Competitive-bidding-a-blow-for-wind-power-sector-may2017pdf
CSO Energy Statistics 2010 New Delhi MoSPI
CSO Energy Statistics 2012 New Delhi MoSPI
CSO Energy Statistics 2013 New Delhi MoSPI
CSO Energy Statistics 2014 New Delhi MoSPI
CSO Energy Statistics 2015 New Delhi MoSPI
CSO Energy Statistics 2016 New Delhi MoSPI
CSO Energy Statistics 2017 New Delhi MoSPI
CSO Energy Statistics 2018 New Delhi MoSPI
CSO Energy Statistics 2019 New Delhi MoSPI
CSO Energy Statistics 2020 New Delhi MoSPI
Deign Jason 2017 ldquoIndiarsquos Record-Low Wind and Solar Prices May Not Be Sustainablerdquo Greentech Media 25 September Accessed 26 November 2020 httpswwwgreentechmediacomarticlesreadindias-renewable-energy-auctions-may-not-be-sustainable
Deloitte and CII 2015 ldquoSolar Power in Karnataka Charting the Path for a Bright Futurerdquo Knowledge Paper for CII Karnataka Conference on Power July httpswww2deloittecomcontentdamDeloitteinDocumentsenergy-resourcesin-enr-solar-power-in-karnataka-noexppdf
Dutt Arjun Lucila Arboleya and and Pablo Gonzalez 2020 Clean Energy investment Trends Mapping Project Level Financial Performance Expectations in India New Delhi Paris CEEW and IEA httpscefceewinsolutions-factoryCEEW-CEF-clean-energy-investment-trends-2020pdf
Economic Times 2010 ldquoGujarat Takes the Lead Among States in Solar Powerrdquo The Economic Times 2 November Accessed 12 October 2020 httpseconomictimesindiatimescomspecial-featuregujarat-takes-the-lead-among-states-in-solar-powerarticleshow6855821cmsfrom=mdr
Economic Times 2019 ldquoPower Ministry order on LCs to Face Challenges India Ratingsrdquo Economic Times 18 July Accessed 26 November 2020 httpseconomictimesindiatimescomindustryenergypowerpower-ministry-order-on-lcs-to-face-challenges-india-ratingsarticleshow70279939cmsfrom=mdr
ETEnergyWorld 2020 ldquoGovt plans 20 GW capacity solar tenders till June 2021rdquo ETEnergyworldcom 18 March
References
How Indiarsquos Solar and Wind Policies Enabled its Energy Transition A Decade in Review 56
Accessed 12 October 2020 httpsenergyeconomictimesindiatimescomnewsrenewablegovt-plans-20-gw-capacity-solar-tenders-till-june-202174688993
Financial Express 2020 ldquoLower power tariff can boost Make in India after corona crisisrdquo Financial Express 8 May Accessed 29 November 2020 httpswwwfinancialexpresscomeconomylower-power-tariff-can-boost-make-in-india-after-corona-crisis1951679
Ganesan Karthik Poulami Choudhury Rajeev Palakshappa Rishabh Jain and Sanyukta Raje 2014 Assessing Green Industrial Policy ndash The India Experience New Delhi CEEW httpswwwiisdorggsisitesdefaultfilesrens_gip_indiapdf
Garg Vibhuti and Kashish Shah 2020 The Curious Case of Indiarsquos Discoms New Delhi IEEFA httpsieefaorgwp-contentuploads202008The-Curious-Case-of-Indias-Discoms_August-2020pdf
Garg Vibhuti Balasubramanian Viswanathan Danwant Narayanaswamy Christopher Beaton Karthik Ganesan Shruti Sharma and Richard Bridle 2020 Mapping Indiarsquos Energy Subsidies 2020 Fossil Fuels Renewables and Electric Vehicles Winnipeg IISD httpswwwiisdorgsystemfilespublicationsindia-energy-transition-2020pdf
ICRA Limited and CARE Ratings 2019 State Distribution Utilities Seventh Annual Integrated Rating New Delhi MoP httpspfcindiacomDocumentRepositoryckfinderfilesGoI_InitiativesAnnual_Integrated_Ratings_of_State_DISCOMs7th_Rating_Booklet_Final_13-10-2019pdf
Idam Infra 2016 Procurement of Wind Power Wind Vision India 2032 New Delhi Shakti Sustainable Energy Foundation httpsidaminfracomwp-contentuploads201607Wind-Vision-2032-A-Multi-Stakeholder-Perspectivepdf
IEA 2020 ldquoEvolution of Solar PV Module Cost by Data Source 1970-2020rdquo 30 June Accessed 28 November 2020 httpswwwieaorgdata-and-statisticschartsevolution-of-solar-pv-module-cost-by-data-source-1970-2020
India RE Navigator 2020 ldquoAuction Resultsrdquo Accessed 28 November 2020 httpsindia-re-navigatorcomwind
IRENA 2017 ldquoRenewable Energy Prospects for Indiardquo Working Paper Based on REmap May IRENA httpswwwirenaorg-mediaFilesIRENAAgencyPublication2017MayIRENA_REmap_India_paper_2017pdfla=enamphash=4B737628E6D1E4C7F04551C26B3C3F7EB768281A
IWTMF 2019 ldquoIndia - Wind Power Capacity Installations FY 2018-19rdquo Accessed 28 November 2020 httpsindianwindpowercompdfSTATE-WISE-MONTH-WISE-WIND-INSTALLATIONS-FY-2018-19pdf
Jai Shreya 2018 ldquo35 GW of Solar Tenders in Limbo Thanks to Tax and Regulatory Nigglesrdquo Business Standard 27 February Accessed 28 November 2020 httpswwwbusiness-standardcomarticleeconomy-policy3-5-gw-of-solar-tenders-in-limbo-owing-to-tax-and-regulatory-niggles-118022700346_1html
Jai Shreya 2020 ldquoGovt Plans Separate Electricity Distribution Channel for Industriesrdquo Business Standard 16 November Accessed 28 November 2020 httpswwwbusiness-standardcomarticleeconomy-policygovt-plans-separate-electricity-distribution-channel-for-industries-120111600018_1html
Jhawar Pratha 2020 ldquoRenewable Energy Curtailment is a Banerdquo Down to Earth 17 January Accessed 12 October 2020 httpswwwdowntoearthorginblogenergyrenewable-energy-curtailment-is-a-bane-68857
Jog Sanjay 2013 ldquoBanks Say PPA Structure for Solar Projects not Bankablerdquo Business Standard 20 January Accessed 12 October 2020 httpswwwbusiness-standardcomarticlefinancebanks-say-ppa-structure-for-solar-projects-not-bankable-110083100077_1html
Kapoor Karan Krishan K Pandey AKJain and Ashish Nandan 2014 ldquoEvolution of Solar Energy in India A Reviewrdquo Renewable and Sustainable Energy Reviews (40) 475-487 httpdxdoiorg101016jrser201407118
57References
Kumar Alok and Sushanta Chatterjee 2012 Electricity Sector in India Policy and Regulation New Delhi Oxford University Press
Kumarankandath Aruna 2015 ldquoWTO Rules Against Indiarsquos Domestic Content Requirements in Solar Powerrdquo Down to Earth 3 September Accessed 26 November 2020 httpswwwdowntoearthorginnewsenergywto-rules-against-india-s-domestic-content-requirements-in-solar-power-50977
MNRE 2017 Agenda Note for National Review Meeting of State Principal Secretaries and State Nodal Agencies of Renewable Energy on 23-24 January 2017 httpssolarrooftopgovinnotificationNotification-09012017pdf
MNRE 2019 Annual Report 2018ndash19 New Delhi MNRE httpsmnregovinimgdocumentsuploadsfile_f-1608040317211pdf
MNRE 2020a Annual Report 2019ndash20 New Delhi MNRE httpsmnregovinimgdocumentsuploadsfile_f-1597797108502pdf
MNRE 2020b Physical Progress Achievements Accessed 26 November 2020 httpsmnregovinthe-ministryphysical-progress
Mondal Debapriya 2016 ldquoWTO Ruling on Domestic Content Requirement in Solar A Blessing in Disguiserdquo ETEnergyWorld 26 September Accessed 26 November 2020 httpsenergyeconomictimesindiatimescomnewsrenewablewto-ruling-on-domestic-content-requirement-in-solar-a-blessing-in-disguise54527456
MoP 2010 Annual Report New Delhi MoP httpspowerminnicinsitesdefaultfilesuploadsAnnual_Report_2009-10_Englishpdf
MoP 2016 Guidelines for Long-term RPO Growth Trajectory of Renewable Purchase Obligations (RPOs) for Non-solar as well as Solar Order No 2332016-RampR New Delhi MoP 22 July httpswwwmahaurjacommedadatarporecreportsMoP20on20Long20term20RPO20trajectorypdf
MoP 2018 Long-term RPO Growth Trajectory of Renewable Purchase Obligations (RPOs) for Solar and Non-solar for a Period of Three Years ie 2019ndash20 to 2021ndash22 Order No 23032016ndashRampR New Delhi MoP 14 June httpspowerminnicinsitesdefaultfileswebformnoticesRPO_trajectory_2019-22_Order_dated_14_June_2018pdf
MoP 2019 Opening and Maintaining of Adequate Letter of Credit (LC) as Payment Security Mechanism under Power Purchase Agreements by Distribution Licensees Order No 23222019-RampR New Delhi MoP 28 June httpsmnregovinimgdocumentsuploadsbf4ce66944bd410bb39ef4cf60cbaa6apdf
MoP 2020a Agenda Background Conference of Power and Renewable Energy Ministers of States and UTs 3 July 2020 New Delhi 3 July
MoP 2020b Regarding MoP Order dated 28062019 regarding opening and maintaining of adequate Letter of Credit (LC) as Payment Security Mechanism under Power Purchase Agreements by Distribution Licensees Order No 23222019-RR New Delhi MoP 27 March httpspowerminnicinsitesdefaultfileswebformnoticesFinal_Clarification_to_the_orders_of_MoP_letter_dtd_06042020pdf
Naidu Katya 2013 ldquoSuzlon to Build Land Bankrdquo Business Standard 20 January Accessed 12 October 2020 httpswwwbusiness-standardcomarticlecompaniessuzlon-to-build-land-bank-111112900026_1html
Paliwal Ankur and Jonas Hamberg 2015 ldquoSolar Mission Phase II May Reign in Import of Thinfilmsrdquo Down to Earth 4 July Accessed 26 November 2020 httpswwwdowntoearthorginnewssolar-mission-phase-ii-may-reign-in-import-of-thinfilms-40130
Parikh Anjana 2020 ldquoPOSOCO to Examine Renewable Energy Curtailment Issue in Andhra Pradeshrdquo Mercom 5 February Accessed 26 November 2020 httpsmercomindiacomposoco-examine-renewable-energy-curtailment-issue-andhra-pradesh
How Indiarsquos Solar and Wind Policies Enabled its Energy Transition A Decade in Review 58
PEG 2018 Electricity Distribution Companies in India Preparing for an Uncertain Future Mumbai PEG httpswwwprayaspuneorgpegpublicationsitemdownload892_2d5b1ca58ed382a4ef554ba04f6515dchtml
PIB 2019 ldquo PM Modi addresses Climate Action Summitrdquo Accessed 28 November 2020 httpspibgovinPressReleasePageaspxPRID=1585979
POSOCO 2018 Renewable Energy Certificate Mechanism in India Key Learnings Data Analysis and Way Forward New Delhi POSOCO NLDC httpsposocoinwp-contentuploads201808REC_REPORT_17082018_fPRINTpdf
Prasad Nithin Thomas 2020 ldquoNew Solar Tariff Record of `2kWh Why Did it Go So Lowrdquo Mercom 27 November Accessed 28 November 2020 httpsmercomindiacomnew-solar-tariff-record
Raikar Nitin 2018 ldquoIndian Wind Industry Analytical Report - FY 2017ndash18rdquo Indian Wind Power 4 (1) 32-33 httpswwwindianwindpowercompdfIndian-Wind-Power-April-May-2018pdf
Ranjan Rakesh 2020 ldquoUttar Pradesh to Set Up 600 MW of Solar in a New Renewable Energy Parkrdquo Mercom 19 June Accessed 28 November 2020 httpsmercomindiacomuttar-pradesh-solar-renewable-energy-park
REC Registry of India 2020a ldquoMonth-wise RECs Reportrdquo REC Registry of India Accessed 30 November httpswwwrecregistryindianicinindexphppublicsrecs
REC Registry of India 2020b ldquoRegistered RE Generatorsrdquo REC Registry of India Accessed 30 November HYPERLINK ldquohttpswwwrecregistryindianicinindexphppublicsrecsrdquo httpswwwrecregistryindianicinindexphppublicsregistered_regens
Reuters 2020 ldquoAdani Green Energy Doesnrsquot Have a Guaranteed Buyer for $6 Billion Solar Project in Indiardquo ET Energy World 19 November Accessed 28 November 2020 httpsenergyeconomictimesindiatimescomnewsrenewableadani-green-energy-doesnt-have-a-guaranteed-buyer-for-6-billion-solar-project-in-india79298448
Saumy Prateek 2019 ldquoAfter Tamil Nadu NSEFI Writes to Karnataka About Solar Projects Facing Curtailmentrdquo Mercom 21 June Accessed 12 October 2020 httpsmercomindiacomnsefi-karnataka-solar-curtailment
Saumy Prateek 2017 ldquoPPAS for 1050 MW Wind Projects Signedrdquo Mercom 21 July Accessed 12 October 2020 httpsmercomindiacomppas-1050-mw-wind-projects-signed
Saurabh 2017 ldquoTamil Nadu India Issues 500 Megawatt Wind Energy Tenderrdquo Clean Technica 9 July Accessed 12 October 2020 httpscleantechnicacom20170709tamil-nadu-india-issues-500-megawatt-wind-energy-tender
SECI 2014 3rd Annual Report 2013ndash14 New Delhi SECI httpswwwsecicoinUploadFinacial637268670541938164pdf
SECI 2019 8th Annual Report 2018ndash19 New Delhi SECI httpsmnregovinimgdocumentsuploadsfile_f-1597797108502pdf
Seetharaman G and Kaavya Chandrasekaran 2019 ldquoGovernmentrsquos Solar Park Push is Running Into Land Acquisition and Transmission Challengesrdquo The Economic Times 28 April Accessed 12 October 2020 httpseconomictimesindiatimescomindustryenergypowergovernments-solar-park-push-is-running-into-land-acquisition-and-transmission-challengesarticleshow69074597cmsfrom=mdr
Sengupta Debjoy 2013 ldquoIndian Solar Market Forecasting a Better 2014 after a Lackluster Yearrdquo The Economic Times 20 November Accessed 12 October 2020 httpseconomictimesindiatimescomindustryenergypowerindian-solar-market-forecasting-a-better-2014-after-a-lackluster-yeararticleshow26101929cmsfrom=mdr
Shrimali Gireesh and Sunali Rohra 2012 ldquoIndiarsquos Solar Mission A Reviewrdquo Renewable and Sustainable Energy Reviews (16) 8 6317ndash6332 httpsdoiorg101016jrser201206018
59References
Singh Anoop 2010 ldquoEconomics Regulation and Implementation Strategy for Renewable Energy Certificates in Indiardquo In India Infrastructure Report 2010 edited by Development Finance Company and 3iNetwork 42-57 New Delhi Oxford University Press
Singh Hartek 2017 ldquoWhy Renewable Energy Evacuation Demands a Decisive Pushrdquo ET Energy World 26 December Accessed 12 October 2020 httpsenergyeconomictimesindiatimescomenergy-speakwhy-renewable-energy-evacuation-demands-a-decisive-push2774
Singh Sarita and Shashwat Mohanty 2020 ldquoWind Generation Falls Over 40 in July Initial Assessment Blames Low Wind Speedrdquo ETEnergyWorld 12 August Accessed 28 November 2020 httpsenergyeconomictimesindiatimescomnewsrenewablewind-generation-falls-over-40-in-july-initial-assessment-blames-low-wind-speed77496934
Singh Vaibhav Pratap Arjun Dutt and Gagan Sidhu 2020 RE-Financing Indiarsquos Energy Transition Limited Period Subsidised Credit Enhancement for Domestic RE Bond Issuances New Delhi CEEW
Sinha Amitesh 2020 ldquoIndiarsquos Ambition and Opportunities in Solar Manufacturingrdquo Presentation India PV Edge 2020 Virtual conference 6 October
Soman Abhinav Neil McCulloch Harsimran Kaur and Christopher Beaton 2019 Indiarsquos Energy Transition The Impact of the Goods and Services Tax on Solar Photovoltaic and Coal Power Costs New Delhi IISD
Srivastava Shobhit Surbhi Singhvi and Vinay Rustagi 2019 Forecasting amp Scheduling Regulations Gurugram Bridge to India httpsbridgetoindiacombackendwp-contentuploads202003Policy-brief-Executive-summarypdf
Stromsta Karl-Erik 2012 ldquoIndia may fine most PV projects for delays in messy start to NSMrdquo Recharge 21 February Accessed 12 October 2020 httpswwwrechargenewscomsolarindia-may-fine-most-pv-projects-for-delays-in-messy-start-to-nsm1-1-837485
Sud Tushar Rajneesh Sharma Radhika Sharma and Lucy Kitson 2015 Indiarsquos Accelerated Depreciation Policy for Wind Energy New Delhi IISD
Sustainability Outlook 2010 Negotiating Power Purchase Agreements for Solar Projects 28 July Accessed 12 October 2020 httpwwwsustainabilityoutlookincontentnegotiating-power-purchase-agreements-solar-projects~text=NVVN20has20proposed20a20tripartite20arrangement20for20purchaseand20Power20Purchase20Agreement20with20Solar20Power20Developers
Tenddulkar Suuhas 2019 ldquoGujarat Land Allocation Logjam Threatens Windrsquos Viabilityrdquo Wind Power Monthly 14 January Accessed 12 October 2020 httpswwwwindpowermonthlycomarticle1522808gujarat-land-allocation-logjam-threatens-winds-viability
TERI 2017 Addressing Land Issues for Utility Scale Renewable Energy Deployment in India New Delhi Shakti Sustainable Energy Foundation
The Hindu 2017 ldquoNew Solar Energy Target for Karnataka 6000 MW by 2021rdquo The Hindu 10 January Accessed 12 October 2020 httpswwwthehinducomnewscitiesbangaloreNew-solar-energy-target-for-Karnataka-6000-MW-by-2021article17018234ece
Thomas Tanya 2018 ldquoIndia May Not Reach 100GW Solar Power Target by 2022 Crisil Reportrdquo Mint 13 August Accessed 29 November 2020 httpswwwlivemintcomIndustryHEugjBRI2zsNDyVzB2E1kJIndia-may-not-reach-100GW-solar-power-target-by-2022-Crisilhtml
Thomas Tanya ldquoPower Utilities Turn to Cheaper Exchange Power as Prices Crashrdquo Mint 28 May Accessed 29 November 2020 httpswwwlivemintcomindustryenergypower-utilities-turn-to-cheaper-exchange-power-as-prices-crash-11590636539577html
How Indiarsquos Solar and Wind Policies Enabled its Energy Transition A Decade in Review 60
TN Energy Department 2012 Policy Note 2012-2013 Chennai Energy Department Government of Tamil Nadu httpscmstngovinsitesdefaultfilesdocumentsenergy_7pdf
TNN 2013 ldquoTNrsquos power utility rated worst among 4 southern statesrdquo Times of India 30 March Accessed 12 October 2020 httpstimesofindiaindiatimescomcitychennaiTNs-power-utility-rated-worst-among-4-southern-statesarticleshow19285688cms
Tongia Rahul Santosh Harish and Rahul Walawalkar 2018 Integrating Renewable Energy Into Indiarsquos Grid- Harder Than It Looks New Delhi Brookings India httpswwwbrookingseduwp-contentuploads201811Complexities-of-Integrating-RE-into-Indias-grid2pdf
Tyagi Akanksha and Neeraj Kuldeep Forthcoming Resource Management Strategies for India by Managing Solar PV Module Waste New Delhi CEEW
Tyagi Akanksha Neeraj Kuldeep and Aarushi Dave 2020 Are Urban Microgrids Economically Feasible A Study of Delhirsquos Discom and Consumer Perspectives for BYPL New Delhi CEEW httpswwwceewinsitesdefaultfilesCEEW-Are-urban-microgrids-economically-feassible-29Oct20pdf
William Praveen 2020 ldquoAmbiguities Under the GST Regime for Renewable Energy Sectorrdquo KPMG India Blog 30 January Accessed 12 October 2020 httpshomekpmginenblogshomeposts202001ambiguities-under-the-gst-regime-for-renewable-energy-sectorhtml
WTO 2016 DS456 India mdash Certain Measures Relating to Solar Cells and Solar Modules Accessed 26 November 2020 httpswwwwtoorgenglishtratop_edispu_ecases_eds456_ehtm
Judicial orders cited
Order dated 3 December 2019 issued by CERC in Petition No 340AT2019 titled PTC India Ltd v SECI and Ors httpwwwcercindgovin2019orders340-AT-2019pdf
Order dated 3 December 2009 issued by CERC in Petition No 2842009 titled Determination of Generic Levellised Generation Tariff httpwwwcercindgovin2009November09284ndash2009_final_3rdDecember09pdf
Order dated 15 May 2014 issued by CERC in Petition No SM3542013 (SuondashMotu) titled Determination of Generic Levellised Generation Tariff for the FY 2014ndash15 httpwwwcercindgovin2014ordersSO354pdf
Order dated 31 March 2015 issued by CERC in Petition No SM0042015(SuondashMotu) titled Determination of Generic Levellised Generation Tariff for the FY 2015 ndash 16 httpcercindgovin2015ordersso4pdf
Order dated 30 March 2016 issued by CERC in Petition No SM032016 (SuondashMotu) titled Determination of Levellised Generic Tariff for FY 2016ndash17 httpcercindgovin2016orderssm_3pdf
Order dated 11 August 2017 issued by the TNERC in TP No1 of 2017 titled Determination of Tariff for Generation and Distribution Accessed 25 October 2020 httpwwwtnercgovinordersTariff20Order2020092017TariffOrderTANGEDCOndash11ndash08ndash2017pdf
Order dated 27 March 2019 issued by the MERC in Case No36 of 2019 titled Case for Verification of Compliance of Renewable Purchase Obligation targets by Maharashtra State Electricity Distribution Co Ltd for FY 2017ndash18
Order dated 2 April 2019 issued by the MERC in Case No37 of 2019 titled Case for Verification of Compliance of Renewable Purchase Obligation targets by Brihanmumbai Electric Supply amp Transport Undertaking for FY 2017ndash18
Order dated 2 April 2019 issued by the MERC in Case No38 of 2019 titled Case for Verification of Compliance of Renewable Purchase Obligation targets by Tata Power Co Ltd (Distribution) for FY 2017ndash18
61Judicial orders cited
Order dated 4 April 2019 issued by the MERC in Case No39 of 2019 titled Case for Verification of Compliance of Renewable Purchase Obligation targets by Adani Electricity Mumbai Limited for FY 2017ndash18
Order dated 23 October 2017 issued by the PSERC titled Annual Revenue Requirement and Determination of Tariff for MYT Control Period from FY 2017ndash18 to FY 2019ndash20 and for True up of FY 2015ndash16 Accessed 25 October 2020 httppsercgovinpagesPSPCL-Tariff-Order-Vol-1-2017-18pdf
Order dated 19 April 2018 issued by the PSERC in Petition titled True up of FY 2016ndash17 Annual Performance Review (APR) for FY 2017ndash18 and Determining the Annual Revenue Requirement (ARR) for FY 2018ndash19 Accessed 25 October 2020 httppsercgovinpagesTariff20Order20PSPCL20for20FY202018-19pdf
Order dated 27 May 2019 issued by the PSERC in Petition No 02 of 2019 titled True up of FY 2017ndash2018 Annual Performance Review (APR) for FY 2018ndash19 approval of Revised Annual Revenue Requirement (ARR) and determination of Tariff for FY 2019ndash20 Accessed 25 October 2020 httppsercgovinpagesPSPCL-Tariff-Order-2019-20pdf
Order dated 25 February 2019 issued by the BERC in Case No 40 and 48 of 2018 and Case No 41 and 47 of 2018 titled Tariff Order for FY 2019ndash20 for NBPDCL and SBPDCL Accessed 25 October 2020 httpsberccoinorderstariffdistributionsbpdcl1965-tariff-order-of-sbpdcl-for-fy-2019-20
Order dated 24 March 2017 issued by the BERC in Case No 45 of 2016 titled Tariff Order for FY 2017-18 for NBPDCL Accessed 25 October 2020 httpsberccoinorderstariffdistributionnbpdcl1143-tariff-order-of-nbpdcl-for-fy-2017-18
Order dated 24 March 2017 issued by the BERC in Case No 46 of 2016 titled Tariff Order for FY 2017ndash18 for SBPDCL Accessed 25 October 2020 httpsberccoinorderstariffdistributionsbpdcl1142-tariff-order-of-sbpdcl-for-fy-2017-18
Order dated 21 March 2018 issued by the BERC in Case No 40 of 2017 titled Tariff Order for FY 2018ndash19 for NBPDCL Accessed 25 October 2020 httpsberccoinorderstariffdistributionnbpdcl1447-tariff-order-of-nbpdcl-for-fy-2018-19
Order dated 21 March 2018 issued by the BERC in Case No 41 of 2017 titled Tariff Order for FY 2018ndash19 for SBPDCL Accessed 25 October 2020 httpsberccoinorderstariffdistributionsbpdcl1444-tariff-order-of-sbpdcl-for-fy-2018-19
Order dated 1 June 2010 issued by the CERC in Petition No 992010 (Suo Motu) titled Determination of Forbearance and Floor Price for the REC Framework httpswwwrecregistryindianicinpdfREC_RegulationFinal_Order_on_Forbearnace_and_Floor_Price_for_RECpdf
Order dated 23 August 2011 issued by the CERC in Petition No 1422011 (Suo Motu) titled Determination of Forbearance and Floor Price for the REC Framework to be Applicable from 1st April 2012 httpswwwrecregistryindianicinpdfREC_RegulationOrder_on_Forbearnace__Floor_Price_23-8-2011pdf
Order dated 30 March 2017 issued by the CERC in Petition No 02SM2017 titled Determination of Forbearance and Floor Price for the REC Framework to be Applicable from 1st April 2017 httpswwwrecregistryindianicinpdfREC_RegulationCERC_Order_300317pdf
Order dated 17 June 2020 issued by the CERC in Petition No 05SM2020 titled Determination of Forbearance and Floor Price for the REC Framework httpswwwrecregistryindianicinpdfREC_Regulation5-SM-2020-finalpdf
Judgment dated 13 May 2015 issued by the Supreme Court of India in Civil Appeal No 4417 of 2015 titled Hindustan Zinc Limited v RERC ((2015)12SCC611) httpswwwrecregistryindianicinpdfREC_RegulationSupreme_Court_Judgement_regarding_RPO_Compliancepdf
Order dated 4 August 2015 issued by the GERC in suo motu Petition Nos 1307 of 2013 and 1312 of 2013 titled Suo-motu Proceedings in Petition Nos 1307 of 2013 and 1312 of 2013 in Pursuance of Honrsquoble APTEL Direction Contained in
How Indiarsquos Solar and Wind Policies Enabled its Energy Transition A Decade in Review
Order Dated 16042015 in Appeal Nos 258 of 2013 and 21 of 2014 and the Order Dated 14052015 in IA No 187 of 2015 Accessed 22 October 2020 httpswwwgercinorgwp-contentuploadsdocumenten_1438799511pdf
Order dated 4 April 2019 issued by the MERC in Case No 39 of 2019 titled Case for Verification of Compliance of Renewable Purchase Obligation Targets by Adani Electricity Mumbai Limited for FY 2017ndash18
Order dated 14 May 2018 issued by the KERC in matter no S032017 titled In the Matter of Revision of Wheeling and Banking Charges for Renewable Power Projects Accessed 22 October 2020 httpskredlinfoingeneralwheeling20and20banking20charges2014052017pdf
Order No 82020 dated 7 October 2020 issued by the TNERC titled Order on Procurement of Wind Power and Related Issues Accessed 22 October 2020 httpwwwtnercgovinordersTariff20Order2020092020WindOrder-2007-10-2020pdf
Order No 22020 dated 30 April 2020 issued by the GERC titled Tariff Framework for Procurement of Power by Distribution Licensees and Others from Wind Turbine Generators and Other Commercial Issues for the State of Gujarat Accessed 22 October 2020 httpswwwgetcogujaratcomgetco_newpagesfilesRNCREOrder20No220of20202020issued20by20GERC20pdf
Order dated 20 March 2020 in Case No 30 2019 and 312019 issued by the BERC titled Tariff Order Truing up for FY 2018-19 Annual Performance Review for FY 2019-20 Annual Revenue Requirement (ARR) and Determination of Retail Tariff for FY 2020-21 for North Bihar Distribution Company Limited (NBPDCL) and South Bihar Distribution Company Limited (SBPDCL) Accessed 22 October 2020 httpsberccoinorderstariffdistributionsbpdcl2216-tariff-order-of-nbpdcl-for-fy-2019-22
62
Unlocking the demand for RE and capitalising on the immense opportunity that it presents requires innovative solutions that account for legacy issues and yet are forward looking
Image iStock
How Indiarsquos Solar and Wind Policies Enabled its Energy Transition A Decade in Review
COUNCIL ON ENERGY ENVIRONMENT AND WATER (CEEW)
Sanskrit Bhawan A-10 Qutab Institutional AreaAruna Asaf Ali Marg New Delhi - 110067 IndiaT +91 (0) 11 4073 3300
infoceewin | ceewin | CEEWIndia | ceewindia

How Indiarsquos Solar and Wind Policies Enabled its Energy Transition A Decade in Review
Copyright copy 2021 Council on Energy Environment and Water (CEEW)
Open access Some rights reserved This work is licenced under the Creative Commons Attribution-
Non-commercial 40 International (CC BY-NC 40) licence To view the full licence visit www
creativecommonsorglicences by-nc40legalcode
Suggested citation Rao Harsha V and Disha Agarwal 2021 How Indiarsquos Solar and Wind Policies Enabled its Energy
Transition A Decade in Review New Delhi Council on Energy Environment and Water
Disclaimer The views expressed in this work are those of the authors and do not necessarily reflect the views and
policies of the Council on Energy Environment and Water
The viewsanalysis expressed in this report do not necessarily reflect the views of Shakti Sustainable
Energy Foundation The Foundation also does not guarantee the accuracy of any data included in this
publication nor does it accept any responsibility for the consequences of its use For private circulation
only
Cover images iStock
Peer reviewers Divyam Nagpal Programme Officer-Energy Access International Renewable Energy Agencyrsquos (IRENA)
Knowledge Policy and Finance Centre Paramita Sahoo Head - Policy Advocacy The Tata Power
Company Limited Pustav Joshi Climate Change Policy and Negotiations Lead UK Trade Economics and
Prosperity Foreign Commonwealth Office Government of UK Vibhuti Garg Energy Economist Institute
for Energy Economics and Financial Analysis (IEEFA) Deepak Sriram Krishnan Associate Director Energy
WRI India and Praveen Golash Senior General Manager Avaada Energy Pvt Ltd
Publication team Alina Sen (CEEW) The Clean Copy Twig Designs and Friends Digital
Acknowledgments The authors of this study would like to thank Shakti Sustainable Energy Foundation (SSEF) for their
support to carry out this study
We are obliged to the peer reviewers of this report who provided critical comments and inputs and
helped improve the draft substantially We thank Gandhar Ukidve and Sachin Zachariah both Research
Analysts at CEEW for their research inputs We are further grateful for the constant guidance and inputs
of Vaibhav Pratap Singh Senior Analyst CEEW-Centre for Energy Finance (CEEW-CEF) and Kanika
Chawla formerly Director CEEW-CEF And finally we thank Alina Sen and the Outreach team at CEEW for
the publishing and outreach of this study
Organisations The Council on Energy Environment and Water (CEEW) is one of Asiarsquos leading not-for-profit policy
research institutions The Council uses data integrated analysis and strategic outreach to explain ndash and
change ndash the use reuse and misuse of resources It prides itself on the independence of its high-quality
research develops partnerships with public and private institutions and engages with wider public In
2021 CEEW once again featured extensively across ten categories in the 2020 Global Go To Think Tank
Index Report The Council has also been consistently ranked among the worldrsquos top climate change think
tanks Follow us on Twitter CEEWIndia for the latest updates
Shakti Sustainable Energy Foundation seeks to facilitate Indiarsquos transition to a sustainable energy
future by aiding the design and implementation of policies in the following areas clean power energy
efficiency sustainable urban transport climate change mitigation and clean energy finance
Council on Energy Environment and Water Sanskrit Bhawan A-10 Qutab Institutional Area Aruna Asaf Ali Marg New Delhi - 110067 India
About CEEW
The Council on Energy Environment and Water (CEEW) is one of Asiarsquos leading not-for-profit policy research institutions The Council uses data integrated analysis and strategic outreach to explain mdash and change mdash the use reuse and misuse of resources The Council addresses pressing global challenges through an integrated and internationally focused approach It prides itself on the independence of its high-quality research develops partnerships with public and private institutions and engages with the wider public
The Councilrsquos illustrious Board comprises Mr Jamshyd Godrej (Chairperson) Mr Tarun Das Dr Anil Kakodkar Mr S Ramadorai Mr Montek Singh Ahluwalia Dr Naushad Forbes Ambassador Nengcha Lhouvum Mukhopadhaya and Dr Janmejaya Sinha The 100 plus executive team is led by Dr Arunabha Ghosh CEEW is certified as a Great Place To Workreg
In 2021 CEEW once again featured extensively across ten categories in the 2020 Global Go To Think Tank Index Report including being ranked as South Asiarsquos top think tank (15th globally) in our category for the eighth year in a row CEEW has also been ranked as South Asiarsquos top energy and resource policy think tank for the third year running It has consistently featured among the worldrsquos best managed and independent think tanks and twice among the worldrsquos 20 best climate think tanks In ten years of operations The Council has engaged in 278 research projects published 212 peer-reviewed books policy reports and papers created 100+ new databases or improved access to data advised governments around the world nearly 700 times promoted bilateral and multilateral initiatives on 80+ occasions and organised 350+ seminars and conferences In July 2019 Minister Dharmendra Pradhan and Dr Fatih Birol (IEA) launched the CEEW Centre for Energy Finance In August 2020 Powering Livelihoods mdash a CEEW and Villgro initiative for rural start-ups mdash was launched by Minister Mr Piyush Goyal Dr Rajiv Kumar (NITI Aayog) and HE Ms Damilola Ogunbiyi (SEforAll) The Councilrsquos major contributions include The 584-page National Water Resources Framework Study for Indiarsquos 12th Five Year Plan the first independent evaluation of the National Solar Mission Indiarsquos first report on global governance submitted to the National Security Adviser irrigation reform for Bihar the birth of the Clean Energy Access Network work for the PMO on accelerated targets for renewables power sector reforms environmental clearances Swachh Bharat pathbreaking work for the Paris Agreement the HFC deal the aviation emissions agreement and international climate technology cooperation the concept and strategy for the International Solar Alliance (ISA) the Common Risk Mitigation Mechanism (CRMM) critical minerals for Make in India modelling uncertainties across 200+ scenarios for Indiarsquos low-carbon pathways Indiarsquos largest multidimensional energy access survey (ACCESS) climate geoengineering governance circular economy of water and waste and the flagship event Energy Horizons It recently published Jobs Growth and Sustainability A New Social Contract for Indiarsquos Recovery
The Councilrsquos current initiatives include A go-to-market programme for decentralised renewable energy-powered livelihood appliances examining country-wide residential energy consumption patterns raising consumer engagement on power issues piloting business models for solar rooftop adoption developing a renewable energy project performance dashboard green hydrogen for industry decarbonisation state-level modelling for energy and climate policy reallocating water for faster economic growth creating a democratic demand for clean air raising consumer awareness on sustainable cooling and supporting Indiarsquos electric vehicle and battery ambitions It also analyses the energy transition in emerging economies including Indonesia South Africa Sri Lanka and Viet Nam
The Council has a footprint in 21 Indian states working extensively with state governments and grassroots NGOs It is supporting power sector reforms in Uttar Pradesh and Tamil Nadu scaling up solar-powered irrigation in Chhattisgarh supporting climate action plans in Gujarat and Madhya Pradesh evaluating community-based natural farming in Andhra Pradesh examining crop residue burning in Punjab and promoting solar rooftops in Delhi and Bihar
How Indiarsquos Solar and Wind Policies Enabled its Energy Transition A Decade in Review
Harsha V Rao harsharaoceewin
Harsha researches the legal and regulatory framework of the energy sector Before joining The Council she worked as a litigation lawyer in Delhi She has also worked with the project finance team of a leading law firm in India
Disha Agarwal dishaagarwalceewin
Disha co-manages The Councilrsquos Renewable Energy Programme She works on legislative policy and regulatory frameworks at the intersection of power and renewables She has experience in strategy development renewable energy policy and market analyses stakeholder management and collaborations grant-making and fund-raising Before joining The Council she was with Shakti Sustainable Energy Foundation leading programmes on renewables and climate policy during her tenure
The authors
ldquoRenewable energy already makes sense We should now take steps to deepen the market and make it more flexiblerdquo
ldquoIndia is set to become a renewable energy powerhouse over this decade This is when we need to adopt pathways to reducing the sectorrsquos reliance on policiesrdquo
How Indiarsquos Solar and Wind Policies Enabled its Energy Transition A Decade in Review
Image iStock
This study focuses on the evolving policies and risks in Indiarsquos utility-scale solar and wind energy sector and mitigating strategies used at various points in time
Contents
Executive summary
2 Evolution of Central policies
21 Pre-2010 ndash private-sector participation and prioritising renewables 22 Post-2010 policies for solar 23 Impact of other policies on project deployment 24 Solar Park Scheme 25 Post-2010 policies for wind 26 Policy assessment
3 Renewable purchase obligations ndash a regulatory mechanism for creating demand
31 Setting RPO targets 32 Compliance with RPO 33 Causes of under-achievement
4 Policy evolution in RE-rich states
41 Policies pre-2014 42 Policies post- 2014
5 Policy evolution in RE-deficit states
6 Looking back to look ahead
References
Judicial orders cited
1 Introduction
11 Methodology 12 Institutional framework
1
24
5
27
49
54
60
17
12
27
5
14
34
1918
43
81011
22
i
How Indiarsquos Solar and Wind Policies Enabled its Energy Transition A Decade in Review
Tables
Table ES1 Spheres of influence of the Centre and states
Table 1 The institutional structure of the power sector
Table 2 Evolution of central policies for utility-scale wind and solar energy ndash 2010ndash2019
Table 3 Snapshot of VGF schemes
Table 4 Indiarsquos progress towards 175 GW renewable energy by 2022
Table 5 MoP trajectory for RPO
Table 6 Resource-rich states are also the highest buyers of RECs
Table 7 REC floor prices and forbearance prices have consistently fallen
Table 8 Average size of a registered plant as of FY 2018
Table 9 Targets specified under policies and actual achievements
Table 10 2010ndash2014 Developments that held back RE deployment and associated risks that remained
Table 11 Timeline of the key events in the AP story
Table 12 Banking charges and conditions across RE-rich states
Figures
Figure ES1 Pace of capacity addition in wind and solar projects has slowed down
Figure ES2 Policy focus of the states
Figure ES3 Developments across project deployment and operations
Figure ES4 Lessons from policy evolution
Figure ES5 Varied and evolving challenges for RE growth
Figure ES6 Signals of disruption of the existing business models of investors
Figure 1 The rate of growth in solar and wind capacity addition is slowing down (2008ndash2020)
Figure 2 The pace of solar park development under the Central scheme has been slow (31 December 2019)
Figure 3 Competitive bidding in wind brought down the tariffs significantly
Figure 4 Compliance with RPOs is uneven among states and discoms
Figure 5 RECs consistently remain unsold in the market
Figure 6 The registration of new projects under the REC mechanism has reduced
Figure 7 RE resource potential is concentrated in western and southern India
Figure 8 Solar and wind capacity increased rapidly 2014 onwards
Figure 9 Average module (multicrystalline) prices have continiously declined (2011ndash2019)
Figure 10 Solar tariffs discovered in Indian auctions
Figure 11 Gujarat saw the largest wind capacity additions among the wind-rich states (2016ndash2020)
Figure 12 ISTS-connected solar PV projects have poor completion record
Figure 13 The rate of commissioning of wind projects has been slow (August 2020)
ii
4
678
10
14
19
22
23
24
2930
34
38
42
ii
iv
v
viii
vii
viii
2
12
13
20
21
23
27
31
35
36
37
38
39
Acronyms
AAPERC Andhra Pradesh Electricity Regulatory Commission
APPC average power purchase cost
APSPDCL Andhra Pradesh Southern Power Distribution Company Limited
AD accelerated depreciation
APTEL Appellate Tribunal of Electricity
BERC Bihar Electricity Regulatory Commission
BREDA Bihar Renewable Energy Development Authority
CAG Comptroller and Auditor General of India
CEA Central Electricity Authority
CERC Central Electricity Regulatory Commission
COVID-19 coronavirus disease 2019
CPP captive power plants
CST central sales tax
DCR domestic content requirement
DRE distributed renewable energy
EA Electricity Act 2003
FiT feed-in tariffs
FY financial year
GBI generation-based incentive
GERC Gujarat Electricity Regulatory Commission
GST goods and services tax
GUVNL Gujarat Urja Vikas Nigam Limited
GW giga watt
IEGC Indian Electricity Grid Code
INR Indian rupee
InSTS intra-state transmission system
IRP integrated resource planning
ISTS inter-state transmission system
KERC Karnataka Electricity Regulatory Commission
KPCL Karnataka Power Corporation Limited
KREDL Karnataka Renewable Energy Development Limited
LC letter of credit
LTA long-term access
MERC Maharashtra Electricity Regulatory Commission
MNRE Ministry of New and Renewable Energy
MoP Ministry of Power
MoSPI Ministry of Statistics and Programme Implementation
How Indiarsquos Solar and Wind Policies Enabled its Energy Transition A Decade in Review
MPERC Madhya Pradesh Electricity Regulatory Commission
MSEDCL Maharashtra State Electricity Distribution Company Limited
MW mega watt
MWh mega watt-hour
NAPCC National Action Plan on Climate Change
NLDC National Load Despatch Centre
NREDCAP New and Renewable Energy Development Corporation of AP Limited
NSM National Solar Mission
NTP National Tariff Policy
NVVN NTPC Vidyut Vyapar Nigam Limited
OampM operation and maintenance
OEMs original equipment manufacturers
PGCIL Power Grid Corporation of India Limited
PIB Press Information Bureau
POSOCO Power System Operation Corporation Limited
PPA power purchase agreement
PSA power sale agreement
PSERC Punjab State Electricity Regulatory Commission
PSM payment security mechanism
PSPCL Punjab State Power Corporation Limited
PV photovoltaic
RBI Reserve Bank of India
RE renewable energy
REC renewable energy certificate
RERC Rajasthan Electricity Regulatory Commission
RES renewable energy sources
RPO renewable purchase obligation
SECI Solar Energy Corporation of India Limited
SERC state electricity regulatory commission
STU state transmission utility
TOD time of day
TSERC Telangana State Electricity Regulatory Commission
TNERC Tamil Nadu Electricity Regulatory Commission
UPERC Uttar Pradesh Electricity Regulatory Commission
UPNEDA Uttar Pradesh New and Renewable Energy Development Agency
VAT value-added tax
VGF viability gap funding
WTO World Trade Organisation
Executive summary
In 2015 India announced ambitious targets for renewable energymdash175 GW by 2022mdashone of the largest expansion initiatives in the world Just four years later at the United
Nations Climate Action Summit 2019 the Prime Minister of India pledged to increase Indiarsquos renewable energy (RE) capacity to 450 GW by 2030 (PIB 2019) Indiarsquos journey to reaching these targets is at a critical juncture The pace of capacity addition in utility-scale wind and solar power which saw a rapid increase during 2014ndash2017 has since slowed down (Figure ES1)
Image iStock
i
How Indiarsquos Solar and Wind Policies Enabled its Energy Transition A Decade in Review
Figure ES1 Pace of capacity addition in wind and solar projects has slowed down
Source CEA 2019 Growth
of Electricity Sector in
India From 1947-2019
New Delhi CEA MoP
CEA 2020 All India
Installed Capacity as on 31
December 2019 New Delhi
CEA
Private investment has shaped deployment trajectories so far Today solar and wind technologies have advanced supply chains have strengthened and expertise has developed Despite the highs and lows investor confidence in Indiarsquos RE sector continues to remain robust Further many factors favour investments in RE It has proved itself to be resilient in times of crisis including the COVID-19 induced shocks in 2020 There are strong signals that RE is a preferred choice not just because of its green attributes but because of its favourable cost economics for all stakeholders
Evolving policies at the Central and state level have played a significant role in building investor confidence From our study of the evolution of the sector we learn that the initial policies were instrumental in propelling RE growth Every time a roadblock emerged India has been successful in testing and identifying alternate approaches and solutions Some of these innovative approaches include tariff bundling encouraging solar parks to benefit from economies of scale creating payment security mechanisms to address counterparty risks encouraging solarndashwind hybrid parks to improve utilisation factors testing and introducing protocols and mechanisms such as security constrained economic dispatch (SCED) a real-time market (RTM) market based economic dispatch (MBED) and a green term-ahead market (GTAM) to optimise grid integration costs etc However a mixture of legacy issues and recent developments threaten the current business models and existing policies may no longer be sufficient to ensure continued growth of the sector
Both the Central government and the state governments have different spheres of influence (Table ES1) affecting the power sector Hence both Central and state policies need to be studied to understand the functioning and evolution of the sector
Table ES1 Spheres of influence of the Centre and states
Source Authorsrsquo analysis
STATES
Set the broader policy direction for the electricity sector under the Electricity Act 2003 (EA)
Primary responsibility and control over the national grid Setting technical standards for the grid to be maintained by the states
Set bidding guidelines for power procurement
Set renewable purchase obligations (RPOs)
Operate with independence within the overarching framework set by the Centre
Directly influence land availability grid connectivity and build-out of intra-state transmission and distribution infrastructure Determine applicable charges to use infrastructure
Power procurement for supply to consumers
Set tariffs and cross-subsidy levels that affect end consumer and hence consumption of power
CENTRE
ii
Growth rate (wind) Growth rate (solar)
0 0
5000 10
10000 20Inst
alle
d c
apac
ity
(MW
)
Gro
wth
rat
e
1500030
2000040
2500050
3000060
35000
70
40000
80
90
2012-13 2013-14 2014-15 2015-16 2016-17 2017-18 2018-19 2019-20
Wind capacity Solar capacity
9
79
14
56
11
42
81 8276
1521
5 5
30
6
24
Note Figures for 2019-20 are only up to December 2019
iiiExecutive summary
Central policies kickstarting solar but leaving wind behindThe initial drivers for RE capacity addition were fiscal financial and tax incentives like accelerated depreciation generation-based incentives and feed-in tariffs (FiTs) determined by state commissions Wind turbine manufacturers were the first movers The de-licensing of generation under the Electricity Act 2003 (EA) set the stage for private investments in RE However the introduction of the National Solar Mission (NSM) in 2010 brought about a massive jump in solar capacity addition and turned the spotlight to utility-scale RE projects The NSM addressed offtake and payment risks with creditworthy trading intermediaries signing long-term power purchase agreements (PPAs) with project proponents The payment and offtake risks arose from the higher costs of solar power as opposed to prevailing conventional power tariffs and poor financial health of distribution companies or discoms (primary bulk procurers of power) The NSM progressed from a FiT regime to competitive bidding and was successful in increasing solar capacity deployment in the country from just 2 MW in 2007ndash08 to 3744 MW in 2014ndash15 (CEA 2019)
Competitive bidding also became mandatory for wind power from 2017 However it did not see the same level of success as solar While tariffs did come down the rate of growth of wind capacity also reduced (see Figure ES1) because the low tariffs disrupted the business model of existing players who were also equipment manufacturers The future trajectory of wind deployment remains to be seen with solar tariffs continuously falling and the evolution of the models adopted by independent RE power producers
Critical requirements that Central policies have not fully tackled are those of timely procurement of suitable land timely construction of evacuation and transmission facilities and minimising curtailment These are also the areas in which states have significant roles and authority The Ministry of New and Renewable Energy (MNRE) introduced the Solar Park Scheme in 2017 to address land-related issues and fast-track deployment through land aggregation and access to the Central transmission network However the schemersquos target of setting up at least 50 solar parks by 2022 is still distant (MNRE 2020) It has been unable to solve coordination issues and the ability of the Centre in developing schemes to address land issues is limited
Inadequate demand creation mechanisms
Initially in the absence of cost-competitive tariffs large buyers of power were mandated to purchase RE through renewable purchase obligations (RPO) under the National Tariff Policy 2006 in a bid to create demand for RE The EA authorises state regulators to set their own targets and regulations on RPOs In subsequent years the Ministry of Power (MoP) and the MNRE made multiple attempts to nudge states to set higher RPO targets and ensure strict compliance However our analysis shows that there have been considerable lags in both
How Indiarsquos Solar and Wind Policies Enabled its Energy Transition A Decade in Review iv
Figure ES2 State concerns that remain unaddressed in Central policies till 2014 and beyond
Source Authorsrsquo analysis
We find that the reasons for middling compliance with RPO targets are
bull Mismatch between the incentives for a RE-rich state to host an RE power plant and a RE-deficit state to buy either power or RE certificates (RECs) from these power plants This has resulted in RE-rich states having the highest compliance with RPOs while RE-deficit states do not see sufficient benefits or strict enforcement to be pushed to fully comply with their RPOs This has in turn affected the ability of even RE-rich states to increase their rates of deployment and RPO compliance
bull Enforcement mechanisms are weak A framework for regular monitoring of compliance is absent Enforcement of RPO by state regulators is not strict enough
Currently apart from setting up inter-state projects there are no other mechanisms to equitably share the costs of hosting RE projects to supply power to other states Further despite RE tariffs attaining grid parity investors continue to rely on RPOs for demand creation indicating deeper causes obstructing further RE penetration in markets Inadequate compliance of Central policies by states also point to certain legitimate state concerns that may not have been addressed (Figure ES2)
Centre and states have different drivers for promoting REWe also note that the main drivers for promoting RE are slightly different for the Centre and the states While the Centre initially emphasised energy security and climate change mitigation the states were keen to obtain the benefits of private investment and job creation It is only lately that the Centre has also emphasised the job creation and domestic manufacturing potential in RE
Most RE-deficit states are inclined to meet their RPO targets mostly through local deployment even if the local deployment is inadequate to meet the targets This is particularly true for solar which is a more abundant and widespread resource throughout the country State-level RPO regulations compliance provisions participation in REC markets and achievement levels demonstrate this However with stricter enforcement measures and falling tariffs the inter-state transmission system (ISTS) procurement of wind and solar power has seen a rise
Hosting RE plant attracts additional balancing costs This means states do not have incentive to host plants for self-consumption as well as export RE power unless directly connected to the central grid (partially addressed)
Severe financial stress on discoms leading to inability in spending towards compliance of RPOs or maintaining payment security (continues to be unaddressed)
Inadequate representation of state concerns before the Centre for policy making setting national objectives setting RPO targets etc (continues to be unaddressed)
Different drivers for the Centre and the states to incentivize RE
Energy security and climate change drives the Centre while investments job creation and resulting cost of system operation matter for the states (partially addressed)
vExecutive summary
Lack of enthusiasm of states in the high-tariff era
State-level institutions have the power and responsibility to ease land procurement for projects facilitate connectivity to the grid enable the construction of transmission infrastructure and ensure offtake of the power generated from the plants From our analysis of the RE policies of eight RE-rich states and three RE-deficit states we find that policies vary widely on these fronts (Figure ES3)
Pre-2014 when RE tariffs were still quite high the policies of even the RE-rich states did not provide a lot of support to private investors in the sector The responsibility of obtaining land was placed on the developers themselves Even though the states notified their own RE policies they did not meet their targets States like Gujarat and Rajasthan saw considerable capacity deployment under the NSM in this period owing to the easy availability of land and high wind and solar potential Charanka Solar Park in Gujarat set up in 2012 was successful in attracting investors This inspired the push towards establishing more solar parks in the country Because evacuation infrastructure was inadequate state policies required developers to finance and construct the required infrastructure at least till the interconnection point
Figure ES3 Developments across project deployment and operations
Source Authorsrsquo analysis
The RE-rich states covered are Andhra Pradesh Gujarat Karnataka Madhya Pradesh Maharashtra Rajasthan Tamil Nadu and Telangana and the RE-deficit states covered are Bihar Punjab and Uttar Pradesh
HIGH
TARIFF ERA
LOW
TARIFF ERA
RE-rich states
Responsibility on developers
Success of Charanka solar park inspired solar park policy
Developers required to construct evacuation infrastructure upto grid connection point
Feed-in-tariff
Procurement for use only within the state
High curtailment High curtailment
High curtailment
Older RE PPA renegotiations
Low utility-scale RE capacity Evacuation constraints visible in few instances
No policy focus
No policy focus
Feed-in-tariff
Decentralised power emphasised
Competitive bidding
Export of power outside the state begins to be promoted
Fewer new PPAs being signed
Competitive bidding
No focus on inter-state power purchase but procurement from central intermediaries has increased
Fewer new PPAs being signed
Solar parks and facilitation of land procurement
Land availability remains a concern especially for wind
States participating in Centre led transmission infrastructure development However progress is slow
Facilitation of land procurement by state agencies
However land availability remains a concern
No policy focus
RE-rich statesRE-deficit states RE-deficit states
LAND
GRID CONNECTION
POWER PROCUREMENT
MODE
PROJECT OPERATION
How Indiarsquos Solar and Wind Policies Enabled its Energy Transition A Decade in Review
However beyond the interconnection point transmission infrastructure continues to remain a challenge This coupled with the financial difficulties of the distribution utilities led to the severe curtailment of RE power The state policies only incentivised RE project development that supplies power to their own state discoms Some states like Maharashtra Karnataka and Andhra Pradesh even made it mandatory to sell electricity only to discoms within their borders and obligated entities within the state
Lowering tariffs corresponded with increased state promotion of RE but legacy issues came in the way The year 2014 marked the beginning of a significant departure from the past Many developments favoured the RE sector and Central and state policies found greater synergy As RE tariffs fell steeply states moved to incentivise large-scale projects including solar parks They sought to capitalise on investor interest in this sector and states like Andhra Pradesh extended the incentives available to other industry like land allotment facilitation of clearances tax incentives etc to RE power plants There was a shift in focus from setting up projects for self-consumption to supporting projects for the export of power to other states Rajasthan Maharashtra and Andhra Pradesh provided developers with incentives such as time bound open access approval facilitating land procurement exemption on charges etc for setting up inter-state projects States also turned their attention to facilitating deployment and many policies tasked their state agencies with facilitating revenue land procurement for the planned and systematic development of projects
However the PPAs signed in the high-tariff era have become a sore thumb for RE-rich states These agreements which were signed for 20ndash25 years must be honoured by discoms even though cheaper power is available States attempted to push back against these obligations as early as 2014 when Gujarat moved to renegotiate tariffs Andhra Pradesh made the most recent attempt in 2019 These moves by states have added to the set of risks to be mitigated In all these cases the states were ultimately unsuccessful in renegotiating tariffs as their actions were struck down in courts or due to interventions by the Central Government However states continue to employ other means like curtailment to reduce their obligations under expensive contracts Considering that the state bears these costs at the end we need a more equitable solution that can ensure a fair transition for all players without creating uncertainty for investors
In RE-deficit states state policies emphasised decentralised power as opposed to utility-scale projects Their primary drivers were the RPO targets and the potential for private investment For example Punjab and Bihar focused on ensuring payment security and ease of doing business in their states The existing policies of RE-deficit states do not exhibit intention to increase their inter-state purchase of RE for example they do not lay out any roadmap or explicit commitment of procuring power from any of the trading intermediaries like Solar Energy Corporation of India Limited (SECI) or from other states to meet their RPOs Any purchase made is unplanned and this prevents RE-rich states and intermediaries from accurately forecasting demand
Varied and evolving challenges have to be tackled to achieve 450 GW RE target by 2030The existing policies have resulted in tremendous outcomes though short of the targets we set for ourselves As we advance in our energy transition journey it is apt that we incorporate the policy lessons from the journey so far (Figure ES4)
vivivi
Indiarsquos electricity sector is grappling with issues both legacy and novel Legacy issues affecting discom financial health is an obstacle to further growth of the RE sector Further new market and technological advancements like storage and new trading platforms at the doorstep have the potential to bring economy and choice in power procurement and support the energy transition Growth pathways must hence emphasise market-based choices for generation technologies and market-driven procurement and dispatch of electricity
The inhibitions and counterproductive steps of the state governments like renegotiations of PPAs rolling back incentives etc are reflective of genuine operational and financial implications (Figure ES5) State actions show the evolving nature of challenges in RE deployment High tariffs were the initial roadblock which were then followed by infrastructural and operational challenges such as land availability transmission and grid integration issues and other legacy issues that soon became starkly visible
With an increasing share of RE in their energy mix RE-rich states have improved their capabilities to manage RE variability harness system flexibility and forecast and schedule demand and supply However grid integration continues to be a challenge There has been some push-and-pull between state regulators system operators and generators around bearing additional costs relating to forecasting scheduling and deviation settlement The contentions relate to the availability of forecasting methods formulae for penalties the status of aggregation error bands and permissible revisions Forecasting and scheduling add to the costs borne by host states
viiExecutive summary
Figure ES4 Policy lessons from the journey so far
Source Authorsrsquo analysis
NEED TO FACTOR IN DISRUPTIONS IN BUSINESS MODELSInvestment has flown into solar sector due to policy certainty and assurance of opportunities However business models are seeing signs of disruptions Land curtailment and payment risks must be addressed
NEED CENTRE-STATE ALIGNMENTJob creation and value addition are more important considerations for states Mandates and penalties have limited success in encouraging higher deployment in states Institutional mechanisms are required to increase alignment
NEED TO REVIEW WIND SECTORThe introduction of competitive bidding in the sector drove down tariffs but adversely affected the existing industry players in the sector Wind sector needs to be revived Land and resource variability are the most significant risks
NEED REALLOCATION OF COSTS AND BENEFITSThere is divergence between RE-rich and RE-deficient states in deployment and consumption of RE RE-rich states have higher RPO compliance rates We need to account for and allocate the costs benefits and co-benefits of achieving rational targets
NEED TO ALIGN MANUFACTURING AND POWER GENERATIONSingle-minded focus on tariff reduction adversely impacted solar manufacturing Going forward contrasting interests of RE manufacturers and developers must converge
NEED TO PREMPT RISKSPolicies respond to risks rather than anticipate them The interests of incumbents and the overall growth of the sector are no longer aligned Going forward policies need to recognise this reality
POLICY LESSONS
viiExecutive summary
How Indiarsquos Solar and Wind Policies Enabled its Energy Transition A Decade in Review
Policies must pre-empt risks and support transition to a market-driven sectorGoing forward policy decisions must enable the overall growth of the sector rather than target scale through incumbent models The incumbent business models and market mechanisms are at the cusp of disruptions caused due to natural market progression technological advancement and discomsrsquo responses in meeting their challenges (Figure ES6)
Figure ES6 Signals of disruption to the existing business models of investors
Source Authorsrsquo analysis
Figure ES5 Operational and financial challenges in increasing RErsquos share in the energy mix
Source Authorsrsquo analysis
Managing intermittency through forecasting scheduling etc
Land and infrastructure availability and cost
RE growth
Cost-benefit allocation between RE-rich and RE-poor states
Transmission network availability access and cost
Legacy issues expensive PPAs fixed cost payment etc
viiiviiiviii
Distance between our targets and distribution companiesrsquo capacity to offtake eg SECI unable to find buyers This affects growth potential of project developers
Increased adoption of distributed RE including rooftop solar by commercial and industrial players will lead to discoms losing out on high paying consumers further affecting finances
Impact of storage technologies on discom procurement Storage can help manage intermittency and reduce power procurement needs of discoms
Increase in additional costs that developers need to factor in to promote manufacturing RE-waste management managing RE variability etc
States pushing back on their obligations eg Andhra Pradesh attempting to renegotiate contracts This affects financials of existing projects and risk perception for new projects
Changing profile of investors ndash higher returns expectations market consolidation and exit of smaller players Only a few players currently occupy the field with the exit of smaller entities
Developments like MBED RTM GTAM etc show that electricity markets are transitioning towards more short-term and flexible markets Current model of long-term agreements will be unsustainable
Unlocking the demand for RE and capitalising on the immense opportunity that it presents requires innovative solutions that account for legacy issues and yet are forward looking The policies must anticipate these changes and prepare for them while investors need to hedge their bets and modify ways of doing business to continue to lead the energy transition
We recommend the following changes to the policy framework These are based on policy lessons from the study of the sectorrsquos evolution and anticipate the power sector transition that is upon us
bull Centrendashstate and inter-state alignment is essential Collaboration and coordination need to be prioritised instead of mandates and penalties Costs and benefits for all actors must be clearly accounted for An institutional framework must be created that increases Centrendashstate and intrandashstate coordination cooperation and engagement Resource planning budgetary allocations and policy priorities should be outcomes of these formalised processes
bull Institutional framework must build in planning coordination and analytical requirements Data collection management and analysis should be systematic Monitoring and reporting practices should be robust and continuous
bull Addressing counterparty risks will require transformation of RE procurement models Market mechanisms allow for the cost recovery and benefit sharing Capacity deployment must happen based on market mechanisms and market determined price signals PPA terms must reduce and sole priority in power procurement should be efficiency and flexibility for discoms Power procurement as a mechanism to support RE or any future technology will not be sustainable in India till discom finances are sorted out
bull Contrasting interests of RE manufacturers and developers must converge Supply chains must be diverse and resilient to shocks Investors must innovate and policy must support backward and forward integration in RE supply chains
bull Accelerating the flow of capital into the sector requires new investment models that can tap into diverse sources of finance and simultaneously enable the transition of the energy markets
ixExecutive summary ixExecutive summary ixExecutive summary
How Indiarsquos Solar and Wind Policies Enabled its Energy Transition A Decade in Review
Image iStock
Between 2016 and 2018 solar capacity in RE-rich states tripled recording a consecutive year-on-year growth rate of more than 70 per cent
From approximately 21 GW of utility-scale solar and wind capacity at the end of financial year (FY) 2012 (1 GW solar and 20 GW wind) India achieved 70 GW capacity by 31
September 2020 (32 GW ground-mounted solar and 38 GW wind) (MNRE 2020b) This growth story is undoubtedly remarkable Solar and wind energy have also proved to be resilient in times of crisis including during the COVID-19 pandemic in 2020 and have continued to attract investment and attention from policymakers
However the story of Indiarsquos solar and wind power generation is at a critical juncture The rate of growth of capacity addition has been slowing down (see Figure 1) Indiarsquos path to reaching an installed capacity of 160 GW by 2022 (100 GW for solar and 60 GW for wind) and 450 GW by 2030 is hindered by complex challenges They arise from the precarious financial health of distribution companies (discoms) (Garg and Shah 2020) the investment required to build associated infrastructure the dynamics of increasing market penetration of renewable energy (RE) while making fixed cost payments for thermal projects (PEG 2018) direct and indirect energy subsidies in favour of conventional fuels1 and difficulties in balancing the priorities of the Centre and states (Tongia Harish and Walawalkar 2018) Some of these challenges are not new especially the discom crisis and those of inadequate infrastructure However their impact on the growth of RE is significant For instance discoms are finding it challenging to continue to pay fixed costs for thermal assets while complying with the must-run status of RE Forecasting and scheduling are now critical for the integration of variable RE power with the grid These challenges in consuming the power generated from RE plants dissuades discoms from increasing their RE portfolio and hampers revenue from operating assets and further capacity addition These issues must be addressed on a priority basis to scale up RE capacity deployment and utilisation levels New technologies like storage new market platforms and a growing realisation of the benefits of decentralising power generation also have the potential to impact the utility-scale sector in new and unexpected ways
1 Introduction
1
1 These subsidies include oil and gas subsidies and coal subsidies by way of concessional taxes non-compliance or non-enforcement of pollution regulations direct benefit transfers on consumption public distribution at subsidised rates etc (Garg Viswanathan et al 2020)
Storage new market platforms and a realisation of the benefits of decentralising power generation have the potential to impact the utility-scale sector in new and unexpected ways
How Indiarsquos Solar and Wind Policies Enabled its Energy Transition A Decade in Review 2
Figure 1 The rate of growth in solar and wind capacity addition is slowing down (2008ndash2020)
Source CEA 2019 Growth of Electricity Sector in India From 1947-2019 New Delhi CEA MoP CEA 2020 All India Installed Capacity as on 31 December 2019 New Delhi CEA
Before we embark on a policy analysis to determine the best tools to address the above challenges we look back and study the sectorrsquos evolution and evaluate the policiesrsquo impact on RE As RE growth slows and faces newer challenges it is the right time to conduct such an analysis Such an exercise will enable us to understand what are the gaps in the existing policies that need to be mended to adapt to the changing dynamics and yet achieve our objectives The legislative architecture along with a diversity of stakeholders and their objectives and interests makes power sector policymaking and governance a complex space Therefore policy evaluation can be done through multiple lenses This study focuses on the evolving risks for project developers in the bulk RE procurement market and the policy response of the Centre and states to those risks
We focus on the bulk power procurement market because RE growth has been led by utility-scale wind and solar energy projects over this decade with discoms being the largest power purchasers2 While there are dedicated schemes and programmes for the scaling up of other renewable energy sources as well as for distributed RE (DRE) they are of a different nature than those of utility-scale RE since they operate at a more decentralised level3 Further the levels of risk and the challenges facing private investors are markedly different for utility-scale solar and wind on the one hand and distributed and other RE resources on the other However we will briefly discuss the impact of growth of DRE on utility-scale RE in our last section
11 MethodologyWe collated all Central and state policy documents from 2009ndash2019 We then created a comprehensive framework to review each Central and state policy For each policy we recorded the key drivers stated purpose and objectives targets key features and incentives provided budgetary outlays (if any) institutional arrangements beneficiaries stated reasons for amendments and risks that the policy intended to mitigate For Central policies we also identified the role required of the state governments The framework helped us examine the
2 Though the rooftop industry continues to mature with multiple market players innovative business models and new financing structures
3 This is a consequence of the failure to establish competitive markets for RE even though it is among the aims of the Electricity Act 2003 (EA) The gap in the official data which does not capture captive power projects demonstrates this failure
Wind capacity (in MW) Solar capacity (in MW)
0
5000
10000 76679344
1064712807
1689718485
2104323354
26777
3562637746
3404632280
2 2 6 32 941 1686 26323744
6763
21651
28181 34812
1228915000
20000
25000
30000
35000
40000
200
7-0
8
200
8-0
9
200
9-10
2010
-11
Year
Cap
acit
y (in
MW
)
2011
-12
2012
-13
2013
-14
2019
-20
2018
-19
2017
-18
2016
-17
2015
-16
2014
-15
2
This study focuses on the evolving risks for project developers in the bulk RE procurement market and the policy response of the Centre and states to those risks
3Introduction
alignment between Central and state objectives and targets and inconsistencies between and within the policies The key features of the policies we studied are set out in Tables A4ndashA6 of the Annexure We also conducted extensive secondary research to assess the actual performance of these policies actions and developments on the ground and the risks that they addressed
Our study contributes to policy research as it combines a national-level analysis with a close examination of the policies and their impacts at the state level RE resources are not uniformly spread across the country and some states have performed better than others We cover the following RE-rich and RE-poor states in this study
Solar and wind-rich states
bull Andhra Pradesh
bull Gujarat
bull Karnataka
bull Madhya Pradesh
bull Maharashtra
bull Rajasthan
bull Tamil Nadu
bull Telangana
Solar and wind-deficit states
bull Bihar
bull Punjab
bull Uttar Pradesh
The RE-rich states are the top eight in terms of resource potential and capacity addition in wind or solar power or both For the RE-poor areas we have picked states that are not only deficit in solar and wind but also lack alternative power sources like hydro or coal though they have biomass-based power capacity In all these states the power supply position access to energy and power sector infrastructure have evolved over the last decade
In this report we begin by briefly mapping out the institutional framework of the power sector to understand the different agencies that implement andor hinder the implementation of these policies We then trace the evolution of the Central policies which largely focus on supply-side risks Next we evaluate the demand-side measure renewable purchase obligations (RPOs) Subsequently we trace the key drivers and policy focus and evaluate policy performance first in the RE-rich states and then in the RE-deficit states For the state-level analysis we divide our assessment into policies pre- and post-2014 since 2014 marked a departure from the previous years in policymaking activity and its consequences We assess the policies based on the risks they were successful in addressing the risks that they left unaddressed and how they measure up to the next generation of challenges We conclude by pointing to the points of transformation of the sector and the nature of required policy focus going forward
We assess the policies based their success in addressing risks the risks they left unaddressed and how they measure up to the next generation of challenges
How Indiarsquos Solar and Wind Policies Enabled its Energy Transition A Decade in Review
12 Institutional framework The long history of policymaking in the power and RE sector has led to a proliferation of agencies and bodies (see Table 1) The legislative architecture under the Electricity Act 2003 (EA) allows states to autonomously undertake activities such as target-setting framing and enforcing regulations developing and implementing policy and setting up institutional mechanisms
However the Central Government sets the policy direction through its National Electricity Policy the National Tariff Policy and the National Electricity Plan which the state governments and regulators are required to follow These policy documents cover electricity planning project bidding and procurement tariff structures RPOs and optimum utilisation of resources and infrastructure
The Central Electricity Regulatory Commission (CERC) and state electricity regulatory commissions (SERCs) have parallel jurisdictions and functions with respect to promoting the generation of RE tariff determination and dispute resolution Typically CERC does not have the authority to provide policy guidance or issue directions to the SERCs However SERCs are bound by the technical rules guidelines and standards set by the CERC in the Indian Electricity Grid Code (IEGC) based on which they prepare their own state grid codes
Table 1 The institutional structure of the power sector
Source Authorsrsquo analysis
Regional and State Union Territory level
Central
Ministries
Statutory autonomous bodies
Regulators
Operating entities
Ministry of Power (MoP)ndashNodal ministry for the power sector Prepares the National Electricity Policy the National Tariff Policy and the National Electricity Plan
Ministry of New and Renewable Energy (MNRE)ndash Nodal ministry for increasing RE deployment in the country
Central Electricity Authority (CEA)
National Load Dispatch Centre (NLDC)
Bureau of Energy Efficiency (BEE)
Power Financial Corporation (PFC) REC Limited Indian Renewable Energy Development Agency (IREDA)ndash Provide financing and implement schemes for RE projects
National Institute of Wind Energy (NIWE) National Institute of Solar Energy (NISE) Central Power Research Institute (CPRI) etcndash Research and development institutes to estimate RE potential in the country and evaluate the latest technologies in power generation
Central Electricity Regulatory Commission (CERC)ndash Tariff determination dispute resolution preparing the Grid Code and Supply Code (to be followed by the operating entities) promote RE etc
Appellate Tribunal for Electricity (APTEL)ndash Appellate body for dispute resolution
Generation utilities eg NTPC NHPC Damodar Valley Corporation (DVC)
Transmission utilityndash Power Grid Corporation of India Limited (PGCIL)
Independent power producersndash projects connected to the Central grid
TradingMarket entitiesndash NTPC Vidyut Vyapar Nigam (NVVN) Solar Energy Corporation of India (SECI) etc
Relevant energy departments and ministries of the states union territories (UT)
Regional Load Dispatch Centres (RLDC)
Regional Power Committees
State Load Dispatch Centres (SLDC)
state nodal agencies (SNAs)ndash implement RE schemes and oversee RE deployment at the state
State Electricity Regulatory Commissions (SERC) and Joint Electricity Regulatory Commissions ( JERC)ndashTariff determination dispute resolution preparing the grid code and supply code (to be followed by the operating entities) promote RE etc
Generation utilitiesndash state-owned generators
Transmission utilities
Distribution utilities
Independent power producersndash projects connected to state grids
Tradingmarket entities
4
The trajectories of wind and solar have been varied yet have affected each other Often similar policies have had widely varying impact on wind and solar This section briefly
describes the policy scenario pre-2010 and then narrates the policy evolution in the last decade (See Table 2 for brief description of the policies) The section concludes with the assessment and lessons from this journey
21 Pre-2010 ndash private-sector participation and prioritising renewables The initial drivers for new and renewable energy were the successive oil crises in the 1980s that compelled the government to reduce the countryrsquos dependence on imported oil and focus on alternative sources of power RE was also one of the strategies to combat climate change
2 Evolution of Central policies
Image iStock
5
How Indiarsquos Solar and Wind Policies Enabled its Energy Transition A Decade in Review
The government has made accelerated depreciation (AD) of 100 per cent available for both wind and solar power generation since 1994 to incentivise RE capacity deployment
The enactment of the EA also intended to transform the state-controlled electricity sector into a competitive electricity market with private players regulated by the state (Kumar and Chatterjee 2012) Promoting environmentally benign policies is a stated objective of the EA and it envisages renewable sources of energy as a significant contributor to the electricity mix The de-licensing of electricity generation under the EA and the mandating of power procurement through competitive bidding under the National Tariff Policy 2006 (NTP 2006) were game-changing reforms towards increasing private-sector investments in power generation The NTP 2006 permitted discoms to procure RE at tariffs fixed by their respective SERCs also called feed-in tariffs (FiTs)4 The SERCs determined the FiTs based on their tariff determination regulations Central regulations in turn guided these regulations The CERC notified the first guidelines for tariff determination in 2009 [(CERC (Terms and Conditions for Tariff Determination from Renewable Energy Sources) Regulations 2009) (Tariff Determination Regulations)] The first generic tariff order determined utility-scale solar PV tariff of INR 1844 and wind power tariffs of INR 563 490 417 and 375 (for Wind Zones 1 2 3 and 4 respectively)5
The policiesrsquo cumulative effect was that by 2010 RE accounted for 97 per cent of the available installed power generation capacity in the country (MoP 2010) This capacity was mainly wind energy and bagasse-based cogeneration6 Successful demonstration projects led by the ministry and collaborations with global technology providers were key triggers of establishment of domestic manufacturing and supply chain in India (Ganesan et al 2014) The AD incentive was particularly useful for private entities who set up distributed and small-scale wind turbines to avail of it This domestic demand also supported development of wind manufacturing capacity in India (Sud 2015 Idam Infra 2016)
Solar power however was lagging Despite the available incentives there were no immediate responses from investors developers and most state governments primarily due to high technology costs Till March 2010 solar capacity remained at 6 MW Subsequently significant policy actions leading to cost reductions and investment commitments marked an upward growth trajectory (see Figure 1)
Table 2 Evolution of Central policies for utility-scale wind and solar energy ndash 2010ndash2019
Source Authorsrsquo analysis
Risks and barriers targeted to be mitigated benefits TechnologyPolicyscheme
Promotion of RE competitive bidding and RPO in National Tariff Policy 2006
National Solar Mission 2010
National Action Plan on Climate Change 2008
Wind
Solar
Creating demand for expensive RE power through RPOs
Policy certainty and continued government support for promotion of RE
Managing offtake risk by signing long-term power purchase agreements (PPA) and providing payment security
Policy certainty and continued government support for promotion of RE
Creating demand for expensive RE power through RPOs
Policy certainty and continued government support for promotion of RE
4 This flexibility was required because RE tariffs at this time could not be compared to those of conventional power However the NTP 2006 also noted that RE power would eventually have to compete with power from other sources at their full cost
5 Order dated 3 December 2009 issued by CERC in Petition No 2842009 titled Determination of Generic Levellised Generation Tariff httpwwwcercindgovin2009November09284-2009_final_3rdDecember09pdf
6 Due to its economic co-benefits bagasse-based cogeneration developed mostly in the sugar producing regions of India
6
Table 2 contdRisks and barriers targeted to be mitigated benefits
TechnologyPolicyScheme
GBI for grid interactive wind power projects 2009 and 2013
NSM Phase II Batch I 2013 (VGF Scheme)
Scheme for solar park development 2014
National Tariff Policy 2016
Commencement of competitive bidding in wind 2016
MNRErsquos policy for re-powering wind projects 2016
Financial incentives for setting up wind power projects
Managing offtake risk by signing long-term PPAs and providing payment security
Low tariffs for discoms through competitive bidding
Financial support for project developers
Delay and roadblocks in land identification aggregation and acquisition
Delays in obtaining approvals and clearances
Risk of conflict with environment or social impact assessment
Lowering cost of supporting infrastructure and services
Creating demand for RE by setting common national trajectory for RErsquos share in consumption
Managing offtake risk by signing long-term PPAs and providing payment security
Low tariffs for discoms through competitive bidding
Support to utilize wind resources efficiently
NSM Phase I Batch II (Bundling scheme) 2011
Green Energy Corridor project 2013
NSM Phase II Batch III 2015
NSM Phase II Batch IV (State specific VGF scheme) 2016
MoPrsquos order on waiver of inter-state transmission charges and losses 2016
Competitive bidding guidelines for solar 2017
Managing offtake risk by signing long-term PPAs and providing payment security
Lowering tariff for discoms by bundling thermal and solar power
Addressing transmission risk and offtake risk by reducing congestion on grid
Managing offtake risk by signing long-term PPAs and providing payment security
Low tariffs for discoms through competitive bidding
Managing offtake risk by signing long-term PPAs and providing payment security
Low tariffs for discoms through competitive bidding
Financial support for project developers
Financial incentive for export of power outside the state
Managing offtake risk by signing long-term PPAs and providing payment security
Low tariffs for discoms through competitive bidding
Must-run status in Grid Code 2010
Introduction of renewable energy certificates (REC) 2010
Addressing transmission and curtailment risk
Creating mechanism to broaden the demand base
7Evolution of Central policies
How Indiarsquos Solar and Wind Policies Enabled its Energy Transition A Decade in Review
22 Post-2010 policies for solar The Jawaharlal Nehru National Solar Mission (NSM) notified in January 2010 was a turning point in the RE story The NSM was one of eight missions developed as part of Indiarsquos National Action Plan on Climate Change (NAPCC) Its primary objective was to develop and deploy solar energy technologies including utility-scale distributed solar and solar thermal energy It targeted the entire ecosystem of solar energy deployment and included measures to support research and development human resource development the increase of technical capacity and awareness of these technologies Such measures included providing technical assistance training customs and excise duty concessionsexemptions on capital equipment critical materials components and project imports ease of doing business and enabling domestic manufacturing through exemptions and incentives The NSM laid out a phase-wise approach until 2022 that brought about policy certainty
The risks for investors and financiers were considerable The upfront costs were high while returns were not guaranteed (since the technology had not yet proven its track record within India) Further even if discoms were willing to sign power purchase agreements (PPAs) low connectivity and transmission capacity hindered offtake However more significant was the payment risk arising due to the poor financial health of discoms The payment risk adds as much as 107 per cent of the additional risk premium to the cost of debt (Atal and Shrimali 2018)
To counteract the payment risk the NSM devised an arrangement whereby NVVN (NTPC Limitedrsquos trading arm) would purchase power from the solar developer for onward sale to state discoms under a power sale agreement (PSA) The standard PSA included a clause stating that in case the discom failed to make timely payments NVVN could invoke the tripartite agreement signed by the Central Government the relevant state government and the Reserve Bank of India (RBI)7
The NSM envisaged that the key driver for promoting solar power would be the RPO mechanism with the FiT and PPA duration determined by the CERC It aimed to achieve parity of solar and coal tariffs by 2030
NSM was to be implemented in three phases The target for Phase I which lasted till 2013 was 1000 MW The initial target of 20 GW was increased to 100 GW in 2015 to be achieved by December 2022 As of November 2020 3691049 MW of solar power capacity has been installed (MNRE 2020b)
Competitive bidding guidelines for wind 2017
Managing offtake risk by signing long-term PPAs and providing payment security
Low tariffs for discoms through competitive bidding
MoP and MNRErsquos order on opening and maintaining adequate LC as PSM under PPAs by distribution licensees 2019
Addressing payment risk from discoms
7 Article 648 of the Standard Draft PSA between NVVN and Distribution Utility (2010) httpwwwnvvncoinDRAFT20PSA_NVVN-Discom_March2029202010pdf In case a state discom defaulted on any payment obligations NVVN could invoke this agreement and the pending dues could be routed to it through the RBI The Centre can then deduct the relevant amount from the annual fund transfers from the Centre to the state which is the most significant source of state government revenue
Table 2 contd
88
Phase IThe guidelines to operationalise the first phase of NSM were notified in July 2010 Many projects had already begun construction before this notification Such projects were permitted to migrate to the NSM and sign PPAs with NVVN The NSM selected fresh projects based on the discounts that the developers were offering on CERC-approved tariffs applicable as of the date of submission of their applications These projects needed to be commissioned within 12 months of the developers signing the PPA In Phase I the NVVN could bundle unallocated conventional power procured from the NTPC and sell it to discoms to average the tariffs
For payment security the standard PSA required the buying utility to open a six-month letter of credit (LC) backed by an escrow account in favour of NVVN Further under an order dated 30 June 2011 the MNRE created a separate payment security fund of INR 486 crore However despite the implicit state guarantee transaction advisers suggested that investors be cautious The standard PPA was not considered bankable (Sustainability Outlook 2010 Jog 2013) High project costs and unproven technology increased the risk Developers were also concerned that the PPA prices could be reduced during its duration
Additionally domestic content requirement (DCR) that required polycrystalline photovoltaic (PV) cells and modules being used to be manufactured in India was imposed on NSM projects The DCR distorted the market towards other PV technologies like thin film (Paliwal and Hamberg 2015) and adversely affected the existing manufacturing base in India that predominantly manufactured polycrystalline PV DCR would have constrained developersrsquo technology choices and did not benefit the domestic manufacturers (Ganesan et al 2014)
The government eventually withdrew DCR after failing to defend the move before the World Trade Organisation (WTO) in a dispute initiated by the United States of America in 2013 on grounds that DCR was discriminatory against imports under the lsquoNational Treatmentrsquo principle (WTO 2016)
Phase I was successful in achieving its target of installed capacity of 1000 MW of grid connected power It also served to demonstrate the technology and the intermediary arrangement under the NSM However even before the Phase II guidelines were notified developers and financiers raised concerns about delayed payments To manage this risk the lenders demanded that NVVN be made a beneficiary of the tripartite agreement (Jog 2013)
Phase II
The Solar Energy Corporation of India Limited (SECI) was designated as the implementing agency for Phase II SECI a public-sector company is an electricity trading licensee and signs PPAs with developers to purchase power for on-sale to discoms and other consumers In February 2017 SECI became a beneficiary of the tripartite agreement between the Government of India state governments and the Reserve Bank of India Consequently ICRA Limited (a credit rating agency) enhanced SECIrsquos credit rating from AA- to AA+ This increased the bankability of SECI projects SECI was required to create a payment security fund of INR 500 crore to cover for three monthsrsquo payment By 2014 SECI received bids worth 2170 MW under reverse bidding conducted by it and signed PPAs and PSAs with state discoms (SECI 2014) Phase II focused on providing viability gap funding (VGF) to project developers However the utility of the VGF initiative is questionable as the actual expenditure of the committed funds progressively declined across the various schemes (see Table 3) After the notification of the
9Evolution of Central policies 9Evolution of Central policies
JNNSM Phase I was successful in achieving its target of 1000 MW grid-connected power However developers and financiers raised concerns about delayed payments even before the notification of Phase II guidelines
How Indiarsquos Solar and Wind Policies Enabled its Energy Transition A Decade in Review
Table 3 Snapshot of VGF schemes
Source Authorrsquos adaptation from MNRE 2020 Annual Report 2019ndash20 New Delhi MNRE and SECI 2019 8th Annual Report 2018ndash19 New Delhi SECI
Allotted and commissioned capacity
VGF per MW Estimated expenditure (in INR crore)
Actual expenditure (in INR crore)
Bidding parameter
TariffYear NSM Phase II batch
2013
2016
2015
750 MW Batch I
Phase II Batch IV
2000 MWBatch III
Discount on VGF
Discount on VGF or tariffAfter 2017 ndash only tariff
Discount on VGF or tariff
INR 545 per kWh INR 475 with AD
No fixed tariff
INR 443 per kWh for the first year annual escalation of INR 005 kWh for the next 20 years with the maximum tariff capped at INR 643 kWh
680 MW
Awarded 3420 MW (as on 31 December 2019)2470 MW capacity commissioned in the states of Gujarat Odisha Maharashtra Rajasthan UP Andhra Pradesh (Kadapa Solar Park) and Karnataka (Pavagada Solar Park) (as on 31 December 2019)
Awarded 2155 MW2295 MW capacity reported as commissioned in the states of Andhra Pradesh Chhattisgarh Karnataka Maharashtra and Uttar Pradesh at both solar park and non-solar park locations (as on 31 December 2019)
The lower of INR 25 crore and 30 per cent of project cost
INR 1 crore for open category
125 for DCR projects
The lower of INR 25 crore and 30 per cent of project cost
1875
5050
1875
742
19163
742
Phase III Phase III of the NSM is currently underway The target is to achieve 100 GW of cumulative solar capacity by 2022 The bidding is conducted under the Solar Bidding Guidelines Various intermediary procurers are participating in conducting the auctions including SECI NTPC and NHPC Limited As of March 2020 solar capacity of 2135 GW was under various stages of implementation and 3127 GW was under different stages of bidding (ETEnergyWorld 2020)
23 Impact of other policies on project deploymentAfter the high-growth period of 2016ndash2018 capacity addition slowed in 2018ndash19 which was a cause for concern It represents a break in the growth momentum There are multiple contributory factors for the slowdown
Guidelines for Tariff Based Competitive Bidding Process for Procurement of Power from Grid Connected Solar PV Power Projects (Solar Bidding Guidelines) in 2017 tariff became the sole bidding parameter and VGF fell into disuse
1010
The introduction of the Goods and Services Tax (GST) in 2017 created considerable confusion and administrative challenges8 It decelerated the growth momentum and raised project costs by 10ndash15 per cent (Soman et al 2019) The imposition of safeguard duties on imports of solar cells and modules from China and Malaysia was introduced in 2018 Eventually these costs were made good to the project developers by their PPA counterparties under the lsquochange-in-lawrsquo clause of the PPA However the uncertainty surrounding its timeline increased cost of procuring components from exempted jurisdictions and litigations before the regulatory commissions to get the duty adjudged as change-in-law added to the costs of under-construction projects and delayed new projects (Thomas 2018 Jai 2018) Payment delays by discoms renegotiation threats curtailment tariff ceilings on bids etc also caused many investors to delay their investment decisions and many SECI tenders were undersubscribed (Buckley and Shah 2020 Chatterjee 2019) Tariff ceilings were removed by MNRE in March 2020 to revive investor interest
Lately SECI has struggled to find buyers for the auctioned capacity For example under a manufacturing-linked solar auction conducted in January 2020 SECI is yet to sign the PPA even after 10 months of awarding the project because it is unable to find buyers for the power (Reuters 2020) This development shows the signs of stress and limits to the NSM model for RE growth
24 Solar Park Scheme
Land procurement in India is hugely complicated with challenges ranging from the legal to the political (TERI 2017) For developers private procurement is expensive and time-consuming This is evidenced by the consecutively increasing time limit for obtaining possession under the NSM In Phase I 180 days was the time limit in Phase II Batch I the time limit was increased to 210 days and currently developers must show possession only at the time of commissioning the project
As the number of RE projects increases we are witnessing more acute problems in relation to the acquisition of land (Tenddulkar 2019) Land is however a state subject and the Centre has limited scope to enable easier land procurement To facilitate economies of scale and support systematic planning and deployment in 2014 the MNRE launched a first-of-its-kind scheme to develop ultra-mega solar parks In 2017 the target under the scheme was enhanced from 20000 MW to 40000 MW with an objective to set up at least 50 solar parks by 2022 (MNRE 2020a) Under this scheme solar park developers can acquire land obtain the necessary permissions and build the required infrastructure including evacuation infrastructure for the capacity to be housed within the park As of December 2019 the MNRE had approved 39 solar parks with a total capacity of 22879 MW across 17 states (MNRE 2020a)
8 The GST is supposed to be an integrated tax on both goods and services In the earlier tax regime goods and services were taxed separately (exciseimport dutiesVAT on goods and service tax on services) For RE the cells and modules are taxed at 5 per cent while services attract an 18 per cent GST rate However for RE works contracts (ie the engineering procurement and construction contracts) the supply of equipment necessary for setting up a power plant and the service component (ie the actual setting up of the plant) are difficult to segregate The government eventually fixed a 7030 ratio for the goods and services components of the contracts respectively (William 2020)
11Evolution of Central policies 11Evolution of Central policies
After an impressive growth period between 2016ndash18 various factors in addition to counterparty risks such as introduction of GST and safeguard duties on imported cells and modules led to change-in law cases delaying projects as well as investor decisions
How Indiarsquos Solar and Wind Policies Enabled its Energy Transition A Decade in Review
25 Post-2010 policies for wind The NSM defined solar power development while wind policies followed a separate trajectory till late 2016 The flip-flops of the Central Government in withdrawing and re-introducing benefits such as AD and generation-based incentives (GBI) had adverse effects on wind capacity addition 100 per cent AD was introduced in 1994 AD was reduced to 80 per cent in 2002 GBI was introduced in 2010 Both AD and GBI lapsed in 2012 but were reintroduced in 2013
Wind power was brought into the competitive bidding regime with the 2016 interstate transmission system (ISTS) wind scheme for 1000 MW and the notification of the Guidelines for Tariff Based Competitive Bidding Process for Procurement of Power from Grid Connected Wind Power Projects in 2017 (Wind Bidding Guidelines) SECI floated the first tender for ISTS wind in OctoberNovember 2016 it concluded in February 2017 and PTC India Limited signed the PPAs (Saumy 2017)9 The bidding procedure and guidelines were similar to those conducted for solar energy It helped bring tariffs down from INR 416ndash602 FiT to INR 346 (see Figure 3) The primary reason for the lower tariff was reduced counterparty risk (CRISIL 2017) with competition driving down tariffs even lower
Figure 2 The pace of solar park development under the Central scheme has been slow (as on 31 December 2019)
Source Authorsrsquo adaptation from MNRE 2020 Annual Report 2019-20 New Delhi MNRE
9 Order dated 3 December 2019 issued by CERC in Petition No 340AT2019 titled PTC India Ltd v SECI and Ors httpwwwcercindgovin2019orders340-AT-2019pdf
0
5000
10000
40000
22879
103207767
15000
20000
25000
30000
35000
40000
45000
50000
Solar park status
Target capacity
Approved capacity
Capacity of fully or partially
operational parks
Commissioned capacity
Cap
acit
y (in
MW
)
12
Figure 3 Competitive bidding in wind brought down the tariffs significantly
Sources FiT orders Order dated 15 May 2014 issued by CERC in Petition No SM3542013 (Suo-Motu) titled Determination of generic levellised generation tariff for the FY 2014-15 Order dated 31 March 2015 issued by CERC in Petition No SM0042015(Suo-Motu) titled Determination of generic levellised generation tariff for the FY 2015 - 16 Order dated 30 March 2016 issued by CERC in Petition No SM032016 (Suo-Motu) titled Determination of levellised generic tariff for FY 2016-17 Auction tariffs from India RE Navigator 2020 ldquoAuction Resultsrdquo Accessed November 28 2020 httpsindia-re-navigatorcomwind
After the discovery of these lower tariffs even under-construction projects were brought within the bidding regime or else their tariffs were renegotiated The reduced tariffs led to reduced margins and concerns that the existing thriving ecosystem which was driven by original equipment manufacturers (OEMs) is collapsing10 After 2017 there was a sharp decrease in the rate of growth of capacity additions (see Figure 1) leading to unsold inventory with the OEMs Discoms were no longer willing to sign PPAs on FiTs and the pace of bidding failed to keep up with expectations
Further because of the low tariffs it has become essential that the developers set up projects in high wind density sites Land has hence become the most crucial element of investment decisions in wind However state policies have not been very conducive in this aspect The consequent delays in setting up projects is further affecting wind OEMs (Dutt Arboleya and Gonzalez 2020) Since the introduction of competitive bidding in wind 191 GW has been auctioned but only 145 GW has been awarded In 2020 the wind bids have been linked to storage blended with solar or been part of hybrid projects Bidding was particularly constrained in 2019 were 5400 MW was tendered but only 2720 MW was awarded (India RE Navigator 2020)
10 This is evidenced by the stressed balance sheets of major wind OEMs including Suzlon and Inox and the exit of Senvion from the Indian market The number of OEMs has reduced from 14 to 5 (Arora 2019) Thin margins are a feature of the entire RE sector however specifically in case of wind competitive bidding and the resulting low tariffs caused a disruption to the existing ecosystem of the industry
0
1
2
576 598 601
346264 243 244 2513
4
5
6
7
FiT 2014ndash15
FiT 2015ndash16
FiT 2016ndash17
SECI February
2017
SECI October
2017
GUVNL December
2017
SECI February
2018
SECI April 2018
CERC determined FiT Auction
Tari
ff (I
NR
per
kW
h)
13Evolution of Central policies
How Indiarsquos Solar and Wind Policies Enabled its Energy Transition A Decade in Review
Land riskLand availability constitutes a major challenge for developers and causes significant project delays The development of solarRE parks provided comfort to developers and led to the realisation of economies of scale However as against the solar park target of 40000 MW by 2022 as of December 2019 only 7767 MW have been commissioned (see Figure 2) Solar park development comes with a chicken-and-egg problem Without committed projects it is expensive to develop solar parks but once projects are awarded solar park development cannot take place within the time provided for project commissioning since solar parks require a longer time for construction Furthermore because solar parks require even greater parcels of land chances of land conflicts are higher While states such as Rajasthan and Gujarat have fared well because of the presence of abundant wastelands others such as Andhra Pradesh (eg Kadapa and Ananthapur) and Karnataka (eg Pavagada) have all faced land conflicts Other issues that developers face relate to the quality of the land ancillary infrastructure and upfront and operation and maintenance (OampM) fees Proposed solar park projects have been cancelled because of unexpectedly high bid tariffs (Seetharaman and Chandrasekaran 2019) Though there have been success stories like the Rewa Solar Park (Bhaskar 2020) we need better planning and coordination between the Centre and the states to mitigate land-related barriers and risks
Curtailment and evacuation risksRE faces a high degree of curtailment risk (Aggarwal and Chawla 2019) The Grid Code 201011
(Grid Code) which must be followed by all states grants a must-run status to power generated from wind and solar plants This means that utilities and system operators must prioritise evacuation of power from must-run plants unless there are grid unavailability security or
11 Clause 52 (u) of the Grid Code
141414
26 Policy assessmentWe now briefly discuss some of the continuing structural risks that the above policies have failed to address or inadequately addressed and surmise the policy lessons from the Central policies (See Table 4 for Indiarsquos project pipeline to achieve the targets)
Table 4 Indiarsquos progress towards 175 GW renewable energy by 2022
Source Amitesh Sinha 2020 ldquoIndiarsquos Ambition and Opportunities in Solar Manufacturingrdquo Presentation India PV Edge 2020 Virtual conference 6 October
Under implementation
(GW)
Tendered (GW)
Total (installed +
pipeline)
Target (GW)
Installed capacity
(GW)
Sub-sector
Solar
Biomass
Total
Windndashsolar hybrid
Wind
Small hydro
RTC assured peak power supply
100
10
175
60
5
3574
1003
88511 4511 2843 16205
825
474
3336
0
144
825
046
16
2066
0
12
157
0
5
8976
1003
264
4782
52
66
safety constraints However commercial considerations grid unavailability and technical grid security concerns lead to curtailment which translates to revenue loss for developers Curtailment could contribute to 14 per cent of the risk premia (Atal and Shrimali 2018)
In the early set of PPAs there was no provision to compensate generators in case of backdown of power However the Solar Bidding Guidelines and the Wind Bidding Guidelines incorporated provisions that require the power purchaser to compensate the generator in case of backdown for reasons other than technical constraints However must-run status has not been as effective as intended and the risk of curtailment persists
Further as RE deployment grows problems arising out of the inadequacies of the evacuation infrastructure assume greater proportions The problem is compounded by the need for transmission infrastructure to be in place before an RE project is conceptualised because the infrastructure takes up to five years to complete while RE projects typically take between 12ndash18 months to launch (H Singh 2017)
A functioning ISTS is also essential as it helps diffuse the costs and benefits of RE across the country and can enable effective implementation of the RPO Hence inter-state transmission charges and losses have been exempted since 2016 and will continue to be exempted till June 2023 Policymakers recognised this problem early on and PGCIL proposed a transmission plan for the envisaged RE capacity in 2011 dubbed the Green Energy Corridor A loan-plus-grant mechanism was devised to fund inter- and intra-state transmission corridors in 2015 However this programme does not address the incentive problem ndash it requires the states to cooperate and take the initiative to submit project proposals for obtaining grants provide last-mile connectivity and improve their own transmission infrastructure There is not enough incentive for RE-rich states to spend money to build the required infrastructure There is no clear accounting or evidence of the benefits that a RE-rich state government will receive if it allocates money and human resources for this purpose
Further there is no transparent data published on curtailment duration curtailing entities and reasons for curtailment So far generators have pooled their data and been able to demonstrate evidence of curtailment However no one knows the exact reasons for such curtailment It is hence difficult to analyse the predominant causes and accordingly frame a policy response
Payment riskAs we have just discussed assured offtake at a fixed tariff for the lifetime of the project helped investors tide over the risks of adopting a new and untested technology and helped increase the scale of these projects
While payment obligations were assured on-time payments remain a concern Delayed payments affect investor returns and project cash-flows adversely Most PPAs have provisions that require the purchaser to create a payment security mechanism (PSM) Opening letters of credit (LC) is the most common PSM However there is widespread non-compliance of this provision SECI had not created any LC under any of its PPAs (though it has a good track record of payment) (Economic Times 2019) As a solution in June 2019 the MoP directed the NLDC and the SLDC to dispatch power only after an LC had been opened for the power
15Evolution of Central policies 15Evolution of Central policies 15Evolution of Central policies
Any transmission infrastructure expansion programme needs to solve for the incentive problem facing the states
How Indiarsquos Solar and Wind Policies Enabled its Energy Transition A Decade in Review
being scheduled The discom would also be liable to pay full tariff on the power that is not scheduled The concerned discom was also precluded from purchasing power from the power exchange and getting a short term open-access (STOA) (MoP 2019) This move essentially brought system operators into contract enforcement which ideally should be beyond their remit Apart from this drawback in the design according to feedback from the developers the move did not change anything on the ground However it has had only one year of effective operation since once COVID-19 struck MoP partially rolled back the directive till 30 June 2020 and permitted scheduling of power even if the PSM was reduced by 50 per cent (MoP 2020b)
Policy lessonsThe success story so far has made India a dominant force in the RE space globally It was able to leverage its growing market and even take leadership on global initiatives like the International Solar Alliance After the implementation of the NSM solar power deployment increased exponentially Further the competitive bidding regime introduced first in solar and then for wind was successful in driving down tariffs
However existing policies are not sufficient to address risks arising from the structural pathologies of the electricity sector and the changing nature of barriers and risks With RE prices falling it may seem that RE procurement would be the natural choice for discoms However discoms hold-out on signing PPAs with the expectation that tariffs would fall even further with each passing auction (Prasad 2020) Deep-rooted issues such as the procurerrsquos obligation to pay fixed costs under long-term PPAs inadequate demand-supply planning and skewed fuel subsidies distort the market Further policies that burden the discoms further like the LC requirement have no real impact on the ground
Tying discoms down in long-duration PPAs reduces their ability to respond to new market developments and forces them to procure at above-market costs posing a greater risk for the sector in the long term While these policies may work for project developers in the short term they do not make the most commercial sense for discoms The fixed cost payment issue is one such example Technologies like storage and introduction of market platforms have the potential of bringing in economic efficiencies in discom procurement strategies (CERC 2018) Hence a variation in procurement strategy for discoms is imminent and policies must enable them Such variation is already visible in the thermal markets where MoP has commenced medium-term power procurement Resistance from incumbent market players is expected and must be addressed for a transition that works for all stakeholders
Further the policy framework till now has a serious gap in data collection and transparency There is lack of data on project-specific information on generation technology selection etc Detailed data on these aspects could have informed policy activity on cost and technology bringing in greater efficiencies The Centre has the mandate to formulate policy in this regard and must make up for the lost time
161616
India is a strong force in the global RE space However existing policies are not sufficient to address the deep-rooted issues and evolving nature of risks inhibiting a natural transition to RE
The NSM Solar Park Policy and other fiscal incentives are supply-side measures targeted at reducing investment risks However a measure to create demand was essential because
RE was considerably more expensive than conventional power in 2010 Demand for RE was created through the RPO mechanism
The EA enabled state regulators to specify a minimum purchase obligation Section 86(1)(e) of the EA requires the SERCs to ldquopromote cogeneration and generation of electricity from
3 Renewable purchase obligations ndash a regulatory mechanism for creating demand
Image iStock
171717
How Indiarsquos Solar and Wind Policies Enabled its Energy Transition A Decade in Review
renewable sources of energy by providing suitable measures for connectivity with the grid and sale of electricity to any person and also specify for purchase of electricity from such sources a percentage of the total consumption of electricity in the area of a distribution licenseerdquo
The NTP 2006 required the SERCs to fix the RPOs ldquotaking into account availability of such resources in the region and its impact on retail tariffsrdquo In the absence of any fixed target or specific obligation only a few states notified the purchase obligations The initial movers were Gujarat (2005) Kerala (2006) Rajasthan (2007) and Madhya Pradesh (2008)
Fixed targets were set for the first time under the NAPCC which prescribed that RE (including bioenergy and small hydro) should account for 5 per cent of total grid purchase in 2010 which would increase to 15 per cent by 2020 with a one per cent increase each year In 2011 the NTP 2006 was amended to include a minimum RPO of 025 per cent for solar power by the end of 2012ndash2013 and 3 per cent by 2022
During 2010ndash2012 many states notified their respective RPO regulations This activity was most likely driven by the increased government and investor focus on RE after the introduction of the NSM The obligated entities ie the entities on whom the RPOs were imposed were discoms captive consumers and open-access consumers
The policymakers were however cognisant of resource variability across the different states To bridge the resource gap and ensure sustained demand for RE they enabled the issuance and trading of renewable energy certificates (REC) Under the REC mechanism registered RE generators receive one REC against one MWh of energy they produce12 The power component is sold separately to discoms and open-access consumers at the average power purchase cost (APPC) or a mutually agreed price respectively The RECs are categorised into solar and non-solar RPOs These RECs can be put up for sale in power exchanges where they can be bought by obligated entities and voluntary buyers or retained by the generator to meet their own RPOs (the latter was allowed from 2013) The CERC periodically fixes a floor price and forbearance price and the trading occurs within this price band
31 Setting RPO targets
The RPO targets notified by states are set out in Table A1 in the Annexure As is evident statesrsquo RE ambition varies widely and there was considerable variance between them and the NAPCC targets Karnataka Tamil Nadu Maharashtra and Rajasthan set relatively high targets while Andhra Pradesh Bihar Madhya Pradesh and Uttar Pradesh set quite low targets
The trajectory set out in the NAPCC did not have any legally binding value on the SERCs and the states were technically free to determine their RE targets However their targets were inadequate to achieve national policy objectives
To address the inadequacy of the RPO targets the NTP was revised in 2016 enabling the Ministry of Power (MoP) to notify a common trajectory from 2016ndash17 to 2018ndash19 The MoP has notified the RPO trajectory up to FY 2021ndash22 (Table 5) (MoP 2016 2018) Since then states must align their trajectories to that set by the Central Government
12 The detailed procedure for all matters relating to RECs is set out in the CERC (Terms and Conditions for Recognition and Issuance of Renewable Energy Certificates for Renewable Energy Generation) Regulations 2010 (REC Regulations) The first solar and non-solar RECs were issued in May 2012 and March 2011 respectively
18
In the absence of any fixed target or specific obligation before 2010 only a few states notified the purchase obligations The initial movers were Gujarat (2005) Kerala (2006) Rajasthan (2007) and Madhya Pradesh (2008)
13 The petition was filed under Section 121 of the Electricity Act 2003 which empowers the tribunal to issue orders instructions or directions to the appropriate commission for the performance of its statutory functions
Till January 2017 only three states ndash Andhra Pradesh Madhya Pradesh and Rajasthan ndash had issued draft regulations specifying a trajectory in line with the one prescribed by the MoP (MNRE 2017) In 2017 Karnataka revised their official policy targets from 2000 MW to 6000 MW of solar power to match the RPO trajectories set by the MoP (The Hindu 2017) Till March 2020 only nine states had aligned their RPO trajectories with that of the MoP (MoP 2020a) The remaining states are yet to either notify their 2021ndash22 trajectories or align them with the Central trajectory While Maharashtra has not aligned its targets it provides incentives of INR 025 per kWh above the state prescribed RPO for procurement up to the MoP target
32 Compliance with RPOThe obligated entities can comply with their RPOs through two routes direct procurement (FiTcompetitive bidding) and purchasing RECs from power exchanges
State regulations typically contain provisions for monitoring compliance which require the obligated entities to submit information to the state nodal agencies and the nodal agencies are required to file periodic compliance reports with the SERC The SERC can also initiate suo moto proceedings to verify compliance
In cases of non-compliance SERCs are typically required to direct the obligated entities to deposit such amounts as the SERC may determine in a separate fund which will then be used to purchase RECs and develop transmission infrastructure However certain provisions ndash like permitting target revision fungibility between solar and non-solar RPOs and carrying forward the RPOs ndash are specific to the states SERCs can also revise the RPOs in case of constraints in the availability of renewable energy A snapshot of the provisions can be found in Table A2 in the Annexure
As early as 2013 power producers filed a petition before the Appellate Tribunal of Electricity (APTEL)13 claiming that various state discoms and obligated entities were not complying with the RPO regulations The petition arose due to the failure of state commissions to implement their RPO regulations The petitioners submitted that the SERCs frequently allowed deferment carry-over and exemptions of the obligations and did not enforce compliance by directing purchase of RECs despite their availability The MNRE also submitted that discoms made inadequate provisions for compliance while the SERCs did not invoke penal provisions to enforce compliance It further submitted that the SERCs did not seek RPO compliance reports in accordance with the regulations and that many had not even announced their long-term RPO trajectories The CERC submitted that the REC market had a large unsold inventory of non-solar RECs that were being traded at floor prices It further noted that the demand for RECs is largely driven by very few private distribution licensees and few captiveopen-access customers meanwhile the state discoms generally do not purchase RECs to fulfil their RPOs
Table 5 MoP trajectory for RPO
Source MoP 2016 Guidelines for Long-term RPO Growth Trajectory of Renewable Purchase Obligations (RPOs) for Non-solar as well as Solar Order No 2332016-RampR New Delhi MoP 22 July MoP 2018 Long-term RPO Growth Trajectory of Renewable Purchase Obligations (RPOs) for Solar and Non-solar for a Period of Three Years ie 2019ndash20 to 2021ndash22 Order No 23032016ndashRampR New Delhi MoP 14 June
2016ndash17 2017ndash18 2018ndash19 2019ndash20 2020ndash21 2021ndash22Category
Non-Solar
Solar
Total
875
275
115
95
475
1425
1025
675
17
1025
725
175
1025
875
19
105
105
21
19Renewable purchase obligations ndash a regulatory mechanism for creating demand
How Indiarsquos Solar and Wind Policies Enabled its Energy Transition A Decade in Review
The SERCs used the provisions built by them in the RPO regulations to allow non-compliances to occur The APTEL directed the SERCs to strictly enforce compliance and use the provisions sparingly and in accordance with the spirit of the mandate
Variance in compliance within states
The MNRE has consistently been urging states to align their RPO trajectories with that of the Central Government and ensure strict compliance In August 2019 the MNRE sought APTELrsquos intervention to nudge SERCs to enforce and align RPOs and not to allow any waivers or carrying forward (MoP 2020a) In 2019ndash20 some RE-rich states including Maharashtra Gujarat Tamil Nadu Rajasthan and Telangana fell short of meeting their RPO targets Apart from Andhra Pradesh Rajasthan Karnataka and more recently Tamil Nadu no other state has met their RPO targets (MoP 2020a) Figure 4 compares the RPO compliance situation across 2015ndash16 and 2017ndash18 of Tamil Nadu Maharashtra Bihar and Punjab and is representative of the compliance situation across the country
Figure 4 Compliance with RPOs is uneven among states and discoms
Source Authorsrsquo adaptation from Order dated 11 August 2017 issued by the TNERC in TP No1 of 2017 titled Determination of Tariff for Generation and Distribution Order dated 27 March 2019 issued by the MERC in Case No36 of 2019 titled Case for Verification of compliance of Renewable Purchase Obligation targets by Maharashtra State Electricity Distribution Co Ltd for FY 2017-18 Order dated 2 April 2019 issued by the MERC in Case No37 of 2019 titled Case for Verification of compliance of Renewable Purchase Obligation targets by Brihanmumbai Electric Supply amp Transport Undertaking for FY 2017-18 Order dated 2 April 2019 issued by the MERC in Case No38 of 2019 titled Case for Verification of compliance of Renewable Purchase Obligation targets by Tata Power Co LtdndashDistribution) for FY 2017-18 Order dated 4 April 2019 issued by the MERC in Case No39 of 2019 titled Case for Verification of compliance of Renewable Purchase Obligation targets by Adani Electricity Mumbai Limited for FY 2017-18 Order dated 23 October 2017 issued by the PSERC titled Annual Revenue Requirement and Determination of tariff for MYT control period from FY 2017-18 to FY 2019-20 and for True up of FY 2015-16 Order dated 19 April 2018 issued by the PSERC in Petition titled True up of FY 2016-17 Annual Performance Review ndashAPR) for FY 2017-18 and Determining the Annual Revenue Requirement ndashARR) for FY 2018-19 Order dated 27 May 2019 issued by the PSERC in Petition No 02 of 2019 titled True up of FY 2017-2018 Annual Performance Review ndashAPR) for FY 2018-19 Approval of Revised Annual Revenue Requirement ndashARR) and Determination of Tariff for FY 2019-20 Order dated 25 February 2019 issued by the BERC in Case No 40 and 48 of 2018 and Case No 41 and 47 of 2018 titled Tariff Order for FY 2019-20 for NBPDCL and SBPDCL Order dated 24 March 2017 issued by the BERC in Case No 45 of 2016 titled Tariff Order for FY 2017-18 for NBPDCL Order dated 24 March 2017 issued by the BERC in Case No 46 of 2016 titled Tariff Order for FY 2017-18 for SBPDCL Order dated 21 March 2018 issued by the BERC in Case No 40 of 2017 titled Tariff Order for FY 2018-19 for NBPDCL Order dated 21 March 2018 issued by the BERC in Case No 41 of 2017 titled Tariff Order for FY 2018-19 for SBPDCL
0
300
250
200
150
100
50
Tamil Nadu Maharashtra Bihar Punjab
TANGEDCO Tata SBPDCL PSPCLNBPDCLAdani MSEDCL BEST
States and discoms
2015-16 Solar
2016-17 Non-solar
2015-16 Non-solar
2017-18 Solar
2016-17 Solar
2017-18 Non-solar
RP
O c
omp
lianc
e (in
per
cen
t)
20
Karnataka and Tamil Nadu which set ambitious targets have high rates of compliance However Madhya Pradesh and Uttar Pradesh were unable to reach their ambitious targets Andhra Pradesh Gujarat Maharashtra and Rajasthan set modest targets with relatively high compliance levels The other states were unable to accomplish even their low targets The Comptroller and Auditor General of India (CAG) in their analysis of RPO compliance in 24 states between 2010ndash11 and 2013ndash2014 noted that non-compliance was more common among the RE resource-deficit states (CAG 2015 chap 2) This trend in non-compliance by the states has remained largely unchanged since then
In most cases the RPO served as a ceiling on deployment rather than a fillip Most RE-rich states limited discomsrsquo procurement of wind and solar power up to the RPOs targets notified by their respective SERCs The RPO regulation of Gujarat explicitly required the discoms to source RE from within their areas of supply Similarly the Bihar RPO regulation requires discoms to meet their RPOs from sources within their state Discoms can source power from outside the state only in case of shortfall within the state Further there is no indication or incentive in the state RE policies for discoms to exceed the RPO targets Grid integration concerns and the technical limitations to RE powerrsquos sale to other states restrict RE deployment
Participation in the REC market mechanism
The trading mechanism instituted for RECs in the power exchanges has not led to its uptake as there has been a consistently high number of unredeemed RECs (see Figure 5) In addition developers installed only around 2266 MW of RE capacity in 2010ndash2017 under the REC mechanism
Figure 5 RECs consistently remain unsold in the market
Source Authorsrsquo adaptation from REC Registry of India 2020 ldquoMonth-wise RECs Reportrdquo REC Registry of India Accessed 30 November httpswwwrecregistryindianicinindexphppublicsrecs
The REC market has not adequately boosted compliance with the RPO regime Up to 2014 only 477 per cent of the RPO compliance was through the REC route (CAG 2015 chap 2) For resource-deficit states to meet their RPOs through RECs a higher number of resource-deficit states should constitute the buyers ndash which however is not the case (see Table 6) Instead the data shows that resource-rich states are also the highest buyers of RECs
Note The closing balance is the balance in December of each year
0
20000000
15000000
10000000
5000000
2013 2014 2018 20192015 2016 2017
RECs issued RECs redeemed Closing balance
21Renewable purchase obligations ndash a regulatory mechanism for creating demand
How Indiarsquos Solar and Wind Policies Enabled its Energy Transition A Decade in Review
Another noteworthy fact is that among the large buyers ie Maharashtra and Gujarat there is significant private-sector participation In Gujarat private discoms make the most REC purchases The other significant chunk of buyers are the union territories which fall within the Central Governmentrsquos purview and for this reason may be more enthusiastic in their use of the REC mechanism (POSOCO 2018)
It appears that the factors behind participation in the REC market are independent of resource availability and utilisation
33 Causes of under-achievement
The possible causes of under-achievement of the REC mechanism in boosting RPO compliance are discussed below
Declining number of sellers
The SERCs have contended in the past that developers stand to gain supernormal profits by setting up REC projects since they are entitled to normal tariffs plus the REC price Analyses also anticipated that the high floor prices could provide windfall gains to developers (A Singh 2010)
However this did not hold true in practice Though there was an initial spurt in the number of projects that were registered under the mechanism as solar and wind tariffs continued to fall the registration of new projects under the REC mechanism reduced (see Figure 6) There is a clear preference for FiTauctions over the REC route Of the total 85908 MW of RE capacity (including all types of RES) in India as of 31 December 2019 (MNRE 2020a) only 4046 MW was registered under the REC mechanism (REC Registry of India 2020b) (see Table A3 of the Annexure for the number of projects registered in the selected states)
Table 6 Resource-rich states are also the highest buyers of RECs
Source Authorsrsquo adaptation from POSOCO 2018 Renewable Energy Certificate Mechanism in India Key Learnings Data Analysis and Way Forward New Delhi POSOCO NLDC
Share of total RECs purchased by state entities (total RECs redeemed up to
2017ndash18 are 37043171) (in per cent)
Share of total RECs purchased by the state discom (total RECs purchased
by all discoms up to 2017ndash18 are 22499976) (in per cent)
State
Maharashtra
Gujarat
Rajasthan
Bihar
Madhya Pradesh
Punjab
Tamil Nadu
Karnataka
Andhra Pradesh
Uttar Pradesh
307
133
62
46
44
33
19
17
16
04
44
131
0
75
0
39
0
0
0
0
22
Cashflow for REC projects
In the early 2010s there was still a wide gap between the APPC and solar and wind tariffs It would have been risky to register as a REC project since REC prices would be discovered in energy exchanges within the approved bands The floor price is calculated by determining the gap between the minimum requirement and the APPC This minimum requirement is an estimation that considers OampM expenses interest on term loans working capital and repayment terms it is fixed to ensure the economic viability of the project However these numbers are estimated based on prevailing rates as opposed to historic rates Hence the prices have expectedly and consistently fallen (see Table 7) the floor price has reached zero This would impact the cashflows of a project registered when the costs were high
Figure 6 The registration of new projects under the REC mechanism has reduced
Source Authorsrsquo analysis of data published by POSOCO 2018 Renewable Energy Certificate Mechanism in India Key Learnings Data Analysis and Way Forward New Delhi POSOCO NLDC
Table 7 REC floor prices and forbearance prices have consistently fallen
Non-solar (INR MWh)
Floor price Floor priceForbearance price Forbearance price
Solar (INR MWh)
1500
1500
1000
0
3900
3300
3000
1000
12000
9300
1000
0
17000
13400
2400
1000
1 June 2010ndashFY 2012
1 April 2012ndashFY 2017
1 April 2017ndashFY 2020
1 July 2020ndash30 June 2021
Control period
Source Order dated 1 June 2010 issued by the CERC in Petition No 992010 (Suo Motu) titled Determination of Forbearance and Floor Price for the REC Framework Order dated 23 August 2011 issued by the CERC in Petition No 1422011 (Suo Motu) titled Determination of Forbearance and Floor Price for the REC Framework to be Applicable from 1st April 2012 Order dated 30 March 2017 issued by the CERC in Petition No 02SM2017 titled Determination of Forbearance and Floor Price for the REC framework to be Applicable from 1st April 2017 Order dated 17 June 2020 issued by the CERC in Petition No 05SM2020 titled Determination of Forbearance and Floor Price for the REC Framework
Capacity Noof projects
0 0
200 50
400100
600
800150
1000 200
1200 250
2010
-11
Year
Cap
acit
y (M
W)
Num
ber
of r
egis
tere
d p
roje
cts
2011
-12
2012
-13
2013
-14
2017
-18
2016
-17
2015
-16
2014
-15
23Renewable purchase obligations ndash a regulatory mechanism for creating demand
The declining trend of the market price of the REC (see Table 7) shows that buyers are unwilling to pay a higher price and that there is significant uncertainty surrounding the expected returns on investment
How Indiarsquos Solar and Wind Policies Enabled its Energy Transition A Decade in Review
Table 8 Average size of a registered plant as of FY 2018
SourceAuthorsrsquo analysis of data published by POSOCO 2018 Renewable Energy Certificate Mechanism in India Key Learnings Data Analysis and Way Forward New Delhi POSOCO NLDC
Maximum capacity (MW)
Minimum capacity (MW)
Average capacity (MW)
No of projects
Total capacity (in MW)
1900
504
010
023
204
525
360
413
736
2167
Solar PV
Wind
RE source
For projects developed after the fall in costs the situation has reversed The APPC in most cases may be higher or equal to solar and wind tariffs If any new projects are registered under the REC regime today they could sell power to the host discoms at the APPC (or SERC-notified tariffs) and RECs thus sold can help an obligated entity meet its RPO
Cost for host discomsstatesThe responsibility and cost of balancing power from REC projects (the cost of maintaining system balance due to injection of variable power in the grid) fall on the host state This could limit the number of REC projects the state would host for the availability of other obligated entities
For RE-deficit states it would be more commercially viable to procure RECs to meet their RPOs (they will incur conventional power purchase costs plus REC costs) and avoid the balancing costs associated with procuring RE directly However data shows that discoms do not avail of this route to meet their RPOs This may be due to behavioural resistance to shift to REC or due to the indifferent enforcement of RPOs
Cost for other obligated entitiesInitially there was considerable resistance from open access and captive consumers to the RPO obligations imposed upon them The dispute was eventually settled by the Supreme Court in Hindustan Zinc Limited v RERC14 in which the Court held such imposition to be valid Open-access consumers have the freedom to switch to grid purchase in which case they do not need to comply with RPOs separately
Regulatory gapsThe REC market is a lsquocompliance marketrsquo ie the demand for RECs arises from a legal mandate and is not organic demand15 In this context non-compliance can result from the following situations
14 Judgment dated 13 May 2015 issued by the Supreme Court of India in Civil Appeal No 4417 of 2015 httpswwwrecregistryindianicinpdfREC_RegulationSupreme_Court_Judgement_regarding_RPO_Compliancepdf
15 The voluntary component of the REC market is the exception However its share is only 01 percent of the REC market (POSOCO 2018)
24
This would especially affect larger projectsrsquo participation in the REC mechanism Investors prefer projects with PPAs as they offer assured returns over a longer duration This is also indicated by data on the average size of projects registered under the REC mechanism (Table 8)
Regulatory uncertainty
As discussed above RPO regulations allow carrying forward exemptions etc which create demand uncertainty Other regulatory causes also contribute to commercial uncertainty Initially the life of the REC was only one year after which it expired if not redeemed These expired RECs generated no returns on investment for investors This would have dissuaded many investors from setting up REC projects The validity period was subsequently increased to two years by the CERC through an order dated 11 February 2013 however this did not give investors sufficient confidence Commercial uncertainty was further exacerbated by the fact that demand was also not certain due to the low RPO targets set by states before the MoP set a common trajectory for all in 2016
Inadequate enforcement
There was no unified framework for monitoring RPO compliance on an on-going basis until the MNRE announced the constitution of the RPO compliance cell in 2019 The SERCs are relatively lenient with regards to non-compliance For example they permit the carrying forward of shortfall16 and the use of the previous yearrsquos surplus to meet shortfalls in the next year17 There have also been delays in reviews of compliance For example compliance for the period FY 2015ndash16 was finally determined by the Gujarat Electricity Regulatory Commission (GERC) on 26 December 2019 While there are generic penalties prescribed in the EA for contravention of regulations made under the EA it is difficult to imagine that the SERCs would be highly inclined to strictly invoke these provisions against their own state discoms
Inability of the obligated entities to comply with the mandate
While non-enforceability and regulatory gaps lead to non-compliance the practical reason is that RPOs and RECs are an additional cost burden for discoms which are already under severe financial stress Further many inefficient thermal projects continue to operate to their technical minimum to provide the baseload which limits the extent of RE procurement Certain states have indicated that they would be willing to purchase RECs provided they find an offtaker for the thermal capacity that is already contracted by the discoms Many states which were earlier in a power deficit situation but have now become power surplus states find it difficult to meet the current RPO levels and have no incentives to raise their RE ambitions
16 Order dated 4 August 2015 issued by the GERC in suo motu Petition Nos 1307 of 2013 and 1312 of 2013 titled Suo-motu Proceedings in Petition Nos 1307 of 2013 and 1312 of 2013 in Pursuance of Honrsquoble APTEL Direction Contained in Order Dated 16042015 in Appeal Nos 258 of 2013 and 21 of 2014 and the Order Dated 14052015 in IA No 187 of 2015 Accessed 22 October 2020 httpswwwgercinorgwp-contentuploadsdocumenten_1438799511pdf
17 Order dated 4 April 2019 issued by the MERC in Case No 39 of 2019 titled Case for Verification of Compliance of Renewable Purchase Obligation Targets by Adani Electricity Mumbai Limited for FY 2017ndash18
25Renewable purchase obligations ndash a regulatory mechanism for creating demand
RPO compliance for FY 2015ndash16 was finally determined by the Gujarat Electricity Regulatory Commission (GERC) on 26 December 2019
How Indiarsquos Solar and Wind Policies Enabled its Energy Transition A Decade in Review 188
Image iStock
India must implement a comprehensive market reforms roadmap with an intent to remove current inefficiencies while designing a market architecture that minimises total system costs in the future
27
The southern and western states of India have a long history of RE development since RE resources are concentrated in these states (Figure 7) These states attracted investments in
solar and wind energy well before the launch of NAPCC and the NSM This section recounts the journey of RE policies in states that have high solar and wind energy potential The RE-rich states covered are Andhra Pradesh Gujarat Karnataka Madhya Pradesh Maharashtra Rajasthan Tamil Nadu and Telangana
41 Policies pre-2014 In January 2009 Gujarat became the first Indian state to launch a solar power policy (Economic Times 2010) In 2012ndash13 over 40 per cent of Tamil Nadursquos total capacity was based on wind power (TN Energy Department 2012) well before the Government of India adopted the ambitious target of 175 GW RE capacity by 2022 including 60 GW wind
In the first phase of NSM Karnataka Power Corporation Limited (KPCL) was the first state-owned utility to be found eligible for the development of a solar project (Deloitte 2015) Rajasthan attracted a slew of projects primarily because of abundant land and resource availability In 2011 Karnataka was the first southern state to introduce an exclusive policy for the development of solar energy
4 Policy evolution in RE-rich states
Figure 7 RE resource potential is concentrated in western and southern India
Source Authorsrsquo analysis based on data from MNRE 2020 Annual Report 2019-20 New Delhi MNRE
Note Wind potential is at 120 m above ground level
Solar potential (GW)
088 0114231 14256
Wind potential (GW)
How Indiarsquos Solar and Wind Policies Enabled its Energy Transition A Decade in Review 28
Key driversThrough 2010ndash14 the underlying policy motivations across RE-rich states were increasing energy access closing demand-supply gaps increasing industrial productivity utilising local resources for power generation garnering private investments creating employment opportunities through project deployment and local manufacturing responding to local environmental challenges and addressing climate change risks
Policy focusIn most of the initial policies support was provided in the form of FiTsbundled tariffs The power was sold through long-term PPAs to state discoms or to NVVN under NSM bundling schemes However we observed shortfalls in administrative and institutional mechanisms like negligible support for land acquisition and approvals and clearance processes lack of strengthening of evacuation infrastructure to tap the best sites no provisions for building knowledge and capacity in key implementing entities and no requirement for improved data collection and communication to aid industryrsquos decision-making and project planning The challenges of the distribution sector also impacted the progress of the sector during the implementation of the NSM Policies therefore failed to create an enabling environment and were not adequate to attract significant investors in the RE business Accordingly these policies attracted a poor response in many RE-rich states For example
bull In Andhra Pradesh only 13184 MW of solar PV capacity was commissioned till FY 2014 against the 2000 MW of solar capacity envisaged under Andhra Pradeshrsquos Solar Power Policy 2012
bull In Tamil Nadu only 13258 MW of solar PV was installed over 2012ndash15 against a target of 3000 MW in Tamil Nadu Solar Policy 2012
bull Karnatakarsquos Renewable Energy Policy 2009ndash14 enabled the addition of 102108 MW during the five-year policy period against a target of 4200 MW
Performance of policies During 2012ndash2014 several states failed to achieve NSM and their state policy targets within the stated time (Stromsta 2012) (See Table 9) States such as Rajasthan Andhra Pradesh and Tamil Nadu conducted auctions in 2013 but there were delays in signing PPAs Gujarat was the only state that adopted the FiT system under its solar policy that was much more attractive than NSM and other state policies Even then there were time overruns Rajasthan auctioned 75 MW of solar capacity in March 2013 However elections in the state delayed land allocation processes (Sengupta 2013) In December 2012 Tamil Nadu conducted a 1000 MW auction out of which only 698 MW was awarded at INR 648 per unit This may reflect investorsrsquo risk perception of the discom finances and operations in the state (TNN 2013)
Project deployment in most states was below the target capacity under the policies
29Policy evolution in RE-rich states
Table 9 Targets specified under policies and achievements
Source Authorsrsquo analysisRPO achievement figures from MoP 2020 Agenda Background Conference of Power and Renewable Energy Ministers of States and UTs 3 July 2020 New Delhi 3 July
Capacity achievement figures from CSO Energy Statistics 2010 New Delhi MoSPI CSO Energy Statistics 2012 New Delhi MoSPI CSO Energy Statistics 2013 New Delhi MoSPI CSO Energy Statistics 2014 New Delhi MoSPI CSO Energy Statistics 2015 New Delhi MoSPI CSO Energy Statistics 2016 New Delhi MoSPI CSO Energy Statistics 2017 New Delhi MoSPI CSO Energy Statistics 2018 New Delhi MoSPI CSO Energy Statistics 2019 New Delhi MoSPI CSO Energy Statistics 2020 New Delhi MoSPI MNRE 2019 Annual Report New Delhi MNRE
Windsolar policy and year Targets in policy Achievement against targets
Solar Power Policy 2012
Solar Power Policy 2015
Wind Power Policy 2015
Solar Power Policy 2018
Wind Power Policy 2018
SolarndashWind Hybrid Policy 2018
Wind Power Policy 2007
Solar Power Policy 2009
Wind Power Policy 2013
Solar Power Policy 2015
Wind Power Policy 2016
Policy for Implementation of Solar Power Based Projects 2012
Wind Power Project Policy 2012
New and Renewable Sources of Energy Policy 2012
Policy for Promotion of New and Renewable Energy Sources 2011
Policy for Promotion of New and Renewable Energy Sources 2017
Karnataka Renewable Energy Policy 2009
Solar Policy 2011
Karnataka Solar Policy 2014
Karnataka Renewable Energy Policy 2016
New Policy for Power Generation from Non-Conventional Sources 2008
Comprehensive Policy for Grid Connected Power Projects based on New and Renewable (Non-conventional) Energy Sources 2015
Rajasthan Solar Energy Policy 2011
Policy for Promoting Generation of Electricity from Wind 2012
Rajasthan Solar Energy Policy 2014
Rajasthan Solar Energy Policy 2019
Rajasthan Wind and Hybrid
Energy Policy 2019
5000 MW
5000 MW additional capacity in 5 years
No targets but discoms required to purchase power up to their RPOs
No targets but discoms required to purchase power up to their RPOs
10 per cent of the capacity portfolio by 2022
1969 MW grid-connected solar
(total solar target is 2969 MW solar)
200 MW (including solar thermal)
Additional 2000 MW between 2014ndash2021
4400 MW additional wind capacity between 2016ndash2022
2000 MW of wind
7500 MW solar till 2020
5000 MW wind till 2020
Target of 10000ndash12000 MW in next 10ndash12 years
300 MW (2013ndash14) 400 MW (2014ndash15) and 500 MW (2015ndash16)
25000 MW
24 GW utility-scale solar by 2025
2000 MW wind for RPO by 2025
Target is only for discom purchase
355902 MW total solar capacity as of December 2019
276355 MW total solar and 735922 MW total wind capacity as of December 2019
For 2019ndash20 solar RPO compliance is 462 per cent and non-solar RPO compliance is 12257 per cent
251989 MW wind and 223748 MW solar as of December 2019
For 2019ndash20 solar RPO compliance is 847 per cent and non-solar RPO compliance is 71 per cent
9471 MW solar as of December 2019
14935 MW total solar capacity as of December 2019
31 MW total solar capacity in FY 2014
724392 MW solar added between FY 2014 and December 2019
188425 MW wind added between FY 2016 and December 2019
4446 MW total wind capacity in FY 2015
500033 MW wind and
166342 MW solar as of December 2019
484421 MW solar as of December 2019
10025 MW (in 2013ndash14) 5241 MW (in 2014ndash15) and 68495 MW (2015ndash16) of wind capacity
484421 MW total solar and 429972 MW total wind as of December 2019
Andhra Pradesh
Gujarat
Madhya Pradesh
Punjab
Bihar
Karnataka
Maharashtra
Rajasthan
State
How Indiarsquos Solar and Wind Policies Enabled its Energy Transition A Decade in Review
Table 9 contd Windsolar policy and year
Targets in policy
Achievement against the targets
Tamil Nadu Solar Policy 2012
Tamil Nadu Solar Policy 2019
Solar Power Policy 2013
Solar Power Policy 2017
Telangana Solar Power Policy 2015
Telangana Wind Power Policy 2016
3000 MW by 2015
9000 MW by 2023
500 MW by 2017
Target up to the RPO
No target
No target
14258 MW total solar capacity in FY 2015
378836 MW solar as of December 2019
33673 MW solar by 2017
10451 MW solar by December 2019 Solar RPO compliance for 2019ndash20 is 305 per cent
362075 MW solar and 1281 MW wind as of December 2019
Tamil Nadu
Uttar Pradesh
Telangana
State
By 2013 Gujarat had installed over 850 MW of solar PV projects the largest capacity in India at that time However the holding company of discoms in Gujarat ndash Gujarat Urja Vikas Nigam Limited (GUVNL) ndash moved to renegotiate the tariffs specified under the signed PPAs citing excessive profits to developersinvestors (Balan 2014) Although GUVNLrsquos attempt was struck down by the APTEL this was the first time that the risks related to contract sanctity emerged in the Indian market which hurt business and investor confidence
As a result of the withdrawal of AD in 2012 and delays in the re-introduction of the GBI wind power deployment rates also declined in 2013 Without the AD or GBI the tariff of a typical new wind power plant was in the range of INR 4 to 5 per unit (for lsquoZone 2rsquo and above sites) Due to this sudden policy gap the market collapsed from 3 GW in 2011 to below 2 GW in 2012 and 2013 (CAG 2015 chap 4)
Figure 8 depicts the growth of solar and wind capacity across states This clearly shows that total capacity started to increase more rapidly 2014 onwards Wind power on the other hand grew at a constant pace till 2012 after which it plateaued for a couple of years and it again picked up in 2016 and 2017 After 2017 wind deployments slowed down again
30
Note The capacity achievement figures include only grid connected capacity while the targets may include decentralised capacity
Figure 8 Solar and wind capacity increased rapidly 2014 onwards
Sources Authorsrsquo analysis based on CSO Energy Statistics 2010 New Delhi MoSPI CSO Energy Statistics 2012 New Delhi MoSPI CSO Energy Statistics 2013 New Delhi MoSPI CSO Energy Statistics 2014 New Delhi MoSPI CSO Energy Statistics 2015 New Delhi MoSPI CSO Energy Statistics 2016 New Delhi MoSPI CSO Energy Statistics 2017 New Delhi MoSPI CSO Energy Statistics 2018 New Delhi MoSPI CSO Energy Statistics 2019 New Delhi MoSPI CSO Energy Statistics 2020 New Delhi MoSPI MNRE 2020 Annual Report 2019ndash2020 New Delhi MNRE
Policies for project planning and development phasesSeveral initial policies assigned the full responsibility for project planning and construction to developers This included locating and acquiring suitable land conducting resource assessments obtaining all clearances and permissions and bearing the cost of ensuring connectivity to the nearest evacuation point Although some policies did talk about single-window clearance through state nodal agencies the portal or facility was non-functional on the ground Some state policies for example Gujarat Solar Policy 2009 Andhra Pradesh Solar Policy 2012 Andhra Pradesh Wind Policy 2015 and Karnataka RE Policy 2009ndash14 did include enabling provisions for the facilitation of revenuebarren lands
bull Gujarat developed the first solar park in the country in 2012 ndash Charanka Solar Park ndash that houses around 600 MW capacity and provides the required infrastructure for projects
0
0
10000
10000
20000
20000
30000
30000
40000
40000
50000
50000
60000
60000
70000
80000
70000
200
820
08
200
920
09
2010
2010
2011
2011
Solar capacity growth
Wind capacity growth
Cap
acit
y (in
MW
)C
apac
ity
(in M
W)
2012
2012
2013
2013
2014
2014
2020
2020
2019
2019
2018
2018
2017
2017
2016
2016
2015
2015
AP
AP
Telangana
Telangana
Rajasthan
Rajasthan
Maharashtra
Maharashtra
Total
Total
Gujarat
Gujarat
Tamil Nadu
Tamil Nadu
Madhya Pradesh
Madhya Pradesh
Karnataka
Karnataka
31Policy evolution in RE-rich states
How Indiarsquos Solar and Wind Policies Enabled its Energy Transition A Decade in Review
bull The New and Renewable Energy Development Corporation of AP Limited (NREDCAP) in Andhra Pradesh worked with the statersquos revenue department to procure land in advance and sign long-term leases with the developers at predetermined rates
bull In Karnataka 10 per cent of barren government lands reserved for industrial use were allocated to Karnataka Renewable Energy Development Limited (KREDL) for RE development KREDL could sub-lease the identified revenue barren or panchayat lands to project developers for 30 years No procedure was specified for the selection of developers and allotment of land to them Therefore this later led to land banking by wind developers As per the state policy KREDL was supposed to undertake wind resource assessment studies identify potential sites and notify land parcels as reserved for wind project development
Many policies did not specify the application procedures to be followed by the project developers For example Tamil Nadu Energy Departmentrsquos Policy Note 2012ndash13 was totally silent on land allocation criteria ndash for land owned by the statersquos revenue department and for private lands (TN Energy Department 2012) Hence almost the entire wind capacity in the state is installed on private lands The criteria for allotting land developed by state nodal agencies (SNA) or special purpose vehicles (SPVs) was not articulated ndash whether it was first-come-first-served basis or a robust assessment framework for leasing land or a system that prioritised certain project categories The arrangements under which the land could be allotted to developers were mainly land-lease-based However the policies were not clear on how these lease values will be determined Mostly these rates were linked to market prices which could increase significantly owing to land-use patterns and the limited availability of land
The land-related provisions in state wind policies or their silence on those aspects led to developersmanufacturers acquiring huge tracts of private land in wind-rich states which they could retain while carrying out wind resource assessments (Naidu 2013) They started implementing the project once the desired infrastructure came up or once they struck a deal with the offtaker As a result the per MW capital costs were high because of a huge component of land premiums that were built into it However this could be considered a way to address the risks wind developers had to bear at that time
Grid connectivity policiesAccording to the Grid Code for intra-state networks the state transmission utility (STU) or discom is responsible for strengthening grid infrastructure to evacuate RE power and bears the associated costs It is also responsible for extending the grid up to the pooling sub-station However given the financial health of discoms and some STUs these steps were rarely taken States took to ad-hoc arrangements to establish grid connection For example in Gujarat the following solution was adopted the STU provided the necessary equipment for connecting projects to the grid while the developers provided the workforce and the required finances This arrangement was then followed by many other RE-rich states Thereafter the parkzone approach was promoted under several later policies
As per the CERC (Grant of Connectivity Long-term Access and Medium-term Open Access in Inter-state Transmission and Related Matters) Regulations 2009 renewable energy plants of
323232
Many policies did not specify the application procedures to be followed by the project developers
more than 50 MW could connect to the ISTS to take advantage of reduced congestion in the higher-voltage grid but no wind or solar plant availed of that option till as late as 2018 This could have been because project development frameworks and power sale contracts were signed with local entities Or under the point of connection transmission pricing (on a MW basis) the charges on wind projects may have been a burden as their capacity utilisation factors are lower than that of thermal power plants Further at that time and even now PGCIL substations are often far from wind farm sites resulting in high connectivity costs for developers
Policies addressing project operations and power procurementMost policies provided for power procurement by discoms from wind and solar plants through long-term PPAs to meet the RPOs Many states in 2012ndash14 experienced power shortages Therefore RE was also considered an option to meet the demand of large commercial and industrial units in these states For example the Karnataka Electricity Regulatory Commission (KERC) notified a fixed-term concessional open-access regime for solar energy including exemption from wheeling and banking charges and cross-subsidy surcharge for the first 10 years of operation for solar projects that did not fall under the REC mechanism However this was rolled back in 201818 Many other states offered incentives and exemptions such as nil or minimal wheeling and transmission charges for wheeling of power consumed within the state cross-subsidy surcharge exemption for open access obtained for third-party sales within the state exemption from paying electricity duties for sale to discoms andor for captive consumption and third-party sale within the state and different arrangements for banking of RE power
It appeared that most RE-rich states preferred RE plants to sell power to discoms or third parties or serve captive demand within the state itself For example
bull Maharashtrarsquos New Policy for Power Generation from Non-Conventional Sources 2008 required developers availing the benefits of the policy to sell 50 per cent of the electricity generated from the plant to the discom ndash Maharashtra State Electricity Distribution Company Limited (MSEDCL) ndash at the Maharashtra Electricity Regulatory Commission (MERC)-approved rate under the PPA and the remaining 50 per cent only within the state
bull Karnatakarsquos Renewable Energy Policy 2009ndash14 required RE plants to sell electricity to discoms under PPAs approved by KERC or use it for captive purposes There was no mention of third parties within the state who could buy RE power through open access
bull Andhra Pradeshrsquos Solar Policy 2012 captures only intra-state sale of power to discoms or third party
CurtailmentFollowing the Grid Code the must-run status of RE plants was adopted by states in their respective grid codes However inadequate grid availability has been a challenge in RE-rich states more so in the period 2009ndash2014 In Tamil Nadu wind generation increases significantly during the monsoons (AprilndashSeptember) when power demand is also relatively low Before 2014 the intra-state grid was unable to absorb the excess generation due to low demand and could not transmit it to other regions because of limited inter-connections with
18 Order dated 14 May 2018 issued by the KERC in matter no S032017 titled In the Matter of Revision of Wheeling and Banking Charges for Renewable Power Projects httpskredlinfoingeneralwheeling20and20banking20charges2014052017pdf
33Policy evolution in RE-rich states 33Policy evolution in RE-rich states 33Policy evolution in RE-rich states
During 2012ndash14 many states experienced power shortages Therefore RE was also considered an option to meet the demand of large commercial and industrial units
How Indiarsquos Solar and Wind Policies Enabled its Energy Transition A Decade in Review
Table 10 2010ndash2014 Developments that held back RE deployment and associated risks that remained
Note Authorsrsquo analysis
Corresponding risks
Inadequate support for land procurement
Lack of evacuation infrastructure and delays in grid connectivity
Mismatch between national targets and state RPO trajectories low RPO compliance
Poor credit profile of state discoms
Uncertainty in incentives ndash lapsing and withdrawal of GBI and AD
Curtailment of power
No provisions for RE sale outside the state
Delay in commissioning leading to cost overrun
National targets at risk restricted marketsdemand
Offtake risk payment risk
Cashflow risks
Offtake risk
Restricted marketsdemand
Inadequate support for land procurement
Inhibitors
42 Policies post- 2014 From 2014 onwards the Indian market witnessed a steep fall in solar tariffs owing to a variety of reasons ranging from domestic factors to global developments The NSM was successful in signalling Indiarsquos commitment towards solar development Although the rate of installation was slow during 2012ndash2014 and risks and inhibitors continued (Table 10) investor outlook remained positive
Key driversAs power deficits in states reduced demand grew slower than expected and solar tariffs declined drastically In response most RE-rich states developed policies with the intent of ensuring state-level energy security meeting agricultural and domestic loads through solar and aiming to become investment-friendly destinations In addition creating employment opportunities through project deployment as well as local manufacturing and responding to local environmental challenges and addressing climate change risks remained some of the commonly stated drivers across these states
Policy focusMost policies starting 2014ndash15 included provisions to facilitate the development of large-scale solar parks in a systematic and structured manner with the help of SECI Instead of individual states conducting their own auctions to procure solar power and meet their solar RPOs states preferred to buy power through SECI while continuing to procure wind power directly at preferential tariffs till 2017 Many policies specified clear targets to be achieved over
the national grid This led to the severe curtailment of wind power In 2014 the southern grid was inter-connected with the national grid providing some relief to the southern states but many industry players (Saumy 2019) and the MNRE (Chandrasekaran 2017) have continued to ask states to prevent curtailment of RE power Curtailment for wind power plants averaged around 30ndash35 per cent of generation in the peak season during 2012ndash15 (Jhawar 2020)
34
a five-year period Most policies at least on paper aimed to mitigate project development counterparty and operations-related risks in the sector to lower the cost of RE generation in their respective states Progressive policies such as the Andhra Pradeshrsquos Solar Power Policy 2015 and Wind Power Policy 2018 provided deemed industry status to RE projects and explicitly accorded them must-run status Unlike in the pre-2014 era these policies acknowledged the need to facilitate the sale of RE power outside the state For example
bull The Rajasthan Solar Energy Policy 2014 aimed to meet the energy requirements of Rajasthan as well as India
bull Maharashtrarsquos Comprehensive Policy for Grid-connected Power Projects Based on New and Renewable (Non-conventional) Energy Sources 2015 aimed to facilitate the sale of renewable power outside the state once the statersquos RPOs were met The policy even included a provision for deemed open access for the sale of energy within or outside the state if permission is not granted within the period specified in the MERC regulations It also gave RE projects the option to terminate their existing PPA with the state discom and opt for open access
bull APrsquos Solar Power Policy 2018 provided transmission and distribution charge exemptions for inter-state wheeling of power (which was later rolled back through an amendment)
bull APrsquos Renewable Energy Export Policy 2020 aimed to facilitate the leasing of land for setting up RE power plants and manufacturing facilities and to export power to other states
The reason for this shift in focus is that RE-rich states would want to utilise their abundant land and resource potential to attract huge private-sector investments generate revenues for the exchequer and create local jobs but would not be able to absorb all the generation within the state to meet their own demand
Global market developmentsApart from reduced risk perceptions due to stronger institutional mechanisms developersrsquo expectation of fall in solar module prices also drove them to place extremely aggressive bids in the auctions (Deign 2017) Solar module prices witnessed an overall drop in prices (see Figure 9) However even small fluctuations in module prices can affect project economics adversely
35Policy evolution in RE-rich states
Unlike in the pre-2014 era the policies now acknowledged the need to facilitate the sale of RE power outside the state
Figure 9 Average module (multicrystalline) prices have declined (2011ndash2019)
Source IEA 2020 ldquoEvolution of Solar PV Module Cost by Data Source 1970-2020rdquo 30 June Accessed 28 November 2020 httpswwwieaorgdata-and-statisticschartsevolution-of-solar-pv-module-cost-by-data-source-1970-2020
0
1412
0908 08
0706
05
0302
12
1
08
06
04
02
201320122011 2014 2018 20192015 2016 2017
USD
per
Wat
t
How Indiarsquos Solar and Wind Policies Enabled its Energy Transition A Decade in Review 36
There were short periods when module prices increased during 2017ndash2020 due to various reasons such as China slashing its subsidies reduced polysilicon supply in China module suppliers demanding price renegotiation and supply chain disruptions due to the COVID-19 pandemic (Bridge to India 2017) Excessive reliance on imported modules and largely from a single country makes the projects vulnerable to geopolitics and domestic policies intended to promote domestic manufacturing (Chawla 2020)
Wind tariffs declined following the initial rounds of bidding however the decline was not at the same pace as that of solar Even as discovered tariffs kept declining and were comparable with or even lower than tariffs of thermal projects RPOs remained the key driver and the primary Central Government lever for states to increase their RE uptake This is primarily because of the additional cost implications for discoms as they balance the increased variability in the system while being tied-up in long-term thermal PPAs
Performance of policiesAlthough all the policies seemed to be favourable and directed towards providing an enabling environment for RE development on-ground implementation and compliance remained weak which was the main reason for the prevailing risks in the sector Almost all RE-rich states like Tamil Nadu Andhra Pradesh Gujarat Karnataka Rajasthan and Maharashtra have made policy and regulatory decisions on electricity matters that have often been inconsistent with national policies and priorities They have made retrospective changes to policies threatened to renege on existing PPAs delayed payments to RE generators and curtailed RE power
One main reason for these inconsistent and ad-hoc actions was the drastic and rapid decline in solar tariffs starting 2014 (see Figure 10) The wind sector too transitioned to competitive bidding in late 2016 because of the success of reverse auctions in reducing solar tariffs While competition and reduced tariffs were desirable outcomes for Central policies it led to states losing confidence in RE PPAs signed at higher tariffs as compared to the lower tariffs discovered in subsequent auctions This not only led to the re-negotiation of PPAs but also delayed the procurement of new RE capacity in anticipation of further declines in tariffs
On the other hand the policies helped advance the setting up of solar parks which was a comforting factor for developers and investors and one of the contributing factors for
Figure 10 Solar tariffs discovered in Indian auctions
Source India RE Navigator 2020 ldquoAuction Resultsrdquo Accessed November 28 2020 httpsindia-re-navigatorcomwind
0
1210
864
2
2010
-13
2014
2018
2019
2020
2015
2016
2017
Central State
INR
kW
h
37Policy evolution in RE-rich states
bringing down tariffs However there were execution bottlenecks on the ground Project development was delayed because tenders were concluded while the park infrastructure was still under construction
Amongst the RE-rich states Karnataka has been a consistent performer for solar Under the Karnataka Solar Policy 2014ndash2021 it has recorded the largest solar capacity deployments in the country in 2017 2018 and 2019 In 2017 Karnataka installed more than 2 GW of large-scale solar and contributed to almost 25 per cent of the total capacity addition in India in that year By March 2019 with over 53 GW Karnataka had the highest installed capacity of utility-scale solar with a pipeline of around 28 GW Other state policies that have attracted investments include those of Rajasthan Andhra Pradesh Tamil Nadu and Maharashtra In 2018 these five states had more than 80 per cent of the countryrsquos utility-scale solar capacity
Meanwhile after SECI successfully concluded two auctions for wind energy in 2017 resulting in reduced tariffs many wind-rich states shifted to competitive bidding with SERC-determined generic tariffs as the tariff ceiling During 2017 states such as Gujarat and Tamil Nadu auctioned additional wind capacity to meet their non-solar RPO targets (Saurabh 2017) Seven wind-rich states installed 55 GW of wind capacity in 2016ndash17 (Raikar 2018) However in 2017ndash18 and 2018ndash19 the total wind installed capacity declined substantially to just around 18 GW and 14 GW respectively (IWTMF 2019) Low tariffs were quoted in initial bids but the subsequent tenders were undersubscribed most likely because the tariff ceilings were financially not feasible The main reasons for states not being able to achieve their wind policy targets were the conditions and risks that reverse auctions failed to address (i) wind resource is more concentrated than solar and high wind density sites are getting exhausted (ii) ISTS is not plannedavailable for moderatehigh wind sites (iii) bearing the costs associated with connecting to the nearest ISTS sub-station or connecting to STU networks instead adds to the risks and the resultant tariffs face tough competition from solarAmongst wind-rich states Gujarat led wind deployment in the country during 2016ndash2020 followed by Andhra Pradesh Karnataka and Tamil Nadu Figure 11 shows the annual wind capacity addition in these states
Karnataka has recorded the largest solar capacity deployments in the country in 2017 2018 and 2019
Figure 11 Gujarat saw the largest wind capacity additions among the wind-rich states (2016ndash2020)
Source Authorsrsquo analysis based on CSO Energy Statistics 2018 New Delhi MoSPI CSO Energy Statistics 2019 New Delhi MoSPI CSO Energy Statistics 2020 New Delhi MoSPI MNRE 2020 Annual Report 2019ndash2020 New Delhi MNRE
0
2000
1000
500
2500
3000
3500
4000
4500
5000
FY 2017
248 336772
316
1286
59
46087
123502
273
857
348
1303
882
2187
FY 2018 FY 2019 FY 2020
Cap
acit
y (in
MW
)
Andhra PradeshGujaratTamil Nadu Karnataka
How Indiarsquos Solar and Wind Policies Enabled its Energy Transition A Decade in Review
In 2019 political risks in the RE sector were exemplified when the new government in Andhra Pradesh took a strong stand on renegotiating wind and solar PPAs signed under Andhra Pradeshrsquos Wind Power Policy 2018 and Solar Power Policy 2018 (see Table 11)
Table 11 Timeline of the key events in the AP story
Source Authorsrsquo analysis
Date in 2019 Event
1 July
24 September
29 November
25 July
October
30 November onwards
1 December
12 July
AP government sets up a committee to renegotiate PPAsPSAs signed between 2012 and 2016
The AP High Court quashes the July 1 order and July 12 letters in writ petitions filed by the developers It directs the developers and discoms to approach the Andhra Pradesh Electricity Regulatory Commission (APERC) with their respective claims and to resolve all disputes in 6 months In the interim discoms will clear their dues and pay all power plants at the rate of INR 243 and INR 244 for wind and solar respectively
A compromise is reached between the Central and AP governments There is to be no tariff revision but concessional loans to be extended to discoms from PFC and IREDA to clear the dues
The AP High Court stays the July 1 order based on a petition by developers
Petition filed by AP discoms before APERC to review the tariffs
AP discoms clear pending dues at the rate of INR 243 and INR 244 for wind and solar respectively
The AP High Court stays the public hearing of the APERC on the tariff review petition filed by developers
Letter from AP Southern Power Distribution Company Limited (APSPDCL) one of the two state discoms to 139 wind and solar power plants to revise tariffs to INR 243 and INR 244 respectively
2016 onward SECIrsquos tendering activity has shifted towards ISTS-connected solar projects Between 2016 to 2019 it issued tenders worth 13000 MW of solar PV capacity (ISTS I to ISTS IX) and 12600 MW of wind capacity (Tranche I to Tranche IX) Figure 12 shows the deployment progress of solar projects awarded under the ISTS I to ISTS IX tenders by the SECI (as of August 2020)
Figure 12 ISTS-connected solar PV projects have poor completion record
Source Authorsrsquo analysis based on CEA 2020 Report of Under Construction Renewable Energy Projects New Delhi Renewable Energy Project Monitoring Division (CEA)
Solar PV capacity tendered
(ISTS-I to ISTS-IX)
13000
9530
4650
1800 17501080
250
Capacity awarded
PPAPSA or both not yet
executed
PPA and PSA signed
Financial closure
achieved
Plant erection in progress
Status not available
Cap
acit
y (in
MW
)
38
As is evident almost 50 per cent of the capacity that has been awarded is still awaiting closure of power purchase andor power sale agreements This implies that state discoms are not coming forward to offtake power from projects already awarded leaving developers and investors in a lurch For the capacity for which PPAs and PSAs have already been signed there have been significant delays because the required transmissionevacuation infrastructure is not ready and long-term access (LTA) to transmission has not been operationalised The COVID-19 pandemic has further impacted the construction of transmission lines increased delays and depressed electricity demand across the country Because of the lockdown enforced to curb the spread of the pandemic the MNRE had granted blanket extension of the scheduled commissioning timelines
For wind projects too the rate of commissioning has been rather slow (Figure 13) Most of the awarded projects will be coming up in Gujarat (Kutch) There were roadblocks with respect to the land allocation policy in Gujarat because of which no progress could be made Few projects are likely to come up in other host states such as Tamil Nadu Karnataka Maharashtra Madhya Pradesh and Kerala While the recent tenders (tranches VI to VIII) were undersubscribed several projects awarded earlier are facing delays due to non-readiness of transmission infrastructure and some projects have terminated their PPAs citing non-viability of projects at the discovered rates due to time and cost overruns Notably wind-rich sites are intrinsically more concentrated than solar logistically as well as resource-wise Therefore unless the sites are identified and prepared and transmission networks are appropriately planned strengthened in advance deployment would be slow One more option being tested is the windndashsolar hybrid or the blending approach and a bidding process akin to case I bidding in the conventional power sector to ease out on transmission variability and land-related risks
39Policy evolution in RE-rich states
Figure 13 The rate of commissioning of wind projects has been slow (August 2020)
Source Authorsrsquo analysis based on CEA 2020 Report of Under Construction Renewable Energy Projects New Delhi Renewable Energy Project Monitoring Division (CEA) CEA 2019 Summary of Solar and Wind Power projects (Commissioned and Under Construction) of SECI New Delhi Renewable Energy Project Monitoring Division (CEA)
Tendered (ISTS Tranche I to IX)
13400
9361
2085
Awarded Commissioned
Win
d c
apac
ity
(in M
W)
Policies facilitating land procurementThe MNRErsquos solar park scheme encourage states to develop solar parks to solve land procurement and connectivity problems All state policies encourage deployment in parks Most policies provide for designating solar power park developers (SPPDs) The SPPDs may be a state government-designated agency or a joint venture company (JVC) between a state-
How Indiarsquos Solar and Wind Policies Enabled its Energy Transition A Decade in Review 40
designated agency and SECI or a JVC between a state-designated agency and private agency or a private agency
The states under their respective solarRE policies have provided the necessary support and arrangements for developing the parks and projects have been successfully commissioned in the parks that are operational However there have been some challenges in developing these parks including problems in land acquisition by the SPPDs and mismatch in timelines for development activities and setting up of solar projects For example developers are facing several challenges with permissions clearances and approvals at the Kadapa Solar Park in Andhra Pradesh where the letters of award were issued in August 2018 but two years hence developers have yet not been able to begin any work there
For non-solar park projects land procurement is typically the generatorsrsquo responsibility particularly for projects set on private lands The Karnataka Renewable Energy Policy 2016ndash22 was the only policy that assigned the responsibility of identifying suitable land banks to the state nodal agency Andhra Pradeshrsquos Wind Power Policy 2018 and Solar Power Policy 2018 had entrusted NREDCAP with the responsibility of securing government lands However this provision was rolled back in 2019
The wind sector was again at a disadvantage here Most policies except recent solarndashwind hybrid policies did not address land requirements for wind power projects which are typically more concentrated in certain pockets In many cases windy sites were located far from plannedexisting intra- and inter-state networks Further all state policies require wind developers to either procure government land on a lease-hold basis on their own or procure private lands Even in SECIrsquos auction for ISTS-connected wind developers faced difficulties in securing land leases from the state governments and revenue departments For example while Gujarat had announced a wind power policy in 2016 to attract investments it took a policy decision in 2018 to not allocate any land to wind projects auctioned by SECI for exporting power to other states (Tenddulkar 2019) Later in January 2019 Gujarat announced a new land policy for wind solar parks as well as windndashsolar hybrid parks to demarcate land areas where these projects would be allowed
Policies for grid connectivity and project operationsFrom 2014 onward MNRE and SECI started coordinating with other line departments and agencies at the Central level to plan construct and strengthen intra- and inter-state networks To ensure the evacuation of power from 20 GW of wind and solar capacity the Centre sanctioned a project to augment the Intra-State Transmission System (InSTS) in 2015ndash16 STUs in eight RE-rich states ndash Tamil Nadu Rajasthan Karnataka Andhra Pradesh Maharashtra Gujarat Himachal Pradesh and Madhya Pradesh ndash are implementing this project
In 2016 the Ministry of Power waived off inter-state transmission charges and losses for wind and solar projects which is now applicable for projects being commissioned till June 2023 In state-level solarwindRE policies there appears to be some degree of disparity and uncertainty on grid connectivity evacuation forecasting scheduling and sale of power
In state-level policies there appears to be some degree of disparity and uncertainty on grid connectivity evacuation forecasting scheduling and sale of power
41Policy evolution in RE-rich states
bull As of July 2019 15 states had notified their regulations for forecasting scheduling and settlement of deviations for RE broadly in line with the CERC regulations (Srivastava Singhvi and Rustagi 2019) Most of these states permit an error band of (+-) 15 per cent as per CERC regulations In a few states such as in Tamil Nadu the error band is limited to a narrower range of (+-) 10 per cent Even within the same regional load dispatch region the error bands notified by states differ For example Maharashtra permits (+-) 15 per cent deviation while Gujarat allows only (+-) 12 per cent deviation for wind developers
bull Andhra Pradeshrsquos Wind Power Policy 2018 and Solar Power Policy 2018 stated that no transmission and distribution charges will be levied for inter-state wheeling of power Later the policy was amended in November 2019 and the exemptions were rolled back and charges as determined by the APERC were made applicable
bull To discourage open-access transactions of wind power Tamil Nadu increased the cross-subsidy surcharge for open-access consumers from 50 per cent of that for conventional power in 2016 to 60 per cent in 2018 Over the same period it also increased open-access charges from 40 per cent to 50 per cent of that for conventional power Such steps restrict significant new demand for RE amongst large commercial and industrial players by adding to the landed cost of RE power even as RE tariffs become cheaper than discoms tariffs
bull Banking charges for wind and solar vary by state The period of banking is also different for various states (Table 12)
bull Although RE is accorded a must-run status by several policies and grid codes curtailment continues for technical as well as commercial reasons Older projects that have higher tariffs face higher curtailment than newer projects In Tamil Nadu curtailment has reduced from a peak of 30ndash35 per cent to 20ndash25 per cent currently (Jhawar 2020) However it appears that commercial concerns are causing the Andhra Pradesh discoms to curtail RE power despite repeated judicial directions against it (Parikh 2020)
How Indiarsquos Solar and Wind Policies Enabled its Energy Transition A Decade in Review 42
Table 12 Banking charges and conditions across RE-rich states
Source Authorsrsquo adaptation based on MERC (Distribution Open Access) (First Amendment) Regulations 2019 Order No 82020 dated 7 October 2020 issued by the TNERC titled Order on Procurement of Wind Power and Related Issues Order No 22020 dated 30 April 2020 issued by the GERC titled Tariff Framework for Procurement of Power by Distribution Licensees and Others from Wind Turbine Generators and Other Commercial Issues for the State of Gujarat RERC (Terms and Conditions for Tariff Determination from Renewable Energy Sources) Regulations 2020 Order dated 14 May 2018 in matter No S032017 issued by the KERC titled Revision of Wheeling and Banking Charges for Renewable Power Projects
Banking charges Other conditionsBanking period
No banking charges for wind projects
10 per cent of RE banked in kind
14 per cent of input energy
No banking charges
2 per cent of RE banked in kind
2 per cent of the injected energy in kind
No banking allowed
One month
April to March barring peak hours as determined by the discoms
One FY (April to March)
One month
One month
January to June ndash for wind projects
April to September and October to March ndash for solar projects
Monthly settlement for non-REC wind projects
Banking facility not available for third-party sale and REC-based captive power plants (CPP)
Energy banked during the peak time of day (TOD) hours may be drawn during off-peak TOD slots but not vice-versa
The unutilised banked energy at the end of the month up to 10 per cent of the total energy generated in that month to be purchased by discoms at the applicable generic tariffs for the year
Unutilised banked energy at the end of six months to be purchased by discoms at 85 per cent of the applicable generic tariff
The energy banked by non-REC projects during the peak ToD hours can only be drawn during the peak ToD hours
Banking allowed for CPP but not for third-party sales under open access within the state
The unutilised banked energy will lapse at the end of the year
The unutilised banked energy as of March 31 to be encashed at 75 per cent of the applicable wind energy tariff for existing wind energy captive users
Excess generation or unutilised banked energy at the end of the month to be purchased at 75 per cent of the wind energy tariff for captive users For captive REC generators the unutilised banked energy can be encashed at 75 per cent of the pooled cost of power
Gujarat
Rajasthan
Tamil Nadu For wind projects commissioned till 31 March 2018
For wind projects commissioned on or after 1st April 2018
Maharashtra
Karnataka
Andhra Pradesh
State
43
5 Policy evolution in RE-deficit states
Image iStock
As discussed above southern and western states in India have abundant RE and land resources to develop large-scale wind and solar power projects However the northern
states in the Indo-Gangetic plains are densely populated agricultural states The mountain regions in the north have excellent solar resources and are sparsely populated but have forest areas and difficult terrains and low transmission capacities The coal economy is dominant in the eastern states
How Indiarsquos Solar and Wind Policies Enabled its Energy Transition A Decade in Review 44
The policy response to developing large-scale solar and wind has been weak in the non-RE-rich states as compared to RE-rich states Our review accounts for three key states ndash Uttar Pradesh Bihar and Punjab
Key driversThe key drivers for promoting RE were poor power supply in the rural as well as urban area growing energy needs in urban industrial and commercial sectors and the need to comply with RPOs Policies intended to attract private-sector investments improve rural livelihoods and create employment opportunities through grid-connected decentralised RE projects and local manufacturing facilities
Policy focusMost of the initial policies were notified starting late 2012 and largely focused on decentralised RE such as rooftop solar solar irrigation pumps off-grid renewables and other RE resources such as bioenergy For example
bull Punjab New and Renewable Sources Policy 2012 focused on rooftop and decentralisedoff-grid generation waste to energy biomass-based cogeneration and new technologies
bull Uttar Pradeshrsquos solar policies of 2013 and 2017 focused on decentralised solar as well as large-scale grid-connected solar because of wastelands being available in the Bundelkhand region
bull Bihar Policy for Promotion of New and Renewable Energy Sources 2011 focused on biomass and biogas cogeneration projects minimicrosmall hydro wind and solar and municipal solid waste-based projects but with no specific targets
These statesrsquo policies promoted the local deployment of projects There was little emphasis on discoms buying wind and solar power from other states or buy RECs to meet solar and non-solar RPOs which were set relatively low as compared to RE-rich states This may be because the states were keen to attract investments and create jobs in their own states and bolster their own generation capacities rather than depending on other states
Even the recent policies of the RE-deficit states do not demonstrate any intent to purchase powerRECs to meet RPOs particularly the non-solar component
Performance of policiesAmong the RE-deficit states Uttar Pradesh and Punjab are leading in terms of solar deployment They are among the top 10 solar states in the country However their RPO compliance has remained weak In the year 2019ndash20 the compliance level for Uttar Pradesh was only 353 per cent whereas for Punjab it was 438 per cent (MoP 2020a) Uttar Pradesh discoms also rank among the least performing discoms of the country (ICRA Limited and CARE Ratings 2019)
Uttar Pradesh notified two solar policies ndash once in 2013 which was later superseded by a policy in 2017 The 2013 Solar Policy stated a target of 500 MW of solar capacity to be deployed
Policies in RE-deficit states promoted local project deployment with little emphasis on discoms buying wind and solar power from other states or RECs to meet RPOs
45Policy evolution in RE-deficit states
by 2017 This policy was the first of its kind because it had an exclusive budgetary allocation for discoms to procure solar power and for state nodal agencies to effectively administer and implement the policy The policy achieved 420 MW against the target of 500 MW by 2017 but presented some uncertainties such as
bull The duration of power purchase agreements was made 10 years as opposed to the usual practice of 25 years the possibility of extending PPAs beyond the 10-year duration at the prevailing APPC price did exist but this represented an uncertainty for developers
bull Strict enabling provisions for establishing solar parks were missing As a result developers reported delays due to the lack of grid infrastructure and difficulties in allotting ready land inside solar parks
The Uttar Pradesh New and Renewable Energy Development Agency (UPNEDA) initiated a competitive bidding round in March 2013 which led to the discovery of tariffs in the range of INR 801 to INR 933 per unit among the highest for any state during that time These high tariffs may be attributed to real and perceived risks specific to the policy as well as the legacy power sector issues in the state Later there were many instances when UPrsquos distribution companies renegotiated tariffs under the PPAs signed during 2015ndash16 This affected completed and under-construction grid-connected solar projects as well as the investor confidence in the sector
The UP Solar Power Policy 2017 set high targets ndash 10700 MW of installed solar capacity by 2022 out of which 6400 MW should be utility-scale projects Some improvements that were made included PPAs for 25 years facilitative provisions for land procurement additional incentives for projects in the Bundelkhand region and modalities for establishing solar parks Currently 973 MW of large-scale solar projects are in operation and about 17 GW capacity is under development (Ranjan 2020)
Recent tenders by UPNEDA have been cancelled or undersubscribed In July 2018 UPNEDA cancelled a 1 GW tender floated in January citing high tariffs Two tenders of 500 MW each in January and October 2019 were undersubscribed The reasons reported for under-subscription included inadequate gridevacuation infrastructure particularly in the Bundelkhand region and the changes made in the PPA
Punjab under its New and Renewable Sources of Energy (NRSE) Policy 2012 aimed to install 1000 MW solar by 2017 Till FY 2020 it had installed 947 MW (MNRE 2020) Although the policy emphasised installations within the state the potential for large-scale solar power in the state is limited Therefore Punjab has been procuring solar and wind power from ISTS-connected projects to meet its solar and non-solar RPO targets Punjab State Power Corporation Limited (PSPCL) signed long-term agreements with SECI and NTPC and has entered into short-term agreements with wind and solar generators for this purpose
The Bihar Policy for Promotion of New and Renewable Energy Sources 2011 was notified in June 2011 It did not state any specific targets for the segments covered The new policy in 2017 set a target of 2969 MW from solar by 2022 out of which 1000 MW was dedicated to grid-connected rooftop solar Even though this policy was notified in June 2017 it did not explicitly put out the intent to purchase solar and wind power through inter-state transactions or
45Policy evolution in RE-deficit states 45Policy evolution in RE-deficit states
In Uttar Pradesh competitive bidding in early years discovered tariffs that were higher compared to other states signalling the high risk perception amongst the industry
How Indiarsquos Solar and Wind Policies Enabled its Energy Transition A Decade in Review 46
Central procurement through SECI By December 2019 Bihar had installed 341 MW of RE capacity (CEA 2020a) out of which grid-connected solar was 149 MW and the rest was non-solar (small hydro biomass cogeneration etc) In FY 2018ndash19 Bihar discoms procured 10 MW solar and 300 MW wind power through SECIrsquos ISTS-connected projects19 In June 2019 the Bihar Renewable Energy Development Authority (BREDA) issued its first tender for setting up 250 MW of ground-mounted solar projects in the state which was re-issued in December 2019 because the state regulatory commission did not approve the high ceiling tariffs With these efforts however Biharrsquos RPO compliance at the end of March 2020 was 15 per cent with respect to Central trajectories (MoP 2020a)
Grid integrationThe initial policies by these states had some typical provisions regarding grid connectivity and transmission of power Like many other state policies on connectivity Uttar Pradeshrsquos solar power policies as well as Punjabrsquos RE Policy 2012 required developers to lay their own transmission lines to the nearest sub-station at their own cost However the UP government committed to bear all transmission-related expenditure for all solar projects in the Bundelkhand region Under Biharrsquos RE Policy 2017 the state government committed to bear connectivity-related expenditure only in cases where the RE plant is located within 10 km from the nearest sub-station
Transmission chargesPunjabrsquos 2012 policy accorded must-run status to grid-connected renewables and exempted transmission and wheeling charges for intra-state open-access sales for 10 years for RE projects commissioned up to 31 March 2017 No explicit exemptions were provided for inter-state open access unlike Uttar Pradesh which interestingly under its Solar Power Policy 2017 allowed the solar developer to sell power across the country with a 100 per cent waiver of transmission charges ndash a one of its kind provision among policies rolled out by RE-deficit states Biharrsquos RE Policy 2017 provided exemptions for wheeling of power from RE projects put up for captive use or intra-state third-party sales
Incentives for project development and operationsIt is interesting to note that some provisions in these policies were outstanding For example
Offtake and payments
bull Punjab required procurers to clear all payment dues within 60 days with rebate entitlements as incentives for early clearances
bull UP allocated budgetary support for the first 200 MW of solar projects to be payable to discoms to equalise solar and conventional power This support was equivalent to the difference between tariffs discovered for conventional power through case I bidding and the solar power tariffs discovered through reverse bidding
19 Order dated 20 March 2020 in Case No 30 2019 and 312019 issued by the BERC titled Tariff Order Truing up for FY 2018-19 Annual Performance Review for FY 2019-20 Annual Revenue Requirement (ARR) and determination of Retail Tariff for FY 2020-21 for North Bihar Distribution Company Limited (NBPDCL) and South Bihar Distribution Company Limited (SBPDCL) httpsberccoinorderstariffdistributionsbpdcl2216-tariff-order-of-nbpdcl-for-fy-2019-22
Uttar Pradesh under its Solar Power Policy 2017 allowed solar developers to sell power across the country with a 100 waiver of transmission charges
Ease of doing business investor attractiveness facilitation
bull Punjab assigned the Bureau of Investment Promotion the task of granting regulatory clearances and fiscal incentive approvals
bull Punjab extended benefits to RE projects under its Fiscal Incentives for Industrial Promotion Policy 2013 It also provided 50 to 100 per cent exemption on stamp duty property tax and electricity duty
bull Incentives under the Uttar Pradesh State Industrial Policy 2012 applied to power plants based on solar energy
bull All RE plants set up for commercial sale of power were eligible for an additional 30 per cent tax benefit on the approved project cost
bull Bihar established a Renewable Energy Development Fund under the new policy notified in 2017 This fund was supposed to be capitalised through
raquo a one-time facilitation fee of INR 100000 per MW payable during the application process for a project of more than one MW capacity
raquo a RE development cess of 10 paise per unit of power sold in the state by discoms (excluding below poverty line and agricultural consumers) subject to Bihar Electricity Regulatory Commissionrsquos (BERC) approval and
raquo a service charge of 7 per cent payable to BREDA for the execution of RE projects However this seems to be a proposal in the policy and is not executed in practice yet
47Policy evolution in RE-deficit states
How Indiarsquos Solar and Wind Policies Enabled its Energy Transition A Decade in Review 188
Image iStock
Discoms continue to be tied-up with long-term PPAs and most investors continue to base their business projections on Central and state bidding pipelines
49
With the evolving policy landscape at the Central and state level we have seen Indiarsquos renewable energy sector grow tremendously In 2010 the total installed RE capacity
was just about 18 GW which has grown almost five-fold over the decade
As our analysis suggests there were high and low points in this journey Every time a roadblock emerged India has been successful in testing and identifying alternate approaches and solutions Some of these include bundling solar power with conventional power to counter high tariffs in 2010 introducing solar parks when deployment became slow and tough increasing RPO targets to create the necessary demand creating and backing SECI to address counterparty risks accelerating tendering activity to signal a commitment to creating strong pipelines encouraging solarndashwind hybrid parks to improve utilisation factors introducing protocols and mechanisms such as market-based economic dispatch a real-time market and a green term ahead market to optimise grid integration costs With economics favouring RE its share in Indiarsquos electricity mix is only expected to grow
De-risking investments in project development has unquestionably been the focus of the policies thus far However policies have mostly not pre-empted any of the risks but developed through an iterative process that has mostly responded to immediate investor concerns Hence non-compliance with RPO targets by the states was met with centralising target setting and making them even higher the Centre responded to PPA renegotiation attempts by states with intra-se negotiations with the states and financial relief to the concerned states for addressing payment delays by discoms the Centre imposed additional financial liability on the discoms by way of the LC mechanism
Imminent market disruptions Further while CERC and the power exchanges have taken forward looking steps with introducing new market platforms there has yet been no attempt to create avenues for participation of greenbalancing power providers and buyers in these markets The discoms continue to be tied-up with long-term PPAs and most investors continue to base their business projections on Central and state bidding pipelines Other developments that threaten the investorsrsquo current business model include
bull Expectations of returns have increased since early 2019 that indicates that risk perceptions of investors have also increased (investors expect higher returns for riskier investments)
6 Looking back to look ahead
Recent developments threaten investorsrsquo current business models
How Indiarsquos Solar and Wind Policies Enabled its Energy Transition A Decade in Review
There are fewer developers who are cornering a greater share of the projects (Dutt Arboleya and Gonzalez 2020) This could mean that entry barriers to the sector are increasing and the incumbents will have a high stake in maintaining status quo Further the exit of many smaller players by selling their assets indicates that navigating Indiarsquos policy and governance environment remains a challenge (Chandra 2020)
bull Commercial and industrial consumers are increasingly turning to DRE to meet their power needs The MoP has recently floated a plan to create lsquoindustrial hubsrsquo that will have their own power supplier This power supplier is likely to be a private entity given the status of a deemed licensee under the EA (Jai 2020) Further calls for lowering commercial and industrial tariffs are becoming louder in the wake of economic downswing (Financial Express 2020) These developments threaten the principal source of revenue for the discoms and will have a cascading effect on ability of discoms to absorb RE power and invest in grid integration Poor revenues will worsen their ability make payments under the PPAs
bull The increasing competitiveness of DRE also makes them an important source of supply for the power markets Discoms are discovering benefits of economising on total power procurement costs by procuring power from the exchanges (Thomas 2020) If given the flexibility it is likely that discoms would prefer to expand exchange-based procurement rather than signing PPAs for all their projected load
bull The unexpected reduction in wind generation in 2020 by up to 43 per cent during the typical high generation period due to low wind speeds caught project developers and system operators by surprise (Singh and Mohanty 2020) Climate change could bring greater uncertainty and variation in weather patterns Project developers need to be better prepared with rigorous and advanced weatherresource forecasting and tools and techniques to make timely and robust investment and operational decisions
bull End of life waste management is going to be a serious concern very soon Developers might not have factored this into costs and current policies are unclear as to who will be required to bear these costs Developers must pre-emptively focus their attention to waste management and not be unpleasantly surprised when the government eventually wakes up to the challenges (Tyagi and Kuldeep Forthcoming)
Policies must pre-empt risks and support transition to a market-driven sector
We are now entering the next decade which could make India a RE powerhouse A target of 450 GW of RE by 2030 has been set However addressing new and legacy issues of the power sector cost-effectively managing the operations of existing assets while also integrating a large quantum of new renewable capacity are challenges that confront us today
Centrendashstate and inter-state alignment requires collaboration not mandates and penalties
Over the last three years RE costs have fallen significantly At the same time regulations allow the transmission of power from a RE-rich state to any other state in the country or the purchase of RECs for an entity to meet its RPO Despite all the obvious benefits that RE
50
It is likely that discoms would prefer to expand exchange-based procurement rather than signing PPAs for all their projected load
51Looking back to look ahead
resources have to offer states have shown some level of resistance to either deploying or buying more RE power and meeting the national targets We have seen above that states do push back when it does not make commercial sense for them or they are unable to allocate resources to meet national targets Policies so far have not resulted in alignment of Centre-state objectives and actions Further there is no institutional or political platform to bring together Centre and state representatives for collective problem solving The Centre has previously determined national capacity and consumption targets unilaterally without previous consultations and engagement It appears that the current policies and mechanisms must evolve if the gaps between RE-rich and RE-deficit states are to be bridged Some approaches to increase alignment may be
bull Account for all the costs benefits and co-benefits of achieving national targets Subsequently the principles of cost- and benefit-sharing must be established and reflected in Central policies inter-state regulations and market mechanisms to drive states towards meeting national goals and objectives An example of sharing costs may be that RE-deficit states support RE manufacturing industry and make it cost competitive globally This will create a buy-in for RE-deficit states in promoting and adopting RE
bull For long-term clarity directional uniform RPO targets can be set out for all states However states may be given the freedom to choose their own technologyclean energy mix to meet the national target
bull Institutional mechanisms may be devised that bring together the Centre and the states for resolution of issues and greater buy-in of the states towards national objectives
Addressing counterparty risks will require transformation of RE procurement models
While Indiarsquos commitment to RE is strong and sustained the consistent poor financial health of discoms poses significant risks to further growth of the sector These risks include delayed payments power curtailment and contract re-negotiation We have learnt from our policy experience so far that mandates and higher penalties have limited impact Project deployment has decreased despite the Centre taking strict and swift action against errant discoms Fundamental reforms in the distribution sector and market operations will be needed to mitigate these risks For example
bull Increasing the ability of discoms to access cheaper balancing resources
bull Rigorous demand forecasting to identify power purchase requirements under long-term contracts
bull Adopting alternate models such as solar power irrigation pumps or using distributed RE for meeting productive and consumptive loads in rural areas to reduce the subsidycost burden on discoms or urban micro-grids to manage peak loads (Tyagi Kuldeep and Dave 2020)
bull Adopting market-based procurement mechanisms for storage capacities including battery pumped storage hydro resources etc
bull Simplifying and rationalising retail tariff structures and adopting alternate subsidy disbursement mechanisms to ensure revenue recovery
Measures required to improve discom financial health and increase their flexibility in power procurement may not be aligned with the incumbent business models
How Indiarsquos Solar and Wind Policies Enabled its Energy Transition A Decade in Review 52
bull Encouraging enhanced participation in new mechanisms such as market-based economic dispatch of power plants real-time markets ancillary markets etc
However all these measures that are required to improve discom financial health and increase their flexibility in power procurement may not be aligned with the incumbent business models Investors and project developers must adapt to new market contours to stay relevant
Contrasting interests of RE manufacturers and developers must converge
Project developers have viewed policies that have aimed to support domestic manufacturing adversely or indifferently Developers preferred cheaper thin film modules when DCR was part of the NSM as against procuring locally manufactured crystalline modules Project activity slowed down when safeguard duty was introduced Developers have also been arguing against imposition of customs duties that is being demanded by manufacturers
However local manufacturing and backward and forward integration of not only generation equipment but also battery storage is essential for RE sector to be future ready and insure against geopolitical risks Lessons learnt from the COVID-19 pandemic and geopolitical tensions must be internalised Developers and manufacturers must collectively find solutions that work for them They can take cues from the initial days of spread of wind technology Wind technology in India spread through research and demonstration collaborations between countries Equipment manufacturers also expanded into project development that gave them a stake in project activity as well as manufacturing More integrated supply chains and linkages must be explored by developers and manufacturers
Institutional framework ndash planning coordination and analytical requirements
Strong institutions are prerequisites for better performance and coordination Developers must aim to work with both Central and state institutions to create data sharing and information protocols For example there is not enough data to detect reasons for curtailment As we aim to increase the share of RE in the electricity mix strong institutions with clear performance standards and a coordination mechanism are essential The functions roles and responsibilities of key power sector institutions need to evolve with national ambitions For example
bull Strict monitoring and reporting of RE curtailment and the underlying reasons
bull Data and information-sharing protocols and analytical requirements for specific institutions
bull Instituting processes for bottom-up integrated resource planning (IRP) to build an optimal and cost-effective electricity system This will include relevant Central level institutions to develop and disseminate guiding frameworks toolkits and processes that any state can utilise to conduct a robust planning exercise
bull Coordination mechanism to consistently monitor the implementation of policies programmes and plans by institutions
Such new roles and responsibilities must be formally assigned to institutions for reducing
Strong institutions with clear performance standards and a coordination mechanism are essential
53
discretion ensuring greater alignment between the Centre and states enhancing the ease of doing business reducing risks for investors and accelerating the pace of the energy transition
Accelerating the flow of capital into the sector
To achieve Indiarsquos ambitious RE targets for 2030 the country would need an additional investment of USD 199 billion (approximately INR 146 lakh crore) in generation alone Investments in transmission and storage will be over and above this (Singh Dutt and Sidhu 2020) Most of this requirement will need to be met through debt finance It is a challenge to raise such enormous amounts of debt capital when our financial institutions are already crossing the regulatory limits of exposure to the power sector As noted above the sector is seeing robust secondary market activity This has become a crucial source of finance for project developers who hive off operational assets to raise funds for fresh investment Investment trusts in infrastructure (InvIT) that have tax incentives may emerge to be an attractive model for divestment of assets especially for divestment to institutional investors who want predictable returns without managing the assets directly In the power sector transmission assets have been structured as InvITs and helped the promoter retain interest in the project while obtaining additional equity investment
Sectoral and financial policies would need to focus on tapping alternative sources of financing Research by the Council on Energy Environment and Water (CEEW) suggests that the issuance of domestic bonds for refinancing loans can unlock the ability of these institutions to lend to new RE projects According to the research this option may be operationalised by providing a limited period credit enhancement subsidy for domestic RE bond issuances
Looking back to look ahead
How Indiarsquos Solar and Wind Policies Enabled its Energy Transition A Decade in Review
Aggarwal Manu and Kanika Chawla 2019 Grid Integration Guarantee A Financial Buffer to Address Renewable Energy Curtailment New Delhi CEEW httpswwwceewinsitesdefaultfilesCEEW-Grid-Integration-Guarantee-17ul19pdf
Arora Bhanvi 2019 ldquoWhy Indiarsquos Wind Turbine Makers Are Under Stressrdquo Bloomberg Quint 22 August Accessed 12 October 2020 httpswwwbloombergquintcombusinesswhy-indias-wind-turbine-makers-are-under-stress
Balan Premal 2014 ldquoAptel Rejects GUVNLrsquos Bid to Cut Solar Power Tariff in Gujaratrdquo Business Standard 27 August Accessed 12 October 2020 httpswwwbusiness-standardcomarticlecurrent-affairsaptel-rejects-guvnl-s-bid-to-cut-solar-power-tariff-in-gujarat-114082700828_1html
Bhaskar Utpal 2020 ldquoHow Rewa solar park helped Indiarsquos green economy turn a cornerrdquo Mint 10 July Accessed 12 October 2020 httpswwwlivemintcomindustryenergyhow-rewa-solar-park-helped-india-s-green-economy-turn-a-corner-11594352166677html
Bridge to India 2017 ldquoIndian developers caught between a rock and a hard placerdquo 28 August Accessed 26 November 2020 httpbridgetoindiacomindian-developers-caught-rock-hard-place
Buckley Tim and Kashish Shah 2020 Indiarsquos Renewable Energy Policy Headwinds New Delhi IEEFA httpsieefaorgwp-contentuploads202002Indias-Renewable-Energy-Policy-Headwinds_February-2020pdf
CEA 2019a Growth of Electricity Sector in India From 1947-2019 New Delhi CEA MoP
CEA 2019b Summary of Solar and Wind Power projects (Commissioned and Under Construction) of SECI New Delhi Renewable Energy Project Monitoring Division (CEA) httpsceanicinreportsothersplanningrpmSECI20Project_Summarypdf
CEA 2020a All India Installed Capacity as on 31 December 2019 New Delhi CEA httpswwwceanicinreportsmonthlyinstalledcapacity2019installed_capacity-12pdf
CEA 2020b Executive Summary on Power Sector April 2020 New Delhi CEA httpsceanicinwp-contentuploads202006exe_summary-04pdf
CEA 2020c Report of Under Construction Renewable Energy Projects New Delhi Renewable Energy Project Monitoring Division (CEA) httpsceanicinreportsothersplanningrpmunderconstructionpdf
CERC 2018 Discussion Paper on Market Based Economic Dispatch of Electricity Re-designing of Day-ahead Market (DAM) in India New Delhi CERC httpwwwcercindgovin2018draft_regDP31pdf
Chandra Rohit 2020 ldquoCheering a Lap-win in an Unfinished Racerdquo Financial Express 1 December Accessed 1 December 2020 httpswwwfinancialexpresscomopinioncheering-a-lap-win-in-an-unfinished-race2140347
Chandrasekaran Kaavya 2017 ldquoMNRE asks Tamil Nadu to prevent curtailment of solar powerrdquo The Economic Times 9 October Accessed 12 October 2020 httpsmeconomictimescomindustryenergypowermnre-asks-tamil-nadu-to-prevent-curtailment-of-solar-powerarticleshow60997998cms
Chatterjee Anupam 2019 ldquoSolar Tenders Remain Hugely Undersubscribed mdash Herersquos What Caused Tepid Responserdquo Financial Express 4 December Accessed 28 November 2020 httpswwwfinancialexpresscomindustrysolar-tenders-remain-hugely-undersubscribed-heres-what-caused-tepid-response1783670
References
54
55
Chawla Kanika 2020 ldquoIndia-China tensions Will Indiarsquos Energy Transition be a Collateral Damagerdquo Financial Express 1 August Accessed 26 November 2020 httpswwwfinancialexpresscomopinionindia-china-tensions-will-indias-energy-transition-be-a-collateral-damage2041561
Atal Vinit and Gireesh Shrimali 2018 An Assessment of Indiarsquos Energy Choices Financial Performance and Risk Perception New Delhi CPI httpclimatepolicyinitiativeorgwp-contentuploads201805Financial-Performance-and-Risk-Perceptionpdf
CAG 2015 Report of the Comptroller and Auditor General of India on Renewable Energy Sector in India Report No 34 of 2015 New Delhi CAG httpscaggovinuploadsdownload_audit_report2015Union_Civil_Performance_Renewable_Energy_Report_34_2015pdf
CRISIL 2017 ldquoCompetitive Bidding Set to Transform Wind Power Marketrdquo May Accessed 28 November 2020 httpswwwcrisilcomcontentdamcrisilour-analysisviews-and-commentariesinsightsCRISIL-Research-Insights-Competitive-bidding-a-blow-for-wind-power-sector-may2017pdf
CSO Energy Statistics 2010 New Delhi MoSPI
CSO Energy Statistics 2012 New Delhi MoSPI
CSO Energy Statistics 2013 New Delhi MoSPI
CSO Energy Statistics 2014 New Delhi MoSPI
CSO Energy Statistics 2015 New Delhi MoSPI
CSO Energy Statistics 2016 New Delhi MoSPI
CSO Energy Statistics 2017 New Delhi MoSPI
CSO Energy Statistics 2018 New Delhi MoSPI
CSO Energy Statistics 2019 New Delhi MoSPI
CSO Energy Statistics 2020 New Delhi MoSPI
Deign Jason 2017 ldquoIndiarsquos Record-Low Wind and Solar Prices May Not Be Sustainablerdquo Greentech Media 25 September Accessed 26 November 2020 httpswwwgreentechmediacomarticlesreadindias-renewable-energy-auctions-may-not-be-sustainable
Deloitte and CII 2015 ldquoSolar Power in Karnataka Charting the Path for a Bright Futurerdquo Knowledge Paper for CII Karnataka Conference on Power July httpswww2deloittecomcontentdamDeloitteinDocumentsenergy-resourcesin-enr-solar-power-in-karnataka-noexppdf
Dutt Arjun Lucila Arboleya and and Pablo Gonzalez 2020 Clean Energy investment Trends Mapping Project Level Financial Performance Expectations in India New Delhi Paris CEEW and IEA httpscefceewinsolutions-factoryCEEW-CEF-clean-energy-investment-trends-2020pdf
Economic Times 2010 ldquoGujarat Takes the Lead Among States in Solar Powerrdquo The Economic Times 2 November Accessed 12 October 2020 httpseconomictimesindiatimescomspecial-featuregujarat-takes-the-lead-among-states-in-solar-powerarticleshow6855821cmsfrom=mdr
Economic Times 2019 ldquoPower Ministry order on LCs to Face Challenges India Ratingsrdquo Economic Times 18 July Accessed 26 November 2020 httpseconomictimesindiatimescomindustryenergypowerpower-ministry-order-on-lcs-to-face-challenges-india-ratingsarticleshow70279939cmsfrom=mdr
ETEnergyWorld 2020 ldquoGovt plans 20 GW capacity solar tenders till June 2021rdquo ETEnergyworldcom 18 March
References
How Indiarsquos Solar and Wind Policies Enabled its Energy Transition A Decade in Review 56
Accessed 12 October 2020 httpsenergyeconomictimesindiatimescomnewsrenewablegovt-plans-20-gw-capacity-solar-tenders-till-june-202174688993
Financial Express 2020 ldquoLower power tariff can boost Make in India after corona crisisrdquo Financial Express 8 May Accessed 29 November 2020 httpswwwfinancialexpresscomeconomylower-power-tariff-can-boost-make-in-india-after-corona-crisis1951679
Ganesan Karthik Poulami Choudhury Rajeev Palakshappa Rishabh Jain and Sanyukta Raje 2014 Assessing Green Industrial Policy ndash The India Experience New Delhi CEEW httpswwwiisdorggsisitesdefaultfilesrens_gip_indiapdf
Garg Vibhuti and Kashish Shah 2020 The Curious Case of Indiarsquos Discoms New Delhi IEEFA httpsieefaorgwp-contentuploads202008The-Curious-Case-of-Indias-Discoms_August-2020pdf
Garg Vibhuti Balasubramanian Viswanathan Danwant Narayanaswamy Christopher Beaton Karthik Ganesan Shruti Sharma and Richard Bridle 2020 Mapping Indiarsquos Energy Subsidies 2020 Fossil Fuels Renewables and Electric Vehicles Winnipeg IISD httpswwwiisdorgsystemfilespublicationsindia-energy-transition-2020pdf
ICRA Limited and CARE Ratings 2019 State Distribution Utilities Seventh Annual Integrated Rating New Delhi MoP httpspfcindiacomDocumentRepositoryckfinderfilesGoI_InitiativesAnnual_Integrated_Ratings_of_State_DISCOMs7th_Rating_Booklet_Final_13-10-2019pdf
Idam Infra 2016 Procurement of Wind Power Wind Vision India 2032 New Delhi Shakti Sustainable Energy Foundation httpsidaminfracomwp-contentuploads201607Wind-Vision-2032-A-Multi-Stakeholder-Perspectivepdf
IEA 2020 ldquoEvolution of Solar PV Module Cost by Data Source 1970-2020rdquo 30 June Accessed 28 November 2020 httpswwwieaorgdata-and-statisticschartsevolution-of-solar-pv-module-cost-by-data-source-1970-2020
India RE Navigator 2020 ldquoAuction Resultsrdquo Accessed 28 November 2020 httpsindia-re-navigatorcomwind
IRENA 2017 ldquoRenewable Energy Prospects for Indiardquo Working Paper Based on REmap May IRENA httpswwwirenaorg-mediaFilesIRENAAgencyPublication2017MayIRENA_REmap_India_paper_2017pdfla=enamphash=4B737628E6D1E4C7F04551C26B3C3F7EB768281A
IWTMF 2019 ldquoIndia - Wind Power Capacity Installations FY 2018-19rdquo Accessed 28 November 2020 httpsindianwindpowercompdfSTATE-WISE-MONTH-WISE-WIND-INSTALLATIONS-FY-2018-19pdf
Jai Shreya 2018 ldquo35 GW of Solar Tenders in Limbo Thanks to Tax and Regulatory Nigglesrdquo Business Standard 27 February Accessed 28 November 2020 httpswwwbusiness-standardcomarticleeconomy-policy3-5-gw-of-solar-tenders-in-limbo-owing-to-tax-and-regulatory-niggles-118022700346_1html
Jai Shreya 2020 ldquoGovt Plans Separate Electricity Distribution Channel for Industriesrdquo Business Standard 16 November Accessed 28 November 2020 httpswwwbusiness-standardcomarticleeconomy-policygovt-plans-separate-electricity-distribution-channel-for-industries-120111600018_1html
Jhawar Pratha 2020 ldquoRenewable Energy Curtailment is a Banerdquo Down to Earth 17 January Accessed 12 October 2020 httpswwwdowntoearthorginblogenergyrenewable-energy-curtailment-is-a-bane-68857
Jog Sanjay 2013 ldquoBanks Say PPA Structure for Solar Projects not Bankablerdquo Business Standard 20 January Accessed 12 October 2020 httpswwwbusiness-standardcomarticlefinancebanks-say-ppa-structure-for-solar-projects-not-bankable-110083100077_1html
Kapoor Karan Krishan K Pandey AKJain and Ashish Nandan 2014 ldquoEvolution of Solar Energy in India A Reviewrdquo Renewable and Sustainable Energy Reviews (40) 475-487 httpdxdoiorg101016jrser201407118
57References
Kumar Alok and Sushanta Chatterjee 2012 Electricity Sector in India Policy and Regulation New Delhi Oxford University Press
Kumarankandath Aruna 2015 ldquoWTO Rules Against Indiarsquos Domestic Content Requirements in Solar Powerrdquo Down to Earth 3 September Accessed 26 November 2020 httpswwwdowntoearthorginnewsenergywto-rules-against-india-s-domestic-content-requirements-in-solar-power-50977
MNRE 2017 Agenda Note for National Review Meeting of State Principal Secretaries and State Nodal Agencies of Renewable Energy on 23-24 January 2017 httpssolarrooftopgovinnotificationNotification-09012017pdf
MNRE 2019 Annual Report 2018ndash19 New Delhi MNRE httpsmnregovinimgdocumentsuploadsfile_f-1608040317211pdf
MNRE 2020a Annual Report 2019ndash20 New Delhi MNRE httpsmnregovinimgdocumentsuploadsfile_f-1597797108502pdf
MNRE 2020b Physical Progress Achievements Accessed 26 November 2020 httpsmnregovinthe-ministryphysical-progress
Mondal Debapriya 2016 ldquoWTO Ruling on Domestic Content Requirement in Solar A Blessing in Disguiserdquo ETEnergyWorld 26 September Accessed 26 November 2020 httpsenergyeconomictimesindiatimescomnewsrenewablewto-ruling-on-domestic-content-requirement-in-solar-a-blessing-in-disguise54527456
MoP 2010 Annual Report New Delhi MoP httpspowerminnicinsitesdefaultfilesuploadsAnnual_Report_2009-10_Englishpdf
MoP 2016 Guidelines for Long-term RPO Growth Trajectory of Renewable Purchase Obligations (RPOs) for Non-solar as well as Solar Order No 2332016-RampR New Delhi MoP 22 July httpswwwmahaurjacommedadatarporecreportsMoP20on20Long20term20RPO20trajectorypdf
MoP 2018 Long-term RPO Growth Trajectory of Renewable Purchase Obligations (RPOs) for Solar and Non-solar for a Period of Three Years ie 2019ndash20 to 2021ndash22 Order No 23032016ndashRampR New Delhi MoP 14 June httpspowerminnicinsitesdefaultfileswebformnoticesRPO_trajectory_2019-22_Order_dated_14_June_2018pdf
MoP 2019 Opening and Maintaining of Adequate Letter of Credit (LC) as Payment Security Mechanism under Power Purchase Agreements by Distribution Licensees Order No 23222019-RampR New Delhi MoP 28 June httpsmnregovinimgdocumentsuploadsbf4ce66944bd410bb39ef4cf60cbaa6apdf
MoP 2020a Agenda Background Conference of Power and Renewable Energy Ministers of States and UTs 3 July 2020 New Delhi 3 July
MoP 2020b Regarding MoP Order dated 28062019 regarding opening and maintaining of adequate Letter of Credit (LC) as Payment Security Mechanism under Power Purchase Agreements by Distribution Licensees Order No 23222019-RR New Delhi MoP 27 March httpspowerminnicinsitesdefaultfileswebformnoticesFinal_Clarification_to_the_orders_of_MoP_letter_dtd_06042020pdf
Naidu Katya 2013 ldquoSuzlon to Build Land Bankrdquo Business Standard 20 January Accessed 12 October 2020 httpswwwbusiness-standardcomarticlecompaniessuzlon-to-build-land-bank-111112900026_1html
Paliwal Ankur and Jonas Hamberg 2015 ldquoSolar Mission Phase II May Reign in Import of Thinfilmsrdquo Down to Earth 4 July Accessed 26 November 2020 httpswwwdowntoearthorginnewssolar-mission-phase-ii-may-reign-in-import-of-thinfilms-40130
Parikh Anjana 2020 ldquoPOSOCO to Examine Renewable Energy Curtailment Issue in Andhra Pradeshrdquo Mercom 5 February Accessed 26 November 2020 httpsmercomindiacomposoco-examine-renewable-energy-curtailment-issue-andhra-pradesh
How Indiarsquos Solar and Wind Policies Enabled its Energy Transition A Decade in Review 58
PEG 2018 Electricity Distribution Companies in India Preparing for an Uncertain Future Mumbai PEG httpswwwprayaspuneorgpegpublicationsitemdownload892_2d5b1ca58ed382a4ef554ba04f6515dchtml
PIB 2019 ldquo PM Modi addresses Climate Action Summitrdquo Accessed 28 November 2020 httpspibgovinPressReleasePageaspxPRID=1585979
POSOCO 2018 Renewable Energy Certificate Mechanism in India Key Learnings Data Analysis and Way Forward New Delhi POSOCO NLDC httpsposocoinwp-contentuploads201808REC_REPORT_17082018_fPRINTpdf
Prasad Nithin Thomas 2020 ldquoNew Solar Tariff Record of `2kWh Why Did it Go So Lowrdquo Mercom 27 November Accessed 28 November 2020 httpsmercomindiacomnew-solar-tariff-record
Raikar Nitin 2018 ldquoIndian Wind Industry Analytical Report - FY 2017ndash18rdquo Indian Wind Power 4 (1) 32-33 httpswwwindianwindpowercompdfIndian-Wind-Power-April-May-2018pdf
Ranjan Rakesh 2020 ldquoUttar Pradesh to Set Up 600 MW of Solar in a New Renewable Energy Parkrdquo Mercom 19 June Accessed 28 November 2020 httpsmercomindiacomuttar-pradesh-solar-renewable-energy-park
REC Registry of India 2020a ldquoMonth-wise RECs Reportrdquo REC Registry of India Accessed 30 November httpswwwrecregistryindianicinindexphppublicsrecs
REC Registry of India 2020b ldquoRegistered RE Generatorsrdquo REC Registry of India Accessed 30 November HYPERLINK ldquohttpswwwrecregistryindianicinindexphppublicsrecsrdquo httpswwwrecregistryindianicinindexphppublicsregistered_regens
Reuters 2020 ldquoAdani Green Energy Doesnrsquot Have a Guaranteed Buyer for $6 Billion Solar Project in Indiardquo ET Energy World 19 November Accessed 28 November 2020 httpsenergyeconomictimesindiatimescomnewsrenewableadani-green-energy-doesnt-have-a-guaranteed-buyer-for-6-billion-solar-project-in-india79298448
Saumy Prateek 2019 ldquoAfter Tamil Nadu NSEFI Writes to Karnataka About Solar Projects Facing Curtailmentrdquo Mercom 21 June Accessed 12 October 2020 httpsmercomindiacomnsefi-karnataka-solar-curtailment
Saumy Prateek 2017 ldquoPPAS for 1050 MW Wind Projects Signedrdquo Mercom 21 July Accessed 12 October 2020 httpsmercomindiacomppas-1050-mw-wind-projects-signed
Saurabh 2017 ldquoTamil Nadu India Issues 500 Megawatt Wind Energy Tenderrdquo Clean Technica 9 July Accessed 12 October 2020 httpscleantechnicacom20170709tamil-nadu-india-issues-500-megawatt-wind-energy-tender
SECI 2014 3rd Annual Report 2013ndash14 New Delhi SECI httpswwwsecicoinUploadFinacial637268670541938164pdf
SECI 2019 8th Annual Report 2018ndash19 New Delhi SECI httpsmnregovinimgdocumentsuploadsfile_f-1597797108502pdf
Seetharaman G and Kaavya Chandrasekaran 2019 ldquoGovernmentrsquos Solar Park Push is Running Into Land Acquisition and Transmission Challengesrdquo The Economic Times 28 April Accessed 12 October 2020 httpseconomictimesindiatimescomindustryenergypowergovernments-solar-park-push-is-running-into-land-acquisition-and-transmission-challengesarticleshow69074597cmsfrom=mdr
Sengupta Debjoy 2013 ldquoIndian Solar Market Forecasting a Better 2014 after a Lackluster Yearrdquo The Economic Times 20 November Accessed 12 October 2020 httpseconomictimesindiatimescomindustryenergypowerindian-solar-market-forecasting-a-better-2014-after-a-lackluster-yeararticleshow26101929cmsfrom=mdr
Shrimali Gireesh and Sunali Rohra 2012 ldquoIndiarsquos Solar Mission A Reviewrdquo Renewable and Sustainable Energy Reviews (16) 8 6317ndash6332 httpsdoiorg101016jrser201206018
59References
Singh Anoop 2010 ldquoEconomics Regulation and Implementation Strategy for Renewable Energy Certificates in Indiardquo In India Infrastructure Report 2010 edited by Development Finance Company and 3iNetwork 42-57 New Delhi Oxford University Press
Singh Hartek 2017 ldquoWhy Renewable Energy Evacuation Demands a Decisive Pushrdquo ET Energy World 26 December Accessed 12 October 2020 httpsenergyeconomictimesindiatimescomenergy-speakwhy-renewable-energy-evacuation-demands-a-decisive-push2774
Singh Sarita and Shashwat Mohanty 2020 ldquoWind Generation Falls Over 40 in July Initial Assessment Blames Low Wind Speedrdquo ETEnergyWorld 12 August Accessed 28 November 2020 httpsenergyeconomictimesindiatimescomnewsrenewablewind-generation-falls-over-40-in-july-initial-assessment-blames-low-wind-speed77496934
Singh Vaibhav Pratap Arjun Dutt and Gagan Sidhu 2020 RE-Financing Indiarsquos Energy Transition Limited Period Subsidised Credit Enhancement for Domestic RE Bond Issuances New Delhi CEEW
Sinha Amitesh 2020 ldquoIndiarsquos Ambition and Opportunities in Solar Manufacturingrdquo Presentation India PV Edge 2020 Virtual conference 6 October
Soman Abhinav Neil McCulloch Harsimran Kaur and Christopher Beaton 2019 Indiarsquos Energy Transition The Impact of the Goods and Services Tax on Solar Photovoltaic and Coal Power Costs New Delhi IISD
Srivastava Shobhit Surbhi Singhvi and Vinay Rustagi 2019 Forecasting amp Scheduling Regulations Gurugram Bridge to India httpsbridgetoindiacombackendwp-contentuploads202003Policy-brief-Executive-summarypdf
Stromsta Karl-Erik 2012 ldquoIndia may fine most PV projects for delays in messy start to NSMrdquo Recharge 21 February Accessed 12 October 2020 httpswwwrechargenewscomsolarindia-may-fine-most-pv-projects-for-delays-in-messy-start-to-nsm1-1-837485
Sud Tushar Rajneesh Sharma Radhika Sharma and Lucy Kitson 2015 Indiarsquos Accelerated Depreciation Policy for Wind Energy New Delhi IISD
Sustainability Outlook 2010 Negotiating Power Purchase Agreements for Solar Projects 28 July Accessed 12 October 2020 httpwwwsustainabilityoutlookincontentnegotiating-power-purchase-agreements-solar-projects~text=NVVN20has20proposed20a20tripartite20arrangement20for20purchaseand20Power20Purchase20Agreement20with20Solar20Power20Developers
Tenddulkar Suuhas 2019 ldquoGujarat Land Allocation Logjam Threatens Windrsquos Viabilityrdquo Wind Power Monthly 14 January Accessed 12 October 2020 httpswwwwindpowermonthlycomarticle1522808gujarat-land-allocation-logjam-threatens-winds-viability
TERI 2017 Addressing Land Issues for Utility Scale Renewable Energy Deployment in India New Delhi Shakti Sustainable Energy Foundation
The Hindu 2017 ldquoNew Solar Energy Target for Karnataka 6000 MW by 2021rdquo The Hindu 10 January Accessed 12 October 2020 httpswwwthehinducomnewscitiesbangaloreNew-solar-energy-target-for-Karnataka-6000-MW-by-2021article17018234ece
Thomas Tanya 2018 ldquoIndia May Not Reach 100GW Solar Power Target by 2022 Crisil Reportrdquo Mint 13 August Accessed 29 November 2020 httpswwwlivemintcomIndustryHEugjBRI2zsNDyVzB2E1kJIndia-may-not-reach-100GW-solar-power-target-by-2022-Crisilhtml
Thomas Tanya ldquoPower Utilities Turn to Cheaper Exchange Power as Prices Crashrdquo Mint 28 May Accessed 29 November 2020 httpswwwlivemintcomindustryenergypower-utilities-turn-to-cheaper-exchange-power-as-prices-crash-11590636539577html
How Indiarsquos Solar and Wind Policies Enabled its Energy Transition A Decade in Review 60
TN Energy Department 2012 Policy Note 2012-2013 Chennai Energy Department Government of Tamil Nadu httpscmstngovinsitesdefaultfilesdocumentsenergy_7pdf
TNN 2013 ldquoTNrsquos power utility rated worst among 4 southern statesrdquo Times of India 30 March Accessed 12 October 2020 httpstimesofindiaindiatimescomcitychennaiTNs-power-utility-rated-worst-among-4-southern-statesarticleshow19285688cms
Tongia Rahul Santosh Harish and Rahul Walawalkar 2018 Integrating Renewable Energy Into Indiarsquos Grid- Harder Than It Looks New Delhi Brookings India httpswwwbrookingseduwp-contentuploads201811Complexities-of-Integrating-RE-into-Indias-grid2pdf
Tyagi Akanksha and Neeraj Kuldeep Forthcoming Resource Management Strategies for India by Managing Solar PV Module Waste New Delhi CEEW
Tyagi Akanksha Neeraj Kuldeep and Aarushi Dave 2020 Are Urban Microgrids Economically Feasible A Study of Delhirsquos Discom and Consumer Perspectives for BYPL New Delhi CEEW httpswwwceewinsitesdefaultfilesCEEW-Are-urban-microgrids-economically-feassible-29Oct20pdf
William Praveen 2020 ldquoAmbiguities Under the GST Regime for Renewable Energy Sectorrdquo KPMG India Blog 30 January Accessed 12 October 2020 httpshomekpmginenblogshomeposts202001ambiguities-under-the-gst-regime-for-renewable-energy-sectorhtml
WTO 2016 DS456 India mdash Certain Measures Relating to Solar Cells and Solar Modules Accessed 26 November 2020 httpswwwwtoorgenglishtratop_edispu_ecases_eds456_ehtm
Judicial orders cited
Order dated 3 December 2019 issued by CERC in Petition No 340AT2019 titled PTC India Ltd v SECI and Ors httpwwwcercindgovin2019orders340-AT-2019pdf
Order dated 3 December 2009 issued by CERC in Petition No 2842009 titled Determination of Generic Levellised Generation Tariff httpwwwcercindgovin2009November09284ndash2009_final_3rdDecember09pdf
Order dated 15 May 2014 issued by CERC in Petition No SM3542013 (SuondashMotu) titled Determination of Generic Levellised Generation Tariff for the FY 2014ndash15 httpwwwcercindgovin2014ordersSO354pdf
Order dated 31 March 2015 issued by CERC in Petition No SM0042015(SuondashMotu) titled Determination of Generic Levellised Generation Tariff for the FY 2015 ndash 16 httpcercindgovin2015ordersso4pdf
Order dated 30 March 2016 issued by CERC in Petition No SM032016 (SuondashMotu) titled Determination of Levellised Generic Tariff for FY 2016ndash17 httpcercindgovin2016orderssm_3pdf
Order dated 11 August 2017 issued by the TNERC in TP No1 of 2017 titled Determination of Tariff for Generation and Distribution Accessed 25 October 2020 httpwwwtnercgovinordersTariff20Order2020092017TariffOrderTANGEDCOndash11ndash08ndash2017pdf
Order dated 27 March 2019 issued by the MERC in Case No36 of 2019 titled Case for Verification of Compliance of Renewable Purchase Obligation targets by Maharashtra State Electricity Distribution Co Ltd for FY 2017ndash18
Order dated 2 April 2019 issued by the MERC in Case No37 of 2019 titled Case for Verification of Compliance of Renewable Purchase Obligation targets by Brihanmumbai Electric Supply amp Transport Undertaking for FY 2017ndash18
Order dated 2 April 2019 issued by the MERC in Case No38 of 2019 titled Case for Verification of Compliance of Renewable Purchase Obligation targets by Tata Power Co Ltd (Distribution) for FY 2017ndash18
61Judicial orders cited
Order dated 4 April 2019 issued by the MERC in Case No39 of 2019 titled Case for Verification of Compliance of Renewable Purchase Obligation targets by Adani Electricity Mumbai Limited for FY 2017ndash18
Order dated 23 October 2017 issued by the PSERC titled Annual Revenue Requirement and Determination of Tariff for MYT Control Period from FY 2017ndash18 to FY 2019ndash20 and for True up of FY 2015ndash16 Accessed 25 October 2020 httppsercgovinpagesPSPCL-Tariff-Order-Vol-1-2017-18pdf
Order dated 19 April 2018 issued by the PSERC in Petition titled True up of FY 2016ndash17 Annual Performance Review (APR) for FY 2017ndash18 and Determining the Annual Revenue Requirement (ARR) for FY 2018ndash19 Accessed 25 October 2020 httppsercgovinpagesTariff20Order20PSPCL20for20FY202018-19pdf
Order dated 27 May 2019 issued by the PSERC in Petition No 02 of 2019 titled True up of FY 2017ndash2018 Annual Performance Review (APR) for FY 2018ndash19 approval of Revised Annual Revenue Requirement (ARR) and determination of Tariff for FY 2019ndash20 Accessed 25 October 2020 httppsercgovinpagesPSPCL-Tariff-Order-2019-20pdf
Order dated 25 February 2019 issued by the BERC in Case No 40 and 48 of 2018 and Case No 41 and 47 of 2018 titled Tariff Order for FY 2019ndash20 for NBPDCL and SBPDCL Accessed 25 October 2020 httpsberccoinorderstariffdistributionsbpdcl1965-tariff-order-of-sbpdcl-for-fy-2019-20
Order dated 24 March 2017 issued by the BERC in Case No 45 of 2016 titled Tariff Order for FY 2017-18 for NBPDCL Accessed 25 October 2020 httpsberccoinorderstariffdistributionnbpdcl1143-tariff-order-of-nbpdcl-for-fy-2017-18
Order dated 24 March 2017 issued by the BERC in Case No 46 of 2016 titled Tariff Order for FY 2017ndash18 for SBPDCL Accessed 25 October 2020 httpsberccoinorderstariffdistributionsbpdcl1142-tariff-order-of-sbpdcl-for-fy-2017-18
Order dated 21 March 2018 issued by the BERC in Case No 40 of 2017 titled Tariff Order for FY 2018ndash19 for NBPDCL Accessed 25 October 2020 httpsberccoinorderstariffdistributionnbpdcl1447-tariff-order-of-nbpdcl-for-fy-2018-19
Order dated 21 March 2018 issued by the BERC in Case No 41 of 2017 titled Tariff Order for FY 2018ndash19 for SBPDCL Accessed 25 October 2020 httpsberccoinorderstariffdistributionsbpdcl1444-tariff-order-of-sbpdcl-for-fy-2018-19
Order dated 1 June 2010 issued by the CERC in Petition No 992010 (Suo Motu) titled Determination of Forbearance and Floor Price for the REC Framework httpswwwrecregistryindianicinpdfREC_RegulationFinal_Order_on_Forbearnace_and_Floor_Price_for_RECpdf
Order dated 23 August 2011 issued by the CERC in Petition No 1422011 (Suo Motu) titled Determination of Forbearance and Floor Price for the REC Framework to be Applicable from 1st April 2012 httpswwwrecregistryindianicinpdfREC_RegulationOrder_on_Forbearnace__Floor_Price_23-8-2011pdf
Order dated 30 March 2017 issued by the CERC in Petition No 02SM2017 titled Determination of Forbearance and Floor Price for the REC Framework to be Applicable from 1st April 2017 httpswwwrecregistryindianicinpdfREC_RegulationCERC_Order_300317pdf
Order dated 17 June 2020 issued by the CERC in Petition No 05SM2020 titled Determination of Forbearance and Floor Price for the REC Framework httpswwwrecregistryindianicinpdfREC_Regulation5-SM-2020-finalpdf
Judgment dated 13 May 2015 issued by the Supreme Court of India in Civil Appeal No 4417 of 2015 titled Hindustan Zinc Limited v RERC ((2015)12SCC611) httpswwwrecregistryindianicinpdfREC_RegulationSupreme_Court_Judgement_regarding_RPO_Compliancepdf
Order dated 4 August 2015 issued by the GERC in suo motu Petition Nos 1307 of 2013 and 1312 of 2013 titled Suo-motu Proceedings in Petition Nos 1307 of 2013 and 1312 of 2013 in Pursuance of Honrsquoble APTEL Direction Contained in
How Indiarsquos Solar and Wind Policies Enabled its Energy Transition A Decade in Review
Order Dated 16042015 in Appeal Nos 258 of 2013 and 21 of 2014 and the Order Dated 14052015 in IA No 187 of 2015 Accessed 22 October 2020 httpswwwgercinorgwp-contentuploadsdocumenten_1438799511pdf
Order dated 4 April 2019 issued by the MERC in Case No 39 of 2019 titled Case for Verification of Compliance of Renewable Purchase Obligation Targets by Adani Electricity Mumbai Limited for FY 2017ndash18
Order dated 14 May 2018 issued by the KERC in matter no S032017 titled In the Matter of Revision of Wheeling and Banking Charges for Renewable Power Projects Accessed 22 October 2020 httpskredlinfoingeneralwheeling20and20banking20charges2014052017pdf
Order No 82020 dated 7 October 2020 issued by the TNERC titled Order on Procurement of Wind Power and Related Issues Accessed 22 October 2020 httpwwwtnercgovinordersTariff20Order2020092020WindOrder-2007-10-2020pdf
Order No 22020 dated 30 April 2020 issued by the GERC titled Tariff Framework for Procurement of Power by Distribution Licensees and Others from Wind Turbine Generators and Other Commercial Issues for the State of Gujarat Accessed 22 October 2020 httpswwwgetcogujaratcomgetco_newpagesfilesRNCREOrder20No220of20202020issued20by20GERC20pdf
Order dated 20 March 2020 in Case No 30 2019 and 312019 issued by the BERC titled Tariff Order Truing up for FY 2018-19 Annual Performance Review for FY 2019-20 Annual Revenue Requirement (ARR) and Determination of Retail Tariff for FY 2020-21 for North Bihar Distribution Company Limited (NBPDCL) and South Bihar Distribution Company Limited (SBPDCL) Accessed 22 October 2020 httpsberccoinorderstariffdistributionsbpdcl2216-tariff-order-of-nbpdcl-for-fy-2019-22
62
Unlocking the demand for RE and capitalising on the immense opportunity that it presents requires innovative solutions that account for legacy issues and yet are forward looking
Image iStock
How Indiarsquos Solar and Wind Policies Enabled its Energy Transition A Decade in Review
COUNCIL ON ENERGY ENVIRONMENT AND WATER (CEEW)
Sanskrit Bhawan A-10 Qutab Institutional AreaAruna Asaf Ali Marg New Delhi - 110067 IndiaT +91 (0) 11 4073 3300
infoceewin | ceewin | CEEWIndia | ceewindia

How Indiarsquos Solar and Wind Policies Enabled its Energy Transition A Decade in Review
Harsha V Rao harsharaoceewin
Harsha researches the legal and regulatory framework of the energy sector Before joining The Council she worked as a litigation lawyer in Delhi She has also worked with the project finance team of a leading law firm in India
Disha Agarwal dishaagarwalceewin
Disha co-manages The Councilrsquos Renewable Energy Programme She works on legislative policy and regulatory frameworks at the intersection of power and renewables She has experience in strategy development renewable energy policy and market analyses stakeholder management and collaborations grant-making and fund-raising Before joining The Council she was with Shakti Sustainable Energy Foundation leading programmes on renewables and climate policy during her tenure
The authors
ldquoRenewable energy already makes sense We should now take steps to deepen the market and make it more flexiblerdquo
ldquoIndia is set to become a renewable energy powerhouse over this decade This is when we need to adopt pathways to reducing the sectorrsquos reliance on policiesrdquo
How Indiarsquos Solar and Wind Policies Enabled its Energy Transition A Decade in Review
Image iStock
This study focuses on the evolving policies and risks in Indiarsquos utility-scale solar and wind energy sector and mitigating strategies used at various points in time
Contents
Executive summary
2 Evolution of Central policies
21 Pre-2010 ndash private-sector participation and prioritising renewables 22 Post-2010 policies for solar 23 Impact of other policies on project deployment 24 Solar Park Scheme 25 Post-2010 policies for wind 26 Policy assessment
3 Renewable purchase obligations ndash a regulatory mechanism for creating demand
31 Setting RPO targets 32 Compliance with RPO 33 Causes of under-achievement
4 Policy evolution in RE-rich states
41 Policies pre-2014 42 Policies post- 2014
5 Policy evolution in RE-deficit states
6 Looking back to look ahead
References
Judicial orders cited
1 Introduction
11 Methodology 12 Institutional framework
1
24
5
27
49
54
60
17
12
27
5
14
34
1918
43
81011
22
i
How Indiarsquos Solar and Wind Policies Enabled its Energy Transition A Decade in Review
Tables
Table ES1 Spheres of influence of the Centre and states
Table 1 The institutional structure of the power sector
Table 2 Evolution of central policies for utility-scale wind and solar energy ndash 2010ndash2019
Table 3 Snapshot of VGF schemes
Table 4 Indiarsquos progress towards 175 GW renewable energy by 2022
Table 5 MoP trajectory for RPO
Table 6 Resource-rich states are also the highest buyers of RECs
Table 7 REC floor prices and forbearance prices have consistently fallen
Table 8 Average size of a registered plant as of FY 2018
Table 9 Targets specified under policies and actual achievements
Table 10 2010ndash2014 Developments that held back RE deployment and associated risks that remained
Table 11 Timeline of the key events in the AP story
Table 12 Banking charges and conditions across RE-rich states
Figures
Figure ES1 Pace of capacity addition in wind and solar projects has slowed down
Figure ES2 Policy focus of the states
Figure ES3 Developments across project deployment and operations
Figure ES4 Lessons from policy evolution
Figure ES5 Varied and evolving challenges for RE growth
Figure ES6 Signals of disruption of the existing business models of investors
Figure 1 The rate of growth in solar and wind capacity addition is slowing down (2008ndash2020)
Figure 2 The pace of solar park development under the Central scheme has been slow (31 December 2019)
Figure 3 Competitive bidding in wind brought down the tariffs significantly
Figure 4 Compliance with RPOs is uneven among states and discoms
Figure 5 RECs consistently remain unsold in the market
Figure 6 The registration of new projects under the REC mechanism has reduced
Figure 7 RE resource potential is concentrated in western and southern India
Figure 8 Solar and wind capacity increased rapidly 2014 onwards
Figure 9 Average module (multicrystalline) prices have continiously declined (2011ndash2019)
Figure 10 Solar tariffs discovered in Indian auctions
Figure 11 Gujarat saw the largest wind capacity additions among the wind-rich states (2016ndash2020)
Figure 12 ISTS-connected solar PV projects have poor completion record
Figure 13 The rate of commissioning of wind projects has been slow (August 2020)
ii
4
678
10
14
19
22
23
24
2930
34
38
42
ii
iv
v
viii
vii
viii
2
12
13
20
21
23
27
31
35
36
37
38
39
Acronyms
AAPERC Andhra Pradesh Electricity Regulatory Commission
APPC average power purchase cost
APSPDCL Andhra Pradesh Southern Power Distribution Company Limited
AD accelerated depreciation
APTEL Appellate Tribunal of Electricity
BERC Bihar Electricity Regulatory Commission
BREDA Bihar Renewable Energy Development Authority
CAG Comptroller and Auditor General of India
CEA Central Electricity Authority
CERC Central Electricity Regulatory Commission
COVID-19 coronavirus disease 2019
CPP captive power plants
CST central sales tax
DCR domestic content requirement
DRE distributed renewable energy
EA Electricity Act 2003
FiT feed-in tariffs
FY financial year
GBI generation-based incentive
GERC Gujarat Electricity Regulatory Commission
GST goods and services tax
GUVNL Gujarat Urja Vikas Nigam Limited
GW giga watt
IEGC Indian Electricity Grid Code
INR Indian rupee
InSTS intra-state transmission system
IRP integrated resource planning
ISTS inter-state transmission system
KERC Karnataka Electricity Regulatory Commission
KPCL Karnataka Power Corporation Limited
KREDL Karnataka Renewable Energy Development Limited
LC letter of credit
LTA long-term access
MERC Maharashtra Electricity Regulatory Commission
MNRE Ministry of New and Renewable Energy
MoP Ministry of Power
MoSPI Ministry of Statistics and Programme Implementation
How Indiarsquos Solar and Wind Policies Enabled its Energy Transition A Decade in Review
MPERC Madhya Pradesh Electricity Regulatory Commission
MSEDCL Maharashtra State Electricity Distribution Company Limited
MW mega watt
MWh mega watt-hour
NAPCC National Action Plan on Climate Change
NLDC National Load Despatch Centre
NREDCAP New and Renewable Energy Development Corporation of AP Limited
NSM National Solar Mission
NTP National Tariff Policy
NVVN NTPC Vidyut Vyapar Nigam Limited
OampM operation and maintenance
OEMs original equipment manufacturers
PGCIL Power Grid Corporation of India Limited
PIB Press Information Bureau
POSOCO Power System Operation Corporation Limited
PPA power purchase agreement
PSA power sale agreement
PSERC Punjab State Electricity Regulatory Commission
PSM payment security mechanism
PSPCL Punjab State Power Corporation Limited
PV photovoltaic
RBI Reserve Bank of India
RE renewable energy
REC renewable energy certificate
RERC Rajasthan Electricity Regulatory Commission
RES renewable energy sources
RPO renewable purchase obligation
SECI Solar Energy Corporation of India Limited
SERC state electricity regulatory commission
STU state transmission utility
TOD time of day
TSERC Telangana State Electricity Regulatory Commission
TNERC Tamil Nadu Electricity Regulatory Commission
UPERC Uttar Pradesh Electricity Regulatory Commission
UPNEDA Uttar Pradesh New and Renewable Energy Development Agency
VAT value-added tax
VGF viability gap funding
WTO World Trade Organisation
Executive summary
In 2015 India announced ambitious targets for renewable energymdash175 GW by 2022mdashone of the largest expansion initiatives in the world Just four years later at the United
Nations Climate Action Summit 2019 the Prime Minister of India pledged to increase Indiarsquos renewable energy (RE) capacity to 450 GW by 2030 (PIB 2019) Indiarsquos journey to reaching these targets is at a critical juncture The pace of capacity addition in utility-scale wind and solar power which saw a rapid increase during 2014ndash2017 has since slowed down (Figure ES1)
Image iStock
i
How Indiarsquos Solar and Wind Policies Enabled its Energy Transition A Decade in Review
Figure ES1 Pace of capacity addition in wind and solar projects has slowed down
Source CEA 2019 Growth
of Electricity Sector in
India From 1947-2019
New Delhi CEA MoP
CEA 2020 All India
Installed Capacity as on 31
December 2019 New Delhi
CEA
Private investment has shaped deployment trajectories so far Today solar and wind technologies have advanced supply chains have strengthened and expertise has developed Despite the highs and lows investor confidence in Indiarsquos RE sector continues to remain robust Further many factors favour investments in RE It has proved itself to be resilient in times of crisis including the COVID-19 induced shocks in 2020 There are strong signals that RE is a preferred choice not just because of its green attributes but because of its favourable cost economics for all stakeholders
Evolving policies at the Central and state level have played a significant role in building investor confidence From our study of the evolution of the sector we learn that the initial policies were instrumental in propelling RE growth Every time a roadblock emerged India has been successful in testing and identifying alternate approaches and solutions Some of these innovative approaches include tariff bundling encouraging solar parks to benefit from economies of scale creating payment security mechanisms to address counterparty risks encouraging solarndashwind hybrid parks to improve utilisation factors testing and introducing protocols and mechanisms such as security constrained economic dispatch (SCED) a real-time market (RTM) market based economic dispatch (MBED) and a green term-ahead market (GTAM) to optimise grid integration costs etc However a mixture of legacy issues and recent developments threaten the current business models and existing policies may no longer be sufficient to ensure continued growth of the sector
Both the Central government and the state governments have different spheres of influence (Table ES1) affecting the power sector Hence both Central and state policies need to be studied to understand the functioning and evolution of the sector
Table ES1 Spheres of influence of the Centre and states
Source Authorsrsquo analysis
STATES
Set the broader policy direction for the electricity sector under the Electricity Act 2003 (EA)
Primary responsibility and control over the national grid Setting technical standards for the grid to be maintained by the states
Set bidding guidelines for power procurement
Set renewable purchase obligations (RPOs)
Operate with independence within the overarching framework set by the Centre
Directly influence land availability grid connectivity and build-out of intra-state transmission and distribution infrastructure Determine applicable charges to use infrastructure
Power procurement for supply to consumers
Set tariffs and cross-subsidy levels that affect end consumer and hence consumption of power
CENTRE
ii
Growth rate (wind) Growth rate (solar)
0 0
5000 10
10000 20Inst
alle
d c
apac
ity
(MW
)
Gro
wth
rat
e
1500030
2000040
2500050
3000060
35000
70
40000
80
90
2012-13 2013-14 2014-15 2015-16 2016-17 2017-18 2018-19 2019-20
Wind capacity Solar capacity
9
79
14
56
11
42
81 8276
1521
5 5
30
6
24
Note Figures for 2019-20 are only up to December 2019
iiiExecutive summary
Central policies kickstarting solar but leaving wind behindThe initial drivers for RE capacity addition were fiscal financial and tax incentives like accelerated depreciation generation-based incentives and feed-in tariffs (FiTs) determined by state commissions Wind turbine manufacturers were the first movers The de-licensing of generation under the Electricity Act 2003 (EA) set the stage for private investments in RE However the introduction of the National Solar Mission (NSM) in 2010 brought about a massive jump in solar capacity addition and turned the spotlight to utility-scale RE projects The NSM addressed offtake and payment risks with creditworthy trading intermediaries signing long-term power purchase agreements (PPAs) with project proponents The payment and offtake risks arose from the higher costs of solar power as opposed to prevailing conventional power tariffs and poor financial health of distribution companies or discoms (primary bulk procurers of power) The NSM progressed from a FiT regime to competitive bidding and was successful in increasing solar capacity deployment in the country from just 2 MW in 2007ndash08 to 3744 MW in 2014ndash15 (CEA 2019)
Competitive bidding also became mandatory for wind power from 2017 However it did not see the same level of success as solar While tariffs did come down the rate of growth of wind capacity also reduced (see Figure ES1) because the low tariffs disrupted the business model of existing players who were also equipment manufacturers The future trajectory of wind deployment remains to be seen with solar tariffs continuously falling and the evolution of the models adopted by independent RE power producers
Critical requirements that Central policies have not fully tackled are those of timely procurement of suitable land timely construction of evacuation and transmission facilities and minimising curtailment These are also the areas in which states have significant roles and authority The Ministry of New and Renewable Energy (MNRE) introduced the Solar Park Scheme in 2017 to address land-related issues and fast-track deployment through land aggregation and access to the Central transmission network However the schemersquos target of setting up at least 50 solar parks by 2022 is still distant (MNRE 2020) It has been unable to solve coordination issues and the ability of the Centre in developing schemes to address land issues is limited
Inadequate demand creation mechanisms
Initially in the absence of cost-competitive tariffs large buyers of power were mandated to purchase RE through renewable purchase obligations (RPO) under the National Tariff Policy 2006 in a bid to create demand for RE The EA authorises state regulators to set their own targets and regulations on RPOs In subsequent years the Ministry of Power (MoP) and the MNRE made multiple attempts to nudge states to set higher RPO targets and ensure strict compliance However our analysis shows that there have been considerable lags in both
How Indiarsquos Solar and Wind Policies Enabled its Energy Transition A Decade in Review iv
Figure ES2 State concerns that remain unaddressed in Central policies till 2014 and beyond
Source Authorsrsquo analysis
We find that the reasons for middling compliance with RPO targets are
bull Mismatch between the incentives for a RE-rich state to host an RE power plant and a RE-deficit state to buy either power or RE certificates (RECs) from these power plants This has resulted in RE-rich states having the highest compliance with RPOs while RE-deficit states do not see sufficient benefits or strict enforcement to be pushed to fully comply with their RPOs This has in turn affected the ability of even RE-rich states to increase their rates of deployment and RPO compliance
bull Enforcement mechanisms are weak A framework for regular monitoring of compliance is absent Enforcement of RPO by state regulators is not strict enough
Currently apart from setting up inter-state projects there are no other mechanisms to equitably share the costs of hosting RE projects to supply power to other states Further despite RE tariffs attaining grid parity investors continue to rely on RPOs for demand creation indicating deeper causes obstructing further RE penetration in markets Inadequate compliance of Central policies by states also point to certain legitimate state concerns that may not have been addressed (Figure ES2)
Centre and states have different drivers for promoting REWe also note that the main drivers for promoting RE are slightly different for the Centre and the states While the Centre initially emphasised energy security and climate change mitigation the states were keen to obtain the benefits of private investment and job creation It is only lately that the Centre has also emphasised the job creation and domestic manufacturing potential in RE
Most RE-deficit states are inclined to meet their RPO targets mostly through local deployment even if the local deployment is inadequate to meet the targets This is particularly true for solar which is a more abundant and widespread resource throughout the country State-level RPO regulations compliance provisions participation in REC markets and achievement levels demonstrate this However with stricter enforcement measures and falling tariffs the inter-state transmission system (ISTS) procurement of wind and solar power has seen a rise
Hosting RE plant attracts additional balancing costs This means states do not have incentive to host plants for self-consumption as well as export RE power unless directly connected to the central grid (partially addressed)
Severe financial stress on discoms leading to inability in spending towards compliance of RPOs or maintaining payment security (continues to be unaddressed)
Inadequate representation of state concerns before the Centre for policy making setting national objectives setting RPO targets etc (continues to be unaddressed)
Different drivers for the Centre and the states to incentivize RE
Energy security and climate change drives the Centre while investments job creation and resulting cost of system operation matter for the states (partially addressed)
vExecutive summary
Lack of enthusiasm of states in the high-tariff era
State-level institutions have the power and responsibility to ease land procurement for projects facilitate connectivity to the grid enable the construction of transmission infrastructure and ensure offtake of the power generated from the plants From our analysis of the RE policies of eight RE-rich states and three RE-deficit states we find that policies vary widely on these fronts (Figure ES3)
Pre-2014 when RE tariffs were still quite high the policies of even the RE-rich states did not provide a lot of support to private investors in the sector The responsibility of obtaining land was placed on the developers themselves Even though the states notified their own RE policies they did not meet their targets States like Gujarat and Rajasthan saw considerable capacity deployment under the NSM in this period owing to the easy availability of land and high wind and solar potential Charanka Solar Park in Gujarat set up in 2012 was successful in attracting investors This inspired the push towards establishing more solar parks in the country Because evacuation infrastructure was inadequate state policies required developers to finance and construct the required infrastructure at least till the interconnection point
Figure ES3 Developments across project deployment and operations
Source Authorsrsquo analysis
The RE-rich states covered are Andhra Pradesh Gujarat Karnataka Madhya Pradesh Maharashtra Rajasthan Tamil Nadu and Telangana and the RE-deficit states covered are Bihar Punjab and Uttar Pradesh
HIGH
TARIFF ERA
LOW
TARIFF ERA
RE-rich states
Responsibility on developers
Success of Charanka solar park inspired solar park policy
Developers required to construct evacuation infrastructure upto grid connection point
Feed-in-tariff
Procurement for use only within the state
High curtailment High curtailment
High curtailment
Older RE PPA renegotiations
Low utility-scale RE capacity Evacuation constraints visible in few instances
No policy focus
No policy focus
Feed-in-tariff
Decentralised power emphasised
Competitive bidding
Export of power outside the state begins to be promoted
Fewer new PPAs being signed
Competitive bidding
No focus on inter-state power purchase but procurement from central intermediaries has increased
Fewer new PPAs being signed
Solar parks and facilitation of land procurement
Land availability remains a concern especially for wind
States participating in Centre led transmission infrastructure development However progress is slow
Facilitation of land procurement by state agencies
However land availability remains a concern
No policy focus
RE-rich statesRE-deficit states RE-deficit states
LAND
GRID CONNECTION
POWER PROCUREMENT
MODE
PROJECT OPERATION
How Indiarsquos Solar and Wind Policies Enabled its Energy Transition A Decade in Review
However beyond the interconnection point transmission infrastructure continues to remain a challenge This coupled with the financial difficulties of the distribution utilities led to the severe curtailment of RE power The state policies only incentivised RE project development that supplies power to their own state discoms Some states like Maharashtra Karnataka and Andhra Pradesh even made it mandatory to sell electricity only to discoms within their borders and obligated entities within the state
Lowering tariffs corresponded with increased state promotion of RE but legacy issues came in the way The year 2014 marked the beginning of a significant departure from the past Many developments favoured the RE sector and Central and state policies found greater synergy As RE tariffs fell steeply states moved to incentivise large-scale projects including solar parks They sought to capitalise on investor interest in this sector and states like Andhra Pradesh extended the incentives available to other industry like land allotment facilitation of clearances tax incentives etc to RE power plants There was a shift in focus from setting up projects for self-consumption to supporting projects for the export of power to other states Rajasthan Maharashtra and Andhra Pradesh provided developers with incentives such as time bound open access approval facilitating land procurement exemption on charges etc for setting up inter-state projects States also turned their attention to facilitating deployment and many policies tasked their state agencies with facilitating revenue land procurement for the planned and systematic development of projects
However the PPAs signed in the high-tariff era have become a sore thumb for RE-rich states These agreements which were signed for 20ndash25 years must be honoured by discoms even though cheaper power is available States attempted to push back against these obligations as early as 2014 when Gujarat moved to renegotiate tariffs Andhra Pradesh made the most recent attempt in 2019 These moves by states have added to the set of risks to be mitigated In all these cases the states were ultimately unsuccessful in renegotiating tariffs as their actions were struck down in courts or due to interventions by the Central Government However states continue to employ other means like curtailment to reduce their obligations under expensive contracts Considering that the state bears these costs at the end we need a more equitable solution that can ensure a fair transition for all players without creating uncertainty for investors
In RE-deficit states state policies emphasised decentralised power as opposed to utility-scale projects Their primary drivers were the RPO targets and the potential for private investment For example Punjab and Bihar focused on ensuring payment security and ease of doing business in their states The existing policies of RE-deficit states do not exhibit intention to increase their inter-state purchase of RE for example they do not lay out any roadmap or explicit commitment of procuring power from any of the trading intermediaries like Solar Energy Corporation of India Limited (SECI) or from other states to meet their RPOs Any purchase made is unplanned and this prevents RE-rich states and intermediaries from accurately forecasting demand
Varied and evolving challenges have to be tackled to achieve 450 GW RE target by 2030The existing policies have resulted in tremendous outcomes though short of the targets we set for ourselves As we advance in our energy transition journey it is apt that we incorporate the policy lessons from the journey so far (Figure ES4)
vivivi
Indiarsquos electricity sector is grappling with issues both legacy and novel Legacy issues affecting discom financial health is an obstacle to further growth of the RE sector Further new market and technological advancements like storage and new trading platforms at the doorstep have the potential to bring economy and choice in power procurement and support the energy transition Growth pathways must hence emphasise market-based choices for generation technologies and market-driven procurement and dispatch of electricity
The inhibitions and counterproductive steps of the state governments like renegotiations of PPAs rolling back incentives etc are reflective of genuine operational and financial implications (Figure ES5) State actions show the evolving nature of challenges in RE deployment High tariffs were the initial roadblock which were then followed by infrastructural and operational challenges such as land availability transmission and grid integration issues and other legacy issues that soon became starkly visible
With an increasing share of RE in their energy mix RE-rich states have improved their capabilities to manage RE variability harness system flexibility and forecast and schedule demand and supply However grid integration continues to be a challenge There has been some push-and-pull between state regulators system operators and generators around bearing additional costs relating to forecasting scheduling and deviation settlement The contentions relate to the availability of forecasting methods formulae for penalties the status of aggregation error bands and permissible revisions Forecasting and scheduling add to the costs borne by host states
viiExecutive summary
Figure ES4 Policy lessons from the journey so far
Source Authorsrsquo analysis
NEED TO FACTOR IN DISRUPTIONS IN BUSINESS MODELSInvestment has flown into solar sector due to policy certainty and assurance of opportunities However business models are seeing signs of disruptions Land curtailment and payment risks must be addressed
NEED CENTRE-STATE ALIGNMENTJob creation and value addition are more important considerations for states Mandates and penalties have limited success in encouraging higher deployment in states Institutional mechanisms are required to increase alignment
NEED TO REVIEW WIND SECTORThe introduction of competitive bidding in the sector drove down tariffs but adversely affected the existing industry players in the sector Wind sector needs to be revived Land and resource variability are the most significant risks
NEED REALLOCATION OF COSTS AND BENEFITSThere is divergence between RE-rich and RE-deficient states in deployment and consumption of RE RE-rich states have higher RPO compliance rates We need to account for and allocate the costs benefits and co-benefits of achieving rational targets
NEED TO ALIGN MANUFACTURING AND POWER GENERATIONSingle-minded focus on tariff reduction adversely impacted solar manufacturing Going forward contrasting interests of RE manufacturers and developers must converge
NEED TO PREMPT RISKSPolicies respond to risks rather than anticipate them The interests of incumbents and the overall growth of the sector are no longer aligned Going forward policies need to recognise this reality
POLICY LESSONS
viiExecutive summary
How Indiarsquos Solar and Wind Policies Enabled its Energy Transition A Decade in Review
Policies must pre-empt risks and support transition to a market-driven sectorGoing forward policy decisions must enable the overall growth of the sector rather than target scale through incumbent models The incumbent business models and market mechanisms are at the cusp of disruptions caused due to natural market progression technological advancement and discomsrsquo responses in meeting their challenges (Figure ES6)
Figure ES6 Signals of disruption to the existing business models of investors
Source Authorsrsquo analysis
Figure ES5 Operational and financial challenges in increasing RErsquos share in the energy mix
Source Authorsrsquo analysis
Managing intermittency through forecasting scheduling etc
Land and infrastructure availability and cost
RE growth
Cost-benefit allocation between RE-rich and RE-poor states
Transmission network availability access and cost
Legacy issues expensive PPAs fixed cost payment etc
viiiviiiviii
Distance between our targets and distribution companiesrsquo capacity to offtake eg SECI unable to find buyers This affects growth potential of project developers
Increased adoption of distributed RE including rooftop solar by commercial and industrial players will lead to discoms losing out on high paying consumers further affecting finances
Impact of storage technologies on discom procurement Storage can help manage intermittency and reduce power procurement needs of discoms
Increase in additional costs that developers need to factor in to promote manufacturing RE-waste management managing RE variability etc
States pushing back on their obligations eg Andhra Pradesh attempting to renegotiate contracts This affects financials of existing projects and risk perception for new projects
Changing profile of investors ndash higher returns expectations market consolidation and exit of smaller players Only a few players currently occupy the field with the exit of smaller entities
Developments like MBED RTM GTAM etc show that electricity markets are transitioning towards more short-term and flexible markets Current model of long-term agreements will be unsustainable
Unlocking the demand for RE and capitalising on the immense opportunity that it presents requires innovative solutions that account for legacy issues and yet are forward looking The policies must anticipate these changes and prepare for them while investors need to hedge their bets and modify ways of doing business to continue to lead the energy transition
We recommend the following changes to the policy framework These are based on policy lessons from the study of the sectorrsquos evolution and anticipate the power sector transition that is upon us
bull Centrendashstate and inter-state alignment is essential Collaboration and coordination need to be prioritised instead of mandates and penalties Costs and benefits for all actors must be clearly accounted for An institutional framework must be created that increases Centrendashstate and intrandashstate coordination cooperation and engagement Resource planning budgetary allocations and policy priorities should be outcomes of these formalised processes
bull Institutional framework must build in planning coordination and analytical requirements Data collection management and analysis should be systematic Monitoring and reporting practices should be robust and continuous
bull Addressing counterparty risks will require transformation of RE procurement models Market mechanisms allow for the cost recovery and benefit sharing Capacity deployment must happen based on market mechanisms and market determined price signals PPA terms must reduce and sole priority in power procurement should be efficiency and flexibility for discoms Power procurement as a mechanism to support RE or any future technology will not be sustainable in India till discom finances are sorted out
bull Contrasting interests of RE manufacturers and developers must converge Supply chains must be diverse and resilient to shocks Investors must innovate and policy must support backward and forward integration in RE supply chains
bull Accelerating the flow of capital into the sector requires new investment models that can tap into diverse sources of finance and simultaneously enable the transition of the energy markets
ixExecutive summary ixExecutive summary ixExecutive summary
How Indiarsquos Solar and Wind Policies Enabled its Energy Transition A Decade in Review
Image iStock
Between 2016 and 2018 solar capacity in RE-rich states tripled recording a consecutive year-on-year growth rate of more than 70 per cent
From approximately 21 GW of utility-scale solar and wind capacity at the end of financial year (FY) 2012 (1 GW solar and 20 GW wind) India achieved 70 GW capacity by 31
September 2020 (32 GW ground-mounted solar and 38 GW wind) (MNRE 2020b) This growth story is undoubtedly remarkable Solar and wind energy have also proved to be resilient in times of crisis including during the COVID-19 pandemic in 2020 and have continued to attract investment and attention from policymakers
However the story of Indiarsquos solar and wind power generation is at a critical juncture The rate of growth of capacity addition has been slowing down (see Figure 1) Indiarsquos path to reaching an installed capacity of 160 GW by 2022 (100 GW for solar and 60 GW for wind) and 450 GW by 2030 is hindered by complex challenges They arise from the precarious financial health of distribution companies (discoms) (Garg and Shah 2020) the investment required to build associated infrastructure the dynamics of increasing market penetration of renewable energy (RE) while making fixed cost payments for thermal projects (PEG 2018) direct and indirect energy subsidies in favour of conventional fuels1 and difficulties in balancing the priorities of the Centre and states (Tongia Harish and Walawalkar 2018) Some of these challenges are not new especially the discom crisis and those of inadequate infrastructure However their impact on the growth of RE is significant For instance discoms are finding it challenging to continue to pay fixed costs for thermal assets while complying with the must-run status of RE Forecasting and scheduling are now critical for the integration of variable RE power with the grid These challenges in consuming the power generated from RE plants dissuades discoms from increasing their RE portfolio and hampers revenue from operating assets and further capacity addition These issues must be addressed on a priority basis to scale up RE capacity deployment and utilisation levels New technologies like storage new market platforms and a growing realisation of the benefits of decentralising power generation also have the potential to impact the utility-scale sector in new and unexpected ways
1 Introduction
1
1 These subsidies include oil and gas subsidies and coal subsidies by way of concessional taxes non-compliance or non-enforcement of pollution regulations direct benefit transfers on consumption public distribution at subsidised rates etc (Garg Viswanathan et al 2020)
Storage new market platforms and a realisation of the benefits of decentralising power generation have the potential to impact the utility-scale sector in new and unexpected ways
How Indiarsquos Solar and Wind Policies Enabled its Energy Transition A Decade in Review 2
Figure 1 The rate of growth in solar and wind capacity addition is slowing down (2008ndash2020)
Source CEA 2019 Growth of Electricity Sector in India From 1947-2019 New Delhi CEA MoP CEA 2020 All India Installed Capacity as on 31 December 2019 New Delhi CEA
Before we embark on a policy analysis to determine the best tools to address the above challenges we look back and study the sectorrsquos evolution and evaluate the policiesrsquo impact on RE As RE growth slows and faces newer challenges it is the right time to conduct such an analysis Such an exercise will enable us to understand what are the gaps in the existing policies that need to be mended to adapt to the changing dynamics and yet achieve our objectives The legislative architecture along with a diversity of stakeholders and their objectives and interests makes power sector policymaking and governance a complex space Therefore policy evaluation can be done through multiple lenses This study focuses on the evolving risks for project developers in the bulk RE procurement market and the policy response of the Centre and states to those risks
We focus on the bulk power procurement market because RE growth has been led by utility-scale wind and solar energy projects over this decade with discoms being the largest power purchasers2 While there are dedicated schemes and programmes for the scaling up of other renewable energy sources as well as for distributed RE (DRE) they are of a different nature than those of utility-scale RE since they operate at a more decentralised level3 Further the levels of risk and the challenges facing private investors are markedly different for utility-scale solar and wind on the one hand and distributed and other RE resources on the other However we will briefly discuss the impact of growth of DRE on utility-scale RE in our last section
11 MethodologyWe collated all Central and state policy documents from 2009ndash2019 We then created a comprehensive framework to review each Central and state policy For each policy we recorded the key drivers stated purpose and objectives targets key features and incentives provided budgetary outlays (if any) institutional arrangements beneficiaries stated reasons for amendments and risks that the policy intended to mitigate For Central policies we also identified the role required of the state governments The framework helped us examine the
2 Though the rooftop industry continues to mature with multiple market players innovative business models and new financing structures
3 This is a consequence of the failure to establish competitive markets for RE even though it is among the aims of the Electricity Act 2003 (EA) The gap in the official data which does not capture captive power projects demonstrates this failure
Wind capacity (in MW) Solar capacity (in MW)
0
5000
10000 76679344
1064712807
1689718485
2104323354
26777
3562637746
3404632280
2 2 6 32 941 1686 26323744
6763
21651
28181 34812
1228915000
20000
25000
30000
35000
40000
200
7-0
8
200
8-0
9
200
9-10
2010
-11
Year
Cap
acit
y (in
MW
)
2011
-12
2012
-13
2013
-14
2019
-20
2018
-19
2017
-18
2016
-17
2015
-16
2014
-15
2
This study focuses on the evolving risks for project developers in the bulk RE procurement market and the policy response of the Centre and states to those risks
3Introduction
alignment between Central and state objectives and targets and inconsistencies between and within the policies The key features of the policies we studied are set out in Tables A4ndashA6 of the Annexure We also conducted extensive secondary research to assess the actual performance of these policies actions and developments on the ground and the risks that they addressed
Our study contributes to policy research as it combines a national-level analysis with a close examination of the policies and their impacts at the state level RE resources are not uniformly spread across the country and some states have performed better than others We cover the following RE-rich and RE-poor states in this study
Solar and wind-rich states
bull Andhra Pradesh
bull Gujarat
bull Karnataka
bull Madhya Pradesh
bull Maharashtra
bull Rajasthan
bull Tamil Nadu
bull Telangana
Solar and wind-deficit states
bull Bihar
bull Punjab
bull Uttar Pradesh
The RE-rich states are the top eight in terms of resource potential and capacity addition in wind or solar power or both For the RE-poor areas we have picked states that are not only deficit in solar and wind but also lack alternative power sources like hydro or coal though they have biomass-based power capacity In all these states the power supply position access to energy and power sector infrastructure have evolved over the last decade
In this report we begin by briefly mapping out the institutional framework of the power sector to understand the different agencies that implement andor hinder the implementation of these policies We then trace the evolution of the Central policies which largely focus on supply-side risks Next we evaluate the demand-side measure renewable purchase obligations (RPOs) Subsequently we trace the key drivers and policy focus and evaluate policy performance first in the RE-rich states and then in the RE-deficit states For the state-level analysis we divide our assessment into policies pre- and post-2014 since 2014 marked a departure from the previous years in policymaking activity and its consequences We assess the policies based on the risks they were successful in addressing the risks that they left unaddressed and how they measure up to the next generation of challenges We conclude by pointing to the points of transformation of the sector and the nature of required policy focus going forward
We assess the policies based their success in addressing risks the risks they left unaddressed and how they measure up to the next generation of challenges
How Indiarsquos Solar and Wind Policies Enabled its Energy Transition A Decade in Review
12 Institutional framework The long history of policymaking in the power and RE sector has led to a proliferation of agencies and bodies (see Table 1) The legislative architecture under the Electricity Act 2003 (EA) allows states to autonomously undertake activities such as target-setting framing and enforcing regulations developing and implementing policy and setting up institutional mechanisms
However the Central Government sets the policy direction through its National Electricity Policy the National Tariff Policy and the National Electricity Plan which the state governments and regulators are required to follow These policy documents cover electricity planning project bidding and procurement tariff structures RPOs and optimum utilisation of resources and infrastructure
The Central Electricity Regulatory Commission (CERC) and state electricity regulatory commissions (SERCs) have parallel jurisdictions and functions with respect to promoting the generation of RE tariff determination and dispute resolution Typically CERC does not have the authority to provide policy guidance or issue directions to the SERCs However SERCs are bound by the technical rules guidelines and standards set by the CERC in the Indian Electricity Grid Code (IEGC) based on which they prepare their own state grid codes
Table 1 The institutional structure of the power sector
Source Authorsrsquo analysis
Regional and State Union Territory level
Central
Ministries
Statutory autonomous bodies
Regulators
Operating entities
Ministry of Power (MoP)ndashNodal ministry for the power sector Prepares the National Electricity Policy the National Tariff Policy and the National Electricity Plan
Ministry of New and Renewable Energy (MNRE)ndash Nodal ministry for increasing RE deployment in the country
Central Electricity Authority (CEA)
National Load Dispatch Centre (NLDC)
Bureau of Energy Efficiency (BEE)
Power Financial Corporation (PFC) REC Limited Indian Renewable Energy Development Agency (IREDA)ndash Provide financing and implement schemes for RE projects
National Institute of Wind Energy (NIWE) National Institute of Solar Energy (NISE) Central Power Research Institute (CPRI) etcndash Research and development institutes to estimate RE potential in the country and evaluate the latest technologies in power generation
Central Electricity Regulatory Commission (CERC)ndash Tariff determination dispute resolution preparing the Grid Code and Supply Code (to be followed by the operating entities) promote RE etc
Appellate Tribunal for Electricity (APTEL)ndash Appellate body for dispute resolution
Generation utilities eg NTPC NHPC Damodar Valley Corporation (DVC)
Transmission utilityndash Power Grid Corporation of India Limited (PGCIL)
Independent power producersndash projects connected to the Central grid
TradingMarket entitiesndash NTPC Vidyut Vyapar Nigam (NVVN) Solar Energy Corporation of India (SECI) etc
Relevant energy departments and ministries of the states union territories (UT)
Regional Load Dispatch Centres (RLDC)
Regional Power Committees
State Load Dispatch Centres (SLDC)
state nodal agencies (SNAs)ndash implement RE schemes and oversee RE deployment at the state
State Electricity Regulatory Commissions (SERC) and Joint Electricity Regulatory Commissions ( JERC)ndashTariff determination dispute resolution preparing the grid code and supply code (to be followed by the operating entities) promote RE etc
Generation utilitiesndash state-owned generators
Transmission utilities
Distribution utilities
Independent power producersndash projects connected to state grids
Tradingmarket entities
4
The trajectories of wind and solar have been varied yet have affected each other Often similar policies have had widely varying impact on wind and solar This section briefly
describes the policy scenario pre-2010 and then narrates the policy evolution in the last decade (See Table 2 for brief description of the policies) The section concludes with the assessment and lessons from this journey
21 Pre-2010 ndash private-sector participation and prioritising renewables The initial drivers for new and renewable energy were the successive oil crises in the 1980s that compelled the government to reduce the countryrsquos dependence on imported oil and focus on alternative sources of power RE was also one of the strategies to combat climate change
2 Evolution of Central policies
Image iStock
5
How Indiarsquos Solar and Wind Policies Enabled its Energy Transition A Decade in Review
The government has made accelerated depreciation (AD) of 100 per cent available for both wind and solar power generation since 1994 to incentivise RE capacity deployment
The enactment of the EA also intended to transform the state-controlled electricity sector into a competitive electricity market with private players regulated by the state (Kumar and Chatterjee 2012) Promoting environmentally benign policies is a stated objective of the EA and it envisages renewable sources of energy as a significant contributor to the electricity mix The de-licensing of electricity generation under the EA and the mandating of power procurement through competitive bidding under the National Tariff Policy 2006 (NTP 2006) were game-changing reforms towards increasing private-sector investments in power generation The NTP 2006 permitted discoms to procure RE at tariffs fixed by their respective SERCs also called feed-in tariffs (FiTs)4 The SERCs determined the FiTs based on their tariff determination regulations Central regulations in turn guided these regulations The CERC notified the first guidelines for tariff determination in 2009 [(CERC (Terms and Conditions for Tariff Determination from Renewable Energy Sources) Regulations 2009) (Tariff Determination Regulations)] The first generic tariff order determined utility-scale solar PV tariff of INR 1844 and wind power tariffs of INR 563 490 417 and 375 (for Wind Zones 1 2 3 and 4 respectively)5
The policiesrsquo cumulative effect was that by 2010 RE accounted for 97 per cent of the available installed power generation capacity in the country (MoP 2010) This capacity was mainly wind energy and bagasse-based cogeneration6 Successful demonstration projects led by the ministry and collaborations with global technology providers were key triggers of establishment of domestic manufacturing and supply chain in India (Ganesan et al 2014) The AD incentive was particularly useful for private entities who set up distributed and small-scale wind turbines to avail of it This domestic demand also supported development of wind manufacturing capacity in India (Sud 2015 Idam Infra 2016)
Solar power however was lagging Despite the available incentives there were no immediate responses from investors developers and most state governments primarily due to high technology costs Till March 2010 solar capacity remained at 6 MW Subsequently significant policy actions leading to cost reductions and investment commitments marked an upward growth trajectory (see Figure 1)
Table 2 Evolution of Central policies for utility-scale wind and solar energy ndash 2010ndash2019
Source Authorsrsquo analysis
Risks and barriers targeted to be mitigated benefits TechnologyPolicyscheme
Promotion of RE competitive bidding and RPO in National Tariff Policy 2006
National Solar Mission 2010
National Action Plan on Climate Change 2008
Wind
Solar
Creating demand for expensive RE power through RPOs
Policy certainty and continued government support for promotion of RE
Managing offtake risk by signing long-term power purchase agreements (PPA) and providing payment security
Policy certainty and continued government support for promotion of RE
Creating demand for expensive RE power through RPOs
Policy certainty and continued government support for promotion of RE
4 This flexibility was required because RE tariffs at this time could not be compared to those of conventional power However the NTP 2006 also noted that RE power would eventually have to compete with power from other sources at their full cost
5 Order dated 3 December 2009 issued by CERC in Petition No 2842009 titled Determination of Generic Levellised Generation Tariff httpwwwcercindgovin2009November09284-2009_final_3rdDecember09pdf
6 Due to its economic co-benefits bagasse-based cogeneration developed mostly in the sugar producing regions of India
6
Table 2 contdRisks and barriers targeted to be mitigated benefits
TechnologyPolicyScheme
GBI for grid interactive wind power projects 2009 and 2013
NSM Phase II Batch I 2013 (VGF Scheme)
Scheme for solar park development 2014
National Tariff Policy 2016
Commencement of competitive bidding in wind 2016
MNRErsquos policy for re-powering wind projects 2016
Financial incentives for setting up wind power projects
Managing offtake risk by signing long-term PPAs and providing payment security
Low tariffs for discoms through competitive bidding
Financial support for project developers
Delay and roadblocks in land identification aggregation and acquisition
Delays in obtaining approvals and clearances
Risk of conflict with environment or social impact assessment
Lowering cost of supporting infrastructure and services
Creating demand for RE by setting common national trajectory for RErsquos share in consumption
Managing offtake risk by signing long-term PPAs and providing payment security
Low tariffs for discoms through competitive bidding
Support to utilize wind resources efficiently
NSM Phase I Batch II (Bundling scheme) 2011
Green Energy Corridor project 2013
NSM Phase II Batch III 2015
NSM Phase II Batch IV (State specific VGF scheme) 2016
MoPrsquos order on waiver of inter-state transmission charges and losses 2016
Competitive bidding guidelines for solar 2017
Managing offtake risk by signing long-term PPAs and providing payment security
Lowering tariff for discoms by bundling thermal and solar power
Addressing transmission risk and offtake risk by reducing congestion on grid
Managing offtake risk by signing long-term PPAs and providing payment security
Low tariffs for discoms through competitive bidding
Managing offtake risk by signing long-term PPAs and providing payment security
Low tariffs for discoms through competitive bidding
Financial support for project developers
Financial incentive for export of power outside the state
Managing offtake risk by signing long-term PPAs and providing payment security
Low tariffs for discoms through competitive bidding
Must-run status in Grid Code 2010
Introduction of renewable energy certificates (REC) 2010
Addressing transmission and curtailment risk
Creating mechanism to broaden the demand base
7Evolution of Central policies
How Indiarsquos Solar and Wind Policies Enabled its Energy Transition A Decade in Review
22 Post-2010 policies for solar The Jawaharlal Nehru National Solar Mission (NSM) notified in January 2010 was a turning point in the RE story The NSM was one of eight missions developed as part of Indiarsquos National Action Plan on Climate Change (NAPCC) Its primary objective was to develop and deploy solar energy technologies including utility-scale distributed solar and solar thermal energy It targeted the entire ecosystem of solar energy deployment and included measures to support research and development human resource development the increase of technical capacity and awareness of these technologies Such measures included providing technical assistance training customs and excise duty concessionsexemptions on capital equipment critical materials components and project imports ease of doing business and enabling domestic manufacturing through exemptions and incentives The NSM laid out a phase-wise approach until 2022 that brought about policy certainty
The risks for investors and financiers were considerable The upfront costs were high while returns were not guaranteed (since the technology had not yet proven its track record within India) Further even if discoms were willing to sign power purchase agreements (PPAs) low connectivity and transmission capacity hindered offtake However more significant was the payment risk arising due to the poor financial health of discoms The payment risk adds as much as 107 per cent of the additional risk premium to the cost of debt (Atal and Shrimali 2018)
To counteract the payment risk the NSM devised an arrangement whereby NVVN (NTPC Limitedrsquos trading arm) would purchase power from the solar developer for onward sale to state discoms under a power sale agreement (PSA) The standard PSA included a clause stating that in case the discom failed to make timely payments NVVN could invoke the tripartite agreement signed by the Central Government the relevant state government and the Reserve Bank of India (RBI)7
The NSM envisaged that the key driver for promoting solar power would be the RPO mechanism with the FiT and PPA duration determined by the CERC It aimed to achieve parity of solar and coal tariffs by 2030
NSM was to be implemented in three phases The target for Phase I which lasted till 2013 was 1000 MW The initial target of 20 GW was increased to 100 GW in 2015 to be achieved by December 2022 As of November 2020 3691049 MW of solar power capacity has been installed (MNRE 2020b)
Competitive bidding guidelines for wind 2017
Managing offtake risk by signing long-term PPAs and providing payment security
Low tariffs for discoms through competitive bidding
MoP and MNRErsquos order on opening and maintaining adequate LC as PSM under PPAs by distribution licensees 2019
Addressing payment risk from discoms
7 Article 648 of the Standard Draft PSA between NVVN and Distribution Utility (2010) httpwwwnvvncoinDRAFT20PSA_NVVN-Discom_March2029202010pdf In case a state discom defaulted on any payment obligations NVVN could invoke this agreement and the pending dues could be routed to it through the RBI The Centre can then deduct the relevant amount from the annual fund transfers from the Centre to the state which is the most significant source of state government revenue
Table 2 contd
88
Phase IThe guidelines to operationalise the first phase of NSM were notified in July 2010 Many projects had already begun construction before this notification Such projects were permitted to migrate to the NSM and sign PPAs with NVVN The NSM selected fresh projects based on the discounts that the developers were offering on CERC-approved tariffs applicable as of the date of submission of their applications These projects needed to be commissioned within 12 months of the developers signing the PPA In Phase I the NVVN could bundle unallocated conventional power procured from the NTPC and sell it to discoms to average the tariffs
For payment security the standard PSA required the buying utility to open a six-month letter of credit (LC) backed by an escrow account in favour of NVVN Further under an order dated 30 June 2011 the MNRE created a separate payment security fund of INR 486 crore However despite the implicit state guarantee transaction advisers suggested that investors be cautious The standard PPA was not considered bankable (Sustainability Outlook 2010 Jog 2013) High project costs and unproven technology increased the risk Developers were also concerned that the PPA prices could be reduced during its duration
Additionally domestic content requirement (DCR) that required polycrystalline photovoltaic (PV) cells and modules being used to be manufactured in India was imposed on NSM projects The DCR distorted the market towards other PV technologies like thin film (Paliwal and Hamberg 2015) and adversely affected the existing manufacturing base in India that predominantly manufactured polycrystalline PV DCR would have constrained developersrsquo technology choices and did not benefit the domestic manufacturers (Ganesan et al 2014)
The government eventually withdrew DCR after failing to defend the move before the World Trade Organisation (WTO) in a dispute initiated by the United States of America in 2013 on grounds that DCR was discriminatory against imports under the lsquoNational Treatmentrsquo principle (WTO 2016)
Phase I was successful in achieving its target of installed capacity of 1000 MW of grid connected power It also served to demonstrate the technology and the intermediary arrangement under the NSM However even before the Phase II guidelines were notified developers and financiers raised concerns about delayed payments To manage this risk the lenders demanded that NVVN be made a beneficiary of the tripartite agreement (Jog 2013)
Phase II
The Solar Energy Corporation of India Limited (SECI) was designated as the implementing agency for Phase II SECI a public-sector company is an electricity trading licensee and signs PPAs with developers to purchase power for on-sale to discoms and other consumers In February 2017 SECI became a beneficiary of the tripartite agreement between the Government of India state governments and the Reserve Bank of India Consequently ICRA Limited (a credit rating agency) enhanced SECIrsquos credit rating from AA- to AA+ This increased the bankability of SECI projects SECI was required to create a payment security fund of INR 500 crore to cover for three monthsrsquo payment By 2014 SECI received bids worth 2170 MW under reverse bidding conducted by it and signed PPAs and PSAs with state discoms (SECI 2014) Phase II focused on providing viability gap funding (VGF) to project developers However the utility of the VGF initiative is questionable as the actual expenditure of the committed funds progressively declined across the various schemes (see Table 3) After the notification of the
9Evolution of Central policies 9Evolution of Central policies
JNNSM Phase I was successful in achieving its target of 1000 MW grid-connected power However developers and financiers raised concerns about delayed payments even before the notification of Phase II guidelines
How Indiarsquos Solar and Wind Policies Enabled its Energy Transition A Decade in Review
Table 3 Snapshot of VGF schemes
Source Authorrsquos adaptation from MNRE 2020 Annual Report 2019ndash20 New Delhi MNRE and SECI 2019 8th Annual Report 2018ndash19 New Delhi SECI
Allotted and commissioned capacity
VGF per MW Estimated expenditure (in INR crore)
Actual expenditure (in INR crore)
Bidding parameter
TariffYear NSM Phase II batch
2013
2016
2015
750 MW Batch I
Phase II Batch IV
2000 MWBatch III
Discount on VGF
Discount on VGF or tariffAfter 2017 ndash only tariff
Discount on VGF or tariff
INR 545 per kWh INR 475 with AD
No fixed tariff
INR 443 per kWh for the first year annual escalation of INR 005 kWh for the next 20 years with the maximum tariff capped at INR 643 kWh
680 MW
Awarded 3420 MW (as on 31 December 2019)2470 MW capacity commissioned in the states of Gujarat Odisha Maharashtra Rajasthan UP Andhra Pradesh (Kadapa Solar Park) and Karnataka (Pavagada Solar Park) (as on 31 December 2019)
Awarded 2155 MW2295 MW capacity reported as commissioned in the states of Andhra Pradesh Chhattisgarh Karnataka Maharashtra and Uttar Pradesh at both solar park and non-solar park locations (as on 31 December 2019)
The lower of INR 25 crore and 30 per cent of project cost
INR 1 crore for open category
125 for DCR projects
The lower of INR 25 crore and 30 per cent of project cost
1875
5050
1875
742
19163
742
Phase III Phase III of the NSM is currently underway The target is to achieve 100 GW of cumulative solar capacity by 2022 The bidding is conducted under the Solar Bidding Guidelines Various intermediary procurers are participating in conducting the auctions including SECI NTPC and NHPC Limited As of March 2020 solar capacity of 2135 GW was under various stages of implementation and 3127 GW was under different stages of bidding (ETEnergyWorld 2020)
23 Impact of other policies on project deploymentAfter the high-growth period of 2016ndash2018 capacity addition slowed in 2018ndash19 which was a cause for concern It represents a break in the growth momentum There are multiple contributory factors for the slowdown
Guidelines for Tariff Based Competitive Bidding Process for Procurement of Power from Grid Connected Solar PV Power Projects (Solar Bidding Guidelines) in 2017 tariff became the sole bidding parameter and VGF fell into disuse
1010
The introduction of the Goods and Services Tax (GST) in 2017 created considerable confusion and administrative challenges8 It decelerated the growth momentum and raised project costs by 10ndash15 per cent (Soman et al 2019) The imposition of safeguard duties on imports of solar cells and modules from China and Malaysia was introduced in 2018 Eventually these costs were made good to the project developers by their PPA counterparties under the lsquochange-in-lawrsquo clause of the PPA However the uncertainty surrounding its timeline increased cost of procuring components from exempted jurisdictions and litigations before the regulatory commissions to get the duty adjudged as change-in-law added to the costs of under-construction projects and delayed new projects (Thomas 2018 Jai 2018) Payment delays by discoms renegotiation threats curtailment tariff ceilings on bids etc also caused many investors to delay their investment decisions and many SECI tenders were undersubscribed (Buckley and Shah 2020 Chatterjee 2019) Tariff ceilings were removed by MNRE in March 2020 to revive investor interest
Lately SECI has struggled to find buyers for the auctioned capacity For example under a manufacturing-linked solar auction conducted in January 2020 SECI is yet to sign the PPA even after 10 months of awarding the project because it is unable to find buyers for the power (Reuters 2020) This development shows the signs of stress and limits to the NSM model for RE growth
24 Solar Park Scheme
Land procurement in India is hugely complicated with challenges ranging from the legal to the political (TERI 2017) For developers private procurement is expensive and time-consuming This is evidenced by the consecutively increasing time limit for obtaining possession under the NSM In Phase I 180 days was the time limit in Phase II Batch I the time limit was increased to 210 days and currently developers must show possession only at the time of commissioning the project
As the number of RE projects increases we are witnessing more acute problems in relation to the acquisition of land (Tenddulkar 2019) Land is however a state subject and the Centre has limited scope to enable easier land procurement To facilitate economies of scale and support systematic planning and deployment in 2014 the MNRE launched a first-of-its-kind scheme to develop ultra-mega solar parks In 2017 the target under the scheme was enhanced from 20000 MW to 40000 MW with an objective to set up at least 50 solar parks by 2022 (MNRE 2020a) Under this scheme solar park developers can acquire land obtain the necessary permissions and build the required infrastructure including evacuation infrastructure for the capacity to be housed within the park As of December 2019 the MNRE had approved 39 solar parks with a total capacity of 22879 MW across 17 states (MNRE 2020a)
8 The GST is supposed to be an integrated tax on both goods and services In the earlier tax regime goods and services were taxed separately (exciseimport dutiesVAT on goods and service tax on services) For RE the cells and modules are taxed at 5 per cent while services attract an 18 per cent GST rate However for RE works contracts (ie the engineering procurement and construction contracts) the supply of equipment necessary for setting up a power plant and the service component (ie the actual setting up of the plant) are difficult to segregate The government eventually fixed a 7030 ratio for the goods and services components of the contracts respectively (William 2020)
11Evolution of Central policies 11Evolution of Central policies
After an impressive growth period between 2016ndash18 various factors in addition to counterparty risks such as introduction of GST and safeguard duties on imported cells and modules led to change-in law cases delaying projects as well as investor decisions
How Indiarsquos Solar and Wind Policies Enabled its Energy Transition A Decade in Review
25 Post-2010 policies for wind The NSM defined solar power development while wind policies followed a separate trajectory till late 2016 The flip-flops of the Central Government in withdrawing and re-introducing benefits such as AD and generation-based incentives (GBI) had adverse effects on wind capacity addition 100 per cent AD was introduced in 1994 AD was reduced to 80 per cent in 2002 GBI was introduced in 2010 Both AD and GBI lapsed in 2012 but were reintroduced in 2013
Wind power was brought into the competitive bidding regime with the 2016 interstate transmission system (ISTS) wind scheme for 1000 MW and the notification of the Guidelines for Tariff Based Competitive Bidding Process for Procurement of Power from Grid Connected Wind Power Projects in 2017 (Wind Bidding Guidelines) SECI floated the first tender for ISTS wind in OctoberNovember 2016 it concluded in February 2017 and PTC India Limited signed the PPAs (Saumy 2017)9 The bidding procedure and guidelines were similar to those conducted for solar energy It helped bring tariffs down from INR 416ndash602 FiT to INR 346 (see Figure 3) The primary reason for the lower tariff was reduced counterparty risk (CRISIL 2017) with competition driving down tariffs even lower
Figure 2 The pace of solar park development under the Central scheme has been slow (as on 31 December 2019)
Source Authorsrsquo adaptation from MNRE 2020 Annual Report 2019-20 New Delhi MNRE
9 Order dated 3 December 2019 issued by CERC in Petition No 340AT2019 titled PTC India Ltd v SECI and Ors httpwwwcercindgovin2019orders340-AT-2019pdf
0
5000
10000
40000
22879
103207767
15000
20000
25000
30000
35000
40000
45000
50000
Solar park status
Target capacity
Approved capacity
Capacity of fully or partially
operational parks
Commissioned capacity
Cap
acit
y (in
MW
)
12
Figure 3 Competitive bidding in wind brought down the tariffs significantly
Sources FiT orders Order dated 15 May 2014 issued by CERC in Petition No SM3542013 (Suo-Motu) titled Determination of generic levellised generation tariff for the FY 2014-15 Order dated 31 March 2015 issued by CERC in Petition No SM0042015(Suo-Motu) titled Determination of generic levellised generation tariff for the FY 2015 - 16 Order dated 30 March 2016 issued by CERC in Petition No SM032016 (Suo-Motu) titled Determination of levellised generic tariff for FY 2016-17 Auction tariffs from India RE Navigator 2020 ldquoAuction Resultsrdquo Accessed November 28 2020 httpsindia-re-navigatorcomwind
After the discovery of these lower tariffs even under-construction projects were brought within the bidding regime or else their tariffs were renegotiated The reduced tariffs led to reduced margins and concerns that the existing thriving ecosystem which was driven by original equipment manufacturers (OEMs) is collapsing10 After 2017 there was a sharp decrease in the rate of growth of capacity additions (see Figure 1) leading to unsold inventory with the OEMs Discoms were no longer willing to sign PPAs on FiTs and the pace of bidding failed to keep up with expectations
Further because of the low tariffs it has become essential that the developers set up projects in high wind density sites Land has hence become the most crucial element of investment decisions in wind However state policies have not been very conducive in this aspect The consequent delays in setting up projects is further affecting wind OEMs (Dutt Arboleya and Gonzalez 2020) Since the introduction of competitive bidding in wind 191 GW has been auctioned but only 145 GW has been awarded In 2020 the wind bids have been linked to storage blended with solar or been part of hybrid projects Bidding was particularly constrained in 2019 were 5400 MW was tendered but only 2720 MW was awarded (India RE Navigator 2020)
10 This is evidenced by the stressed balance sheets of major wind OEMs including Suzlon and Inox and the exit of Senvion from the Indian market The number of OEMs has reduced from 14 to 5 (Arora 2019) Thin margins are a feature of the entire RE sector however specifically in case of wind competitive bidding and the resulting low tariffs caused a disruption to the existing ecosystem of the industry
0
1
2
576 598 601
346264 243 244 2513
4
5
6
7
FiT 2014ndash15
FiT 2015ndash16
FiT 2016ndash17
SECI February
2017
SECI October
2017
GUVNL December
2017
SECI February
2018
SECI April 2018
CERC determined FiT Auction
Tari
ff (I
NR
per
kW
h)
13Evolution of Central policies
How Indiarsquos Solar and Wind Policies Enabled its Energy Transition A Decade in Review
Land riskLand availability constitutes a major challenge for developers and causes significant project delays The development of solarRE parks provided comfort to developers and led to the realisation of economies of scale However as against the solar park target of 40000 MW by 2022 as of December 2019 only 7767 MW have been commissioned (see Figure 2) Solar park development comes with a chicken-and-egg problem Without committed projects it is expensive to develop solar parks but once projects are awarded solar park development cannot take place within the time provided for project commissioning since solar parks require a longer time for construction Furthermore because solar parks require even greater parcels of land chances of land conflicts are higher While states such as Rajasthan and Gujarat have fared well because of the presence of abundant wastelands others such as Andhra Pradesh (eg Kadapa and Ananthapur) and Karnataka (eg Pavagada) have all faced land conflicts Other issues that developers face relate to the quality of the land ancillary infrastructure and upfront and operation and maintenance (OampM) fees Proposed solar park projects have been cancelled because of unexpectedly high bid tariffs (Seetharaman and Chandrasekaran 2019) Though there have been success stories like the Rewa Solar Park (Bhaskar 2020) we need better planning and coordination between the Centre and the states to mitigate land-related barriers and risks
Curtailment and evacuation risksRE faces a high degree of curtailment risk (Aggarwal and Chawla 2019) The Grid Code 201011
(Grid Code) which must be followed by all states grants a must-run status to power generated from wind and solar plants This means that utilities and system operators must prioritise evacuation of power from must-run plants unless there are grid unavailability security or
11 Clause 52 (u) of the Grid Code
141414
26 Policy assessmentWe now briefly discuss some of the continuing structural risks that the above policies have failed to address or inadequately addressed and surmise the policy lessons from the Central policies (See Table 4 for Indiarsquos project pipeline to achieve the targets)
Table 4 Indiarsquos progress towards 175 GW renewable energy by 2022
Source Amitesh Sinha 2020 ldquoIndiarsquos Ambition and Opportunities in Solar Manufacturingrdquo Presentation India PV Edge 2020 Virtual conference 6 October
Under implementation
(GW)
Tendered (GW)
Total (installed +
pipeline)
Target (GW)
Installed capacity
(GW)
Sub-sector
Solar
Biomass
Total
Windndashsolar hybrid
Wind
Small hydro
RTC assured peak power supply
100
10
175
60
5
3574
1003
88511 4511 2843 16205
825
474
3336
0
144
825
046
16
2066
0
12
157
0
5
8976
1003
264
4782
52
66
safety constraints However commercial considerations grid unavailability and technical grid security concerns lead to curtailment which translates to revenue loss for developers Curtailment could contribute to 14 per cent of the risk premia (Atal and Shrimali 2018)
In the early set of PPAs there was no provision to compensate generators in case of backdown of power However the Solar Bidding Guidelines and the Wind Bidding Guidelines incorporated provisions that require the power purchaser to compensate the generator in case of backdown for reasons other than technical constraints However must-run status has not been as effective as intended and the risk of curtailment persists
Further as RE deployment grows problems arising out of the inadequacies of the evacuation infrastructure assume greater proportions The problem is compounded by the need for transmission infrastructure to be in place before an RE project is conceptualised because the infrastructure takes up to five years to complete while RE projects typically take between 12ndash18 months to launch (H Singh 2017)
A functioning ISTS is also essential as it helps diffuse the costs and benefits of RE across the country and can enable effective implementation of the RPO Hence inter-state transmission charges and losses have been exempted since 2016 and will continue to be exempted till June 2023 Policymakers recognised this problem early on and PGCIL proposed a transmission plan for the envisaged RE capacity in 2011 dubbed the Green Energy Corridor A loan-plus-grant mechanism was devised to fund inter- and intra-state transmission corridors in 2015 However this programme does not address the incentive problem ndash it requires the states to cooperate and take the initiative to submit project proposals for obtaining grants provide last-mile connectivity and improve their own transmission infrastructure There is not enough incentive for RE-rich states to spend money to build the required infrastructure There is no clear accounting or evidence of the benefits that a RE-rich state government will receive if it allocates money and human resources for this purpose
Further there is no transparent data published on curtailment duration curtailing entities and reasons for curtailment So far generators have pooled their data and been able to demonstrate evidence of curtailment However no one knows the exact reasons for such curtailment It is hence difficult to analyse the predominant causes and accordingly frame a policy response
Payment riskAs we have just discussed assured offtake at a fixed tariff for the lifetime of the project helped investors tide over the risks of adopting a new and untested technology and helped increase the scale of these projects
While payment obligations were assured on-time payments remain a concern Delayed payments affect investor returns and project cash-flows adversely Most PPAs have provisions that require the purchaser to create a payment security mechanism (PSM) Opening letters of credit (LC) is the most common PSM However there is widespread non-compliance of this provision SECI had not created any LC under any of its PPAs (though it has a good track record of payment) (Economic Times 2019) As a solution in June 2019 the MoP directed the NLDC and the SLDC to dispatch power only after an LC had been opened for the power
15Evolution of Central policies 15Evolution of Central policies 15Evolution of Central policies
Any transmission infrastructure expansion programme needs to solve for the incentive problem facing the states
How Indiarsquos Solar and Wind Policies Enabled its Energy Transition A Decade in Review
being scheduled The discom would also be liable to pay full tariff on the power that is not scheduled The concerned discom was also precluded from purchasing power from the power exchange and getting a short term open-access (STOA) (MoP 2019) This move essentially brought system operators into contract enforcement which ideally should be beyond their remit Apart from this drawback in the design according to feedback from the developers the move did not change anything on the ground However it has had only one year of effective operation since once COVID-19 struck MoP partially rolled back the directive till 30 June 2020 and permitted scheduling of power even if the PSM was reduced by 50 per cent (MoP 2020b)
Policy lessonsThe success story so far has made India a dominant force in the RE space globally It was able to leverage its growing market and even take leadership on global initiatives like the International Solar Alliance After the implementation of the NSM solar power deployment increased exponentially Further the competitive bidding regime introduced first in solar and then for wind was successful in driving down tariffs
However existing policies are not sufficient to address risks arising from the structural pathologies of the electricity sector and the changing nature of barriers and risks With RE prices falling it may seem that RE procurement would be the natural choice for discoms However discoms hold-out on signing PPAs with the expectation that tariffs would fall even further with each passing auction (Prasad 2020) Deep-rooted issues such as the procurerrsquos obligation to pay fixed costs under long-term PPAs inadequate demand-supply planning and skewed fuel subsidies distort the market Further policies that burden the discoms further like the LC requirement have no real impact on the ground
Tying discoms down in long-duration PPAs reduces their ability to respond to new market developments and forces them to procure at above-market costs posing a greater risk for the sector in the long term While these policies may work for project developers in the short term they do not make the most commercial sense for discoms The fixed cost payment issue is one such example Technologies like storage and introduction of market platforms have the potential of bringing in economic efficiencies in discom procurement strategies (CERC 2018) Hence a variation in procurement strategy for discoms is imminent and policies must enable them Such variation is already visible in the thermal markets where MoP has commenced medium-term power procurement Resistance from incumbent market players is expected and must be addressed for a transition that works for all stakeholders
Further the policy framework till now has a serious gap in data collection and transparency There is lack of data on project-specific information on generation technology selection etc Detailed data on these aspects could have informed policy activity on cost and technology bringing in greater efficiencies The Centre has the mandate to formulate policy in this regard and must make up for the lost time
161616
India is a strong force in the global RE space However existing policies are not sufficient to address the deep-rooted issues and evolving nature of risks inhibiting a natural transition to RE
The NSM Solar Park Policy and other fiscal incentives are supply-side measures targeted at reducing investment risks However a measure to create demand was essential because
RE was considerably more expensive than conventional power in 2010 Demand for RE was created through the RPO mechanism
The EA enabled state regulators to specify a minimum purchase obligation Section 86(1)(e) of the EA requires the SERCs to ldquopromote cogeneration and generation of electricity from
3 Renewable purchase obligations ndash a regulatory mechanism for creating demand
Image iStock
171717
How Indiarsquos Solar and Wind Policies Enabled its Energy Transition A Decade in Review
renewable sources of energy by providing suitable measures for connectivity with the grid and sale of electricity to any person and also specify for purchase of electricity from such sources a percentage of the total consumption of electricity in the area of a distribution licenseerdquo
The NTP 2006 required the SERCs to fix the RPOs ldquotaking into account availability of such resources in the region and its impact on retail tariffsrdquo In the absence of any fixed target or specific obligation only a few states notified the purchase obligations The initial movers were Gujarat (2005) Kerala (2006) Rajasthan (2007) and Madhya Pradesh (2008)
Fixed targets were set for the first time under the NAPCC which prescribed that RE (including bioenergy and small hydro) should account for 5 per cent of total grid purchase in 2010 which would increase to 15 per cent by 2020 with a one per cent increase each year In 2011 the NTP 2006 was amended to include a minimum RPO of 025 per cent for solar power by the end of 2012ndash2013 and 3 per cent by 2022
During 2010ndash2012 many states notified their respective RPO regulations This activity was most likely driven by the increased government and investor focus on RE after the introduction of the NSM The obligated entities ie the entities on whom the RPOs were imposed were discoms captive consumers and open-access consumers
The policymakers were however cognisant of resource variability across the different states To bridge the resource gap and ensure sustained demand for RE they enabled the issuance and trading of renewable energy certificates (REC) Under the REC mechanism registered RE generators receive one REC against one MWh of energy they produce12 The power component is sold separately to discoms and open-access consumers at the average power purchase cost (APPC) or a mutually agreed price respectively The RECs are categorised into solar and non-solar RPOs These RECs can be put up for sale in power exchanges where they can be bought by obligated entities and voluntary buyers or retained by the generator to meet their own RPOs (the latter was allowed from 2013) The CERC periodically fixes a floor price and forbearance price and the trading occurs within this price band
31 Setting RPO targets
The RPO targets notified by states are set out in Table A1 in the Annexure As is evident statesrsquo RE ambition varies widely and there was considerable variance between them and the NAPCC targets Karnataka Tamil Nadu Maharashtra and Rajasthan set relatively high targets while Andhra Pradesh Bihar Madhya Pradesh and Uttar Pradesh set quite low targets
The trajectory set out in the NAPCC did not have any legally binding value on the SERCs and the states were technically free to determine their RE targets However their targets were inadequate to achieve national policy objectives
To address the inadequacy of the RPO targets the NTP was revised in 2016 enabling the Ministry of Power (MoP) to notify a common trajectory from 2016ndash17 to 2018ndash19 The MoP has notified the RPO trajectory up to FY 2021ndash22 (Table 5) (MoP 2016 2018) Since then states must align their trajectories to that set by the Central Government
12 The detailed procedure for all matters relating to RECs is set out in the CERC (Terms and Conditions for Recognition and Issuance of Renewable Energy Certificates for Renewable Energy Generation) Regulations 2010 (REC Regulations) The first solar and non-solar RECs were issued in May 2012 and March 2011 respectively
18
In the absence of any fixed target or specific obligation before 2010 only a few states notified the purchase obligations The initial movers were Gujarat (2005) Kerala (2006) Rajasthan (2007) and Madhya Pradesh (2008)
13 The petition was filed under Section 121 of the Electricity Act 2003 which empowers the tribunal to issue orders instructions or directions to the appropriate commission for the performance of its statutory functions
Till January 2017 only three states ndash Andhra Pradesh Madhya Pradesh and Rajasthan ndash had issued draft regulations specifying a trajectory in line with the one prescribed by the MoP (MNRE 2017) In 2017 Karnataka revised their official policy targets from 2000 MW to 6000 MW of solar power to match the RPO trajectories set by the MoP (The Hindu 2017) Till March 2020 only nine states had aligned their RPO trajectories with that of the MoP (MoP 2020a) The remaining states are yet to either notify their 2021ndash22 trajectories or align them with the Central trajectory While Maharashtra has not aligned its targets it provides incentives of INR 025 per kWh above the state prescribed RPO for procurement up to the MoP target
32 Compliance with RPOThe obligated entities can comply with their RPOs through two routes direct procurement (FiTcompetitive bidding) and purchasing RECs from power exchanges
State regulations typically contain provisions for monitoring compliance which require the obligated entities to submit information to the state nodal agencies and the nodal agencies are required to file periodic compliance reports with the SERC The SERC can also initiate suo moto proceedings to verify compliance
In cases of non-compliance SERCs are typically required to direct the obligated entities to deposit such amounts as the SERC may determine in a separate fund which will then be used to purchase RECs and develop transmission infrastructure However certain provisions ndash like permitting target revision fungibility between solar and non-solar RPOs and carrying forward the RPOs ndash are specific to the states SERCs can also revise the RPOs in case of constraints in the availability of renewable energy A snapshot of the provisions can be found in Table A2 in the Annexure
As early as 2013 power producers filed a petition before the Appellate Tribunal of Electricity (APTEL)13 claiming that various state discoms and obligated entities were not complying with the RPO regulations The petition arose due to the failure of state commissions to implement their RPO regulations The petitioners submitted that the SERCs frequently allowed deferment carry-over and exemptions of the obligations and did not enforce compliance by directing purchase of RECs despite their availability The MNRE also submitted that discoms made inadequate provisions for compliance while the SERCs did not invoke penal provisions to enforce compliance It further submitted that the SERCs did not seek RPO compliance reports in accordance with the regulations and that many had not even announced their long-term RPO trajectories The CERC submitted that the REC market had a large unsold inventory of non-solar RECs that were being traded at floor prices It further noted that the demand for RECs is largely driven by very few private distribution licensees and few captiveopen-access customers meanwhile the state discoms generally do not purchase RECs to fulfil their RPOs
Table 5 MoP trajectory for RPO
Source MoP 2016 Guidelines for Long-term RPO Growth Trajectory of Renewable Purchase Obligations (RPOs) for Non-solar as well as Solar Order No 2332016-RampR New Delhi MoP 22 July MoP 2018 Long-term RPO Growth Trajectory of Renewable Purchase Obligations (RPOs) for Solar and Non-solar for a Period of Three Years ie 2019ndash20 to 2021ndash22 Order No 23032016ndashRampR New Delhi MoP 14 June
2016ndash17 2017ndash18 2018ndash19 2019ndash20 2020ndash21 2021ndash22Category
Non-Solar
Solar
Total
875
275
115
95
475
1425
1025
675
17
1025
725
175
1025
875
19
105
105
21
19Renewable purchase obligations ndash a regulatory mechanism for creating demand
How Indiarsquos Solar and Wind Policies Enabled its Energy Transition A Decade in Review
The SERCs used the provisions built by them in the RPO regulations to allow non-compliances to occur The APTEL directed the SERCs to strictly enforce compliance and use the provisions sparingly and in accordance with the spirit of the mandate
Variance in compliance within states
The MNRE has consistently been urging states to align their RPO trajectories with that of the Central Government and ensure strict compliance In August 2019 the MNRE sought APTELrsquos intervention to nudge SERCs to enforce and align RPOs and not to allow any waivers or carrying forward (MoP 2020a) In 2019ndash20 some RE-rich states including Maharashtra Gujarat Tamil Nadu Rajasthan and Telangana fell short of meeting their RPO targets Apart from Andhra Pradesh Rajasthan Karnataka and more recently Tamil Nadu no other state has met their RPO targets (MoP 2020a) Figure 4 compares the RPO compliance situation across 2015ndash16 and 2017ndash18 of Tamil Nadu Maharashtra Bihar and Punjab and is representative of the compliance situation across the country
Figure 4 Compliance with RPOs is uneven among states and discoms
Source Authorsrsquo adaptation from Order dated 11 August 2017 issued by the TNERC in TP No1 of 2017 titled Determination of Tariff for Generation and Distribution Order dated 27 March 2019 issued by the MERC in Case No36 of 2019 titled Case for Verification of compliance of Renewable Purchase Obligation targets by Maharashtra State Electricity Distribution Co Ltd for FY 2017-18 Order dated 2 April 2019 issued by the MERC in Case No37 of 2019 titled Case for Verification of compliance of Renewable Purchase Obligation targets by Brihanmumbai Electric Supply amp Transport Undertaking for FY 2017-18 Order dated 2 April 2019 issued by the MERC in Case No38 of 2019 titled Case for Verification of compliance of Renewable Purchase Obligation targets by Tata Power Co LtdndashDistribution) for FY 2017-18 Order dated 4 April 2019 issued by the MERC in Case No39 of 2019 titled Case for Verification of compliance of Renewable Purchase Obligation targets by Adani Electricity Mumbai Limited for FY 2017-18 Order dated 23 October 2017 issued by the PSERC titled Annual Revenue Requirement and Determination of tariff for MYT control period from FY 2017-18 to FY 2019-20 and for True up of FY 2015-16 Order dated 19 April 2018 issued by the PSERC in Petition titled True up of FY 2016-17 Annual Performance Review ndashAPR) for FY 2017-18 and Determining the Annual Revenue Requirement ndashARR) for FY 2018-19 Order dated 27 May 2019 issued by the PSERC in Petition No 02 of 2019 titled True up of FY 2017-2018 Annual Performance Review ndashAPR) for FY 2018-19 Approval of Revised Annual Revenue Requirement ndashARR) and Determination of Tariff for FY 2019-20 Order dated 25 February 2019 issued by the BERC in Case No 40 and 48 of 2018 and Case No 41 and 47 of 2018 titled Tariff Order for FY 2019-20 for NBPDCL and SBPDCL Order dated 24 March 2017 issued by the BERC in Case No 45 of 2016 titled Tariff Order for FY 2017-18 for NBPDCL Order dated 24 March 2017 issued by the BERC in Case No 46 of 2016 titled Tariff Order for FY 2017-18 for SBPDCL Order dated 21 March 2018 issued by the BERC in Case No 40 of 2017 titled Tariff Order for FY 2018-19 for NBPDCL Order dated 21 March 2018 issued by the BERC in Case No 41 of 2017 titled Tariff Order for FY 2018-19 for SBPDCL
0
300
250
200
150
100
50
Tamil Nadu Maharashtra Bihar Punjab
TANGEDCO Tata SBPDCL PSPCLNBPDCLAdani MSEDCL BEST
States and discoms
2015-16 Solar
2016-17 Non-solar
2015-16 Non-solar
2017-18 Solar
2016-17 Solar
2017-18 Non-solar
RP
O c
omp
lianc
e (in
per
cen
t)
20
Karnataka and Tamil Nadu which set ambitious targets have high rates of compliance However Madhya Pradesh and Uttar Pradesh were unable to reach their ambitious targets Andhra Pradesh Gujarat Maharashtra and Rajasthan set modest targets with relatively high compliance levels The other states were unable to accomplish even their low targets The Comptroller and Auditor General of India (CAG) in their analysis of RPO compliance in 24 states between 2010ndash11 and 2013ndash2014 noted that non-compliance was more common among the RE resource-deficit states (CAG 2015 chap 2) This trend in non-compliance by the states has remained largely unchanged since then
In most cases the RPO served as a ceiling on deployment rather than a fillip Most RE-rich states limited discomsrsquo procurement of wind and solar power up to the RPOs targets notified by their respective SERCs The RPO regulation of Gujarat explicitly required the discoms to source RE from within their areas of supply Similarly the Bihar RPO regulation requires discoms to meet their RPOs from sources within their state Discoms can source power from outside the state only in case of shortfall within the state Further there is no indication or incentive in the state RE policies for discoms to exceed the RPO targets Grid integration concerns and the technical limitations to RE powerrsquos sale to other states restrict RE deployment
Participation in the REC market mechanism
The trading mechanism instituted for RECs in the power exchanges has not led to its uptake as there has been a consistently high number of unredeemed RECs (see Figure 5) In addition developers installed only around 2266 MW of RE capacity in 2010ndash2017 under the REC mechanism
Figure 5 RECs consistently remain unsold in the market
Source Authorsrsquo adaptation from REC Registry of India 2020 ldquoMonth-wise RECs Reportrdquo REC Registry of India Accessed 30 November httpswwwrecregistryindianicinindexphppublicsrecs
The REC market has not adequately boosted compliance with the RPO regime Up to 2014 only 477 per cent of the RPO compliance was through the REC route (CAG 2015 chap 2) For resource-deficit states to meet their RPOs through RECs a higher number of resource-deficit states should constitute the buyers ndash which however is not the case (see Table 6) Instead the data shows that resource-rich states are also the highest buyers of RECs
Note The closing balance is the balance in December of each year
0
20000000
15000000
10000000
5000000
2013 2014 2018 20192015 2016 2017
RECs issued RECs redeemed Closing balance
21Renewable purchase obligations ndash a regulatory mechanism for creating demand
How Indiarsquos Solar and Wind Policies Enabled its Energy Transition A Decade in Review
Another noteworthy fact is that among the large buyers ie Maharashtra and Gujarat there is significant private-sector participation In Gujarat private discoms make the most REC purchases The other significant chunk of buyers are the union territories which fall within the Central Governmentrsquos purview and for this reason may be more enthusiastic in their use of the REC mechanism (POSOCO 2018)
It appears that the factors behind participation in the REC market are independent of resource availability and utilisation
33 Causes of under-achievement
The possible causes of under-achievement of the REC mechanism in boosting RPO compliance are discussed below
Declining number of sellers
The SERCs have contended in the past that developers stand to gain supernormal profits by setting up REC projects since they are entitled to normal tariffs plus the REC price Analyses also anticipated that the high floor prices could provide windfall gains to developers (A Singh 2010)
However this did not hold true in practice Though there was an initial spurt in the number of projects that were registered under the mechanism as solar and wind tariffs continued to fall the registration of new projects under the REC mechanism reduced (see Figure 6) There is a clear preference for FiTauctions over the REC route Of the total 85908 MW of RE capacity (including all types of RES) in India as of 31 December 2019 (MNRE 2020a) only 4046 MW was registered under the REC mechanism (REC Registry of India 2020b) (see Table A3 of the Annexure for the number of projects registered in the selected states)
Table 6 Resource-rich states are also the highest buyers of RECs
Source Authorsrsquo adaptation from POSOCO 2018 Renewable Energy Certificate Mechanism in India Key Learnings Data Analysis and Way Forward New Delhi POSOCO NLDC
Share of total RECs purchased by state entities (total RECs redeemed up to
2017ndash18 are 37043171) (in per cent)
Share of total RECs purchased by the state discom (total RECs purchased
by all discoms up to 2017ndash18 are 22499976) (in per cent)
State
Maharashtra
Gujarat
Rajasthan
Bihar
Madhya Pradesh
Punjab
Tamil Nadu
Karnataka
Andhra Pradesh
Uttar Pradesh
307
133
62
46
44
33
19
17
16
04
44
131
0
75
0
39
0
0
0
0
22
Cashflow for REC projects
In the early 2010s there was still a wide gap between the APPC and solar and wind tariffs It would have been risky to register as a REC project since REC prices would be discovered in energy exchanges within the approved bands The floor price is calculated by determining the gap between the minimum requirement and the APPC This minimum requirement is an estimation that considers OampM expenses interest on term loans working capital and repayment terms it is fixed to ensure the economic viability of the project However these numbers are estimated based on prevailing rates as opposed to historic rates Hence the prices have expectedly and consistently fallen (see Table 7) the floor price has reached zero This would impact the cashflows of a project registered when the costs were high
Figure 6 The registration of new projects under the REC mechanism has reduced
Source Authorsrsquo analysis of data published by POSOCO 2018 Renewable Energy Certificate Mechanism in India Key Learnings Data Analysis and Way Forward New Delhi POSOCO NLDC
Table 7 REC floor prices and forbearance prices have consistently fallen
Non-solar (INR MWh)
Floor price Floor priceForbearance price Forbearance price
Solar (INR MWh)
1500
1500
1000
0
3900
3300
3000
1000
12000
9300
1000
0
17000
13400
2400
1000
1 June 2010ndashFY 2012
1 April 2012ndashFY 2017
1 April 2017ndashFY 2020
1 July 2020ndash30 June 2021
Control period
Source Order dated 1 June 2010 issued by the CERC in Petition No 992010 (Suo Motu) titled Determination of Forbearance and Floor Price for the REC Framework Order dated 23 August 2011 issued by the CERC in Petition No 1422011 (Suo Motu) titled Determination of Forbearance and Floor Price for the REC Framework to be Applicable from 1st April 2012 Order dated 30 March 2017 issued by the CERC in Petition No 02SM2017 titled Determination of Forbearance and Floor Price for the REC framework to be Applicable from 1st April 2017 Order dated 17 June 2020 issued by the CERC in Petition No 05SM2020 titled Determination of Forbearance and Floor Price for the REC Framework
Capacity Noof projects
0 0
200 50
400100
600
800150
1000 200
1200 250
2010
-11
Year
Cap
acit
y (M
W)
Num
ber
of r
egis
tere
d p
roje
cts
2011
-12
2012
-13
2013
-14
2017
-18
2016
-17
2015
-16
2014
-15
23Renewable purchase obligations ndash a regulatory mechanism for creating demand
The declining trend of the market price of the REC (see Table 7) shows that buyers are unwilling to pay a higher price and that there is significant uncertainty surrounding the expected returns on investment
How Indiarsquos Solar and Wind Policies Enabled its Energy Transition A Decade in Review
Table 8 Average size of a registered plant as of FY 2018
SourceAuthorsrsquo analysis of data published by POSOCO 2018 Renewable Energy Certificate Mechanism in India Key Learnings Data Analysis and Way Forward New Delhi POSOCO NLDC
Maximum capacity (MW)
Minimum capacity (MW)
Average capacity (MW)
No of projects
Total capacity (in MW)
1900
504
010
023
204
525
360
413
736
2167
Solar PV
Wind
RE source
For projects developed after the fall in costs the situation has reversed The APPC in most cases may be higher or equal to solar and wind tariffs If any new projects are registered under the REC regime today they could sell power to the host discoms at the APPC (or SERC-notified tariffs) and RECs thus sold can help an obligated entity meet its RPO
Cost for host discomsstatesThe responsibility and cost of balancing power from REC projects (the cost of maintaining system balance due to injection of variable power in the grid) fall on the host state This could limit the number of REC projects the state would host for the availability of other obligated entities
For RE-deficit states it would be more commercially viable to procure RECs to meet their RPOs (they will incur conventional power purchase costs plus REC costs) and avoid the balancing costs associated with procuring RE directly However data shows that discoms do not avail of this route to meet their RPOs This may be due to behavioural resistance to shift to REC or due to the indifferent enforcement of RPOs
Cost for other obligated entitiesInitially there was considerable resistance from open access and captive consumers to the RPO obligations imposed upon them The dispute was eventually settled by the Supreme Court in Hindustan Zinc Limited v RERC14 in which the Court held such imposition to be valid Open-access consumers have the freedom to switch to grid purchase in which case they do not need to comply with RPOs separately
Regulatory gapsThe REC market is a lsquocompliance marketrsquo ie the demand for RECs arises from a legal mandate and is not organic demand15 In this context non-compliance can result from the following situations
14 Judgment dated 13 May 2015 issued by the Supreme Court of India in Civil Appeal No 4417 of 2015 httpswwwrecregistryindianicinpdfREC_RegulationSupreme_Court_Judgement_regarding_RPO_Compliancepdf
15 The voluntary component of the REC market is the exception However its share is only 01 percent of the REC market (POSOCO 2018)
24
This would especially affect larger projectsrsquo participation in the REC mechanism Investors prefer projects with PPAs as they offer assured returns over a longer duration This is also indicated by data on the average size of projects registered under the REC mechanism (Table 8)
Regulatory uncertainty
As discussed above RPO regulations allow carrying forward exemptions etc which create demand uncertainty Other regulatory causes also contribute to commercial uncertainty Initially the life of the REC was only one year after which it expired if not redeemed These expired RECs generated no returns on investment for investors This would have dissuaded many investors from setting up REC projects The validity period was subsequently increased to two years by the CERC through an order dated 11 February 2013 however this did not give investors sufficient confidence Commercial uncertainty was further exacerbated by the fact that demand was also not certain due to the low RPO targets set by states before the MoP set a common trajectory for all in 2016
Inadequate enforcement
There was no unified framework for monitoring RPO compliance on an on-going basis until the MNRE announced the constitution of the RPO compliance cell in 2019 The SERCs are relatively lenient with regards to non-compliance For example they permit the carrying forward of shortfall16 and the use of the previous yearrsquos surplus to meet shortfalls in the next year17 There have also been delays in reviews of compliance For example compliance for the period FY 2015ndash16 was finally determined by the Gujarat Electricity Regulatory Commission (GERC) on 26 December 2019 While there are generic penalties prescribed in the EA for contravention of regulations made under the EA it is difficult to imagine that the SERCs would be highly inclined to strictly invoke these provisions against their own state discoms
Inability of the obligated entities to comply with the mandate
While non-enforceability and regulatory gaps lead to non-compliance the practical reason is that RPOs and RECs are an additional cost burden for discoms which are already under severe financial stress Further many inefficient thermal projects continue to operate to their technical minimum to provide the baseload which limits the extent of RE procurement Certain states have indicated that they would be willing to purchase RECs provided they find an offtaker for the thermal capacity that is already contracted by the discoms Many states which were earlier in a power deficit situation but have now become power surplus states find it difficult to meet the current RPO levels and have no incentives to raise their RE ambitions
16 Order dated 4 August 2015 issued by the GERC in suo motu Petition Nos 1307 of 2013 and 1312 of 2013 titled Suo-motu Proceedings in Petition Nos 1307 of 2013 and 1312 of 2013 in Pursuance of Honrsquoble APTEL Direction Contained in Order Dated 16042015 in Appeal Nos 258 of 2013 and 21 of 2014 and the Order Dated 14052015 in IA No 187 of 2015 Accessed 22 October 2020 httpswwwgercinorgwp-contentuploadsdocumenten_1438799511pdf
17 Order dated 4 April 2019 issued by the MERC in Case No 39 of 2019 titled Case for Verification of Compliance of Renewable Purchase Obligation Targets by Adani Electricity Mumbai Limited for FY 2017ndash18
25Renewable purchase obligations ndash a regulatory mechanism for creating demand
RPO compliance for FY 2015ndash16 was finally determined by the Gujarat Electricity Regulatory Commission (GERC) on 26 December 2019
How Indiarsquos Solar and Wind Policies Enabled its Energy Transition A Decade in Review 188
Image iStock
India must implement a comprehensive market reforms roadmap with an intent to remove current inefficiencies while designing a market architecture that minimises total system costs in the future
27
The southern and western states of India have a long history of RE development since RE resources are concentrated in these states (Figure 7) These states attracted investments in
solar and wind energy well before the launch of NAPCC and the NSM This section recounts the journey of RE policies in states that have high solar and wind energy potential The RE-rich states covered are Andhra Pradesh Gujarat Karnataka Madhya Pradesh Maharashtra Rajasthan Tamil Nadu and Telangana
41 Policies pre-2014 In January 2009 Gujarat became the first Indian state to launch a solar power policy (Economic Times 2010) In 2012ndash13 over 40 per cent of Tamil Nadursquos total capacity was based on wind power (TN Energy Department 2012) well before the Government of India adopted the ambitious target of 175 GW RE capacity by 2022 including 60 GW wind
In the first phase of NSM Karnataka Power Corporation Limited (KPCL) was the first state-owned utility to be found eligible for the development of a solar project (Deloitte 2015) Rajasthan attracted a slew of projects primarily because of abundant land and resource availability In 2011 Karnataka was the first southern state to introduce an exclusive policy for the development of solar energy
4 Policy evolution in RE-rich states
Figure 7 RE resource potential is concentrated in western and southern India
Source Authorsrsquo analysis based on data from MNRE 2020 Annual Report 2019-20 New Delhi MNRE
Note Wind potential is at 120 m above ground level
Solar potential (GW)
088 0114231 14256
Wind potential (GW)
How Indiarsquos Solar and Wind Policies Enabled its Energy Transition A Decade in Review 28
Key driversThrough 2010ndash14 the underlying policy motivations across RE-rich states were increasing energy access closing demand-supply gaps increasing industrial productivity utilising local resources for power generation garnering private investments creating employment opportunities through project deployment and local manufacturing responding to local environmental challenges and addressing climate change risks
Policy focusIn most of the initial policies support was provided in the form of FiTsbundled tariffs The power was sold through long-term PPAs to state discoms or to NVVN under NSM bundling schemes However we observed shortfalls in administrative and institutional mechanisms like negligible support for land acquisition and approvals and clearance processes lack of strengthening of evacuation infrastructure to tap the best sites no provisions for building knowledge and capacity in key implementing entities and no requirement for improved data collection and communication to aid industryrsquos decision-making and project planning The challenges of the distribution sector also impacted the progress of the sector during the implementation of the NSM Policies therefore failed to create an enabling environment and were not adequate to attract significant investors in the RE business Accordingly these policies attracted a poor response in many RE-rich states For example
bull In Andhra Pradesh only 13184 MW of solar PV capacity was commissioned till FY 2014 against the 2000 MW of solar capacity envisaged under Andhra Pradeshrsquos Solar Power Policy 2012
bull In Tamil Nadu only 13258 MW of solar PV was installed over 2012ndash15 against a target of 3000 MW in Tamil Nadu Solar Policy 2012
bull Karnatakarsquos Renewable Energy Policy 2009ndash14 enabled the addition of 102108 MW during the five-year policy period against a target of 4200 MW
Performance of policies During 2012ndash2014 several states failed to achieve NSM and their state policy targets within the stated time (Stromsta 2012) (See Table 9) States such as Rajasthan Andhra Pradesh and Tamil Nadu conducted auctions in 2013 but there were delays in signing PPAs Gujarat was the only state that adopted the FiT system under its solar policy that was much more attractive than NSM and other state policies Even then there were time overruns Rajasthan auctioned 75 MW of solar capacity in March 2013 However elections in the state delayed land allocation processes (Sengupta 2013) In December 2012 Tamil Nadu conducted a 1000 MW auction out of which only 698 MW was awarded at INR 648 per unit This may reflect investorsrsquo risk perception of the discom finances and operations in the state (TNN 2013)
Project deployment in most states was below the target capacity under the policies
29Policy evolution in RE-rich states
Table 9 Targets specified under policies and achievements
Source Authorsrsquo analysisRPO achievement figures from MoP 2020 Agenda Background Conference of Power and Renewable Energy Ministers of States and UTs 3 July 2020 New Delhi 3 July
Capacity achievement figures from CSO Energy Statistics 2010 New Delhi MoSPI CSO Energy Statistics 2012 New Delhi MoSPI CSO Energy Statistics 2013 New Delhi MoSPI CSO Energy Statistics 2014 New Delhi MoSPI CSO Energy Statistics 2015 New Delhi MoSPI CSO Energy Statistics 2016 New Delhi MoSPI CSO Energy Statistics 2017 New Delhi MoSPI CSO Energy Statistics 2018 New Delhi MoSPI CSO Energy Statistics 2019 New Delhi MoSPI CSO Energy Statistics 2020 New Delhi MoSPI MNRE 2019 Annual Report New Delhi MNRE
Windsolar policy and year Targets in policy Achievement against targets
Solar Power Policy 2012
Solar Power Policy 2015
Wind Power Policy 2015
Solar Power Policy 2018
Wind Power Policy 2018
SolarndashWind Hybrid Policy 2018
Wind Power Policy 2007
Solar Power Policy 2009
Wind Power Policy 2013
Solar Power Policy 2015
Wind Power Policy 2016
Policy for Implementation of Solar Power Based Projects 2012
Wind Power Project Policy 2012
New and Renewable Sources of Energy Policy 2012
Policy for Promotion of New and Renewable Energy Sources 2011
Policy for Promotion of New and Renewable Energy Sources 2017
Karnataka Renewable Energy Policy 2009
Solar Policy 2011
Karnataka Solar Policy 2014
Karnataka Renewable Energy Policy 2016
New Policy for Power Generation from Non-Conventional Sources 2008
Comprehensive Policy for Grid Connected Power Projects based on New and Renewable (Non-conventional) Energy Sources 2015
Rajasthan Solar Energy Policy 2011
Policy for Promoting Generation of Electricity from Wind 2012
Rajasthan Solar Energy Policy 2014
Rajasthan Solar Energy Policy 2019
Rajasthan Wind and Hybrid
Energy Policy 2019
5000 MW
5000 MW additional capacity in 5 years
No targets but discoms required to purchase power up to their RPOs
No targets but discoms required to purchase power up to their RPOs
10 per cent of the capacity portfolio by 2022
1969 MW grid-connected solar
(total solar target is 2969 MW solar)
200 MW (including solar thermal)
Additional 2000 MW between 2014ndash2021
4400 MW additional wind capacity between 2016ndash2022
2000 MW of wind
7500 MW solar till 2020
5000 MW wind till 2020
Target of 10000ndash12000 MW in next 10ndash12 years
300 MW (2013ndash14) 400 MW (2014ndash15) and 500 MW (2015ndash16)
25000 MW
24 GW utility-scale solar by 2025
2000 MW wind for RPO by 2025
Target is only for discom purchase
355902 MW total solar capacity as of December 2019
276355 MW total solar and 735922 MW total wind capacity as of December 2019
For 2019ndash20 solar RPO compliance is 462 per cent and non-solar RPO compliance is 12257 per cent
251989 MW wind and 223748 MW solar as of December 2019
For 2019ndash20 solar RPO compliance is 847 per cent and non-solar RPO compliance is 71 per cent
9471 MW solar as of December 2019
14935 MW total solar capacity as of December 2019
31 MW total solar capacity in FY 2014
724392 MW solar added between FY 2014 and December 2019
188425 MW wind added between FY 2016 and December 2019
4446 MW total wind capacity in FY 2015
500033 MW wind and
166342 MW solar as of December 2019
484421 MW solar as of December 2019
10025 MW (in 2013ndash14) 5241 MW (in 2014ndash15) and 68495 MW (2015ndash16) of wind capacity
484421 MW total solar and 429972 MW total wind as of December 2019
Andhra Pradesh
Gujarat
Madhya Pradesh
Punjab
Bihar
Karnataka
Maharashtra
Rajasthan
State
How Indiarsquos Solar and Wind Policies Enabled its Energy Transition A Decade in Review
Table 9 contd Windsolar policy and year
Targets in policy
Achievement against the targets
Tamil Nadu Solar Policy 2012
Tamil Nadu Solar Policy 2019
Solar Power Policy 2013
Solar Power Policy 2017
Telangana Solar Power Policy 2015
Telangana Wind Power Policy 2016
3000 MW by 2015
9000 MW by 2023
500 MW by 2017
Target up to the RPO
No target
No target
14258 MW total solar capacity in FY 2015
378836 MW solar as of December 2019
33673 MW solar by 2017
10451 MW solar by December 2019 Solar RPO compliance for 2019ndash20 is 305 per cent
362075 MW solar and 1281 MW wind as of December 2019
Tamil Nadu
Uttar Pradesh
Telangana
State
By 2013 Gujarat had installed over 850 MW of solar PV projects the largest capacity in India at that time However the holding company of discoms in Gujarat ndash Gujarat Urja Vikas Nigam Limited (GUVNL) ndash moved to renegotiate the tariffs specified under the signed PPAs citing excessive profits to developersinvestors (Balan 2014) Although GUVNLrsquos attempt was struck down by the APTEL this was the first time that the risks related to contract sanctity emerged in the Indian market which hurt business and investor confidence
As a result of the withdrawal of AD in 2012 and delays in the re-introduction of the GBI wind power deployment rates also declined in 2013 Without the AD or GBI the tariff of a typical new wind power plant was in the range of INR 4 to 5 per unit (for lsquoZone 2rsquo and above sites) Due to this sudden policy gap the market collapsed from 3 GW in 2011 to below 2 GW in 2012 and 2013 (CAG 2015 chap 4)
Figure 8 depicts the growth of solar and wind capacity across states This clearly shows that total capacity started to increase more rapidly 2014 onwards Wind power on the other hand grew at a constant pace till 2012 after which it plateaued for a couple of years and it again picked up in 2016 and 2017 After 2017 wind deployments slowed down again
30
Note The capacity achievement figures include only grid connected capacity while the targets may include decentralised capacity
Figure 8 Solar and wind capacity increased rapidly 2014 onwards
Sources Authorsrsquo analysis based on CSO Energy Statistics 2010 New Delhi MoSPI CSO Energy Statistics 2012 New Delhi MoSPI CSO Energy Statistics 2013 New Delhi MoSPI CSO Energy Statistics 2014 New Delhi MoSPI CSO Energy Statistics 2015 New Delhi MoSPI CSO Energy Statistics 2016 New Delhi MoSPI CSO Energy Statistics 2017 New Delhi MoSPI CSO Energy Statistics 2018 New Delhi MoSPI CSO Energy Statistics 2019 New Delhi MoSPI CSO Energy Statistics 2020 New Delhi MoSPI MNRE 2020 Annual Report 2019ndash2020 New Delhi MNRE
Policies for project planning and development phasesSeveral initial policies assigned the full responsibility for project planning and construction to developers This included locating and acquiring suitable land conducting resource assessments obtaining all clearances and permissions and bearing the cost of ensuring connectivity to the nearest evacuation point Although some policies did talk about single-window clearance through state nodal agencies the portal or facility was non-functional on the ground Some state policies for example Gujarat Solar Policy 2009 Andhra Pradesh Solar Policy 2012 Andhra Pradesh Wind Policy 2015 and Karnataka RE Policy 2009ndash14 did include enabling provisions for the facilitation of revenuebarren lands
bull Gujarat developed the first solar park in the country in 2012 ndash Charanka Solar Park ndash that houses around 600 MW capacity and provides the required infrastructure for projects
0
0
10000
10000
20000
20000
30000
30000
40000
40000
50000
50000
60000
60000
70000
80000
70000
200
820
08
200
920
09
2010
2010
2011
2011
Solar capacity growth
Wind capacity growth
Cap
acit
y (in
MW
)C
apac
ity
(in M
W)
2012
2012
2013
2013
2014
2014
2020
2020
2019
2019
2018
2018
2017
2017
2016
2016
2015
2015
AP
AP
Telangana
Telangana
Rajasthan
Rajasthan
Maharashtra
Maharashtra
Total
Total
Gujarat
Gujarat
Tamil Nadu
Tamil Nadu
Madhya Pradesh
Madhya Pradesh
Karnataka
Karnataka
31Policy evolution in RE-rich states
How Indiarsquos Solar and Wind Policies Enabled its Energy Transition A Decade in Review
bull The New and Renewable Energy Development Corporation of AP Limited (NREDCAP) in Andhra Pradesh worked with the statersquos revenue department to procure land in advance and sign long-term leases with the developers at predetermined rates
bull In Karnataka 10 per cent of barren government lands reserved for industrial use were allocated to Karnataka Renewable Energy Development Limited (KREDL) for RE development KREDL could sub-lease the identified revenue barren or panchayat lands to project developers for 30 years No procedure was specified for the selection of developers and allotment of land to them Therefore this later led to land banking by wind developers As per the state policy KREDL was supposed to undertake wind resource assessment studies identify potential sites and notify land parcels as reserved for wind project development
Many policies did not specify the application procedures to be followed by the project developers For example Tamil Nadu Energy Departmentrsquos Policy Note 2012ndash13 was totally silent on land allocation criteria ndash for land owned by the statersquos revenue department and for private lands (TN Energy Department 2012) Hence almost the entire wind capacity in the state is installed on private lands The criteria for allotting land developed by state nodal agencies (SNA) or special purpose vehicles (SPVs) was not articulated ndash whether it was first-come-first-served basis or a robust assessment framework for leasing land or a system that prioritised certain project categories The arrangements under which the land could be allotted to developers were mainly land-lease-based However the policies were not clear on how these lease values will be determined Mostly these rates were linked to market prices which could increase significantly owing to land-use patterns and the limited availability of land
The land-related provisions in state wind policies or their silence on those aspects led to developersmanufacturers acquiring huge tracts of private land in wind-rich states which they could retain while carrying out wind resource assessments (Naidu 2013) They started implementing the project once the desired infrastructure came up or once they struck a deal with the offtaker As a result the per MW capital costs were high because of a huge component of land premiums that were built into it However this could be considered a way to address the risks wind developers had to bear at that time
Grid connectivity policiesAccording to the Grid Code for intra-state networks the state transmission utility (STU) or discom is responsible for strengthening grid infrastructure to evacuate RE power and bears the associated costs It is also responsible for extending the grid up to the pooling sub-station However given the financial health of discoms and some STUs these steps were rarely taken States took to ad-hoc arrangements to establish grid connection For example in Gujarat the following solution was adopted the STU provided the necessary equipment for connecting projects to the grid while the developers provided the workforce and the required finances This arrangement was then followed by many other RE-rich states Thereafter the parkzone approach was promoted under several later policies
As per the CERC (Grant of Connectivity Long-term Access and Medium-term Open Access in Inter-state Transmission and Related Matters) Regulations 2009 renewable energy plants of
323232
Many policies did not specify the application procedures to be followed by the project developers
more than 50 MW could connect to the ISTS to take advantage of reduced congestion in the higher-voltage grid but no wind or solar plant availed of that option till as late as 2018 This could have been because project development frameworks and power sale contracts were signed with local entities Or under the point of connection transmission pricing (on a MW basis) the charges on wind projects may have been a burden as their capacity utilisation factors are lower than that of thermal power plants Further at that time and even now PGCIL substations are often far from wind farm sites resulting in high connectivity costs for developers
Policies addressing project operations and power procurementMost policies provided for power procurement by discoms from wind and solar plants through long-term PPAs to meet the RPOs Many states in 2012ndash14 experienced power shortages Therefore RE was also considered an option to meet the demand of large commercial and industrial units in these states For example the Karnataka Electricity Regulatory Commission (KERC) notified a fixed-term concessional open-access regime for solar energy including exemption from wheeling and banking charges and cross-subsidy surcharge for the first 10 years of operation for solar projects that did not fall under the REC mechanism However this was rolled back in 201818 Many other states offered incentives and exemptions such as nil or minimal wheeling and transmission charges for wheeling of power consumed within the state cross-subsidy surcharge exemption for open access obtained for third-party sales within the state exemption from paying electricity duties for sale to discoms andor for captive consumption and third-party sale within the state and different arrangements for banking of RE power
It appeared that most RE-rich states preferred RE plants to sell power to discoms or third parties or serve captive demand within the state itself For example
bull Maharashtrarsquos New Policy for Power Generation from Non-Conventional Sources 2008 required developers availing the benefits of the policy to sell 50 per cent of the electricity generated from the plant to the discom ndash Maharashtra State Electricity Distribution Company Limited (MSEDCL) ndash at the Maharashtra Electricity Regulatory Commission (MERC)-approved rate under the PPA and the remaining 50 per cent only within the state
bull Karnatakarsquos Renewable Energy Policy 2009ndash14 required RE plants to sell electricity to discoms under PPAs approved by KERC or use it for captive purposes There was no mention of third parties within the state who could buy RE power through open access
bull Andhra Pradeshrsquos Solar Policy 2012 captures only intra-state sale of power to discoms or third party
CurtailmentFollowing the Grid Code the must-run status of RE plants was adopted by states in their respective grid codes However inadequate grid availability has been a challenge in RE-rich states more so in the period 2009ndash2014 In Tamil Nadu wind generation increases significantly during the monsoons (AprilndashSeptember) when power demand is also relatively low Before 2014 the intra-state grid was unable to absorb the excess generation due to low demand and could not transmit it to other regions because of limited inter-connections with
18 Order dated 14 May 2018 issued by the KERC in matter no S032017 titled In the Matter of Revision of Wheeling and Banking Charges for Renewable Power Projects httpskredlinfoingeneralwheeling20and20banking20charges2014052017pdf
33Policy evolution in RE-rich states 33Policy evolution in RE-rich states 33Policy evolution in RE-rich states
During 2012ndash14 many states experienced power shortages Therefore RE was also considered an option to meet the demand of large commercial and industrial units
How Indiarsquos Solar and Wind Policies Enabled its Energy Transition A Decade in Review
Table 10 2010ndash2014 Developments that held back RE deployment and associated risks that remained
Note Authorsrsquo analysis
Corresponding risks
Inadequate support for land procurement
Lack of evacuation infrastructure and delays in grid connectivity
Mismatch between national targets and state RPO trajectories low RPO compliance
Poor credit profile of state discoms
Uncertainty in incentives ndash lapsing and withdrawal of GBI and AD
Curtailment of power
No provisions for RE sale outside the state
Delay in commissioning leading to cost overrun
National targets at risk restricted marketsdemand
Offtake risk payment risk
Cashflow risks
Offtake risk
Restricted marketsdemand
Inadequate support for land procurement
Inhibitors
42 Policies post- 2014 From 2014 onwards the Indian market witnessed a steep fall in solar tariffs owing to a variety of reasons ranging from domestic factors to global developments The NSM was successful in signalling Indiarsquos commitment towards solar development Although the rate of installation was slow during 2012ndash2014 and risks and inhibitors continued (Table 10) investor outlook remained positive
Key driversAs power deficits in states reduced demand grew slower than expected and solar tariffs declined drastically In response most RE-rich states developed policies with the intent of ensuring state-level energy security meeting agricultural and domestic loads through solar and aiming to become investment-friendly destinations In addition creating employment opportunities through project deployment as well as local manufacturing and responding to local environmental challenges and addressing climate change risks remained some of the commonly stated drivers across these states
Policy focusMost policies starting 2014ndash15 included provisions to facilitate the development of large-scale solar parks in a systematic and structured manner with the help of SECI Instead of individual states conducting their own auctions to procure solar power and meet their solar RPOs states preferred to buy power through SECI while continuing to procure wind power directly at preferential tariffs till 2017 Many policies specified clear targets to be achieved over
the national grid This led to the severe curtailment of wind power In 2014 the southern grid was inter-connected with the national grid providing some relief to the southern states but many industry players (Saumy 2019) and the MNRE (Chandrasekaran 2017) have continued to ask states to prevent curtailment of RE power Curtailment for wind power plants averaged around 30ndash35 per cent of generation in the peak season during 2012ndash15 (Jhawar 2020)
34
a five-year period Most policies at least on paper aimed to mitigate project development counterparty and operations-related risks in the sector to lower the cost of RE generation in their respective states Progressive policies such as the Andhra Pradeshrsquos Solar Power Policy 2015 and Wind Power Policy 2018 provided deemed industry status to RE projects and explicitly accorded them must-run status Unlike in the pre-2014 era these policies acknowledged the need to facilitate the sale of RE power outside the state For example
bull The Rajasthan Solar Energy Policy 2014 aimed to meet the energy requirements of Rajasthan as well as India
bull Maharashtrarsquos Comprehensive Policy for Grid-connected Power Projects Based on New and Renewable (Non-conventional) Energy Sources 2015 aimed to facilitate the sale of renewable power outside the state once the statersquos RPOs were met The policy even included a provision for deemed open access for the sale of energy within or outside the state if permission is not granted within the period specified in the MERC regulations It also gave RE projects the option to terminate their existing PPA with the state discom and opt for open access
bull APrsquos Solar Power Policy 2018 provided transmission and distribution charge exemptions for inter-state wheeling of power (which was later rolled back through an amendment)
bull APrsquos Renewable Energy Export Policy 2020 aimed to facilitate the leasing of land for setting up RE power plants and manufacturing facilities and to export power to other states
The reason for this shift in focus is that RE-rich states would want to utilise their abundant land and resource potential to attract huge private-sector investments generate revenues for the exchequer and create local jobs but would not be able to absorb all the generation within the state to meet their own demand
Global market developmentsApart from reduced risk perceptions due to stronger institutional mechanisms developersrsquo expectation of fall in solar module prices also drove them to place extremely aggressive bids in the auctions (Deign 2017) Solar module prices witnessed an overall drop in prices (see Figure 9) However even small fluctuations in module prices can affect project economics adversely
35Policy evolution in RE-rich states
Unlike in the pre-2014 era the policies now acknowledged the need to facilitate the sale of RE power outside the state
Figure 9 Average module (multicrystalline) prices have declined (2011ndash2019)
Source IEA 2020 ldquoEvolution of Solar PV Module Cost by Data Source 1970-2020rdquo 30 June Accessed 28 November 2020 httpswwwieaorgdata-and-statisticschartsevolution-of-solar-pv-module-cost-by-data-source-1970-2020
0
1412
0908 08
0706
05
0302
12
1
08
06
04
02
201320122011 2014 2018 20192015 2016 2017
USD
per
Wat
t
How Indiarsquos Solar and Wind Policies Enabled its Energy Transition A Decade in Review 36
There were short periods when module prices increased during 2017ndash2020 due to various reasons such as China slashing its subsidies reduced polysilicon supply in China module suppliers demanding price renegotiation and supply chain disruptions due to the COVID-19 pandemic (Bridge to India 2017) Excessive reliance on imported modules and largely from a single country makes the projects vulnerable to geopolitics and domestic policies intended to promote domestic manufacturing (Chawla 2020)
Wind tariffs declined following the initial rounds of bidding however the decline was not at the same pace as that of solar Even as discovered tariffs kept declining and were comparable with or even lower than tariffs of thermal projects RPOs remained the key driver and the primary Central Government lever for states to increase their RE uptake This is primarily because of the additional cost implications for discoms as they balance the increased variability in the system while being tied-up in long-term thermal PPAs
Performance of policiesAlthough all the policies seemed to be favourable and directed towards providing an enabling environment for RE development on-ground implementation and compliance remained weak which was the main reason for the prevailing risks in the sector Almost all RE-rich states like Tamil Nadu Andhra Pradesh Gujarat Karnataka Rajasthan and Maharashtra have made policy and regulatory decisions on electricity matters that have often been inconsistent with national policies and priorities They have made retrospective changes to policies threatened to renege on existing PPAs delayed payments to RE generators and curtailed RE power
One main reason for these inconsistent and ad-hoc actions was the drastic and rapid decline in solar tariffs starting 2014 (see Figure 10) The wind sector too transitioned to competitive bidding in late 2016 because of the success of reverse auctions in reducing solar tariffs While competition and reduced tariffs were desirable outcomes for Central policies it led to states losing confidence in RE PPAs signed at higher tariffs as compared to the lower tariffs discovered in subsequent auctions This not only led to the re-negotiation of PPAs but also delayed the procurement of new RE capacity in anticipation of further declines in tariffs
On the other hand the policies helped advance the setting up of solar parks which was a comforting factor for developers and investors and one of the contributing factors for
Figure 10 Solar tariffs discovered in Indian auctions
Source India RE Navigator 2020 ldquoAuction Resultsrdquo Accessed November 28 2020 httpsindia-re-navigatorcomwind
0
1210
864
2
2010
-13
2014
2018
2019
2020
2015
2016
2017
Central State
INR
kW
h
37Policy evolution in RE-rich states
bringing down tariffs However there were execution bottlenecks on the ground Project development was delayed because tenders were concluded while the park infrastructure was still under construction
Amongst the RE-rich states Karnataka has been a consistent performer for solar Under the Karnataka Solar Policy 2014ndash2021 it has recorded the largest solar capacity deployments in the country in 2017 2018 and 2019 In 2017 Karnataka installed more than 2 GW of large-scale solar and contributed to almost 25 per cent of the total capacity addition in India in that year By March 2019 with over 53 GW Karnataka had the highest installed capacity of utility-scale solar with a pipeline of around 28 GW Other state policies that have attracted investments include those of Rajasthan Andhra Pradesh Tamil Nadu and Maharashtra In 2018 these five states had more than 80 per cent of the countryrsquos utility-scale solar capacity
Meanwhile after SECI successfully concluded two auctions for wind energy in 2017 resulting in reduced tariffs many wind-rich states shifted to competitive bidding with SERC-determined generic tariffs as the tariff ceiling During 2017 states such as Gujarat and Tamil Nadu auctioned additional wind capacity to meet their non-solar RPO targets (Saurabh 2017) Seven wind-rich states installed 55 GW of wind capacity in 2016ndash17 (Raikar 2018) However in 2017ndash18 and 2018ndash19 the total wind installed capacity declined substantially to just around 18 GW and 14 GW respectively (IWTMF 2019) Low tariffs were quoted in initial bids but the subsequent tenders were undersubscribed most likely because the tariff ceilings were financially not feasible The main reasons for states not being able to achieve their wind policy targets were the conditions and risks that reverse auctions failed to address (i) wind resource is more concentrated than solar and high wind density sites are getting exhausted (ii) ISTS is not plannedavailable for moderatehigh wind sites (iii) bearing the costs associated with connecting to the nearest ISTS sub-station or connecting to STU networks instead adds to the risks and the resultant tariffs face tough competition from solarAmongst wind-rich states Gujarat led wind deployment in the country during 2016ndash2020 followed by Andhra Pradesh Karnataka and Tamil Nadu Figure 11 shows the annual wind capacity addition in these states
Karnataka has recorded the largest solar capacity deployments in the country in 2017 2018 and 2019
Figure 11 Gujarat saw the largest wind capacity additions among the wind-rich states (2016ndash2020)
Source Authorsrsquo analysis based on CSO Energy Statistics 2018 New Delhi MoSPI CSO Energy Statistics 2019 New Delhi MoSPI CSO Energy Statistics 2020 New Delhi MoSPI MNRE 2020 Annual Report 2019ndash2020 New Delhi MNRE
0
2000
1000
500
2500
3000
3500
4000
4500
5000
FY 2017
248 336772
316
1286
59
46087
123502
273
857
348
1303
882
2187
FY 2018 FY 2019 FY 2020
Cap
acit
y (in
MW
)
Andhra PradeshGujaratTamil Nadu Karnataka
How Indiarsquos Solar and Wind Policies Enabled its Energy Transition A Decade in Review
In 2019 political risks in the RE sector were exemplified when the new government in Andhra Pradesh took a strong stand on renegotiating wind and solar PPAs signed under Andhra Pradeshrsquos Wind Power Policy 2018 and Solar Power Policy 2018 (see Table 11)
Table 11 Timeline of the key events in the AP story
Source Authorsrsquo analysis
Date in 2019 Event
1 July
24 September
29 November
25 July
October
30 November onwards
1 December
12 July
AP government sets up a committee to renegotiate PPAsPSAs signed between 2012 and 2016
The AP High Court quashes the July 1 order and July 12 letters in writ petitions filed by the developers It directs the developers and discoms to approach the Andhra Pradesh Electricity Regulatory Commission (APERC) with their respective claims and to resolve all disputes in 6 months In the interim discoms will clear their dues and pay all power plants at the rate of INR 243 and INR 244 for wind and solar respectively
A compromise is reached between the Central and AP governments There is to be no tariff revision but concessional loans to be extended to discoms from PFC and IREDA to clear the dues
The AP High Court stays the July 1 order based on a petition by developers
Petition filed by AP discoms before APERC to review the tariffs
AP discoms clear pending dues at the rate of INR 243 and INR 244 for wind and solar respectively
The AP High Court stays the public hearing of the APERC on the tariff review petition filed by developers
Letter from AP Southern Power Distribution Company Limited (APSPDCL) one of the two state discoms to 139 wind and solar power plants to revise tariffs to INR 243 and INR 244 respectively
2016 onward SECIrsquos tendering activity has shifted towards ISTS-connected solar projects Between 2016 to 2019 it issued tenders worth 13000 MW of solar PV capacity (ISTS I to ISTS IX) and 12600 MW of wind capacity (Tranche I to Tranche IX) Figure 12 shows the deployment progress of solar projects awarded under the ISTS I to ISTS IX tenders by the SECI (as of August 2020)
Figure 12 ISTS-connected solar PV projects have poor completion record
Source Authorsrsquo analysis based on CEA 2020 Report of Under Construction Renewable Energy Projects New Delhi Renewable Energy Project Monitoring Division (CEA)
Solar PV capacity tendered
(ISTS-I to ISTS-IX)
13000
9530
4650
1800 17501080
250
Capacity awarded
PPAPSA or both not yet
executed
PPA and PSA signed
Financial closure
achieved
Plant erection in progress
Status not available
Cap
acit
y (in
MW
)
38
As is evident almost 50 per cent of the capacity that has been awarded is still awaiting closure of power purchase andor power sale agreements This implies that state discoms are not coming forward to offtake power from projects already awarded leaving developers and investors in a lurch For the capacity for which PPAs and PSAs have already been signed there have been significant delays because the required transmissionevacuation infrastructure is not ready and long-term access (LTA) to transmission has not been operationalised The COVID-19 pandemic has further impacted the construction of transmission lines increased delays and depressed electricity demand across the country Because of the lockdown enforced to curb the spread of the pandemic the MNRE had granted blanket extension of the scheduled commissioning timelines
For wind projects too the rate of commissioning has been rather slow (Figure 13) Most of the awarded projects will be coming up in Gujarat (Kutch) There were roadblocks with respect to the land allocation policy in Gujarat because of which no progress could be made Few projects are likely to come up in other host states such as Tamil Nadu Karnataka Maharashtra Madhya Pradesh and Kerala While the recent tenders (tranches VI to VIII) were undersubscribed several projects awarded earlier are facing delays due to non-readiness of transmission infrastructure and some projects have terminated their PPAs citing non-viability of projects at the discovered rates due to time and cost overruns Notably wind-rich sites are intrinsically more concentrated than solar logistically as well as resource-wise Therefore unless the sites are identified and prepared and transmission networks are appropriately planned strengthened in advance deployment would be slow One more option being tested is the windndashsolar hybrid or the blending approach and a bidding process akin to case I bidding in the conventional power sector to ease out on transmission variability and land-related risks
39Policy evolution in RE-rich states
Figure 13 The rate of commissioning of wind projects has been slow (August 2020)
Source Authorsrsquo analysis based on CEA 2020 Report of Under Construction Renewable Energy Projects New Delhi Renewable Energy Project Monitoring Division (CEA) CEA 2019 Summary of Solar and Wind Power projects (Commissioned and Under Construction) of SECI New Delhi Renewable Energy Project Monitoring Division (CEA)
Tendered (ISTS Tranche I to IX)
13400
9361
2085
Awarded Commissioned
Win
d c
apac
ity
(in M
W)
Policies facilitating land procurementThe MNRErsquos solar park scheme encourage states to develop solar parks to solve land procurement and connectivity problems All state policies encourage deployment in parks Most policies provide for designating solar power park developers (SPPDs) The SPPDs may be a state government-designated agency or a joint venture company (JVC) between a state-
How Indiarsquos Solar and Wind Policies Enabled its Energy Transition A Decade in Review 40
designated agency and SECI or a JVC between a state-designated agency and private agency or a private agency
The states under their respective solarRE policies have provided the necessary support and arrangements for developing the parks and projects have been successfully commissioned in the parks that are operational However there have been some challenges in developing these parks including problems in land acquisition by the SPPDs and mismatch in timelines for development activities and setting up of solar projects For example developers are facing several challenges with permissions clearances and approvals at the Kadapa Solar Park in Andhra Pradesh where the letters of award were issued in August 2018 but two years hence developers have yet not been able to begin any work there
For non-solar park projects land procurement is typically the generatorsrsquo responsibility particularly for projects set on private lands The Karnataka Renewable Energy Policy 2016ndash22 was the only policy that assigned the responsibility of identifying suitable land banks to the state nodal agency Andhra Pradeshrsquos Wind Power Policy 2018 and Solar Power Policy 2018 had entrusted NREDCAP with the responsibility of securing government lands However this provision was rolled back in 2019
The wind sector was again at a disadvantage here Most policies except recent solarndashwind hybrid policies did not address land requirements for wind power projects which are typically more concentrated in certain pockets In many cases windy sites were located far from plannedexisting intra- and inter-state networks Further all state policies require wind developers to either procure government land on a lease-hold basis on their own or procure private lands Even in SECIrsquos auction for ISTS-connected wind developers faced difficulties in securing land leases from the state governments and revenue departments For example while Gujarat had announced a wind power policy in 2016 to attract investments it took a policy decision in 2018 to not allocate any land to wind projects auctioned by SECI for exporting power to other states (Tenddulkar 2019) Later in January 2019 Gujarat announced a new land policy for wind solar parks as well as windndashsolar hybrid parks to demarcate land areas where these projects would be allowed
Policies for grid connectivity and project operationsFrom 2014 onward MNRE and SECI started coordinating with other line departments and agencies at the Central level to plan construct and strengthen intra- and inter-state networks To ensure the evacuation of power from 20 GW of wind and solar capacity the Centre sanctioned a project to augment the Intra-State Transmission System (InSTS) in 2015ndash16 STUs in eight RE-rich states ndash Tamil Nadu Rajasthan Karnataka Andhra Pradesh Maharashtra Gujarat Himachal Pradesh and Madhya Pradesh ndash are implementing this project
In 2016 the Ministry of Power waived off inter-state transmission charges and losses for wind and solar projects which is now applicable for projects being commissioned till June 2023 In state-level solarwindRE policies there appears to be some degree of disparity and uncertainty on grid connectivity evacuation forecasting scheduling and sale of power
In state-level policies there appears to be some degree of disparity and uncertainty on grid connectivity evacuation forecasting scheduling and sale of power
41Policy evolution in RE-rich states
bull As of July 2019 15 states had notified their regulations for forecasting scheduling and settlement of deviations for RE broadly in line with the CERC regulations (Srivastava Singhvi and Rustagi 2019) Most of these states permit an error band of (+-) 15 per cent as per CERC regulations In a few states such as in Tamil Nadu the error band is limited to a narrower range of (+-) 10 per cent Even within the same regional load dispatch region the error bands notified by states differ For example Maharashtra permits (+-) 15 per cent deviation while Gujarat allows only (+-) 12 per cent deviation for wind developers
bull Andhra Pradeshrsquos Wind Power Policy 2018 and Solar Power Policy 2018 stated that no transmission and distribution charges will be levied for inter-state wheeling of power Later the policy was amended in November 2019 and the exemptions were rolled back and charges as determined by the APERC were made applicable
bull To discourage open-access transactions of wind power Tamil Nadu increased the cross-subsidy surcharge for open-access consumers from 50 per cent of that for conventional power in 2016 to 60 per cent in 2018 Over the same period it also increased open-access charges from 40 per cent to 50 per cent of that for conventional power Such steps restrict significant new demand for RE amongst large commercial and industrial players by adding to the landed cost of RE power even as RE tariffs become cheaper than discoms tariffs
bull Banking charges for wind and solar vary by state The period of banking is also different for various states (Table 12)
bull Although RE is accorded a must-run status by several policies and grid codes curtailment continues for technical as well as commercial reasons Older projects that have higher tariffs face higher curtailment than newer projects In Tamil Nadu curtailment has reduced from a peak of 30ndash35 per cent to 20ndash25 per cent currently (Jhawar 2020) However it appears that commercial concerns are causing the Andhra Pradesh discoms to curtail RE power despite repeated judicial directions against it (Parikh 2020)
How Indiarsquos Solar and Wind Policies Enabled its Energy Transition A Decade in Review 42
Table 12 Banking charges and conditions across RE-rich states
Source Authorsrsquo adaptation based on MERC (Distribution Open Access) (First Amendment) Regulations 2019 Order No 82020 dated 7 October 2020 issued by the TNERC titled Order on Procurement of Wind Power and Related Issues Order No 22020 dated 30 April 2020 issued by the GERC titled Tariff Framework for Procurement of Power by Distribution Licensees and Others from Wind Turbine Generators and Other Commercial Issues for the State of Gujarat RERC (Terms and Conditions for Tariff Determination from Renewable Energy Sources) Regulations 2020 Order dated 14 May 2018 in matter No S032017 issued by the KERC titled Revision of Wheeling and Banking Charges for Renewable Power Projects
Banking charges Other conditionsBanking period
No banking charges for wind projects
10 per cent of RE banked in kind
14 per cent of input energy
No banking charges
2 per cent of RE banked in kind
2 per cent of the injected energy in kind
No banking allowed
One month
April to March barring peak hours as determined by the discoms
One FY (April to March)
One month
One month
January to June ndash for wind projects
April to September and October to March ndash for solar projects
Monthly settlement for non-REC wind projects
Banking facility not available for third-party sale and REC-based captive power plants (CPP)
Energy banked during the peak time of day (TOD) hours may be drawn during off-peak TOD slots but not vice-versa
The unutilised banked energy at the end of the month up to 10 per cent of the total energy generated in that month to be purchased by discoms at the applicable generic tariffs for the year
Unutilised banked energy at the end of six months to be purchased by discoms at 85 per cent of the applicable generic tariff
The energy banked by non-REC projects during the peak ToD hours can only be drawn during the peak ToD hours
Banking allowed for CPP but not for third-party sales under open access within the state
The unutilised banked energy will lapse at the end of the year
The unutilised banked energy as of March 31 to be encashed at 75 per cent of the applicable wind energy tariff for existing wind energy captive users
Excess generation or unutilised banked energy at the end of the month to be purchased at 75 per cent of the wind energy tariff for captive users For captive REC generators the unutilised banked energy can be encashed at 75 per cent of the pooled cost of power
Gujarat
Rajasthan
Tamil Nadu For wind projects commissioned till 31 March 2018
For wind projects commissioned on or after 1st April 2018
Maharashtra
Karnataka
Andhra Pradesh
State
43
5 Policy evolution in RE-deficit states
Image iStock
As discussed above southern and western states in India have abundant RE and land resources to develop large-scale wind and solar power projects However the northern
states in the Indo-Gangetic plains are densely populated agricultural states The mountain regions in the north have excellent solar resources and are sparsely populated but have forest areas and difficult terrains and low transmission capacities The coal economy is dominant in the eastern states
How Indiarsquos Solar and Wind Policies Enabled its Energy Transition A Decade in Review 44
The policy response to developing large-scale solar and wind has been weak in the non-RE-rich states as compared to RE-rich states Our review accounts for three key states ndash Uttar Pradesh Bihar and Punjab
Key driversThe key drivers for promoting RE were poor power supply in the rural as well as urban area growing energy needs in urban industrial and commercial sectors and the need to comply with RPOs Policies intended to attract private-sector investments improve rural livelihoods and create employment opportunities through grid-connected decentralised RE projects and local manufacturing facilities
Policy focusMost of the initial policies were notified starting late 2012 and largely focused on decentralised RE such as rooftop solar solar irrigation pumps off-grid renewables and other RE resources such as bioenergy For example
bull Punjab New and Renewable Sources Policy 2012 focused on rooftop and decentralisedoff-grid generation waste to energy biomass-based cogeneration and new technologies
bull Uttar Pradeshrsquos solar policies of 2013 and 2017 focused on decentralised solar as well as large-scale grid-connected solar because of wastelands being available in the Bundelkhand region
bull Bihar Policy for Promotion of New and Renewable Energy Sources 2011 focused on biomass and biogas cogeneration projects minimicrosmall hydro wind and solar and municipal solid waste-based projects but with no specific targets
These statesrsquo policies promoted the local deployment of projects There was little emphasis on discoms buying wind and solar power from other states or buy RECs to meet solar and non-solar RPOs which were set relatively low as compared to RE-rich states This may be because the states were keen to attract investments and create jobs in their own states and bolster their own generation capacities rather than depending on other states
Even the recent policies of the RE-deficit states do not demonstrate any intent to purchase powerRECs to meet RPOs particularly the non-solar component
Performance of policiesAmong the RE-deficit states Uttar Pradesh and Punjab are leading in terms of solar deployment They are among the top 10 solar states in the country However their RPO compliance has remained weak In the year 2019ndash20 the compliance level for Uttar Pradesh was only 353 per cent whereas for Punjab it was 438 per cent (MoP 2020a) Uttar Pradesh discoms also rank among the least performing discoms of the country (ICRA Limited and CARE Ratings 2019)
Uttar Pradesh notified two solar policies ndash once in 2013 which was later superseded by a policy in 2017 The 2013 Solar Policy stated a target of 500 MW of solar capacity to be deployed
Policies in RE-deficit states promoted local project deployment with little emphasis on discoms buying wind and solar power from other states or RECs to meet RPOs
45Policy evolution in RE-deficit states
by 2017 This policy was the first of its kind because it had an exclusive budgetary allocation for discoms to procure solar power and for state nodal agencies to effectively administer and implement the policy The policy achieved 420 MW against the target of 500 MW by 2017 but presented some uncertainties such as
bull The duration of power purchase agreements was made 10 years as opposed to the usual practice of 25 years the possibility of extending PPAs beyond the 10-year duration at the prevailing APPC price did exist but this represented an uncertainty for developers
bull Strict enabling provisions for establishing solar parks were missing As a result developers reported delays due to the lack of grid infrastructure and difficulties in allotting ready land inside solar parks
The Uttar Pradesh New and Renewable Energy Development Agency (UPNEDA) initiated a competitive bidding round in March 2013 which led to the discovery of tariffs in the range of INR 801 to INR 933 per unit among the highest for any state during that time These high tariffs may be attributed to real and perceived risks specific to the policy as well as the legacy power sector issues in the state Later there were many instances when UPrsquos distribution companies renegotiated tariffs under the PPAs signed during 2015ndash16 This affected completed and under-construction grid-connected solar projects as well as the investor confidence in the sector
The UP Solar Power Policy 2017 set high targets ndash 10700 MW of installed solar capacity by 2022 out of which 6400 MW should be utility-scale projects Some improvements that were made included PPAs for 25 years facilitative provisions for land procurement additional incentives for projects in the Bundelkhand region and modalities for establishing solar parks Currently 973 MW of large-scale solar projects are in operation and about 17 GW capacity is under development (Ranjan 2020)
Recent tenders by UPNEDA have been cancelled or undersubscribed In July 2018 UPNEDA cancelled a 1 GW tender floated in January citing high tariffs Two tenders of 500 MW each in January and October 2019 were undersubscribed The reasons reported for under-subscription included inadequate gridevacuation infrastructure particularly in the Bundelkhand region and the changes made in the PPA
Punjab under its New and Renewable Sources of Energy (NRSE) Policy 2012 aimed to install 1000 MW solar by 2017 Till FY 2020 it had installed 947 MW (MNRE 2020) Although the policy emphasised installations within the state the potential for large-scale solar power in the state is limited Therefore Punjab has been procuring solar and wind power from ISTS-connected projects to meet its solar and non-solar RPO targets Punjab State Power Corporation Limited (PSPCL) signed long-term agreements with SECI and NTPC and has entered into short-term agreements with wind and solar generators for this purpose
The Bihar Policy for Promotion of New and Renewable Energy Sources 2011 was notified in June 2011 It did not state any specific targets for the segments covered The new policy in 2017 set a target of 2969 MW from solar by 2022 out of which 1000 MW was dedicated to grid-connected rooftop solar Even though this policy was notified in June 2017 it did not explicitly put out the intent to purchase solar and wind power through inter-state transactions or
45Policy evolution in RE-deficit states 45Policy evolution in RE-deficit states
In Uttar Pradesh competitive bidding in early years discovered tariffs that were higher compared to other states signalling the high risk perception amongst the industry
How Indiarsquos Solar and Wind Policies Enabled its Energy Transition A Decade in Review 46
Central procurement through SECI By December 2019 Bihar had installed 341 MW of RE capacity (CEA 2020a) out of which grid-connected solar was 149 MW and the rest was non-solar (small hydro biomass cogeneration etc) In FY 2018ndash19 Bihar discoms procured 10 MW solar and 300 MW wind power through SECIrsquos ISTS-connected projects19 In June 2019 the Bihar Renewable Energy Development Authority (BREDA) issued its first tender for setting up 250 MW of ground-mounted solar projects in the state which was re-issued in December 2019 because the state regulatory commission did not approve the high ceiling tariffs With these efforts however Biharrsquos RPO compliance at the end of March 2020 was 15 per cent with respect to Central trajectories (MoP 2020a)
Grid integrationThe initial policies by these states had some typical provisions regarding grid connectivity and transmission of power Like many other state policies on connectivity Uttar Pradeshrsquos solar power policies as well as Punjabrsquos RE Policy 2012 required developers to lay their own transmission lines to the nearest sub-station at their own cost However the UP government committed to bear all transmission-related expenditure for all solar projects in the Bundelkhand region Under Biharrsquos RE Policy 2017 the state government committed to bear connectivity-related expenditure only in cases where the RE plant is located within 10 km from the nearest sub-station
Transmission chargesPunjabrsquos 2012 policy accorded must-run status to grid-connected renewables and exempted transmission and wheeling charges for intra-state open-access sales for 10 years for RE projects commissioned up to 31 March 2017 No explicit exemptions were provided for inter-state open access unlike Uttar Pradesh which interestingly under its Solar Power Policy 2017 allowed the solar developer to sell power across the country with a 100 per cent waiver of transmission charges ndash a one of its kind provision among policies rolled out by RE-deficit states Biharrsquos RE Policy 2017 provided exemptions for wheeling of power from RE projects put up for captive use or intra-state third-party sales
Incentives for project development and operationsIt is interesting to note that some provisions in these policies were outstanding For example
Offtake and payments
bull Punjab required procurers to clear all payment dues within 60 days with rebate entitlements as incentives for early clearances
bull UP allocated budgetary support for the first 200 MW of solar projects to be payable to discoms to equalise solar and conventional power This support was equivalent to the difference between tariffs discovered for conventional power through case I bidding and the solar power tariffs discovered through reverse bidding
19 Order dated 20 March 2020 in Case No 30 2019 and 312019 issued by the BERC titled Tariff Order Truing up for FY 2018-19 Annual Performance Review for FY 2019-20 Annual Revenue Requirement (ARR) and determination of Retail Tariff for FY 2020-21 for North Bihar Distribution Company Limited (NBPDCL) and South Bihar Distribution Company Limited (SBPDCL) httpsberccoinorderstariffdistributionsbpdcl2216-tariff-order-of-nbpdcl-for-fy-2019-22
Uttar Pradesh under its Solar Power Policy 2017 allowed solar developers to sell power across the country with a 100 waiver of transmission charges
Ease of doing business investor attractiveness facilitation
bull Punjab assigned the Bureau of Investment Promotion the task of granting regulatory clearances and fiscal incentive approvals
bull Punjab extended benefits to RE projects under its Fiscal Incentives for Industrial Promotion Policy 2013 It also provided 50 to 100 per cent exemption on stamp duty property tax and electricity duty
bull Incentives under the Uttar Pradesh State Industrial Policy 2012 applied to power plants based on solar energy
bull All RE plants set up for commercial sale of power were eligible for an additional 30 per cent tax benefit on the approved project cost
bull Bihar established a Renewable Energy Development Fund under the new policy notified in 2017 This fund was supposed to be capitalised through
raquo a one-time facilitation fee of INR 100000 per MW payable during the application process for a project of more than one MW capacity
raquo a RE development cess of 10 paise per unit of power sold in the state by discoms (excluding below poverty line and agricultural consumers) subject to Bihar Electricity Regulatory Commissionrsquos (BERC) approval and
raquo a service charge of 7 per cent payable to BREDA for the execution of RE projects However this seems to be a proposal in the policy and is not executed in practice yet
47Policy evolution in RE-deficit states
How Indiarsquos Solar and Wind Policies Enabled its Energy Transition A Decade in Review 188
Image iStock
Discoms continue to be tied-up with long-term PPAs and most investors continue to base their business projections on Central and state bidding pipelines
49
With the evolving policy landscape at the Central and state level we have seen Indiarsquos renewable energy sector grow tremendously In 2010 the total installed RE capacity
was just about 18 GW which has grown almost five-fold over the decade
As our analysis suggests there were high and low points in this journey Every time a roadblock emerged India has been successful in testing and identifying alternate approaches and solutions Some of these include bundling solar power with conventional power to counter high tariffs in 2010 introducing solar parks when deployment became slow and tough increasing RPO targets to create the necessary demand creating and backing SECI to address counterparty risks accelerating tendering activity to signal a commitment to creating strong pipelines encouraging solarndashwind hybrid parks to improve utilisation factors introducing protocols and mechanisms such as market-based economic dispatch a real-time market and a green term ahead market to optimise grid integration costs With economics favouring RE its share in Indiarsquos electricity mix is only expected to grow
De-risking investments in project development has unquestionably been the focus of the policies thus far However policies have mostly not pre-empted any of the risks but developed through an iterative process that has mostly responded to immediate investor concerns Hence non-compliance with RPO targets by the states was met with centralising target setting and making them even higher the Centre responded to PPA renegotiation attempts by states with intra-se negotiations with the states and financial relief to the concerned states for addressing payment delays by discoms the Centre imposed additional financial liability on the discoms by way of the LC mechanism
Imminent market disruptions Further while CERC and the power exchanges have taken forward looking steps with introducing new market platforms there has yet been no attempt to create avenues for participation of greenbalancing power providers and buyers in these markets The discoms continue to be tied-up with long-term PPAs and most investors continue to base their business projections on Central and state bidding pipelines Other developments that threaten the investorsrsquo current business model include
bull Expectations of returns have increased since early 2019 that indicates that risk perceptions of investors have also increased (investors expect higher returns for riskier investments)
6 Looking back to look ahead
Recent developments threaten investorsrsquo current business models
How Indiarsquos Solar and Wind Policies Enabled its Energy Transition A Decade in Review
There are fewer developers who are cornering a greater share of the projects (Dutt Arboleya and Gonzalez 2020) This could mean that entry barriers to the sector are increasing and the incumbents will have a high stake in maintaining status quo Further the exit of many smaller players by selling their assets indicates that navigating Indiarsquos policy and governance environment remains a challenge (Chandra 2020)
bull Commercial and industrial consumers are increasingly turning to DRE to meet their power needs The MoP has recently floated a plan to create lsquoindustrial hubsrsquo that will have their own power supplier This power supplier is likely to be a private entity given the status of a deemed licensee under the EA (Jai 2020) Further calls for lowering commercial and industrial tariffs are becoming louder in the wake of economic downswing (Financial Express 2020) These developments threaten the principal source of revenue for the discoms and will have a cascading effect on ability of discoms to absorb RE power and invest in grid integration Poor revenues will worsen their ability make payments under the PPAs
bull The increasing competitiveness of DRE also makes them an important source of supply for the power markets Discoms are discovering benefits of economising on total power procurement costs by procuring power from the exchanges (Thomas 2020) If given the flexibility it is likely that discoms would prefer to expand exchange-based procurement rather than signing PPAs for all their projected load
bull The unexpected reduction in wind generation in 2020 by up to 43 per cent during the typical high generation period due to low wind speeds caught project developers and system operators by surprise (Singh and Mohanty 2020) Climate change could bring greater uncertainty and variation in weather patterns Project developers need to be better prepared with rigorous and advanced weatherresource forecasting and tools and techniques to make timely and robust investment and operational decisions
bull End of life waste management is going to be a serious concern very soon Developers might not have factored this into costs and current policies are unclear as to who will be required to bear these costs Developers must pre-emptively focus their attention to waste management and not be unpleasantly surprised when the government eventually wakes up to the challenges (Tyagi and Kuldeep Forthcoming)
Policies must pre-empt risks and support transition to a market-driven sector
We are now entering the next decade which could make India a RE powerhouse A target of 450 GW of RE by 2030 has been set However addressing new and legacy issues of the power sector cost-effectively managing the operations of existing assets while also integrating a large quantum of new renewable capacity are challenges that confront us today
Centrendashstate and inter-state alignment requires collaboration not mandates and penalties
Over the last three years RE costs have fallen significantly At the same time regulations allow the transmission of power from a RE-rich state to any other state in the country or the purchase of RECs for an entity to meet its RPO Despite all the obvious benefits that RE
50
It is likely that discoms would prefer to expand exchange-based procurement rather than signing PPAs for all their projected load
51Looking back to look ahead
resources have to offer states have shown some level of resistance to either deploying or buying more RE power and meeting the national targets We have seen above that states do push back when it does not make commercial sense for them or they are unable to allocate resources to meet national targets Policies so far have not resulted in alignment of Centre-state objectives and actions Further there is no institutional or political platform to bring together Centre and state representatives for collective problem solving The Centre has previously determined national capacity and consumption targets unilaterally without previous consultations and engagement It appears that the current policies and mechanisms must evolve if the gaps between RE-rich and RE-deficit states are to be bridged Some approaches to increase alignment may be
bull Account for all the costs benefits and co-benefits of achieving national targets Subsequently the principles of cost- and benefit-sharing must be established and reflected in Central policies inter-state regulations and market mechanisms to drive states towards meeting national goals and objectives An example of sharing costs may be that RE-deficit states support RE manufacturing industry and make it cost competitive globally This will create a buy-in for RE-deficit states in promoting and adopting RE
bull For long-term clarity directional uniform RPO targets can be set out for all states However states may be given the freedom to choose their own technologyclean energy mix to meet the national target
bull Institutional mechanisms may be devised that bring together the Centre and the states for resolution of issues and greater buy-in of the states towards national objectives
Addressing counterparty risks will require transformation of RE procurement models
While Indiarsquos commitment to RE is strong and sustained the consistent poor financial health of discoms poses significant risks to further growth of the sector These risks include delayed payments power curtailment and contract re-negotiation We have learnt from our policy experience so far that mandates and higher penalties have limited impact Project deployment has decreased despite the Centre taking strict and swift action against errant discoms Fundamental reforms in the distribution sector and market operations will be needed to mitigate these risks For example
bull Increasing the ability of discoms to access cheaper balancing resources
bull Rigorous demand forecasting to identify power purchase requirements under long-term contracts
bull Adopting alternate models such as solar power irrigation pumps or using distributed RE for meeting productive and consumptive loads in rural areas to reduce the subsidycost burden on discoms or urban micro-grids to manage peak loads (Tyagi Kuldeep and Dave 2020)
bull Adopting market-based procurement mechanisms for storage capacities including battery pumped storage hydro resources etc
bull Simplifying and rationalising retail tariff structures and adopting alternate subsidy disbursement mechanisms to ensure revenue recovery
Measures required to improve discom financial health and increase their flexibility in power procurement may not be aligned with the incumbent business models
How Indiarsquos Solar and Wind Policies Enabled its Energy Transition A Decade in Review 52
bull Encouraging enhanced participation in new mechanisms such as market-based economic dispatch of power plants real-time markets ancillary markets etc
However all these measures that are required to improve discom financial health and increase their flexibility in power procurement may not be aligned with the incumbent business models Investors and project developers must adapt to new market contours to stay relevant
Contrasting interests of RE manufacturers and developers must converge
Project developers have viewed policies that have aimed to support domestic manufacturing adversely or indifferently Developers preferred cheaper thin film modules when DCR was part of the NSM as against procuring locally manufactured crystalline modules Project activity slowed down when safeguard duty was introduced Developers have also been arguing against imposition of customs duties that is being demanded by manufacturers
However local manufacturing and backward and forward integration of not only generation equipment but also battery storage is essential for RE sector to be future ready and insure against geopolitical risks Lessons learnt from the COVID-19 pandemic and geopolitical tensions must be internalised Developers and manufacturers must collectively find solutions that work for them They can take cues from the initial days of spread of wind technology Wind technology in India spread through research and demonstration collaborations between countries Equipment manufacturers also expanded into project development that gave them a stake in project activity as well as manufacturing More integrated supply chains and linkages must be explored by developers and manufacturers
Institutional framework ndash planning coordination and analytical requirements
Strong institutions are prerequisites for better performance and coordination Developers must aim to work with both Central and state institutions to create data sharing and information protocols For example there is not enough data to detect reasons for curtailment As we aim to increase the share of RE in the electricity mix strong institutions with clear performance standards and a coordination mechanism are essential The functions roles and responsibilities of key power sector institutions need to evolve with national ambitions For example
bull Strict monitoring and reporting of RE curtailment and the underlying reasons
bull Data and information-sharing protocols and analytical requirements for specific institutions
bull Instituting processes for bottom-up integrated resource planning (IRP) to build an optimal and cost-effective electricity system This will include relevant Central level institutions to develop and disseminate guiding frameworks toolkits and processes that any state can utilise to conduct a robust planning exercise
bull Coordination mechanism to consistently monitor the implementation of policies programmes and plans by institutions
Such new roles and responsibilities must be formally assigned to institutions for reducing
Strong institutions with clear performance standards and a coordination mechanism are essential
53
discretion ensuring greater alignment between the Centre and states enhancing the ease of doing business reducing risks for investors and accelerating the pace of the energy transition
Accelerating the flow of capital into the sector
To achieve Indiarsquos ambitious RE targets for 2030 the country would need an additional investment of USD 199 billion (approximately INR 146 lakh crore) in generation alone Investments in transmission and storage will be over and above this (Singh Dutt and Sidhu 2020) Most of this requirement will need to be met through debt finance It is a challenge to raise such enormous amounts of debt capital when our financial institutions are already crossing the regulatory limits of exposure to the power sector As noted above the sector is seeing robust secondary market activity This has become a crucial source of finance for project developers who hive off operational assets to raise funds for fresh investment Investment trusts in infrastructure (InvIT) that have tax incentives may emerge to be an attractive model for divestment of assets especially for divestment to institutional investors who want predictable returns without managing the assets directly In the power sector transmission assets have been structured as InvITs and helped the promoter retain interest in the project while obtaining additional equity investment
Sectoral and financial policies would need to focus on tapping alternative sources of financing Research by the Council on Energy Environment and Water (CEEW) suggests that the issuance of domestic bonds for refinancing loans can unlock the ability of these institutions to lend to new RE projects According to the research this option may be operationalised by providing a limited period credit enhancement subsidy for domestic RE bond issuances
Looking back to look ahead
How Indiarsquos Solar and Wind Policies Enabled its Energy Transition A Decade in Review
Aggarwal Manu and Kanika Chawla 2019 Grid Integration Guarantee A Financial Buffer to Address Renewable Energy Curtailment New Delhi CEEW httpswwwceewinsitesdefaultfilesCEEW-Grid-Integration-Guarantee-17ul19pdf
Arora Bhanvi 2019 ldquoWhy Indiarsquos Wind Turbine Makers Are Under Stressrdquo Bloomberg Quint 22 August Accessed 12 October 2020 httpswwwbloombergquintcombusinesswhy-indias-wind-turbine-makers-are-under-stress
Balan Premal 2014 ldquoAptel Rejects GUVNLrsquos Bid to Cut Solar Power Tariff in Gujaratrdquo Business Standard 27 August Accessed 12 October 2020 httpswwwbusiness-standardcomarticlecurrent-affairsaptel-rejects-guvnl-s-bid-to-cut-solar-power-tariff-in-gujarat-114082700828_1html
Bhaskar Utpal 2020 ldquoHow Rewa solar park helped Indiarsquos green economy turn a cornerrdquo Mint 10 July Accessed 12 October 2020 httpswwwlivemintcomindustryenergyhow-rewa-solar-park-helped-india-s-green-economy-turn-a-corner-11594352166677html
Bridge to India 2017 ldquoIndian developers caught between a rock and a hard placerdquo 28 August Accessed 26 November 2020 httpbridgetoindiacomindian-developers-caught-rock-hard-place
Buckley Tim and Kashish Shah 2020 Indiarsquos Renewable Energy Policy Headwinds New Delhi IEEFA httpsieefaorgwp-contentuploads202002Indias-Renewable-Energy-Policy-Headwinds_February-2020pdf
CEA 2019a Growth of Electricity Sector in India From 1947-2019 New Delhi CEA MoP
CEA 2019b Summary of Solar and Wind Power projects (Commissioned and Under Construction) of SECI New Delhi Renewable Energy Project Monitoring Division (CEA) httpsceanicinreportsothersplanningrpmSECI20Project_Summarypdf
CEA 2020a All India Installed Capacity as on 31 December 2019 New Delhi CEA httpswwwceanicinreportsmonthlyinstalledcapacity2019installed_capacity-12pdf
CEA 2020b Executive Summary on Power Sector April 2020 New Delhi CEA httpsceanicinwp-contentuploads202006exe_summary-04pdf
CEA 2020c Report of Under Construction Renewable Energy Projects New Delhi Renewable Energy Project Monitoring Division (CEA) httpsceanicinreportsothersplanningrpmunderconstructionpdf
CERC 2018 Discussion Paper on Market Based Economic Dispatch of Electricity Re-designing of Day-ahead Market (DAM) in India New Delhi CERC httpwwwcercindgovin2018draft_regDP31pdf
Chandra Rohit 2020 ldquoCheering a Lap-win in an Unfinished Racerdquo Financial Express 1 December Accessed 1 December 2020 httpswwwfinancialexpresscomopinioncheering-a-lap-win-in-an-unfinished-race2140347
Chandrasekaran Kaavya 2017 ldquoMNRE asks Tamil Nadu to prevent curtailment of solar powerrdquo The Economic Times 9 October Accessed 12 October 2020 httpsmeconomictimescomindustryenergypowermnre-asks-tamil-nadu-to-prevent-curtailment-of-solar-powerarticleshow60997998cms
Chatterjee Anupam 2019 ldquoSolar Tenders Remain Hugely Undersubscribed mdash Herersquos What Caused Tepid Responserdquo Financial Express 4 December Accessed 28 November 2020 httpswwwfinancialexpresscomindustrysolar-tenders-remain-hugely-undersubscribed-heres-what-caused-tepid-response1783670
References
54
55
Chawla Kanika 2020 ldquoIndia-China tensions Will Indiarsquos Energy Transition be a Collateral Damagerdquo Financial Express 1 August Accessed 26 November 2020 httpswwwfinancialexpresscomopinionindia-china-tensions-will-indias-energy-transition-be-a-collateral-damage2041561
Atal Vinit and Gireesh Shrimali 2018 An Assessment of Indiarsquos Energy Choices Financial Performance and Risk Perception New Delhi CPI httpclimatepolicyinitiativeorgwp-contentuploads201805Financial-Performance-and-Risk-Perceptionpdf
CAG 2015 Report of the Comptroller and Auditor General of India on Renewable Energy Sector in India Report No 34 of 2015 New Delhi CAG httpscaggovinuploadsdownload_audit_report2015Union_Civil_Performance_Renewable_Energy_Report_34_2015pdf
CRISIL 2017 ldquoCompetitive Bidding Set to Transform Wind Power Marketrdquo May Accessed 28 November 2020 httpswwwcrisilcomcontentdamcrisilour-analysisviews-and-commentariesinsightsCRISIL-Research-Insights-Competitive-bidding-a-blow-for-wind-power-sector-may2017pdf
CSO Energy Statistics 2010 New Delhi MoSPI
CSO Energy Statistics 2012 New Delhi MoSPI
CSO Energy Statistics 2013 New Delhi MoSPI
CSO Energy Statistics 2014 New Delhi MoSPI
CSO Energy Statistics 2015 New Delhi MoSPI
CSO Energy Statistics 2016 New Delhi MoSPI
CSO Energy Statistics 2017 New Delhi MoSPI
CSO Energy Statistics 2018 New Delhi MoSPI
CSO Energy Statistics 2019 New Delhi MoSPI
CSO Energy Statistics 2020 New Delhi MoSPI
Deign Jason 2017 ldquoIndiarsquos Record-Low Wind and Solar Prices May Not Be Sustainablerdquo Greentech Media 25 September Accessed 26 November 2020 httpswwwgreentechmediacomarticlesreadindias-renewable-energy-auctions-may-not-be-sustainable
Deloitte and CII 2015 ldquoSolar Power in Karnataka Charting the Path for a Bright Futurerdquo Knowledge Paper for CII Karnataka Conference on Power July httpswww2deloittecomcontentdamDeloitteinDocumentsenergy-resourcesin-enr-solar-power-in-karnataka-noexppdf
Dutt Arjun Lucila Arboleya and and Pablo Gonzalez 2020 Clean Energy investment Trends Mapping Project Level Financial Performance Expectations in India New Delhi Paris CEEW and IEA httpscefceewinsolutions-factoryCEEW-CEF-clean-energy-investment-trends-2020pdf
Economic Times 2010 ldquoGujarat Takes the Lead Among States in Solar Powerrdquo The Economic Times 2 November Accessed 12 October 2020 httpseconomictimesindiatimescomspecial-featuregujarat-takes-the-lead-among-states-in-solar-powerarticleshow6855821cmsfrom=mdr
Economic Times 2019 ldquoPower Ministry order on LCs to Face Challenges India Ratingsrdquo Economic Times 18 July Accessed 26 November 2020 httpseconomictimesindiatimescomindustryenergypowerpower-ministry-order-on-lcs-to-face-challenges-india-ratingsarticleshow70279939cmsfrom=mdr
ETEnergyWorld 2020 ldquoGovt plans 20 GW capacity solar tenders till June 2021rdquo ETEnergyworldcom 18 March
References
How Indiarsquos Solar and Wind Policies Enabled its Energy Transition A Decade in Review 56
Accessed 12 October 2020 httpsenergyeconomictimesindiatimescomnewsrenewablegovt-plans-20-gw-capacity-solar-tenders-till-june-202174688993
Financial Express 2020 ldquoLower power tariff can boost Make in India after corona crisisrdquo Financial Express 8 May Accessed 29 November 2020 httpswwwfinancialexpresscomeconomylower-power-tariff-can-boost-make-in-india-after-corona-crisis1951679
Ganesan Karthik Poulami Choudhury Rajeev Palakshappa Rishabh Jain and Sanyukta Raje 2014 Assessing Green Industrial Policy ndash The India Experience New Delhi CEEW httpswwwiisdorggsisitesdefaultfilesrens_gip_indiapdf
Garg Vibhuti and Kashish Shah 2020 The Curious Case of Indiarsquos Discoms New Delhi IEEFA httpsieefaorgwp-contentuploads202008The-Curious-Case-of-Indias-Discoms_August-2020pdf
Garg Vibhuti Balasubramanian Viswanathan Danwant Narayanaswamy Christopher Beaton Karthik Ganesan Shruti Sharma and Richard Bridle 2020 Mapping Indiarsquos Energy Subsidies 2020 Fossil Fuels Renewables and Electric Vehicles Winnipeg IISD httpswwwiisdorgsystemfilespublicationsindia-energy-transition-2020pdf
ICRA Limited and CARE Ratings 2019 State Distribution Utilities Seventh Annual Integrated Rating New Delhi MoP httpspfcindiacomDocumentRepositoryckfinderfilesGoI_InitiativesAnnual_Integrated_Ratings_of_State_DISCOMs7th_Rating_Booklet_Final_13-10-2019pdf
Idam Infra 2016 Procurement of Wind Power Wind Vision India 2032 New Delhi Shakti Sustainable Energy Foundation httpsidaminfracomwp-contentuploads201607Wind-Vision-2032-A-Multi-Stakeholder-Perspectivepdf
IEA 2020 ldquoEvolution of Solar PV Module Cost by Data Source 1970-2020rdquo 30 June Accessed 28 November 2020 httpswwwieaorgdata-and-statisticschartsevolution-of-solar-pv-module-cost-by-data-source-1970-2020
India RE Navigator 2020 ldquoAuction Resultsrdquo Accessed 28 November 2020 httpsindia-re-navigatorcomwind
IRENA 2017 ldquoRenewable Energy Prospects for Indiardquo Working Paper Based on REmap May IRENA httpswwwirenaorg-mediaFilesIRENAAgencyPublication2017MayIRENA_REmap_India_paper_2017pdfla=enamphash=4B737628E6D1E4C7F04551C26B3C3F7EB768281A
IWTMF 2019 ldquoIndia - Wind Power Capacity Installations FY 2018-19rdquo Accessed 28 November 2020 httpsindianwindpowercompdfSTATE-WISE-MONTH-WISE-WIND-INSTALLATIONS-FY-2018-19pdf
Jai Shreya 2018 ldquo35 GW of Solar Tenders in Limbo Thanks to Tax and Regulatory Nigglesrdquo Business Standard 27 February Accessed 28 November 2020 httpswwwbusiness-standardcomarticleeconomy-policy3-5-gw-of-solar-tenders-in-limbo-owing-to-tax-and-regulatory-niggles-118022700346_1html
Jai Shreya 2020 ldquoGovt Plans Separate Electricity Distribution Channel for Industriesrdquo Business Standard 16 November Accessed 28 November 2020 httpswwwbusiness-standardcomarticleeconomy-policygovt-plans-separate-electricity-distribution-channel-for-industries-120111600018_1html
Jhawar Pratha 2020 ldquoRenewable Energy Curtailment is a Banerdquo Down to Earth 17 January Accessed 12 October 2020 httpswwwdowntoearthorginblogenergyrenewable-energy-curtailment-is-a-bane-68857
Jog Sanjay 2013 ldquoBanks Say PPA Structure for Solar Projects not Bankablerdquo Business Standard 20 January Accessed 12 October 2020 httpswwwbusiness-standardcomarticlefinancebanks-say-ppa-structure-for-solar-projects-not-bankable-110083100077_1html
Kapoor Karan Krishan K Pandey AKJain and Ashish Nandan 2014 ldquoEvolution of Solar Energy in India A Reviewrdquo Renewable and Sustainable Energy Reviews (40) 475-487 httpdxdoiorg101016jrser201407118
57References
Kumar Alok and Sushanta Chatterjee 2012 Electricity Sector in India Policy and Regulation New Delhi Oxford University Press
Kumarankandath Aruna 2015 ldquoWTO Rules Against Indiarsquos Domestic Content Requirements in Solar Powerrdquo Down to Earth 3 September Accessed 26 November 2020 httpswwwdowntoearthorginnewsenergywto-rules-against-india-s-domestic-content-requirements-in-solar-power-50977
MNRE 2017 Agenda Note for National Review Meeting of State Principal Secretaries and State Nodal Agencies of Renewable Energy on 23-24 January 2017 httpssolarrooftopgovinnotificationNotification-09012017pdf
MNRE 2019 Annual Report 2018ndash19 New Delhi MNRE httpsmnregovinimgdocumentsuploadsfile_f-1608040317211pdf
MNRE 2020a Annual Report 2019ndash20 New Delhi MNRE httpsmnregovinimgdocumentsuploadsfile_f-1597797108502pdf
MNRE 2020b Physical Progress Achievements Accessed 26 November 2020 httpsmnregovinthe-ministryphysical-progress
Mondal Debapriya 2016 ldquoWTO Ruling on Domestic Content Requirement in Solar A Blessing in Disguiserdquo ETEnergyWorld 26 September Accessed 26 November 2020 httpsenergyeconomictimesindiatimescomnewsrenewablewto-ruling-on-domestic-content-requirement-in-solar-a-blessing-in-disguise54527456
MoP 2010 Annual Report New Delhi MoP httpspowerminnicinsitesdefaultfilesuploadsAnnual_Report_2009-10_Englishpdf
MoP 2016 Guidelines for Long-term RPO Growth Trajectory of Renewable Purchase Obligations (RPOs) for Non-solar as well as Solar Order No 2332016-RampR New Delhi MoP 22 July httpswwwmahaurjacommedadatarporecreportsMoP20on20Long20term20RPO20trajectorypdf
MoP 2018 Long-term RPO Growth Trajectory of Renewable Purchase Obligations (RPOs) for Solar and Non-solar for a Period of Three Years ie 2019ndash20 to 2021ndash22 Order No 23032016ndashRampR New Delhi MoP 14 June httpspowerminnicinsitesdefaultfileswebformnoticesRPO_trajectory_2019-22_Order_dated_14_June_2018pdf
MoP 2019 Opening and Maintaining of Adequate Letter of Credit (LC) as Payment Security Mechanism under Power Purchase Agreements by Distribution Licensees Order No 23222019-RampR New Delhi MoP 28 June httpsmnregovinimgdocumentsuploadsbf4ce66944bd410bb39ef4cf60cbaa6apdf
MoP 2020a Agenda Background Conference of Power and Renewable Energy Ministers of States and UTs 3 July 2020 New Delhi 3 July
MoP 2020b Regarding MoP Order dated 28062019 regarding opening and maintaining of adequate Letter of Credit (LC) as Payment Security Mechanism under Power Purchase Agreements by Distribution Licensees Order No 23222019-RR New Delhi MoP 27 March httpspowerminnicinsitesdefaultfileswebformnoticesFinal_Clarification_to_the_orders_of_MoP_letter_dtd_06042020pdf
Naidu Katya 2013 ldquoSuzlon to Build Land Bankrdquo Business Standard 20 January Accessed 12 October 2020 httpswwwbusiness-standardcomarticlecompaniessuzlon-to-build-land-bank-111112900026_1html
Paliwal Ankur and Jonas Hamberg 2015 ldquoSolar Mission Phase II May Reign in Import of Thinfilmsrdquo Down to Earth 4 July Accessed 26 November 2020 httpswwwdowntoearthorginnewssolar-mission-phase-ii-may-reign-in-import-of-thinfilms-40130
Parikh Anjana 2020 ldquoPOSOCO to Examine Renewable Energy Curtailment Issue in Andhra Pradeshrdquo Mercom 5 February Accessed 26 November 2020 httpsmercomindiacomposoco-examine-renewable-energy-curtailment-issue-andhra-pradesh
How Indiarsquos Solar and Wind Policies Enabled its Energy Transition A Decade in Review 58
PEG 2018 Electricity Distribution Companies in India Preparing for an Uncertain Future Mumbai PEG httpswwwprayaspuneorgpegpublicationsitemdownload892_2d5b1ca58ed382a4ef554ba04f6515dchtml
PIB 2019 ldquo PM Modi addresses Climate Action Summitrdquo Accessed 28 November 2020 httpspibgovinPressReleasePageaspxPRID=1585979
POSOCO 2018 Renewable Energy Certificate Mechanism in India Key Learnings Data Analysis and Way Forward New Delhi POSOCO NLDC httpsposocoinwp-contentuploads201808REC_REPORT_17082018_fPRINTpdf
Prasad Nithin Thomas 2020 ldquoNew Solar Tariff Record of `2kWh Why Did it Go So Lowrdquo Mercom 27 November Accessed 28 November 2020 httpsmercomindiacomnew-solar-tariff-record
Raikar Nitin 2018 ldquoIndian Wind Industry Analytical Report - FY 2017ndash18rdquo Indian Wind Power 4 (1) 32-33 httpswwwindianwindpowercompdfIndian-Wind-Power-April-May-2018pdf
Ranjan Rakesh 2020 ldquoUttar Pradesh to Set Up 600 MW of Solar in a New Renewable Energy Parkrdquo Mercom 19 June Accessed 28 November 2020 httpsmercomindiacomuttar-pradesh-solar-renewable-energy-park
REC Registry of India 2020a ldquoMonth-wise RECs Reportrdquo REC Registry of India Accessed 30 November httpswwwrecregistryindianicinindexphppublicsrecs
REC Registry of India 2020b ldquoRegistered RE Generatorsrdquo REC Registry of India Accessed 30 November HYPERLINK ldquohttpswwwrecregistryindianicinindexphppublicsrecsrdquo httpswwwrecregistryindianicinindexphppublicsregistered_regens
Reuters 2020 ldquoAdani Green Energy Doesnrsquot Have a Guaranteed Buyer for $6 Billion Solar Project in Indiardquo ET Energy World 19 November Accessed 28 November 2020 httpsenergyeconomictimesindiatimescomnewsrenewableadani-green-energy-doesnt-have-a-guaranteed-buyer-for-6-billion-solar-project-in-india79298448
Saumy Prateek 2019 ldquoAfter Tamil Nadu NSEFI Writes to Karnataka About Solar Projects Facing Curtailmentrdquo Mercom 21 June Accessed 12 October 2020 httpsmercomindiacomnsefi-karnataka-solar-curtailment
Saumy Prateek 2017 ldquoPPAS for 1050 MW Wind Projects Signedrdquo Mercom 21 July Accessed 12 October 2020 httpsmercomindiacomppas-1050-mw-wind-projects-signed
Saurabh 2017 ldquoTamil Nadu India Issues 500 Megawatt Wind Energy Tenderrdquo Clean Technica 9 July Accessed 12 October 2020 httpscleantechnicacom20170709tamil-nadu-india-issues-500-megawatt-wind-energy-tender
SECI 2014 3rd Annual Report 2013ndash14 New Delhi SECI httpswwwsecicoinUploadFinacial637268670541938164pdf
SECI 2019 8th Annual Report 2018ndash19 New Delhi SECI httpsmnregovinimgdocumentsuploadsfile_f-1597797108502pdf
Seetharaman G and Kaavya Chandrasekaran 2019 ldquoGovernmentrsquos Solar Park Push is Running Into Land Acquisition and Transmission Challengesrdquo The Economic Times 28 April Accessed 12 October 2020 httpseconomictimesindiatimescomindustryenergypowergovernments-solar-park-push-is-running-into-land-acquisition-and-transmission-challengesarticleshow69074597cmsfrom=mdr
Sengupta Debjoy 2013 ldquoIndian Solar Market Forecasting a Better 2014 after a Lackluster Yearrdquo The Economic Times 20 November Accessed 12 October 2020 httpseconomictimesindiatimescomindustryenergypowerindian-solar-market-forecasting-a-better-2014-after-a-lackluster-yeararticleshow26101929cmsfrom=mdr
Shrimali Gireesh and Sunali Rohra 2012 ldquoIndiarsquos Solar Mission A Reviewrdquo Renewable and Sustainable Energy Reviews (16) 8 6317ndash6332 httpsdoiorg101016jrser201206018
59References
Singh Anoop 2010 ldquoEconomics Regulation and Implementation Strategy for Renewable Energy Certificates in Indiardquo In India Infrastructure Report 2010 edited by Development Finance Company and 3iNetwork 42-57 New Delhi Oxford University Press
Singh Hartek 2017 ldquoWhy Renewable Energy Evacuation Demands a Decisive Pushrdquo ET Energy World 26 December Accessed 12 October 2020 httpsenergyeconomictimesindiatimescomenergy-speakwhy-renewable-energy-evacuation-demands-a-decisive-push2774
Singh Sarita and Shashwat Mohanty 2020 ldquoWind Generation Falls Over 40 in July Initial Assessment Blames Low Wind Speedrdquo ETEnergyWorld 12 August Accessed 28 November 2020 httpsenergyeconomictimesindiatimescomnewsrenewablewind-generation-falls-over-40-in-july-initial-assessment-blames-low-wind-speed77496934
Singh Vaibhav Pratap Arjun Dutt and Gagan Sidhu 2020 RE-Financing Indiarsquos Energy Transition Limited Period Subsidised Credit Enhancement for Domestic RE Bond Issuances New Delhi CEEW
Sinha Amitesh 2020 ldquoIndiarsquos Ambition and Opportunities in Solar Manufacturingrdquo Presentation India PV Edge 2020 Virtual conference 6 October
Soman Abhinav Neil McCulloch Harsimran Kaur and Christopher Beaton 2019 Indiarsquos Energy Transition The Impact of the Goods and Services Tax on Solar Photovoltaic and Coal Power Costs New Delhi IISD
Srivastava Shobhit Surbhi Singhvi and Vinay Rustagi 2019 Forecasting amp Scheduling Regulations Gurugram Bridge to India httpsbridgetoindiacombackendwp-contentuploads202003Policy-brief-Executive-summarypdf
Stromsta Karl-Erik 2012 ldquoIndia may fine most PV projects for delays in messy start to NSMrdquo Recharge 21 February Accessed 12 October 2020 httpswwwrechargenewscomsolarindia-may-fine-most-pv-projects-for-delays-in-messy-start-to-nsm1-1-837485
Sud Tushar Rajneesh Sharma Radhika Sharma and Lucy Kitson 2015 Indiarsquos Accelerated Depreciation Policy for Wind Energy New Delhi IISD
Sustainability Outlook 2010 Negotiating Power Purchase Agreements for Solar Projects 28 July Accessed 12 October 2020 httpwwwsustainabilityoutlookincontentnegotiating-power-purchase-agreements-solar-projects~text=NVVN20has20proposed20a20tripartite20arrangement20for20purchaseand20Power20Purchase20Agreement20with20Solar20Power20Developers
Tenddulkar Suuhas 2019 ldquoGujarat Land Allocation Logjam Threatens Windrsquos Viabilityrdquo Wind Power Monthly 14 January Accessed 12 October 2020 httpswwwwindpowermonthlycomarticle1522808gujarat-land-allocation-logjam-threatens-winds-viability
TERI 2017 Addressing Land Issues for Utility Scale Renewable Energy Deployment in India New Delhi Shakti Sustainable Energy Foundation
The Hindu 2017 ldquoNew Solar Energy Target for Karnataka 6000 MW by 2021rdquo The Hindu 10 January Accessed 12 October 2020 httpswwwthehinducomnewscitiesbangaloreNew-solar-energy-target-for-Karnataka-6000-MW-by-2021article17018234ece
Thomas Tanya 2018 ldquoIndia May Not Reach 100GW Solar Power Target by 2022 Crisil Reportrdquo Mint 13 August Accessed 29 November 2020 httpswwwlivemintcomIndustryHEugjBRI2zsNDyVzB2E1kJIndia-may-not-reach-100GW-solar-power-target-by-2022-Crisilhtml
Thomas Tanya ldquoPower Utilities Turn to Cheaper Exchange Power as Prices Crashrdquo Mint 28 May Accessed 29 November 2020 httpswwwlivemintcomindustryenergypower-utilities-turn-to-cheaper-exchange-power-as-prices-crash-11590636539577html
How Indiarsquos Solar and Wind Policies Enabled its Energy Transition A Decade in Review 60
TN Energy Department 2012 Policy Note 2012-2013 Chennai Energy Department Government of Tamil Nadu httpscmstngovinsitesdefaultfilesdocumentsenergy_7pdf
TNN 2013 ldquoTNrsquos power utility rated worst among 4 southern statesrdquo Times of India 30 March Accessed 12 October 2020 httpstimesofindiaindiatimescomcitychennaiTNs-power-utility-rated-worst-among-4-southern-statesarticleshow19285688cms
Tongia Rahul Santosh Harish and Rahul Walawalkar 2018 Integrating Renewable Energy Into Indiarsquos Grid- Harder Than It Looks New Delhi Brookings India httpswwwbrookingseduwp-contentuploads201811Complexities-of-Integrating-RE-into-Indias-grid2pdf
Tyagi Akanksha and Neeraj Kuldeep Forthcoming Resource Management Strategies for India by Managing Solar PV Module Waste New Delhi CEEW
Tyagi Akanksha Neeraj Kuldeep and Aarushi Dave 2020 Are Urban Microgrids Economically Feasible A Study of Delhirsquos Discom and Consumer Perspectives for BYPL New Delhi CEEW httpswwwceewinsitesdefaultfilesCEEW-Are-urban-microgrids-economically-feassible-29Oct20pdf
William Praveen 2020 ldquoAmbiguities Under the GST Regime for Renewable Energy Sectorrdquo KPMG India Blog 30 January Accessed 12 October 2020 httpshomekpmginenblogshomeposts202001ambiguities-under-the-gst-regime-for-renewable-energy-sectorhtml
WTO 2016 DS456 India mdash Certain Measures Relating to Solar Cells and Solar Modules Accessed 26 November 2020 httpswwwwtoorgenglishtratop_edispu_ecases_eds456_ehtm
Judicial orders cited
Order dated 3 December 2019 issued by CERC in Petition No 340AT2019 titled PTC India Ltd v SECI and Ors httpwwwcercindgovin2019orders340-AT-2019pdf
Order dated 3 December 2009 issued by CERC in Petition No 2842009 titled Determination of Generic Levellised Generation Tariff httpwwwcercindgovin2009November09284ndash2009_final_3rdDecember09pdf
Order dated 15 May 2014 issued by CERC in Petition No SM3542013 (SuondashMotu) titled Determination of Generic Levellised Generation Tariff for the FY 2014ndash15 httpwwwcercindgovin2014ordersSO354pdf
Order dated 31 March 2015 issued by CERC in Petition No SM0042015(SuondashMotu) titled Determination of Generic Levellised Generation Tariff for the FY 2015 ndash 16 httpcercindgovin2015ordersso4pdf
Order dated 30 March 2016 issued by CERC in Petition No SM032016 (SuondashMotu) titled Determination of Levellised Generic Tariff for FY 2016ndash17 httpcercindgovin2016orderssm_3pdf
Order dated 11 August 2017 issued by the TNERC in TP No1 of 2017 titled Determination of Tariff for Generation and Distribution Accessed 25 October 2020 httpwwwtnercgovinordersTariff20Order2020092017TariffOrderTANGEDCOndash11ndash08ndash2017pdf
Order dated 27 March 2019 issued by the MERC in Case No36 of 2019 titled Case for Verification of Compliance of Renewable Purchase Obligation targets by Maharashtra State Electricity Distribution Co Ltd for FY 2017ndash18
Order dated 2 April 2019 issued by the MERC in Case No37 of 2019 titled Case for Verification of Compliance of Renewable Purchase Obligation targets by Brihanmumbai Electric Supply amp Transport Undertaking for FY 2017ndash18
Order dated 2 April 2019 issued by the MERC in Case No38 of 2019 titled Case for Verification of Compliance of Renewable Purchase Obligation targets by Tata Power Co Ltd (Distribution) for FY 2017ndash18
61Judicial orders cited
Order dated 4 April 2019 issued by the MERC in Case No39 of 2019 titled Case for Verification of Compliance of Renewable Purchase Obligation targets by Adani Electricity Mumbai Limited for FY 2017ndash18
Order dated 23 October 2017 issued by the PSERC titled Annual Revenue Requirement and Determination of Tariff for MYT Control Period from FY 2017ndash18 to FY 2019ndash20 and for True up of FY 2015ndash16 Accessed 25 October 2020 httppsercgovinpagesPSPCL-Tariff-Order-Vol-1-2017-18pdf
Order dated 19 April 2018 issued by the PSERC in Petition titled True up of FY 2016ndash17 Annual Performance Review (APR) for FY 2017ndash18 and Determining the Annual Revenue Requirement (ARR) for FY 2018ndash19 Accessed 25 October 2020 httppsercgovinpagesTariff20Order20PSPCL20for20FY202018-19pdf
Order dated 27 May 2019 issued by the PSERC in Petition No 02 of 2019 titled True up of FY 2017ndash2018 Annual Performance Review (APR) for FY 2018ndash19 approval of Revised Annual Revenue Requirement (ARR) and determination of Tariff for FY 2019ndash20 Accessed 25 October 2020 httppsercgovinpagesPSPCL-Tariff-Order-2019-20pdf
Order dated 25 February 2019 issued by the BERC in Case No 40 and 48 of 2018 and Case No 41 and 47 of 2018 titled Tariff Order for FY 2019ndash20 for NBPDCL and SBPDCL Accessed 25 October 2020 httpsberccoinorderstariffdistributionsbpdcl1965-tariff-order-of-sbpdcl-for-fy-2019-20
Order dated 24 March 2017 issued by the BERC in Case No 45 of 2016 titled Tariff Order for FY 2017-18 for NBPDCL Accessed 25 October 2020 httpsberccoinorderstariffdistributionnbpdcl1143-tariff-order-of-nbpdcl-for-fy-2017-18
Order dated 24 March 2017 issued by the BERC in Case No 46 of 2016 titled Tariff Order for FY 2017ndash18 for SBPDCL Accessed 25 October 2020 httpsberccoinorderstariffdistributionsbpdcl1142-tariff-order-of-sbpdcl-for-fy-2017-18
Order dated 21 March 2018 issued by the BERC in Case No 40 of 2017 titled Tariff Order for FY 2018ndash19 for NBPDCL Accessed 25 October 2020 httpsberccoinorderstariffdistributionnbpdcl1447-tariff-order-of-nbpdcl-for-fy-2018-19
Order dated 21 March 2018 issued by the BERC in Case No 41 of 2017 titled Tariff Order for FY 2018ndash19 for SBPDCL Accessed 25 October 2020 httpsberccoinorderstariffdistributionsbpdcl1444-tariff-order-of-sbpdcl-for-fy-2018-19
Order dated 1 June 2010 issued by the CERC in Petition No 992010 (Suo Motu) titled Determination of Forbearance and Floor Price for the REC Framework httpswwwrecregistryindianicinpdfREC_RegulationFinal_Order_on_Forbearnace_and_Floor_Price_for_RECpdf
Order dated 23 August 2011 issued by the CERC in Petition No 1422011 (Suo Motu) titled Determination of Forbearance and Floor Price for the REC Framework to be Applicable from 1st April 2012 httpswwwrecregistryindianicinpdfREC_RegulationOrder_on_Forbearnace__Floor_Price_23-8-2011pdf
Order dated 30 March 2017 issued by the CERC in Petition No 02SM2017 titled Determination of Forbearance and Floor Price for the REC Framework to be Applicable from 1st April 2017 httpswwwrecregistryindianicinpdfREC_RegulationCERC_Order_300317pdf
Order dated 17 June 2020 issued by the CERC in Petition No 05SM2020 titled Determination of Forbearance and Floor Price for the REC Framework httpswwwrecregistryindianicinpdfREC_Regulation5-SM-2020-finalpdf
Judgment dated 13 May 2015 issued by the Supreme Court of India in Civil Appeal No 4417 of 2015 titled Hindustan Zinc Limited v RERC ((2015)12SCC611) httpswwwrecregistryindianicinpdfREC_RegulationSupreme_Court_Judgement_regarding_RPO_Compliancepdf
Order dated 4 August 2015 issued by the GERC in suo motu Petition Nos 1307 of 2013 and 1312 of 2013 titled Suo-motu Proceedings in Petition Nos 1307 of 2013 and 1312 of 2013 in Pursuance of Honrsquoble APTEL Direction Contained in
How Indiarsquos Solar and Wind Policies Enabled its Energy Transition A Decade in Review
Order Dated 16042015 in Appeal Nos 258 of 2013 and 21 of 2014 and the Order Dated 14052015 in IA No 187 of 2015 Accessed 22 October 2020 httpswwwgercinorgwp-contentuploadsdocumenten_1438799511pdf
Order dated 4 April 2019 issued by the MERC in Case No 39 of 2019 titled Case for Verification of Compliance of Renewable Purchase Obligation Targets by Adani Electricity Mumbai Limited for FY 2017ndash18
Order dated 14 May 2018 issued by the KERC in matter no S032017 titled In the Matter of Revision of Wheeling and Banking Charges for Renewable Power Projects Accessed 22 October 2020 httpskredlinfoingeneralwheeling20and20banking20charges2014052017pdf
Order No 82020 dated 7 October 2020 issued by the TNERC titled Order on Procurement of Wind Power and Related Issues Accessed 22 October 2020 httpwwwtnercgovinordersTariff20Order2020092020WindOrder-2007-10-2020pdf
Order No 22020 dated 30 April 2020 issued by the GERC titled Tariff Framework for Procurement of Power by Distribution Licensees and Others from Wind Turbine Generators and Other Commercial Issues for the State of Gujarat Accessed 22 October 2020 httpswwwgetcogujaratcomgetco_newpagesfilesRNCREOrder20No220of20202020issued20by20GERC20pdf
Order dated 20 March 2020 in Case No 30 2019 and 312019 issued by the BERC titled Tariff Order Truing up for FY 2018-19 Annual Performance Review for FY 2019-20 Annual Revenue Requirement (ARR) and Determination of Retail Tariff for FY 2020-21 for North Bihar Distribution Company Limited (NBPDCL) and South Bihar Distribution Company Limited (SBPDCL) Accessed 22 October 2020 httpsberccoinorderstariffdistributionsbpdcl2216-tariff-order-of-nbpdcl-for-fy-2019-22
62
Unlocking the demand for RE and capitalising on the immense opportunity that it presents requires innovative solutions that account for legacy issues and yet are forward looking
Image iStock
How Indiarsquos Solar and Wind Policies Enabled its Energy Transition A Decade in Review
COUNCIL ON ENERGY ENVIRONMENT AND WATER (CEEW)
Sanskrit Bhawan A-10 Qutab Institutional AreaAruna Asaf Ali Marg New Delhi - 110067 IndiaT +91 (0) 11 4073 3300
infoceewin | ceewin | CEEWIndia | ceewindia

How Indiarsquos Solar and Wind Policies Enabled its Energy Transition A Decade in Review
Image iStock
This study focuses on the evolving policies and risks in Indiarsquos utility-scale solar and wind energy sector and mitigating strategies used at various points in time
Contents
Executive summary
2 Evolution of Central policies
21 Pre-2010 ndash private-sector participation and prioritising renewables 22 Post-2010 policies for solar 23 Impact of other policies on project deployment 24 Solar Park Scheme 25 Post-2010 policies for wind 26 Policy assessment
3 Renewable purchase obligations ndash a regulatory mechanism for creating demand
31 Setting RPO targets 32 Compliance with RPO 33 Causes of under-achievement
4 Policy evolution in RE-rich states
41 Policies pre-2014 42 Policies post- 2014
5 Policy evolution in RE-deficit states
6 Looking back to look ahead
References
Judicial orders cited
1 Introduction
11 Methodology 12 Institutional framework
1
24
5
27
49
54
60
17
12
27
5
14
34
1918
43
81011
22
i
How Indiarsquos Solar and Wind Policies Enabled its Energy Transition A Decade in Review
Tables
Table ES1 Spheres of influence of the Centre and states
Table 1 The institutional structure of the power sector
Table 2 Evolution of central policies for utility-scale wind and solar energy ndash 2010ndash2019
Table 3 Snapshot of VGF schemes
Table 4 Indiarsquos progress towards 175 GW renewable energy by 2022
Table 5 MoP trajectory for RPO
Table 6 Resource-rich states are also the highest buyers of RECs
Table 7 REC floor prices and forbearance prices have consistently fallen
Table 8 Average size of a registered plant as of FY 2018
Table 9 Targets specified under policies and actual achievements
Table 10 2010ndash2014 Developments that held back RE deployment and associated risks that remained
Table 11 Timeline of the key events in the AP story
Table 12 Banking charges and conditions across RE-rich states
Figures
Figure ES1 Pace of capacity addition in wind and solar projects has slowed down
Figure ES2 Policy focus of the states
Figure ES3 Developments across project deployment and operations
Figure ES4 Lessons from policy evolution
Figure ES5 Varied and evolving challenges for RE growth
Figure ES6 Signals of disruption of the existing business models of investors
Figure 1 The rate of growth in solar and wind capacity addition is slowing down (2008ndash2020)
Figure 2 The pace of solar park development under the Central scheme has been slow (31 December 2019)
Figure 3 Competitive bidding in wind brought down the tariffs significantly
Figure 4 Compliance with RPOs is uneven among states and discoms
Figure 5 RECs consistently remain unsold in the market
Figure 6 The registration of new projects under the REC mechanism has reduced
Figure 7 RE resource potential is concentrated in western and southern India
Figure 8 Solar and wind capacity increased rapidly 2014 onwards
Figure 9 Average module (multicrystalline) prices have continiously declined (2011ndash2019)
Figure 10 Solar tariffs discovered in Indian auctions
Figure 11 Gujarat saw the largest wind capacity additions among the wind-rich states (2016ndash2020)
Figure 12 ISTS-connected solar PV projects have poor completion record
Figure 13 The rate of commissioning of wind projects has been slow (August 2020)
ii
4
678
10
14
19
22
23
24
2930
34
38
42
ii
iv
v
viii
vii
viii
2
12
13
20
21
23
27
31
35
36
37
38
39
Acronyms
AAPERC Andhra Pradesh Electricity Regulatory Commission
APPC average power purchase cost
APSPDCL Andhra Pradesh Southern Power Distribution Company Limited
AD accelerated depreciation
APTEL Appellate Tribunal of Electricity
BERC Bihar Electricity Regulatory Commission
BREDA Bihar Renewable Energy Development Authority
CAG Comptroller and Auditor General of India
CEA Central Electricity Authority
CERC Central Electricity Regulatory Commission
COVID-19 coronavirus disease 2019
CPP captive power plants
CST central sales tax
DCR domestic content requirement
DRE distributed renewable energy
EA Electricity Act 2003
FiT feed-in tariffs
FY financial year
GBI generation-based incentive
GERC Gujarat Electricity Regulatory Commission
GST goods and services tax
GUVNL Gujarat Urja Vikas Nigam Limited
GW giga watt
IEGC Indian Electricity Grid Code
INR Indian rupee
InSTS intra-state transmission system
IRP integrated resource planning
ISTS inter-state transmission system
KERC Karnataka Electricity Regulatory Commission
KPCL Karnataka Power Corporation Limited
KREDL Karnataka Renewable Energy Development Limited
LC letter of credit
LTA long-term access
MERC Maharashtra Electricity Regulatory Commission
MNRE Ministry of New and Renewable Energy
MoP Ministry of Power
MoSPI Ministry of Statistics and Programme Implementation
How Indiarsquos Solar and Wind Policies Enabled its Energy Transition A Decade in Review
MPERC Madhya Pradesh Electricity Regulatory Commission
MSEDCL Maharashtra State Electricity Distribution Company Limited
MW mega watt
MWh mega watt-hour
NAPCC National Action Plan on Climate Change
NLDC National Load Despatch Centre
NREDCAP New and Renewable Energy Development Corporation of AP Limited
NSM National Solar Mission
NTP National Tariff Policy
NVVN NTPC Vidyut Vyapar Nigam Limited
OampM operation and maintenance
OEMs original equipment manufacturers
PGCIL Power Grid Corporation of India Limited
PIB Press Information Bureau
POSOCO Power System Operation Corporation Limited
PPA power purchase agreement
PSA power sale agreement
PSERC Punjab State Electricity Regulatory Commission
PSM payment security mechanism
PSPCL Punjab State Power Corporation Limited
PV photovoltaic
RBI Reserve Bank of India
RE renewable energy
REC renewable energy certificate
RERC Rajasthan Electricity Regulatory Commission
RES renewable energy sources
RPO renewable purchase obligation
SECI Solar Energy Corporation of India Limited
SERC state electricity regulatory commission
STU state transmission utility
TOD time of day
TSERC Telangana State Electricity Regulatory Commission
TNERC Tamil Nadu Electricity Regulatory Commission
UPERC Uttar Pradesh Electricity Regulatory Commission
UPNEDA Uttar Pradesh New and Renewable Energy Development Agency
VAT value-added tax
VGF viability gap funding
WTO World Trade Organisation
Executive summary
In 2015 India announced ambitious targets for renewable energymdash175 GW by 2022mdashone of the largest expansion initiatives in the world Just four years later at the United
Nations Climate Action Summit 2019 the Prime Minister of India pledged to increase Indiarsquos renewable energy (RE) capacity to 450 GW by 2030 (PIB 2019) Indiarsquos journey to reaching these targets is at a critical juncture The pace of capacity addition in utility-scale wind and solar power which saw a rapid increase during 2014ndash2017 has since slowed down (Figure ES1)
Image iStock
i
How Indiarsquos Solar and Wind Policies Enabled its Energy Transition A Decade in Review
Figure ES1 Pace of capacity addition in wind and solar projects has slowed down
Source CEA 2019 Growth
of Electricity Sector in
India From 1947-2019
New Delhi CEA MoP
CEA 2020 All India
Installed Capacity as on 31
December 2019 New Delhi
CEA
Private investment has shaped deployment trajectories so far Today solar and wind technologies have advanced supply chains have strengthened and expertise has developed Despite the highs and lows investor confidence in Indiarsquos RE sector continues to remain robust Further many factors favour investments in RE It has proved itself to be resilient in times of crisis including the COVID-19 induced shocks in 2020 There are strong signals that RE is a preferred choice not just because of its green attributes but because of its favourable cost economics for all stakeholders
Evolving policies at the Central and state level have played a significant role in building investor confidence From our study of the evolution of the sector we learn that the initial policies were instrumental in propelling RE growth Every time a roadblock emerged India has been successful in testing and identifying alternate approaches and solutions Some of these innovative approaches include tariff bundling encouraging solar parks to benefit from economies of scale creating payment security mechanisms to address counterparty risks encouraging solarndashwind hybrid parks to improve utilisation factors testing and introducing protocols and mechanisms such as security constrained economic dispatch (SCED) a real-time market (RTM) market based economic dispatch (MBED) and a green term-ahead market (GTAM) to optimise grid integration costs etc However a mixture of legacy issues and recent developments threaten the current business models and existing policies may no longer be sufficient to ensure continued growth of the sector
Both the Central government and the state governments have different spheres of influence (Table ES1) affecting the power sector Hence both Central and state policies need to be studied to understand the functioning and evolution of the sector
Table ES1 Spheres of influence of the Centre and states
Source Authorsrsquo analysis
STATES
Set the broader policy direction for the electricity sector under the Electricity Act 2003 (EA)
Primary responsibility and control over the national grid Setting technical standards for the grid to be maintained by the states
Set bidding guidelines for power procurement
Set renewable purchase obligations (RPOs)
Operate with independence within the overarching framework set by the Centre
Directly influence land availability grid connectivity and build-out of intra-state transmission and distribution infrastructure Determine applicable charges to use infrastructure
Power procurement for supply to consumers
Set tariffs and cross-subsidy levels that affect end consumer and hence consumption of power
CENTRE
ii
Growth rate (wind) Growth rate (solar)
0 0
5000 10
10000 20Inst
alle
d c
apac
ity
(MW
)
Gro
wth
rat
e
1500030
2000040
2500050
3000060
35000
70
40000
80
90
2012-13 2013-14 2014-15 2015-16 2016-17 2017-18 2018-19 2019-20
Wind capacity Solar capacity
9
79
14
56
11
42
81 8276
1521
5 5
30
6
24
Note Figures for 2019-20 are only up to December 2019
iiiExecutive summary
Central policies kickstarting solar but leaving wind behindThe initial drivers for RE capacity addition were fiscal financial and tax incentives like accelerated depreciation generation-based incentives and feed-in tariffs (FiTs) determined by state commissions Wind turbine manufacturers were the first movers The de-licensing of generation under the Electricity Act 2003 (EA) set the stage for private investments in RE However the introduction of the National Solar Mission (NSM) in 2010 brought about a massive jump in solar capacity addition and turned the spotlight to utility-scale RE projects The NSM addressed offtake and payment risks with creditworthy trading intermediaries signing long-term power purchase agreements (PPAs) with project proponents The payment and offtake risks arose from the higher costs of solar power as opposed to prevailing conventional power tariffs and poor financial health of distribution companies or discoms (primary bulk procurers of power) The NSM progressed from a FiT regime to competitive bidding and was successful in increasing solar capacity deployment in the country from just 2 MW in 2007ndash08 to 3744 MW in 2014ndash15 (CEA 2019)
Competitive bidding also became mandatory for wind power from 2017 However it did not see the same level of success as solar While tariffs did come down the rate of growth of wind capacity also reduced (see Figure ES1) because the low tariffs disrupted the business model of existing players who were also equipment manufacturers The future trajectory of wind deployment remains to be seen with solar tariffs continuously falling and the evolution of the models adopted by independent RE power producers
Critical requirements that Central policies have not fully tackled are those of timely procurement of suitable land timely construction of evacuation and transmission facilities and minimising curtailment These are also the areas in which states have significant roles and authority The Ministry of New and Renewable Energy (MNRE) introduced the Solar Park Scheme in 2017 to address land-related issues and fast-track deployment through land aggregation and access to the Central transmission network However the schemersquos target of setting up at least 50 solar parks by 2022 is still distant (MNRE 2020) It has been unable to solve coordination issues and the ability of the Centre in developing schemes to address land issues is limited
Inadequate demand creation mechanisms
Initially in the absence of cost-competitive tariffs large buyers of power were mandated to purchase RE through renewable purchase obligations (RPO) under the National Tariff Policy 2006 in a bid to create demand for RE The EA authorises state regulators to set their own targets and regulations on RPOs In subsequent years the Ministry of Power (MoP) and the MNRE made multiple attempts to nudge states to set higher RPO targets and ensure strict compliance However our analysis shows that there have been considerable lags in both
How Indiarsquos Solar and Wind Policies Enabled its Energy Transition A Decade in Review iv
Figure ES2 State concerns that remain unaddressed in Central policies till 2014 and beyond
Source Authorsrsquo analysis
We find that the reasons for middling compliance with RPO targets are
bull Mismatch between the incentives for a RE-rich state to host an RE power plant and a RE-deficit state to buy either power or RE certificates (RECs) from these power plants This has resulted in RE-rich states having the highest compliance with RPOs while RE-deficit states do not see sufficient benefits or strict enforcement to be pushed to fully comply with their RPOs This has in turn affected the ability of even RE-rich states to increase their rates of deployment and RPO compliance
bull Enforcement mechanisms are weak A framework for regular monitoring of compliance is absent Enforcement of RPO by state regulators is not strict enough
Currently apart from setting up inter-state projects there are no other mechanisms to equitably share the costs of hosting RE projects to supply power to other states Further despite RE tariffs attaining grid parity investors continue to rely on RPOs for demand creation indicating deeper causes obstructing further RE penetration in markets Inadequate compliance of Central policies by states also point to certain legitimate state concerns that may not have been addressed (Figure ES2)
Centre and states have different drivers for promoting REWe also note that the main drivers for promoting RE are slightly different for the Centre and the states While the Centre initially emphasised energy security and climate change mitigation the states were keen to obtain the benefits of private investment and job creation It is only lately that the Centre has also emphasised the job creation and domestic manufacturing potential in RE
Most RE-deficit states are inclined to meet their RPO targets mostly through local deployment even if the local deployment is inadequate to meet the targets This is particularly true for solar which is a more abundant and widespread resource throughout the country State-level RPO regulations compliance provisions participation in REC markets and achievement levels demonstrate this However with stricter enforcement measures and falling tariffs the inter-state transmission system (ISTS) procurement of wind and solar power has seen a rise
Hosting RE plant attracts additional balancing costs This means states do not have incentive to host plants for self-consumption as well as export RE power unless directly connected to the central grid (partially addressed)
Severe financial stress on discoms leading to inability in spending towards compliance of RPOs or maintaining payment security (continues to be unaddressed)
Inadequate representation of state concerns before the Centre for policy making setting national objectives setting RPO targets etc (continues to be unaddressed)
Different drivers for the Centre and the states to incentivize RE
Energy security and climate change drives the Centre while investments job creation and resulting cost of system operation matter for the states (partially addressed)
vExecutive summary
Lack of enthusiasm of states in the high-tariff era
State-level institutions have the power and responsibility to ease land procurement for projects facilitate connectivity to the grid enable the construction of transmission infrastructure and ensure offtake of the power generated from the plants From our analysis of the RE policies of eight RE-rich states and three RE-deficit states we find that policies vary widely on these fronts (Figure ES3)
Pre-2014 when RE tariffs were still quite high the policies of even the RE-rich states did not provide a lot of support to private investors in the sector The responsibility of obtaining land was placed on the developers themselves Even though the states notified their own RE policies they did not meet their targets States like Gujarat and Rajasthan saw considerable capacity deployment under the NSM in this period owing to the easy availability of land and high wind and solar potential Charanka Solar Park in Gujarat set up in 2012 was successful in attracting investors This inspired the push towards establishing more solar parks in the country Because evacuation infrastructure was inadequate state policies required developers to finance and construct the required infrastructure at least till the interconnection point
Figure ES3 Developments across project deployment and operations
Source Authorsrsquo analysis
The RE-rich states covered are Andhra Pradesh Gujarat Karnataka Madhya Pradesh Maharashtra Rajasthan Tamil Nadu and Telangana and the RE-deficit states covered are Bihar Punjab and Uttar Pradesh
HIGH
TARIFF ERA
LOW
TARIFF ERA
RE-rich states
Responsibility on developers
Success of Charanka solar park inspired solar park policy
Developers required to construct evacuation infrastructure upto grid connection point
Feed-in-tariff
Procurement for use only within the state
High curtailment High curtailment
High curtailment
Older RE PPA renegotiations
Low utility-scale RE capacity Evacuation constraints visible in few instances
No policy focus
No policy focus
Feed-in-tariff
Decentralised power emphasised
Competitive bidding
Export of power outside the state begins to be promoted
Fewer new PPAs being signed
Competitive bidding
No focus on inter-state power purchase but procurement from central intermediaries has increased
Fewer new PPAs being signed
Solar parks and facilitation of land procurement
Land availability remains a concern especially for wind
States participating in Centre led transmission infrastructure development However progress is slow
Facilitation of land procurement by state agencies
However land availability remains a concern
No policy focus
RE-rich statesRE-deficit states RE-deficit states
LAND
GRID CONNECTION
POWER PROCUREMENT
MODE
PROJECT OPERATION
How Indiarsquos Solar and Wind Policies Enabled its Energy Transition A Decade in Review
However beyond the interconnection point transmission infrastructure continues to remain a challenge This coupled with the financial difficulties of the distribution utilities led to the severe curtailment of RE power The state policies only incentivised RE project development that supplies power to their own state discoms Some states like Maharashtra Karnataka and Andhra Pradesh even made it mandatory to sell electricity only to discoms within their borders and obligated entities within the state
Lowering tariffs corresponded with increased state promotion of RE but legacy issues came in the way The year 2014 marked the beginning of a significant departure from the past Many developments favoured the RE sector and Central and state policies found greater synergy As RE tariffs fell steeply states moved to incentivise large-scale projects including solar parks They sought to capitalise on investor interest in this sector and states like Andhra Pradesh extended the incentives available to other industry like land allotment facilitation of clearances tax incentives etc to RE power plants There was a shift in focus from setting up projects for self-consumption to supporting projects for the export of power to other states Rajasthan Maharashtra and Andhra Pradesh provided developers with incentives such as time bound open access approval facilitating land procurement exemption on charges etc for setting up inter-state projects States also turned their attention to facilitating deployment and many policies tasked their state agencies with facilitating revenue land procurement for the planned and systematic development of projects
However the PPAs signed in the high-tariff era have become a sore thumb for RE-rich states These agreements which were signed for 20ndash25 years must be honoured by discoms even though cheaper power is available States attempted to push back against these obligations as early as 2014 when Gujarat moved to renegotiate tariffs Andhra Pradesh made the most recent attempt in 2019 These moves by states have added to the set of risks to be mitigated In all these cases the states were ultimately unsuccessful in renegotiating tariffs as their actions were struck down in courts or due to interventions by the Central Government However states continue to employ other means like curtailment to reduce their obligations under expensive contracts Considering that the state bears these costs at the end we need a more equitable solution that can ensure a fair transition for all players without creating uncertainty for investors
In RE-deficit states state policies emphasised decentralised power as opposed to utility-scale projects Their primary drivers were the RPO targets and the potential for private investment For example Punjab and Bihar focused on ensuring payment security and ease of doing business in their states The existing policies of RE-deficit states do not exhibit intention to increase their inter-state purchase of RE for example they do not lay out any roadmap or explicit commitment of procuring power from any of the trading intermediaries like Solar Energy Corporation of India Limited (SECI) or from other states to meet their RPOs Any purchase made is unplanned and this prevents RE-rich states and intermediaries from accurately forecasting demand
Varied and evolving challenges have to be tackled to achieve 450 GW RE target by 2030The existing policies have resulted in tremendous outcomes though short of the targets we set for ourselves As we advance in our energy transition journey it is apt that we incorporate the policy lessons from the journey so far (Figure ES4)
vivivi
Indiarsquos electricity sector is grappling with issues both legacy and novel Legacy issues affecting discom financial health is an obstacle to further growth of the RE sector Further new market and technological advancements like storage and new trading platforms at the doorstep have the potential to bring economy and choice in power procurement and support the energy transition Growth pathways must hence emphasise market-based choices for generation technologies and market-driven procurement and dispatch of electricity
The inhibitions and counterproductive steps of the state governments like renegotiations of PPAs rolling back incentives etc are reflective of genuine operational and financial implications (Figure ES5) State actions show the evolving nature of challenges in RE deployment High tariffs were the initial roadblock which were then followed by infrastructural and operational challenges such as land availability transmission and grid integration issues and other legacy issues that soon became starkly visible
With an increasing share of RE in their energy mix RE-rich states have improved their capabilities to manage RE variability harness system flexibility and forecast and schedule demand and supply However grid integration continues to be a challenge There has been some push-and-pull between state regulators system operators and generators around bearing additional costs relating to forecasting scheduling and deviation settlement The contentions relate to the availability of forecasting methods formulae for penalties the status of aggregation error bands and permissible revisions Forecasting and scheduling add to the costs borne by host states
viiExecutive summary
Figure ES4 Policy lessons from the journey so far
Source Authorsrsquo analysis
NEED TO FACTOR IN DISRUPTIONS IN BUSINESS MODELSInvestment has flown into solar sector due to policy certainty and assurance of opportunities However business models are seeing signs of disruptions Land curtailment and payment risks must be addressed
NEED CENTRE-STATE ALIGNMENTJob creation and value addition are more important considerations for states Mandates and penalties have limited success in encouraging higher deployment in states Institutional mechanisms are required to increase alignment
NEED TO REVIEW WIND SECTORThe introduction of competitive bidding in the sector drove down tariffs but adversely affected the existing industry players in the sector Wind sector needs to be revived Land and resource variability are the most significant risks
NEED REALLOCATION OF COSTS AND BENEFITSThere is divergence between RE-rich and RE-deficient states in deployment and consumption of RE RE-rich states have higher RPO compliance rates We need to account for and allocate the costs benefits and co-benefits of achieving rational targets
NEED TO ALIGN MANUFACTURING AND POWER GENERATIONSingle-minded focus on tariff reduction adversely impacted solar manufacturing Going forward contrasting interests of RE manufacturers and developers must converge
NEED TO PREMPT RISKSPolicies respond to risks rather than anticipate them The interests of incumbents and the overall growth of the sector are no longer aligned Going forward policies need to recognise this reality
POLICY LESSONS
viiExecutive summary
How Indiarsquos Solar and Wind Policies Enabled its Energy Transition A Decade in Review
Policies must pre-empt risks and support transition to a market-driven sectorGoing forward policy decisions must enable the overall growth of the sector rather than target scale through incumbent models The incumbent business models and market mechanisms are at the cusp of disruptions caused due to natural market progression technological advancement and discomsrsquo responses in meeting their challenges (Figure ES6)
Figure ES6 Signals of disruption to the existing business models of investors
Source Authorsrsquo analysis
Figure ES5 Operational and financial challenges in increasing RErsquos share in the energy mix
Source Authorsrsquo analysis
Managing intermittency through forecasting scheduling etc
Land and infrastructure availability and cost
RE growth
Cost-benefit allocation between RE-rich and RE-poor states
Transmission network availability access and cost
Legacy issues expensive PPAs fixed cost payment etc
viiiviiiviii
Distance between our targets and distribution companiesrsquo capacity to offtake eg SECI unable to find buyers This affects growth potential of project developers
Increased adoption of distributed RE including rooftop solar by commercial and industrial players will lead to discoms losing out on high paying consumers further affecting finances
Impact of storage technologies on discom procurement Storage can help manage intermittency and reduce power procurement needs of discoms
Increase in additional costs that developers need to factor in to promote manufacturing RE-waste management managing RE variability etc
States pushing back on their obligations eg Andhra Pradesh attempting to renegotiate contracts This affects financials of existing projects and risk perception for new projects
Changing profile of investors ndash higher returns expectations market consolidation and exit of smaller players Only a few players currently occupy the field with the exit of smaller entities
Developments like MBED RTM GTAM etc show that electricity markets are transitioning towards more short-term and flexible markets Current model of long-term agreements will be unsustainable
Unlocking the demand for RE and capitalising on the immense opportunity that it presents requires innovative solutions that account for legacy issues and yet are forward looking The policies must anticipate these changes and prepare for them while investors need to hedge their bets and modify ways of doing business to continue to lead the energy transition
We recommend the following changes to the policy framework These are based on policy lessons from the study of the sectorrsquos evolution and anticipate the power sector transition that is upon us
bull Centrendashstate and inter-state alignment is essential Collaboration and coordination need to be prioritised instead of mandates and penalties Costs and benefits for all actors must be clearly accounted for An institutional framework must be created that increases Centrendashstate and intrandashstate coordination cooperation and engagement Resource planning budgetary allocations and policy priorities should be outcomes of these formalised processes
bull Institutional framework must build in planning coordination and analytical requirements Data collection management and analysis should be systematic Monitoring and reporting practices should be robust and continuous
bull Addressing counterparty risks will require transformation of RE procurement models Market mechanisms allow for the cost recovery and benefit sharing Capacity deployment must happen based on market mechanisms and market determined price signals PPA terms must reduce and sole priority in power procurement should be efficiency and flexibility for discoms Power procurement as a mechanism to support RE or any future technology will not be sustainable in India till discom finances are sorted out
bull Contrasting interests of RE manufacturers and developers must converge Supply chains must be diverse and resilient to shocks Investors must innovate and policy must support backward and forward integration in RE supply chains
bull Accelerating the flow of capital into the sector requires new investment models that can tap into diverse sources of finance and simultaneously enable the transition of the energy markets
ixExecutive summary ixExecutive summary ixExecutive summary
How Indiarsquos Solar and Wind Policies Enabled its Energy Transition A Decade in Review
Image iStock
Between 2016 and 2018 solar capacity in RE-rich states tripled recording a consecutive year-on-year growth rate of more than 70 per cent
From approximately 21 GW of utility-scale solar and wind capacity at the end of financial year (FY) 2012 (1 GW solar and 20 GW wind) India achieved 70 GW capacity by 31
September 2020 (32 GW ground-mounted solar and 38 GW wind) (MNRE 2020b) This growth story is undoubtedly remarkable Solar and wind energy have also proved to be resilient in times of crisis including during the COVID-19 pandemic in 2020 and have continued to attract investment and attention from policymakers
However the story of Indiarsquos solar and wind power generation is at a critical juncture The rate of growth of capacity addition has been slowing down (see Figure 1) Indiarsquos path to reaching an installed capacity of 160 GW by 2022 (100 GW for solar and 60 GW for wind) and 450 GW by 2030 is hindered by complex challenges They arise from the precarious financial health of distribution companies (discoms) (Garg and Shah 2020) the investment required to build associated infrastructure the dynamics of increasing market penetration of renewable energy (RE) while making fixed cost payments for thermal projects (PEG 2018) direct and indirect energy subsidies in favour of conventional fuels1 and difficulties in balancing the priorities of the Centre and states (Tongia Harish and Walawalkar 2018) Some of these challenges are not new especially the discom crisis and those of inadequate infrastructure However their impact on the growth of RE is significant For instance discoms are finding it challenging to continue to pay fixed costs for thermal assets while complying with the must-run status of RE Forecasting and scheduling are now critical for the integration of variable RE power with the grid These challenges in consuming the power generated from RE plants dissuades discoms from increasing their RE portfolio and hampers revenue from operating assets and further capacity addition These issues must be addressed on a priority basis to scale up RE capacity deployment and utilisation levels New technologies like storage new market platforms and a growing realisation of the benefits of decentralising power generation also have the potential to impact the utility-scale sector in new and unexpected ways
1 Introduction
1
1 These subsidies include oil and gas subsidies and coal subsidies by way of concessional taxes non-compliance or non-enforcement of pollution regulations direct benefit transfers on consumption public distribution at subsidised rates etc (Garg Viswanathan et al 2020)
Storage new market platforms and a realisation of the benefits of decentralising power generation have the potential to impact the utility-scale sector in new and unexpected ways
How Indiarsquos Solar and Wind Policies Enabled its Energy Transition A Decade in Review 2
Figure 1 The rate of growth in solar and wind capacity addition is slowing down (2008ndash2020)
Source CEA 2019 Growth of Electricity Sector in India From 1947-2019 New Delhi CEA MoP CEA 2020 All India Installed Capacity as on 31 December 2019 New Delhi CEA
Before we embark on a policy analysis to determine the best tools to address the above challenges we look back and study the sectorrsquos evolution and evaluate the policiesrsquo impact on RE As RE growth slows and faces newer challenges it is the right time to conduct such an analysis Such an exercise will enable us to understand what are the gaps in the existing policies that need to be mended to adapt to the changing dynamics and yet achieve our objectives The legislative architecture along with a diversity of stakeholders and their objectives and interests makes power sector policymaking and governance a complex space Therefore policy evaluation can be done through multiple lenses This study focuses on the evolving risks for project developers in the bulk RE procurement market and the policy response of the Centre and states to those risks
We focus on the bulk power procurement market because RE growth has been led by utility-scale wind and solar energy projects over this decade with discoms being the largest power purchasers2 While there are dedicated schemes and programmes for the scaling up of other renewable energy sources as well as for distributed RE (DRE) they are of a different nature than those of utility-scale RE since they operate at a more decentralised level3 Further the levels of risk and the challenges facing private investors are markedly different for utility-scale solar and wind on the one hand and distributed and other RE resources on the other However we will briefly discuss the impact of growth of DRE on utility-scale RE in our last section
11 MethodologyWe collated all Central and state policy documents from 2009ndash2019 We then created a comprehensive framework to review each Central and state policy For each policy we recorded the key drivers stated purpose and objectives targets key features and incentives provided budgetary outlays (if any) institutional arrangements beneficiaries stated reasons for amendments and risks that the policy intended to mitigate For Central policies we also identified the role required of the state governments The framework helped us examine the
2 Though the rooftop industry continues to mature with multiple market players innovative business models and new financing structures
3 This is a consequence of the failure to establish competitive markets for RE even though it is among the aims of the Electricity Act 2003 (EA) The gap in the official data which does not capture captive power projects demonstrates this failure
Wind capacity (in MW) Solar capacity (in MW)
0
5000
10000 76679344
1064712807
1689718485
2104323354
26777
3562637746
3404632280
2 2 6 32 941 1686 26323744
6763
21651
28181 34812
1228915000
20000
25000
30000
35000
40000
200
7-0
8
200
8-0
9
200
9-10
2010
-11
Year
Cap
acit
y (in
MW
)
2011
-12
2012
-13
2013
-14
2019
-20
2018
-19
2017
-18
2016
-17
2015
-16
2014
-15
2
This study focuses on the evolving risks for project developers in the bulk RE procurement market and the policy response of the Centre and states to those risks
3Introduction
alignment between Central and state objectives and targets and inconsistencies between and within the policies The key features of the policies we studied are set out in Tables A4ndashA6 of the Annexure We also conducted extensive secondary research to assess the actual performance of these policies actions and developments on the ground and the risks that they addressed
Our study contributes to policy research as it combines a national-level analysis with a close examination of the policies and their impacts at the state level RE resources are not uniformly spread across the country and some states have performed better than others We cover the following RE-rich and RE-poor states in this study
Solar and wind-rich states
bull Andhra Pradesh
bull Gujarat
bull Karnataka
bull Madhya Pradesh
bull Maharashtra
bull Rajasthan
bull Tamil Nadu
bull Telangana
Solar and wind-deficit states
bull Bihar
bull Punjab
bull Uttar Pradesh
The RE-rich states are the top eight in terms of resource potential and capacity addition in wind or solar power or both For the RE-poor areas we have picked states that are not only deficit in solar and wind but also lack alternative power sources like hydro or coal though they have biomass-based power capacity In all these states the power supply position access to energy and power sector infrastructure have evolved over the last decade
In this report we begin by briefly mapping out the institutional framework of the power sector to understand the different agencies that implement andor hinder the implementation of these policies We then trace the evolution of the Central policies which largely focus on supply-side risks Next we evaluate the demand-side measure renewable purchase obligations (RPOs) Subsequently we trace the key drivers and policy focus and evaluate policy performance first in the RE-rich states and then in the RE-deficit states For the state-level analysis we divide our assessment into policies pre- and post-2014 since 2014 marked a departure from the previous years in policymaking activity and its consequences We assess the policies based on the risks they were successful in addressing the risks that they left unaddressed and how they measure up to the next generation of challenges We conclude by pointing to the points of transformation of the sector and the nature of required policy focus going forward
We assess the policies based their success in addressing risks the risks they left unaddressed and how they measure up to the next generation of challenges
How Indiarsquos Solar and Wind Policies Enabled its Energy Transition A Decade in Review
12 Institutional framework The long history of policymaking in the power and RE sector has led to a proliferation of agencies and bodies (see Table 1) The legislative architecture under the Electricity Act 2003 (EA) allows states to autonomously undertake activities such as target-setting framing and enforcing regulations developing and implementing policy and setting up institutional mechanisms
However the Central Government sets the policy direction through its National Electricity Policy the National Tariff Policy and the National Electricity Plan which the state governments and regulators are required to follow These policy documents cover electricity planning project bidding and procurement tariff structures RPOs and optimum utilisation of resources and infrastructure
The Central Electricity Regulatory Commission (CERC) and state electricity regulatory commissions (SERCs) have parallel jurisdictions and functions with respect to promoting the generation of RE tariff determination and dispute resolution Typically CERC does not have the authority to provide policy guidance or issue directions to the SERCs However SERCs are bound by the technical rules guidelines and standards set by the CERC in the Indian Electricity Grid Code (IEGC) based on which they prepare their own state grid codes
Table 1 The institutional structure of the power sector
Source Authorsrsquo analysis
Regional and State Union Territory level
Central
Ministries
Statutory autonomous bodies
Regulators
Operating entities
Ministry of Power (MoP)ndashNodal ministry for the power sector Prepares the National Electricity Policy the National Tariff Policy and the National Electricity Plan
Ministry of New and Renewable Energy (MNRE)ndash Nodal ministry for increasing RE deployment in the country
Central Electricity Authority (CEA)
National Load Dispatch Centre (NLDC)
Bureau of Energy Efficiency (BEE)
Power Financial Corporation (PFC) REC Limited Indian Renewable Energy Development Agency (IREDA)ndash Provide financing and implement schemes for RE projects
National Institute of Wind Energy (NIWE) National Institute of Solar Energy (NISE) Central Power Research Institute (CPRI) etcndash Research and development institutes to estimate RE potential in the country and evaluate the latest technologies in power generation
Central Electricity Regulatory Commission (CERC)ndash Tariff determination dispute resolution preparing the Grid Code and Supply Code (to be followed by the operating entities) promote RE etc
Appellate Tribunal for Electricity (APTEL)ndash Appellate body for dispute resolution
Generation utilities eg NTPC NHPC Damodar Valley Corporation (DVC)
Transmission utilityndash Power Grid Corporation of India Limited (PGCIL)
Independent power producersndash projects connected to the Central grid
TradingMarket entitiesndash NTPC Vidyut Vyapar Nigam (NVVN) Solar Energy Corporation of India (SECI) etc
Relevant energy departments and ministries of the states union territories (UT)
Regional Load Dispatch Centres (RLDC)
Regional Power Committees
State Load Dispatch Centres (SLDC)
state nodal agencies (SNAs)ndash implement RE schemes and oversee RE deployment at the state
State Electricity Regulatory Commissions (SERC) and Joint Electricity Regulatory Commissions ( JERC)ndashTariff determination dispute resolution preparing the grid code and supply code (to be followed by the operating entities) promote RE etc
Generation utilitiesndash state-owned generators
Transmission utilities
Distribution utilities
Independent power producersndash projects connected to state grids
Tradingmarket entities
4
The trajectories of wind and solar have been varied yet have affected each other Often similar policies have had widely varying impact on wind and solar This section briefly
describes the policy scenario pre-2010 and then narrates the policy evolution in the last decade (See Table 2 for brief description of the policies) The section concludes with the assessment and lessons from this journey
21 Pre-2010 ndash private-sector participation and prioritising renewables The initial drivers for new and renewable energy were the successive oil crises in the 1980s that compelled the government to reduce the countryrsquos dependence on imported oil and focus on alternative sources of power RE was also one of the strategies to combat climate change
2 Evolution of Central policies
Image iStock
5
How Indiarsquos Solar and Wind Policies Enabled its Energy Transition A Decade in Review
The government has made accelerated depreciation (AD) of 100 per cent available for both wind and solar power generation since 1994 to incentivise RE capacity deployment
The enactment of the EA also intended to transform the state-controlled electricity sector into a competitive electricity market with private players regulated by the state (Kumar and Chatterjee 2012) Promoting environmentally benign policies is a stated objective of the EA and it envisages renewable sources of energy as a significant contributor to the electricity mix The de-licensing of electricity generation under the EA and the mandating of power procurement through competitive bidding under the National Tariff Policy 2006 (NTP 2006) were game-changing reforms towards increasing private-sector investments in power generation The NTP 2006 permitted discoms to procure RE at tariffs fixed by their respective SERCs also called feed-in tariffs (FiTs)4 The SERCs determined the FiTs based on their tariff determination regulations Central regulations in turn guided these regulations The CERC notified the first guidelines for tariff determination in 2009 [(CERC (Terms and Conditions for Tariff Determination from Renewable Energy Sources) Regulations 2009) (Tariff Determination Regulations)] The first generic tariff order determined utility-scale solar PV tariff of INR 1844 and wind power tariffs of INR 563 490 417 and 375 (for Wind Zones 1 2 3 and 4 respectively)5
The policiesrsquo cumulative effect was that by 2010 RE accounted for 97 per cent of the available installed power generation capacity in the country (MoP 2010) This capacity was mainly wind energy and bagasse-based cogeneration6 Successful demonstration projects led by the ministry and collaborations with global technology providers were key triggers of establishment of domestic manufacturing and supply chain in India (Ganesan et al 2014) The AD incentive was particularly useful for private entities who set up distributed and small-scale wind turbines to avail of it This domestic demand also supported development of wind manufacturing capacity in India (Sud 2015 Idam Infra 2016)
Solar power however was lagging Despite the available incentives there were no immediate responses from investors developers and most state governments primarily due to high technology costs Till March 2010 solar capacity remained at 6 MW Subsequently significant policy actions leading to cost reductions and investment commitments marked an upward growth trajectory (see Figure 1)
Table 2 Evolution of Central policies for utility-scale wind and solar energy ndash 2010ndash2019
Source Authorsrsquo analysis
Risks and barriers targeted to be mitigated benefits TechnologyPolicyscheme
Promotion of RE competitive bidding and RPO in National Tariff Policy 2006
National Solar Mission 2010
National Action Plan on Climate Change 2008
Wind
Solar
Creating demand for expensive RE power through RPOs
Policy certainty and continued government support for promotion of RE
Managing offtake risk by signing long-term power purchase agreements (PPA) and providing payment security
Policy certainty and continued government support for promotion of RE
Creating demand for expensive RE power through RPOs
Policy certainty and continued government support for promotion of RE
4 This flexibility was required because RE tariffs at this time could not be compared to those of conventional power However the NTP 2006 also noted that RE power would eventually have to compete with power from other sources at their full cost
5 Order dated 3 December 2009 issued by CERC in Petition No 2842009 titled Determination of Generic Levellised Generation Tariff httpwwwcercindgovin2009November09284-2009_final_3rdDecember09pdf
6 Due to its economic co-benefits bagasse-based cogeneration developed mostly in the sugar producing regions of India
6
Table 2 contdRisks and barriers targeted to be mitigated benefits
TechnologyPolicyScheme
GBI for grid interactive wind power projects 2009 and 2013
NSM Phase II Batch I 2013 (VGF Scheme)
Scheme for solar park development 2014
National Tariff Policy 2016
Commencement of competitive bidding in wind 2016
MNRErsquos policy for re-powering wind projects 2016
Financial incentives for setting up wind power projects
Managing offtake risk by signing long-term PPAs and providing payment security
Low tariffs for discoms through competitive bidding
Financial support for project developers
Delay and roadblocks in land identification aggregation and acquisition
Delays in obtaining approvals and clearances
Risk of conflict with environment or social impact assessment
Lowering cost of supporting infrastructure and services
Creating demand for RE by setting common national trajectory for RErsquos share in consumption
Managing offtake risk by signing long-term PPAs and providing payment security
Low tariffs for discoms through competitive bidding
Support to utilize wind resources efficiently
NSM Phase I Batch II (Bundling scheme) 2011
Green Energy Corridor project 2013
NSM Phase II Batch III 2015
NSM Phase II Batch IV (State specific VGF scheme) 2016
MoPrsquos order on waiver of inter-state transmission charges and losses 2016
Competitive bidding guidelines for solar 2017
Managing offtake risk by signing long-term PPAs and providing payment security
Lowering tariff for discoms by bundling thermal and solar power
Addressing transmission risk and offtake risk by reducing congestion on grid
Managing offtake risk by signing long-term PPAs and providing payment security
Low tariffs for discoms through competitive bidding
Managing offtake risk by signing long-term PPAs and providing payment security
Low tariffs for discoms through competitive bidding
Financial support for project developers
Financial incentive for export of power outside the state
Managing offtake risk by signing long-term PPAs and providing payment security
Low tariffs for discoms through competitive bidding
Must-run status in Grid Code 2010
Introduction of renewable energy certificates (REC) 2010
Addressing transmission and curtailment risk
Creating mechanism to broaden the demand base
7Evolution of Central policies
How Indiarsquos Solar and Wind Policies Enabled its Energy Transition A Decade in Review
22 Post-2010 policies for solar The Jawaharlal Nehru National Solar Mission (NSM) notified in January 2010 was a turning point in the RE story The NSM was one of eight missions developed as part of Indiarsquos National Action Plan on Climate Change (NAPCC) Its primary objective was to develop and deploy solar energy technologies including utility-scale distributed solar and solar thermal energy It targeted the entire ecosystem of solar energy deployment and included measures to support research and development human resource development the increase of technical capacity and awareness of these technologies Such measures included providing technical assistance training customs and excise duty concessionsexemptions on capital equipment critical materials components and project imports ease of doing business and enabling domestic manufacturing through exemptions and incentives The NSM laid out a phase-wise approach until 2022 that brought about policy certainty
The risks for investors and financiers were considerable The upfront costs were high while returns were not guaranteed (since the technology had not yet proven its track record within India) Further even if discoms were willing to sign power purchase agreements (PPAs) low connectivity and transmission capacity hindered offtake However more significant was the payment risk arising due to the poor financial health of discoms The payment risk adds as much as 107 per cent of the additional risk premium to the cost of debt (Atal and Shrimali 2018)
To counteract the payment risk the NSM devised an arrangement whereby NVVN (NTPC Limitedrsquos trading arm) would purchase power from the solar developer for onward sale to state discoms under a power sale agreement (PSA) The standard PSA included a clause stating that in case the discom failed to make timely payments NVVN could invoke the tripartite agreement signed by the Central Government the relevant state government and the Reserve Bank of India (RBI)7
The NSM envisaged that the key driver for promoting solar power would be the RPO mechanism with the FiT and PPA duration determined by the CERC It aimed to achieve parity of solar and coal tariffs by 2030
NSM was to be implemented in three phases The target for Phase I which lasted till 2013 was 1000 MW The initial target of 20 GW was increased to 100 GW in 2015 to be achieved by December 2022 As of November 2020 3691049 MW of solar power capacity has been installed (MNRE 2020b)
Competitive bidding guidelines for wind 2017
Managing offtake risk by signing long-term PPAs and providing payment security
Low tariffs for discoms through competitive bidding
MoP and MNRErsquos order on opening and maintaining adequate LC as PSM under PPAs by distribution licensees 2019
Addressing payment risk from discoms
7 Article 648 of the Standard Draft PSA between NVVN and Distribution Utility (2010) httpwwwnvvncoinDRAFT20PSA_NVVN-Discom_March2029202010pdf In case a state discom defaulted on any payment obligations NVVN could invoke this agreement and the pending dues could be routed to it through the RBI The Centre can then deduct the relevant amount from the annual fund transfers from the Centre to the state which is the most significant source of state government revenue
Table 2 contd
88
Phase IThe guidelines to operationalise the first phase of NSM were notified in July 2010 Many projects had already begun construction before this notification Such projects were permitted to migrate to the NSM and sign PPAs with NVVN The NSM selected fresh projects based on the discounts that the developers were offering on CERC-approved tariffs applicable as of the date of submission of their applications These projects needed to be commissioned within 12 months of the developers signing the PPA In Phase I the NVVN could bundle unallocated conventional power procured from the NTPC and sell it to discoms to average the tariffs
For payment security the standard PSA required the buying utility to open a six-month letter of credit (LC) backed by an escrow account in favour of NVVN Further under an order dated 30 June 2011 the MNRE created a separate payment security fund of INR 486 crore However despite the implicit state guarantee transaction advisers suggested that investors be cautious The standard PPA was not considered bankable (Sustainability Outlook 2010 Jog 2013) High project costs and unproven technology increased the risk Developers were also concerned that the PPA prices could be reduced during its duration
Additionally domestic content requirement (DCR) that required polycrystalline photovoltaic (PV) cells and modules being used to be manufactured in India was imposed on NSM projects The DCR distorted the market towards other PV technologies like thin film (Paliwal and Hamberg 2015) and adversely affected the existing manufacturing base in India that predominantly manufactured polycrystalline PV DCR would have constrained developersrsquo technology choices and did not benefit the domestic manufacturers (Ganesan et al 2014)
The government eventually withdrew DCR after failing to defend the move before the World Trade Organisation (WTO) in a dispute initiated by the United States of America in 2013 on grounds that DCR was discriminatory against imports under the lsquoNational Treatmentrsquo principle (WTO 2016)
Phase I was successful in achieving its target of installed capacity of 1000 MW of grid connected power It also served to demonstrate the technology and the intermediary arrangement under the NSM However even before the Phase II guidelines were notified developers and financiers raised concerns about delayed payments To manage this risk the lenders demanded that NVVN be made a beneficiary of the tripartite agreement (Jog 2013)
Phase II
The Solar Energy Corporation of India Limited (SECI) was designated as the implementing agency for Phase II SECI a public-sector company is an electricity trading licensee and signs PPAs with developers to purchase power for on-sale to discoms and other consumers In February 2017 SECI became a beneficiary of the tripartite agreement between the Government of India state governments and the Reserve Bank of India Consequently ICRA Limited (a credit rating agency) enhanced SECIrsquos credit rating from AA- to AA+ This increased the bankability of SECI projects SECI was required to create a payment security fund of INR 500 crore to cover for three monthsrsquo payment By 2014 SECI received bids worth 2170 MW under reverse bidding conducted by it and signed PPAs and PSAs with state discoms (SECI 2014) Phase II focused on providing viability gap funding (VGF) to project developers However the utility of the VGF initiative is questionable as the actual expenditure of the committed funds progressively declined across the various schemes (see Table 3) After the notification of the
9Evolution of Central policies 9Evolution of Central policies
JNNSM Phase I was successful in achieving its target of 1000 MW grid-connected power However developers and financiers raised concerns about delayed payments even before the notification of Phase II guidelines
How Indiarsquos Solar and Wind Policies Enabled its Energy Transition A Decade in Review
Table 3 Snapshot of VGF schemes
Source Authorrsquos adaptation from MNRE 2020 Annual Report 2019ndash20 New Delhi MNRE and SECI 2019 8th Annual Report 2018ndash19 New Delhi SECI
Allotted and commissioned capacity
VGF per MW Estimated expenditure (in INR crore)
Actual expenditure (in INR crore)
Bidding parameter
TariffYear NSM Phase II batch
2013
2016
2015
750 MW Batch I
Phase II Batch IV
2000 MWBatch III
Discount on VGF
Discount on VGF or tariffAfter 2017 ndash only tariff
Discount on VGF or tariff
INR 545 per kWh INR 475 with AD
No fixed tariff
INR 443 per kWh for the first year annual escalation of INR 005 kWh for the next 20 years with the maximum tariff capped at INR 643 kWh
680 MW
Awarded 3420 MW (as on 31 December 2019)2470 MW capacity commissioned in the states of Gujarat Odisha Maharashtra Rajasthan UP Andhra Pradesh (Kadapa Solar Park) and Karnataka (Pavagada Solar Park) (as on 31 December 2019)
Awarded 2155 MW2295 MW capacity reported as commissioned in the states of Andhra Pradesh Chhattisgarh Karnataka Maharashtra and Uttar Pradesh at both solar park and non-solar park locations (as on 31 December 2019)
The lower of INR 25 crore and 30 per cent of project cost
INR 1 crore for open category
125 for DCR projects
The lower of INR 25 crore and 30 per cent of project cost
1875
5050
1875
742
19163
742
Phase III Phase III of the NSM is currently underway The target is to achieve 100 GW of cumulative solar capacity by 2022 The bidding is conducted under the Solar Bidding Guidelines Various intermediary procurers are participating in conducting the auctions including SECI NTPC and NHPC Limited As of March 2020 solar capacity of 2135 GW was under various stages of implementation and 3127 GW was under different stages of bidding (ETEnergyWorld 2020)
23 Impact of other policies on project deploymentAfter the high-growth period of 2016ndash2018 capacity addition slowed in 2018ndash19 which was a cause for concern It represents a break in the growth momentum There are multiple contributory factors for the slowdown
Guidelines for Tariff Based Competitive Bidding Process for Procurement of Power from Grid Connected Solar PV Power Projects (Solar Bidding Guidelines) in 2017 tariff became the sole bidding parameter and VGF fell into disuse
1010
The introduction of the Goods and Services Tax (GST) in 2017 created considerable confusion and administrative challenges8 It decelerated the growth momentum and raised project costs by 10ndash15 per cent (Soman et al 2019) The imposition of safeguard duties on imports of solar cells and modules from China and Malaysia was introduced in 2018 Eventually these costs were made good to the project developers by their PPA counterparties under the lsquochange-in-lawrsquo clause of the PPA However the uncertainty surrounding its timeline increased cost of procuring components from exempted jurisdictions and litigations before the regulatory commissions to get the duty adjudged as change-in-law added to the costs of under-construction projects and delayed new projects (Thomas 2018 Jai 2018) Payment delays by discoms renegotiation threats curtailment tariff ceilings on bids etc also caused many investors to delay their investment decisions and many SECI tenders were undersubscribed (Buckley and Shah 2020 Chatterjee 2019) Tariff ceilings were removed by MNRE in March 2020 to revive investor interest
Lately SECI has struggled to find buyers for the auctioned capacity For example under a manufacturing-linked solar auction conducted in January 2020 SECI is yet to sign the PPA even after 10 months of awarding the project because it is unable to find buyers for the power (Reuters 2020) This development shows the signs of stress and limits to the NSM model for RE growth
24 Solar Park Scheme
Land procurement in India is hugely complicated with challenges ranging from the legal to the political (TERI 2017) For developers private procurement is expensive and time-consuming This is evidenced by the consecutively increasing time limit for obtaining possession under the NSM In Phase I 180 days was the time limit in Phase II Batch I the time limit was increased to 210 days and currently developers must show possession only at the time of commissioning the project
As the number of RE projects increases we are witnessing more acute problems in relation to the acquisition of land (Tenddulkar 2019) Land is however a state subject and the Centre has limited scope to enable easier land procurement To facilitate economies of scale and support systematic planning and deployment in 2014 the MNRE launched a first-of-its-kind scheme to develop ultra-mega solar parks In 2017 the target under the scheme was enhanced from 20000 MW to 40000 MW with an objective to set up at least 50 solar parks by 2022 (MNRE 2020a) Under this scheme solar park developers can acquire land obtain the necessary permissions and build the required infrastructure including evacuation infrastructure for the capacity to be housed within the park As of December 2019 the MNRE had approved 39 solar parks with a total capacity of 22879 MW across 17 states (MNRE 2020a)
8 The GST is supposed to be an integrated tax on both goods and services In the earlier tax regime goods and services were taxed separately (exciseimport dutiesVAT on goods and service tax on services) For RE the cells and modules are taxed at 5 per cent while services attract an 18 per cent GST rate However for RE works contracts (ie the engineering procurement and construction contracts) the supply of equipment necessary for setting up a power plant and the service component (ie the actual setting up of the plant) are difficult to segregate The government eventually fixed a 7030 ratio for the goods and services components of the contracts respectively (William 2020)
11Evolution of Central policies 11Evolution of Central policies
After an impressive growth period between 2016ndash18 various factors in addition to counterparty risks such as introduction of GST and safeguard duties on imported cells and modules led to change-in law cases delaying projects as well as investor decisions
How Indiarsquos Solar and Wind Policies Enabled its Energy Transition A Decade in Review
25 Post-2010 policies for wind The NSM defined solar power development while wind policies followed a separate trajectory till late 2016 The flip-flops of the Central Government in withdrawing and re-introducing benefits such as AD and generation-based incentives (GBI) had adverse effects on wind capacity addition 100 per cent AD was introduced in 1994 AD was reduced to 80 per cent in 2002 GBI was introduced in 2010 Both AD and GBI lapsed in 2012 but were reintroduced in 2013
Wind power was brought into the competitive bidding regime with the 2016 interstate transmission system (ISTS) wind scheme for 1000 MW and the notification of the Guidelines for Tariff Based Competitive Bidding Process for Procurement of Power from Grid Connected Wind Power Projects in 2017 (Wind Bidding Guidelines) SECI floated the first tender for ISTS wind in OctoberNovember 2016 it concluded in February 2017 and PTC India Limited signed the PPAs (Saumy 2017)9 The bidding procedure and guidelines were similar to those conducted for solar energy It helped bring tariffs down from INR 416ndash602 FiT to INR 346 (see Figure 3) The primary reason for the lower tariff was reduced counterparty risk (CRISIL 2017) with competition driving down tariffs even lower
Figure 2 The pace of solar park development under the Central scheme has been slow (as on 31 December 2019)
Source Authorsrsquo adaptation from MNRE 2020 Annual Report 2019-20 New Delhi MNRE
9 Order dated 3 December 2019 issued by CERC in Petition No 340AT2019 titled PTC India Ltd v SECI and Ors httpwwwcercindgovin2019orders340-AT-2019pdf
0
5000
10000
40000
22879
103207767
15000
20000
25000
30000
35000
40000
45000
50000
Solar park status
Target capacity
Approved capacity
Capacity of fully or partially
operational parks
Commissioned capacity
Cap
acit
y (in
MW
)
12
Figure 3 Competitive bidding in wind brought down the tariffs significantly
Sources FiT orders Order dated 15 May 2014 issued by CERC in Petition No SM3542013 (Suo-Motu) titled Determination of generic levellised generation tariff for the FY 2014-15 Order dated 31 March 2015 issued by CERC in Petition No SM0042015(Suo-Motu) titled Determination of generic levellised generation tariff for the FY 2015 - 16 Order dated 30 March 2016 issued by CERC in Petition No SM032016 (Suo-Motu) titled Determination of levellised generic tariff for FY 2016-17 Auction tariffs from India RE Navigator 2020 ldquoAuction Resultsrdquo Accessed November 28 2020 httpsindia-re-navigatorcomwind
After the discovery of these lower tariffs even under-construction projects were brought within the bidding regime or else their tariffs were renegotiated The reduced tariffs led to reduced margins and concerns that the existing thriving ecosystem which was driven by original equipment manufacturers (OEMs) is collapsing10 After 2017 there was a sharp decrease in the rate of growth of capacity additions (see Figure 1) leading to unsold inventory with the OEMs Discoms were no longer willing to sign PPAs on FiTs and the pace of bidding failed to keep up with expectations
Further because of the low tariffs it has become essential that the developers set up projects in high wind density sites Land has hence become the most crucial element of investment decisions in wind However state policies have not been very conducive in this aspect The consequent delays in setting up projects is further affecting wind OEMs (Dutt Arboleya and Gonzalez 2020) Since the introduction of competitive bidding in wind 191 GW has been auctioned but only 145 GW has been awarded In 2020 the wind bids have been linked to storage blended with solar or been part of hybrid projects Bidding was particularly constrained in 2019 were 5400 MW was tendered but only 2720 MW was awarded (India RE Navigator 2020)
10 This is evidenced by the stressed balance sheets of major wind OEMs including Suzlon and Inox and the exit of Senvion from the Indian market The number of OEMs has reduced from 14 to 5 (Arora 2019) Thin margins are a feature of the entire RE sector however specifically in case of wind competitive bidding and the resulting low tariffs caused a disruption to the existing ecosystem of the industry
0
1
2
576 598 601
346264 243 244 2513
4
5
6
7
FiT 2014ndash15
FiT 2015ndash16
FiT 2016ndash17
SECI February
2017
SECI October
2017
GUVNL December
2017
SECI February
2018
SECI April 2018
CERC determined FiT Auction
Tari
ff (I
NR
per
kW
h)
13Evolution of Central policies
How Indiarsquos Solar and Wind Policies Enabled its Energy Transition A Decade in Review
Land riskLand availability constitutes a major challenge for developers and causes significant project delays The development of solarRE parks provided comfort to developers and led to the realisation of economies of scale However as against the solar park target of 40000 MW by 2022 as of December 2019 only 7767 MW have been commissioned (see Figure 2) Solar park development comes with a chicken-and-egg problem Without committed projects it is expensive to develop solar parks but once projects are awarded solar park development cannot take place within the time provided for project commissioning since solar parks require a longer time for construction Furthermore because solar parks require even greater parcels of land chances of land conflicts are higher While states such as Rajasthan and Gujarat have fared well because of the presence of abundant wastelands others such as Andhra Pradesh (eg Kadapa and Ananthapur) and Karnataka (eg Pavagada) have all faced land conflicts Other issues that developers face relate to the quality of the land ancillary infrastructure and upfront and operation and maintenance (OampM) fees Proposed solar park projects have been cancelled because of unexpectedly high bid tariffs (Seetharaman and Chandrasekaran 2019) Though there have been success stories like the Rewa Solar Park (Bhaskar 2020) we need better planning and coordination between the Centre and the states to mitigate land-related barriers and risks
Curtailment and evacuation risksRE faces a high degree of curtailment risk (Aggarwal and Chawla 2019) The Grid Code 201011
(Grid Code) which must be followed by all states grants a must-run status to power generated from wind and solar plants This means that utilities and system operators must prioritise evacuation of power from must-run plants unless there are grid unavailability security or
11 Clause 52 (u) of the Grid Code
141414
26 Policy assessmentWe now briefly discuss some of the continuing structural risks that the above policies have failed to address or inadequately addressed and surmise the policy lessons from the Central policies (See Table 4 for Indiarsquos project pipeline to achieve the targets)
Table 4 Indiarsquos progress towards 175 GW renewable energy by 2022
Source Amitesh Sinha 2020 ldquoIndiarsquos Ambition and Opportunities in Solar Manufacturingrdquo Presentation India PV Edge 2020 Virtual conference 6 October
Under implementation
(GW)
Tendered (GW)
Total (installed +
pipeline)
Target (GW)
Installed capacity
(GW)
Sub-sector
Solar
Biomass
Total
Windndashsolar hybrid
Wind
Small hydro
RTC assured peak power supply
100
10
175
60
5
3574
1003
88511 4511 2843 16205
825
474
3336
0
144
825
046
16
2066
0
12
157
0
5
8976
1003
264
4782
52
66
safety constraints However commercial considerations grid unavailability and technical grid security concerns lead to curtailment which translates to revenue loss for developers Curtailment could contribute to 14 per cent of the risk premia (Atal and Shrimali 2018)
In the early set of PPAs there was no provision to compensate generators in case of backdown of power However the Solar Bidding Guidelines and the Wind Bidding Guidelines incorporated provisions that require the power purchaser to compensate the generator in case of backdown for reasons other than technical constraints However must-run status has not been as effective as intended and the risk of curtailment persists
Further as RE deployment grows problems arising out of the inadequacies of the evacuation infrastructure assume greater proportions The problem is compounded by the need for transmission infrastructure to be in place before an RE project is conceptualised because the infrastructure takes up to five years to complete while RE projects typically take between 12ndash18 months to launch (H Singh 2017)
A functioning ISTS is also essential as it helps diffuse the costs and benefits of RE across the country and can enable effective implementation of the RPO Hence inter-state transmission charges and losses have been exempted since 2016 and will continue to be exempted till June 2023 Policymakers recognised this problem early on and PGCIL proposed a transmission plan for the envisaged RE capacity in 2011 dubbed the Green Energy Corridor A loan-plus-grant mechanism was devised to fund inter- and intra-state transmission corridors in 2015 However this programme does not address the incentive problem ndash it requires the states to cooperate and take the initiative to submit project proposals for obtaining grants provide last-mile connectivity and improve their own transmission infrastructure There is not enough incentive for RE-rich states to spend money to build the required infrastructure There is no clear accounting or evidence of the benefits that a RE-rich state government will receive if it allocates money and human resources for this purpose
Further there is no transparent data published on curtailment duration curtailing entities and reasons for curtailment So far generators have pooled their data and been able to demonstrate evidence of curtailment However no one knows the exact reasons for such curtailment It is hence difficult to analyse the predominant causes and accordingly frame a policy response
Payment riskAs we have just discussed assured offtake at a fixed tariff for the lifetime of the project helped investors tide over the risks of adopting a new and untested technology and helped increase the scale of these projects
While payment obligations were assured on-time payments remain a concern Delayed payments affect investor returns and project cash-flows adversely Most PPAs have provisions that require the purchaser to create a payment security mechanism (PSM) Opening letters of credit (LC) is the most common PSM However there is widespread non-compliance of this provision SECI had not created any LC under any of its PPAs (though it has a good track record of payment) (Economic Times 2019) As a solution in June 2019 the MoP directed the NLDC and the SLDC to dispatch power only after an LC had been opened for the power
15Evolution of Central policies 15Evolution of Central policies 15Evolution of Central policies
Any transmission infrastructure expansion programme needs to solve for the incentive problem facing the states
How Indiarsquos Solar and Wind Policies Enabled its Energy Transition A Decade in Review
being scheduled The discom would also be liable to pay full tariff on the power that is not scheduled The concerned discom was also precluded from purchasing power from the power exchange and getting a short term open-access (STOA) (MoP 2019) This move essentially brought system operators into contract enforcement which ideally should be beyond their remit Apart from this drawback in the design according to feedback from the developers the move did not change anything on the ground However it has had only one year of effective operation since once COVID-19 struck MoP partially rolled back the directive till 30 June 2020 and permitted scheduling of power even if the PSM was reduced by 50 per cent (MoP 2020b)
Policy lessonsThe success story so far has made India a dominant force in the RE space globally It was able to leverage its growing market and even take leadership on global initiatives like the International Solar Alliance After the implementation of the NSM solar power deployment increased exponentially Further the competitive bidding regime introduced first in solar and then for wind was successful in driving down tariffs
However existing policies are not sufficient to address risks arising from the structural pathologies of the electricity sector and the changing nature of barriers and risks With RE prices falling it may seem that RE procurement would be the natural choice for discoms However discoms hold-out on signing PPAs with the expectation that tariffs would fall even further with each passing auction (Prasad 2020) Deep-rooted issues such as the procurerrsquos obligation to pay fixed costs under long-term PPAs inadequate demand-supply planning and skewed fuel subsidies distort the market Further policies that burden the discoms further like the LC requirement have no real impact on the ground
Tying discoms down in long-duration PPAs reduces their ability to respond to new market developments and forces them to procure at above-market costs posing a greater risk for the sector in the long term While these policies may work for project developers in the short term they do not make the most commercial sense for discoms The fixed cost payment issue is one such example Technologies like storage and introduction of market platforms have the potential of bringing in economic efficiencies in discom procurement strategies (CERC 2018) Hence a variation in procurement strategy for discoms is imminent and policies must enable them Such variation is already visible in the thermal markets where MoP has commenced medium-term power procurement Resistance from incumbent market players is expected and must be addressed for a transition that works for all stakeholders
Further the policy framework till now has a serious gap in data collection and transparency There is lack of data on project-specific information on generation technology selection etc Detailed data on these aspects could have informed policy activity on cost and technology bringing in greater efficiencies The Centre has the mandate to formulate policy in this regard and must make up for the lost time
161616
India is a strong force in the global RE space However existing policies are not sufficient to address the deep-rooted issues and evolving nature of risks inhibiting a natural transition to RE
The NSM Solar Park Policy and other fiscal incentives are supply-side measures targeted at reducing investment risks However a measure to create demand was essential because
RE was considerably more expensive than conventional power in 2010 Demand for RE was created through the RPO mechanism
The EA enabled state regulators to specify a minimum purchase obligation Section 86(1)(e) of the EA requires the SERCs to ldquopromote cogeneration and generation of electricity from
3 Renewable purchase obligations ndash a regulatory mechanism for creating demand
Image iStock
171717
How Indiarsquos Solar and Wind Policies Enabled its Energy Transition A Decade in Review
renewable sources of energy by providing suitable measures for connectivity with the grid and sale of electricity to any person and also specify for purchase of electricity from such sources a percentage of the total consumption of electricity in the area of a distribution licenseerdquo
The NTP 2006 required the SERCs to fix the RPOs ldquotaking into account availability of such resources in the region and its impact on retail tariffsrdquo In the absence of any fixed target or specific obligation only a few states notified the purchase obligations The initial movers were Gujarat (2005) Kerala (2006) Rajasthan (2007) and Madhya Pradesh (2008)
Fixed targets were set for the first time under the NAPCC which prescribed that RE (including bioenergy and small hydro) should account for 5 per cent of total grid purchase in 2010 which would increase to 15 per cent by 2020 with a one per cent increase each year In 2011 the NTP 2006 was amended to include a minimum RPO of 025 per cent for solar power by the end of 2012ndash2013 and 3 per cent by 2022
During 2010ndash2012 many states notified their respective RPO regulations This activity was most likely driven by the increased government and investor focus on RE after the introduction of the NSM The obligated entities ie the entities on whom the RPOs were imposed were discoms captive consumers and open-access consumers
The policymakers were however cognisant of resource variability across the different states To bridge the resource gap and ensure sustained demand for RE they enabled the issuance and trading of renewable energy certificates (REC) Under the REC mechanism registered RE generators receive one REC against one MWh of energy they produce12 The power component is sold separately to discoms and open-access consumers at the average power purchase cost (APPC) or a mutually agreed price respectively The RECs are categorised into solar and non-solar RPOs These RECs can be put up for sale in power exchanges where they can be bought by obligated entities and voluntary buyers or retained by the generator to meet their own RPOs (the latter was allowed from 2013) The CERC periodically fixes a floor price and forbearance price and the trading occurs within this price band
31 Setting RPO targets
The RPO targets notified by states are set out in Table A1 in the Annexure As is evident statesrsquo RE ambition varies widely and there was considerable variance between them and the NAPCC targets Karnataka Tamil Nadu Maharashtra and Rajasthan set relatively high targets while Andhra Pradesh Bihar Madhya Pradesh and Uttar Pradesh set quite low targets
The trajectory set out in the NAPCC did not have any legally binding value on the SERCs and the states were technically free to determine their RE targets However their targets were inadequate to achieve national policy objectives
To address the inadequacy of the RPO targets the NTP was revised in 2016 enabling the Ministry of Power (MoP) to notify a common trajectory from 2016ndash17 to 2018ndash19 The MoP has notified the RPO trajectory up to FY 2021ndash22 (Table 5) (MoP 2016 2018) Since then states must align their trajectories to that set by the Central Government
12 The detailed procedure for all matters relating to RECs is set out in the CERC (Terms and Conditions for Recognition and Issuance of Renewable Energy Certificates for Renewable Energy Generation) Regulations 2010 (REC Regulations) The first solar and non-solar RECs were issued in May 2012 and March 2011 respectively
18
In the absence of any fixed target or specific obligation before 2010 only a few states notified the purchase obligations The initial movers were Gujarat (2005) Kerala (2006) Rajasthan (2007) and Madhya Pradesh (2008)
13 The petition was filed under Section 121 of the Electricity Act 2003 which empowers the tribunal to issue orders instructions or directions to the appropriate commission for the performance of its statutory functions
Till January 2017 only three states ndash Andhra Pradesh Madhya Pradesh and Rajasthan ndash had issued draft regulations specifying a trajectory in line with the one prescribed by the MoP (MNRE 2017) In 2017 Karnataka revised their official policy targets from 2000 MW to 6000 MW of solar power to match the RPO trajectories set by the MoP (The Hindu 2017) Till March 2020 only nine states had aligned their RPO trajectories with that of the MoP (MoP 2020a) The remaining states are yet to either notify their 2021ndash22 trajectories or align them with the Central trajectory While Maharashtra has not aligned its targets it provides incentives of INR 025 per kWh above the state prescribed RPO for procurement up to the MoP target
32 Compliance with RPOThe obligated entities can comply with their RPOs through two routes direct procurement (FiTcompetitive bidding) and purchasing RECs from power exchanges
State regulations typically contain provisions for monitoring compliance which require the obligated entities to submit information to the state nodal agencies and the nodal agencies are required to file periodic compliance reports with the SERC The SERC can also initiate suo moto proceedings to verify compliance
In cases of non-compliance SERCs are typically required to direct the obligated entities to deposit such amounts as the SERC may determine in a separate fund which will then be used to purchase RECs and develop transmission infrastructure However certain provisions ndash like permitting target revision fungibility between solar and non-solar RPOs and carrying forward the RPOs ndash are specific to the states SERCs can also revise the RPOs in case of constraints in the availability of renewable energy A snapshot of the provisions can be found in Table A2 in the Annexure
As early as 2013 power producers filed a petition before the Appellate Tribunal of Electricity (APTEL)13 claiming that various state discoms and obligated entities were not complying with the RPO regulations The petition arose due to the failure of state commissions to implement their RPO regulations The petitioners submitted that the SERCs frequently allowed deferment carry-over and exemptions of the obligations and did not enforce compliance by directing purchase of RECs despite their availability The MNRE also submitted that discoms made inadequate provisions for compliance while the SERCs did not invoke penal provisions to enforce compliance It further submitted that the SERCs did not seek RPO compliance reports in accordance with the regulations and that many had not even announced their long-term RPO trajectories The CERC submitted that the REC market had a large unsold inventory of non-solar RECs that were being traded at floor prices It further noted that the demand for RECs is largely driven by very few private distribution licensees and few captiveopen-access customers meanwhile the state discoms generally do not purchase RECs to fulfil their RPOs
Table 5 MoP trajectory for RPO
Source MoP 2016 Guidelines for Long-term RPO Growth Trajectory of Renewable Purchase Obligations (RPOs) for Non-solar as well as Solar Order No 2332016-RampR New Delhi MoP 22 July MoP 2018 Long-term RPO Growth Trajectory of Renewable Purchase Obligations (RPOs) for Solar and Non-solar for a Period of Three Years ie 2019ndash20 to 2021ndash22 Order No 23032016ndashRampR New Delhi MoP 14 June
2016ndash17 2017ndash18 2018ndash19 2019ndash20 2020ndash21 2021ndash22Category
Non-Solar
Solar
Total
875
275
115
95
475
1425
1025
675
17
1025
725
175
1025
875
19
105
105
21
19Renewable purchase obligations ndash a regulatory mechanism for creating demand
How Indiarsquos Solar and Wind Policies Enabled its Energy Transition A Decade in Review
The SERCs used the provisions built by them in the RPO regulations to allow non-compliances to occur The APTEL directed the SERCs to strictly enforce compliance and use the provisions sparingly and in accordance with the spirit of the mandate
Variance in compliance within states
The MNRE has consistently been urging states to align their RPO trajectories with that of the Central Government and ensure strict compliance In August 2019 the MNRE sought APTELrsquos intervention to nudge SERCs to enforce and align RPOs and not to allow any waivers or carrying forward (MoP 2020a) In 2019ndash20 some RE-rich states including Maharashtra Gujarat Tamil Nadu Rajasthan and Telangana fell short of meeting their RPO targets Apart from Andhra Pradesh Rajasthan Karnataka and more recently Tamil Nadu no other state has met their RPO targets (MoP 2020a) Figure 4 compares the RPO compliance situation across 2015ndash16 and 2017ndash18 of Tamil Nadu Maharashtra Bihar and Punjab and is representative of the compliance situation across the country
Figure 4 Compliance with RPOs is uneven among states and discoms
Source Authorsrsquo adaptation from Order dated 11 August 2017 issued by the TNERC in TP No1 of 2017 titled Determination of Tariff for Generation and Distribution Order dated 27 March 2019 issued by the MERC in Case No36 of 2019 titled Case for Verification of compliance of Renewable Purchase Obligation targets by Maharashtra State Electricity Distribution Co Ltd for FY 2017-18 Order dated 2 April 2019 issued by the MERC in Case No37 of 2019 titled Case for Verification of compliance of Renewable Purchase Obligation targets by Brihanmumbai Electric Supply amp Transport Undertaking for FY 2017-18 Order dated 2 April 2019 issued by the MERC in Case No38 of 2019 titled Case for Verification of compliance of Renewable Purchase Obligation targets by Tata Power Co LtdndashDistribution) for FY 2017-18 Order dated 4 April 2019 issued by the MERC in Case No39 of 2019 titled Case for Verification of compliance of Renewable Purchase Obligation targets by Adani Electricity Mumbai Limited for FY 2017-18 Order dated 23 October 2017 issued by the PSERC titled Annual Revenue Requirement and Determination of tariff for MYT control period from FY 2017-18 to FY 2019-20 and for True up of FY 2015-16 Order dated 19 April 2018 issued by the PSERC in Petition titled True up of FY 2016-17 Annual Performance Review ndashAPR) for FY 2017-18 and Determining the Annual Revenue Requirement ndashARR) for FY 2018-19 Order dated 27 May 2019 issued by the PSERC in Petition No 02 of 2019 titled True up of FY 2017-2018 Annual Performance Review ndashAPR) for FY 2018-19 Approval of Revised Annual Revenue Requirement ndashARR) and Determination of Tariff for FY 2019-20 Order dated 25 February 2019 issued by the BERC in Case No 40 and 48 of 2018 and Case No 41 and 47 of 2018 titled Tariff Order for FY 2019-20 for NBPDCL and SBPDCL Order dated 24 March 2017 issued by the BERC in Case No 45 of 2016 titled Tariff Order for FY 2017-18 for NBPDCL Order dated 24 March 2017 issued by the BERC in Case No 46 of 2016 titled Tariff Order for FY 2017-18 for SBPDCL Order dated 21 March 2018 issued by the BERC in Case No 40 of 2017 titled Tariff Order for FY 2018-19 for NBPDCL Order dated 21 March 2018 issued by the BERC in Case No 41 of 2017 titled Tariff Order for FY 2018-19 for SBPDCL
0
300
250
200
150
100
50
Tamil Nadu Maharashtra Bihar Punjab
TANGEDCO Tata SBPDCL PSPCLNBPDCLAdani MSEDCL BEST
States and discoms
2015-16 Solar
2016-17 Non-solar
2015-16 Non-solar
2017-18 Solar
2016-17 Solar
2017-18 Non-solar
RP
O c
omp
lianc
e (in
per
cen
t)
20
Karnataka and Tamil Nadu which set ambitious targets have high rates of compliance However Madhya Pradesh and Uttar Pradesh were unable to reach their ambitious targets Andhra Pradesh Gujarat Maharashtra and Rajasthan set modest targets with relatively high compliance levels The other states were unable to accomplish even their low targets The Comptroller and Auditor General of India (CAG) in their analysis of RPO compliance in 24 states between 2010ndash11 and 2013ndash2014 noted that non-compliance was more common among the RE resource-deficit states (CAG 2015 chap 2) This trend in non-compliance by the states has remained largely unchanged since then
In most cases the RPO served as a ceiling on deployment rather than a fillip Most RE-rich states limited discomsrsquo procurement of wind and solar power up to the RPOs targets notified by their respective SERCs The RPO regulation of Gujarat explicitly required the discoms to source RE from within their areas of supply Similarly the Bihar RPO regulation requires discoms to meet their RPOs from sources within their state Discoms can source power from outside the state only in case of shortfall within the state Further there is no indication or incentive in the state RE policies for discoms to exceed the RPO targets Grid integration concerns and the technical limitations to RE powerrsquos sale to other states restrict RE deployment
Participation in the REC market mechanism
The trading mechanism instituted for RECs in the power exchanges has not led to its uptake as there has been a consistently high number of unredeemed RECs (see Figure 5) In addition developers installed only around 2266 MW of RE capacity in 2010ndash2017 under the REC mechanism
Figure 5 RECs consistently remain unsold in the market
Source Authorsrsquo adaptation from REC Registry of India 2020 ldquoMonth-wise RECs Reportrdquo REC Registry of India Accessed 30 November httpswwwrecregistryindianicinindexphppublicsrecs
The REC market has not adequately boosted compliance with the RPO regime Up to 2014 only 477 per cent of the RPO compliance was through the REC route (CAG 2015 chap 2) For resource-deficit states to meet their RPOs through RECs a higher number of resource-deficit states should constitute the buyers ndash which however is not the case (see Table 6) Instead the data shows that resource-rich states are also the highest buyers of RECs
Note The closing balance is the balance in December of each year
0
20000000
15000000
10000000
5000000
2013 2014 2018 20192015 2016 2017
RECs issued RECs redeemed Closing balance
21Renewable purchase obligations ndash a regulatory mechanism for creating demand
How Indiarsquos Solar and Wind Policies Enabled its Energy Transition A Decade in Review
Another noteworthy fact is that among the large buyers ie Maharashtra and Gujarat there is significant private-sector participation In Gujarat private discoms make the most REC purchases The other significant chunk of buyers are the union territories which fall within the Central Governmentrsquos purview and for this reason may be more enthusiastic in their use of the REC mechanism (POSOCO 2018)
It appears that the factors behind participation in the REC market are independent of resource availability and utilisation
33 Causes of under-achievement
The possible causes of under-achievement of the REC mechanism in boosting RPO compliance are discussed below
Declining number of sellers
The SERCs have contended in the past that developers stand to gain supernormal profits by setting up REC projects since they are entitled to normal tariffs plus the REC price Analyses also anticipated that the high floor prices could provide windfall gains to developers (A Singh 2010)
However this did not hold true in practice Though there was an initial spurt in the number of projects that were registered under the mechanism as solar and wind tariffs continued to fall the registration of new projects under the REC mechanism reduced (see Figure 6) There is a clear preference for FiTauctions over the REC route Of the total 85908 MW of RE capacity (including all types of RES) in India as of 31 December 2019 (MNRE 2020a) only 4046 MW was registered under the REC mechanism (REC Registry of India 2020b) (see Table A3 of the Annexure for the number of projects registered in the selected states)
Table 6 Resource-rich states are also the highest buyers of RECs
Source Authorsrsquo adaptation from POSOCO 2018 Renewable Energy Certificate Mechanism in India Key Learnings Data Analysis and Way Forward New Delhi POSOCO NLDC
Share of total RECs purchased by state entities (total RECs redeemed up to
2017ndash18 are 37043171) (in per cent)
Share of total RECs purchased by the state discom (total RECs purchased
by all discoms up to 2017ndash18 are 22499976) (in per cent)
State
Maharashtra
Gujarat
Rajasthan
Bihar
Madhya Pradesh
Punjab
Tamil Nadu
Karnataka
Andhra Pradesh
Uttar Pradesh
307
133
62
46
44
33
19
17
16
04
44
131
0
75
0
39
0
0
0
0
22
Cashflow for REC projects
In the early 2010s there was still a wide gap between the APPC and solar and wind tariffs It would have been risky to register as a REC project since REC prices would be discovered in energy exchanges within the approved bands The floor price is calculated by determining the gap between the minimum requirement and the APPC This minimum requirement is an estimation that considers OampM expenses interest on term loans working capital and repayment terms it is fixed to ensure the economic viability of the project However these numbers are estimated based on prevailing rates as opposed to historic rates Hence the prices have expectedly and consistently fallen (see Table 7) the floor price has reached zero This would impact the cashflows of a project registered when the costs were high
Figure 6 The registration of new projects under the REC mechanism has reduced
Source Authorsrsquo analysis of data published by POSOCO 2018 Renewable Energy Certificate Mechanism in India Key Learnings Data Analysis and Way Forward New Delhi POSOCO NLDC
Table 7 REC floor prices and forbearance prices have consistently fallen
Non-solar (INR MWh)
Floor price Floor priceForbearance price Forbearance price
Solar (INR MWh)
1500
1500
1000
0
3900
3300
3000
1000
12000
9300
1000
0
17000
13400
2400
1000
1 June 2010ndashFY 2012
1 April 2012ndashFY 2017
1 April 2017ndashFY 2020
1 July 2020ndash30 June 2021
Control period
Source Order dated 1 June 2010 issued by the CERC in Petition No 992010 (Suo Motu) titled Determination of Forbearance and Floor Price for the REC Framework Order dated 23 August 2011 issued by the CERC in Petition No 1422011 (Suo Motu) titled Determination of Forbearance and Floor Price for the REC Framework to be Applicable from 1st April 2012 Order dated 30 March 2017 issued by the CERC in Petition No 02SM2017 titled Determination of Forbearance and Floor Price for the REC framework to be Applicable from 1st April 2017 Order dated 17 June 2020 issued by the CERC in Petition No 05SM2020 titled Determination of Forbearance and Floor Price for the REC Framework
Capacity Noof projects
0 0
200 50
400100
600
800150
1000 200
1200 250
2010
-11
Year
Cap
acit
y (M
W)
Num
ber
of r
egis
tere
d p
roje
cts
2011
-12
2012
-13
2013
-14
2017
-18
2016
-17
2015
-16
2014
-15
23Renewable purchase obligations ndash a regulatory mechanism for creating demand
The declining trend of the market price of the REC (see Table 7) shows that buyers are unwilling to pay a higher price and that there is significant uncertainty surrounding the expected returns on investment
How Indiarsquos Solar and Wind Policies Enabled its Energy Transition A Decade in Review
Table 8 Average size of a registered plant as of FY 2018
SourceAuthorsrsquo analysis of data published by POSOCO 2018 Renewable Energy Certificate Mechanism in India Key Learnings Data Analysis and Way Forward New Delhi POSOCO NLDC
Maximum capacity (MW)
Minimum capacity (MW)
Average capacity (MW)
No of projects
Total capacity (in MW)
1900
504
010
023
204
525
360
413
736
2167
Solar PV
Wind
RE source
For projects developed after the fall in costs the situation has reversed The APPC in most cases may be higher or equal to solar and wind tariffs If any new projects are registered under the REC regime today they could sell power to the host discoms at the APPC (or SERC-notified tariffs) and RECs thus sold can help an obligated entity meet its RPO
Cost for host discomsstatesThe responsibility and cost of balancing power from REC projects (the cost of maintaining system balance due to injection of variable power in the grid) fall on the host state This could limit the number of REC projects the state would host for the availability of other obligated entities
For RE-deficit states it would be more commercially viable to procure RECs to meet their RPOs (they will incur conventional power purchase costs plus REC costs) and avoid the balancing costs associated with procuring RE directly However data shows that discoms do not avail of this route to meet their RPOs This may be due to behavioural resistance to shift to REC or due to the indifferent enforcement of RPOs
Cost for other obligated entitiesInitially there was considerable resistance from open access and captive consumers to the RPO obligations imposed upon them The dispute was eventually settled by the Supreme Court in Hindustan Zinc Limited v RERC14 in which the Court held such imposition to be valid Open-access consumers have the freedom to switch to grid purchase in which case they do not need to comply with RPOs separately
Regulatory gapsThe REC market is a lsquocompliance marketrsquo ie the demand for RECs arises from a legal mandate and is not organic demand15 In this context non-compliance can result from the following situations
14 Judgment dated 13 May 2015 issued by the Supreme Court of India in Civil Appeal No 4417 of 2015 httpswwwrecregistryindianicinpdfREC_RegulationSupreme_Court_Judgement_regarding_RPO_Compliancepdf
15 The voluntary component of the REC market is the exception However its share is only 01 percent of the REC market (POSOCO 2018)
24
This would especially affect larger projectsrsquo participation in the REC mechanism Investors prefer projects with PPAs as they offer assured returns over a longer duration This is also indicated by data on the average size of projects registered under the REC mechanism (Table 8)
Regulatory uncertainty
As discussed above RPO regulations allow carrying forward exemptions etc which create demand uncertainty Other regulatory causes also contribute to commercial uncertainty Initially the life of the REC was only one year after which it expired if not redeemed These expired RECs generated no returns on investment for investors This would have dissuaded many investors from setting up REC projects The validity period was subsequently increased to two years by the CERC through an order dated 11 February 2013 however this did not give investors sufficient confidence Commercial uncertainty was further exacerbated by the fact that demand was also not certain due to the low RPO targets set by states before the MoP set a common trajectory for all in 2016
Inadequate enforcement
There was no unified framework for monitoring RPO compliance on an on-going basis until the MNRE announced the constitution of the RPO compliance cell in 2019 The SERCs are relatively lenient with regards to non-compliance For example they permit the carrying forward of shortfall16 and the use of the previous yearrsquos surplus to meet shortfalls in the next year17 There have also been delays in reviews of compliance For example compliance for the period FY 2015ndash16 was finally determined by the Gujarat Electricity Regulatory Commission (GERC) on 26 December 2019 While there are generic penalties prescribed in the EA for contravention of regulations made under the EA it is difficult to imagine that the SERCs would be highly inclined to strictly invoke these provisions against their own state discoms
Inability of the obligated entities to comply with the mandate
While non-enforceability and regulatory gaps lead to non-compliance the practical reason is that RPOs and RECs are an additional cost burden for discoms which are already under severe financial stress Further many inefficient thermal projects continue to operate to their technical minimum to provide the baseload which limits the extent of RE procurement Certain states have indicated that they would be willing to purchase RECs provided they find an offtaker for the thermal capacity that is already contracted by the discoms Many states which were earlier in a power deficit situation but have now become power surplus states find it difficult to meet the current RPO levels and have no incentives to raise their RE ambitions
16 Order dated 4 August 2015 issued by the GERC in suo motu Petition Nos 1307 of 2013 and 1312 of 2013 titled Suo-motu Proceedings in Petition Nos 1307 of 2013 and 1312 of 2013 in Pursuance of Honrsquoble APTEL Direction Contained in Order Dated 16042015 in Appeal Nos 258 of 2013 and 21 of 2014 and the Order Dated 14052015 in IA No 187 of 2015 Accessed 22 October 2020 httpswwwgercinorgwp-contentuploadsdocumenten_1438799511pdf
17 Order dated 4 April 2019 issued by the MERC in Case No 39 of 2019 titled Case for Verification of Compliance of Renewable Purchase Obligation Targets by Adani Electricity Mumbai Limited for FY 2017ndash18
25Renewable purchase obligations ndash a regulatory mechanism for creating demand
RPO compliance for FY 2015ndash16 was finally determined by the Gujarat Electricity Regulatory Commission (GERC) on 26 December 2019
How Indiarsquos Solar and Wind Policies Enabled its Energy Transition A Decade in Review 188
Image iStock
India must implement a comprehensive market reforms roadmap with an intent to remove current inefficiencies while designing a market architecture that minimises total system costs in the future
27
The southern and western states of India have a long history of RE development since RE resources are concentrated in these states (Figure 7) These states attracted investments in
solar and wind energy well before the launch of NAPCC and the NSM This section recounts the journey of RE policies in states that have high solar and wind energy potential The RE-rich states covered are Andhra Pradesh Gujarat Karnataka Madhya Pradesh Maharashtra Rajasthan Tamil Nadu and Telangana
41 Policies pre-2014 In January 2009 Gujarat became the first Indian state to launch a solar power policy (Economic Times 2010) In 2012ndash13 over 40 per cent of Tamil Nadursquos total capacity was based on wind power (TN Energy Department 2012) well before the Government of India adopted the ambitious target of 175 GW RE capacity by 2022 including 60 GW wind
In the first phase of NSM Karnataka Power Corporation Limited (KPCL) was the first state-owned utility to be found eligible for the development of a solar project (Deloitte 2015) Rajasthan attracted a slew of projects primarily because of abundant land and resource availability In 2011 Karnataka was the first southern state to introduce an exclusive policy for the development of solar energy
4 Policy evolution in RE-rich states
Figure 7 RE resource potential is concentrated in western and southern India
Source Authorsrsquo analysis based on data from MNRE 2020 Annual Report 2019-20 New Delhi MNRE
Note Wind potential is at 120 m above ground level
Solar potential (GW)
088 0114231 14256
Wind potential (GW)
How Indiarsquos Solar and Wind Policies Enabled its Energy Transition A Decade in Review 28
Key driversThrough 2010ndash14 the underlying policy motivations across RE-rich states were increasing energy access closing demand-supply gaps increasing industrial productivity utilising local resources for power generation garnering private investments creating employment opportunities through project deployment and local manufacturing responding to local environmental challenges and addressing climate change risks
Policy focusIn most of the initial policies support was provided in the form of FiTsbundled tariffs The power was sold through long-term PPAs to state discoms or to NVVN under NSM bundling schemes However we observed shortfalls in administrative and institutional mechanisms like negligible support for land acquisition and approvals and clearance processes lack of strengthening of evacuation infrastructure to tap the best sites no provisions for building knowledge and capacity in key implementing entities and no requirement for improved data collection and communication to aid industryrsquos decision-making and project planning The challenges of the distribution sector also impacted the progress of the sector during the implementation of the NSM Policies therefore failed to create an enabling environment and were not adequate to attract significant investors in the RE business Accordingly these policies attracted a poor response in many RE-rich states For example
bull In Andhra Pradesh only 13184 MW of solar PV capacity was commissioned till FY 2014 against the 2000 MW of solar capacity envisaged under Andhra Pradeshrsquos Solar Power Policy 2012
bull In Tamil Nadu only 13258 MW of solar PV was installed over 2012ndash15 against a target of 3000 MW in Tamil Nadu Solar Policy 2012
bull Karnatakarsquos Renewable Energy Policy 2009ndash14 enabled the addition of 102108 MW during the five-year policy period against a target of 4200 MW
Performance of policies During 2012ndash2014 several states failed to achieve NSM and their state policy targets within the stated time (Stromsta 2012) (See Table 9) States such as Rajasthan Andhra Pradesh and Tamil Nadu conducted auctions in 2013 but there were delays in signing PPAs Gujarat was the only state that adopted the FiT system under its solar policy that was much more attractive than NSM and other state policies Even then there were time overruns Rajasthan auctioned 75 MW of solar capacity in March 2013 However elections in the state delayed land allocation processes (Sengupta 2013) In December 2012 Tamil Nadu conducted a 1000 MW auction out of which only 698 MW was awarded at INR 648 per unit This may reflect investorsrsquo risk perception of the discom finances and operations in the state (TNN 2013)
Project deployment in most states was below the target capacity under the policies
29Policy evolution in RE-rich states
Table 9 Targets specified under policies and achievements
Source Authorsrsquo analysisRPO achievement figures from MoP 2020 Agenda Background Conference of Power and Renewable Energy Ministers of States and UTs 3 July 2020 New Delhi 3 July
Capacity achievement figures from CSO Energy Statistics 2010 New Delhi MoSPI CSO Energy Statistics 2012 New Delhi MoSPI CSO Energy Statistics 2013 New Delhi MoSPI CSO Energy Statistics 2014 New Delhi MoSPI CSO Energy Statistics 2015 New Delhi MoSPI CSO Energy Statistics 2016 New Delhi MoSPI CSO Energy Statistics 2017 New Delhi MoSPI CSO Energy Statistics 2018 New Delhi MoSPI CSO Energy Statistics 2019 New Delhi MoSPI CSO Energy Statistics 2020 New Delhi MoSPI MNRE 2019 Annual Report New Delhi MNRE
Windsolar policy and year Targets in policy Achievement against targets
Solar Power Policy 2012
Solar Power Policy 2015
Wind Power Policy 2015
Solar Power Policy 2018
Wind Power Policy 2018
SolarndashWind Hybrid Policy 2018
Wind Power Policy 2007
Solar Power Policy 2009
Wind Power Policy 2013
Solar Power Policy 2015
Wind Power Policy 2016
Policy for Implementation of Solar Power Based Projects 2012
Wind Power Project Policy 2012
New and Renewable Sources of Energy Policy 2012
Policy for Promotion of New and Renewable Energy Sources 2011
Policy for Promotion of New and Renewable Energy Sources 2017
Karnataka Renewable Energy Policy 2009
Solar Policy 2011
Karnataka Solar Policy 2014
Karnataka Renewable Energy Policy 2016
New Policy for Power Generation from Non-Conventional Sources 2008
Comprehensive Policy for Grid Connected Power Projects based on New and Renewable (Non-conventional) Energy Sources 2015
Rajasthan Solar Energy Policy 2011
Policy for Promoting Generation of Electricity from Wind 2012
Rajasthan Solar Energy Policy 2014
Rajasthan Solar Energy Policy 2019
Rajasthan Wind and Hybrid
Energy Policy 2019
5000 MW
5000 MW additional capacity in 5 years
No targets but discoms required to purchase power up to their RPOs
No targets but discoms required to purchase power up to their RPOs
10 per cent of the capacity portfolio by 2022
1969 MW grid-connected solar
(total solar target is 2969 MW solar)
200 MW (including solar thermal)
Additional 2000 MW between 2014ndash2021
4400 MW additional wind capacity between 2016ndash2022
2000 MW of wind
7500 MW solar till 2020
5000 MW wind till 2020
Target of 10000ndash12000 MW in next 10ndash12 years
300 MW (2013ndash14) 400 MW (2014ndash15) and 500 MW (2015ndash16)
25000 MW
24 GW utility-scale solar by 2025
2000 MW wind for RPO by 2025
Target is only for discom purchase
355902 MW total solar capacity as of December 2019
276355 MW total solar and 735922 MW total wind capacity as of December 2019
For 2019ndash20 solar RPO compliance is 462 per cent and non-solar RPO compliance is 12257 per cent
251989 MW wind and 223748 MW solar as of December 2019
For 2019ndash20 solar RPO compliance is 847 per cent and non-solar RPO compliance is 71 per cent
9471 MW solar as of December 2019
14935 MW total solar capacity as of December 2019
31 MW total solar capacity in FY 2014
724392 MW solar added between FY 2014 and December 2019
188425 MW wind added between FY 2016 and December 2019
4446 MW total wind capacity in FY 2015
500033 MW wind and
166342 MW solar as of December 2019
484421 MW solar as of December 2019
10025 MW (in 2013ndash14) 5241 MW (in 2014ndash15) and 68495 MW (2015ndash16) of wind capacity
484421 MW total solar and 429972 MW total wind as of December 2019
Andhra Pradesh
Gujarat
Madhya Pradesh
Punjab
Bihar
Karnataka
Maharashtra
Rajasthan
State
How Indiarsquos Solar and Wind Policies Enabled its Energy Transition A Decade in Review
Table 9 contd Windsolar policy and year
Targets in policy
Achievement against the targets
Tamil Nadu Solar Policy 2012
Tamil Nadu Solar Policy 2019
Solar Power Policy 2013
Solar Power Policy 2017
Telangana Solar Power Policy 2015
Telangana Wind Power Policy 2016
3000 MW by 2015
9000 MW by 2023
500 MW by 2017
Target up to the RPO
No target
No target
14258 MW total solar capacity in FY 2015
378836 MW solar as of December 2019
33673 MW solar by 2017
10451 MW solar by December 2019 Solar RPO compliance for 2019ndash20 is 305 per cent
362075 MW solar and 1281 MW wind as of December 2019
Tamil Nadu
Uttar Pradesh
Telangana
State
By 2013 Gujarat had installed over 850 MW of solar PV projects the largest capacity in India at that time However the holding company of discoms in Gujarat ndash Gujarat Urja Vikas Nigam Limited (GUVNL) ndash moved to renegotiate the tariffs specified under the signed PPAs citing excessive profits to developersinvestors (Balan 2014) Although GUVNLrsquos attempt was struck down by the APTEL this was the first time that the risks related to contract sanctity emerged in the Indian market which hurt business and investor confidence
As a result of the withdrawal of AD in 2012 and delays in the re-introduction of the GBI wind power deployment rates also declined in 2013 Without the AD or GBI the tariff of a typical new wind power plant was in the range of INR 4 to 5 per unit (for lsquoZone 2rsquo and above sites) Due to this sudden policy gap the market collapsed from 3 GW in 2011 to below 2 GW in 2012 and 2013 (CAG 2015 chap 4)
Figure 8 depicts the growth of solar and wind capacity across states This clearly shows that total capacity started to increase more rapidly 2014 onwards Wind power on the other hand grew at a constant pace till 2012 after which it plateaued for a couple of years and it again picked up in 2016 and 2017 After 2017 wind deployments slowed down again
30
Note The capacity achievement figures include only grid connected capacity while the targets may include decentralised capacity
Figure 8 Solar and wind capacity increased rapidly 2014 onwards
Sources Authorsrsquo analysis based on CSO Energy Statistics 2010 New Delhi MoSPI CSO Energy Statistics 2012 New Delhi MoSPI CSO Energy Statistics 2013 New Delhi MoSPI CSO Energy Statistics 2014 New Delhi MoSPI CSO Energy Statistics 2015 New Delhi MoSPI CSO Energy Statistics 2016 New Delhi MoSPI CSO Energy Statistics 2017 New Delhi MoSPI CSO Energy Statistics 2018 New Delhi MoSPI CSO Energy Statistics 2019 New Delhi MoSPI CSO Energy Statistics 2020 New Delhi MoSPI MNRE 2020 Annual Report 2019ndash2020 New Delhi MNRE
Policies for project planning and development phasesSeveral initial policies assigned the full responsibility for project planning and construction to developers This included locating and acquiring suitable land conducting resource assessments obtaining all clearances and permissions and bearing the cost of ensuring connectivity to the nearest evacuation point Although some policies did talk about single-window clearance through state nodal agencies the portal or facility was non-functional on the ground Some state policies for example Gujarat Solar Policy 2009 Andhra Pradesh Solar Policy 2012 Andhra Pradesh Wind Policy 2015 and Karnataka RE Policy 2009ndash14 did include enabling provisions for the facilitation of revenuebarren lands
bull Gujarat developed the first solar park in the country in 2012 ndash Charanka Solar Park ndash that houses around 600 MW capacity and provides the required infrastructure for projects
0
0
10000
10000
20000
20000
30000
30000
40000
40000
50000
50000
60000
60000
70000
80000
70000
200
820
08
200
920
09
2010
2010
2011
2011
Solar capacity growth
Wind capacity growth
Cap
acit
y (in
MW
)C
apac
ity
(in M
W)
2012
2012
2013
2013
2014
2014
2020
2020
2019
2019
2018
2018
2017
2017
2016
2016
2015
2015
AP
AP
Telangana
Telangana
Rajasthan
Rajasthan
Maharashtra
Maharashtra
Total
Total
Gujarat
Gujarat
Tamil Nadu
Tamil Nadu
Madhya Pradesh
Madhya Pradesh
Karnataka
Karnataka
31Policy evolution in RE-rich states
How Indiarsquos Solar and Wind Policies Enabled its Energy Transition A Decade in Review
bull The New and Renewable Energy Development Corporation of AP Limited (NREDCAP) in Andhra Pradesh worked with the statersquos revenue department to procure land in advance and sign long-term leases with the developers at predetermined rates
bull In Karnataka 10 per cent of barren government lands reserved for industrial use were allocated to Karnataka Renewable Energy Development Limited (KREDL) for RE development KREDL could sub-lease the identified revenue barren or panchayat lands to project developers for 30 years No procedure was specified for the selection of developers and allotment of land to them Therefore this later led to land banking by wind developers As per the state policy KREDL was supposed to undertake wind resource assessment studies identify potential sites and notify land parcels as reserved for wind project development
Many policies did not specify the application procedures to be followed by the project developers For example Tamil Nadu Energy Departmentrsquos Policy Note 2012ndash13 was totally silent on land allocation criteria ndash for land owned by the statersquos revenue department and for private lands (TN Energy Department 2012) Hence almost the entire wind capacity in the state is installed on private lands The criteria for allotting land developed by state nodal agencies (SNA) or special purpose vehicles (SPVs) was not articulated ndash whether it was first-come-first-served basis or a robust assessment framework for leasing land or a system that prioritised certain project categories The arrangements under which the land could be allotted to developers were mainly land-lease-based However the policies were not clear on how these lease values will be determined Mostly these rates were linked to market prices which could increase significantly owing to land-use patterns and the limited availability of land
The land-related provisions in state wind policies or their silence on those aspects led to developersmanufacturers acquiring huge tracts of private land in wind-rich states which they could retain while carrying out wind resource assessments (Naidu 2013) They started implementing the project once the desired infrastructure came up or once they struck a deal with the offtaker As a result the per MW capital costs were high because of a huge component of land premiums that were built into it However this could be considered a way to address the risks wind developers had to bear at that time
Grid connectivity policiesAccording to the Grid Code for intra-state networks the state transmission utility (STU) or discom is responsible for strengthening grid infrastructure to evacuate RE power and bears the associated costs It is also responsible for extending the grid up to the pooling sub-station However given the financial health of discoms and some STUs these steps were rarely taken States took to ad-hoc arrangements to establish grid connection For example in Gujarat the following solution was adopted the STU provided the necessary equipment for connecting projects to the grid while the developers provided the workforce and the required finances This arrangement was then followed by many other RE-rich states Thereafter the parkzone approach was promoted under several later policies
As per the CERC (Grant of Connectivity Long-term Access and Medium-term Open Access in Inter-state Transmission and Related Matters) Regulations 2009 renewable energy plants of
323232
Many policies did not specify the application procedures to be followed by the project developers
more than 50 MW could connect to the ISTS to take advantage of reduced congestion in the higher-voltage grid but no wind or solar plant availed of that option till as late as 2018 This could have been because project development frameworks and power sale contracts were signed with local entities Or under the point of connection transmission pricing (on a MW basis) the charges on wind projects may have been a burden as their capacity utilisation factors are lower than that of thermal power plants Further at that time and even now PGCIL substations are often far from wind farm sites resulting in high connectivity costs for developers
Policies addressing project operations and power procurementMost policies provided for power procurement by discoms from wind and solar plants through long-term PPAs to meet the RPOs Many states in 2012ndash14 experienced power shortages Therefore RE was also considered an option to meet the demand of large commercial and industrial units in these states For example the Karnataka Electricity Regulatory Commission (KERC) notified a fixed-term concessional open-access regime for solar energy including exemption from wheeling and banking charges and cross-subsidy surcharge for the first 10 years of operation for solar projects that did not fall under the REC mechanism However this was rolled back in 201818 Many other states offered incentives and exemptions such as nil or minimal wheeling and transmission charges for wheeling of power consumed within the state cross-subsidy surcharge exemption for open access obtained for third-party sales within the state exemption from paying electricity duties for sale to discoms andor for captive consumption and third-party sale within the state and different arrangements for banking of RE power
It appeared that most RE-rich states preferred RE plants to sell power to discoms or third parties or serve captive demand within the state itself For example
bull Maharashtrarsquos New Policy for Power Generation from Non-Conventional Sources 2008 required developers availing the benefits of the policy to sell 50 per cent of the electricity generated from the plant to the discom ndash Maharashtra State Electricity Distribution Company Limited (MSEDCL) ndash at the Maharashtra Electricity Regulatory Commission (MERC)-approved rate under the PPA and the remaining 50 per cent only within the state
bull Karnatakarsquos Renewable Energy Policy 2009ndash14 required RE plants to sell electricity to discoms under PPAs approved by KERC or use it for captive purposes There was no mention of third parties within the state who could buy RE power through open access
bull Andhra Pradeshrsquos Solar Policy 2012 captures only intra-state sale of power to discoms or third party
CurtailmentFollowing the Grid Code the must-run status of RE plants was adopted by states in their respective grid codes However inadequate grid availability has been a challenge in RE-rich states more so in the period 2009ndash2014 In Tamil Nadu wind generation increases significantly during the monsoons (AprilndashSeptember) when power demand is also relatively low Before 2014 the intra-state grid was unable to absorb the excess generation due to low demand and could not transmit it to other regions because of limited inter-connections with
18 Order dated 14 May 2018 issued by the KERC in matter no S032017 titled In the Matter of Revision of Wheeling and Banking Charges for Renewable Power Projects httpskredlinfoingeneralwheeling20and20banking20charges2014052017pdf
33Policy evolution in RE-rich states 33Policy evolution in RE-rich states 33Policy evolution in RE-rich states
During 2012ndash14 many states experienced power shortages Therefore RE was also considered an option to meet the demand of large commercial and industrial units
How Indiarsquos Solar and Wind Policies Enabled its Energy Transition A Decade in Review
Table 10 2010ndash2014 Developments that held back RE deployment and associated risks that remained
Note Authorsrsquo analysis
Corresponding risks
Inadequate support for land procurement
Lack of evacuation infrastructure and delays in grid connectivity
Mismatch between national targets and state RPO trajectories low RPO compliance
Poor credit profile of state discoms
Uncertainty in incentives ndash lapsing and withdrawal of GBI and AD
Curtailment of power
No provisions for RE sale outside the state
Delay in commissioning leading to cost overrun
National targets at risk restricted marketsdemand
Offtake risk payment risk
Cashflow risks
Offtake risk
Restricted marketsdemand
Inadequate support for land procurement
Inhibitors
42 Policies post- 2014 From 2014 onwards the Indian market witnessed a steep fall in solar tariffs owing to a variety of reasons ranging from domestic factors to global developments The NSM was successful in signalling Indiarsquos commitment towards solar development Although the rate of installation was slow during 2012ndash2014 and risks and inhibitors continued (Table 10) investor outlook remained positive
Key driversAs power deficits in states reduced demand grew slower than expected and solar tariffs declined drastically In response most RE-rich states developed policies with the intent of ensuring state-level energy security meeting agricultural and domestic loads through solar and aiming to become investment-friendly destinations In addition creating employment opportunities through project deployment as well as local manufacturing and responding to local environmental challenges and addressing climate change risks remained some of the commonly stated drivers across these states
Policy focusMost policies starting 2014ndash15 included provisions to facilitate the development of large-scale solar parks in a systematic and structured manner with the help of SECI Instead of individual states conducting their own auctions to procure solar power and meet their solar RPOs states preferred to buy power through SECI while continuing to procure wind power directly at preferential tariffs till 2017 Many policies specified clear targets to be achieved over
the national grid This led to the severe curtailment of wind power In 2014 the southern grid was inter-connected with the national grid providing some relief to the southern states but many industry players (Saumy 2019) and the MNRE (Chandrasekaran 2017) have continued to ask states to prevent curtailment of RE power Curtailment for wind power plants averaged around 30ndash35 per cent of generation in the peak season during 2012ndash15 (Jhawar 2020)
34
a five-year period Most policies at least on paper aimed to mitigate project development counterparty and operations-related risks in the sector to lower the cost of RE generation in their respective states Progressive policies such as the Andhra Pradeshrsquos Solar Power Policy 2015 and Wind Power Policy 2018 provided deemed industry status to RE projects and explicitly accorded them must-run status Unlike in the pre-2014 era these policies acknowledged the need to facilitate the sale of RE power outside the state For example
bull The Rajasthan Solar Energy Policy 2014 aimed to meet the energy requirements of Rajasthan as well as India
bull Maharashtrarsquos Comprehensive Policy for Grid-connected Power Projects Based on New and Renewable (Non-conventional) Energy Sources 2015 aimed to facilitate the sale of renewable power outside the state once the statersquos RPOs were met The policy even included a provision for deemed open access for the sale of energy within or outside the state if permission is not granted within the period specified in the MERC regulations It also gave RE projects the option to terminate their existing PPA with the state discom and opt for open access
bull APrsquos Solar Power Policy 2018 provided transmission and distribution charge exemptions for inter-state wheeling of power (which was later rolled back through an amendment)
bull APrsquos Renewable Energy Export Policy 2020 aimed to facilitate the leasing of land for setting up RE power plants and manufacturing facilities and to export power to other states
The reason for this shift in focus is that RE-rich states would want to utilise their abundant land and resource potential to attract huge private-sector investments generate revenues for the exchequer and create local jobs but would not be able to absorb all the generation within the state to meet their own demand
Global market developmentsApart from reduced risk perceptions due to stronger institutional mechanisms developersrsquo expectation of fall in solar module prices also drove them to place extremely aggressive bids in the auctions (Deign 2017) Solar module prices witnessed an overall drop in prices (see Figure 9) However even small fluctuations in module prices can affect project economics adversely
35Policy evolution in RE-rich states
Unlike in the pre-2014 era the policies now acknowledged the need to facilitate the sale of RE power outside the state
Figure 9 Average module (multicrystalline) prices have declined (2011ndash2019)
Source IEA 2020 ldquoEvolution of Solar PV Module Cost by Data Source 1970-2020rdquo 30 June Accessed 28 November 2020 httpswwwieaorgdata-and-statisticschartsevolution-of-solar-pv-module-cost-by-data-source-1970-2020
0
1412
0908 08
0706
05
0302
12
1
08
06
04
02
201320122011 2014 2018 20192015 2016 2017
USD
per
Wat
t
How Indiarsquos Solar and Wind Policies Enabled its Energy Transition A Decade in Review 36
There were short periods when module prices increased during 2017ndash2020 due to various reasons such as China slashing its subsidies reduced polysilicon supply in China module suppliers demanding price renegotiation and supply chain disruptions due to the COVID-19 pandemic (Bridge to India 2017) Excessive reliance on imported modules and largely from a single country makes the projects vulnerable to geopolitics and domestic policies intended to promote domestic manufacturing (Chawla 2020)
Wind tariffs declined following the initial rounds of bidding however the decline was not at the same pace as that of solar Even as discovered tariffs kept declining and were comparable with or even lower than tariffs of thermal projects RPOs remained the key driver and the primary Central Government lever for states to increase their RE uptake This is primarily because of the additional cost implications for discoms as they balance the increased variability in the system while being tied-up in long-term thermal PPAs
Performance of policiesAlthough all the policies seemed to be favourable and directed towards providing an enabling environment for RE development on-ground implementation and compliance remained weak which was the main reason for the prevailing risks in the sector Almost all RE-rich states like Tamil Nadu Andhra Pradesh Gujarat Karnataka Rajasthan and Maharashtra have made policy and regulatory decisions on electricity matters that have often been inconsistent with national policies and priorities They have made retrospective changes to policies threatened to renege on existing PPAs delayed payments to RE generators and curtailed RE power
One main reason for these inconsistent and ad-hoc actions was the drastic and rapid decline in solar tariffs starting 2014 (see Figure 10) The wind sector too transitioned to competitive bidding in late 2016 because of the success of reverse auctions in reducing solar tariffs While competition and reduced tariffs were desirable outcomes for Central policies it led to states losing confidence in RE PPAs signed at higher tariffs as compared to the lower tariffs discovered in subsequent auctions This not only led to the re-negotiation of PPAs but also delayed the procurement of new RE capacity in anticipation of further declines in tariffs
On the other hand the policies helped advance the setting up of solar parks which was a comforting factor for developers and investors and one of the contributing factors for
Figure 10 Solar tariffs discovered in Indian auctions
Source India RE Navigator 2020 ldquoAuction Resultsrdquo Accessed November 28 2020 httpsindia-re-navigatorcomwind
0
1210
864
2
2010
-13
2014
2018
2019
2020
2015
2016
2017
Central State
INR
kW
h
37Policy evolution in RE-rich states
bringing down tariffs However there were execution bottlenecks on the ground Project development was delayed because tenders were concluded while the park infrastructure was still under construction
Amongst the RE-rich states Karnataka has been a consistent performer for solar Under the Karnataka Solar Policy 2014ndash2021 it has recorded the largest solar capacity deployments in the country in 2017 2018 and 2019 In 2017 Karnataka installed more than 2 GW of large-scale solar and contributed to almost 25 per cent of the total capacity addition in India in that year By March 2019 with over 53 GW Karnataka had the highest installed capacity of utility-scale solar with a pipeline of around 28 GW Other state policies that have attracted investments include those of Rajasthan Andhra Pradesh Tamil Nadu and Maharashtra In 2018 these five states had more than 80 per cent of the countryrsquos utility-scale solar capacity
Meanwhile after SECI successfully concluded two auctions for wind energy in 2017 resulting in reduced tariffs many wind-rich states shifted to competitive bidding with SERC-determined generic tariffs as the tariff ceiling During 2017 states such as Gujarat and Tamil Nadu auctioned additional wind capacity to meet their non-solar RPO targets (Saurabh 2017) Seven wind-rich states installed 55 GW of wind capacity in 2016ndash17 (Raikar 2018) However in 2017ndash18 and 2018ndash19 the total wind installed capacity declined substantially to just around 18 GW and 14 GW respectively (IWTMF 2019) Low tariffs were quoted in initial bids but the subsequent tenders were undersubscribed most likely because the tariff ceilings were financially not feasible The main reasons for states not being able to achieve their wind policy targets were the conditions and risks that reverse auctions failed to address (i) wind resource is more concentrated than solar and high wind density sites are getting exhausted (ii) ISTS is not plannedavailable for moderatehigh wind sites (iii) bearing the costs associated with connecting to the nearest ISTS sub-station or connecting to STU networks instead adds to the risks and the resultant tariffs face tough competition from solarAmongst wind-rich states Gujarat led wind deployment in the country during 2016ndash2020 followed by Andhra Pradesh Karnataka and Tamil Nadu Figure 11 shows the annual wind capacity addition in these states
Karnataka has recorded the largest solar capacity deployments in the country in 2017 2018 and 2019
Figure 11 Gujarat saw the largest wind capacity additions among the wind-rich states (2016ndash2020)
Source Authorsrsquo analysis based on CSO Energy Statistics 2018 New Delhi MoSPI CSO Energy Statistics 2019 New Delhi MoSPI CSO Energy Statistics 2020 New Delhi MoSPI MNRE 2020 Annual Report 2019ndash2020 New Delhi MNRE
0
2000
1000
500
2500
3000
3500
4000
4500
5000
FY 2017
248 336772
316
1286
59
46087
123502
273
857
348
1303
882
2187
FY 2018 FY 2019 FY 2020
Cap
acit
y (in
MW
)
Andhra PradeshGujaratTamil Nadu Karnataka
How Indiarsquos Solar and Wind Policies Enabled its Energy Transition A Decade in Review
In 2019 political risks in the RE sector were exemplified when the new government in Andhra Pradesh took a strong stand on renegotiating wind and solar PPAs signed under Andhra Pradeshrsquos Wind Power Policy 2018 and Solar Power Policy 2018 (see Table 11)
Table 11 Timeline of the key events in the AP story
Source Authorsrsquo analysis
Date in 2019 Event
1 July
24 September
29 November
25 July
October
30 November onwards
1 December
12 July
AP government sets up a committee to renegotiate PPAsPSAs signed between 2012 and 2016
The AP High Court quashes the July 1 order and July 12 letters in writ petitions filed by the developers It directs the developers and discoms to approach the Andhra Pradesh Electricity Regulatory Commission (APERC) with their respective claims and to resolve all disputes in 6 months In the interim discoms will clear their dues and pay all power plants at the rate of INR 243 and INR 244 for wind and solar respectively
A compromise is reached between the Central and AP governments There is to be no tariff revision but concessional loans to be extended to discoms from PFC and IREDA to clear the dues
The AP High Court stays the July 1 order based on a petition by developers
Petition filed by AP discoms before APERC to review the tariffs
AP discoms clear pending dues at the rate of INR 243 and INR 244 for wind and solar respectively
The AP High Court stays the public hearing of the APERC on the tariff review petition filed by developers
Letter from AP Southern Power Distribution Company Limited (APSPDCL) one of the two state discoms to 139 wind and solar power plants to revise tariffs to INR 243 and INR 244 respectively
2016 onward SECIrsquos tendering activity has shifted towards ISTS-connected solar projects Between 2016 to 2019 it issued tenders worth 13000 MW of solar PV capacity (ISTS I to ISTS IX) and 12600 MW of wind capacity (Tranche I to Tranche IX) Figure 12 shows the deployment progress of solar projects awarded under the ISTS I to ISTS IX tenders by the SECI (as of August 2020)
Figure 12 ISTS-connected solar PV projects have poor completion record
Source Authorsrsquo analysis based on CEA 2020 Report of Under Construction Renewable Energy Projects New Delhi Renewable Energy Project Monitoring Division (CEA)
Solar PV capacity tendered
(ISTS-I to ISTS-IX)
13000
9530
4650
1800 17501080
250
Capacity awarded
PPAPSA or both not yet
executed
PPA and PSA signed
Financial closure
achieved
Plant erection in progress
Status not available
Cap
acit
y (in
MW
)
38
As is evident almost 50 per cent of the capacity that has been awarded is still awaiting closure of power purchase andor power sale agreements This implies that state discoms are not coming forward to offtake power from projects already awarded leaving developers and investors in a lurch For the capacity for which PPAs and PSAs have already been signed there have been significant delays because the required transmissionevacuation infrastructure is not ready and long-term access (LTA) to transmission has not been operationalised The COVID-19 pandemic has further impacted the construction of transmission lines increased delays and depressed electricity demand across the country Because of the lockdown enforced to curb the spread of the pandemic the MNRE had granted blanket extension of the scheduled commissioning timelines
For wind projects too the rate of commissioning has been rather slow (Figure 13) Most of the awarded projects will be coming up in Gujarat (Kutch) There were roadblocks with respect to the land allocation policy in Gujarat because of which no progress could be made Few projects are likely to come up in other host states such as Tamil Nadu Karnataka Maharashtra Madhya Pradesh and Kerala While the recent tenders (tranches VI to VIII) were undersubscribed several projects awarded earlier are facing delays due to non-readiness of transmission infrastructure and some projects have terminated their PPAs citing non-viability of projects at the discovered rates due to time and cost overruns Notably wind-rich sites are intrinsically more concentrated than solar logistically as well as resource-wise Therefore unless the sites are identified and prepared and transmission networks are appropriately planned strengthened in advance deployment would be slow One more option being tested is the windndashsolar hybrid or the blending approach and a bidding process akin to case I bidding in the conventional power sector to ease out on transmission variability and land-related risks
39Policy evolution in RE-rich states
Figure 13 The rate of commissioning of wind projects has been slow (August 2020)
Source Authorsrsquo analysis based on CEA 2020 Report of Under Construction Renewable Energy Projects New Delhi Renewable Energy Project Monitoring Division (CEA) CEA 2019 Summary of Solar and Wind Power projects (Commissioned and Under Construction) of SECI New Delhi Renewable Energy Project Monitoring Division (CEA)
Tendered (ISTS Tranche I to IX)
13400
9361
2085
Awarded Commissioned
Win
d c
apac
ity
(in M
W)
Policies facilitating land procurementThe MNRErsquos solar park scheme encourage states to develop solar parks to solve land procurement and connectivity problems All state policies encourage deployment in parks Most policies provide for designating solar power park developers (SPPDs) The SPPDs may be a state government-designated agency or a joint venture company (JVC) between a state-
How Indiarsquos Solar and Wind Policies Enabled its Energy Transition A Decade in Review 40
designated agency and SECI or a JVC between a state-designated agency and private agency or a private agency
The states under their respective solarRE policies have provided the necessary support and arrangements for developing the parks and projects have been successfully commissioned in the parks that are operational However there have been some challenges in developing these parks including problems in land acquisition by the SPPDs and mismatch in timelines for development activities and setting up of solar projects For example developers are facing several challenges with permissions clearances and approvals at the Kadapa Solar Park in Andhra Pradesh where the letters of award were issued in August 2018 but two years hence developers have yet not been able to begin any work there
For non-solar park projects land procurement is typically the generatorsrsquo responsibility particularly for projects set on private lands The Karnataka Renewable Energy Policy 2016ndash22 was the only policy that assigned the responsibility of identifying suitable land banks to the state nodal agency Andhra Pradeshrsquos Wind Power Policy 2018 and Solar Power Policy 2018 had entrusted NREDCAP with the responsibility of securing government lands However this provision was rolled back in 2019
The wind sector was again at a disadvantage here Most policies except recent solarndashwind hybrid policies did not address land requirements for wind power projects which are typically more concentrated in certain pockets In many cases windy sites were located far from plannedexisting intra- and inter-state networks Further all state policies require wind developers to either procure government land on a lease-hold basis on their own or procure private lands Even in SECIrsquos auction for ISTS-connected wind developers faced difficulties in securing land leases from the state governments and revenue departments For example while Gujarat had announced a wind power policy in 2016 to attract investments it took a policy decision in 2018 to not allocate any land to wind projects auctioned by SECI for exporting power to other states (Tenddulkar 2019) Later in January 2019 Gujarat announced a new land policy for wind solar parks as well as windndashsolar hybrid parks to demarcate land areas where these projects would be allowed
Policies for grid connectivity and project operationsFrom 2014 onward MNRE and SECI started coordinating with other line departments and agencies at the Central level to plan construct and strengthen intra- and inter-state networks To ensure the evacuation of power from 20 GW of wind and solar capacity the Centre sanctioned a project to augment the Intra-State Transmission System (InSTS) in 2015ndash16 STUs in eight RE-rich states ndash Tamil Nadu Rajasthan Karnataka Andhra Pradesh Maharashtra Gujarat Himachal Pradesh and Madhya Pradesh ndash are implementing this project
In 2016 the Ministry of Power waived off inter-state transmission charges and losses for wind and solar projects which is now applicable for projects being commissioned till June 2023 In state-level solarwindRE policies there appears to be some degree of disparity and uncertainty on grid connectivity evacuation forecasting scheduling and sale of power
In state-level policies there appears to be some degree of disparity and uncertainty on grid connectivity evacuation forecasting scheduling and sale of power
41Policy evolution in RE-rich states
bull As of July 2019 15 states had notified their regulations for forecasting scheduling and settlement of deviations for RE broadly in line with the CERC regulations (Srivastava Singhvi and Rustagi 2019) Most of these states permit an error band of (+-) 15 per cent as per CERC regulations In a few states such as in Tamil Nadu the error band is limited to a narrower range of (+-) 10 per cent Even within the same regional load dispatch region the error bands notified by states differ For example Maharashtra permits (+-) 15 per cent deviation while Gujarat allows only (+-) 12 per cent deviation for wind developers
bull Andhra Pradeshrsquos Wind Power Policy 2018 and Solar Power Policy 2018 stated that no transmission and distribution charges will be levied for inter-state wheeling of power Later the policy was amended in November 2019 and the exemptions were rolled back and charges as determined by the APERC were made applicable
bull To discourage open-access transactions of wind power Tamil Nadu increased the cross-subsidy surcharge for open-access consumers from 50 per cent of that for conventional power in 2016 to 60 per cent in 2018 Over the same period it also increased open-access charges from 40 per cent to 50 per cent of that for conventional power Such steps restrict significant new demand for RE amongst large commercial and industrial players by adding to the landed cost of RE power even as RE tariffs become cheaper than discoms tariffs
bull Banking charges for wind and solar vary by state The period of banking is also different for various states (Table 12)
bull Although RE is accorded a must-run status by several policies and grid codes curtailment continues for technical as well as commercial reasons Older projects that have higher tariffs face higher curtailment than newer projects In Tamil Nadu curtailment has reduced from a peak of 30ndash35 per cent to 20ndash25 per cent currently (Jhawar 2020) However it appears that commercial concerns are causing the Andhra Pradesh discoms to curtail RE power despite repeated judicial directions against it (Parikh 2020)
How Indiarsquos Solar and Wind Policies Enabled its Energy Transition A Decade in Review 42
Table 12 Banking charges and conditions across RE-rich states
Source Authorsrsquo adaptation based on MERC (Distribution Open Access) (First Amendment) Regulations 2019 Order No 82020 dated 7 October 2020 issued by the TNERC titled Order on Procurement of Wind Power and Related Issues Order No 22020 dated 30 April 2020 issued by the GERC titled Tariff Framework for Procurement of Power by Distribution Licensees and Others from Wind Turbine Generators and Other Commercial Issues for the State of Gujarat RERC (Terms and Conditions for Tariff Determination from Renewable Energy Sources) Regulations 2020 Order dated 14 May 2018 in matter No S032017 issued by the KERC titled Revision of Wheeling and Banking Charges for Renewable Power Projects
Banking charges Other conditionsBanking period
No banking charges for wind projects
10 per cent of RE banked in kind
14 per cent of input energy
No banking charges
2 per cent of RE banked in kind
2 per cent of the injected energy in kind
No banking allowed
One month
April to March barring peak hours as determined by the discoms
One FY (April to March)
One month
One month
January to June ndash for wind projects
April to September and October to March ndash for solar projects
Monthly settlement for non-REC wind projects
Banking facility not available for third-party sale and REC-based captive power plants (CPP)
Energy banked during the peak time of day (TOD) hours may be drawn during off-peak TOD slots but not vice-versa
The unutilised banked energy at the end of the month up to 10 per cent of the total energy generated in that month to be purchased by discoms at the applicable generic tariffs for the year
Unutilised banked energy at the end of six months to be purchased by discoms at 85 per cent of the applicable generic tariff
The energy banked by non-REC projects during the peak ToD hours can only be drawn during the peak ToD hours
Banking allowed for CPP but not for third-party sales under open access within the state
The unutilised banked energy will lapse at the end of the year
The unutilised banked energy as of March 31 to be encashed at 75 per cent of the applicable wind energy tariff for existing wind energy captive users
Excess generation or unutilised banked energy at the end of the month to be purchased at 75 per cent of the wind energy tariff for captive users For captive REC generators the unutilised banked energy can be encashed at 75 per cent of the pooled cost of power
Gujarat
Rajasthan
Tamil Nadu For wind projects commissioned till 31 March 2018
For wind projects commissioned on or after 1st April 2018
Maharashtra
Karnataka
Andhra Pradesh
State
43
5 Policy evolution in RE-deficit states
Image iStock
As discussed above southern and western states in India have abundant RE and land resources to develop large-scale wind and solar power projects However the northern
states in the Indo-Gangetic plains are densely populated agricultural states The mountain regions in the north have excellent solar resources and are sparsely populated but have forest areas and difficult terrains and low transmission capacities The coal economy is dominant in the eastern states
How Indiarsquos Solar and Wind Policies Enabled its Energy Transition A Decade in Review 44
The policy response to developing large-scale solar and wind has been weak in the non-RE-rich states as compared to RE-rich states Our review accounts for three key states ndash Uttar Pradesh Bihar and Punjab
Key driversThe key drivers for promoting RE were poor power supply in the rural as well as urban area growing energy needs in urban industrial and commercial sectors and the need to comply with RPOs Policies intended to attract private-sector investments improve rural livelihoods and create employment opportunities through grid-connected decentralised RE projects and local manufacturing facilities
Policy focusMost of the initial policies were notified starting late 2012 and largely focused on decentralised RE such as rooftop solar solar irrigation pumps off-grid renewables and other RE resources such as bioenergy For example
bull Punjab New and Renewable Sources Policy 2012 focused on rooftop and decentralisedoff-grid generation waste to energy biomass-based cogeneration and new technologies
bull Uttar Pradeshrsquos solar policies of 2013 and 2017 focused on decentralised solar as well as large-scale grid-connected solar because of wastelands being available in the Bundelkhand region
bull Bihar Policy for Promotion of New and Renewable Energy Sources 2011 focused on biomass and biogas cogeneration projects minimicrosmall hydro wind and solar and municipal solid waste-based projects but with no specific targets
These statesrsquo policies promoted the local deployment of projects There was little emphasis on discoms buying wind and solar power from other states or buy RECs to meet solar and non-solar RPOs which were set relatively low as compared to RE-rich states This may be because the states were keen to attract investments and create jobs in their own states and bolster their own generation capacities rather than depending on other states
Even the recent policies of the RE-deficit states do not demonstrate any intent to purchase powerRECs to meet RPOs particularly the non-solar component
Performance of policiesAmong the RE-deficit states Uttar Pradesh and Punjab are leading in terms of solar deployment They are among the top 10 solar states in the country However their RPO compliance has remained weak In the year 2019ndash20 the compliance level for Uttar Pradesh was only 353 per cent whereas for Punjab it was 438 per cent (MoP 2020a) Uttar Pradesh discoms also rank among the least performing discoms of the country (ICRA Limited and CARE Ratings 2019)
Uttar Pradesh notified two solar policies ndash once in 2013 which was later superseded by a policy in 2017 The 2013 Solar Policy stated a target of 500 MW of solar capacity to be deployed
Policies in RE-deficit states promoted local project deployment with little emphasis on discoms buying wind and solar power from other states or RECs to meet RPOs
45Policy evolution in RE-deficit states
by 2017 This policy was the first of its kind because it had an exclusive budgetary allocation for discoms to procure solar power and for state nodal agencies to effectively administer and implement the policy The policy achieved 420 MW against the target of 500 MW by 2017 but presented some uncertainties such as
bull The duration of power purchase agreements was made 10 years as opposed to the usual practice of 25 years the possibility of extending PPAs beyond the 10-year duration at the prevailing APPC price did exist but this represented an uncertainty for developers
bull Strict enabling provisions for establishing solar parks were missing As a result developers reported delays due to the lack of grid infrastructure and difficulties in allotting ready land inside solar parks
The Uttar Pradesh New and Renewable Energy Development Agency (UPNEDA) initiated a competitive bidding round in March 2013 which led to the discovery of tariffs in the range of INR 801 to INR 933 per unit among the highest for any state during that time These high tariffs may be attributed to real and perceived risks specific to the policy as well as the legacy power sector issues in the state Later there were many instances when UPrsquos distribution companies renegotiated tariffs under the PPAs signed during 2015ndash16 This affected completed and under-construction grid-connected solar projects as well as the investor confidence in the sector
The UP Solar Power Policy 2017 set high targets ndash 10700 MW of installed solar capacity by 2022 out of which 6400 MW should be utility-scale projects Some improvements that were made included PPAs for 25 years facilitative provisions for land procurement additional incentives for projects in the Bundelkhand region and modalities for establishing solar parks Currently 973 MW of large-scale solar projects are in operation and about 17 GW capacity is under development (Ranjan 2020)
Recent tenders by UPNEDA have been cancelled or undersubscribed In July 2018 UPNEDA cancelled a 1 GW tender floated in January citing high tariffs Two tenders of 500 MW each in January and October 2019 were undersubscribed The reasons reported for under-subscription included inadequate gridevacuation infrastructure particularly in the Bundelkhand region and the changes made in the PPA
Punjab under its New and Renewable Sources of Energy (NRSE) Policy 2012 aimed to install 1000 MW solar by 2017 Till FY 2020 it had installed 947 MW (MNRE 2020) Although the policy emphasised installations within the state the potential for large-scale solar power in the state is limited Therefore Punjab has been procuring solar and wind power from ISTS-connected projects to meet its solar and non-solar RPO targets Punjab State Power Corporation Limited (PSPCL) signed long-term agreements with SECI and NTPC and has entered into short-term agreements with wind and solar generators for this purpose
The Bihar Policy for Promotion of New and Renewable Energy Sources 2011 was notified in June 2011 It did not state any specific targets for the segments covered The new policy in 2017 set a target of 2969 MW from solar by 2022 out of which 1000 MW was dedicated to grid-connected rooftop solar Even though this policy was notified in June 2017 it did not explicitly put out the intent to purchase solar and wind power through inter-state transactions or
45Policy evolution in RE-deficit states 45Policy evolution in RE-deficit states
In Uttar Pradesh competitive bidding in early years discovered tariffs that were higher compared to other states signalling the high risk perception amongst the industry
How Indiarsquos Solar and Wind Policies Enabled its Energy Transition A Decade in Review 46
Central procurement through SECI By December 2019 Bihar had installed 341 MW of RE capacity (CEA 2020a) out of which grid-connected solar was 149 MW and the rest was non-solar (small hydro biomass cogeneration etc) In FY 2018ndash19 Bihar discoms procured 10 MW solar and 300 MW wind power through SECIrsquos ISTS-connected projects19 In June 2019 the Bihar Renewable Energy Development Authority (BREDA) issued its first tender for setting up 250 MW of ground-mounted solar projects in the state which was re-issued in December 2019 because the state regulatory commission did not approve the high ceiling tariffs With these efforts however Biharrsquos RPO compliance at the end of March 2020 was 15 per cent with respect to Central trajectories (MoP 2020a)
Grid integrationThe initial policies by these states had some typical provisions regarding grid connectivity and transmission of power Like many other state policies on connectivity Uttar Pradeshrsquos solar power policies as well as Punjabrsquos RE Policy 2012 required developers to lay their own transmission lines to the nearest sub-station at their own cost However the UP government committed to bear all transmission-related expenditure for all solar projects in the Bundelkhand region Under Biharrsquos RE Policy 2017 the state government committed to bear connectivity-related expenditure only in cases where the RE plant is located within 10 km from the nearest sub-station
Transmission chargesPunjabrsquos 2012 policy accorded must-run status to grid-connected renewables and exempted transmission and wheeling charges for intra-state open-access sales for 10 years for RE projects commissioned up to 31 March 2017 No explicit exemptions were provided for inter-state open access unlike Uttar Pradesh which interestingly under its Solar Power Policy 2017 allowed the solar developer to sell power across the country with a 100 per cent waiver of transmission charges ndash a one of its kind provision among policies rolled out by RE-deficit states Biharrsquos RE Policy 2017 provided exemptions for wheeling of power from RE projects put up for captive use or intra-state third-party sales
Incentives for project development and operationsIt is interesting to note that some provisions in these policies were outstanding For example
Offtake and payments
bull Punjab required procurers to clear all payment dues within 60 days with rebate entitlements as incentives for early clearances
bull UP allocated budgetary support for the first 200 MW of solar projects to be payable to discoms to equalise solar and conventional power This support was equivalent to the difference between tariffs discovered for conventional power through case I bidding and the solar power tariffs discovered through reverse bidding
19 Order dated 20 March 2020 in Case No 30 2019 and 312019 issued by the BERC titled Tariff Order Truing up for FY 2018-19 Annual Performance Review for FY 2019-20 Annual Revenue Requirement (ARR) and determination of Retail Tariff for FY 2020-21 for North Bihar Distribution Company Limited (NBPDCL) and South Bihar Distribution Company Limited (SBPDCL) httpsberccoinorderstariffdistributionsbpdcl2216-tariff-order-of-nbpdcl-for-fy-2019-22
Uttar Pradesh under its Solar Power Policy 2017 allowed solar developers to sell power across the country with a 100 waiver of transmission charges
Ease of doing business investor attractiveness facilitation
bull Punjab assigned the Bureau of Investment Promotion the task of granting regulatory clearances and fiscal incentive approvals
bull Punjab extended benefits to RE projects under its Fiscal Incentives for Industrial Promotion Policy 2013 It also provided 50 to 100 per cent exemption on stamp duty property tax and electricity duty
bull Incentives under the Uttar Pradesh State Industrial Policy 2012 applied to power plants based on solar energy
bull All RE plants set up for commercial sale of power were eligible for an additional 30 per cent tax benefit on the approved project cost
bull Bihar established a Renewable Energy Development Fund under the new policy notified in 2017 This fund was supposed to be capitalised through
raquo a one-time facilitation fee of INR 100000 per MW payable during the application process for a project of more than one MW capacity
raquo a RE development cess of 10 paise per unit of power sold in the state by discoms (excluding below poverty line and agricultural consumers) subject to Bihar Electricity Regulatory Commissionrsquos (BERC) approval and
raquo a service charge of 7 per cent payable to BREDA for the execution of RE projects However this seems to be a proposal in the policy and is not executed in practice yet
47Policy evolution in RE-deficit states
How Indiarsquos Solar and Wind Policies Enabled its Energy Transition A Decade in Review 188
Image iStock
Discoms continue to be tied-up with long-term PPAs and most investors continue to base their business projections on Central and state bidding pipelines
49
With the evolving policy landscape at the Central and state level we have seen Indiarsquos renewable energy sector grow tremendously In 2010 the total installed RE capacity
was just about 18 GW which has grown almost five-fold over the decade
As our analysis suggests there were high and low points in this journey Every time a roadblock emerged India has been successful in testing and identifying alternate approaches and solutions Some of these include bundling solar power with conventional power to counter high tariffs in 2010 introducing solar parks when deployment became slow and tough increasing RPO targets to create the necessary demand creating and backing SECI to address counterparty risks accelerating tendering activity to signal a commitment to creating strong pipelines encouraging solarndashwind hybrid parks to improve utilisation factors introducing protocols and mechanisms such as market-based economic dispatch a real-time market and a green term ahead market to optimise grid integration costs With economics favouring RE its share in Indiarsquos electricity mix is only expected to grow
De-risking investments in project development has unquestionably been the focus of the policies thus far However policies have mostly not pre-empted any of the risks but developed through an iterative process that has mostly responded to immediate investor concerns Hence non-compliance with RPO targets by the states was met with centralising target setting and making them even higher the Centre responded to PPA renegotiation attempts by states with intra-se negotiations with the states and financial relief to the concerned states for addressing payment delays by discoms the Centre imposed additional financial liability on the discoms by way of the LC mechanism
Imminent market disruptions Further while CERC and the power exchanges have taken forward looking steps with introducing new market platforms there has yet been no attempt to create avenues for participation of greenbalancing power providers and buyers in these markets The discoms continue to be tied-up with long-term PPAs and most investors continue to base their business projections on Central and state bidding pipelines Other developments that threaten the investorsrsquo current business model include
bull Expectations of returns have increased since early 2019 that indicates that risk perceptions of investors have also increased (investors expect higher returns for riskier investments)
6 Looking back to look ahead
Recent developments threaten investorsrsquo current business models
How Indiarsquos Solar and Wind Policies Enabled its Energy Transition A Decade in Review
There are fewer developers who are cornering a greater share of the projects (Dutt Arboleya and Gonzalez 2020) This could mean that entry barriers to the sector are increasing and the incumbents will have a high stake in maintaining status quo Further the exit of many smaller players by selling their assets indicates that navigating Indiarsquos policy and governance environment remains a challenge (Chandra 2020)
bull Commercial and industrial consumers are increasingly turning to DRE to meet their power needs The MoP has recently floated a plan to create lsquoindustrial hubsrsquo that will have their own power supplier This power supplier is likely to be a private entity given the status of a deemed licensee under the EA (Jai 2020) Further calls for lowering commercial and industrial tariffs are becoming louder in the wake of economic downswing (Financial Express 2020) These developments threaten the principal source of revenue for the discoms and will have a cascading effect on ability of discoms to absorb RE power and invest in grid integration Poor revenues will worsen their ability make payments under the PPAs
bull The increasing competitiveness of DRE also makes them an important source of supply for the power markets Discoms are discovering benefits of economising on total power procurement costs by procuring power from the exchanges (Thomas 2020) If given the flexibility it is likely that discoms would prefer to expand exchange-based procurement rather than signing PPAs for all their projected load
bull The unexpected reduction in wind generation in 2020 by up to 43 per cent during the typical high generation period due to low wind speeds caught project developers and system operators by surprise (Singh and Mohanty 2020) Climate change could bring greater uncertainty and variation in weather patterns Project developers need to be better prepared with rigorous and advanced weatherresource forecasting and tools and techniques to make timely and robust investment and operational decisions
bull End of life waste management is going to be a serious concern very soon Developers might not have factored this into costs and current policies are unclear as to who will be required to bear these costs Developers must pre-emptively focus their attention to waste management and not be unpleasantly surprised when the government eventually wakes up to the challenges (Tyagi and Kuldeep Forthcoming)
Policies must pre-empt risks and support transition to a market-driven sector
We are now entering the next decade which could make India a RE powerhouse A target of 450 GW of RE by 2030 has been set However addressing new and legacy issues of the power sector cost-effectively managing the operations of existing assets while also integrating a large quantum of new renewable capacity are challenges that confront us today
Centrendashstate and inter-state alignment requires collaboration not mandates and penalties
Over the last three years RE costs have fallen significantly At the same time regulations allow the transmission of power from a RE-rich state to any other state in the country or the purchase of RECs for an entity to meet its RPO Despite all the obvious benefits that RE
50
It is likely that discoms would prefer to expand exchange-based procurement rather than signing PPAs for all their projected load
51Looking back to look ahead
resources have to offer states have shown some level of resistance to either deploying or buying more RE power and meeting the national targets We have seen above that states do push back when it does not make commercial sense for them or they are unable to allocate resources to meet national targets Policies so far have not resulted in alignment of Centre-state objectives and actions Further there is no institutional or political platform to bring together Centre and state representatives for collective problem solving The Centre has previously determined national capacity and consumption targets unilaterally without previous consultations and engagement It appears that the current policies and mechanisms must evolve if the gaps between RE-rich and RE-deficit states are to be bridged Some approaches to increase alignment may be
bull Account for all the costs benefits and co-benefits of achieving national targets Subsequently the principles of cost- and benefit-sharing must be established and reflected in Central policies inter-state regulations and market mechanisms to drive states towards meeting national goals and objectives An example of sharing costs may be that RE-deficit states support RE manufacturing industry and make it cost competitive globally This will create a buy-in for RE-deficit states in promoting and adopting RE
bull For long-term clarity directional uniform RPO targets can be set out for all states However states may be given the freedom to choose their own technologyclean energy mix to meet the national target
bull Institutional mechanisms may be devised that bring together the Centre and the states for resolution of issues and greater buy-in of the states towards national objectives
Addressing counterparty risks will require transformation of RE procurement models
While Indiarsquos commitment to RE is strong and sustained the consistent poor financial health of discoms poses significant risks to further growth of the sector These risks include delayed payments power curtailment and contract re-negotiation We have learnt from our policy experience so far that mandates and higher penalties have limited impact Project deployment has decreased despite the Centre taking strict and swift action against errant discoms Fundamental reforms in the distribution sector and market operations will be needed to mitigate these risks For example
bull Increasing the ability of discoms to access cheaper balancing resources
bull Rigorous demand forecasting to identify power purchase requirements under long-term contracts
bull Adopting alternate models such as solar power irrigation pumps or using distributed RE for meeting productive and consumptive loads in rural areas to reduce the subsidycost burden on discoms or urban micro-grids to manage peak loads (Tyagi Kuldeep and Dave 2020)
bull Adopting market-based procurement mechanisms for storage capacities including battery pumped storage hydro resources etc
bull Simplifying and rationalising retail tariff structures and adopting alternate subsidy disbursement mechanisms to ensure revenue recovery
Measures required to improve discom financial health and increase their flexibility in power procurement may not be aligned with the incumbent business models
How Indiarsquos Solar and Wind Policies Enabled its Energy Transition A Decade in Review 52
bull Encouraging enhanced participation in new mechanisms such as market-based economic dispatch of power plants real-time markets ancillary markets etc
However all these measures that are required to improve discom financial health and increase their flexibility in power procurement may not be aligned with the incumbent business models Investors and project developers must adapt to new market contours to stay relevant
Contrasting interests of RE manufacturers and developers must converge
Project developers have viewed policies that have aimed to support domestic manufacturing adversely or indifferently Developers preferred cheaper thin film modules when DCR was part of the NSM as against procuring locally manufactured crystalline modules Project activity slowed down when safeguard duty was introduced Developers have also been arguing against imposition of customs duties that is being demanded by manufacturers
However local manufacturing and backward and forward integration of not only generation equipment but also battery storage is essential for RE sector to be future ready and insure against geopolitical risks Lessons learnt from the COVID-19 pandemic and geopolitical tensions must be internalised Developers and manufacturers must collectively find solutions that work for them They can take cues from the initial days of spread of wind technology Wind technology in India spread through research and demonstration collaborations between countries Equipment manufacturers also expanded into project development that gave them a stake in project activity as well as manufacturing More integrated supply chains and linkages must be explored by developers and manufacturers
Institutional framework ndash planning coordination and analytical requirements
Strong institutions are prerequisites for better performance and coordination Developers must aim to work with both Central and state institutions to create data sharing and information protocols For example there is not enough data to detect reasons for curtailment As we aim to increase the share of RE in the electricity mix strong institutions with clear performance standards and a coordination mechanism are essential The functions roles and responsibilities of key power sector institutions need to evolve with national ambitions For example
bull Strict monitoring and reporting of RE curtailment and the underlying reasons
bull Data and information-sharing protocols and analytical requirements for specific institutions
bull Instituting processes for bottom-up integrated resource planning (IRP) to build an optimal and cost-effective electricity system This will include relevant Central level institutions to develop and disseminate guiding frameworks toolkits and processes that any state can utilise to conduct a robust planning exercise
bull Coordination mechanism to consistently monitor the implementation of policies programmes and plans by institutions
Such new roles and responsibilities must be formally assigned to institutions for reducing
Strong institutions with clear performance standards and a coordination mechanism are essential
53
discretion ensuring greater alignment between the Centre and states enhancing the ease of doing business reducing risks for investors and accelerating the pace of the energy transition
Accelerating the flow of capital into the sector
To achieve Indiarsquos ambitious RE targets for 2030 the country would need an additional investment of USD 199 billion (approximately INR 146 lakh crore) in generation alone Investments in transmission and storage will be over and above this (Singh Dutt and Sidhu 2020) Most of this requirement will need to be met through debt finance It is a challenge to raise such enormous amounts of debt capital when our financial institutions are already crossing the regulatory limits of exposure to the power sector As noted above the sector is seeing robust secondary market activity This has become a crucial source of finance for project developers who hive off operational assets to raise funds for fresh investment Investment trusts in infrastructure (InvIT) that have tax incentives may emerge to be an attractive model for divestment of assets especially for divestment to institutional investors who want predictable returns without managing the assets directly In the power sector transmission assets have been structured as InvITs and helped the promoter retain interest in the project while obtaining additional equity investment
Sectoral and financial policies would need to focus on tapping alternative sources of financing Research by the Council on Energy Environment and Water (CEEW) suggests that the issuance of domestic bonds for refinancing loans can unlock the ability of these institutions to lend to new RE projects According to the research this option may be operationalised by providing a limited period credit enhancement subsidy for domestic RE bond issuances
Looking back to look ahead
How Indiarsquos Solar and Wind Policies Enabled its Energy Transition A Decade in Review
Aggarwal Manu and Kanika Chawla 2019 Grid Integration Guarantee A Financial Buffer to Address Renewable Energy Curtailment New Delhi CEEW httpswwwceewinsitesdefaultfilesCEEW-Grid-Integration-Guarantee-17ul19pdf
Arora Bhanvi 2019 ldquoWhy Indiarsquos Wind Turbine Makers Are Under Stressrdquo Bloomberg Quint 22 August Accessed 12 October 2020 httpswwwbloombergquintcombusinesswhy-indias-wind-turbine-makers-are-under-stress
Balan Premal 2014 ldquoAptel Rejects GUVNLrsquos Bid to Cut Solar Power Tariff in Gujaratrdquo Business Standard 27 August Accessed 12 October 2020 httpswwwbusiness-standardcomarticlecurrent-affairsaptel-rejects-guvnl-s-bid-to-cut-solar-power-tariff-in-gujarat-114082700828_1html
Bhaskar Utpal 2020 ldquoHow Rewa solar park helped Indiarsquos green economy turn a cornerrdquo Mint 10 July Accessed 12 October 2020 httpswwwlivemintcomindustryenergyhow-rewa-solar-park-helped-india-s-green-economy-turn-a-corner-11594352166677html
Bridge to India 2017 ldquoIndian developers caught between a rock and a hard placerdquo 28 August Accessed 26 November 2020 httpbridgetoindiacomindian-developers-caught-rock-hard-place
Buckley Tim and Kashish Shah 2020 Indiarsquos Renewable Energy Policy Headwinds New Delhi IEEFA httpsieefaorgwp-contentuploads202002Indias-Renewable-Energy-Policy-Headwinds_February-2020pdf
CEA 2019a Growth of Electricity Sector in India From 1947-2019 New Delhi CEA MoP
CEA 2019b Summary of Solar and Wind Power projects (Commissioned and Under Construction) of SECI New Delhi Renewable Energy Project Monitoring Division (CEA) httpsceanicinreportsothersplanningrpmSECI20Project_Summarypdf
CEA 2020a All India Installed Capacity as on 31 December 2019 New Delhi CEA httpswwwceanicinreportsmonthlyinstalledcapacity2019installed_capacity-12pdf
CEA 2020b Executive Summary on Power Sector April 2020 New Delhi CEA httpsceanicinwp-contentuploads202006exe_summary-04pdf
CEA 2020c Report of Under Construction Renewable Energy Projects New Delhi Renewable Energy Project Monitoring Division (CEA) httpsceanicinreportsothersplanningrpmunderconstructionpdf
CERC 2018 Discussion Paper on Market Based Economic Dispatch of Electricity Re-designing of Day-ahead Market (DAM) in India New Delhi CERC httpwwwcercindgovin2018draft_regDP31pdf
Chandra Rohit 2020 ldquoCheering a Lap-win in an Unfinished Racerdquo Financial Express 1 December Accessed 1 December 2020 httpswwwfinancialexpresscomopinioncheering-a-lap-win-in-an-unfinished-race2140347
Chandrasekaran Kaavya 2017 ldquoMNRE asks Tamil Nadu to prevent curtailment of solar powerrdquo The Economic Times 9 October Accessed 12 October 2020 httpsmeconomictimescomindustryenergypowermnre-asks-tamil-nadu-to-prevent-curtailment-of-solar-powerarticleshow60997998cms
Chatterjee Anupam 2019 ldquoSolar Tenders Remain Hugely Undersubscribed mdash Herersquos What Caused Tepid Responserdquo Financial Express 4 December Accessed 28 November 2020 httpswwwfinancialexpresscomindustrysolar-tenders-remain-hugely-undersubscribed-heres-what-caused-tepid-response1783670
References
54
55
Chawla Kanika 2020 ldquoIndia-China tensions Will Indiarsquos Energy Transition be a Collateral Damagerdquo Financial Express 1 August Accessed 26 November 2020 httpswwwfinancialexpresscomopinionindia-china-tensions-will-indias-energy-transition-be-a-collateral-damage2041561
Atal Vinit and Gireesh Shrimali 2018 An Assessment of Indiarsquos Energy Choices Financial Performance and Risk Perception New Delhi CPI httpclimatepolicyinitiativeorgwp-contentuploads201805Financial-Performance-and-Risk-Perceptionpdf
CAG 2015 Report of the Comptroller and Auditor General of India on Renewable Energy Sector in India Report No 34 of 2015 New Delhi CAG httpscaggovinuploadsdownload_audit_report2015Union_Civil_Performance_Renewable_Energy_Report_34_2015pdf
CRISIL 2017 ldquoCompetitive Bidding Set to Transform Wind Power Marketrdquo May Accessed 28 November 2020 httpswwwcrisilcomcontentdamcrisilour-analysisviews-and-commentariesinsightsCRISIL-Research-Insights-Competitive-bidding-a-blow-for-wind-power-sector-may2017pdf
CSO Energy Statistics 2010 New Delhi MoSPI
CSO Energy Statistics 2012 New Delhi MoSPI
CSO Energy Statistics 2013 New Delhi MoSPI
CSO Energy Statistics 2014 New Delhi MoSPI
CSO Energy Statistics 2015 New Delhi MoSPI
CSO Energy Statistics 2016 New Delhi MoSPI
CSO Energy Statistics 2017 New Delhi MoSPI
CSO Energy Statistics 2018 New Delhi MoSPI
CSO Energy Statistics 2019 New Delhi MoSPI
CSO Energy Statistics 2020 New Delhi MoSPI
Deign Jason 2017 ldquoIndiarsquos Record-Low Wind and Solar Prices May Not Be Sustainablerdquo Greentech Media 25 September Accessed 26 November 2020 httpswwwgreentechmediacomarticlesreadindias-renewable-energy-auctions-may-not-be-sustainable
Deloitte and CII 2015 ldquoSolar Power in Karnataka Charting the Path for a Bright Futurerdquo Knowledge Paper for CII Karnataka Conference on Power July httpswww2deloittecomcontentdamDeloitteinDocumentsenergy-resourcesin-enr-solar-power-in-karnataka-noexppdf
Dutt Arjun Lucila Arboleya and and Pablo Gonzalez 2020 Clean Energy investment Trends Mapping Project Level Financial Performance Expectations in India New Delhi Paris CEEW and IEA httpscefceewinsolutions-factoryCEEW-CEF-clean-energy-investment-trends-2020pdf
Economic Times 2010 ldquoGujarat Takes the Lead Among States in Solar Powerrdquo The Economic Times 2 November Accessed 12 October 2020 httpseconomictimesindiatimescomspecial-featuregujarat-takes-the-lead-among-states-in-solar-powerarticleshow6855821cmsfrom=mdr
Economic Times 2019 ldquoPower Ministry order on LCs to Face Challenges India Ratingsrdquo Economic Times 18 July Accessed 26 November 2020 httpseconomictimesindiatimescomindustryenergypowerpower-ministry-order-on-lcs-to-face-challenges-india-ratingsarticleshow70279939cmsfrom=mdr
ETEnergyWorld 2020 ldquoGovt plans 20 GW capacity solar tenders till June 2021rdquo ETEnergyworldcom 18 March
References
How Indiarsquos Solar and Wind Policies Enabled its Energy Transition A Decade in Review 56
Accessed 12 October 2020 httpsenergyeconomictimesindiatimescomnewsrenewablegovt-plans-20-gw-capacity-solar-tenders-till-june-202174688993
Financial Express 2020 ldquoLower power tariff can boost Make in India after corona crisisrdquo Financial Express 8 May Accessed 29 November 2020 httpswwwfinancialexpresscomeconomylower-power-tariff-can-boost-make-in-india-after-corona-crisis1951679
Ganesan Karthik Poulami Choudhury Rajeev Palakshappa Rishabh Jain and Sanyukta Raje 2014 Assessing Green Industrial Policy ndash The India Experience New Delhi CEEW httpswwwiisdorggsisitesdefaultfilesrens_gip_indiapdf
Garg Vibhuti and Kashish Shah 2020 The Curious Case of Indiarsquos Discoms New Delhi IEEFA httpsieefaorgwp-contentuploads202008The-Curious-Case-of-Indias-Discoms_August-2020pdf
Garg Vibhuti Balasubramanian Viswanathan Danwant Narayanaswamy Christopher Beaton Karthik Ganesan Shruti Sharma and Richard Bridle 2020 Mapping Indiarsquos Energy Subsidies 2020 Fossil Fuels Renewables and Electric Vehicles Winnipeg IISD httpswwwiisdorgsystemfilespublicationsindia-energy-transition-2020pdf
ICRA Limited and CARE Ratings 2019 State Distribution Utilities Seventh Annual Integrated Rating New Delhi MoP httpspfcindiacomDocumentRepositoryckfinderfilesGoI_InitiativesAnnual_Integrated_Ratings_of_State_DISCOMs7th_Rating_Booklet_Final_13-10-2019pdf
Idam Infra 2016 Procurement of Wind Power Wind Vision India 2032 New Delhi Shakti Sustainable Energy Foundation httpsidaminfracomwp-contentuploads201607Wind-Vision-2032-A-Multi-Stakeholder-Perspectivepdf
IEA 2020 ldquoEvolution of Solar PV Module Cost by Data Source 1970-2020rdquo 30 June Accessed 28 November 2020 httpswwwieaorgdata-and-statisticschartsevolution-of-solar-pv-module-cost-by-data-source-1970-2020
India RE Navigator 2020 ldquoAuction Resultsrdquo Accessed 28 November 2020 httpsindia-re-navigatorcomwind
IRENA 2017 ldquoRenewable Energy Prospects for Indiardquo Working Paper Based on REmap May IRENA httpswwwirenaorg-mediaFilesIRENAAgencyPublication2017MayIRENA_REmap_India_paper_2017pdfla=enamphash=4B737628E6D1E4C7F04551C26B3C3F7EB768281A
IWTMF 2019 ldquoIndia - Wind Power Capacity Installations FY 2018-19rdquo Accessed 28 November 2020 httpsindianwindpowercompdfSTATE-WISE-MONTH-WISE-WIND-INSTALLATIONS-FY-2018-19pdf
Jai Shreya 2018 ldquo35 GW of Solar Tenders in Limbo Thanks to Tax and Regulatory Nigglesrdquo Business Standard 27 February Accessed 28 November 2020 httpswwwbusiness-standardcomarticleeconomy-policy3-5-gw-of-solar-tenders-in-limbo-owing-to-tax-and-regulatory-niggles-118022700346_1html
Jai Shreya 2020 ldquoGovt Plans Separate Electricity Distribution Channel for Industriesrdquo Business Standard 16 November Accessed 28 November 2020 httpswwwbusiness-standardcomarticleeconomy-policygovt-plans-separate-electricity-distribution-channel-for-industries-120111600018_1html
Jhawar Pratha 2020 ldquoRenewable Energy Curtailment is a Banerdquo Down to Earth 17 January Accessed 12 October 2020 httpswwwdowntoearthorginblogenergyrenewable-energy-curtailment-is-a-bane-68857
Jog Sanjay 2013 ldquoBanks Say PPA Structure for Solar Projects not Bankablerdquo Business Standard 20 January Accessed 12 October 2020 httpswwwbusiness-standardcomarticlefinancebanks-say-ppa-structure-for-solar-projects-not-bankable-110083100077_1html
Kapoor Karan Krishan K Pandey AKJain and Ashish Nandan 2014 ldquoEvolution of Solar Energy in India A Reviewrdquo Renewable and Sustainable Energy Reviews (40) 475-487 httpdxdoiorg101016jrser201407118
57References
Kumar Alok and Sushanta Chatterjee 2012 Electricity Sector in India Policy and Regulation New Delhi Oxford University Press
Kumarankandath Aruna 2015 ldquoWTO Rules Against Indiarsquos Domestic Content Requirements in Solar Powerrdquo Down to Earth 3 September Accessed 26 November 2020 httpswwwdowntoearthorginnewsenergywto-rules-against-india-s-domestic-content-requirements-in-solar-power-50977
MNRE 2017 Agenda Note for National Review Meeting of State Principal Secretaries and State Nodal Agencies of Renewable Energy on 23-24 January 2017 httpssolarrooftopgovinnotificationNotification-09012017pdf
MNRE 2019 Annual Report 2018ndash19 New Delhi MNRE httpsmnregovinimgdocumentsuploadsfile_f-1608040317211pdf
MNRE 2020a Annual Report 2019ndash20 New Delhi MNRE httpsmnregovinimgdocumentsuploadsfile_f-1597797108502pdf
MNRE 2020b Physical Progress Achievements Accessed 26 November 2020 httpsmnregovinthe-ministryphysical-progress
Mondal Debapriya 2016 ldquoWTO Ruling on Domestic Content Requirement in Solar A Blessing in Disguiserdquo ETEnergyWorld 26 September Accessed 26 November 2020 httpsenergyeconomictimesindiatimescomnewsrenewablewto-ruling-on-domestic-content-requirement-in-solar-a-blessing-in-disguise54527456
MoP 2010 Annual Report New Delhi MoP httpspowerminnicinsitesdefaultfilesuploadsAnnual_Report_2009-10_Englishpdf
MoP 2016 Guidelines for Long-term RPO Growth Trajectory of Renewable Purchase Obligations (RPOs) for Non-solar as well as Solar Order No 2332016-RampR New Delhi MoP 22 July httpswwwmahaurjacommedadatarporecreportsMoP20on20Long20term20RPO20trajectorypdf
MoP 2018 Long-term RPO Growth Trajectory of Renewable Purchase Obligations (RPOs) for Solar and Non-solar for a Period of Three Years ie 2019ndash20 to 2021ndash22 Order No 23032016ndashRampR New Delhi MoP 14 June httpspowerminnicinsitesdefaultfileswebformnoticesRPO_trajectory_2019-22_Order_dated_14_June_2018pdf
MoP 2019 Opening and Maintaining of Adequate Letter of Credit (LC) as Payment Security Mechanism under Power Purchase Agreements by Distribution Licensees Order No 23222019-RampR New Delhi MoP 28 June httpsmnregovinimgdocumentsuploadsbf4ce66944bd410bb39ef4cf60cbaa6apdf
MoP 2020a Agenda Background Conference of Power and Renewable Energy Ministers of States and UTs 3 July 2020 New Delhi 3 July
MoP 2020b Regarding MoP Order dated 28062019 regarding opening and maintaining of adequate Letter of Credit (LC) as Payment Security Mechanism under Power Purchase Agreements by Distribution Licensees Order No 23222019-RR New Delhi MoP 27 March httpspowerminnicinsitesdefaultfileswebformnoticesFinal_Clarification_to_the_orders_of_MoP_letter_dtd_06042020pdf
Naidu Katya 2013 ldquoSuzlon to Build Land Bankrdquo Business Standard 20 January Accessed 12 October 2020 httpswwwbusiness-standardcomarticlecompaniessuzlon-to-build-land-bank-111112900026_1html
Paliwal Ankur and Jonas Hamberg 2015 ldquoSolar Mission Phase II May Reign in Import of Thinfilmsrdquo Down to Earth 4 July Accessed 26 November 2020 httpswwwdowntoearthorginnewssolar-mission-phase-ii-may-reign-in-import-of-thinfilms-40130
Parikh Anjana 2020 ldquoPOSOCO to Examine Renewable Energy Curtailment Issue in Andhra Pradeshrdquo Mercom 5 February Accessed 26 November 2020 httpsmercomindiacomposoco-examine-renewable-energy-curtailment-issue-andhra-pradesh
How Indiarsquos Solar and Wind Policies Enabled its Energy Transition A Decade in Review 58
PEG 2018 Electricity Distribution Companies in India Preparing for an Uncertain Future Mumbai PEG httpswwwprayaspuneorgpegpublicationsitemdownload892_2d5b1ca58ed382a4ef554ba04f6515dchtml
PIB 2019 ldquo PM Modi addresses Climate Action Summitrdquo Accessed 28 November 2020 httpspibgovinPressReleasePageaspxPRID=1585979
POSOCO 2018 Renewable Energy Certificate Mechanism in India Key Learnings Data Analysis and Way Forward New Delhi POSOCO NLDC httpsposocoinwp-contentuploads201808REC_REPORT_17082018_fPRINTpdf
Prasad Nithin Thomas 2020 ldquoNew Solar Tariff Record of `2kWh Why Did it Go So Lowrdquo Mercom 27 November Accessed 28 November 2020 httpsmercomindiacomnew-solar-tariff-record
Raikar Nitin 2018 ldquoIndian Wind Industry Analytical Report - FY 2017ndash18rdquo Indian Wind Power 4 (1) 32-33 httpswwwindianwindpowercompdfIndian-Wind-Power-April-May-2018pdf
Ranjan Rakesh 2020 ldquoUttar Pradesh to Set Up 600 MW of Solar in a New Renewable Energy Parkrdquo Mercom 19 June Accessed 28 November 2020 httpsmercomindiacomuttar-pradesh-solar-renewable-energy-park
REC Registry of India 2020a ldquoMonth-wise RECs Reportrdquo REC Registry of India Accessed 30 November httpswwwrecregistryindianicinindexphppublicsrecs
REC Registry of India 2020b ldquoRegistered RE Generatorsrdquo REC Registry of India Accessed 30 November HYPERLINK ldquohttpswwwrecregistryindianicinindexphppublicsrecsrdquo httpswwwrecregistryindianicinindexphppublicsregistered_regens
Reuters 2020 ldquoAdani Green Energy Doesnrsquot Have a Guaranteed Buyer for $6 Billion Solar Project in Indiardquo ET Energy World 19 November Accessed 28 November 2020 httpsenergyeconomictimesindiatimescomnewsrenewableadani-green-energy-doesnt-have-a-guaranteed-buyer-for-6-billion-solar-project-in-india79298448
Saumy Prateek 2019 ldquoAfter Tamil Nadu NSEFI Writes to Karnataka About Solar Projects Facing Curtailmentrdquo Mercom 21 June Accessed 12 October 2020 httpsmercomindiacomnsefi-karnataka-solar-curtailment
Saumy Prateek 2017 ldquoPPAS for 1050 MW Wind Projects Signedrdquo Mercom 21 July Accessed 12 October 2020 httpsmercomindiacomppas-1050-mw-wind-projects-signed
Saurabh 2017 ldquoTamil Nadu India Issues 500 Megawatt Wind Energy Tenderrdquo Clean Technica 9 July Accessed 12 October 2020 httpscleantechnicacom20170709tamil-nadu-india-issues-500-megawatt-wind-energy-tender
SECI 2014 3rd Annual Report 2013ndash14 New Delhi SECI httpswwwsecicoinUploadFinacial637268670541938164pdf
SECI 2019 8th Annual Report 2018ndash19 New Delhi SECI httpsmnregovinimgdocumentsuploadsfile_f-1597797108502pdf
Seetharaman G and Kaavya Chandrasekaran 2019 ldquoGovernmentrsquos Solar Park Push is Running Into Land Acquisition and Transmission Challengesrdquo The Economic Times 28 April Accessed 12 October 2020 httpseconomictimesindiatimescomindustryenergypowergovernments-solar-park-push-is-running-into-land-acquisition-and-transmission-challengesarticleshow69074597cmsfrom=mdr
Sengupta Debjoy 2013 ldquoIndian Solar Market Forecasting a Better 2014 after a Lackluster Yearrdquo The Economic Times 20 November Accessed 12 October 2020 httpseconomictimesindiatimescomindustryenergypowerindian-solar-market-forecasting-a-better-2014-after-a-lackluster-yeararticleshow26101929cmsfrom=mdr
Shrimali Gireesh and Sunali Rohra 2012 ldquoIndiarsquos Solar Mission A Reviewrdquo Renewable and Sustainable Energy Reviews (16) 8 6317ndash6332 httpsdoiorg101016jrser201206018
59References
Singh Anoop 2010 ldquoEconomics Regulation and Implementation Strategy for Renewable Energy Certificates in Indiardquo In India Infrastructure Report 2010 edited by Development Finance Company and 3iNetwork 42-57 New Delhi Oxford University Press
Singh Hartek 2017 ldquoWhy Renewable Energy Evacuation Demands a Decisive Pushrdquo ET Energy World 26 December Accessed 12 October 2020 httpsenergyeconomictimesindiatimescomenergy-speakwhy-renewable-energy-evacuation-demands-a-decisive-push2774
Singh Sarita and Shashwat Mohanty 2020 ldquoWind Generation Falls Over 40 in July Initial Assessment Blames Low Wind Speedrdquo ETEnergyWorld 12 August Accessed 28 November 2020 httpsenergyeconomictimesindiatimescomnewsrenewablewind-generation-falls-over-40-in-july-initial-assessment-blames-low-wind-speed77496934
Singh Vaibhav Pratap Arjun Dutt and Gagan Sidhu 2020 RE-Financing Indiarsquos Energy Transition Limited Period Subsidised Credit Enhancement for Domestic RE Bond Issuances New Delhi CEEW
Sinha Amitesh 2020 ldquoIndiarsquos Ambition and Opportunities in Solar Manufacturingrdquo Presentation India PV Edge 2020 Virtual conference 6 October
Soman Abhinav Neil McCulloch Harsimran Kaur and Christopher Beaton 2019 Indiarsquos Energy Transition The Impact of the Goods and Services Tax on Solar Photovoltaic and Coal Power Costs New Delhi IISD
Srivastava Shobhit Surbhi Singhvi and Vinay Rustagi 2019 Forecasting amp Scheduling Regulations Gurugram Bridge to India httpsbridgetoindiacombackendwp-contentuploads202003Policy-brief-Executive-summarypdf
Stromsta Karl-Erik 2012 ldquoIndia may fine most PV projects for delays in messy start to NSMrdquo Recharge 21 February Accessed 12 October 2020 httpswwwrechargenewscomsolarindia-may-fine-most-pv-projects-for-delays-in-messy-start-to-nsm1-1-837485
Sud Tushar Rajneesh Sharma Radhika Sharma and Lucy Kitson 2015 Indiarsquos Accelerated Depreciation Policy for Wind Energy New Delhi IISD
Sustainability Outlook 2010 Negotiating Power Purchase Agreements for Solar Projects 28 July Accessed 12 October 2020 httpwwwsustainabilityoutlookincontentnegotiating-power-purchase-agreements-solar-projects~text=NVVN20has20proposed20a20tripartite20arrangement20for20purchaseand20Power20Purchase20Agreement20with20Solar20Power20Developers
Tenddulkar Suuhas 2019 ldquoGujarat Land Allocation Logjam Threatens Windrsquos Viabilityrdquo Wind Power Monthly 14 January Accessed 12 October 2020 httpswwwwindpowermonthlycomarticle1522808gujarat-land-allocation-logjam-threatens-winds-viability
TERI 2017 Addressing Land Issues for Utility Scale Renewable Energy Deployment in India New Delhi Shakti Sustainable Energy Foundation
The Hindu 2017 ldquoNew Solar Energy Target for Karnataka 6000 MW by 2021rdquo The Hindu 10 January Accessed 12 October 2020 httpswwwthehinducomnewscitiesbangaloreNew-solar-energy-target-for-Karnataka-6000-MW-by-2021article17018234ece
Thomas Tanya 2018 ldquoIndia May Not Reach 100GW Solar Power Target by 2022 Crisil Reportrdquo Mint 13 August Accessed 29 November 2020 httpswwwlivemintcomIndustryHEugjBRI2zsNDyVzB2E1kJIndia-may-not-reach-100GW-solar-power-target-by-2022-Crisilhtml
Thomas Tanya ldquoPower Utilities Turn to Cheaper Exchange Power as Prices Crashrdquo Mint 28 May Accessed 29 November 2020 httpswwwlivemintcomindustryenergypower-utilities-turn-to-cheaper-exchange-power-as-prices-crash-11590636539577html
How Indiarsquos Solar and Wind Policies Enabled its Energy Transition A Decade in Review 60
TN Energy Department 2012 Policy Note 2012-2013 Chennai Energy Department Government of Tamil Nadu httpscmstngovinsitesdefaultfilesdocumentsenergy_7pdf
TNN 2013 ldquoTNrsquos power utility rated worst among 4 southern statesrdquo Times of India 30 March Accessed 12 October 2020 httpstimesofindiaindiatimescomcitychennaiTNs-power-utility-rated-worst-among-4-southern-statesarticleshow19285688cms
Tongia Rahul Santosh Harish and Rahul Walawalkar 2018 Integrating Renewable Energy Into Indiarsquos Grid- Harder Than It Looks New Delhi Brookings India httpswwwbrookingseduwp-contentuploads201811Complexities-of-Integrating-RE-into-Indias-grid2pdf
Tyagi Akanksha and Neeraj Kuldeep Forthcoming Resource Management Strategies for India by Managing Solar PV Module Waste New Delhi CEEW
Tyagi Akanksha Neeraj Kuldeep and Aarushi Dave 2020 Are Urban Microgrids Economically Feasible A Study of Delhirsquos Discom and Consumer Perspectives for BYPL New Delhi CEEW httpswwwceewinsitesdefaultfilesCEEW-Are-urban-microgrids-economically-feassible-29Oct20pdf
William Praveen 2020 ldquoAmbiguities Under the GST Regime for Renewable Energy Sectorrdquo KPMG India Blog 30 January Accessed 12 October 2020 httpshomekpmginenblogshomeposts202001ambiguities-under-the-gst-regime-for-renewable-energy-sectorhtml
WTO 2016 DS456 India mdash Certain Measures Relating to Solar Cells and Solar Modules Accessed 26 November 2020 httpswwwwtoorgenglishtratop_edispu_ecases_eds456_ehtm
Judicial orders cited
Order dated 3 December 2019 issued by CERC in Petition No 340AT2019 titled PTC India Ltd v SECI and Ors httpwwwcercindgovin2019orders340-AT-2019pdf
Order dated 3 December 2009 issued by CERC in Petition No 2842009 titled Determination of Generic Levellised Generation Tariff httpwwwcercindgovin2009November09284ndash2009_final_3rdDecember09pdf
Order dated 15 May 2014 issued by CERC in Petition No SM3542013 (SuondashMotu) titled Determination of Generic Levellised Generation Tariff for the FY 2014ndash15 httpwwwcercindgovin2014ordersSO354pdf
Order dated 31 March 2015 issued by CERC in Petition No SM0042015(SuondashMotu) titled Determination of Generic Levellised Generation Tariff for the FY 2015 ndash 16 httpcercindgovin2015ordersso4pdf
Order dated 30 March 2016 issued by CERC in Petition No SM032016 (SuondashMotu) titled Determination of Levellised Generic Tariff for FY 2016ndash17 httpcercindgovin2016orderssm_3pdf
Order dated 11 August 2017 issued by the TNERC in TP No1 of 2017 titled Determination of Tariff for Generation and Distribution Accessed 25 October 2020 httpwwwtnercgovinordersTariff20Order2020092017TariffOrderTANGEDCOndash11ndash08ndash2017pdf
Order dated 27 March 2019 issued by the MERC in Case No36 of 2019 titled Case for Verification of Compliance of Renewable Purchase Obligation targets by Maharashtra State Electricity Distribution Co Ltd for FY 2017ndash18
Order dated 2 April 2019 issued by the MERC in Case No37 of 2019 titled Case for Verification of Compliance of Renewable Purchase Obligation targets by Brihanmumbai Electric Supply amp Transport Undertaking for FY 2017ndash18
Order dated 2 April 2019 issued by the MERC in Case No38 of 2019 titled Case for Verification of Compliance of Renewable Purchase Obligation targets by Tata Power Co Ltd (Distribution) for FY 2017ndash18
61Judicial orders cited
Order dated 4 April 2019 issued by the MERC in Case No39 of 2019 titled Case for Verification of Compliance of Renewable Purchase Obligation targets by Adani Electricity Mumbai Limited for FY 2017ndash18
Order dated 23 October 2017 issued by the PSERC titled Annual Revenue Requirement and Determination of Tariff for MYT Control Period from FY 2017ndash18 to FY 2019ndash20 and for True up of FY 2015ndash16 Accessed 25 October 2020 httppsercgovinpagesPSPCL-Tariff-Order-Vol-1-2017-18pdf
Order dated 19 April 2018 issued by the PSERC in Petition titled True up of FY 2016ndash17 Annual Performance Review (APR) for FY 2017ndash18 and Determining the Annual Revenue Requirement (ARR) for FY 2018ndash19 Accessed 25 October 2020 httppsercgovinpagesTariff20Order20PSPCL20for20FY202018-19pdf
Order dated 27 May 2019 issued by the PSERC in Petition No 02 of 2019 titled True up of FY 2017ndash2018 Annual Performance Review (APR) for FY 2018ndash19 approval of Revised Annual Revenue Requirement (ARR) and determination of Tariff for FY 2019ndash20 Accessed 25 October 2020 httppsercgovinpagesPSPCL-Tariff-Order-2019-20pdf
Order dated 25 February 2019 issued by the BERC in Case No 40 and 48 of 2018 and Case No 41 and 47 of 2018 titled Tariff Order for FY 2019ndash20 for NBPDCL and SBPDCL Accessed 25 October 2020 httpsberccoinorderstariffdistributionsbpdcl1965-tariff-order-of-sbpdcl-for-fy-2019-20
Order dated 24 March 2017 issued by the BERC in Case No 45 of 2016 titled Tariff Order for FY 2017-18 for NBPDCL Accessed 25 October 2020 httpsberccoinorderstariffdistributionnbpdcl1143-tariff-order-of-nbpdcl-for-fy-2017-18
Order dated 24 March 2017 issued by the BERC in Case No 46 of 2016 titled Tariff Order for FY 2017ndash18 for SBPDCL Accessed 25 October 2020 httpsberccoinorderstariffdistributionsbpdcl1142-tariff-order-of-sbpdcl-for-fy-2017-18
Order dated 21 March 2018 issued by the BERC in Case No 40 of 2017 titled Tariff Order for FY 2018ndash19 for NBPDCL Accessed 25 October 2020 httpsberccoinorderstariffdistributionnbpdcl1447-tariff-order-of-nbpdcl-for-fy-2018-19
Order dated 21 March 2018 issued by the BERC in Case No 41 of 2017 titled Tariff Order for FY 2018ndash19 for SBPDCL Accessed 25 October 2020 httpsberccoinorderstariffdistributionsbpdcl1444-tariff-order-of-sbpdcl-for-fy-2018-19
Order dated 1 June 2010 issued by the CERC in Petition No 992010 (Suo Motu) titled Determination of Forbearance and Floor Price for the REC Framework httpswwwrecregistryindianicinpdfREC_RegulationFinal_Order_on_Forbearnace_and_Floor_Price_for_RECpdf
Order dated 23 August 2011 issued by the CERC in Petition No 1422011 (Suo Motu) titled Determination of Forbearance and Floor Price for the REC Framework to be Applicable from 1st April 2012 httpswwwrecregistryindianicinpdfREC_RegulationOrder_on_Forbearnace__Floor_Price_23-8-2011pdf
Order dated 30 March 2017 issued by the CERC in Petition No 02SM2017 titled Determination of Forbearance and Floor Price for the REC Framework to be Applicable from 1st April 2017 httpswwwrecregistryindianicinpdfREC_RegulationCERC_Order_300317pdf
Order dated 17 June 2020 issued by the CERC in Petition No 05SM2020 titled Determination of Forbearance and Floor Price for the REC Framework httpswwwrecregistryindianicinpdfREC_Regulation5-SM-2020-finalpdf
Judgment dated 13 May 2015 issued by the Supreme Court of India in Civil Appeal No 4417 of 2015 titled Hindustan Zinc Limited v RERC ((2015)12SCC611) httpswwwrecregistryindianicinpdfREC_RegulationSupreme_Court_Judgement_regarding_RPO_Compliancepdf
Order dated 4 August 2015 issued by the GERC in suo motu Petition Nos 1307 of 2013 and 1312 of 2013 titled Suo-motu Proceedings in Petition Nos 1307 of 2013 and 1312 of 2013 in Pursuance of Honrsquoble APTEL Direction Contained in
How Indiarsquos Solar and Wind Policies Enabled its Energy Transition A Decade in Review
Order Dated 16042015 in Appeal Nos 258 of 2013 and 21 of 2014 and the Order Dated 14052015 in IA No 187 of 2015 Accessed 22 October 2020 httpswwwgercinorgwp-contentuploadsdocumenten_1438799511pdf
Order dated 4 April 2019 issued by the MERC in Case No 39 of 2019 titled Case for Verification of Compliance of Renewable Purchase Obligation Targets by Adani Electricity Mumbai Limited for FY 2017ndash18
Order dated 14 May 2018 issued by the KERC in matter no S032017 titled In the Matter of Revision of Wheeling and Banking Charges for Renewable Power Projects Accessed 22 October 2020 httpskredlinfoingeneralwheeling20and20banking20charges2014052017pdf
Order No 82020 dated 7 October 2020 issued by the TNERC titled Order on Procurement of Wind Power and Related Issues Accessed 22 October 2020 httpwwwtnercgovinordersTariff20Order2020092020WindOrder-2007-10-2020pdf
Order No 22020 dated 30 April 2020 issued by the GERC titled Tariff Framework for Procurement of Power by Distribution Licensees and Others from Wind Turbine Generators and Other Commercial Issues for the State of Gujarat Accessed 22 October 2020 httpswwwgetcogujaratcomgetco_newpagesfilesRNCREOrder20No220of20202020issued20by20GERC20pdf
Order dated 20 March 2020 in Case No 30 2019 and 312019 issued by the BERC titled Tariff Order Truing up for FY 2018-19 Annual Performance Review for FY 2019-20 Annual Revenue Requirement (ARR) and Determination of Retail Tariff for FY 2020-21 for North Bihar Distribution Company Limited (NBPDCL) and South Bihar Distribution Company Limited (SBPDCL) Accessed 22 October 2020 httpsberccoinorderstariffdistributionsbpdcl2216-tariff-order-of-nbpdcl-for-fy-2019-22
62
Unlocking the demand for RE and capitalising on the immense opportunity that it presents requires innovative solutions that account for legacy issues and yet are forward looking
Image iStock
How Indiarsquos Solar and Wind Policies Enabled its Energy Transition A Decade in Review
COUNCIL ON ENERGY ENVIRONMENT AND WATER (CEEW)
Sanskrit Bhawan A-10 Qutab Institutional AreaAruna Asaf Ali Marg New Delhi - 110067 IndiaT +91 (0) 11 4073 3300
infoceewin | ceewin | CEEWIndia | ceewindia