how to quantitatively capture the state of the household
TRANSCRIPT

IFC Satellite meeting at the ISI Regional Statistics Conference on “Is the household sector in Asia overleveraged: what do the data say?”
Kuala Lumpur, Malaysia, 15 November 2014
How to quantitatively capture the state of the household sector in Asia?1
Sayako Konno and Masahiro Higo, Bank of Japan
1 This presentation was prepared for the meeting. The views expressed are those of the authors and do not necessarily reflect the views of the BIS or the central banks and
other institutions represented at the meeting.

I F C S a t e l l i t e S e m i n a r
N o ve m b e r 1 5 , 2 0 1 4 i n K u a l a L u m p u r
S a ya k o K o n n o
M a s a h i r o H i g o
R e s e a r c h a n d S t a t i s t i c s D e p a r t m e n t B a n k o f J a p a n
“How to quantitatively capture the state of the household sector in Asia?”
1. Growing Importance of the Household Sector in Asia 1.1 Role of Households in Asia 1.2 Issues of Households Debt 1.3 Important Role of Statistics 2. Current Development of Statistics in Asia 2.1 What kind of statistics are needed? 2.2 Financial Accounts in Asia 2.3 Residential Property Prices 2.4 Distributional Information on Households 2.5 Summary 3. Needs to Develop the Financial Accounts 3.1 The Importance of FFA to Compile the HHs Balance Sheet 3.2 What is J-FFA? 3.3 Analyses of J-FFA 3.4 The Future Revision of J-FFA
Outline of Presentation
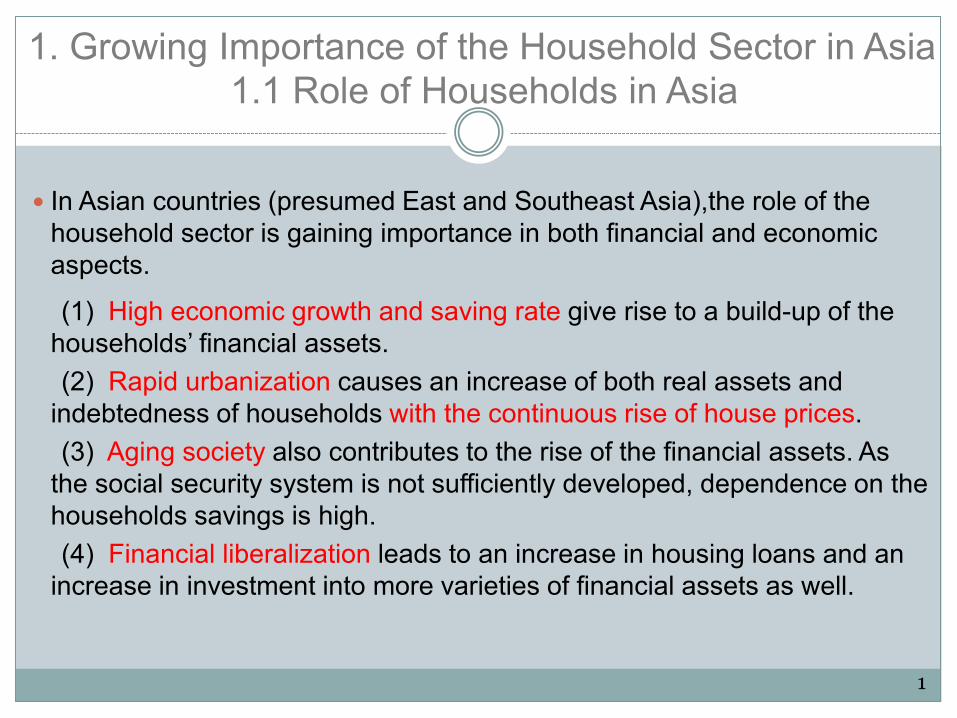
In Asian countries (presumed East and Southeast Asia),the role of the household sector is gaining importance in both financial and economic aspects.
(1) High economic growth and saving rate give rise to a build-up of the households’ financial assets.
(2) Rapid urbanization causes an increase of both real assets and indebtedness of households with the continuous rise of house prices.
(3) Aging society also contributes to the rise of the financial assets. As the social security system is not sufficiently developed, dependence on the households savings is high.
(4) Financial liberalization leads to an increase in housing loans and an increase in investment into more varieties of financial assets as well.
1.1 Role of Households in Asia 1. Growing Importance of the Household Sector in Asia
1

As the house prices increased rapidly in some Asian countries, household indebtedness especially in cities became big issues. There is a concern about the question of whether the household sector is overleveraged or not.
A sharp decline in house prices would damage the household balance sheet.
“Regional Economic Outlook,” April 2014 by the IMF, introduced analyses of rising household debt and house prices in Asia.
1.2 Issues of Household Debt
2

Household Debt in Asia
IMF Regional Economic Outlook; How “indebted” are households in Asia? “Rapid credit growth has also fueled growing household indebtedness across
parts of Asia.” “ Mortgage credit accounts for a significant share of total credit to households in
many Asian economies.” Total credit to households Households debt
0102030405060708090
100
2010
Late
st
2006
2008
Late
st
2003
2008
Late
st
2007
2008
Late
st
2000
2008
Late
st
2000
2008
Late
st
2000
2008
Late
st
Indonesia Malaysia Thailand China Singapore Korea Japan
Housing Other
In percent of GDP
0
50
100
150
200
250
2010
Late
st
2006
2008
Late
st
2007
2008
Late
st
2000
2008
Late
st
2002
2008
Late
st
Indonesia Malaysia China Singapore Korea
In percent of deposits
3

House Prices in Asia
IMF Regional Economic Outlook (Cont.); House prices rose rapidly across most of Asia during the last
decade.
“Given that rapidly rising credit has often been associated with an upward cycle in house prices, there is a potential for the housing-credit cycle to unwind in some countries.”
“A decline in housing prices would lower the value of collateral and tighten credit availability, creating an adverse financial accelerator effect.”
House Prices
-30 -20 -10 0 10 20 30 40 50
Indonesia
Malaysia
Thailand
China
Singapore
Korea
Japan
Change f rom 2000Q1 to 2007Q1 Change since 2008%
4
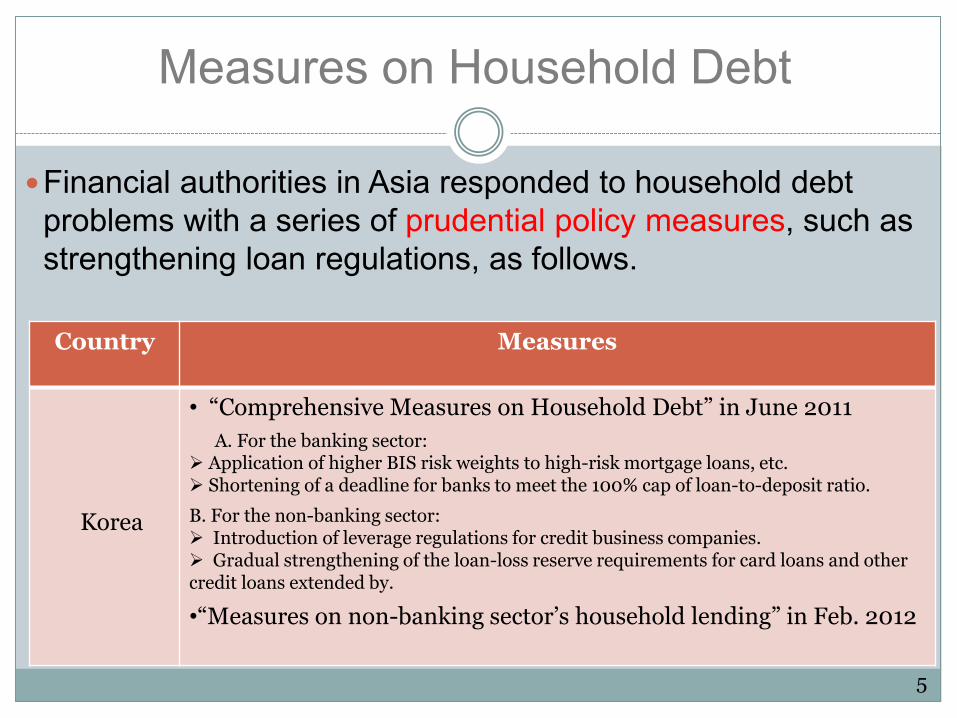
Measures on Household Debt
Financial authorities in Asia responded to household debt problems with a series of prudential policy measures, such as strengthening loan regulations, as follows.
Country Measures
Korea
• “Comprehensive Measures on Household Debt” in June 2011 A. For the banking sector: Application of higher BIS risk weights to high-risk mortgage loans, etc. Shortening of a deadline for banks to meet the 100% cap of loan-to-deposit ratio.
B. For the non-banking sector: Introduction of leverage regulations for credit business companies. Gradual strengthening of the loan-loss reserve requirements for card loans and other credit loans extended by.
•“Measures on non-banking sector’s household lending” in Feb. 2012
5

Measures on Household Debt
Country Measures Malaysia
• Increasing the RPGT rate from 5% to 10% for properties held and disposed within 2 years. (Jan. 2011)
• Initiation of new regulation on credit cards. (Mar. 2011) • Increasing the minimum values of properties that foreigners
are allowed to buy. (Apr. 2014) • Limit the repayment period for the purchase of properties to
35 years and personal financing to 10 years. (July 2013) • Increasing the RPGT rate to further curb speculative
activities (Oct. 2013).
Thailand
• Tightening the rules on mortgage lending in Jan. 2011. Increasing from 35% to 75% the risk weight for banks exposure to mortgages on condominiums and detached houses.
6

Good statistics are indispensable for effective surveillance and policy responses.
(E.g.) Evaluate the risk of a housing bubble.
How accurately can we capture the pictures of the household balance sheet with the current financial statistics?
What are our tasks as statistical experts of central banks?
1.3 Important Role of Statistics
7

1. It is desirable to compile financial accounts (Flow of Funds Accounts) on an SNA basis in order to capture a comprehensive picture of households’ financial assets and liabilities.
2. Detailed information on house prices are important in order to determine the accurate values of real assets.
3. The distribution of households’ assets and liabilities shows a dispersion. Statistics on the distributions compiled with micro data are required for a better policy.
2. Current Development of Statistics in Asia 2.1 What kind of statistics are needed?
8
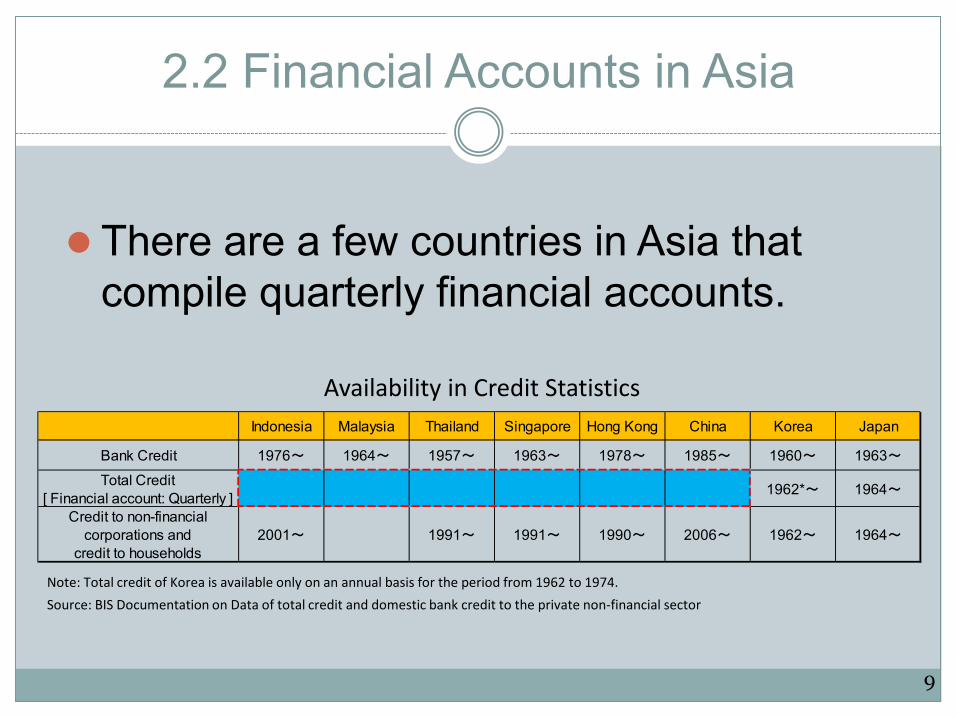
2.2 Financial Accounts in Asia
There are a few countries in Asia that compile quarterly financial accounts.
Indonesia Malaysia Thailand Singapore Hong Kong China Korea Japan
Bank Credit 1976~ 1964~ 1957~ 1963~ 1978~ 1985~ 1960~ 1963~
Total Credit[ Financial account: Quarterly ] 1962*~ 1964~
Credit to non-financialcorporations and
credit to households2001~ 1991~ 1991~ 1990~ 2006~ 1962~ 1964~
Availability in Credit Statistics
Source: BIS Documentation on Data of total credit and domestic bank credit to the private non-financial sector Note: Total credit of Korea is available only on an annual basis for the period from 1962 to 1974.
9

• Financial Accounts (Flow of Funds Accounts) on an SNA basis:
Korea, Australia and Japan
• Outstanding of Households’ Financial Assets and Liabilities (not on an SNA basis):
China, Malaysia, and Singapore
• Many Asian countries do not grasp the whole pictures of households’ financial assets and liabilities.
e.g. Thailand and Indonesia conducted only irregular household surveys.
Statistical Development in Central Banks
10

IMF Regional Economic Outlook: Asia and Pacific April 2014 Broad coverage over countries Insufficient coverage over financial assets and liabilities--limited to the
banking sector
BIS Credit Statistics BIS encourages members to provide total credit In reality, many members report only bank credit; some do not report
credit to households.
Nomura (Japanese think-tank) Report Analyze the balance sheet structures in East Asian countries Due to a lack of data, analyses are limited to Japan, China, Korea,
Singapore, and Malaysia.
11
Analyses of Households under Limited Availability of Data

0.0
0.1
0.2
0.3
0.4
0.5
0.6
0.7
0.8
0.9
1.0
0.0 0.5 1.0 1.5 2.0 2.5 3.0 Totalcredit/GDP
Bank
cred
it/To
tal c
redi
t
financial development
significantnegativecoefficient
Source: BIS Quarterly Review March 2013 Source: BIS Total credit and bank credit to the private nonfinancial sector
0.5
0.6
0.7
0.8
0.9
1.0
1990
1991
1992
1993
1994
1995
1996
1997
1998
1999
2000
2001
2002
2003
2004
2005
2006
2007
2008
2009
2010
2011
2012
2013
Japan Korea Malyasia
Bank
cred
it/To
tal c
redi
t
BIS Quarterly Review, March 2013; 1. Due to a lack of time-series data for total credit, even in countries that compile
financial accounts, well established statistics on bank credit are broadly used. 2. As financial liberalization advances in Asia, households invests their assets into
more varieties of financial products. 3. The analyses with bank credit data may be misleading regarding the real issues
on balance sheets. Therefore, we are urged to develop credit data with broader coverage.
Needs to Develop Broader Credit Data
Bank Credit to Total Credit
12
Source: BIS Quarterly Review September 2014
Note: Selected series data set is one representative price series per country. Long series data set is a price series with a long time span which also satisfies some minimum comparability criteria across countries.
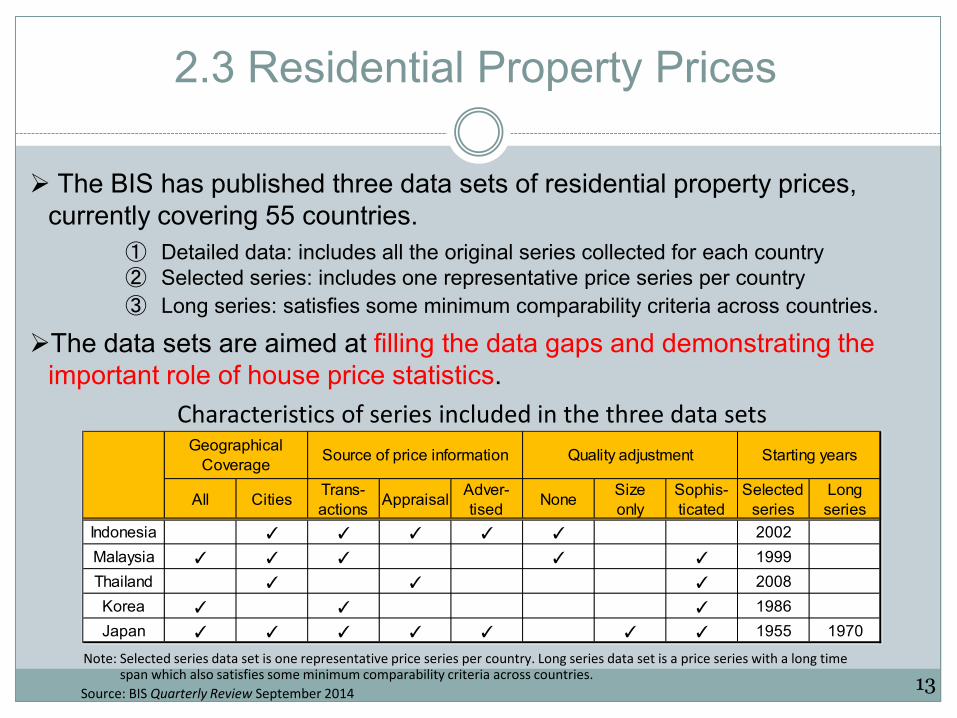
The BIS has published three data sets of residential property prices, currently covering 55 countries.
① Detailed data: includes all the original series collected for each country ② Selected series: includes one representative price series per country ③ Long series: satisfies some minimum comparability criteria across countries.
The data sets are aimed at filling the data gaps and demonstrating the important role of house price statistics.
2.3 Residential Property Prices
Characteristics of series included in the three data sets
13
All Cities Trans-actions Appraisal Adver-
tised None Sizeonly
Sophis-ticated
Selectedseries
Longseries
Indonesia ✓ ✓ ✓ ✓ ✓ 2002Malaysia ✓ ✓ ✓ ✓ ✓ 1999Thailand ✓ ✓ ✓ 2008Korea ✓ ✓ ✓ 1986Japan ✓ ✓ ✓ ✓ ✓ ✓ ✓ 1955 1970
GeographicalCoverage Source of price information Quality adjustment Starting years
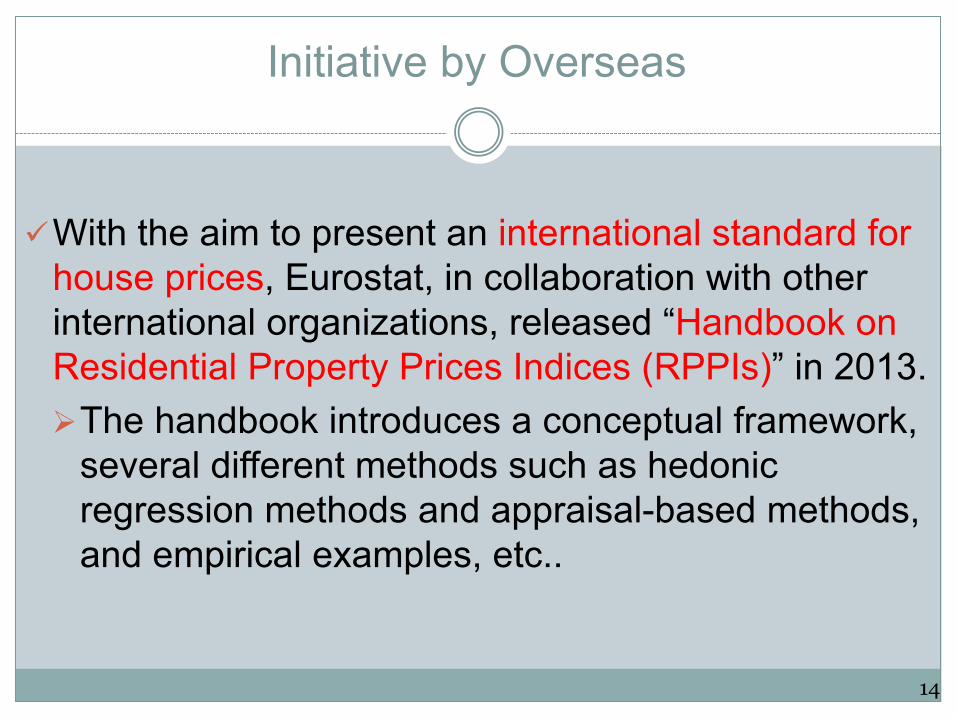
Initiative by Overseas
With the aim to present an international standard for house prices, Eurostat, in collaboration with other international organizations, released “Handbook on Residential Property Prices Indices (RPPIs)” in 2013. The handbook introduces a conceptual framework,
several different methods such as hedonic regression methods and appraisal-based methods, and empirical examples, etc..
14

100
120
140
160
180
200
220
240
260
Q1Q2Q3Q4Q1Q2Q3Q4Q1Q2Q3Q4Q1Q2Q3Q4Q1Q2Q3Q4Q1Q2Q3Q4Q1Q2Q3Q4Q1Q2Q3Q4Q1Q2Q3Q4Q1Q2
2005 2006 2007 2008 2009 2010 2011 2012 2013 2014
Whole county Kuala Lumpur
2010 Avg.=100
Source: BIS Housing Property Price Series
-5
0
5
10
15
20
25
Q1Q2Q3Q4Q1Q2Q3Q4Q1Q2Q3Q4Q1Q2Q3Q4Q1Q2Q3Q4Q1Q2Q3Q4Q1Q2Q3Q4Q1Q2Q3Q4Q1Q2Q3Q4Q1Q2
2005 2006 2007 2008 2009 2010 2011 2012 2013 2014
Whole county Kuala Lumpur
YoY, %
While the statistical developments of house prices based on a macro- level basis conducted by BIS and others are important, house prices with more detailed data are also needed in order to detect any discrepancy in trends among the regions.
Issues concerning House Prices
Capital city v.s Whole country: Malaysian case
15

Case of Japan
In Japan, there are several kinds of statistics on house prices. “Published Land Price Survey” (PLPS) contributes to estimating the
residential value in the SNA. MLIT has been working on creating a commercial property price index.
Statistics Organization Data Frequency Subject
Areas/Sites Starting date
Published Land Price Survey
MLIT Appraisal Value
Annual 26,000 (as of 2013)
1970
Land Price Survey
Each prefecture Appraisal Value
Annual 22,264 (as of 2012)
1975
Land Value for Inheritance Tax
National Tax Agency
Appraisal Value
Annual
Prices along selected streets across Japan
1963
Residential Property Price Index
MLIT Hedonic Approach
Monthly •All Japan •Regions •Metropolitan Areas
2008
Types and qualities of property price information
16

2.4 Distributional Information on Households
What is the G-20 recommendations? #16 says…. “As the recommended improvements to data sources and categories
are implemented, statistical experts to seek to compile distributional information (such as ranges and quartile information) alongside aggregate figures, wherever this is relevant. The IAG is encouraged to promote production and dissemination of these data in a frequent and timely manner. The OECD is encouraged to continue in its efforts to link national accounts data with distributional information.”
17
What statistics provide distributional information?
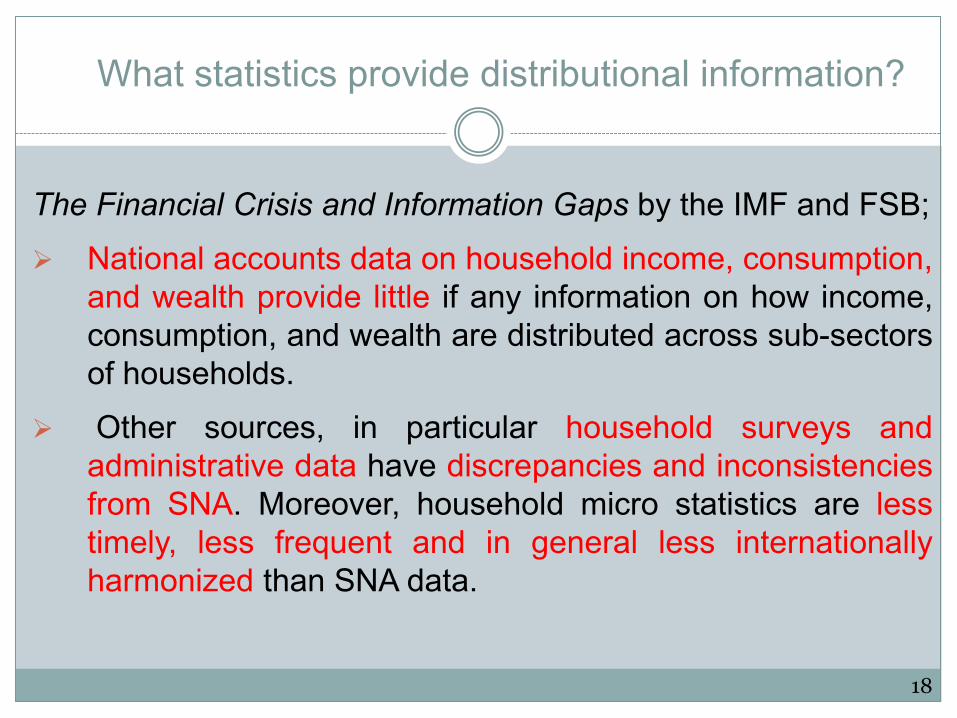
The Financial Crisis and Information Gaps by the IMF and FSB;
National accounts data on household income, consumption, and wealth provide little if any information on how income, consumption, and wealth are distributed across sub-sectors of households.
Other sources, in particular household surveys and administrative data have discrepancies and inconsistencies from SNA. Moreover, household micro statistics are less timely, less frequent and in general less internationally harmonized than SNA data.
18

Case of Japan
1. The family Income and Expenditure Survey (FIES) Conducted every month since 1950. Obtaining comprehensive data on income and expenditure of
households. About 9,000 households are surveyed. Covers financial assets and liabilities.
2.“National Survey of Family Income and Expenditure” Conducted every five years since 1959. Designed to sample about 57,000 households. Covered real asset at market values in addition to financial assets and
liabilities. The two surveys are inconsistent with the financial accounts
based on the SNA, often the survey is underestimated.
19

Case of Japan
The Cabinet Office made a trial estimation of distribution based on the household survey and in accordance with SNA.
While the deviation between the SNA after the conceptual adjustments and statistics based on the household survey is relatively small for the flow data, it remains large for the stock data.
Flow: Use of Disposable Income Account
Percentage of deviation
1. Final consumption expenditure
-1.8
2. Saving (gross) 4.1
3. Disposable income (gross)
-1.4
Saving ratio (%) 5.5
Discrepancies between distributional statistics and adjusted SNA %
20
Stock: Financial Assets and Liabilities
Percentage of deviation
1. Financial Assets -42.6
Deposits -41.8 Securities other than shares -54.2
Shares -68.1 Insurance and pension reserves -29.2
2. Financial Liabilities -36.4
Loans -36.4 (data sources) Annual estimation of SNA distributional statistics by the Cabinet Office

Initiatives by Overseas
Some European countries have been developing micro data base with sources data such as the banking supervision’s information in order to encounter the issues on the distributional statistics.
Country Data
Portugal CCR (The Central Credit Register) This is the data related to credit information such as loans with regard to non-financial corporations and households. CBSD (The Central Balance Sheet Database) This is the data related to financial statement information (B/S, P/L) with regard to non-financial institutions.
ECCBSO Micro-data base (BACH: Bank for Accounts Companies Harmonized) on the ECB level. Currently, 13 countries (Germany, France, Italy, Portugal, Spain, Australia) have reported the data on non-financial corporations.
Norway Tax Register includes detailed information on most financial assets held by Norwegian households, as well as total liabilities. Tax data even includes information on non-financial assets ,such as a private dwelling.
21

2.5 Summary
Sufficient data are not available to capture the comprehensive picture of the households balance sheet in many Asian countries.
The authorities need to make a further effort to develop:
1. Quarterly financial accounts 2. House prices based on the detailed source data 3. Distributional information on households
22

3. Needs to Develop Financial Accounts 3.1 The importance of FFA to compile the HHs balance sheet It is difficult to compile the household balance sheet directly
from the data sources. The most effective way to compile the household balance
sheet is to estimate the figures with the data sources provided from the financial institutions. The development of the household balance sheet based on the macro data basis is the first priority, and then compilation of distributional information for the household will follow.
The data sources provided by financial institutions are not often sufficient to compile the household balance sheet. Therefore, some estimations are often used to compile the transaction data, and to keep the sufficient accuracy.
23

3.2 What is J-FFA?
Japan’s Flow of Funds Accounts… - Records outstanding balances of financial assets and
liabilities (stock), financial transactions (flow), and the difference between stock and flow (reconciliation) in each sector
- Comprises of matrices of 43 sectors and 51 transaction items (cf., 31 sectors for US, 8 sectors of EA) - Is compiled in accordance with the System of National
Accounts (SNA) (currently with SNA 1993, but will be with SNA 2008 in 2016) - Makes data available from 1980 annually; from 1998Q1
quarterly
24

FFA: A Snapshot Example
• Stock table (major sectors and transaction items)
Note: Japan’s Nominal GDP = 473 trillion yen (2012FY) 25

Methodological Framework of FFA
Vertically Integrated A
pproach
Horizontally Integrated Approach
26
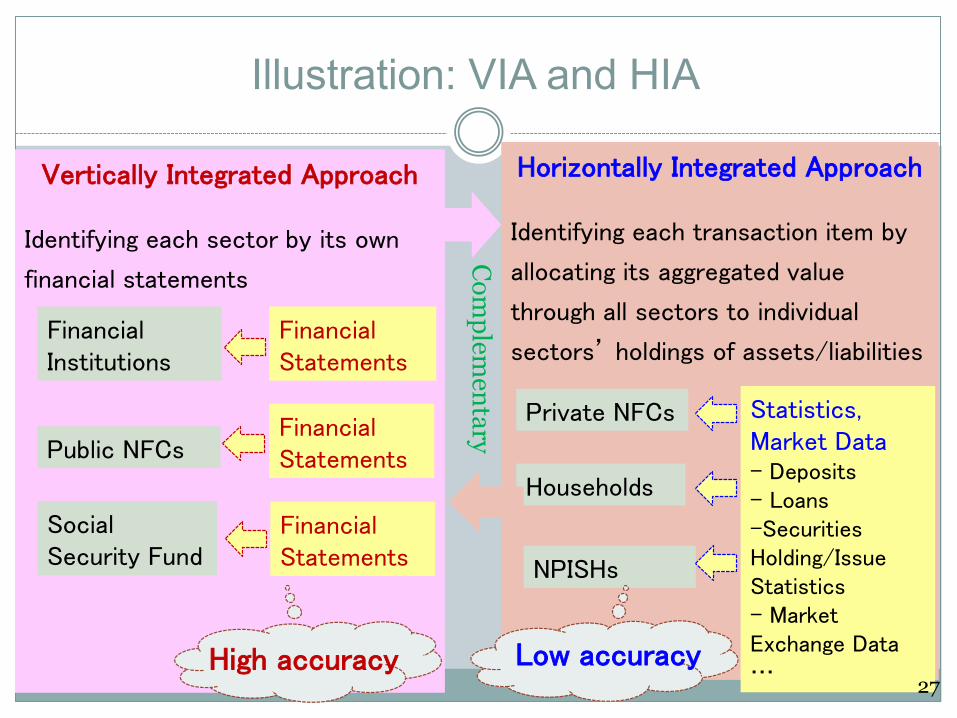
Illustration: VIA and HIA
Vertically Integrated Approach
Identifying each sector by its own
financial statements
Financial Statements
Financial Institutions
Public NFCs
Social Security Fund
Financial Statements
Financial Statements
Horizontally Integrated Approach
Identifying each transaction item by
allocating its aggregated value
through all sectors to individual
sectors’ holdings of assets/liabilities
Households
NPISHs
Statistics, Market Data - Deposits - Loans -Securities Holding/Issue Statistics - Market Exchange Data … High accuracy Low accuracy
Private NFCs
Com
plementary
27

Households: Assets
Assets
Central government securities, local government securities, public corporation securities, industrial securities, shares, insurance and pension reserves
Transaction Items
Aggregation
Transferable deposits, time and savings deposits, foreign currency deposits, bank debentures, investment trust beneficiary certificates, trust beneficiary rights, financial derivatives, deposits
Estimation
Currency, certificates of deposit, mortgage securities, outward investment in securities
Deposit Stats,
BOP, IIP, ...
Proportional Allocation
Deposit Stats,
Securities Holding
Statistics, ...
In principle, the residual of unidentified sectors is allocated after all identified sectors are subtracted from the total of transaction items.
28

Households: Liabilities
Liabilities
Installment credit Transaction Items
Aggregation
Residual Calculation
Loans by private financial institutions, loans by public financial institutions, loans by the nonfinancial sector, financial derivatives Estimation
Trade credit
Make use of financial statements of counterpart financial institutions.
For a sole proprietor, the residual is recorded after all identified sectors are subtracted from the total of transaction items.
29

Estimation Accuracy of Assets/Liabilities Table
30

3.3 Analyses of J-FFA Households: Composition of Financial Assets
Note: Japan’s Nominal GDP = 473 trillion yen (2012FY)
Amounts outstanding
0
200
400
600
800
1,000
1,200
1,400
1,600
1,800
Q3CY12
Q4 Q1CY13
Q2 Q3 Q4 Q1CY14
Q2
0
200
400
600
800
1,000
1,200
1,400
1,600
1,800
80 81 82 83 84 85 86 87 88 89 90 91 92 93 94 95 96 97 98 99 00 01 02 03 04 05 06 07 08 09 10 11 12 13
(trillion yen)
FY
Currency and depositsBondsInvestment trust beneficiary certificatesShares and other equitiesInsurance and pension reservesOthers
(trillion yen)
31

3.4 The Future Revision of J-FFA
The BOJ is planning to revise the J-FFA in the first half of 2016 with the implementation of the new statistical standard (2008SNA).
The main financial revisions of 2008 SNA related to the household sector are:
1. Pension benefit obligations of corporate pensions
2. Flow data of investment funds and pension reserves
3. Employee stock options (ESO)
4. Provisions for calls under standardized guarantees
32

Preliminary Assessment of Quantitative Impact
Pension benefit obligations of corporate pensions
Amounts outstanding: 10 to 20 trillion yen.
Transactions of investment funds and pension reserves
• The transaction of investment funds by the households: ▲5 trillion yen or less for FY2012. • The transaction flow of the pension entitlements: ▲several trillion yen per year reduce financial surplus of the household sector by the same amount.
Employee stock options (ESO)
The amount outstanding: + around hundreds of billions of yen for FY2012.
Provisions for calls under standardized guarantees
Provisions for calls: + 3 to 4 trillion yen.
(Reference) Total assets of households and net surplus for FY2012 amounts to 1,579 trillion yen and +23 trillion yen respectively.
33

The End
Thank you for your attention.