stoichiometric flux balance models quantitatively predict growth
TRANSCRIPT

APPLIED AND ENVIRONMENTAL MICROBIOLOGY, OCt. 1994, p. 3724-37310099-2240/94/$04.00+ 0Copyright C) 1994, American Society for Microbiology
Stoichiometric Flux Balance Models Quantitatively PredictGrowth and Metabolic By-Product Secretion in
Wild-Type Escherichia coli W3110AMIT VARMA AND BERNHARD 0. PALSSON*
Department of Chemical Engineering, University of Michigan, Ann Arbor, Michigan 48109
Received 10 March 1994/Accepted 4 August 1994
Flux balance models of metabolism use stoichiometry of metabolic pathways, metabolic demands of growth,and optimality principles to predict metabolic flux distribution and cellular growth under specified environ-mental conditions. These models have provided a mechanistic interpretation of systemic metabolic physiology,and they are also useful as a quantitative tool for metabolic pathway design. Quantitative predictions of cellgrowth and metabolic by-product secretion that are experimentally testable can be obtained from these models.In the present report, we used independent measurements to determine the model parameters for the wild-typeEscherichia coli strain W3110. We experimentally determined the maximum oxygen utilization rate (15 mmolof 02 per g [dry weight] per h), the maximum aerobic glucose utilization rate (10.5 mmol of Glc per g [dryweight] per h), the maximum anaerobic glucose utilization rate (18.5 mmol of Glc per g [dry weight] per h),the non-growth-associated maintenance requirements (7.6 mmol of ATP per g [dry weight] per h), and thegrowth-associated maintenance requirements (13 mmol of ATP per g of biomass). The flux balance modelspecified by these parameters was found to quantitatively predict glucose and oxygen uptake rates as well asacetate secretion rates observed in chemostat experiments. We have formulated a predictive algorithm in orderto apply the flux balance model to describe unsteady-state growth and by-product secretion in aerobic batch,fed-batch, and anaerobic batch cultures. In aerobic experiments we observed acetate secretion, accumulationin the culture medium, and reutilization from the culture medium. In fed-batch cultures acetate iscometabolized with glucose during the later part of the culture period. Anaerobic batch culture is observed toprimarily secrete the by-products acetate, ethanol, and formate. The flux balance model was found toquantitatively predict the time profiles of cell density and glucose and by-product concentrations in theabove-described experiments. Taken together, the experimental data and model predictions presented showthat observed growth and by-product secretion of wild-type E. coli are consistent with stoichiometricallyoptimal pathway utilization. Flux balance models can thus be used to describe prokaryotic metabolicphysiology, and they can be applied to bioprocess design and control.
The ability to quantitatively describe metabolic fluxesthrough metabolic networks has long been desired (10). How-ever, this endeavor has been hampered by the need forextensive kinetic information describing enzyme catalysiswithin the living cell. Detailed information about all theenzymes in a specific metabolic network is not available,perhaps with the exception of the enucleated human erythro-cyte (6). This dilemma has recently been partially resolved bythe development of flux balance-based metabolic models (3,12, 17, 19, 24). The flux balance approach relies on metabolicstoichiometry, metabolic requirements for growth, and opti-mality principles (19, 20). These models quantitatively describesteady-state flux distributions in metabolic network. Sincemetabolic transients are typically rapid, the flux balance mod-els are applicable to most experiments that involve cell growth,including bioprocess situations in which process transients aremuch longer than those associated with metabolism.
Flux balance models have provided valuable insights intoprokaryotic metabolic physiology (18). A balance betweenmetabolic fluxes has been used to formulate hypotheses ex-plaining the phenomena of acetate secretion in Escherichia coli(9) and ethanol production in Saccharomyces cerevisiae (15).Flux balance models provide a quantitative analysis of meta-bolic pathway utilization under different environmental condi-
* Corresponding author. Phone: (313) 763-2090. Fax: (313) 764-7453.
tions. For example, switches in pathway utilization that lead tothe secretion of by-products are interpreted in terms ofoptimal coupling between energy and redox metabolism andthe achievement of optimal growth rates (18). From a biopro-cessing standpoint flux balance models have been used topredict optimal process conditions and feed strategies (21).However, to date no direct experimental verification of thepredictions of flux balance models has been carried out.Here we address the secretion of metabolic by-products by a
nearly wild-type E. coli strain under various culture conditionsand relate experimental observations to predictions made by aflux balance model. Much of the theoretical framework andinsights relevant to an understanding of this work have beenpublished previously (18). Here we report data conceming E. coligrowth on glucose under aerobic chemostat, batch, and fed-batchconditions as well as anaerobic batch conditions. We show thatthe flux balance model with an objective of optimizing the growthrate is an appropriate representation of metabolism under theseconditions, and furthermore we show that when the initial con-ditions of the culture are known the flux balance model is able topredict the time proffiles of growth and by-product concentrationin the culture media for batch and fed-batch cultures.
MATERIALS AND METHODS
Culture. An E. coli K-12 strain, W3110 (ATCC 27325), wasused for all the experiments. The strain has been described as
3724
Vol. 60, No. 10
Dow
nloa
ded
from
http
s://j
ourn
als.
asm
.org
/jour
nal/a
em o
n 29
Dec
embe
r 20
21 b
y 62
.182
.151
.212
.

FLUX BALANCE MODEL 3725
being nearly wild type, and it is able to grow on glucose mineralmedium. Defined M9 medium (Na2HPO4 [6 g/liter], KH2PO4[3 g/liter], NaCl [0.5 g/liter], NH4Cl [1 g/liter], MgSO4 [2 mM],CaCl2 [0.1 mM], FeCl3 [0.01 mM]) was used for all theexperiments with 2 g of glucose per liter except for thefed-batch experiments, in which glucose was continuouslyadded as described below. A temperature of 38°C was main-tained for the culture in the bioreactor as well as in theincubator.
Bioreactor setup. Batch, fed-batch, and chemostat experi-ments were performed in a water jacketed bioreactor (Pega-sus). The temperature was controlled at 38°C by using a waterbath (Haake, Berlin, Germany). Medium inflow in chemostatexperiments was achieved by using a peristaltic pump, and itwas measured volumetrically at the outlet. Glucose solutionwas injected with a syringe pump in fed-batch experiments.Cell density was measured either with a Coulter Counter(Model ZM; Coulter Electronics Inc., Hialeah, Fla.) or byoptical density at 600 nm with a UV 160 spectrophotometer(Shimadzu, Kyoto, Japan) and calibrated with the dry weight.A dry weight calibration of 0.32 g (dry weight)/optical densityat 600 nm was obtained.Gas sparging was achieved by using three type-D sintered
glass spargers (bore size, 10 to 20 ,um; Ace Glass Inc.,Louisville, Ky.). A small bubble size that helped keep dissolvedoxygen above 50% saturation in aerobic experiments wasobtained. The gas flow rate was measured with Gilmontrotameters (Gilmont Instruments, Inc., Great Neck, N.Y.) inthe inlet and outlet. The oxygen percentages in the inlet andoutlet gases were measured by using fuel cell-based oxygenanalyzers (Systech model 2000 [Illinois Instruments CompanyInc., McHenry, Ill.] and Micro-Oxymax [Columbus Instru-ments International Corporation, Columbus, Ohio]). Bothinstruments produced similar results.
Analytical assays. Glucose and lactate concentrations weremeasured by using a YSI glucose lactate analyzer model 2000(Yellow Springs Instruments Inc., Yellow Springs, Ohio).Lactate secretion was not observed in any of the experimentsreported. Acetate was measured by enzymatic conversion toacetyl phosphate and reaction with hydroxylamine (7, 8, 11).Ethanol, formate, and succinate were measured by usingavailable enzymatic kits (Boehringer Mannheim Corporation,Indianapolis, Ind.).
Flux balance model. A metabolic steady state is assumed, inwhich the metabolic pathway flux leading to the formation of ametabolite and that leading to the degradation of a metabolitemust balance, which generates the flux balance equation (3,13):
S v=b (1)
where S is a matrix comprising the stoichiometry of thecatabolic reactions, v is a vector of metabolic fluxes, and b is avector containing the net metabolic uptake by the cell. Equa-tion 1 is typically underdetermined, since the number of fluxes(or metabolic pathways) normally exceeds the number ofmetabolites. Thus, a plurality of solutions exists and a partic-ular solution may be found by using linear optimization bystating an objective and seeking its maximal value within thestoichiometrically defined domain. In other words, specifyingan objective such as optimization of the growth rate woulddetermine the specific metabolic pathway utilization thatwould fulfill the objective.
Objective. A maximal growth objective was used in thepresent study (19, 20); it is shown in equations 2 and 3:
Minimize Z = - Vgro
d. MVgo biomassall M
(2)
(3)
where dM represents the requirements in millimoles per gramof biomass of the M biosynthetic precursors and cofactors forbiomass production. These metabolic requirements for growthare based on biomass composition (5, 20). As noted below, wealso incorporated a scaling factor to allow for strain-specificvariations in biomass and maintenance. Vg,0 is the growth flux(grams of biomass produced), which with the basis of 1 g (dryweight) per h reduces to the growth rate (grams of biomassproduced per gram [dry weight] per hour). Minimizing theobjective function, Z, thus maximizes the growth rate, Vg'.
In order to fulfill the objective of optimizing the growth rate,we allowed the model to secrete unlimited amounts of theby-products acetate, ethanol, formate, lactate, and succinate inall simulations. Thus, the amount of by-product secreted isdetermined by the objective of optimizing the growth rate. Wethen compared predictions of growth rates and by-productlevels simulated by the model with experimental data.Algorithm for prediction of transient changes in external
concentrations. For the prediction of the time profiles ofconsumed and secreted metabolites in batch and fed-batchexperiments, we divided the experimental time into small timesteps, At. The initial concentration values were specified.Starting with the first time step, the flux balance model wasused to predict concentrations for the next step by using thefollowing iterative algorithm.
(i) Substrate concentration (S,) (millimoles per liter) isdetermined from the substrate concentration predicted for theprevious step (S,O) plus any additional substrate provided in afed-batch mode:
supply AtSC = SCO + volume
(ii) The substrate concentration is appropriately scaled todefine the amount of substrate available per unit of biomassper unit of time (millimoles per gram [dry weight] per hour):
Substrate available = AtX A\t
where X is the cell density.(iii) The flux balance model is used to evaluate the actual
substrate uptake (Sn) (this may be less than the amount ofsubstrate available), the growth rate (,u), and potential by-product secretion.
(iv) Concentrations for the next time step are calculatedfrom the standard differential equations:
flyV- = pX-> X=XOdt
aSc _S x > SC = SCO +SuXo(l - eL&)
(6)
(7)
For the algorithm shown above, we considered both glucoseand by-products as substrates that can be used by cells. Thus,as a result of implementing the above algorithm, we predictedthe concentration time profiles of cells, glucose, and by-products.
VOL. 60, 1994
(4)
(5)
Dow
nloa
ded
from
http
s://j
ourn
als.
asm
.org
/jour
nal/a
em o
n 29
Dec
embe
r 20
21 b
y 62
.182
.151
.212
.

3726 VARMA AND PALSSON
4
e4
03-
3
2
1
0.00.0
0.0 0.2 0.4 0.6 0.8,v sn\
0.1 0.2 0.3
X (g/l)FIG. 1. Maximum enzymatic capacity for oxygen utilization deter-
mined from batch experiments as the slope of the best fit, 15 mmol of02 per g (dry weight) per h. The data are a composite from three batchexperiments in which oxygen consumption was measured in the gasphase. The correlation coefficient (r2) was 0.975. rO2, millimoles ofoxygen consumed by 1 liter of culture volume in 1 h.
RESULTS
In order to apply the flux balance model we first needed todetermine the strain-specific parameters. The fully specifiedmodel was then used to compare predictions with experimentaldata.
Strain characterization: experimental determination ofmodel parameters. It is necessary to establish a finite upperlimit on the rate of metabolism per unit (dry weight) of thebacterium. We thus determined the maximum enzymatic limitsof oxygen and glucose uptake rates from batch experiments forE. coli W3110. We also derived the biomass scaling andmaintenance requirements, which are strain- and temperature-specific.Oxygen uptake rate. The enzymatic capacity of the cell to
consume oxygen was determined by performing batch experi-ments. During the exponential growth phase of a batch culture,when the glucose substrate is present in excess, the growth rateis at a maximum. In such a situation bacterial cells consume themaximum amount of oxygen possible (1).The flux balance model also predicts that the maximal
oxygen consumption rate occurs during exponential batchculture. On the basis of a linear regression of the experimentaldata shown in Fig. 1 the maximum oxygen utilization rate wasdetermined to be 15 mmol of 02 per g (dry weight) per h.
Glucose uptake rate. The flux balance model requires that amaximum glucose utilization rate be specified for metabolicsimulations of batch and fed-batch cultures in order to restrictthe metabolic capacity of a single cell to a finite upper limit.The enzymatic capacity for glucose utilization is determined asthe ratio of the growth rate to the biomass yield in batchexperiments. For aerobic batch cultures we have determinedthis value to be 10.5 mmol of Glc per g (dry weight) per h (Fig.2). Similarly, for anaerobic cultures the maximum glucoseutilization rate was determined to be 18.5 mmol per g (dryweight) per h (Fig. 3).
Maintenance and biomass requirements. The metabolicrequirements for biomass synthesis have been defined on thebasis of previously reported composition analyses (5, 20). Inorder to fully describe biomass generation in the model weneeded to include the metabolic maintenance requirements of
(a) A (g/l)
0
-1
-2
-4
-54 6 8 10 12 14 16
(b) Time (hr)FIG. 2. Maximum aerobic glucose utilization rate (10.5 mmol of
Glc per g [dry weight] per h) determined from batch experiments asthe growth rate (0.68 h-1; r2 = 0.999) divided by the biomass yield(0.064 g [dry weight] per mmol of Glc; r2 = 0.995). The plots arecomposites from batch experiments.
the bacterium as well as account for strain-specific differencesin biomass composition.
Maintenance requirements were determined by the standardapproach (14) of plotting glucose uptake as a function of thegrowth rate in a chemostat. As shown in Fig. 4, a fit of themodel to the experimental plot gives us the non-growth-associated maintenance (18) as the y-intercept, which is equalto 7.6 mmol of ATP per g (dry weight) per h.
Growth-associated maintenance (18) was determined by theclosest fit of the discontinuity in slope predicted by the modelto the experimental data of Fig. 4. The flux balance modelpredicts that such a discontinuity in slope must exist at a pointwhere oxygen becomes limiting and acetate is secreted.Growth-associated maintenance accounts for energy depletingactivities such as protein turnover that increase with increasinggrowth rates. For strain and experimental conditions describedhere, we have determined the growth-associated maintenancerequirement to be 13 mmol of ATP per g of biomass. Thismaintenance requirement adds to the ATP energy require-ments for biomass synthesis.
Biomass requirements for growth have been estimated for E.coli (5) on the basis of composition analyses. To apply the fluxbalance model, we found it necessary to modify these biomassrequirements, which may reflect strain-specific differences.Thus, a scaling factor of 1.3 (i.e., 30% higher biomass require-ments) was used to obtain the best fit of the predicted slope toexperimental data (Fig. 4). Therefore, the flux balance modelfor our E. coli strain requires a definition of biomass require-ments that is 30% higher than that reported previously (5). It
APPL. ENVIRON. MICROBIOL.
Dow
nloa
ded
from
http
s://j
ourn
als.
asm
.org
/jour
nal/a
em o
n 29
Dec
embe
r 20
21 b
y 62
.182
.151
.212
.

FLUX BALANCE MODEL 3727
5-
4-
0o
*a
3-
2-
1
0-
+ x (g/)A Glc (g/l)* Ac (mM)
.
U U
+ I +~!
f M .AA
0.0 0.2 0.4
D (l/hr)
+ +
0.6 0.8
FIG. 5. Analysis of aerobic chemostat culture showing cell density,glucose concentration, and acetate concentration as functions of thedilution or growth rate. The chemostat was not limited for minerals. D,dilution rate in the chemostat.
(b
FIG. 3. MGlc per g [drthe growth rE(0.023 g [dry
should be p(specific biosfrom the ccstrain (5).model is nc
1
o 11
FIG. 4. Don the basislimitations infrom the fluxThe non-grefrom the y-inih, while the g13 mmol of Aare scaled toously (5) to athe chemosta
I biosynthetic precursor (20). Thus, the nonspecific scaling fac-0 tor of 1.3 is expected to take into account any discrepancy in0.0 0.1 0.2 0.3 the biomass composition.
X (gil) From the model specifications described above we have
aximum anaerobic glucose utilization rate (18.5 mmol ofarrived at a total ATP requirement for biomass production
y weight] per h) determined from batch experiments as that is equal to 70 mmol of ATP per g of biomass ([41 mmol forate (0.43 h-1; = 0.999) divided by the biomass yield biomass synthesis + 13 mmol for maintenance] x 1.3 [scalingweight] per mmol of Glc; r2 = 0.996). factor] = 70 mmol total), a value that compares favorably with
the value (71 mmol of ATP per g of biomass) obtained for theclosely related organism Aerobacter aerogenes (16).
)inted out that the biomass composition in terms of Stoichiometrically optimal by-product secretion. The flux
,ynthetic precursors for our strain may be different balance model is formulated by using stoichiometric informa-
)mposition determined previously for a particular tion concerning the metabolic pathways and the metabolic
Iowever, it has been shown that the flux balance requirements for growth. The model utilizes the principle of
)t highly sensitive to demands for any particular optimal growth rate in order to determine the metabolicpathway utilization. We now report a series of experimentswhose data can be directly compared with predictions made bythe model.
E. coli cells were grown in an aerobic chemostat at severaldifferent dilution rates. Cell density and glucose and by-product concentrations in the outlet from the culture vessel
0o were measured and are plotted in Fig. 5. At low dilution rates
we observed that all the glucose was consumed without thesecretion of any by-product. Increasing the dilution rate abovea critical value resulted in the secretion of acetate as a
S ^~by-product. Lactate secretion was not observed in any of theexperiments reported here.The glucose uptake, oxygen uptake, and acetate secretion
0 ~ , rates at different dilution rates were computed on the basis of
0.0 0.2 0.4 0.6 0.8 data presented in Fig. 5. Simulation using the flux balancemodel was carried out by specifying a glucose uptake rate and
D (VIhr) determining the optimal rates of growth, oxygen uptake, and
etermination of biomass and maintenance requirements by-product secretion. The measured and predicted rates wereof chemostat experiments. There were no mineral directly compared (Fig. 6). The flux balance model was found
the chemostat. The solid line denotes the best fit of data to quantitatively simulate both the onset of acetate secretionbalance model to the experimental datum points shown. and the increase in the acetate secretion rate with increasing)wth-associated maintenance requirement determined dilution rates. Switches in metabolic flux distribution lead to
tercept is 7.6 mmol of ATP per g (dry weight [DW]) per the secretion of metabolites, and a detailed explanation forYrowth-associated maintenance requirement is defined as
TP per g (dry weight). In addition, biomass requirements these switches can be obtained by flux balance analysis (18). Atbe 30% higher than the defined values reported previ- high growth rates the cells are enzymatically limited for
iccount for strain-specific differences. D, dilution rate in oxygen, which acts as a redox sink. This limitation causes a
tt. change in the usefulness of metabolic intermediates to the cell.
-4
(a) 4 6Time (hr)
8 10
VOL. 60, 1994
Dow
nloa
ded
from
http
s://j
ourn
als.
asm
.org
/jour
nal/a
em o
n 29
Dec
embe
r 20
21 b
y 62
.182
.151
.212
.

3728 VARMA AND PALSSON
O Oxygen E = 1.5 mmol/g DW-hrA Glucose E = 0.3 mmol/g DW-hr* Acetate E = 0.35 mmol/g DW-hr
0.8
0.62
%0.4
0.2
E = 0.024 g/l ++++
2 4 6 8Time (hr)
rA4)16aco9
C.4) :!.cn0.$ 0
w14 I.-Iam
0.0 0.2 0.4 0.6 0.8
D (lAhr)FIG. 6. Analysis of aerobic chemostat culture showing the glucose
and oxygen uptake rates and the acetate secretion rate as functions ofthe dilution or growth rate. The chemostat was not limited forminerals. The solid lines represent the flux balance model simulations.E, average deviation between predictions of the model and experimen-tal measurements; DW, dry weight.
Acetate is no longer useful to the cell, and it is secreted as a
redox sink.Batch and fed-batch cultures. We now consider the predic-
tive ability of the flux balance model to describe batch andfed-batch cultures. In order to simulate the time course ofconcentration changes in the culture medium we discretizedtime into small segments, in each of which, we assumed, themetabolic steady state was maintained.
Aerobic batch culture. Bacterial cells were cultured indefined M9 medium with glucose as the carbon source underaerobic conditions. Figure 7 shows experimental data from a
typical aerobic batch culture. Also shown are predictive simu-lations from the flux balance model. The predictions werecarried out as described in Materials and Methods by specify-ing the initial conditions for the model.The flux balance model was able to accurately predict time
profiles for the cell density as well as the glucose uptake rate(Fig. 7). The model was also able to predict acetate secretionand accumulation in the medium. The model accurately pre-dicted the reutilization of acetate, but it was unable to quan-titatively account for the time required to make the transitionfrom glucose consumption to acetate consumption. Transitionsbetween different pathway utilizations are a function of geneticregulatory processes. The flux balance model incorporates onlymetabolic pathway information and thus cannot predict thetime course of genetic regulation.
Enzymatic limitations on acetate uptake rates may also havesignificance in limiting the reconsumption of acetate. We havenot determined the enzymatic limits on acetate uptake. Thecurrent specification of the flux balance model allows unlim-ited acetate consumption. However, there is a broader enzy-
matic limit of oxygen uptake that indirectly restricts acetateconsumption. Thus, an oxygen uptake limit of 15 mmol of 02per g (dry weight) per h corresponds to an acetate utilizationlimit of 11.3 mmol of acetate per g (dry weight) per h.
Aerobic fed-batch culture. We next investigated the appli-cability of the flux balance model to fed-batch cultures. Fed-batch cultures were initiated by inoculating bacteria into
5.0-
4.0--
3.0-i< 2.0-
1.0-
E=0.36mM
0 2 4 6 8 10
Time (hr)
FIG. 7. Analysis of aerobic batch culture showing time profiles ofcell density, glucose concentration, and acetate (Ac) concentration.The culture was not limited for minerals. The solid lines are the fluxbalance model predictions of the time profiles for the culture. E,average deviation between predictions of the model and experimentalmeasurements.
defined mineral medium without a carbon source. Glucose as
the carbon source was continuously fed to the culture by usinga syringe pump. As with the batch experiments, the lag phaseof growth was ignored for the simulations. The initial concen-trations and the glucose feed rate were inserted into thepredictive algorithm in order to obtain time profiles of celldensity and glucose and by-product concentrations.
Let us first consider the case of a culture inoculated withbacteria at a relatively high cell density and fed with glucose ata relatively low feed rate. Figure 8 shows the experimental andpredicted time profiles of such a culture. A high degree ofcorrelation between the experimental and predicted time
0.5
0.4
%;4 0.3
0.2
0.1 '
0.08 g Glc
1-hr
0.16 gGlc1-hr
/+ E = 0.015 g/l
0 2 4 6 8Time (hr)
FIG. 8. Aerobic fed-batch culture with continuous glucose injec-tion at the rates indicated. The culture was not limited for minerals.The time profile of cell density is shown, with predictions of the modelrepresented as the solid line. Glucose and acetate concentrations werezero for both experiments and predictions of the model. E, averagedeviation between predictions of the model and experimental mea-
surements.
10
8
1 6
c 4.
2
A
E = 0.27mM \
10 0 2 4 6 8Time (hr)
10
APPL. ENVIRON. MICROBIOL.
Dow
nloa
ded
from
http
s://j
ourn
als.
asm
.org
/jour
nal/a
em o
n 29
Dec
embe
r 20
21 b
y 62
.182
.151
.212
.
FLUX BALANCE MODEL 3729
0.8-
0.6-
%0.4-
0.2-
0 2 4 6Time (hr)
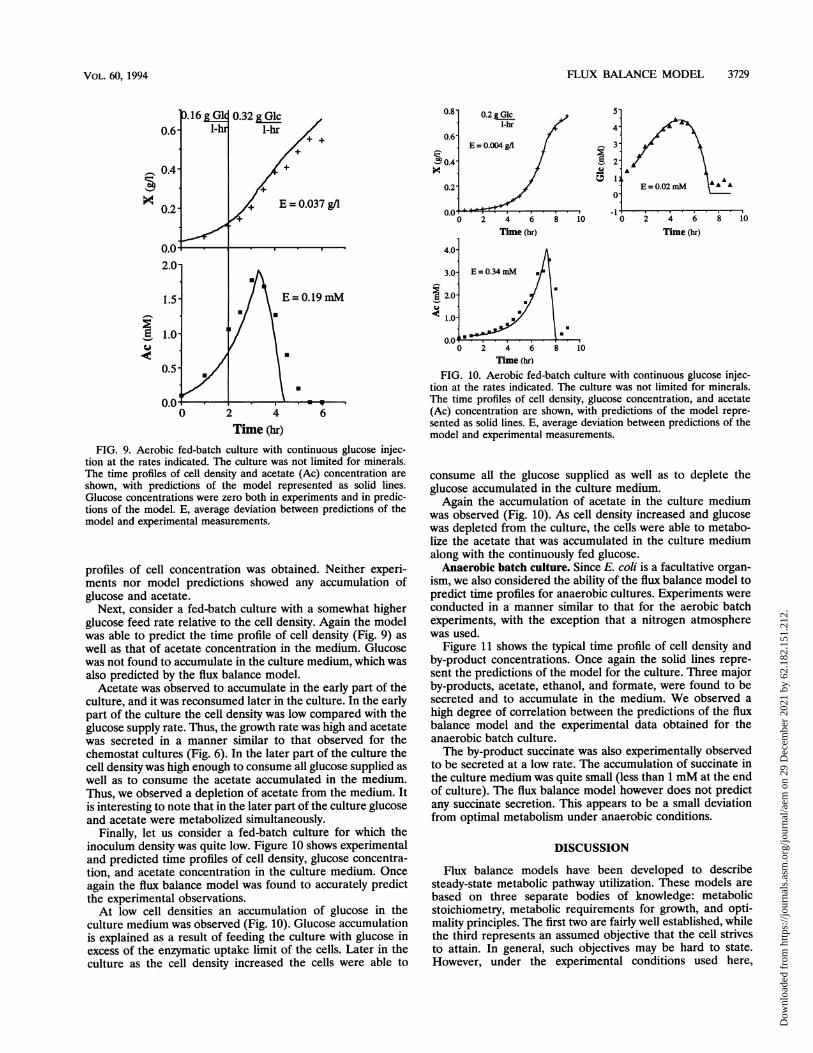
FIG. 9. Aerobic fed-batch culture with continuous glucose injec-tion at the rates indicated. The culture was not limited for minerals.The time profiles of cell density and acetate (Ac) concentration areshown, with predictions of the model represented as solid lines.Glucose concentrations were zero both in experiments and in predic-tions of the model. E, average deviation between predictions of themodel and experimental measurements.
profiles of cell concentration was obtained. Neither experi-ments nor model predictions showed any accumulation ofglucose and acetate.
Next, consider a fed-batch culture with a somewhat higherglucose feed rate relative to the cell density. Again the modelwas able to predict the time profile of cell density (Fig. 9) aswell as that of acetate concentration in the medium. Glucosewas not found to accumulate in the culture medium, which wasalso predicted by the flux balance model.
Acetate was observed to accumulate in the early part of theculture, and it was reconsumed later in the culture. In the earlypart of the culture the cell density was low compared with theglucose supply rate. Thus, the growth rate was high and acetatewas secreted in a manner similar to that observed for thechemostat cultures (Fig. 6). In the later part of the culture thecell density was high enough to consume all glucose supplied aswell as to consume the acetate accumulated in the medium.Thus, we observed a depletion of acetate from the medium. Itis interesting to note that in the later part of the culture glucoseand acetate were metabolized simultaneously.
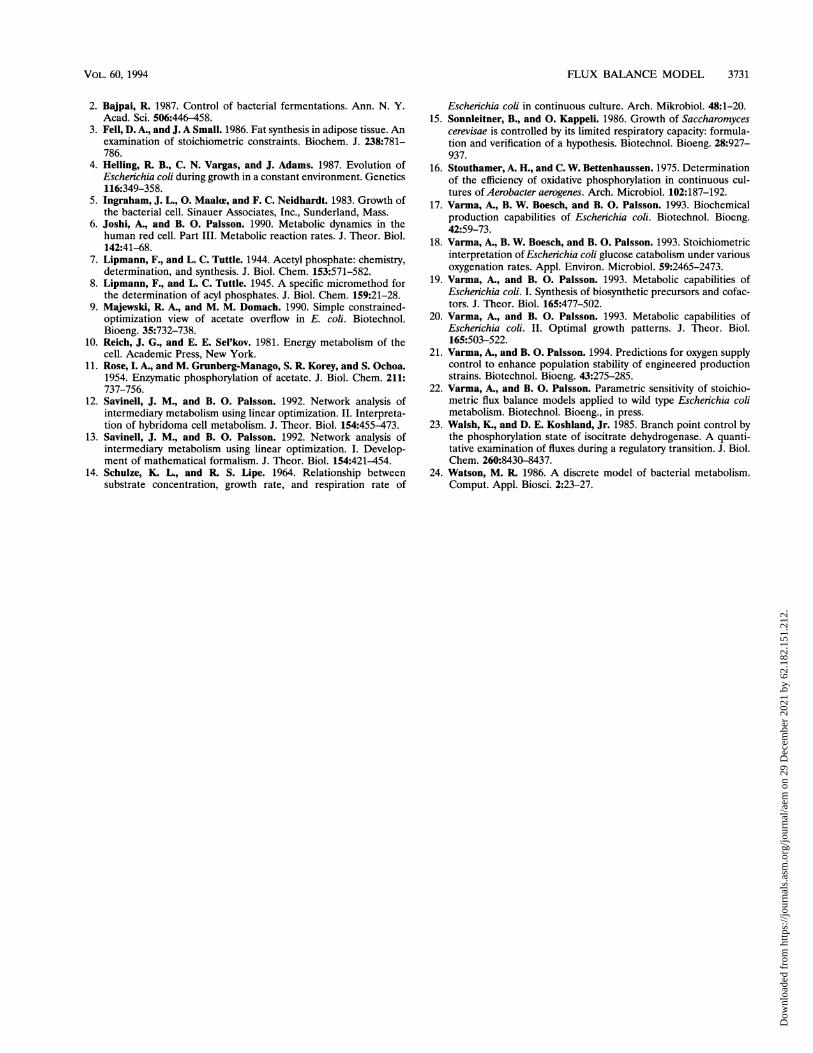
Finally, let us consider a fed-batch culture for which theinoculum density was quite low. Figure 10 shows experimentaland predicted time profiles of cell density, glucose concentra-tion, and acetate concentration in the culture medium. Onceagain the flux balance model was found to accurately predictthe experimental observations.At low cell densities an accumulation of glucose in the
culture medium was observed (Fig. 10). Glucose accumulationis explained as a result of feeding the culture with glucose inexcess of the enzymatic uptake limit of the cells. Later in theculture as the cell density increased the cells were able to
0.2 g Glc1-hr
E = 0.004 g/l
D 2 4 6Time (hr)
4.0-
3.0- E = 0.34 mM
2.0-
1.0-
0.0 1. -u -I
8 10
5-
4-
3-
2
A
-1 _0
A
E = 0.02 mM AM
2 4 6Time (hr)
8 10
0 2 4 6 8 10Time (hr)
FIG. 10. Aerobic fed-batch culture with continuous glucose injec-tion at the rates indicated. The culture was not limited for minerals.The time profiles of cell density, glucose concentration, and acetate(Ac) concentration are shown, with predictions of the model repre-sented as solid lines. E, average deviation between predictions of themodel and experimental measurements.
consume all the glucose supplied as well as to deplete theglucose accumulated in the culture medium.Again the accumulation of acetate in the culture medium
was observed (Fig. 10). As cell density increased and glucosewas depleted from the culture, the cells were able to metabo-lize the acetate that was accumulated in the culture mediumalong with the continuously fed glucose.Anaerobic batch culture. Since E. coli is a facultative organ-
ism, we also considered the ability of the flux balance model topredict time profiles for anaerobic cultures. Experiments wereconducted in a manner similar to that for the aerobic batchexperiments, with the exception that a nitrogen atmospherewas used.
Figure 11 shows the typical time profile of cell density andby-product concentrations. Once again the solid lines repre-sent the predictions of the model for the culture. Three majorby-products, acetate, ethanol, and formate, were found to besecreted and to accumulate in the medium. We observed ahigh degree of correlation between the predictions of the fluxbalance model and the experimental data obtained for theanaerobic batch culture.The by-product succinate was also experimentally observed
to be secreted at a low rate. The accumulation of succinate inthe culture medium was quite small (less than 1 mM at the endof culture). The flux balance model however does not predictany succinate secretion. This appears to be a small deviationfrom optimal metabolism under anaerobic conditions.
DISCUSSION
Flux balance models have been developed to describesteady-state metabolic pathway utilization. These models arebased on three separate bodies of knowledge: metabolicstoichiometry, metabolic requirements for growth, and opti-mality principles. The first two are fairly well established, whilethe third represents an assumed objective that the cell strivesto attain. In general, such objectives may be hard to state.However, under the experimental conditions used here,
VOL. 60, 1994
A
c)
Dow
nloa
ded
from
http
s://j
ourn
als.
asm
.org
/jour
nal/a
em o
n 29
Dec
embe
r 20
21 b
y 62
.182
.151
.212
.

3730 VARMA AND PALSSON
6- E=0.55 mM \
2- A2 4 6 8 10 12A
12
20
16
1 12
o 8-
4
0
12 "0
2 4 6 8, lo 1,2Time (hr)
E= 1.5 mM
2 4 6 8Time (hr)
10 12
0 2 4 6 8 10 12
Time (hr)
FIG. 11. Anaerobic batch culture showing the time profiles of celldensity and various by-product concentrations. Solid lines representthe model predictions of the model. E, average deviation betweenpredictions of the model and experimental measurements; Ac, acetate;
For, formate; Eth, ethanol.
namely, nutritionally rich environments, the assumption thatgrowth rates are optimized is consistent with evolutionaryprinciples.Although stoichiometric models have provided insight into
metabolic physiology and optimal bioprocess conditions (18,21), the predictions they yield have not been directly experi-mentally verified. In this report we provide quantitative com-
parisons of experimental and theoretical results. We firstmeasured strain-specific parameters in independent experi-ments. Then, we used the fully specified model to predict thebehavior of E. coli W3110 in a chemostat and in batch andfed-batch cultures. A detailed sensitivity analysis of the fluxbalance model formulated here is reported elsewhere (22).The flux balance model was specified for the wild-type strain
W3110 by determining the enzymatic capacity limits of oxygen
and glucose utilization. In a broader sense specification of suchlimits prevents a single cell from displaying an infinite meta-
bolic capacity-a physical impossibility. In addition, mainte-nance requirements and strain-specific biomass scaling were
determined on the basis of chemostat experiments.With a glucose substrate the bacterial culture was found to
secrete and reutilize by-products in specific situations. Cells inthe aerobic chemostat were shown to secrete acetate whengrown at a rate above a specific growth rate in a manner similarto that reported previously (2). We have shown here that theflux balance model can explain the secretion of acetate by usingthe constrained-optimization logic reported previously (9).We have developed a predictive algorithm for time profiles
of metabolism in the unsteady state of batch and fed-batchculture. The algorithm divides the culture time into small steps
and assumes the existence of a steady state in each small timestep. The ability of the algorithm to predict time profiles forcell density, glucose concentration, and by-product concentra-tions in the culture medium provides a verification for thevalidity of the flux balance model and demonstrates its useful-ness for bioprocess engineering.Some deviations from the predictions of the model were
observed during transitions in the utilization of metabolicpathways, such as the change from glucose metabolism toacetate metabolism. It was observed that the transition was lessabrupt for fed-batch cultures, resulting in quantitatively betterpredictions by the model for fed-batch transitions.
It should be recognized that the flux balance model is amodel of metabolism and does not incorporate the dynamics ofregulation. As the culture environment changes, through sucha process as the depletion of a specific carbon source, the fluxbalance model predicts a change in metabolic pathway utiliza-tion. However, in order to actually achieve the new metabolicpathway utilization several regulatory changes have to be madeboth at the genetic level and at the enzymatic level. The timerequired for these regulatory changes is not taken into consid-eration in the flux balance model. Thus, the flux balance modelis able to accurately predict the occurrence of metabolictransitions, but it has trouble in circumstances in which regu-latory changes require time. Thus, for example, the fluxbalance model is inappropriate for simulating the lag phase incultures.An interesting phenomenon observed in the aerobic fed-
batch cultures is that of acetate reconsumption in the presenceof a glucose feed. It is generally assumed that the presence ofglucose represses the utilization of other substrates. In con-trast, we observed in both experiments and the predictions ofthe model that a sufficiently high cell density can result in thesimultaneous consumption of glucose and acetate. Cometabo-lization of glucose and acetate has been reported previously(23).An important question concerning the observation of come-
tabolism is that of clone-specific metabolism. Culture in aglucose-limited chemostat, starting with a single clone of E.coli (4), has been shown to result in the generation ofpolymorphisms. Clones isolated from the chemostat werefound to have different metabolism rates for glucose andacetate. The cometabolism of glucose and acetate observed inthe fed-batch experiment (Fig. 9 and 10) could be the result ofeither single-cell cometabolism or clone-specific metabolism,with different clonal populations metabolizing glucose andacetate. However, since the experiments only last a few hours,one may reasonably assume that genetic mutants cannot besignificant unless they are present in the inoculum. One mayalso formulate arguments for clone-specific metabolism as aresult of regulation within the same genetic clone. Thesequestions form an interesting area for future research.
Applicability of the flux balance model to the experimentalconditions described in this report demonstrates the impor-tance of stoichiometrically optimal metabolism. It would be ofinterest to further develop the model and investigate itsexperimental applicability under a wider range of conditions.Validation of the flux balance model has far-reaching ramifi-cations for the interpretation of metabolic physiology, pathwayutilization, strain design, and bioprocess development andcontrol (9, 18, 21).
REFERENCES1. Anderson, K. B., and K. von Meyenburg. 1980. Are growth rates of
Escherichia coli in batch cultures limited by respiration? J. Bacte-riol 144:114-123.
0.3
0.2
0
0.1
U.U'0
10-
8-
6-
4-
2-
0-r_0
E=0.012g/1 ++
2L 4 6 8+ 1
Time (hr)
E=0.33mM i
2 4 6 8 loTime (hr)
I x
E = 0.51mM /xx
8
6
4.
2-
APPL. ENvIRON. MICROBIOL.
I:
11
I.20
Ici
-.14
Dow
nloa
ded
from
http
s://j
ourn
als.
asm
.org
/jour
nal/a
em o
n 29
Dec
embe
r 20
21 b
y 62
.182
.151
.212
.
FLUX BALANCE MODEL 3731
2. Bajpai, R. 1987. Control of bacterial fermentations. Ann. N. Y.Acad. Sci. 506:446-458.
3. Fell, D. A., and J. A Small. 1986. Fat synthesis in adipose tissue. Anexamination of stoichiometric constraints. Biochem. J. 238:781-786.
4. Helling, R. B., C. N. Vargas, and J. Adams. 1987. Evolution ofEscherichia coli during growth in a constant environment. Genetics116:349-358.
5. Ingraham, J. L., 0. Maale, and F. C. Neidhardt. 1983. Growth ofthe bacterial cell. Sinauer Associates, Inc., Sunderland, Mass.
6. Joshi, A., and B. 0. Palsson. 1990. Metabolic dynamics in thehuman red cell. Part III. Metabolic reaction rates. J. Theor. Biol.142:41-68.
7. Lipmann, F., and L. C. Tuttle. 1944. Acetyl phosphate: chemistry,determination, and synthesis. J. Biol. Chem. 153:571-582.
8. Lipmann, F., and L. C. Tuttle. 1945. A specific micromethod forthe determination of acyl phosphates. J. Biol. Chem. 159:21-28.
9. Majewski, R. A., and M. M. Domach. 1990. Simple constrained-optimization view of acetate overflow in E. coli. Biotechnol.Bioeng. 35:732-738.
10. Reich, J. G., and E. E. Sel'kov. 1981. Energy metabolism of thecell. Academic Press, New York.
11. Rose, I. A., and M. Grunberg-Manago, S. R. Korey, and S. Ochoa.1954. Enzymatic phosphorylation of acetate. J. Biol. Chem. 211:737-756.
12. Savinell, J. M., and B. 0. Palsson. 1992. Network analysis ofintermediary metabolism using linear optimization. II. Interpreta-tion of hybridoma cell metabolism. J. Theor. Biol. 154:455-473.
13. Savinell, J. M., and B. 0. Palsson. 1992. Network analysis ofintermediary metabolism using linear optimization. I. Develop-ment of mathematical formalism. J. Theor. Biol. 154:421-454.
14. Schulze, K. L., and R. S. Lipe. 1964. Relationship betweensubstrate concentration, growth rate, and respiration rate of
Escherichia coli in continuous culture. Arch. Mikrobiol. 48:1-20.15. Sonnleitner, B., and 0. Kappeli. 1986. Growth of Saccharomyces
cerevisae is controlled by its limited respiratory capacity: formula-tion and verification of a hypothesis. Biotechnol. Bioeng. 28:927-937.
16. Stouthamer, A. H., and C. W. Bettenhaussen. 1975. Determinationof the efficiency of oxidative phosphorylation in continuous cul-tures of Aerobacter aerogenes. Arch. Microbiol. 102:187-192.
17. Varma, A., B. W. Boesch, and B. 0. Palsson. 1993. Biochemicalproduction capabilities of Escherichia coli. Biotechnol. Bioeng.42:59-73.
18. Varma, A., B. W. Boesch, and B. 0. Palsson. 1993. Stoichiometricinterpretation of Escherichia coli glucose catabolism under variousoxygenation rates. Appl. Environ. Microbiol. 59:2465-2473.
19. Varma, A., and B. 0. Palsson. 1993. Metabolic capabilities ofEscherichia coli. I. Synthesis of biosynthetic precursors and cofac-tors. J. Theor. Biol. 165:477-502.
20. Varma, A., and B. 0. Palsson. 1993. Metabolic capabilities ofEscherichia coli. II. Optimal growth patterns. J. Theor. Biol.165:503-522.
21. Varma, A., and B. 0. Palsson. 1994. Predictions for oxygen supplycontrol to enhance population stability of engineered productionstrains. Biotechnol. Bioeng. 43:275-285.
22. Varma, A., and B. 0. Palsson. Parametric sensitivity of stoichio-metric flux balance models applied to wild type Escherichia colimetabolism. Biotechnol. Bioeng., in press.
23. Walsh, K., and D. E. Koshland, Jr. 1985. Branch point control bythe phosphorylation state of isocitrate dehydrogenase. A quanti-tative examination of fluxes during a regulatory transition. J. Biol.Chem. 260:8430-8437.
24. Watson, M. R. 1986. A discrete model of bacterial metabolism.Comput. Appl. Biosci. 2:23-27.
VOL. 60, 1994
Dow
nloa
ded
from
http
s://j
ourn
als.
asm
.org
/jour
nal/a
em o
n 29
Dec
embe
r 20
21 b
y 62
.182
.151
.212
.