hsl pcg “the daily” may 16, 2018 - hdfcsec.com daily 16052018... · upward revised to 0.8%, the...
TRANSCRIPT

PRIVATE CLIENT GROUP [PCG]
May 16, 2018
HSL PCG “THE DAILY”

PRIVATE CLIENT GROUP [PCG]
“THE DAILY”
2
VIEW POINTDOMESTIC INDICES
Close Points % Change
SENSEX 35544 -13 -0.04
NIFTY 10802 -5 -0.04
MIDCAP 16069 -131 -0.81
SMALL CAP 17525 -115 -0.65
SECTORAL INDICES
Close Points % Change
IT 13240 63 0.48
TECK 6885 23 0.34
METAL 14054 30 0.21
CD 21407 -9 -0.04
BANKEX 29706 -33 -0.11
Finance 5960 -9 -0.15
POWER 2143 -3 -0.15
CG 19012 -51 -0.27
OIL & GAS 14733 -42 -0.28
Healthcare 13293 -60 -0.45
AUTO 24867 -177 -0.71
REALTY 2280 -44 -1.90
ADVANCE/DECLINES
BSE %
ADVANCES 1028 37
DECLINES 1611 58
UNCHANGED 140 5
GAINERS % LOSERS %
MPHASIS 9.80 NCC -8.03
DMART 4.31 IBREALEST -5.17
SIEMENS 3.86 TATAGLOBAL -5.03
COLPAL 3.39 PCJEWELLER -5.00
JSWENERGY 3.08 VAKRANGEE -4.98
BSE 200 GAINERS/LOSERS
MARKETS DON’T LIKE UNCERTAINTIES
INSTITUTIONAL ACTIVITY
Rs Cr 15/05/18 14/05/18 May Total
FII -518 718 -3419
MF 531 687 3465
Though the elections in Karnataka have ended aGovernment is still not in place. This means uncertaintyfor the markets and markets don’t like uncertainties.
Meanwhile, the April retail sales in the U.S. grew 3%.Considering the fact that the March sales were furtherupward revised to 0.8%, the indications are that theU.S. economy is picking up in Q2 after a Luke warm Q1.
As a result bond yields on the 10 year U.S. paper spiked7.5 basis points to 3.070%. Equity indices fell onaccount of this. In itself, 3% isn’t as significant, but it ispsychologically important, and it comes at an uncertaintime for the equity markets.
Markets will now look at the international news andevents in a more engaging manner. The markets arelikely to open lower in line with the international cues.North Korea has called off the talks with South Koreathat were scheduled this week over joint military drillsby U.S. and South Korea.
We had asked traders to keep tight stop losses on theirlong trades yesterday as we felt that it was time to closethat bullish trading call. We will meanwhile, withdraw tothe side-lines and wait and watch from there and willgive a fresh bullish call as and when we feel it isopportune.
Exports rise 5.17% to $ 25.9bn in April; tradedeficit up at $ 13.7 bn
India's exports rose by 5.17 % YoY to $ 25.9 bn in Aprilon back of good show by sectors like engineering,pharmaceutical and chemicals. Imports during themonth were valued at $ 39.6 bn, up 4.6 % over April2017.
The gap between imports and exports or trade deficitwas marginally higher at $ 13.7 bn during April 2018compared to $ 13.24 bn in April 2017, the data showed.
Major commodity groups showing positive export growthin April on annual basis include engineering goods(17.63 %), chemicals (38.48 %), pharmaceuticals(13.56 %), yarn and handloom products (15.66 %) andplastic and linoleum (30.03 %).
PRIVATE CLIENT GROUP [PCG]
“THE DAILY”
3
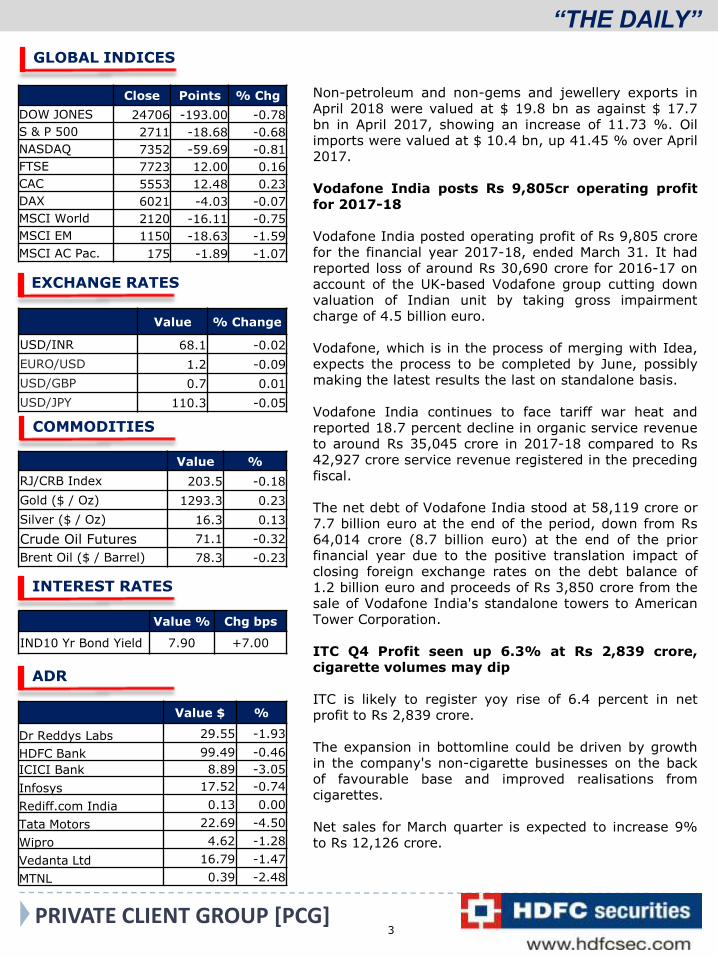
GLOBAL INDICES
Close Points % Chg
DOW JONES 24706 -193.00 -0.78
S & P 500 2711 -18.68 -0.68
NASDAQ 7352 -59.69 -0.81
FTSE 7723 12.00 0.16
CAC 5553 12.48 0.23
DAX 6021 -4.03 -0.07
MSCI World 2120 -16.11 -0.75
MSCI EM 1150 -18.63 -1.59
MSCI AC Pac. 175 -1.89 -1.07
EXCHANGE RATES
Value % Change
USD/INR 68.1 -0.02
EURO/USD 1.2 -0.09
USD/GBP 0.7 0.01
USD/JPY 110.3 -0.05
INTEREST RATES
Value % Chg bps
IND10 Yr Bond Yield 7.90 +7.00
Value %
RJ/CRB Index 203.5 -0.18
Gold ($ / Oz) 1293.3 0.23
Silver ($ / Oz) 16.3 0.13
Crude Oil Futures 71.1 -0.32
Brent Oil ($ / Barrel) 78.3 -0.23
COMMODITIES
ADR
Value $ %
Dr Reddys Labs 29.55 -1.93
HDFC Bank 99.49 -0.46
ICICI Bank 8.89 -3.05
Infosys 17.52 -0.74
Rediff.com India 0.13 0.00
Tata Motors 22.69 -4.50
Wipro 4.62 -1.28
Vedanta Ltd 16.79 -1.47
MTNL 0.39 -2.48
Non-petroleum and non-gems and jewellery exports inApril 2018 were valued at $ 19.8 bn as against $ 17.7bn in April 2017, showing an increase of 11.73 %. Oilimports were valued at $ 10.4 bn, up 41.45 % over April2017.
Vodafone India posts Rs 9,805cr operating profitfor 2017-18
Vodafone India posted operating profit of Rs 9,805 crorefor the financial year 2017-18, ended March 31. It hadreported loss of around Rs 30,690 crore for 2016-17 onaccount of the UK-based Vodafone group cutting downvaluation of Indian unit by taking gross impairmentcharge of 4.5 billion euro.
Vodafone, which is in the process of merging with Idea,expects the process to be completed by June, possiblymaking the latest results the last on standalone basis.
Vodafone India continues to face tariff war heat andreported 18.7 percent decline in organic service revenueto around Rs 35,045 crore in 2017-18 compared to Rs42,927 crore service revenue registered in the precedingfiscal.
The net debt of Vodafone India stood at 58,119 crore or7.7 billion euro at the end of the period, down from Rs64,014 crore (8.7 billion euro) at the end of the priorfinancial year due to the positive translation impact ofclosing foreign exchange rates on the debt balance of1.2 billion euro and proceeds of Rs 3,850 crore from thesale of Vodafone India's standalone towers to AmericanTower Corporation.
ITC Q4 Profit seen up 6.3% at Rs 2,839 crore,cigarette volumes may dip
ITC is likely to register yoy rise of 6.4 percent in netprofit to Rs 2,839 crore.
The expansion in bottomline could be driven by growthin the company's non-cigarette businesses on the backof favourable base and improved realisations fromcigarettes.
Net sales for March quarter is expected to increase 9%to Rs 12,126 crore.

PRIVATE CLIENT GROUP [PCG]
“THE DAILY”
4
Earnings before interest, tax, depreciation, and amortisation (EBITDA) are likely to grow 9percent YoY to Rs 4,236 crore.
Cigarettes are the mainstay business of the company, contributing 86 percent of total PBIT.Company's cigarette volumes may decline 2 percent on year in the March quarter.
The key trends to watch out for in the results will be cigarette volumes and operating marginsfor the FMCG segment, along with profitability for each segment.
Tata Steel Q4 preview; Results to be announced today
Tata Steel is expected to swing back to profit in the fourth quarter ending March 2018, aided bybetter price realisation.
Company to report a consolidated net profit of Rs 2,552 crore in the period ending March 31,2018, as against a loss of Rs 1,168 crore a year earlier.
The poll expects company’s consolidated revenue at Rs 34,869 crore as against Rs 33,896 crorea year earlier.The company will be helped by a hike in steel prices, and also a correction in therates of raw materials like iron ore coking coal.These market conditions compensated for thetrying conditions the company faced in its facilities.
Tata Steel’s production in India for the quarter was impacted by a breakdown in the blastfurnace of its facility in Kalinganagar. Its domestic sales declined by 6.23 percent to 3.01 milliontons, while production was down 4.06 percent at 3.07 million tons.
The performance was similar in its European unit, where sales dropped to 2.48 million tons,from 2.85 million tons a year earlier. Production was flat at 2.62 million tons.
Hindalco Q4 FY18 preview
Standalone Revenue is likely to dip 2% yoy to Rs 10533cr. EBITDA may decline 11% yoy to Rs1183cr. Adjusted PAT may decline 17% to Rs 417cr.
JSW Steel Q4 preview: Better steel prices to fuel net profit
JSW Steel’s consolidated net profit may jump 90 percent in the fourth quarter, helped by betterrealisation and record quarterly steel production.
Company may report consolidated net profit of Rs 1,893 crore, from Rs 996 crore a year earlier.
Consolidated revenue is likely to increase from Rs 16,656 crore to Rs 19,556 crore in the fourthquarter ending March 31, 2018.
JSW Steel’s margins have been boosted by pick up in steel prices since November 2017.
On the other hand, raw material prices have corrected. While coking coal prices have reducedglobally, iron ore prices have also shown a similar trend.
Company will also benefit from record quarterly steel production. The steelmaker made 4.31million tons of steel in the fourth quarter, compared to 4.1 million tons a year earlier.

PRIVATE CLIENT GROUP [PCG]
“THE DAILY”
5
TVS Motor Q4 preview: Expect double digit growth in net profit on strong rural demand
A strong comeback in the rural market, coupled with new launches, will help TVS Motorcompany post strong double digit growth in net profit for the quarter ending March.
Company is expected to report rise of 58 percent in standalone net profit to Rs 201 crore for theMarch quarter as against Rs 127 crore reported in the same quarter in 2016-17.
Standalone revenue from operations in Q4FY18 is expected to be Rs 4,039 crore for the quarter,an increase of 31 percent compared to Rs 3,076 crore posted in the corresponding quarter in2016-17.
The company clocked total sales of 8.89 lakh units, growth of 32 percent during Q4FY18compared to 6.74 lakh units sold in Q4FY17. Out of this domestic two and three-wheeler salesgrew by 29 percent to 7.28 lakh units as against 5.64 lakh units.
The company launched three models during the quarter including one all-new product. NTorq125, an all-new scooter was launched by TVS in February. Besides it also launched the ApacheRTR 160 4V and the Apache RTR 200 4V.
The company is ramping up production of the Apache 310 RR which is having waiting period ofup to three months. The premium bike is presently available through limited channel ofdealerships.
Karnataka Bank Q4 profit dives 92% as NPA provisioning swells
Karnataka Bank reported 92% slump in net profit at Rs 11cr for the March quarter due to multi-fold jump in provisioning for bad assets.
During the same quarter of 2017, the bank had made net profit of Rs 138 crore.
Bank’s provisioning for bad loans and contingencies was hiked over three times to Rs 541 croreduring March quarter as against Rs 160 crore in the year-ago period.
Income during the quarter increased to Rs 1,737 crore as against Rs 1,606 crore earlier.
For the full fiscal 2017-18, the bank said its net profit fell to Rs 325 crore as against Rs 452crore. Income during the year was up at Rs 6,378 crore from Rs 5,995 crore. Otherwise, thebank had reported a net profit of Rs 452 crore for that financial year.
Provisioning amount for the full year more than doubled at Rs 1,163 crore against Rs 528 crorein the preceding year.
Asset-wise, gross non-performing assets (NPAs) rose to 4.9% of the gross advances by the endof March 2018 from 4.21% a year ago. In absolute value, gross NPAs were Rs 2,376 crore asagainst Rs 1,581 crore. Net NPAs also increased to 2.96% (Rs 1,400 crore) compared with 2.6%(Rs 975 crore).
Board has recommended dividend of Rs 3 per share for the year ended 31 March. The provisioncoverage ratio as at end-March 2018 stood at 54.56% (54% as on 31 March 2017).

PRIVATE CLIENT GROUP [PCG]
“THE DAILY”
6
Lupin posts net loss of Rs 783.5 crore in Q4 due to one-time write off
Lupin posted net loss of Rs 783.5 crore in the fourth quarter ended March due to one-timewrite-off on the Gavis acquisition. The company took a write-off of 1464.3 crore on Gavis.
Company reported net profit of Rs 384 crore in the year-ago quarter. Sales fell 2.8 percent toRs 4,179 crore.
Revenue for FY18 was at Rs 15598cr. US Formulations recorded 29% yoy dip. India businesssaw 11% yoy growth to Rs 4125cr. Asia and Europe revenues increased 14% and 11%respectively. Company now has 158 products in the US generics market.Total capex for the year stood at Rs 1047cr. R&D expenditure for the year was at Rs 1851cr(11.9% of sales).
Lupin acquired US based Gavis in July 2015 for USD 880 million to expand US portfolio,especially pain management drugs (controlled substances) and get manufacturing base in theUS.
Gavis was largest ever overseas acquisition by Indian drug maker but its contribution from ithas been below expectations so far. The pace of approvals has been slow and the US crackdownon use of opioids has worsened matter. Sales of the company have not even been close to theexpectation of the much-tampered target of USD 200 million in FY18.
PNB posts Rs 13,417 crore loss in Q4FY18
Punjab National Bank has reported net loss of Rs 13,417 crore for the fourth quarter endingMarch 2018.
The profit was dragged by a three-fold surge in provisions towards bad loans, which was takenupfront during the quarter.
Total hit to PNB on account of the NiravModi-scam is Rs 14,357 crore. This includesunauthorised letters of undertaking and domestic loan.
Due to high provisions, the capital adequacy ratio (CAR) dipped to 9.2 percent, below theminimum of 11.5 percent laid down by Basel-III norms.
Asset quality
In the fourth quarter, PNB's provisions close to trebled to Rs 16,202 crore, from Rs 5,753.3crore in March quarter 2017, due to the fraud, and a Reserve Bank of India circular.
Gross non-performing assets (NPAs) worsened substantially to 18.4 percent of total loans as onMarch-end 2018 as compared to 12.1 percent of total loans in December 2017 and 12.5 percentas on March-end 2017.
Net NPA ratio also deteriorated to 11.2 percent from 7.5 percent in the previous quarter and 7.8percent in the year-ago period.
In absolute terms, gross NPAs jumped significantly to Rs 86,620 crore, up from Rs 57,519 crorein the December quarter.

PRIVATE CLIENT GROUP [PCG]
“THE DAILY”
7
Net NPAs were at Rs 48,684 crore as on March end 2018, up from Rs 34,075 crore inDecember.
As on March 31, the bank had net non-performing loans totaling over Rs 48,000 crore on itsbooks, against a net worth of around Rs 41,000 crore.
For the full year ending March 2018, PNB’s net loss stood at Rs 12,130 crore as against a netprofit of Rs 1187 crore in FY17.
Britannia Industries Q4 net profit up 24.8% at Rs 263 crore, beats estimates
Britannia Industries' net profit rose 24.8% on year to Rs 263.2 crore for the quarter endedMarch 31, beating estimates. Revenue rose 13.1 percent at Rs 2,537.5 on the back of doubledigit volume growth.
Earnings before interest, tax, depreciation and amortisation (EBITDA) surged 29 percent year-on-year to Rs 397.1 crore.
The company's international business grew in double digits despite slow-down in geographieslike the Middle East and Africa. Board has recommended dividend of Rs 25 per share.
Growth in dairy business was subdued due to the company's focus on driving value addedproducts. On the commodity front, prices of key raw material have seen a marginal inflation inthe quarter under review.
The company's new greenfield factories at Guwahati and SEZ in Mundra have beencommercialized.
Additionally, the company is also setting up an integrated food park at Ranjangaon, inMaharashtra and a Greenfield plant in Nepal.
Crompton Greaves Consumer Q4 profit up 32% at Rs 103 cr
Crompton Greaves Consumer Electricals Ltd (CGCEL) reported 32.4 percent increase in profit toRs 103.2 crore for the fourth quarter ended March 31, 2018 riding on robust volume growth.The company had posted profit of Rs 77.9 crore in the same period of previous fiscal.
Revenue from operations during the quarter stood at Rs 1,126 crore. It was at Rs 1,076 crore inthe year ago quarter.
This growth has largely been driven by underlying volume growth.
CGCEL has stepped up focus on building its 'go to market', leveraging internal data systems,analytics and strong distributor partnerships. For the year 2017-18, profit was at Rs 323.8 croreas against Rs 283.1 crore in the previous year, up 14.3 percent.
Karnataka Assembly election results: House hung, over to Governor VajubhaiVala
The situation in Karnataka pits the claim of the single largest minority against a post-pollcombination equipped with a clear majority. Governor VajubhaiVala has the discretion to inviteany leader to form the government. But he must make a choice keeping in mind the leader’sability to prove his majority on the floor of the House, and to provide a stable government.
PRIVATE CLIENT GROUP [PCG]
“THE DAILY”
8
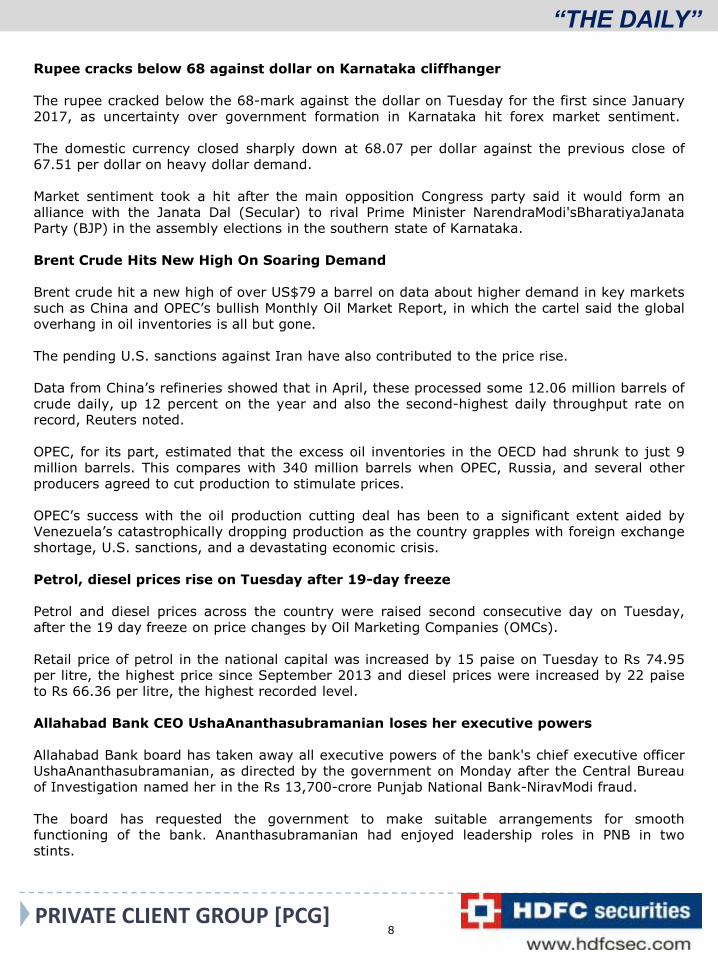
Rupee cracks below 68 against dollar on Karnataka cliffhanger
The rupee cracked below the 68-mark against the dollar on Tuesday for the first since January2017, as uncertainty over government formation in Karnataka hit forex market sentiment.
The domestic currency closed sharply down at 68.07 per dollar against the previous close of67.51 per dollar on heavy dollar demand.
Market sentiment took a hit after the main opposition Congress party said it would form analliance with the Janata Dal (Secular) to rival Prime Minister NarendraModi'sBharatiyaJanataParty (BJP) in the assembly elections in the southern state of Karnataka.
Brent Crude Hits New High On Soaring Demand
Brent crude hit a new high of over US$79 a barrel on data about higher demand in key marketssuch as China and OPEC’s bullish Monthly Oil Market Report, in which the cartel said the globaloverhang in oil inventories is all but gone.
The pending U.S. sanctions against Iran have also contributed to the price rise.
Data from China’s refineries showed that in April, these processed some 12.06 million barrels ofcrude daily, up 12 percent on the year and also the second-highest daily throughput rate onrecord, Reuters noted.
OPEC, for its part, estimated that the excess oil inventories in the OECD had shrunk to just 9million barrels. This compares with 340 million barrels when OPEC, Russia, and several otherproducers agreed to cut production to stimulate prices.
OPEC’s success with the oil production cutting deal has been to a significant extent aided byVenezuela’s catastrophically dropping production as the country grapples with foreign exchangeshortage, U.S. sanctions, and a devastating economic crisis.
Petrol, diesel prices rise on Tuesday after 19-day freeze
Petrol and diesel prices across the country were raised second consecutive day on Tuesday,after the 19 day freeze on price changes by Oil Marketing Companies (OMCs).
Retail price of petrol in the national capital was increased by 15 paise on Tuesday to Rs 74.95per litre, the highest price since September 2013 and diesel prices were increased by 22 paiseto Rs 66.36 per litre, the highest recorded level.
Allahabad Bank CEO UshaAnanthasubramanian loses her executive powers
Allahabad Bank board has taken away all executive powers of the bank's chief executive officerUshaAnanthasubramanian, as directed by the government on Monday after the Central Bureauof Investigation named her in the Rs 13,700-crore Punjab National Bank-NiravModi fraud.
The board has requested the government to make suitable arrangements for smoothfunctioning of the bank. Ananthasubramanian had enjoyed leadership roles in PNB in twostints.
PRIVATE CLIENT GROUP [PCG]
“THE DAILY”
9
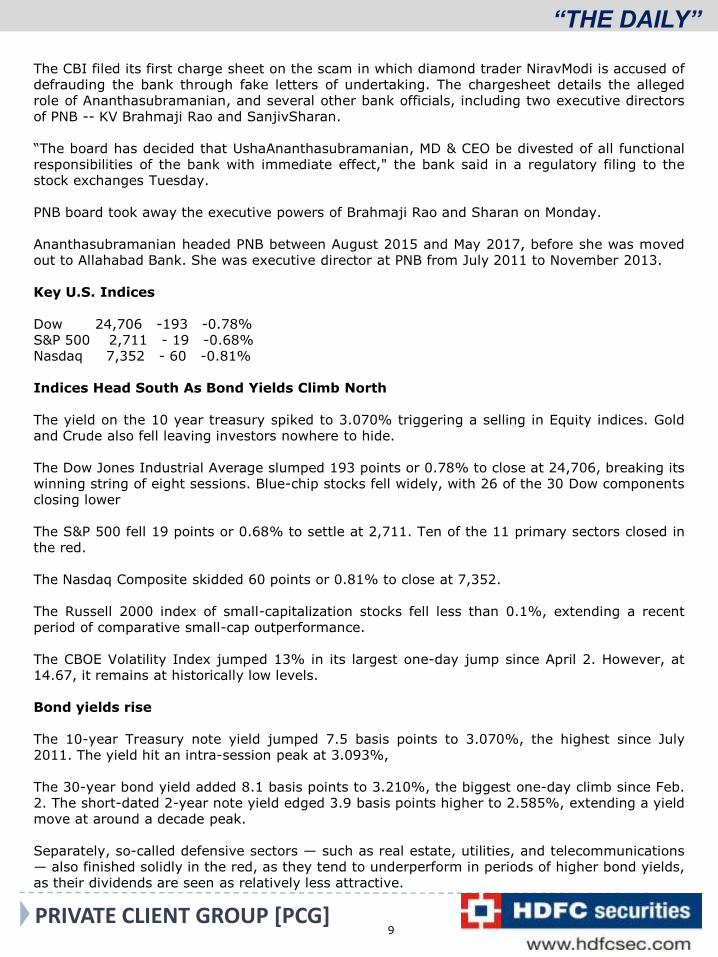
The CBI filed its first charge sheet on the scam in which diamond trader NiravModi is accused ofdefrauding the bank through fake letters of undertaking. The chargesheet details the allegedrole of Ananthasubramanian, and several other bank officials, including two executive directorsof PNB -- KV Brahmaji Rao and SanjivSharan.
“The board has decided that UshaAnanthasubramanian, MD & CEO be divested of all functionalresponsibilities of the bank with immediate effect," the bank said in a regulatory filing to thestock exchanges Tuesday.
PNB board took away the executive powers of Brahmaji Rao and Sharan on Monday.
Ananthasubramanian headed PNB between August 2015 and May 2017, before she was movedout to Allahabad Bank. She was executive director at PNB from July 2011 to November 2013.
Key U.S. Indices
Dow 24,706 -193 -0.78%S&P 500 2,711 - 19 -0.68%Nasdaq 7,352 - 60 -0.81%
Indices Head South As Bond Yields Climb North
The yield on the 10 year treasury spiked to 3.070% triggering a selling in Equity indices. Goldand Crude also fell leaving investors nowhere to hide.
The Dow Jones Industrial Average slumped 193 points or 0.78% to close at 24,706, breaking itswinning string of eight sessions. Blue-chip stocks fell widely, with 26 of the 30 Dow componentsclosing lower
The S&P 500 fell 19 points or 0.68% to settle at 2,711. Ten of the 11 primary sectors closed inthe red.
The Nasdaq Composite skidded 60 points or 0.81% to close at 7,352.
The Russell 2000 index of small-capitalization stocks fell less than 0.1%, extending a recentperiod of comparative small-cap outperformance.
The CBOE Volatility Index jumped 13% in its largest one-day jump since April 2. However, at14.67, it remains at historically low levels.
Bond yields rise
The 10-year Treasury note yield jumped 7.5 basis points to 3.070%, the highest since July2011. The yield hit an intra-session peak at 3.093%,
The 30-year bond yield added 8.1 basis points to 3.210%, the biggest one-day climb since Feb.2. The short-dated 2-year note yield edged 3.9 basis points higher to 2.585%, extending a yieldmove at around a decade peak.
Separately, so-called defensive sectors — such as real estate, utilities, and telecommunications— also finished solidly in the red, as they tend to underperform in periods of higher bond yields,as their dividends are seen as relatively less attractive.

PRIVATE CLIENT GROUP [PCG]
“THE DAILY”
10
Economic data
Forecasts for a second-quarter rebound in the U.S. economy became more of a reality onTuesday as Retail sales climbed 0.3 percent in April. March sales growth was revised upwards to0.8 percent.
Meanwhile, the Empire State manufacturing index rose in May, which also pointed to animproving economy.
While there are no signs of overheating, investors are concerned that the Federal Reserve maytry to slow down the economy by raising interest rates more aggressively.
Fed chatter
On the Federal Reserve front, Dallas Fed President Robert Kaplan said he wasn’t concerned withthe rise in the yield on the 10-year Treasury note, but is “very carefully watching the shape ofthe curve.”
San Francisco Fed President John Williams said he supports the Fed’s target of three or four rateincreases this year with further gradual increases over the next two years.
Also Tuesday, a Senate panel held a hearing on the nomination of Richard Clarida to becomethe Fed’s vice chairman and Michelle Bowman to become a member of the central bank’s boardof governors.
Clarida said that President Donald Trump gave him no reason to worry about the erosion of thepolitical independence of the central bank, adding he would ignore any political pressure onmonetary policy.
Other markets
Asian markets mostly closed lower while the European markets closed mixed.
Gold futures tumbled sharply, falling 2% as the ICE U.S. Dollar Index gained 0.7%, and oilfutures advanced 0.5% to $71.31 a barrel, helping energy stocks close in slightly positiveterritory.

PRIVATE CLIENT GROUP [PCG]
“THE DAILY”
11
DATA & EVENTS
OPEN TRADING CALLS
NOTE: ALL TRADING RECOMMENDATIONS GIVEN BY PCG TEAM ARE ON REAL TIMEBASIS. A TRADING RECOMMENDATION SHOULD BE CONSIDERED CLOSED ORSQUARED OFF AS AND WHEN A STOPLOSS OR TARGET IS TOUCHED IN INTRADAYTRADING. DO NOT WAIT FOR TARGET ACHIEVED OR STOPLOSS MESSAGE TO CLOSETHE POSITIONS. REFER JAMMOON FOR TIMELY ENTRY AND EXIT FROMRECOMMENDATIONS.
No. Reco Date Company Name Reco Cost SL Target
1 03-05-2018 RBLBANK BUY 524-512 505 555
2 11-05-2018 CAMLINFINE BUY 111.45-108 105 120
3 14-05-2018 EDELWEISS BUY 304.05-295 290 335.5
4 15-05-2018 YESBANK BUY 353.95-348 339 375
DATE COUNTRY EVENT PERIOD FORECAST PREVIOUS
16 05 2018 Japan GDP (QoQ%) 1Q P 0 0.4
16 05 2018 Japan GDP (YoY%) 1Q P 0.3 0.1
16 05 2018 Japan Industrial Production (MoM%) Mar F, 2018 N.A. 1.2
16 05 2018 Japan Industrial Production (YoY%) Mar F, 2018 N.A. 2.2
16 05 2018 EC CPI Core (YoY%) Apr F, 2018 0.7 0.7
16 05 2018 EC CPI (YoY%) Apr F, 2018 1.2 1.3
16 05 2018 EC CPI (MoM%) Apr, 2018 0.3 1
16 05 2018 US Industrial Production (MoM%) Apr, 2018 0.6 0.5
TODAY’S EVENTS
DATE COUNTRY EVENT PERIOD FORECAST PREVIOUS ACTUAL
15 05 2018 EC GDP (QoQ%) 1Q P 0.4 0.4 0.4
15 05 2018 EC GDP (YoY%) 1Q P 2.5 2.5 2.5
15 05 2018 India Exports (YoY%) Apr, 2018 N.A. -0.7 5.17
15 05 2018 India Imports (YoY%) Apr, 2018 N.A. 7.2 4.6
YESTERDAY’S EVENTS

PRIVATE CLIENT GROUP [PCG]
“THE DAILY”
12
DATA & EVENTS
BULK DEALS*
Date Script Name Fund NameBuy/Sell
Quantity Value
(Rs.Cr.)
NSE
15/05/18Kale Consultants Limited
SBI MUTUAL FUND BUY 239533 30.9
15/05/18Kale Consultants Limited
SBI MUTUAL FUND SELL 239427 30.9
15/05/18 BEML LimitedALPHAGREP COMMODITIES PRIVATE LIMITED
BUY 277215 30.9
15/05/18 BEML LimitedALPHAGREP COMMODITIES PRIVATE LIMITED
SELL 277215 31.0
15/05/18 BEML Limited CROSSLAND TRADING CO BUY 434002 48.3
15/05/18 BEML Limited CROSSLAND TRADING CO SELL 434002 48.4
15/05/18 BEML LimitedWAY2WEALTH SECURITIES P LTD
BUY 323441 36.0
15/05/18 BEML LimitedWAY2WEALTH SECURITIES P LTD
SELL 323441 36.0
15/05/18Dr. Lal Path Labs Ltd.
SANJEEVINI INVESTMENT HOLDINGS
SELL 422494 35.5
15/05/18 PC Jeweller LtdSHAASTRA SECURITIES TRADING PRIVATE LIMITED
BUY 3710554 62.6
15/05/18 PC Jeweller LtdSHAASTRA SECURITIES TRADING PRIVATE LIMITED
SELL 3710554 62.7
15/05/18Precision Camshafts Ltd.
SBI MUTUAL FUND BUY 3699999 37.0
15/05/18Precision Camshafts Ltd.
SBI MUTUAL FUND SELL 3699999 37.0
BSE
15/05/18 GOODYEAR SBI MUTUAL FUND SELL 1040000 125.7
15/05/18 GOODYEAR SBI MUTUAL FUND BUY 1033780 124.9
* Bulk deals of only more than Rs.25 Cr are taken into consideration
PRIVATE CLIENT GROUP [PCG]
“THE DAILY”
13
DATA & EVENTS
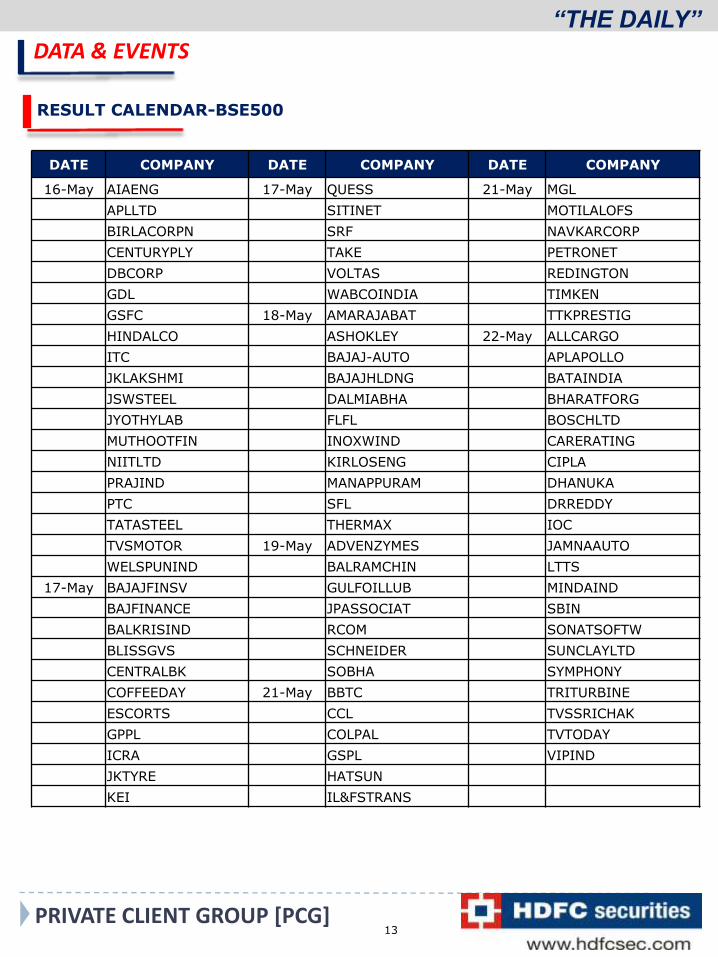
RESULT CALENDAR-BSE500
DATE COMPANY DATE COMPANY DATE COMPANY
16-May AIAENG 17-May QUESS 21-May MGL
APLLTD SITINET MOTILALOFS
BIRLACORPN SRF NAVKARCORP
CENTURYPLY TAKE PETRONET
DBCORP VOLTAS REDINGTON
GDL WABCOINDIA TIMKEN
GSFC 18-May AMARAJABAT TTKPRESTIG
HINDALCO ASHOKLEY 22-May ALLCARGO
ITC BAJAJ-AUTO APLAPOLLO
JKLAKSHMI BAJAJHLDNG BATAINDIA
JSWSTEEL DALMIABHA BHARATFORG
JYOTHYLAB FLFL BOSCHLTD
MUTHOOTFIN INOXWIND CARERATING
NIITLTD KIRLOSENG CIPLA
PRAJIND MANAPPURAM DHANUKA
PTC SFL DRREDDY
TATASTEEL THERMAX IOC
TVSMOTOR 19-May ADVENZYMES JAMNAAUTO
WELSPUNIND BALRAMCHIN LTTS
17-May BAJAJFINSV GULFOILLUB MINDAIND
BAJFINANCE JPASSOCIAT SBIN
BALKRISIND RCOM SONATSOFTW
BLISSGVS SCHNEIDER SUNCLAYLTD
CENTRALBK SOBHA SYMPHONY
COFFEEDAY 21-May BBTC TRITURBINE
ESCORTS CCL TVSSRICHAK
GPPL COLPAL TVTODAY
ICRA GSPL VIPIND
JKTYRE HATSUN
KEI IL&FSTRANS
PRIVATE CLIENT GROUP [PCG]
“THE DAILY”
14
DATA & EVENTS
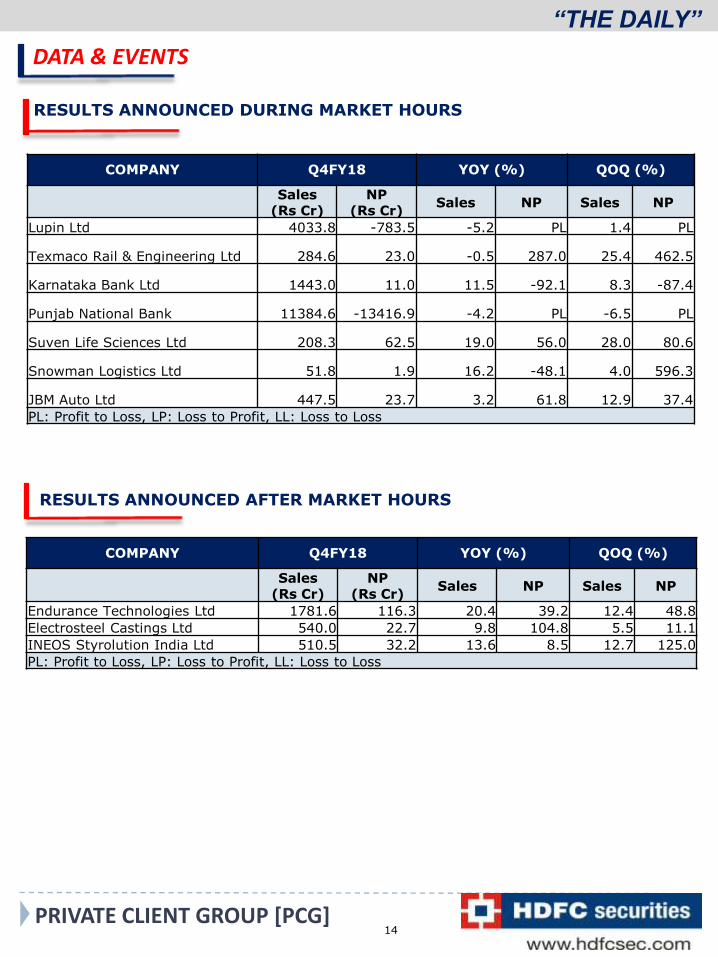
RESULTS ANNOUNCED DURING MARKET HOURS
COMPANY Q4FY18 YOY (%) QOQ (%)
Sales (Rs Cr)
NP (Rs Cr)
Sales NP Sales NP
Lupin Ltd 4033.8 -783.5 -5.2 PL 1.4 PL
Texmaco Rail & Engineering Ltd 284.6 23.0 -0.5 287.0 25.4 462.5
Karnataka Bank Ltd 1443.0 11.0 11.5 -92.1 8.3 -87.4
Punjab National Bank 11384.6 -13416.9 -4.2 PL -6.5 PL
Suven Life Sciences Ltd 208.3 62.5 19.0 56.0 28.0 80.6
Snowman Logistics Ltd 51.8 1.9 16.2 -48.1 4.0 596.3
JBM Auto Ltd 447.5 23.7 3.2 61.8 12.9 37.4
PL: Profit to Loss, LP: Loss to Profit, LL: Loss to Loss
COMPANY Q4FY18 YOY (%) QOQ (%)
Sales (Rs Cr)
NP (Rs Cr)
Sales NP Sales NP
Endurance Technologies Ltd 1781.6 116.3 20.4 39.2 12.4 48.8
Electrosteel Castings Ltd 540.0 22.7 9.8 104.8 5.5 11.1
INEOS Styrolution India Ltd 510.5 32.2 13.6 8.5 12.7 125.0
PL: Profit to Loss, LP: Loss to Profit, LL: Loss to Loss
RESULTS ANNOUNCED AFTER MARKET HOURS
PRIVATE CLIENT GROUP [PCG]
“THE DAILY”
15
SUPPORT - RESISTANCE
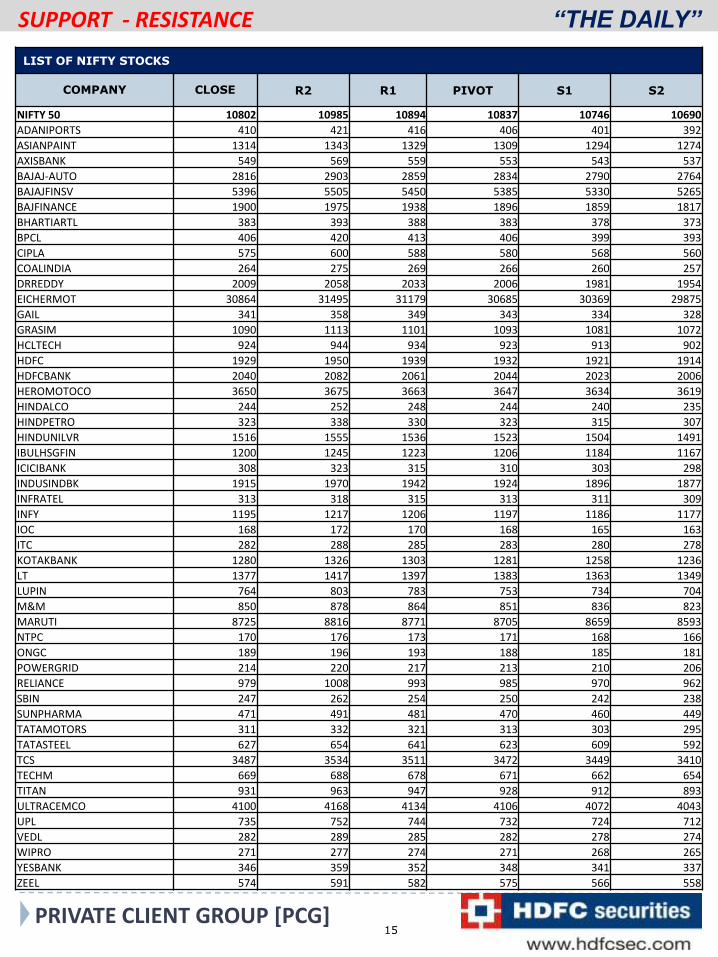
LIST OF NIFTY STOCKS
COMPANY CLOSE R2 R1 PIVOT S1 S2
NIFTY 50 10802 10985 10894 10837 10746 10690
ADANIPORTS 410 421 416 406 401 392
ASIANPAINT 1314 1343 1329 1309 1294 1274
AXISBANK 549 569 559 553 543 537
BAJAJ-AUTO 2816 2903 2859 2834 2790 2764
BAJAJFINSV 5396 5505 5450 5385 5330 5265
BAJFINANCE 1900 1975 1938 1896 1859 1817
BHARTIARTL 383 393 388 383 378 373
BPCL 406 420 413 406 399 393
CIPLA 575 600 588 580 568 560
COALINDIA 264 275 269 266 260 257
DRREDDY 2009 2058 2033 2006 1981 1954
EICHERMOT 30864 31495 31179 30685 30369 29875
GAIL 341 358 349 343 334 328
GRASIM 1090 1113 1101 1093 1081 1072
HCLTECH 924 944 934 923 913 902
HDFC 1929 1950 1939 1932 1921 1914
HDFCBANK 2040 2082 2061 2044 2023 2006
HEROMOTOCO 3650 3675 3663 3647 3634 3619
HINDALCO 244 252 248 244 240 235
HINDPETRO 323 338 330 323 315 307
HINDUNILVR 1516 1555 1536 1523 1504 1491
IBULHSGFIN 1200 1245 1223 1206 1184 1167
ICICIBANK 308 323 315 310 303 298
INDUSINDBK 1915 1970 1942 1924 1896 1877
INFRATEL 313 318 315 313 311 309
INFY 1195 1217 1206 1197 1186 1177
IOC 168 172 170 168 165 163
ITC 282 288 285 283 280 278
KOTAKBANK 1280 1326 1303 1281 1258 1236
LT 1377 1417 1397 1383 1363 1349
LUPIN 764 803 783 753 734 704
M&M 850 878 864 851 836 823
MARUTI 8725 8816 8771 8705 8659 8593
NTPC 170 176 173 171 168 166
ONGC 189 196 193 188 185 181
POWERGRID 214 220 217 213 210 206
RELIANCE 979 1008 993 985 970 962
SBIN 247 262 254 250 242 238
SUNPHARMA 471 491 481 470 460 449
TATAMOTORS 311 332 321 313 303 295
TATASTEEL 627 654 641 623 609 592
TCS 3487 3534 3511 3472 3449 3410
TECHM 669 688 678 671 662 654
TITAN 931 963 947 928 912 893
ULTRACEMCO 4100 4168 4134 4106 4072 4043
UPL 735 752 744 732 724 712
VEDL 282 289 285 282 278 274
WIPRO 271 277 274 271 268 265
YESBANK 346 359 352 348 341 337
ZEEL 574 591 582 575 566 558

PRIVATE CLIENT GROUP [PCG]
“THE DAILY”
16
Disclaimer:
This report has been prepared by HDFC Securities Ltd and is meant for sole use by the recipient and not for circulation. The information and opinions contained herein have been compiled or arrived at, based upon information obtained in good faith from sources believed to be reliable. Such information has not been independently verified and no guaranty, representation of warranty, express or implied, is made as to its accuracy, completeness or correctness. All such information and opinions are subject to change without notice. This document is for information purposes only. Descriptions of any company or companies or their securities mentioned herein are not intended to be complete and this document is not, and should not be construed as an offer or solicitation of an offer, to buy or sell any securities or other financial instruments. This report is not directed to, or intended for display, downloading, printing, reproducing or for distribution to or use by, any person or entity who is a citizen or resident or located in any locality, state, country or other jurisdiction where such distribution, publication, reproduction, availability or use would be contrary to law or regulation or what would subject HSL or its affiliates to any registration or licensing requirement within such jurisdiction. If this report is inadvertently send or has reached any individual in such country, especially, USA, the same may be ignored and brought to the attention of the sender. This document may not be reproduced, distributed or published for any purposes without prior written approval of HSL. Foreign currencies denominated securities, wherever mentioned, are subject to exchange rate fluctuations, which could have an adverse effect on their value or price, or the income derived from them. In addition, investors in securities such as ADRs, the values of which are influenced by foreign currencies effectively assume currency risk. It should not be considered to be taken as an offer to sell or a solicitation to buy any security. HSL may from time to time solicit from, or perform broking, or other services for, any company mentioned in this mail and/or its attachments.HSL and its affiliated company(ies), their directors and employees may; (a) from time to time, have a long or short position in, and buy or sell the securities of the company(ies) mentioned herein or (b) be engaged in any other transaction involving such securities and earn brokerage or other compensation or act as a market maker in the financial instruments of the company(ies) discussed herein or act as an advisor or lender/borrower to such company(ies) or may have any other potential conflict of interests with respect to any recommendation and other related information and opinions.HSL, its directors, analysts or employees do not take any responsibility, financial or otherwise, of the losses or the damages sustained due to the investments made or any action taken on basis of this report, including but not restricted to, fluctuation in the prices of shares and bonds, changes in the currency rates, diminution in the NAVs, reduction in the dividend or income, etc.HSL and other group companies, its directors, associates, employees may have various positions in any of the stocks, securities and financial instruments dealt in the report, or may make sell or purchase or other deals in these securities from time to time or may deal in other securities of the companies / organizations described in this report.
HSL or its associates might have managed or co-managed public offering of securities for the subject company or might have been mandated by the subject company for any other assignment in the past twelve months. HSL or its associates might have received any compensation from the companies mentioned in the report during the period preceding twelve months from t date of this report for services in respect of managing or co-managing public offerings, corporate finance, investment banking or merchant banking, brokerage services or other advisory service in a merger or specific transaction in the normal course of business.HSL or its analysts did not receive any compensation or other benefits from the companies mentioned in the report or third party in connection with preparation of the research report. Accordingly, neither HSL nor Research Analysts have any material conflict of interest at the time of publication of this report. Compensation of our Research Analysts is not based on any specific merchant banking, investment banking or brokerage service transactions. HSL may have issued other reports that are inconsistent with and reach different conclusion from the information presented in this report. Research entity has not been engaged in market making activity for the subject company. Research analyst has not served as an officer, director or employee of the subject company. We have not received any compensation/benefits from the subject company or third party in connection with the Research Report.
HDFC securities Limited, I Think Techno Campus, Building - B, "Alpha", Office Floor 8, Near Kanjurmarg Station, Opp. Crompton Greaves, Kanjurmarg (East), Mumbai 400 042 Phone: (022) 3075 3400 Fax: (022) 2496 5066Compliance Officer: Binkle R. Oza Email: [email protected] Phone: (022) 3045 3600
HDFC Securities Limited, SEBI Reg. No.: NSE-INB/F/E 231109431, BSE-INB/F 011109437, AMFI Reg. No. ARN: 13549, PFRDA Reg. No. POP: 04102015, IRDA Corporate Agent License No.: HDF 2806925/HDF C000222657, SEBI Research Analyst Reg. No.: INH000002475, CIN - U67120MH2000PLC152193
Mutual Funds Investments are subject to market risk. Please read the offer and scheme related documents carefully before investing.
"HDFC Securities Ltd. is a SEBI Registered Research Analyst having registration no. INH000002475."
PCG TEAM
Name DESIGNATION EMAIL ID
Mr. Vinod Sharma Head, PCG & Market Strategy [email protected]
Mr. Devarsh Vakil Head, Advisory [email protected]
Mr. Nandish Shah Derivative Analyst [email protected]
Mr. Vinay Rajani Technical Analyst [email protected]
Mr. Kushal Rughani Fundamental Analyst [email protected]
Ms. Kinnari Patel Junior Analyst [email protected]
Ms. Nisha Sankhala Junior Analyst [email protected]
Mr. Dilip Parmar Currency Analyst [email protected]