human resource capability - state services … 4 occupations in the hr customised occupation groups...
TRANSCRIPT

Human Resource Capability
— 2014 —
IN THE NEW ZEALAND STATE SERVICES
This work is licensed under the Creative Commons Attribution 3.0 New Zealand licence. In essence, you are free to copy, distribute and adapt the work, as long as you attribute the work to the State Services Commission and abide by the other licence terms. To view a copy of this licence, visit http://creativecommons.org/licenses/by/3.0/nz/. Please note that neither the State Services
Commission emblem nor the New Zealand Government logo may be used in any way which infringes any provision of the Flags, Emblems, and Names Protection Act 1981. Attribution to the State Services Commission should be in written form and not by reproduction of the State Services Commission emblem or New Zealand Government logo.
CROWN COPYRIGHT ©
ISBN 978-0-478-43430-9
Published by the State Services CommissionPO Box 329, Wellington, New Zealand December 2014
Human Resource Capability 1
Commissioner’s Foreword 2
A Public Service for the Future 3
Executive Summary 4
Introduction 6
Staff Numbers 8
Composition 11
People Costs 15
Leadership in the State Services 21
Capability and Diversity 24
Appendix 1 FTE employees by department 35
Appendix 2 Department diversity information 36
Appendix 3 Tenure, annual leave, and sick leave by department 37
Appendix 4 Occupations in the HR customised occupation groups 38
Appendix 5 Definitions 39
Contents
Human Resource Capability2
This Human Resource Capability (HRC) survey of Public Service departments provides insights into the Public Service workforce, contributes to workforce planning and gives information on changing workforce trends. It lets New Zealanders look ‘under the bonnet’ of the Public Service workforce that their taxes pay for, and enables agencies to
make informed decisions about their workforce to ensure the delivery of better public services.
New Zealand’s public institutions, their employees and the public services they deliver, exist for the benefit of New Zealanders. Our State services and its leaders have become increasingly focused on creating a government system that can meet the present and future needs of New Zealanders in a fast-changing and technological world.
Both New Zealanders and Ministers have told us they expect government services to be designed and delivered around the needs of people, and we cannot expect people to organise themselves around artificial boundaries between government agencies and their individual processes.
We have heard this call and we are transforming into a co-ordinated system that works as one and concentrates its efforts and resources on the areas where we can make the biggest difference and achieve real and measurable results that improve New Zealanders’ lives.
In 2012, the Government announced ten Results in challenging areas with stretch targets to be achieved over five years. The Results include reducing long-term welfare dependency, increasing participation in early childhood education and the proportion of 18 year olds with NCEA level 2, reducing crime and reoffending, providing businesses with an online shop for all government advice and support and reducing the rates of rheumatic fever.
The Public Service is making real and sustained progress towards achieving these Results. For some areas, more effort is needed, but other areas are well on track to be accomplished earlier than the initial target. The Results are deliberately challenging and require sustained team work between agencies and also with partners outside of central government. The progress that has been made has required transformational change in how agencies work.
The focus now is on consolidating progress and ensuring the Results approach, and the collaborative, co-ordinated team work it requires, becomes a deeply ingrained part of how the State services work.
Making sure the Public Service can continue to deliver results, both now and into the future requires skilled and experienced leaders who are comfortable working as a team and responding to the evolving needs and challenges of New Zealand society. The State Services Commission (SSC) is leading a programme to develop a deep and broad pool of leaders for the future of the State services. These leaders will be skilled in working across agency boundaries and working together to develop smart solutions to difficult problems that will deliver results.
Achieving future success also requires effective strategic planning now. SSC and the Treasury are working closely with Public Service agencies to develop high quality Four-year Plans that set out how each agency is going to achieve the results it is responsible for, work across their sector and operate within tight financial limits. The most valuable resource an agency has is the skills, expertise and commitment of the public servants who work for it. Workforce planning to make sure they have the right mix of skills in the right places over the long term is an essential part of long term success.
Iain Rennie State Services Commissioner
Commissioner’s Foreword
Human Resource Capability 3
The vision of trusted, engaged and high performing State services that improve the lives of New Zealanders can only be realised if we have the right numbers and mix of capable people who can be deployed when and where they are most needed. With greater collaboration across agencies, the knowledge and skills of State servants will
increasingly become a system-wide resource as well as an agency resource.
The New Zealand Public Service has a strong tradition of professionalism and expertise. In a fast changing world, we will need to use that strong foundation to build new and different capabilities. To deliver more agile public services we will need stronger capabilities in building relationships and working with our customers and partners. Our workforce will be much more diverse to better reflect and respond to the changing face of New Zealand communities. We will also need skills for the digital age including harnessing large-scale data and information sources.
The State Services Commission is working with Public Service agencies in our stewardship role to ensure that the system has the knowledge and skills needed now and for the future.
Identifying and growing leaders is a critical ingredient of successful change. We already have a system-wide programme in place to develop our current and future leaders. Over the next four years we will build a robust leadership pipeline. Our goal is to develop talented leaders at all levels of the Public Service and to ensure that leaders can be deployed to where they are most needed. Providing opportunities for talented people who are early in their careers to develop leadership capability is an important part of this picture.
We are also prioritising effective workforce strategy and planning to ensure the Public Service is able to respond to the needs of all New Zealanders.
Four-year Plans are a central tool, enabling agencies to align their people capability requirements to business intentions. Four-year Plans, based on sound workforce analysis and accurate information, provide a platform for identifying and responding to capability gaps and pressures system-wide. We will continue to support agencies as they actively build an effective workforce in a dynamic and challenging environment. A recent cross-agency initiative to develop an environment scan as a resource for all agencies highlights the value that can be achieved by working collectively to improve workforce planning.
Human resource professionals have a lead role as experts and business partners in a sector where people are critical to success. Over the next two years and beyond we will be working with HR leaders to build the capability and resilience of people functions system-wide.
Importantly the Human Resource Capability survey is a product of the collective effort of all Public Service agencies. As such, it models the value of information and shared endeavours to provide a resource that supports agency and system-wide work towards more evidence-based people strategies.
Andrew Hampton Government Chief Talent Officer
A Public Service for the Future

Human Resource Capability4
This report provides information about trends in the State services workforce with a focus on the Public Service. The report is produced annually and looks at both annual and historical changes, as well as highlighting areas of focus for the State Services Commission (SSC). In the year to 30 June 2014:
Executive Summary
Public Service staff numbers have increased
The number of full-time equivalent (FTE) employees has increased from 44,500 in 2013 to 45,280 (+1.8%). The number of FTE staff in Core Government Administration (refer to page 6) has remained below the cap, at 35,656. The Wellington region, being the main central administration, had the largest proportion of this Public Service workforce with 41.4%. This was followed by Auckland (20.0%), Canterbury (9.6%) and Waikato (8.4%). These four regions accounted for 79% of the Public Service workforce.
The average salary of Public Service employees has increased by 2.5%
The HRC survey has measured the movement in average salary for the Public Service as 2.5% (2.1% in 2013). This movement is not a direct reflection of the salary increases staff receive, it is affected by both compositional changes in the workforce, and progression within the scale and promotion increases.
In the year to June 2014, the Labour Cost Index (LCI) measured an increase in wages and salaries of 1.2% for the public sector. Within the public sector, the Public Service moved by 1.1%, the education sector by 1.2% and the health sector by 0.7%. In comparison, the private sector increased by 1.8%. The LCI controls for a constant quality and quantity of labour.
Redundancies are decreasing
In the year to 30 June 2014, 440 employees in the Public Service were made redundant (down from 696 in 2013). Redundancy payments totalled $25 million. This compares to $33 million last year and $38 million four years ago.
45,280 FTE employees
Wages and salaries
Redundancy payments totalled
$25 million
Human Resource Capability 5
There has been an increase in diversity in Senior Leadership over the last four years.
There has been an increase in the proportion of Māori senior leaders, from 8.3% in 2010 to 12.0% in 2014. Māori are still under-represented in senior leadership, compared to their representation in the Public Service workforce (16.6%). The proportion of Asian senior leaders has increased over the last four years (from 1.7% to 2.4%). There has been little increase in Pacific senior leaders over the last four years. 42% of senior leadership roles are filled by women.
The gender pay gap is a complex issue, with many factors at play
In 2014, the unadjusted gender pay gap is about the same as last year, at 14.1%. This report looks at controlling for factors such as occupation, seniority and age, and presents an adjusted pay gap of 5.3%.
Other HR measures are similar to last year
Core unplanned turnover remains stable at 10.7% in 2014. The average length of service for employees in the Public Service has stayed the same at 9.2 years. The amount of sick leave and domestic leave taken by Public Service employees decreased slightly to an average of 7.7 days per employee (from 7.9 days in 2013).
Proportion of Māori senior
leaders
14.1% unadjusted
gender pay gap
7.7 days average sick and domestic
leave taken
Human Resource Capability6
Information in this report comes primarily from the HRC survey, which collects payroll data on staff in all 29 Public Service departments. The survey has been conducted annually since the year 2000. The SSC has a statutory role of employing Public Service chief executives and reviewing their performance. The HRC survey provides insights into performance from a Human Resource Information System (HRIS) perspective.
This report provides information about characteristics and trends within the State services, and provides an extra level of analysis of the Public Service. Five main topic areas are covered:• staff numbers • composition• people costs• leadership• capability and diversity.
The survey data is a resource for agencies to use in benchmarking themselves with other agencies, sectors and the Public Service as a whole. HRC information also feeds into university research, parliamentary questions, international benchmarks on government performance, policy advice and is an example of the Public Service’s commitment to open government.
Technical aspects of the survey
The survey collects employee and organisational level information from departments. The survey covers permanent and fixed term staff. The database of information is managed by the Strategic Information team within the State Services Commission, who have information on Public Service employment dating back to 1913. Information on the survey structure, definitions, and contact details are available on the SSC website: http://www.ssc.govt.nz/hrc-survey-materials.
HRC reporting and capping reporting
This report complements the capping of Core Government Administration update which reports on the total number of positions (FTE staff numbers plus vacancy numbers) in the Core Government Administration group, and the number of communication staff in each department. For the full capping report, see http://www.ssc.govt.nz/capping-june14.
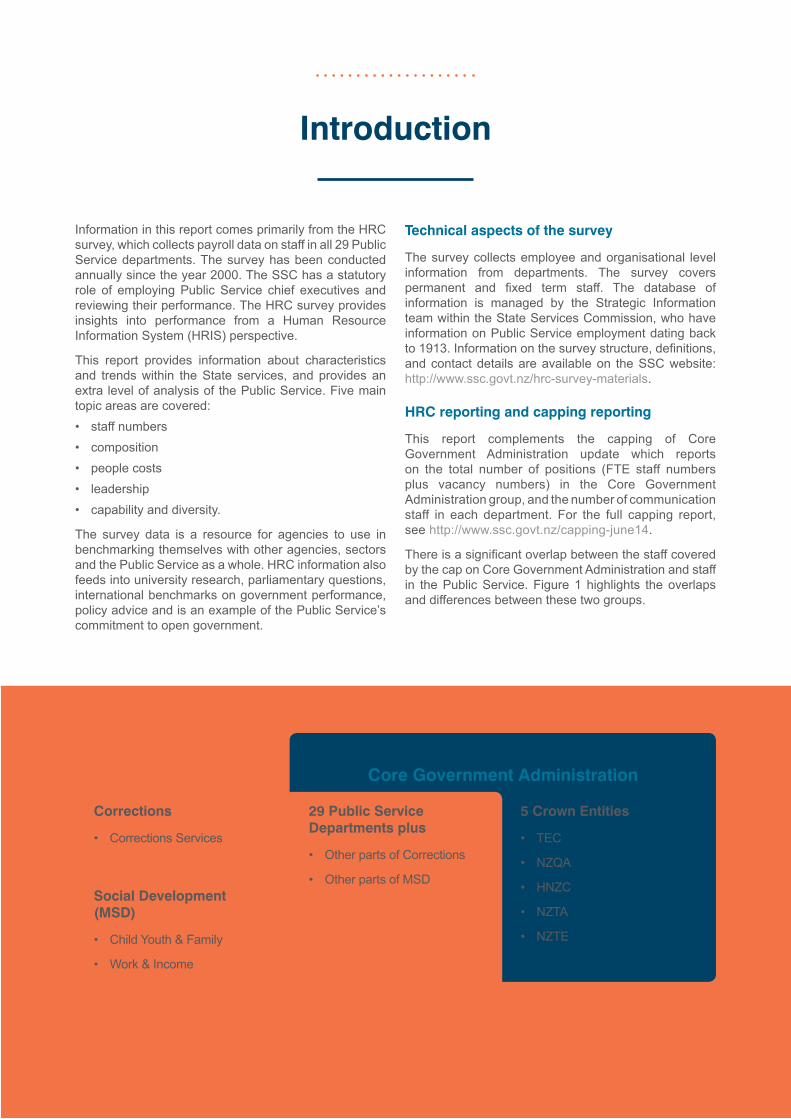
There is a significant overlap between the staff covered by the cap on Core Government Administration and staff in the Public Service. Figure 1 highlights the overlaps and differences between these two groups.
Introduction
Figure 1 Core Government Administration and the Public Service
Capping Report
HRC ReportPublic Service
Corrections
• Corrections Services
Social Development (MSD)
• Child Youth & Family
• Work & Income
29 Public Service Departments plus
• Other parts of Corrections
• Other parts of MSD
5 Crown Entities
• TEC
• NZQA
• HNZC
• NZTA
• NZTE
Core Government Administration
Human Resource Capability 7
Public Service
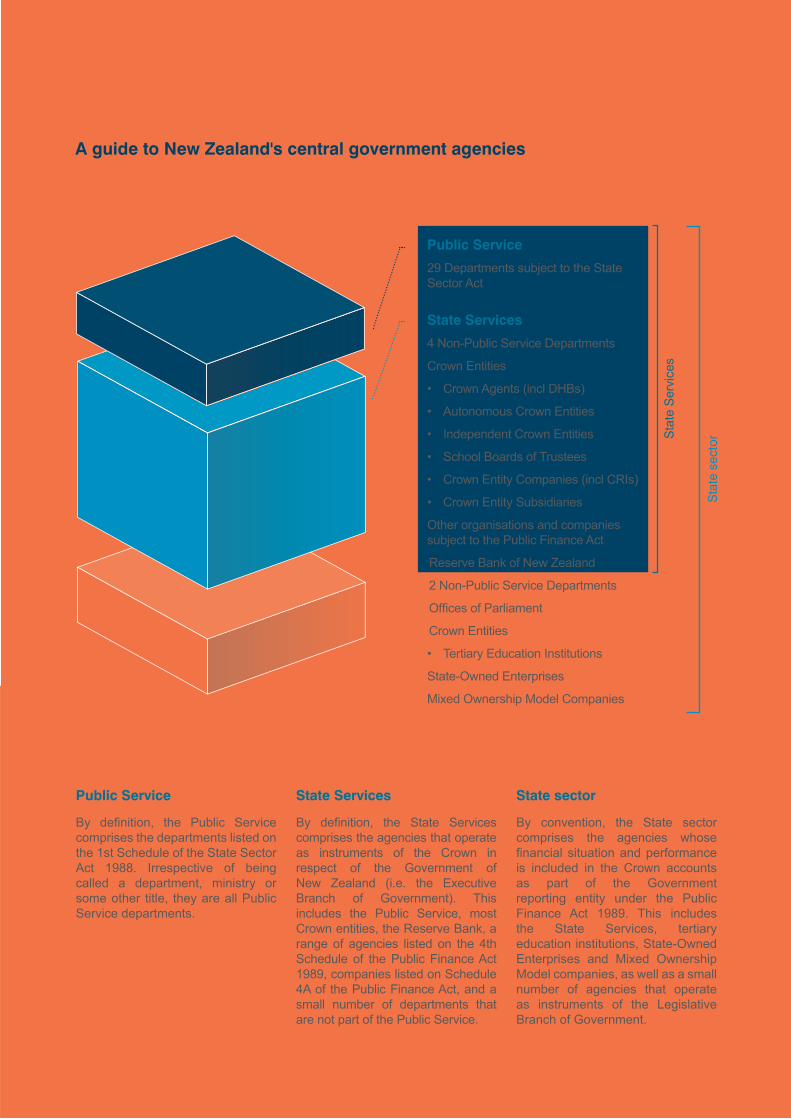
By definition, the Public Service comprises the departments listed on the 1st Schedule of the State Sector Act 1988. Irrespective of being called a department, ministry or some other title, they are all Public Service departments.
State sector
By convention, the State sector comprises the agencies whose financial situation and performance is included in the Crown accounts as part of the Government reporting entity under the Public Finance Act 1989. This includes the State Services, tertiary education institutions, State-Owned Enterprises and Mixed Ownership Model companies, as well as a small number of agencies that operate as instruments of the Legislative Branch of Government.
State Services
By definition, the State Services comprises the agencies that operate as instruments of the Crown in respect of the Government of New Zealand (i.e. the Executive Branch of Government). This includes the Public Service, most Crown entities, the Reserve Bank, a range of agencies listed on the 4th Schedule of the Public Finance Act 1989, companies listed on Schedule 4A of the Public Finance Act, and a small number of departments that are not part of the Public Service.
Public Service
29 Departments subject to the State Sector Act
State Services
4 Non-Public Service Departments
Crown Entities
• Crown Agents (incl DHBs)
• Autonomous Crown Entities
• Independent Crown Entities
• School Boards of Trustees
• Crown Entity Companies (incl CRIs)
• Crown Entity Subsidiaries
Other organisations and companies subject to the Public Finance Act
Reserve Bank of New Zealand
2 Non-Public Service Departments
Offices of Parliament
Crown Entities
• Tertiary Education Institutions
State-Owned Enterprises
Mixed Ownership Model Companies
Sta
te S
ervi
ces
Sta
te s
ecto
r
A guide to New Zealand's central government agencies
Human Resource Capability8
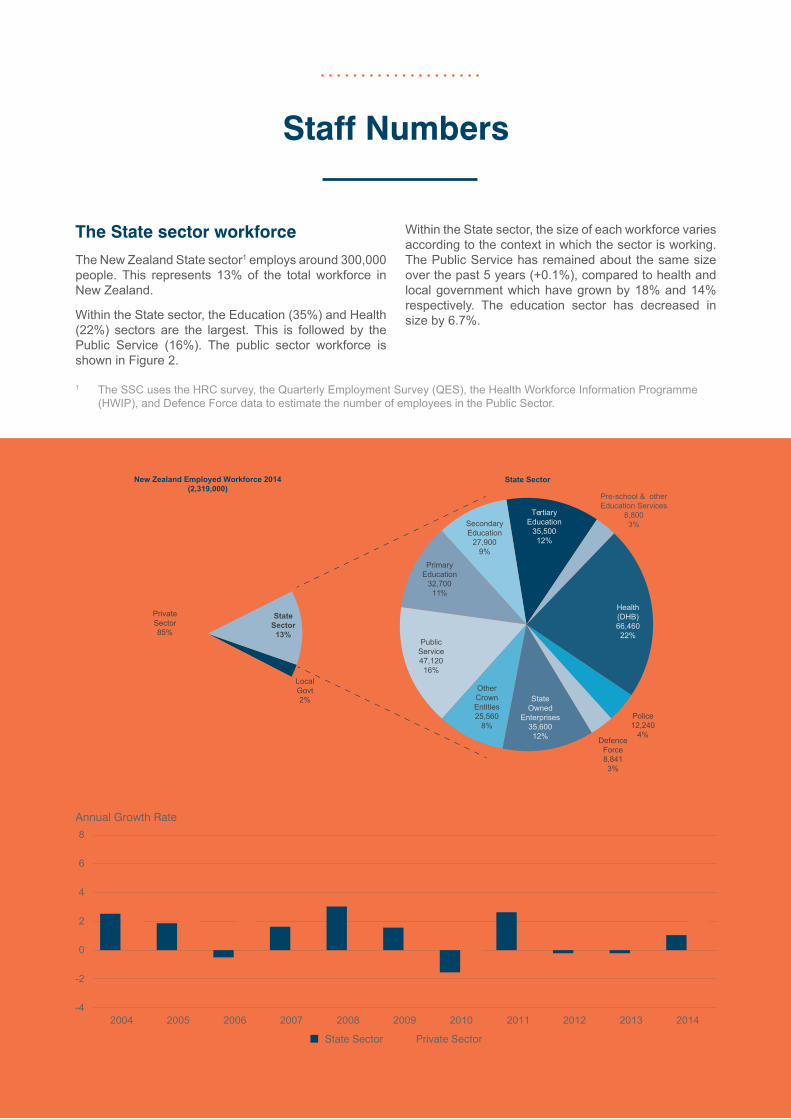
Figure 2 The public sector workforce (headcount), June 2014
Private Sector85%
State Sector13%
Local Govt
2%
New Zealand Employed Workforce 2014(2,319,000)
State Sector
SecondaryEducation
27,9009%
TertiaryEducation
35,50012%
Pre-school & other Education Services
8,8003%
Health(DHB)66,46022%
Police12,240
4%Defence
Force8,8413%
State Owned
Enterprises 35,600
12%
Public Service47,12016%
PrimaryEducation
32,70011%
Other Crown
Entities 25,560
8%
The State sector workforce
The New Zealand State sector1 employs around 300,000 people. This represents 13% of the total workforce in New Zealand.
Within the State sector, the Education (35%) and Health (22%) sectors are the largest. This is followed by the Public Service (16%). The public sector workforce is shown in Figure 2.
Within the State sector, the size of each workforce varies according to the context in which the sector is working. The Public Service has remained about the same size over the past 5 years (+0.1%), compared to health and local government which have grown by 18% and 14% respectively. The education sector has decreased in size by 6.7%.
Staff Numbers
1 The SSC uses the HRC survey, the Quarterly Employment Survey (QES), the Health Workforce Information Programme (HWIP), and Defence Force data to estimate the number of employees in the Public Sector.
Figure 3 Workforce growth in State and private sectors, 2004-2014
Annual Growth Rate
¢ State Sector ¢ Private Sector
-4
-2
0
2
4
6
8
20142013201220112010200920082007200620052004
Human Resource Capability 9
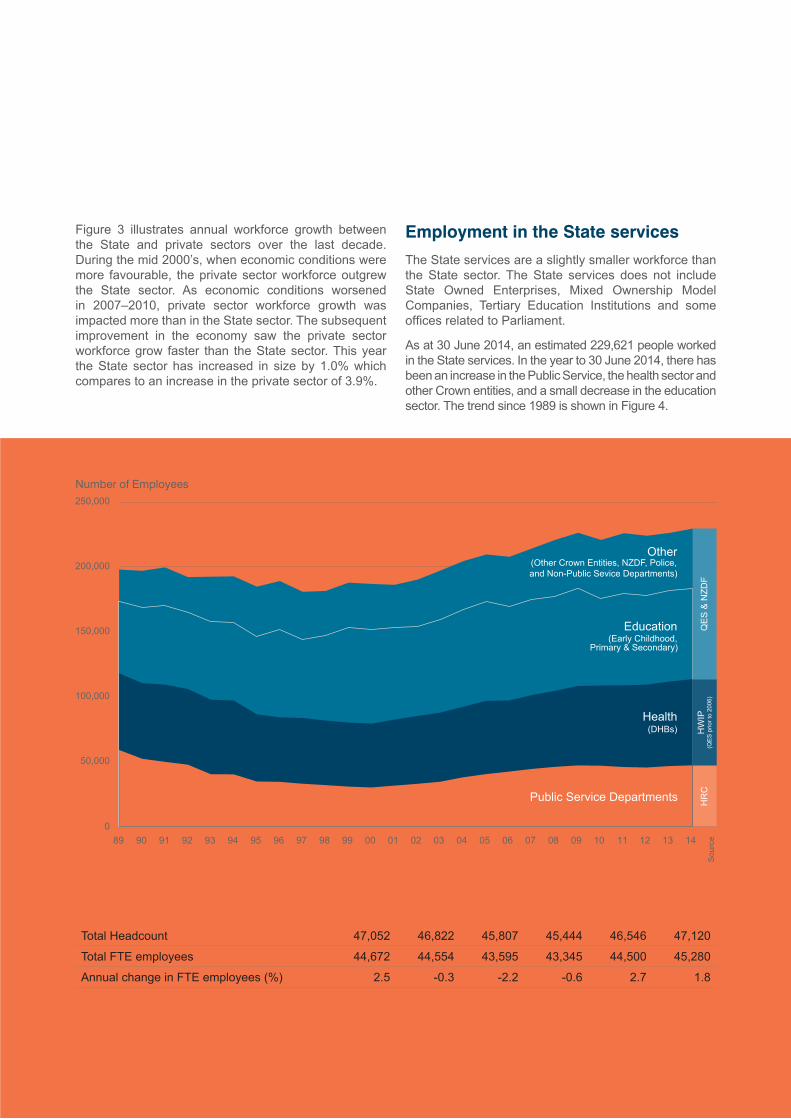
Figure 3 illustrates annual workforce growth between the State and private sectors over the last decade. During the mid 2000’s, when economic conditions were more favourable, the private sector workforce outgrew the State sector. As economic conditions worsened in 2007–2010, private sector workforce growth was impacted more than in the State sector. The subsequent improvement in the economy saw the private sector workforce grow faster than the State sector. This year the State sector has increased in size by 1.0% which compares to an increase in the private sector of 3.9%.
Employment in the State services
The State services are a slightly smaller workforce than the State sector. The State services does not include State Owned Enterprises, Mixed Ownership Model Companies, Tertiary Education Institutions and some offices related to Parliament.
As at 30 June 2014, an estimated 229,621 people worked in the State services. In the year to 30 June 2014, there has been an increase in the Public Service, the health sector and other Crown entities, and a small decrease in the education sector. The trend since 1989 is shown in Figure 4.
Figure 4 Estimated State services headcounts, 30 June 1989-2014
Number of Employees
0
50,000
100,000
Other(Other Crown Entities, NZDF, Police,and Non-Public Sevice Departments)
HR
CH
WIP
(QES
prio
r to
2006
)Q
ES
& N
ZDF
(Early Childhood,Primary & Secondary)
Education
(DHBs)Health
Public Service Departments
150,000
200,000
250,000
Sou
rce1413121110090807060504030201009998979695949392919089
Table 1 Public Service staff numbers, 30 June 2009-2014
2009 2010 2011 2012 2013 2014
Total Headcount 47,052 46,822 45,807 45,444 46,546 47,120
Total FTE employees 44,672 44,554 43,595 43,345 44,500 45,280
Annual change in FTE employees (%) 2.5 -0.3 -2.2 -0.6 2.7 1.8
Human Resource Capability10
Staff numbers in the Public Service
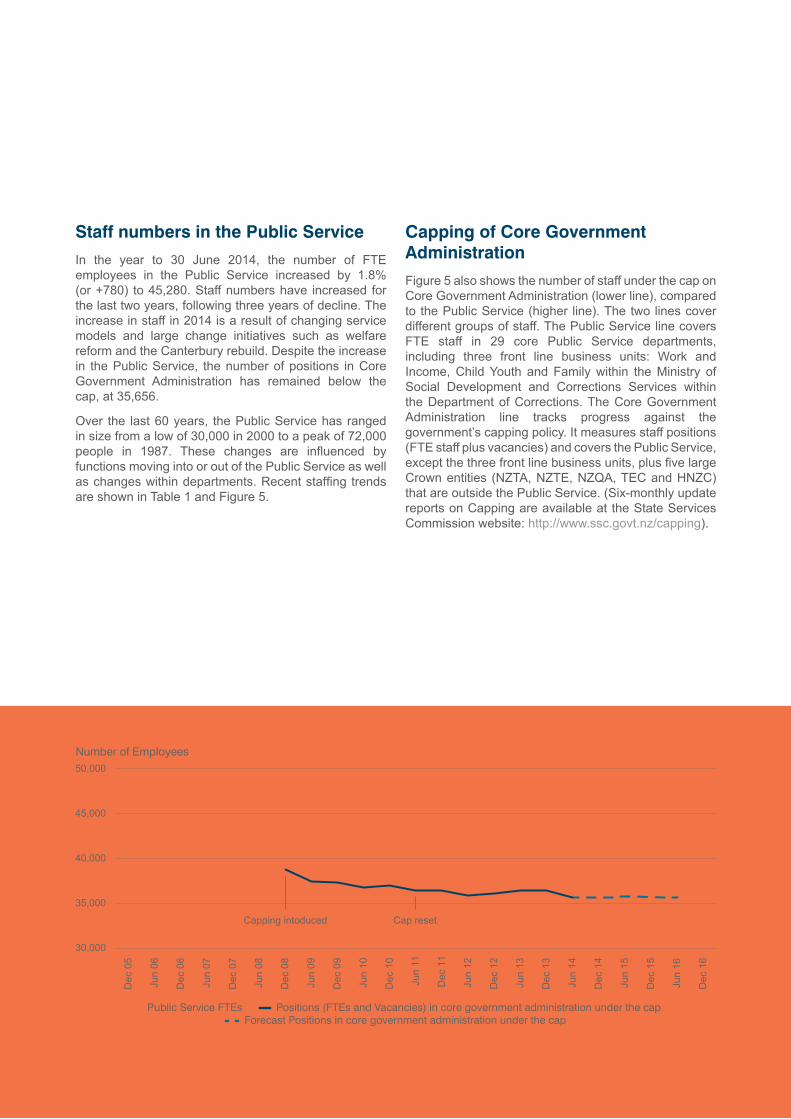
In the year to 30 June 2014, the number of FTE employees in the Public Service increased by 1.8% (or +780) to 45,280. Staff numbers have increased for the last two years, following three years of decline. The increase in staff in 2014 is a result of changing service models and large change initiatives such as welfare reform and the Canterbury rebuild. Despite the increase in the Public Service, the number of positions in Core Government Administration has remained below the cap, at 35,656.
Over the last 60 years, the Public Service has ranged in size from a low of 30,000 in 2000 to a peak of 72,000 people in 1987. These changes are influenced by functions moving into or out of the Public Service as well as changes within departments. Recent staffing trends are shown in Table 1 and Figure 5.
Capping of Core Government Administration
Figure 5 also shows the number of staff under the cap on Core Government Administration (lower line), compared to the Public Service (higher line). The two lines cover different groups of staff. The Public Service line covers FTE staff in 29 core Public Service departments, including three front line business units: Work and Income, Child Youth and Family within the Ministry of Social Development and Corrections Services within the Department of Corrections. The Core Government Administration line tracks progress against the government’s capping policy. It measures staff positions (FTE staff plus vacancies) and covers the Public Service, except the three front line business units, plus five large Crown entities (NZTA, NZTE, NZQA, TEC and HNZC) that are outside the Public Service. (Six-monthly update reports on Capping are available at the State Services Commission website: http://www.ssc.govt.nz/capping).
Figure 5 Staff numbers in the Public Service
Number of Employees
— Public Service FTEs — Positions (FTEs and Vacancies) in core government administration under the cap - - Forecast Positions in core government administration under the cap
30,000
35,000
40,000
45,000
50,000
Dec
16
Jun
16
Dec
15
Jun
15
Dec
14
Jun
14
Dec
13
Jun
13
Dec
12
Jun
12
Dec
11
Jun
11
Dec
10
Jun
10
Dec
09
Jun
09
Dec
08
Jun
08
Dec
07
Jun
07
Dec
06
Jun
06
Dec
05
Capping intoduced Cap reset

Human Resource Capability 11
Traditionally, agencies in the New Zealand State services have operated autonomously in making decisions on functional business areas. As part of Better Public Services reform, changes are being made to provide for stronger system-wide leadership across Results and by function.
Public Service agencies have been consolidating over time, and as at 30 June 2014 there are 29 Public Service agencies, the lowest number in 15 years. The number of Crown entities has also fallen, going from 127 in 2005 to 122 today.2
Changes in staff numbers in Public Service departments
The Public Service workforce has increased in size by 1.8% or 780 FTE employees during the 2014 June year. Fifteen departments had an increase in FTE employees and fourteen departments had a decrease, as shown in Figure 6.
• Ministry of Social Development (MSD) has increased by 364 FTE employees, mainly in Work and Income, as a result of Welfare Reform changes. This represents an increase of 4% of MSD total staff numbers.
• Inland Revenue Department increased by 166 FTE staff as a result of its Business Transformation Programme.
• Canterbury Earthquake Recovery Authority increased by 140 FTE to support the rebuild of greater Christchurch and in particular the central city.
• Ministry of Primary Industries increased by 106 FTE staff to support an increase in market access and border inspection work.
• The Ministry of Education increased by 94 FTE staff in areas such as Special Education and the implementation of Novopay.
• Statistics New Zealand decreased by 210 FTE owing to the completion of the 2013 Census and reorganisation of its workforce.
Staff numbers by occupation
Occupational information within the Public Service is collected using the Australian and New Zealand Standard Classification of Occupations (ANZSCO). A set of HRC customised occupational groups is used to report on occupations in the Public Service. A breakdown of the most common occupations in these customised groups is provided in Appendix 4. Table 2 shows FTE staff numbers by occupational group for the last five years.
Composition
2 This excludes any changes to the number of School Board of Trustees and Crown entity subsidiaries, of which there are around 2,435 and 200 respectively.
Figure 6 Changes in department FTE staff numbers, June year 2013-2014
Changes in FTEs (2013 to 2014)
Sta
tistic
s
MB
IE
Cus
tom
s
Cor
rect
ionsDIA
TPK
Cro
wn
Law
MC
H
SFO
LIN
Z
ER
O
MoD
SS
C
MW
A
MP
IA
MoT
GC
SB
Trea
sury
MfE
MFa
T
DP
MC
MoH
DoCMoJ
MoEMP
I
CE
RAIR
MS
D
-300
-200
-100
0
100
200
300
400
500
Human Resource Capability12
Table 2 FTE staff numbers by occupation group, 30 June 2010-2014
HRC Occupational Groups 2010 2011 2012 2013 2014% change
since 2010
Managers 5,105 5,050 5,172 5,120 5,281 3.4%
Policy Analysts 2,626 2,603 2,624 2,760 2,514 -4.3%
Information Professionals 3,411 3,333 3,530 3,956 4,327 26.9%
Social, Health and Education Workers 7,977 8,078 7,992 8,330 8,502 6.6%
ICT Professionals and Technicians 2,009 1,738 1,677 1,794 1,807 -10.1%
Legal, HR and Finance Professionals 2,129 2,075 2,182 2,202 2,111 -0.9%
Other Professionals not elsewhere included 1,923 1,813 1,660 1,938 2,282 18.7%
Inspectors and Regulatory Officers 9,454 9,334 9,234 9,480 9,688 2.5%
Contact Centre Workers 4,409 4,426 4,361 4,154 4,217 -4.4%
Clerical and Administrative Workers 5,178 4,821 4,565 4,393 4,191 -19.1%
Other 333 324 348 373 360 8.4%
Total 44,554 43,595 43,345 44,500 45,280 1.6%
Table 3 Number and proportion of employees on fixed term agreements and secondments, 30 June 2010-2014
Employees (headcount) 2010 2011 2012 2013 2014
Permanent employees 43,565 42,522 42,060 42,661 43,181
Fixed term employees 3,257 3,285 3,384 3,885 3,939
Proportion of current employees on fixed term agreements 7.0% 7.2% 7.4% 8.3% 8.4%
Number of inter-agency secondments 119 130 148 148 196
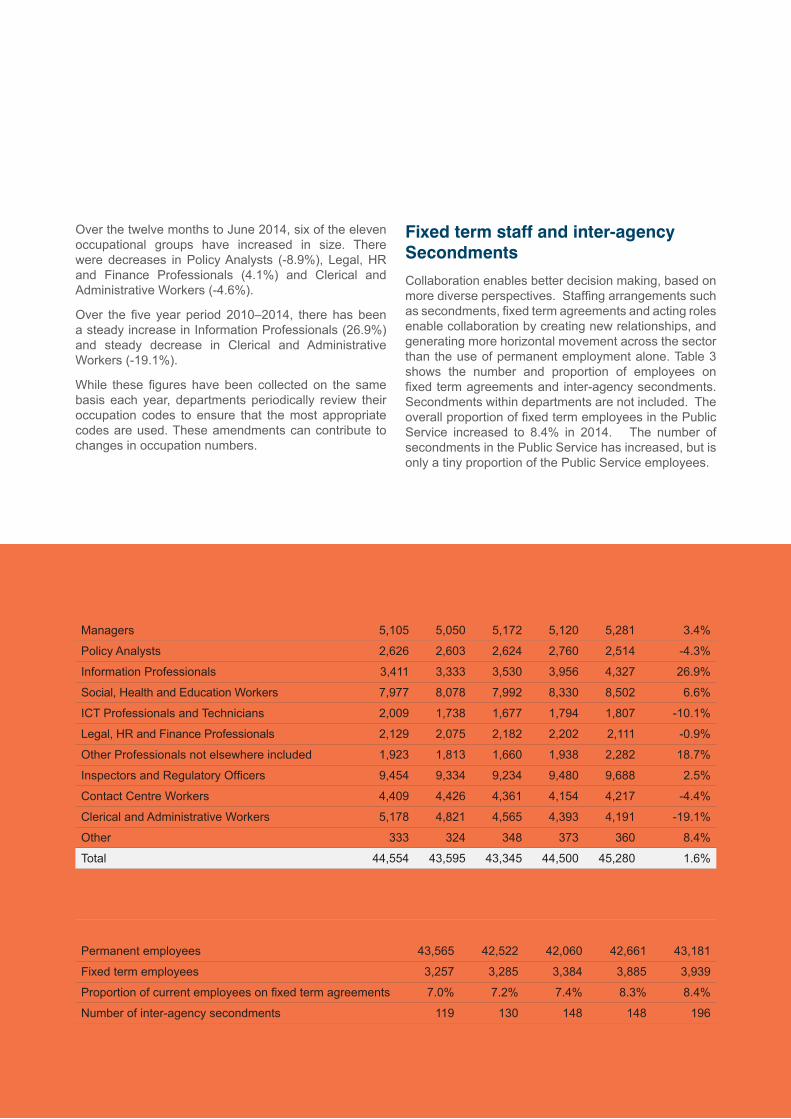
Over the twelve months to June 2014, six of the eleven occupational groups have increased in size. There were decreases in Policy Analysts (-8.9%), Legal, HR and Finance Professionals (4.1%) and Clerical and Administrative Workers (-4.6%).
Over the five year period 2010–2014, there has been a steady increase in Information Professionals (26.9%) and steady decrease in Clerical and Administrative Workers (-19.1%).
While these figures have been collected on the same basis each year, departments periodically review their occupation codes to ensure that the most appropriate codes are used. These amendments can contribute to changes in occupation numbers.
Fixed term staff and inter-agency Secondments
Collaboration enables better decision making, based on more diverse perspectives. Staffing arrangements such as secondments, fixed term agreements and acting roles enable collaboration by creating new relationships, and generating more horizontal movement across the sector than the use of permanent employment alone. Table 3 shows the number and proportion of employees on fixed term agreements and inter-agency secondments. Secondments within departments are not included. The overall proportion of fixed term employees in the Public Service increased to 8.4% in 2014. The number of secondments in the Public Service has increased, but is only a tiny proportion of the Public Service employees.

Human Resource Capability 13
Regional staff
In 2014, there were a total of 45,280 Public Service FTE employees across New Zealand. The Wellington region, being the main central administration, had the largest proportion of this workforce with 41.4%. This was followed by Auckland (20.0%), Canterbury (9.6%) and Waikato (8.4%). These four regions accounted for 79% of the Public Service workforce. The regional distribution has been relatively stable in recent years.
Northland
1,2132.7%
Auckland
9,04120.0%
Bay of Plenty
1,6323.6%
Gisborne
2530.6%
Hawkes Bay
1,0512.3%
Wellington
18,73441.4%
Marlborough
1260.3%
Canterbury
4,3549.6%
Otago
1,2272.7%
Southland
5721.3%
West Coast
2180.5%
Nelson
4741.0%
Tasman
340.1%
Manawatu-Wanaganui
1,8794.1%
Taranaki
4100.9%
Waikato
3,7988.4%
Public Service FTE employees
45,280
4 regions make up 79% of the Public
Service
269 or 0.6% of Public Service FTE employees worked overseas as at June
30 2014
Human Resource Capability14
Auckland
The Auckland State Sector
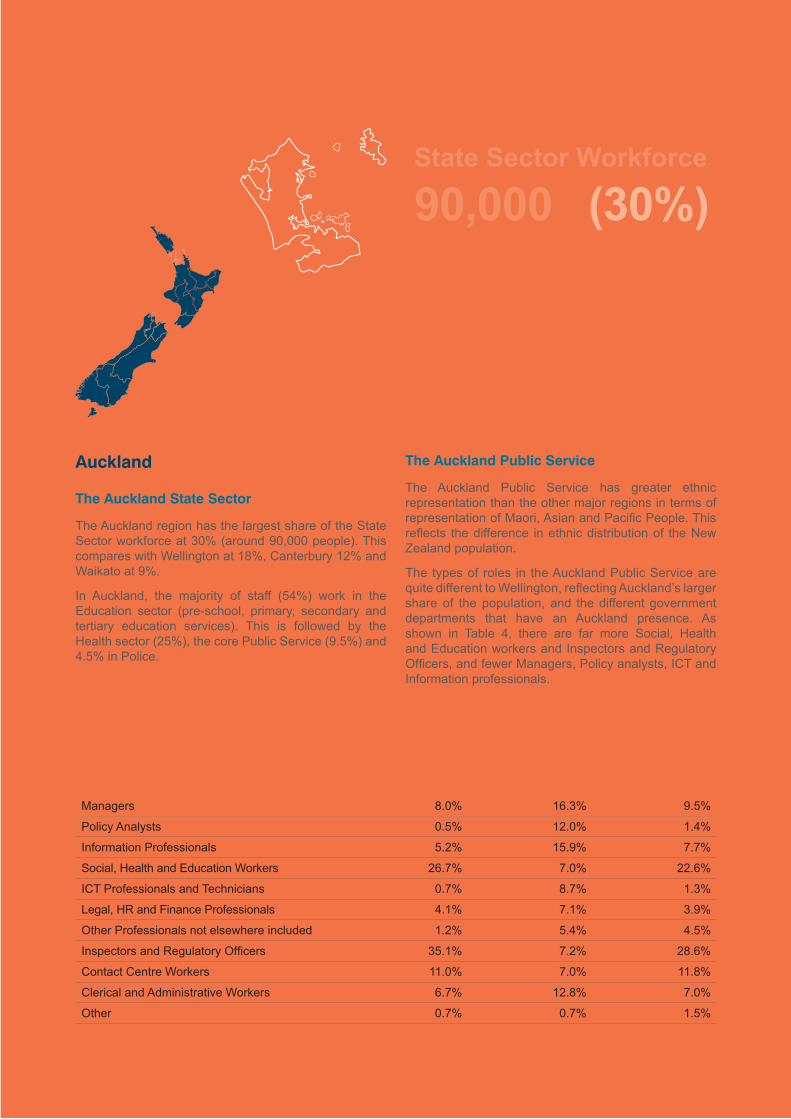
The Auckland region has the largest share of the State Sector workforce at 30% (around 90,000 people). This compares with Wellington at 18%, Canterbury 12% and Waikato at 9%.
In Auckland, the majority of staff (54%) work in the Education sector (pre-school, primary, secondary and tertiary education services). This is followed by the Health sector (25%), the core Public Service (9.5%) and 4.5% in Police.
The Auckland Public Service
The Auckland Public Service has greater ethnic representation than the other major regions in terms of representation of Maori, Asian and Pacific People. This reflects the difference in ethnic distribution of the New Zealand population.
The types of roles in the Auckland Public Service are quite different to Wellington, reflecting Auckland’s larger share of the population, and the different government departments that have an Auckland presence. As shown in Table 4, there are far more Social, Health and Education workers and Inspectors and Regulatory Officers, and fewer Managers, Policy analysts, ICT and Information professionals.
Table 4 Occupational makeup of the Public Service by the three major regions
HRC Occupational Groups Auckland Wellington Canterbury
Managers 8.0% 16.3% 9.5%
Policy Analysts 0.5% 12.0% 1.4%
Information Professionals 5.2% 15.9% 7.7%
Social, Health and Education Workers 26.7% 7.0% 22.6%
ICT Professionals and Technicians 0.7% 8.7% 1.3%
Legal, HR and Finance Professionals 4.1% 7.1% 3.9%
Other Professionals not elsewhere included 1.2% 5.4% 4.5%
Inspectors and Regulatory Officers 35.1% 7.2% 28.6%
Contact Centre Workers 11.0% 7.0% 11.8%
Clerical and Administrative Workers 6.7% 12.8% 7.0%
Other 0.7% 0.7% 1.5%
State Sector Workforce
90,000 (30%)
Human Resource Capability 15
It is important for agencies to understand the total cost of staff. On average, 40% of agency costs are people. People costs include elements such as wages and salaries, superannuation, performance pay, redundancy and retirement. Agencies also have costs associated with their HR function, which run the people policies and processes to effectively recruit, develop and manage staff.
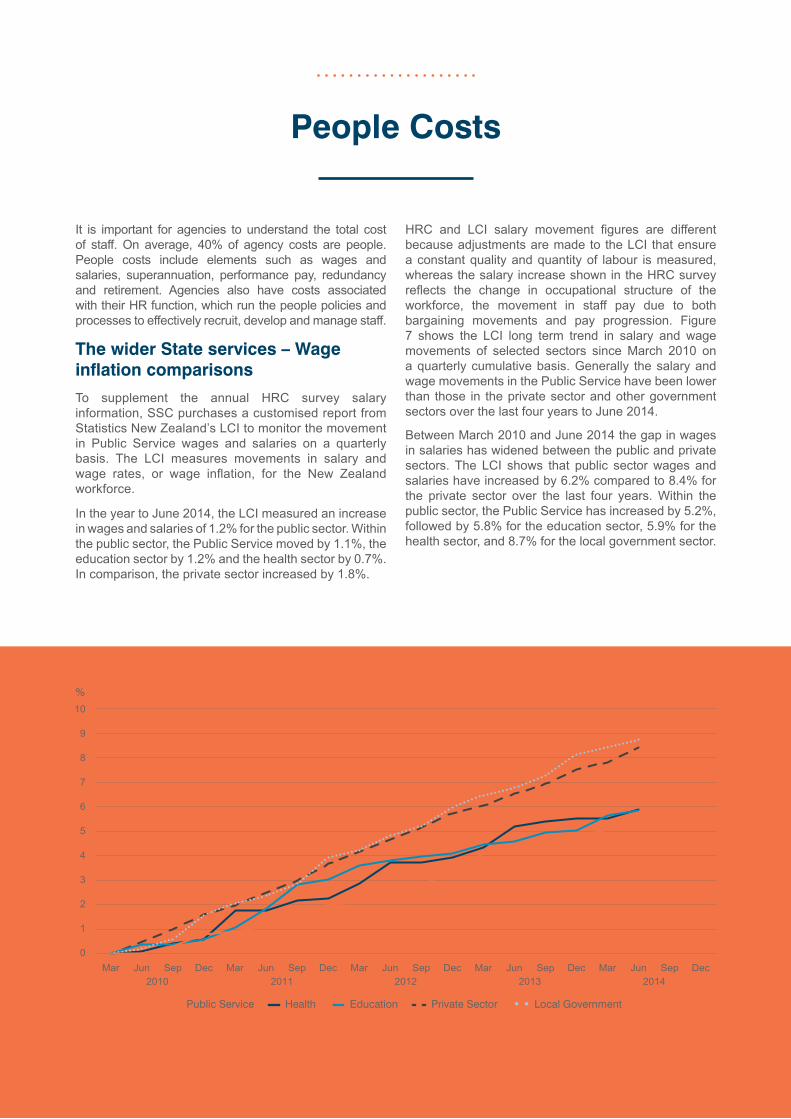
The wider State services – Wage inflation comparisons
To supplement the annual HRC survey salary information, SSC purchases a customised report from Statistics New Zealand’s LCI to monitor the movement in Public Service wages and salaries on a quarterly basis. The LCI measures movements in salary and wage rates, or wage inflation, for the New Zealand workforce.
In the year to June 2014, the LCI measured an increase in wages and salaries of 1.2% for the public sector. Within the public sector, the Public Service moved by 1.1%, the education sector by 1.2% and the health sector by 0.7%. In comparison, the private sector increased by 1.8%.
HRC and LCI salary movement figures are different because adjustments are made to the LCI that ensure a constant quality and quantity of labour is measured, whereas the salary increase shown in the HRC survey reflects the change in occupational structure of the workforce, the movement in staff pay due to both bargaining movements and pay progression. Figure 7 shows the LCI long term trend in salary and wage movements of selected sectors since March 2010 on a quarterly cumulative basis. Generally the salary and wage movements in the Public Service have been lower than those in the private sector and other government sectors over the last four years to June 2014.
Between March 2010 and June 2014 the gap in wages in salaries has widened between the public and private sectors. The LCI shows that public sector wages and salaries have increased by 6.2% compared to 8.4% for the private sector over the last four years. Within the public sector, the Public Service has increased by 5.2%, followed by 5.8% for the education sector, 5.9% for the health sector, and 8.7% for the local government sector.
People Costs
Figure 7 Public and private sector wage movements, 2010-2014
%
— Public Service — Health — Education - - Private Sector � � Local Government
0
1
2
3
4
5
6
7
8
9
10
2010 2011 2012 2013 2014DecSepJunMarDecSepJunMarDecSepJunMarDecSepJunMarDecSepJunMar
Human Resource Capability16
Personnel expenses
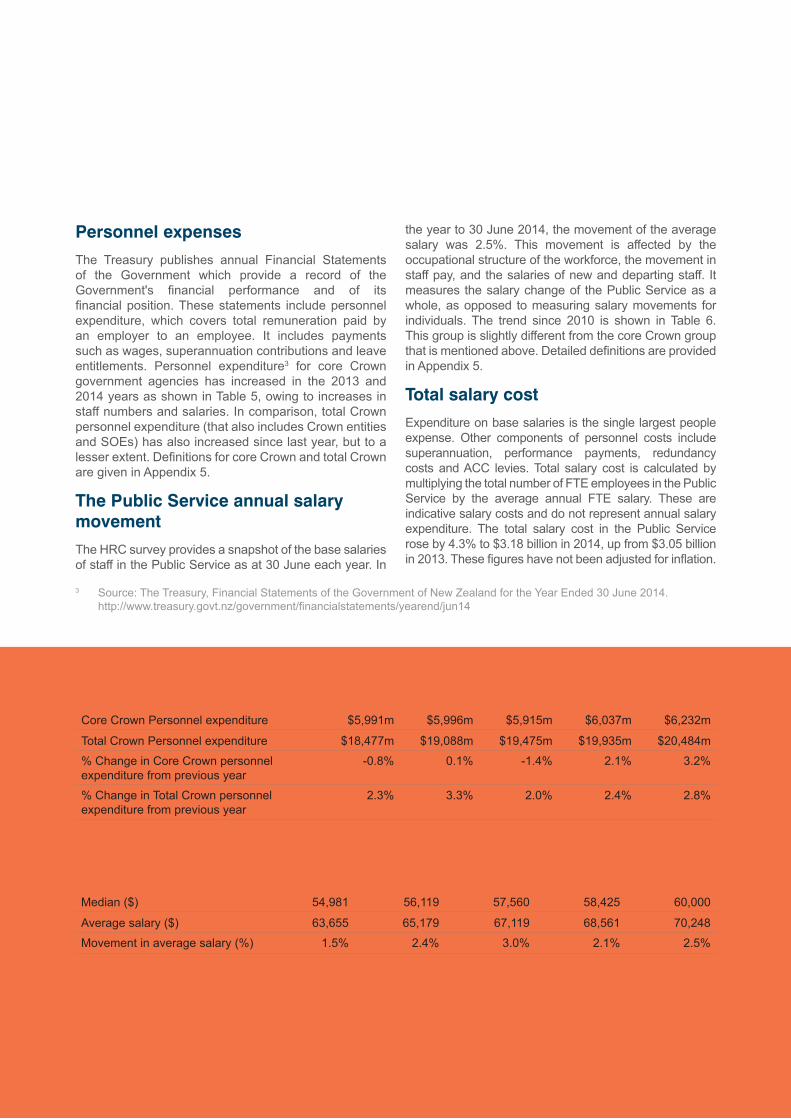
The Treasury publishes annual Financial Statements of the Government which provide a record of the Government's financial performance and of its financial position. These statements include personnel expenditure, which covers total remuneration paid by an employer to an employee. It includes payments such as wages, superannuation contributions and leave entitlements. Personnel expenditure3 for core Crown government agencies has increased in the 2013 and 2014 years as shown in Table 5, owing to increases in staff numbers and salaries. In comparison, total Crown personnel expenditure (that also includes Crown entities and SOEs) has also increased since last year, but to a lesser extent. Definitions for core Crown and total Crown are given in Appendix 5.
The Public Service annual salary movement
The HRC survey provides a snapshot of the base salaries of staff in the Public Service as at 30 June each year. In
the year to 30 June 2014, the movement of the average salary was 2.5%. This movement is affected by the occupational structure of the workforce, the movement in staff pay, and the salaries of new and departing staff. It measures the salary change of the Public Service as a whole, as opposed to measuring salary movements for individuals. The trend since 2010 is shown in Table 6. This group is slightly different from the core Crown group that is mentioned above. Detailed definitions are provided in Appendix 5.
Total salary cost
Expenditure on base salaries is the single largest people expense. Other components of personnel costs include superannuation, performance payments, redundancy costs and ACC levies. Total salary cost is calculated by multiplying the total number of FTE employees in the Public Service by the average annual FTE salary. These are indicative salary costs and do not represent annual salary expenditure. The total salary cost in the Public Service rose by 4.3% to $3.18 billion in 2014, up from $3.05 billion in 2013. These figures have not been adjusted for inflation.
3 Source: The Treasury, Financial Statements of the Government of New Zealand for the Year Ended 30 June 2014. http://www.treasury.govt.nz/government/financialstatements/yearend/jun14
Table 6 Average and median salary, 30 June 2010-2014
2010 2011 2012 2013 2014
Median ($) 54,981 56,119 57,560 58,425 60,000
Average salary ($) 63,655 65,179 67,119 68,561 70,248
Movement in average salary (%) 1.5% 2.4% 3.0% 2.1% 2.5%
Table 5 Personnel expenditure3 in core Crown and total Crown, June year 2010-2014
2010 2011 2012 2013 2014
Core Crown Personnel expenditure $5,991m $5,996m $5,915m $6,037m $6,232m
Total Crown Personnel expenditure $18,477m $19,088m $19,475m $19,935m $20,484m
% Change in Core Crown personnel expenditure from previous year
-0.8% 0.1% -1.4% 2.1% 3.2%
% Change in Total Crown personnel expenditure from previous year
2.3% 3.3% 2.0% 2.4% 2.8%
Human Resource Capability 17
Average salary movement and total cost by occupation
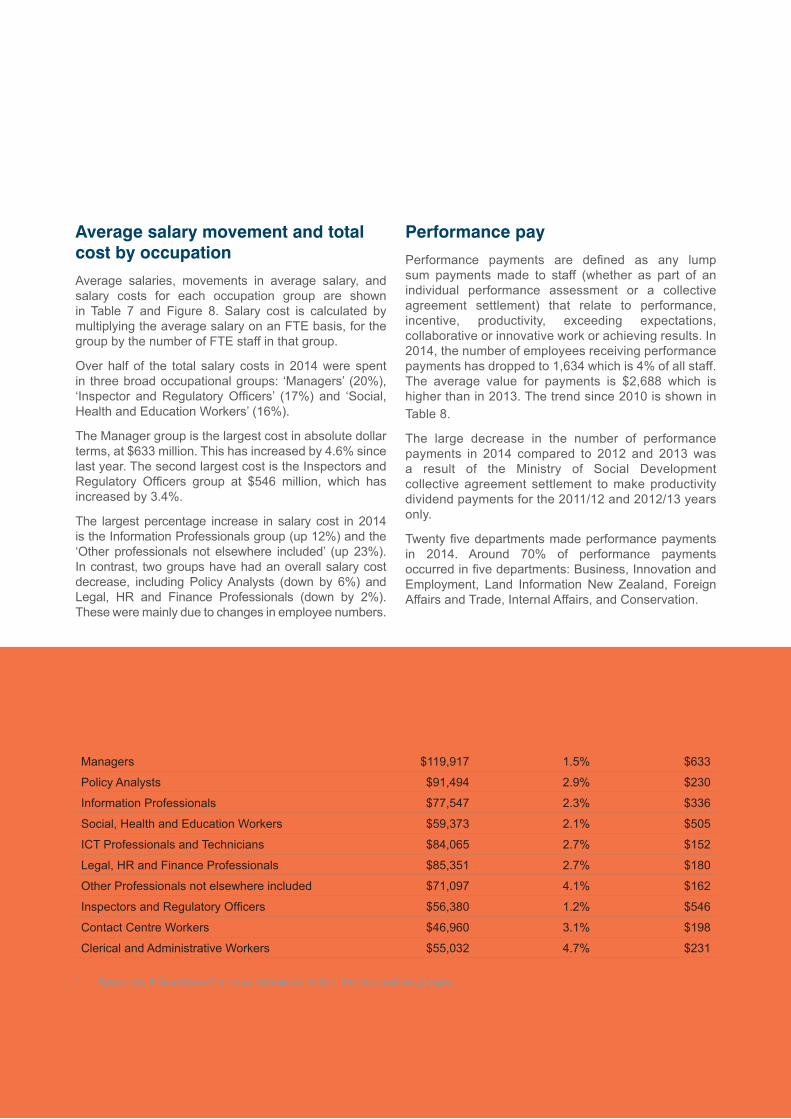
Average salaries, movements in average salary, and salary costs for each occupation group are shown in Table 7 and Figure 8. Salary cost is calculated by multiplying the average salary on an FTE basis, for the group by the number of FTE staff in that group.
Over half of the total salary costs in 2014 were spent in three broad occupational groups: ‘Managers’ (20%), ‘Inspector and Regulatory Officers’ (17%) and ‘Social, Health and Education Workers’ (16%).
The Manager group is the largest cost in absolute dollar terms, at $633 million. This has increased by 4.6% since last year. The second largest cost is the Inspectors and Regulatory Officers group at $546 million, which has increased by 3.4%.
The largest percentage increase in salary cost in 2014 is the Information Professionals group (up 12%) and the ‘Other professionals not elsewhere included’ (up 23%). In contrast, two groups have had an overall salary cost decrease, including Policy Analysts (down by 6%) and Legal, HR and Finance Professionals (down by 2%). These were mainly due to changes in employee numbers.
Performance pay
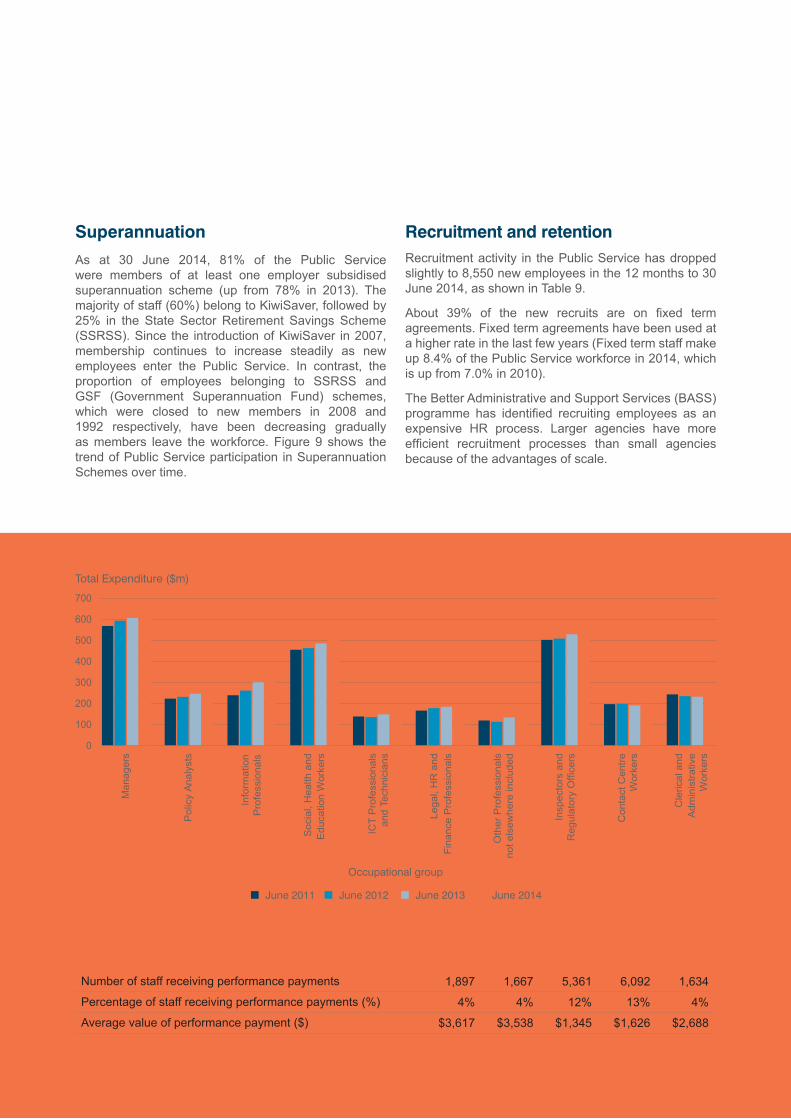
Performance payments are defined as any lump sum payments made to staff (whether as part of an individual performance assessment or a collective agreement settlement) that relate to performance, incentive, productivity, exceeding expectations, collaborative or innovative work or achieving results. In 2014, the number of employees receiving performance payments has dropped to 1,634 which is 4% of all staff. The average value for payments is $2,688 which is higher than in 2013. The trend since 2010 is shown in Table 8.
The large decrease in the number of performance payments in 2014 compared to 2012 and 2013 was a result of the Ministry of Social Development collective agreement settlement to make productivity dividend payments for the 2011/12 and 2012/13 years only.
Twenty five departments made performance payments in 2014. Around 70% of performance payments occurred in five departments: Business, Innovation and Employment, Land Information New Zealand, Foreign Affairs and Trade, Internal Affairs, and Conservation.
Table 7 Movements in average salary and estimated total cost by occupation group
HRC customised occupation groups4Average Salary
June 2014
Movement in Average Salary between 2013
and 2014Total Salary Cost
$(million)
Managers $119,917 1.5% $633
Policy Analysts $91,494 2.9% $230
Information Professionals $77,547 2.3% $336
Social, Health and Education Workers $59,373 2.1% $505
ICT Professionals and Technicians $84,065 2.7% $152
Legal, HR and Finance Professionals $85,351 2.7% $180
Other Professionals not elsewhere included $71,097 4.1% $162
Inspectors and Regulatory Officers $56,380 1.2% $546
Contact Centre Workers $46,960 3.1% $198
Clerical and Administrative Workers $55,032 4.7% $231
4 Appendix 4 describes the roles contained within the occupation groups.
Human Resource Capability18
Table 8 Lump sum performance payments, June year 2010 to 2014
2010 2011 2012 2013 2014
Number of staff receiving performance payments 1,897 1,667 5,361 6,092 1,634
Percentage of staff receiving performance payments (%) 4% 4% 12% 13% 4%
Average value of performance payment ($) $3,617 $3,538 $1,345 $1,626 $2,688
Superannuation
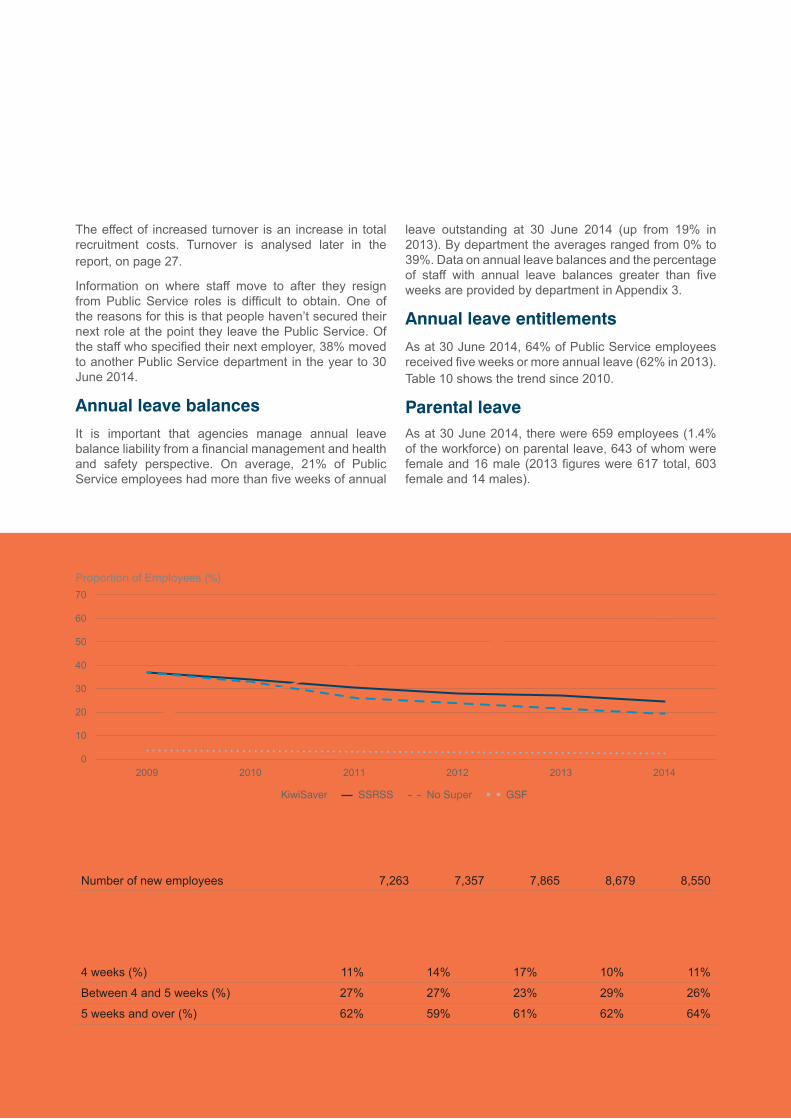
As at 30 June 2014, 81% of the Public Service were members of at least one employer subsidised superannuation scheme (up from 78% in 2013). The majority of staff (60%) belong to KiwiSaver, followed by 25% in the State Sector Retirement Savings Scheme (SSRSS). Since the introduction of KiwiSaver in 2007, membership continues to increase steadily as new employees enter the Public Service. In contrast, the proportion of employees belonging to SSRSS and GSF (Government Superannuation Fund) schemes, which were closed to new members in 2008 and 1992 respectively, have been decreasing gradually as members leave the workforce. Figure 9 shows the trend of Public Service participation in Superannuation Schemes over time.
Recruitment and retentionRecruitment activity in the Public Service has dropped slightly to 8,550 new employees in the 12 months to 30 June 2014, as shown in Table 9.
About 39% of the new recruits are on fixed term agreements. Fixed term agreements have been used at a higher rate in the last few years (Fixed term staff make up 8.4% of the Public Service workforce in 2014, which is up from 7.0% in 2010).
The Better Administrative and Support Services (BASS) programme has identified recruiting employees as an expensive HR process. Larger agencies have more efficient recruitment processes than small agencies because of the advantages of scale.
¢ June 2011 ¢ June 2012 ¢ June 2013 ¢ June 2014
Occupational group
Figure 8 Estimated salary cost by occupation group
Total Expenditure ($m)
0
100
200
300
400
500
600
700
Cle
rical
and
Adm
inis
trativ
eW
orke
rs
Con
tact
Cen
treW
orke
rs
Insp
ecto
rs a
ndR
egul
ator
y O
ffice
rs
Oth
er P
rofe
ssio
nals
not e
lsew
here
incl
uded
Lega
l, H
R a
ndFi
nanc
e P
rofe
ssio
nals
ICT
Pro
fess
iona
lsan
d Te
chni
cian
s
Soc
ial,
Hea
lth a
ndE
duca
tion
Wor
kers
Info
rmat
ion
Pro
fess
iona
ls
Pol
icy
Anal
ysts
Man
ager
s
Human Resource Capability 19
The effect of increased turnover is an increase in total recruitment costs. Turnover is analysed later in the report, on page 27.
Information on where staff move to after they resign from Public Service roles is difficult to obtain. One of the reasons for this is that people haven’t secured their next role at the point they leave the Public Service. Of the staff who specified their next employer, 38% moved to another Public Service department in the year to 30 June 2014.
Annual leave balances
It is important that agencies manage annual leave balance liability from a financial management and health and safety perspective. On average, 21% of Public Service employees had more than five weeks of annual
leave outstanding at 30 June 2014 (up from 19% in 2013). By department the averages ranged from 0% to 39%. Data on annual leave balances and the percentage of staff with annual leave balances greater than five weeks are provided by department in Appendix 3.
Annual leave entitlements
As at 30 June 2014, 64% of Public Service employees received five weeks or more annual leave (62% in 2013). Table 10 shows the trend since 2010.
Parental leaveAs at 30 June 2014, there were 659 employees (1.4% of the workforce) on parental leave, 643 of whom were female and 16 male (2013 figures were 617 total, 603 female and 14 males).
Table 9 Number of new employees, June year 2010-2014
2010 2011 2012 2013 2014
Number of new employees 7,263 7,357 7,865 8,679 8,550
Figure 9 Proportion of Public Service employees in subsidised superannuation schemes, June year 2009-2014
Proportion of Employees (%)
— KiwiSaver — SSRSS - - No Super � � GSF
0
10
20
30
40
50
60
70
201420132012201120102009
Table 10 Annual leave entitlements (including department days), June year 2010-2014
2010 2011 2012 2013 2014
4 weeks (%) 11% 14% 17% 10% 11%
Between 4 and 5 weeks (%) 27% 27% 23% 29% 26%
5 weeks and over (%) 62% 59% 61% 62% 64%
Human Resource Capability20
Efficiency and effectiveness of HR functions
Organisational HR functions carry out a mixture of strategic and transactional activities associated with effectively managing and making the most of people. It is important for agencies to use the human resources function as a strategic business partner, with a goal of ensuring people are aligned with strategic objectives.
BASS reporting provides insights into the performance of HR services to support agencies’ value for money assessments, target-setting, and tracking of improvements over time. BASS is supporting agencies to assess their cost, efficiency and effectiveness and to identify and track improvements across HR processes.
BASS results for the 2012/13 financial year continue to show the need for significant change in HR services. HR service costs have remained relatively stable over the last three years. The agencies included in BASS spent
$161.5m on the HR function in FY 2012/13, which is up $1.0m (about 1 percent) from FY 2010/11 when adjusted for inflation. BASS results suggest that compared to international standards, there is a significant room for effiency gains. HR needs to deliver more value to agencies through business partnering.
Effectiveness indicators also show room for improvement. The proportion of new hires in the same role after 12 months is lower than international comparators and has continued to drop year on year. The Management Practice Indicators were replaced by a Capability Maturity Model (CMM) for the 2012/13 collection, to improve the effectiveness measurement of the HR function. The CMM scores showed that, overall, agencies aspire to significantly improve the maturity of their HR management practices over the next two years. The two highest priority areas for improvement for agencies were developing people skills of managers and staff engagement. Source: The Treasury
Human Resource Capability 21
The State services need leaders who are focused on whole-of-system transformation and strategy. It is critical that leaders can influence beyond their agency boundary to deliver on key government outcomes for the people of New Zealand.
Changes to the State Sector Amendment Act (2013) strengthened the role of the State Services Commissioner to oversee the delivery of a leadership strategy for the State services. In support of the Commissioner, chief executives ensure alignment and integration of the strategy at an agency, sector and system level. A Government Chief Talent Officer (GCTO) was appointed in May 2014 to deliver the leadership programme and act as the Head of Profession for Human Resources (HR) for the Public Service.
In 2013, the Leadership and Capability Development and Deployment (LCDD) programme was established to deliver on the aims of the leadership strategy and integrate system-wide capability development and leadership initiatives into a single change programme. The LCDD programme is focused on ensuring the development of current and future leaders to enable the State services to be responsive to the needs of an increasingly diverse New Zealand.
The LCDD programme and delivery approach is supported by the Performance Improvement Framework, 4-Year Excellence Horizons, 4-year Plans, and Executive Management of chief executives. The programme priorities are focused in four key areas:
• Position leaders as system assets• Drive insights through data• Unlock early in career leaders• Provide stewardship of critical functions.
From good agency leaders to great system leaders
The big challenges facing the State services require leaders who can operate at both an agency and a system level. As a result, there is a need to change the dialogue around people, and to think differently about how to attract, develop and retain people, as well as use them most effectively. There is increasing pressure being placed on chief executives for a renewed emphasis and importance on people management and development. What has been rewarded in the past will not necessarily be rewarded going forward. We need to understand different organisational cultures within and outside the State sector, and think differently about how we collectively achieve outcomes. The shift in leadership we seek is defined below:
Leadership in the State Services
From good agency leaders... To great system leaders...
• Leaders who operate with authority over things they are accountable for (Agency Leaders).
• Leaders who lead their agency and are mostly internally focused.
• Leaders who are focused on managing risk and delivering results safely.
• Leaders who consult the community on their solutions.
• Leaders who get everything expected of them done.• Leaders who focus on agency achievement and
protect their resources.• Leaders who ‘manage’ their senior team members.
• Leaders who operate with influence over things they feel responsible for (Public Service leaders).
• Leaders who lead in the cross-sectoral and wider State services context and are mostly externally focused.
• Leaders who reflect and respond to the needs of diverse New Zealanders.
• Leaders who know when to take calculated risks and are not scared to experiment and learn from failure.
• Leaders who engage the community in their questions.
• Leaders who concentrate their resources on their top priorities.
• Leaders who also contribute to collective achievement and can ‘take one for the team’.
• Leaders who build powerful teams and who lead highly engaged organisations.
Human Resource Capability22
Senior leadership in the Public Service
Senior leadership in the context of the HRC data is defined as the top three tiers of managers within Public Service departments.
As at 30 June 2014, there were 1,025 senior leaders in the Public Service. This compares to 1,019 senior leaders last year. The composition of the senior leadership has changed slightly, with more tier 2, and fewer tier 3 positions.
The trend over the last 13 years has been a decline in the number of senior leaders, which has been caused by the reduction in the number of Public Service departments over time.
As at 30 June 2014, the movement in average salary of senior leadership was 4.0%, which is up from 3.3% last year. This compares to the Public Service movement in average salary of 2.5%. The average length of service (within their organisation) for senior leaders is 10.4 years. Sick leave usage for senior leadership is very low, at 3.3 days. This compares to 5.2 days for all managers group, and 7.7 days on average, for all Public Service employees.
Mobility in senior leadership and management
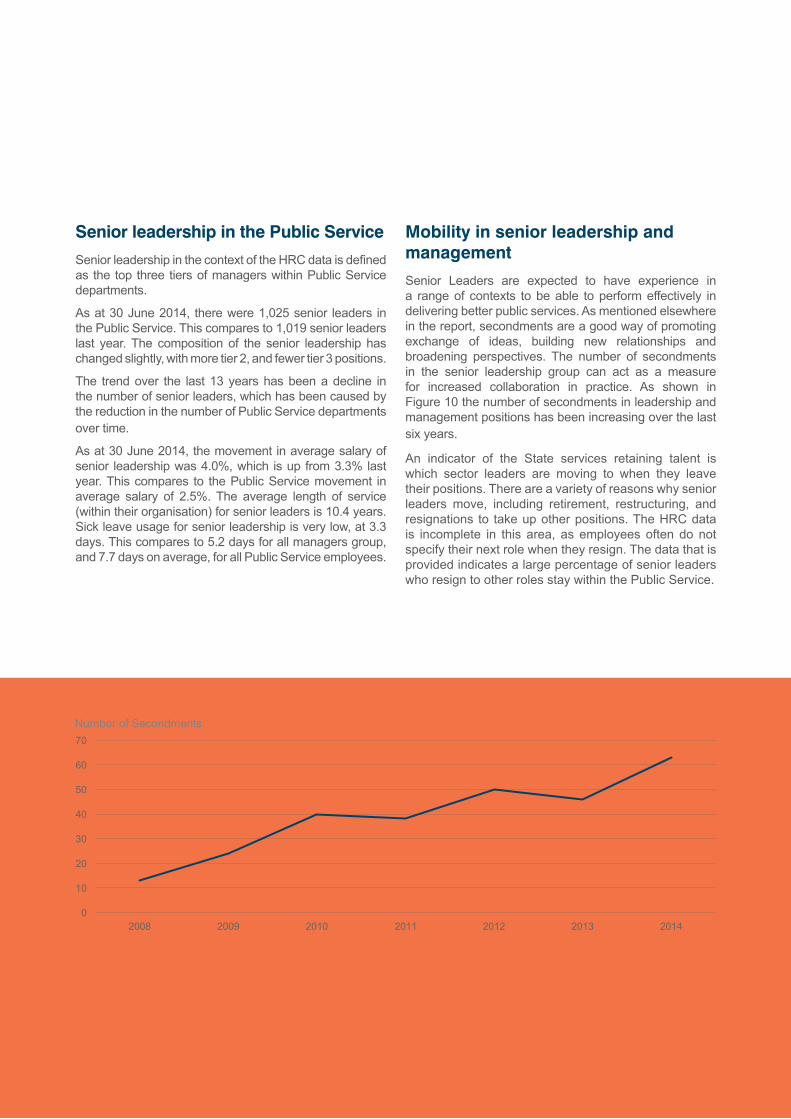
Senior Leaders are expected to have experience in a range of contexts to be able to perform effectively in delivering better public services. As mentioned elsewhere in the report, secondments are a good way of promoting exchange of ideas, building new relationships and broadening perspectives. The number of secondments in the senior leadership group can act as a measure for increased collaboration in practice. As shown in Figure 10 the number of secondments in leadership and management positions has been increasing over the last six years.
An indicator of the State services retaining talent is which sector leaders are moving to when they leave their positions. There are a variety of reasons why senior leaders move, including retirement, restructuring, and resignations to take up other positions. The HRC data is incomplete in this area, as employees often do not specify their next role when they resign. The data that is provided indicates a large percentage of senior leaders who resign to other roles stay within the Public Service.
Figure 10 Secondments in Public Service leadership and management positions, 30 June 2008-2014
Number of Secondments
0
10
20
30
40
50
60
70
2014201320122011201020092008

Human Resource Capability 23
Diversity in senior leadershipBecause of the relatively low turnover in tier 1, 2 and 3 roles, the ethnic and gender composition of senior leaders does not change much year on year. The trend over time is more important.
The proportion of women in senior leadership roles has been slowly increasing over the last decade. As at 30 June 2014, the percentage of women in senior management is 42%. If the trend of the last 5 years continues, the Public Service will reach 50% female representation in senior leadership in 2029.
There has been an increase in the proportion of Māori senior leaders, from 8.3% in 2010 to 12.0% in 2014. Māori are still under-represented in senior leadership, compared to their representation in the Public Service workforce (16.6%). The proportion of Asian senior leaders has increased over the last four years (from 1.7% to 2.4%). There has been little increase in Pacific senior leaders over the last four years. The figures for diversity in senior leadership are shown in Table 11 below.
Gender pay gap in senior leadership
As at 30 June 2014 the gender pay gap in senior leadership was 8.3%, down from 9.1% in 2013. This is low compared to the gender pay gap for all management roles (13.9%) and compared to the Public Service as a whole (14.1%). Table 12 shows the change in senior leadership pay gap over the last five years.
Table 11 Diversity in senior leadership, 30 June 2010-2014
2010 2011 2012 2013 2014Public Service
Workforce (2014)
Women 39.8% 39.6% 42.1% 41.5% 42.0% 60.0%
Māori 8.3% 9.2% 9.6% 11.2% 12.0% 16.6%
Pacific people 1.5% 1.6% 1.7% 1.8% 1.8% 8.0%
Asian 1.7% 1.9% 2.6% 2.3% 2.4% 8.2%
Table 12 Senior leadership gender pay gap, 30 June 2010 to 2014
2010 2011 2012 2013 2014
Senior leadership gender pay gap 8.0% 8.0% 11.0% 9.1% 8.3%
Human Resource Capability24
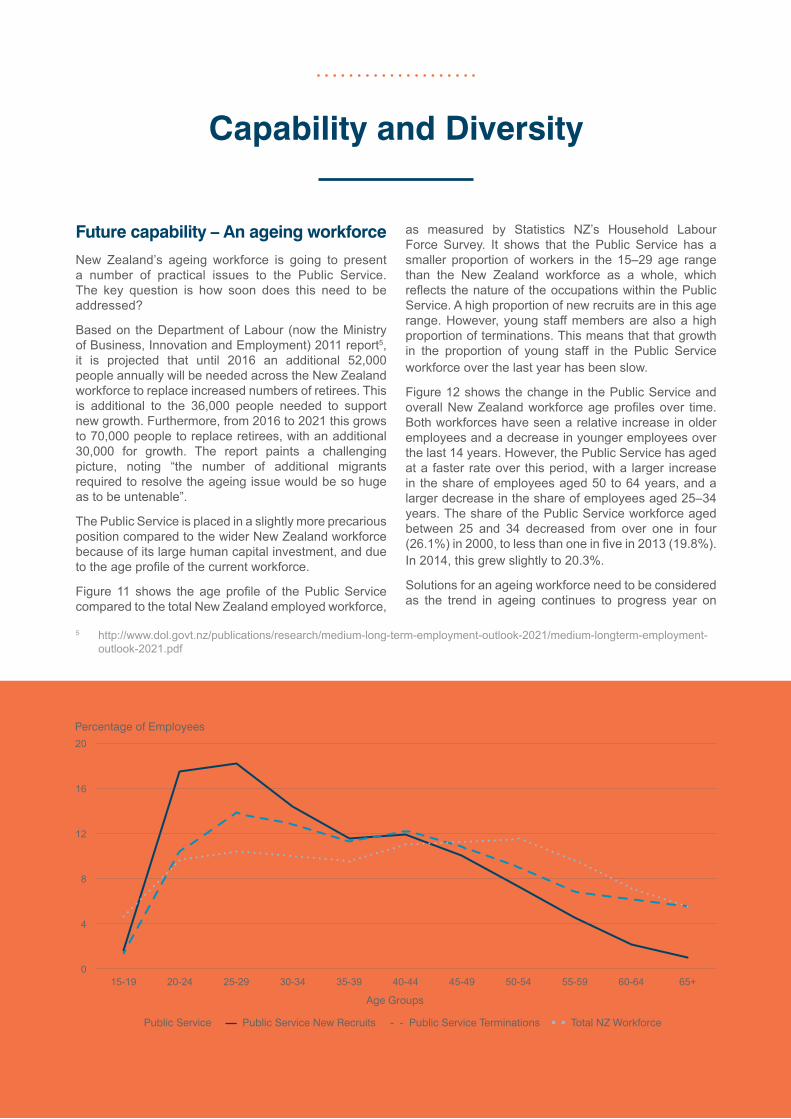
Future capability – An ageing workforce
New Zealand’s ageing workforce is going to present a number of practical issues to the Public Service. The key question is how soon does this need to be addressed?
Based on the Department of Labour (now the Ministry of Business, Innovation and Employment) 2011 report5, it is projected that until 2016 an additional 52,000 people annually will be needed across the New Zealand workforce to replace increased numbers of retirees. This is additional to the 36,000 people needed to support new growth. Furthermore, from 2016 to 2021 this grows to 70,000 people to replace retirees, with an additional 30,000 for growth. The report paints a challenging picture, noting “the number of additional migrants required to resolve the ageing issue would be so huge as to be untenable”.
The Public Service is placed in a slightly more precarious position compared to the wider New Zealand workforce because of its large human capital investment, and due to the age profile of the current workforce.
Figure 11 shows the age profile of the Public Service compared to the total New Zealand employed workforce,
as measured by Statistics NZ’s Household Labour Force Survey. It shows that the Public Service has a smaller proportion of workers in the 15–29 age range than the New Zealand workforce as a whole, which reflects the nature of the occupations within the Public Service. A high proportion of new recruits are in this age range. However, young staff members are also a high proportion of terminations. This means that that growth in the proportion of young staff in the Public Service workforce over the last year has been slow.
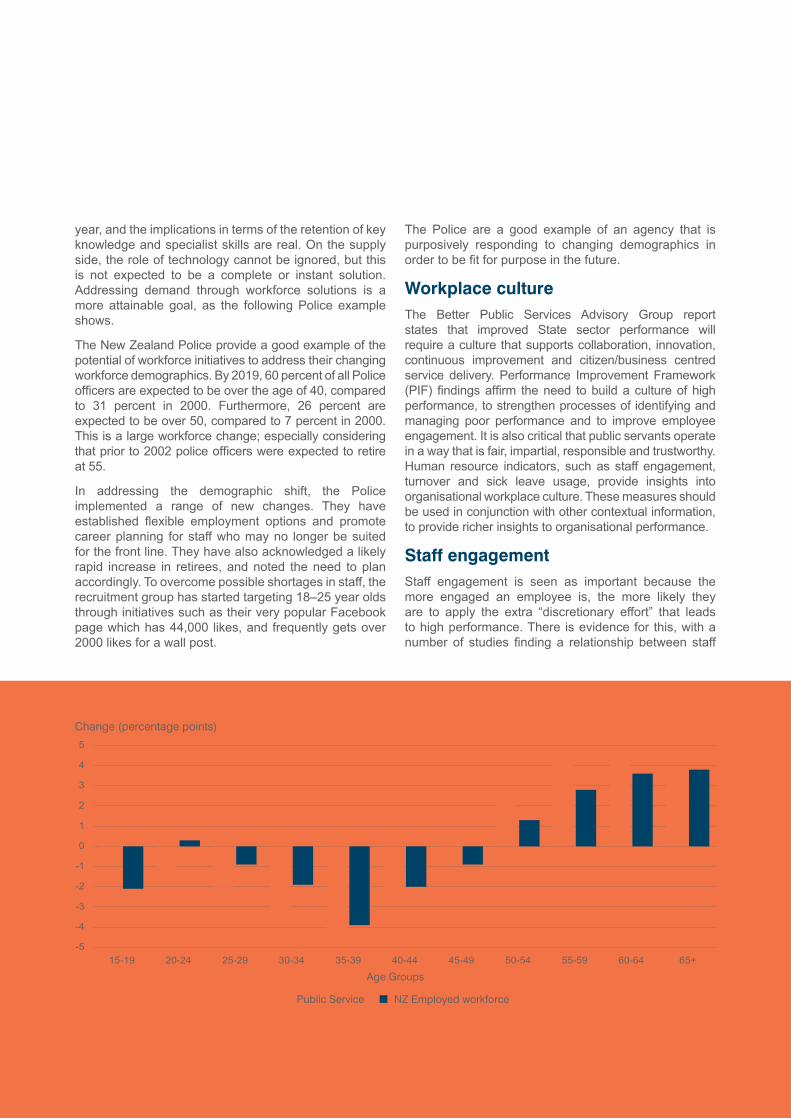
Figure 12 shows the change in the Public Service and overall New Zealand workforce age profiles over time. Both workforces have seen a relative increase in older employees and a decrease in younger employees over the last 14 years. However, the Public Service has aged at a faster rate over this period, with a larger increase in the share of employees aged 50 to 64 years, and a larger decrease in the share of employees aged 25–34 years. The share of the Public Service workforce aged between 25 and 34 decreased from over one in four (26.1%) in 2000, to less than one in five in 2013 (19.8%). In 2014, this grew slightly to 20.3%.
Solutions for an ageing workforce need to be considered as the trend in ageing continues to progress year on
Capability and Diversity
5 http://www.dol.govt.nz/publications/research/medium-long-term-employment-outlook-2021/medium-longterm-employment-outlook-2021.pdf
Figure 11 Employee age profile, 30 June 2014
Percentage of Employees
¢ Public Service — Public Service New Recruits - - Public Service Terminations � � Total NZ Workforce
Age Groups
0
4
8
12
16
20
65+60-6455-5950-5445-4940-4435-3930-3425-2920-2415-19
Human Resource Capability 25
year, and the implications in terms of the retention of key knowledge and specialist skills are real. On the supply side, the role of technology cannot be ignored, but this is not expected to be a complete or instant solution. Addressing demand through workforce solutions is a more attainable goal, as the following Police example shows.
The New Zealand Police provide a good example of the potential of workforce initiatives to address their changing workforce demographics. By 2019, 60 percent of all Police officers are expected to be over the age of 40, compared to 31 percent in 2000. Furthermore, 26 percent are expected to be over 50, compared to 7 percent in 2000. This is a large workforce change; especially considering that prior to 2002 police officers were expected to retire at 55.
In addressing the demographic shift, the Police implemented a range of new changes. They have established flexible employment options and promote career planning for staff who may no longer be suited for the front line. They have also acknowledged a likely rapid increase in retirees, and noted the need to plan accordingly. To overcome possible shortages in staff, the recruitment group has started targeting 18–25 year olds through initiatives such as their very popular Facebook page which has 44,000 likes, and frequently gets over 2000 likes for a wall post.
The Police are a good example of an agency that is purposively responding to changing demographics in order to be fit for purpose in the future.
Workplace cultureThe Better Public Services Advisory Group report states that improved State sector performance will require a culture that supports collaboration, innovation, continuous improvement and citizen/business centred service delivery. Performance Improvement Framework (PIF) findings affirm the need to build a culture of high performance, to strengthen processes of identifying and managing poor performance and to improve employee engagement. It is also critical that public servants operate in a way that is fair, impartial, responsible and trustworthy. Human resource indicators, such as staff engagement, turnover and sick leave usage, provide insights into organisational workplace culture. These measures should be used in conjunction with other contextual information, to provide richer insights to organisational performance.
Staff engagementStaff engagement is seen as important because the more engaged an employee is, the more likely they are to apply the extra “discretionary effort” that leads to high performance. There is evidence for this, with a number of studies finding a relationship between staff
¢ Public Service ¢ NZ Employed workforce
Figure 12 Change in proportion by age group between June 2000 and 2014
Change (percentage points)
Age Groups
-5
-4
-3
-2
-1
0
1
2
3
4
5
65+60-6455-5950-5445-4940-4435-3930-3425-2920-2415-19

Human Resource Capability26
engagement and organisational performance, in both the public and private sectors.6 Given this evidence, it is not surprising that agencies regularly survey their staff to gauge their level of engagement. In fact all the agencies that respond to the HRC indicated that they use some kind of staff engagement survey.
Information on agency results from staff engagement surveys has been collected as part of the HRC survey for the first time this year. This will allow research into how engagement results vary across agencies over time, and how these results relate to workforce and other agency characteristics. The goal is to better understand the factors driving improved staff engagement, and therefore improved agency performance.
It will take time to develop this kind of understanding of the staff engagement data. One issue that will need to be resolved is the extent to which staff engagement results can be compared across agencies. In 2014, the 29 Public Service agencies that provided information through the HRC process used a number of different staff engagement surveys: • Kenexa was used by 15 agencies.• Gallup was used by 11 agencies.• Winsborough was used by 2 agencies.• 1 agency had developed an internal staff engagement
survey.
6 Good summaries of the relationship between staff engagement and organisational performance can be found in chapter two of Engaging for Success: Enhancing Performance through Employee Engagement, a 2009 report to the UK Government and the follow-up 2012 report: The Evidence: Employee Engagement Task Force “Nailing the evidence” workgroup.
Table 13 Redundancies and average payments, June year 2010-2014
2010* 2011* 2012 2013 2014
Number of redundancies 784 888 764 696 440
Average payment ($) 48,564 45,728 50,650 47,696 55,825
Total cost of redundancy payments ($ millions) 38.1 40.6 38.7 33.2 24.6
* 2010 and 2011 figures have been revised
Figure 13 Redundancies by department, 2014
Number of redundancies
0
20
40
60
80
100
120
MW
A
SFO
DPM
C
ERO
CER
A
MfE
MPI
A
MoHTP
K
SSC
Cul
ture
GC
SB
MoD
LIN
Z
MoT
Trea
sury
Cro
wn
Law
MPI
MoEDIAIR
MFA
T
Stat
istic
s
MoJ
Cor
rect
ions
Cus
tom
s
MSD
MBI
E
DoC
Human Resource Capability 27
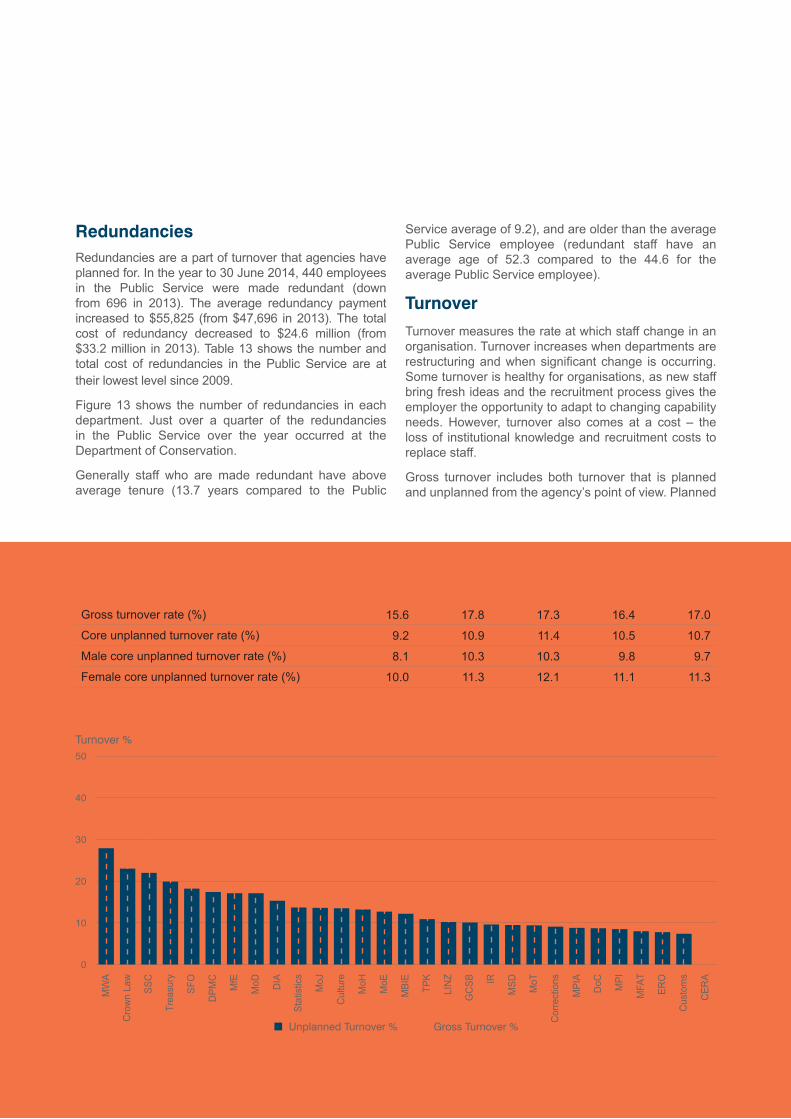
RedundanciesRedundancies are a part of turnover that agencies have planned for. In the year to 30 June 2014, 440 employees in the Public Service were made redundant (down from 696 in 2013). The average redundancy payment increased to $55,825 (from $47,696 in 2013). The total cost of redundancy decreased to $24.6 million (from $33.2 million in 2013). Table 13 shows the number and total cost of redundancies in the Public Service are at their lowest level since 2009.
Figure 13 shows the number of redundancies in each department. Just over a quarter of the redundancies in the Public Service over the year occurred at the Department of Conservation.
Generally staff who are made redundant have above average tenure (13.7 years compared to the Public
Service average of 9.2), and are older than the average Public Service employee (redundant staff have an average age of 52.3 compared to the 44.6 for the average Public Service employee).
Turnover
Turnover measures the rate at which staff change in an organisation. Turnover increases when departments are restructuring and when significant change is occurring. Some turnover is healthy for organisations, as new staff bring fresh ideas and the recruitment process gives the employer the opportunity to adapt to changing capability needs. However, turnover also comes at a cost – the loss of institutional knowledge and recruitment costs to replace staff.
Gross turnover includes both turnover that is planned and unplanned from the agency’s point of view. Planned
Figure 14 Gross and core unplanned turnover by department, June year 2014
Turnover %
¢ Unplanned Turnover % - - Gross Turnover %
0
10
20
30
40
50
CER
A
Cus
tom
s
ERO
MFA
T
MPI
DoC
MPI
A
Cor
rect
ions
MoT
MSDIR
GC
SB
LIN
Z
TPK
MBI
E
MoE
MoH
Cul
ture
MoJ
Stat
istic
s
DIA
MoDMfE
DPM
C
SFO
Trea
sury
SSC
Cro
wn
Law
MW
A
Table 14 Turnover rates in the Public Service, June year 2010-2014
2010 2011 2012 2013 2014
Gross turnover rate (%) 15.6 17.8 17.3 16.4 17.0
Core unplanned turnover rate (%) 9.2 10.9 11.4 10.5 10.7
Male core unplanned turnover rate (%) 8.1 10.3 10.3 9.8 9.7
Female core unplanned turnover rate (%) 10.0 11.3 12.1 11.1 11.3

Human Resource Capability28
turnover includes staff who leave due to redundancy and staff who finish fixed term agreements. Table 14 shows that turnover rates in the Public Service have been fairly constant in recent years.
Unplanned turnoverCore unplanned turnover measures the rate at which organisations lose permanent staff due to reasons the organisation hasn’t planned for such as resignations, retirements, and dismissals. Unplanned turnover can be used as an indicator of organisational health – less engaged staff are more likely to leave an organisation. Table 14 shows that core unplanned turnover has been steady since 2013, at 10.7% across the Public Service.
Turnover by department
Figure 14 shows the variation in core unplanned and gross turnover rates for individual departments. Higher gross turnover can indicate an above average use of fixed term staff or significant change programmes within an organisation.
Turnover tends to be higher for small departments. This relationship is also seen in the private sector.7 There are a number of potential reasons for this. There are often fewer opportunities for advancement within smaller organisations so employees need to move to gain experience or to advance their careers. Also, turnover rates are more unstable in smaller organisations. For example, one person leaving in an organisation of only 30 people will increase the turnover rate by over three percentage points.
Turnover by occupation group
Another reason for the difference in turnover by department is the variation in occupational composition of their workforces. For example, certain groups such as leadership and management have much lower turnover than occupations such as policy analysts, contact centre and clerical and administrative staff. Specialised roles also have very low turnover as there is less scope for these skills to be transferable. Departments that feature at the lower end of the unplanned turnover spectrum, such as Government Communications Security Bureau,
Table 15 Core unplanned turnover by occupation group, June year 2010-2014
HRC customised occupation groups 2010 2011 2012 2013 2014
Managers 6% 8% 9% 9% 9%
Policy Analysts 12% 15% 15% 15% 16%
Information Professionals 9% 10% 11% 11% 11%
Social, Health and Education Workers 10% 10% 11% 11% 10%
ICT Professionals and Technicians 8% 16% 16% 11% 9%
Legal, HR and Finance Professionals 9% 13% 13% 12% 13%
Other Professionals not elsewhere included 8% 10% 11% 9% 11%
Inspectors and Regulatory Officers 7% 8% 8% 9% 8%
Contact Centre Workers 13% 13% 15% 14% 15%
Clerical and Administrative Workers 12% 12% 14% 12% 12%
Table 16 Sick and domestic leave taken, June year 2010-2014
2010 2011 2012 2013 2014
Average sick and domestic leave taken (days) 7.6 7.4 7.6 7.9 7.7

Human Resource Capability 29
New Zealand Customs Service, Education Review Office and the Department of Conservation, all have a large number of roles that are specific to their area of expertise.
Table 15 shows core unplanned turnover by occupation group. The ‘Manager’ group and the ‘Inspectors and Regulatory Officer’ group have the lowest turnover rates in the Public Service. The Inspector and Regulatory Officer occupational group contains specialised roles, such as customs officers and security and intelligence officers, which generally have lower turnover than the general workforce. The 'Manager' group contains senior leaders and the management pool. This group traditionally has longer tenure within specific roles than the rest of the workforce. Turnover for ‘ICT Professionals and Technicians’ is also low in 2014 – the lowest rate of unplanned turnover for this group since 2010.
Sick and domestic leave taken
Sick and domestic leave taken can be used as an indicator of organisational health, with high levels perhaps indicating staff disengagement or intention to leave. There are many other factors that influence sick and domestic leave use, such as age, gender and occupation. In the year to 30 June 2014, Public Service employees took 7.7 days of sick and domestic leave, down from 7.9 days in 2013.
As shown in Table 17, sick and domestic leave use is affected by the occupational makeup of the workforce – overall front line occupational groups such as contact centre operators and Social, Health and Education Workers take more sick leave than policy or manager roles. The average amount of sick and domestic leave taken varies by department from 2.6 days to 10.5 days. Data on sick and domestic days taken by department is available in Appendix 3.
7 As shown by Linked Employer-Employee Dataset worker turnover statistics.
Table 17 Sick and domestic leave taken by occupational group, June year 2014
HRC customised occupation groupsAverage Sick and Domestic
Leave taken (days)
Managers 5.2
Policy Analysts 4.5
Information Professionals 7.2
Social, Health and Education Workers 9.9
ICT Professionals and Technicians 7.4
Legal, HR and Finance Professionals 5.5
Other Professionals not elsewhere included 6.0
Inspectors and Regulatory Officers 8.1
Contact Centre Workers 9.6
Clerical and Administrative Workers 7.5
Human Resource Capability30
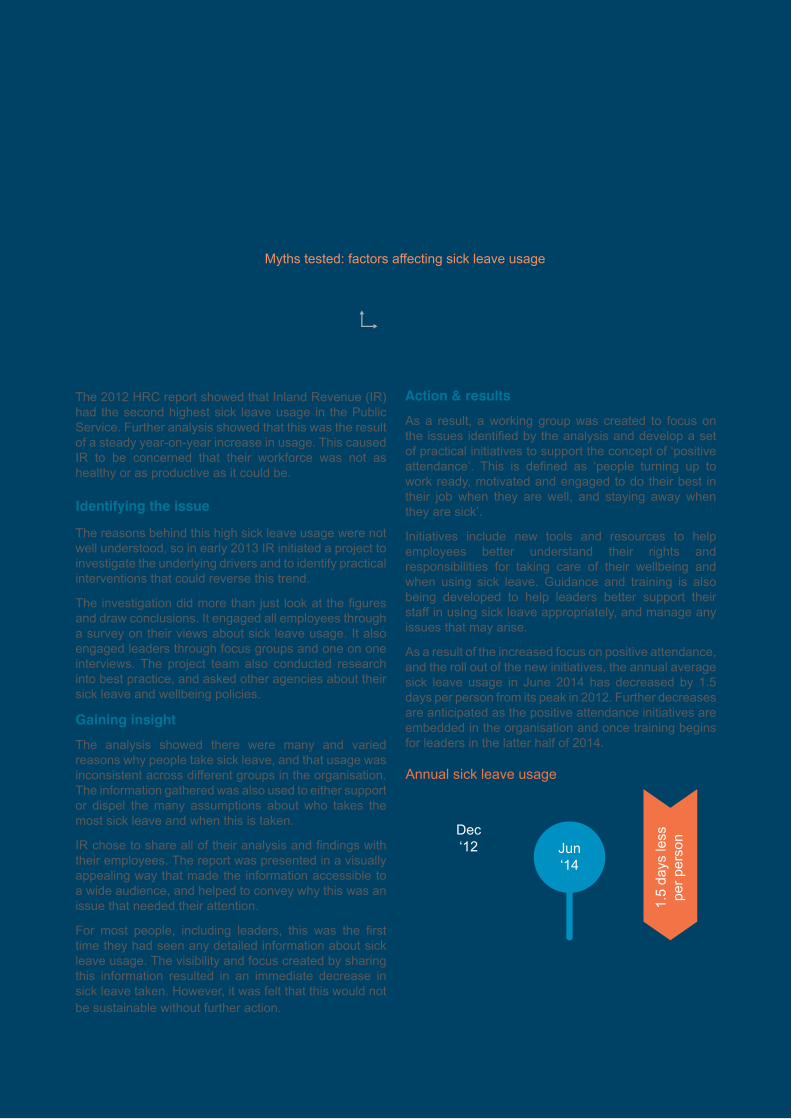
Case study: Understanding the drivers behind sick leave usage at Inland Revenue
The 2012 HRC report showed that Inland Revenue (IR) had the second highest sick leave usage in the Public Service. Further analysis showed that this was the result of a steady year-on-year increase in usage. This caused IR to be concerned that their workforce was not as healthy or as productive as it could be.
Identifying the issue
The reasons behind this high sick leave usage were not well understood, so in early 2013 IR initiated a project to investigate the underlying drivers and to identify practical interventions that could reverse this trend.
The investigation did more than just look at the figures and draw conclusions. It engaged all employees through a survey on their views about sick leave usage. It also engaged leaders through focus groups and one on one interviews. The project team also conducted research into best practice, and asked other agencies about their sick leave and wellbeing policies.
Gaining insight
The analysis showed there were many and varied reasons why people take sick leave, and that usage was inconsistent across different groups in the organisation. The information gathered was also used to either support or dispel the many assumptions about who takes the most sick leave and when this is taken.
IR chose to share all of their analysis and findings with their employees. The report was presented in a visually appealing way that made the information accessible to a wide audience, and helped to convey why this was an issue that needed their attention.
For most people, including leaders, this was the first time they had seen any detailed information about sick leave usage. The visibility and focus created by sharing this information resulted in an immediate decrease in sick leave taken. However, it was felt that this would not be sustainable without further action.
Action & results
As a result, a working group was created to focus on the issues identified by the analysis and develop a set of practical initiatives to support the concept of ‘positive attendance’. This is defined as ‘people turning up to work ready, motivated and engaged to do their best in their job when they are well, and staying away when they are sick’.
Initiatives include new tools and resources to help employees better understand their rights and responsibilities for taking care of their wellbeing and when using sick leave. Guidance and training is also being developed to help leaders better support their staff in using sick leave appropriately, and manage any issues that may arise.
As a result of the increased focus on positive attendance, and the roll out of the new initiatives, the annual average sick leave usage in June 2014 has decreased by 1.5 days per person from its peak in 2012. Further decreases are anticipated as the positive attendance initiatives are embedded in the organisation and once training begins for leaders in the latter half of 2014.
Annual sick leave usage
Dec‘12 Jun
‘14
AgeHaving young kids Gender Part/full time Had flu jab Particular days
Myths tested: factors affecting sick leave usage
Human Resource Capability 31
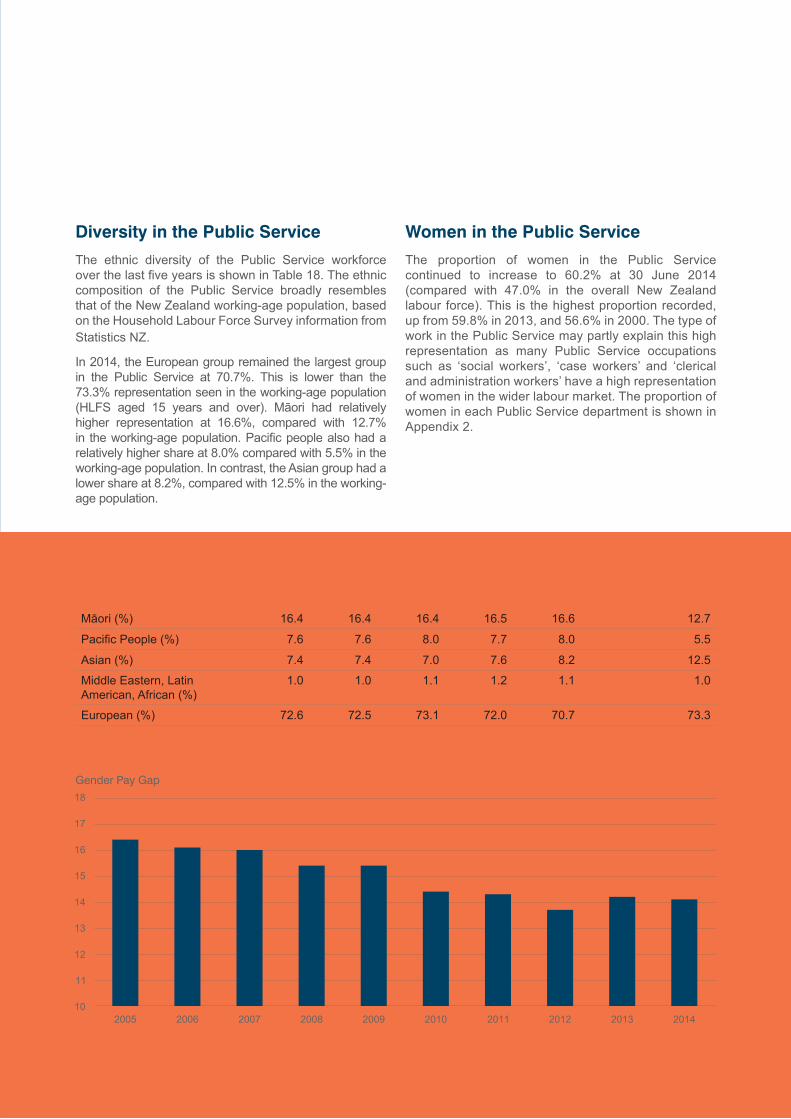
Diversity in the Public Service
The ethnic diversity of the Public Service workforce over the last five years is shown in Table 18. The ethnic composition of the Public Service broadly resembles that of the New Zealand working-age population, based on the Household Labour Force Survey information from Statistics NZ.
In 2014, the European group remained the largest group in the Public Service at 70.7%. This is lower than the 73.3% representation seen in the working-age population (HLFS aged 15 years and over). Māori had relatively higher representation at 16.6%, compared with 12.7% in the working-age population. Pacific people also had a relatively higher share at 8.0% compared with 5.5% in the working-age population. In contrast, the Asian group had a lower share at 8.2%, compared with 12.5% in the working-age population.
Women in the Public Service
The proportion of women in the Public Service continued to increase to 60.2% at 30 June 2014 (compared with 47.0% in the overall New Zealand labour force). This is the highest proportion recorded, up from 59.8% in 2013, and 56.6% in 2000. The type of work in the Public Service may partly explain this high representation as many Public Service occupations such as ‘social workers’, ‘case workers’ and ‘clerical and administration workers’ have a high representation of women in the wider labour market. The proportion of women in each Public Service department is shown in Appendix 2.
Figure 15 Unadjusted gender pay gap, June 2005-2014
Gender Pay Gap
10
11
12
13
14
15
16
17
18
2014201320122011201020092008200720062005
Table 18 Representation of ethnic groups in the Public Service, 30 June 2010-2014
2010 2011 2012 2013 2014New Zealand Working-Age Population (2014)
Māori (%) 16.4 16.4 16.4 16.5 16.6 12.7
Pacific People (%) 7.6 7.6 8.0 7.7 8.0 5.5
Asian (%) 7.4 7.4 7.0 7.6 8.2 12.5
Middle Eastern, Latin American, African (%)
1.0 1.0 1.1 1.2 1.1 1.0
European (%) 72.6 72.5 73.1 72.0 70.7 73.3
Human Resource Capability32
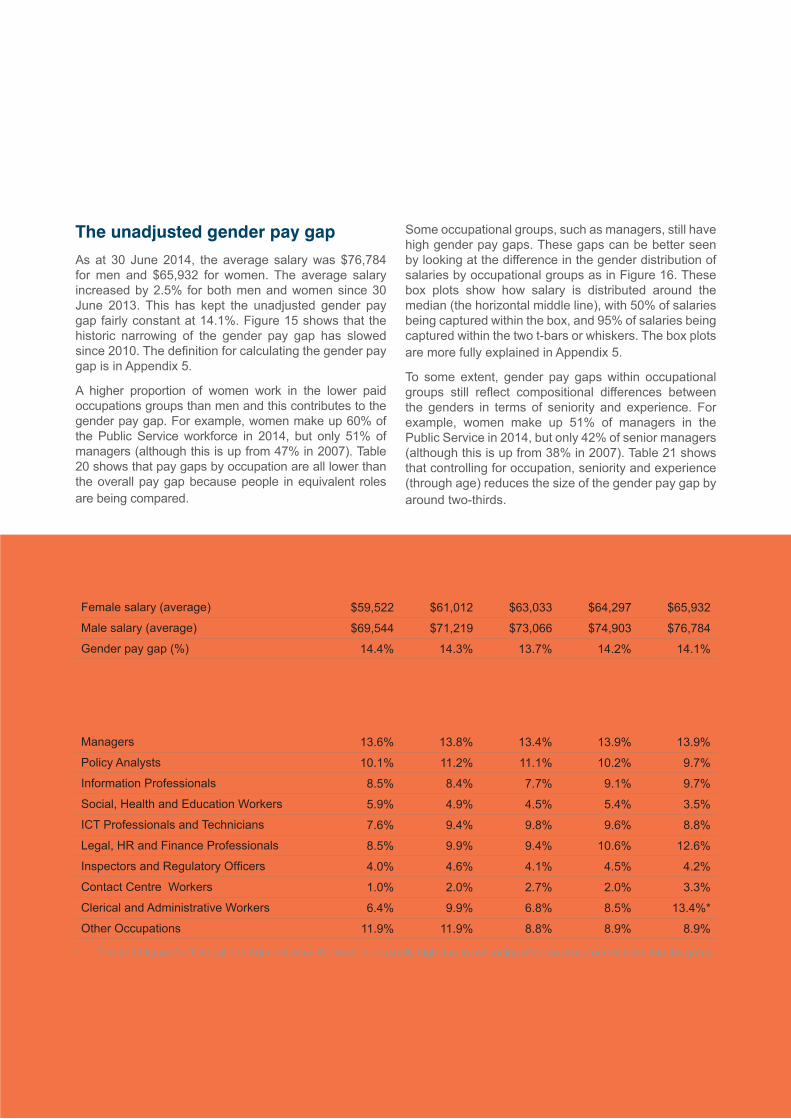
The unadjusted gender pay gap
As at 30 June 2014, the average salary was $76,784 for men and $65,932 for women. The average salary increased by 2.5% for both men and women since 30 June 2013. This has kept the unadjusted gender pay gap fairly constant at 14.1%. Figure 15 shows that the historic narrowing of the gender pay gap has slowed since 2010. The definition for calculating the gender pay gap is in Appendix 5.
A higher proportion of women work in the lower paid occupations groups than men and this contributes to the gender pay gap. For example, women make up 60% of the Public Service workforce in 2014, but only 51% of managers (although this is up from 47% in 2007). Table 20 shows that pay gaps by occupation are all lower than the overall pay gap because people in equivalent roles are being compared.
Some occupational groups, such as managers, still have high gender pay gaps. These gaps can be better seen by looking at the difference in the gender distribution of salaries by occupational groups as in Figure 16. These box plots show how salary is distributed around the median (the horizontal middle line), with 50% of salaries being captured within the box, and 95% of salaries being captured within the two t-bars or whiskers. The box plots are more fully explained in Appendix 5.
To some extent, gender pay gaps within occupational groups still reflect compositional differences between the genders in terms of seniority and experience. For example, women make up 51% of managers in the Public Service in 2014, but only 42% of senior managers (although this is up from 38% in 2007). Table 21 shows that controlling for occupation, seniority and experience (through age) reduces the size of the gender pay gap by around two-thirds.
Table 19 Average salary by gender, 30 June 2010-2014
2010 2011 2012 2013 2014
Female salary (average) $59,522 $61,012 $63,033 $64,297 $65,932
Male salary (average) $69,544 $71,219 $73,066 $74,903 $76,784
Gender pay gap (%) 14.4% 14.3% 13.7% 14.2% 14.1%
Table 20 Gender pay gaps by occupation group, 30 June 2010-2014
HRC customised occupation groups 2010 2011 2012 2013 2014
Managers 13.6% 13.8% 13.4% 13.9% 13.9%
Policy Analysts 10.1% 11.2% 11.1% 10.2% 9.7%
Information Professionals 8.5% 8.4% 7.7% 9.1% 9.7%
Social, Health and Education Workers 5.9% 4.9% 4.5% 5.4% 3.5%
ICT Professionals and Technicians 7.6% 9.4% 9.8% 9.6% 8.8%
Legal, HR and Finance Professionals 8.5% 9.9% 9.4% 10.6% 12.6%
Inspectors and Regulatory Officers 4.0% 4.6% 4.1% 4.5% 4.2%
Contact Centre Workers 1.0% 2.0% 2.7% 2.0% 3.3%
Clerical and Administrative Workers 6.4% 9.9% 6.8% 8.5% 13.4%*
Other Occupations 11.9% 11.9% 8.8% 8.9% 8.9%
* The 2014 figure for ‘Clerical and Administrative Workers’ is unusually high due to miscoding of some procurement roles into the group.
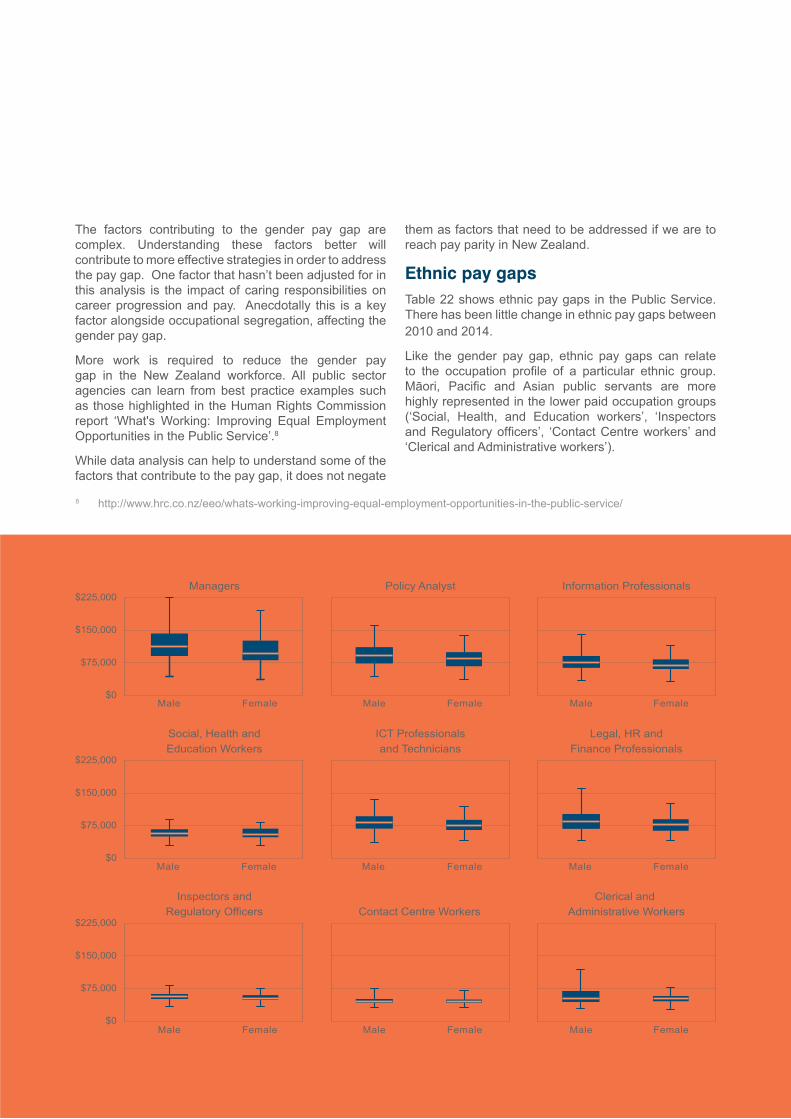
Human Resource Capability 33
The factors contributing to the gender pay gap are complex. Understanding these factors better will contribute to more effective strategies in order to address the pay gap. One factor that hasn’t been adjusted for in this analysis is the impact of caring responsibilities on career progression and pay. Anecdotally this is a key factor alongside occupational segregation, affecting the gender pay gap.
More work is required to reduce the gender pay gap in the New Zealand workforce. All public sector agencies can learn from best practice examples such as those highlighted in the Human Rights Commission report ‘What's Working: Improving Equal Employment Opportunities in the Public Service’.8
While data analysis can help to understand some of the factors that contribute to the pay gap, it does not negate
them as factors that need to be addressed if we are to reach pay parity in New Zealand.
Ethnic pay gapsTable 22 shows ethnic pay gaps in the Public Service. There has been little change in ethnic pay gaps between 2010 and 2014.
Like the gender pay gap, ethnic pay gaps can relate to the occupation profile of a particular ethnic group. Māori, Pacific and Asian public servants are more highly represented in the lower paid occupation groups (‘Social, Health, and Education workers’, ‘Inspectors and Regulatory officers’, ‘Contact Centre workers’ and ‘Clerical and Administrative workers’).
8 http://www.hrc.co.nz/eeo/whats-working-improving-equal-employment-opportunities-in-the-public-service/
Figure 16 Gender salary box plots by occupational group, June 2014
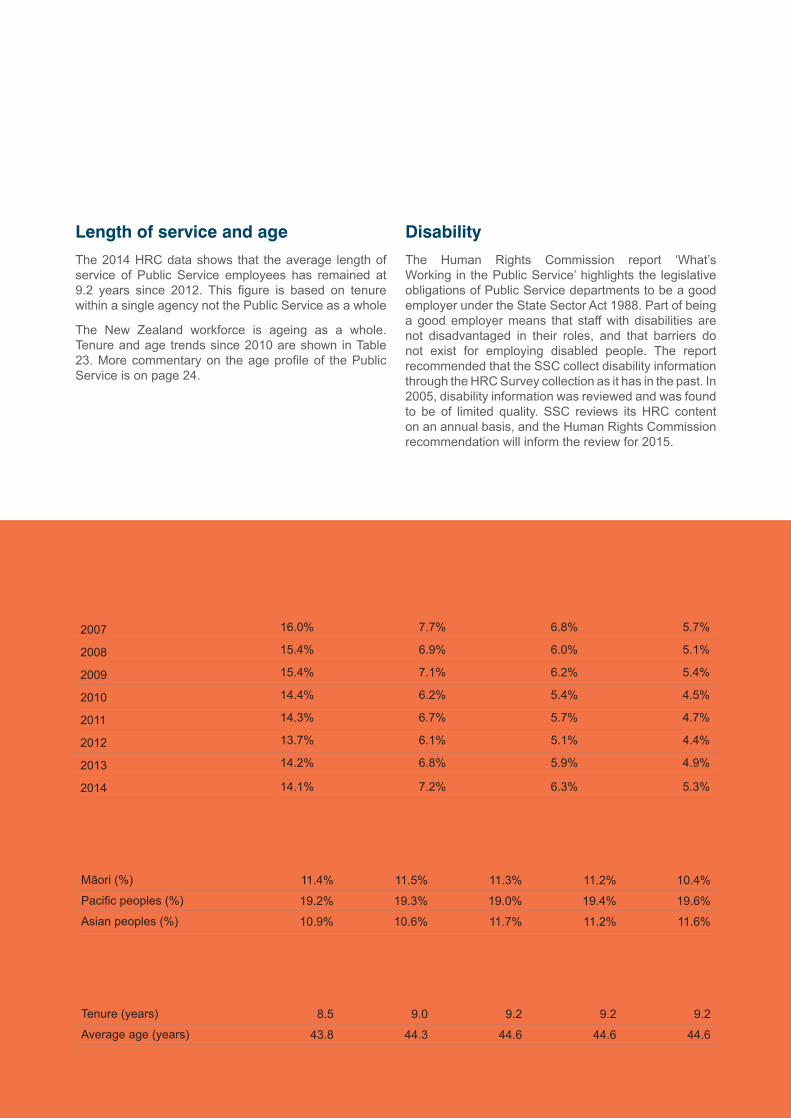
Human Resource Capability34
Length of service and age
The 2014 HRC data shows that the average length of service of Public Service employees has remained at 9.2 years since 2012. This figure is based on tenure within a single agency not the Public Service as a whole
The New Zealand workforce is ageing as a whole. Tenure and age trends since 2010 are shown in Table 23. More commentary on the age profile of the Public Service is on page 24.
Disability
The Human Rights Commission report ‘What’s Working in the Public Service’ highlights the legislative obligations of Public Service departments to be a good employer under the State Sector Act 1988. Part of being a good employer means that staff with disabilities are not disadvantaged in their roles, and that barriers do not exist for employing disabled people. The report recommended that the SSC collect disability information through the HRC Survey collection as it has in the past. In 2005, disability information was reviewed and was found to be of limited quality. SSC reviews its HRC content on an annual basis, and the Human Rights Commission recommendation will inform the review for 2015.
Table 21 Gender pay gaps adjusted for compositional differences, 30 June 2007-2014
Year
Unadjusted Adjusted for:
Raw gender pay gap OccupationOccupation &
seniority*Occupation, seniority*
& age
2007 16.0% 7.7% 6.8% 5.7%
2008 15.4% 6.9% 6.0% 5.1%
2009 15.4% 7.1% 6.2% 5.4%
2010 14.4% 6.2% 5.4% 4.5%
2011 14.3% 6.7% 5.7% 4.7%
2012 13.7% 6.1% 5.1% 4.4%
2013 14.2% 6.8% 5.9% 4.9%
2014 14.1% 7.2% 6.3% 5.3%
Table 22 Ethnic pay gaps, 30 June 2010-2014
2010 2011 2012 2013 2014
Māori (%) 11.4% 11.5% 11.3% 11.2% 10.4%
Pacific peoples (%) 19.2% 19.3% 19.0% 19.4% 19.6%
Asian peoples (%) 10.9% 10.6% 11.7% 11.2% 11.6%
Table 23 Tenure and age in the Public Service, 30 June 2010-2014
2010 2011 2012 2013 2014
Tenure (years) 8.5 9.0 9.2 9.2 9.2
Average age (years) 43.8 44.3 44.6 44.6 44.6
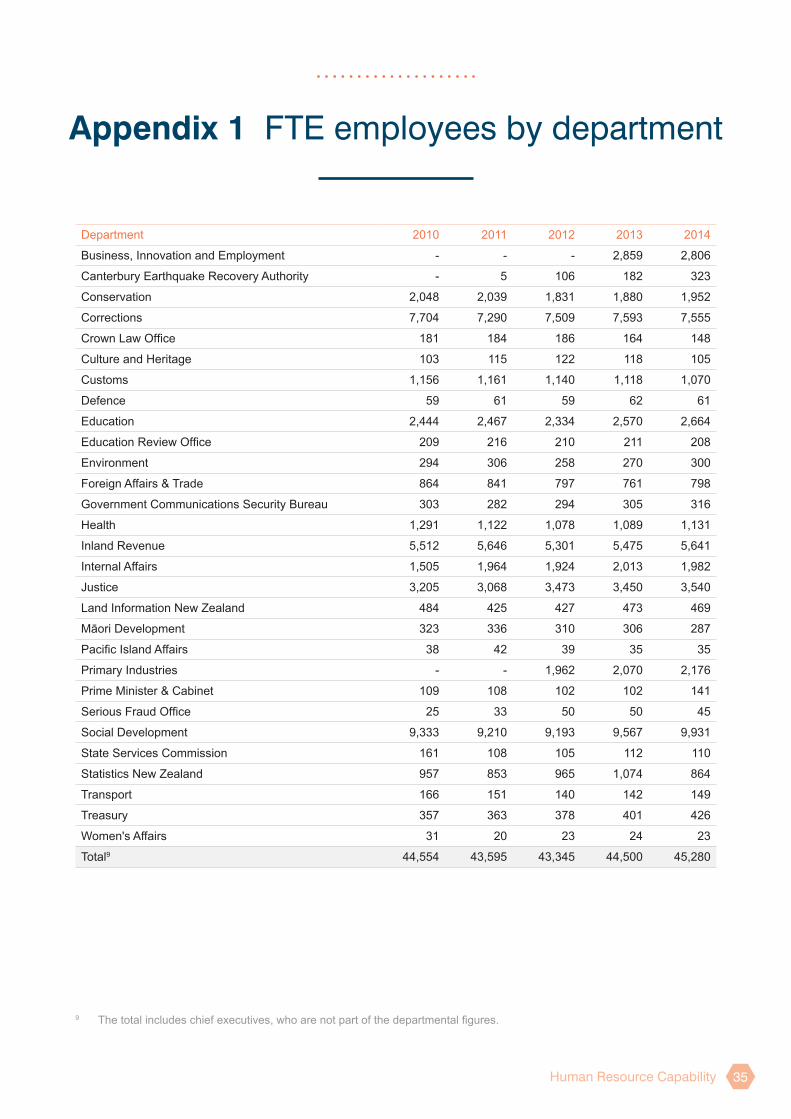
Human Resource Capability 35
Department 2010 2011 2012 2013 2014
Business, Innovation and Employment - - - 2,859 2,806
Canterbury Earthquake Recovery Authority - 5 106 182 323
Conservation 2,048 2,039 1,831 1,880 1,952
Corrections 7,704 7,290 7,509 7,593 7,555
Crown Law Office 181 184 186 164 148
Culture and Heritage 103 115 122 118 105
Customs 1,156 1,161 1,140 1,118 1,070
Defence 59 61 59 62 61
Education 2,444 2,467 2,334 2,570 2,664
Education Review Office 209 216 210 211 208
Environment 294 306 258 270 300
Foreign Affairs & Trade 864 841 797 761 798
Government Communications Security Bureau 303 282 294 305 316
Health 1,291 1,122 1,078 1,089 1,131
Inland Revenue 5,512 5,646 5,301 5,475 5,641
Internal Affairs 1,505 1,964 1,924 2,013 1,982
Justice 3,205 3,068 3,473 3,450 3,540
Land Information New Zealand 484 425 427 473 469
Māori Development 323 336 310 306 287
Pacific Island Affairs 38 42 39 35 35
Primary Industries - - 1,962 2,070 2,176
Prime Minister & Cabinet 109 108 102 102 141
Serious Fraud Office 25 33 50 50 45
Social Development 9,333 9,210 9,193 9,567 9,931
State Services Commission 161 108 105 112 110
Statistics New Zealand 957 853 965 1,074 864
Transport 166 151 140 142 149
Treasury 357 363 378 401 426
Women's Affairs 31 20 23 24 23
Total9 44,554 43,595 43,345 44,500 45,280
Appendix 1 FTE employees by department
9 The total includes chief executives, who are not part of the departmental figures.
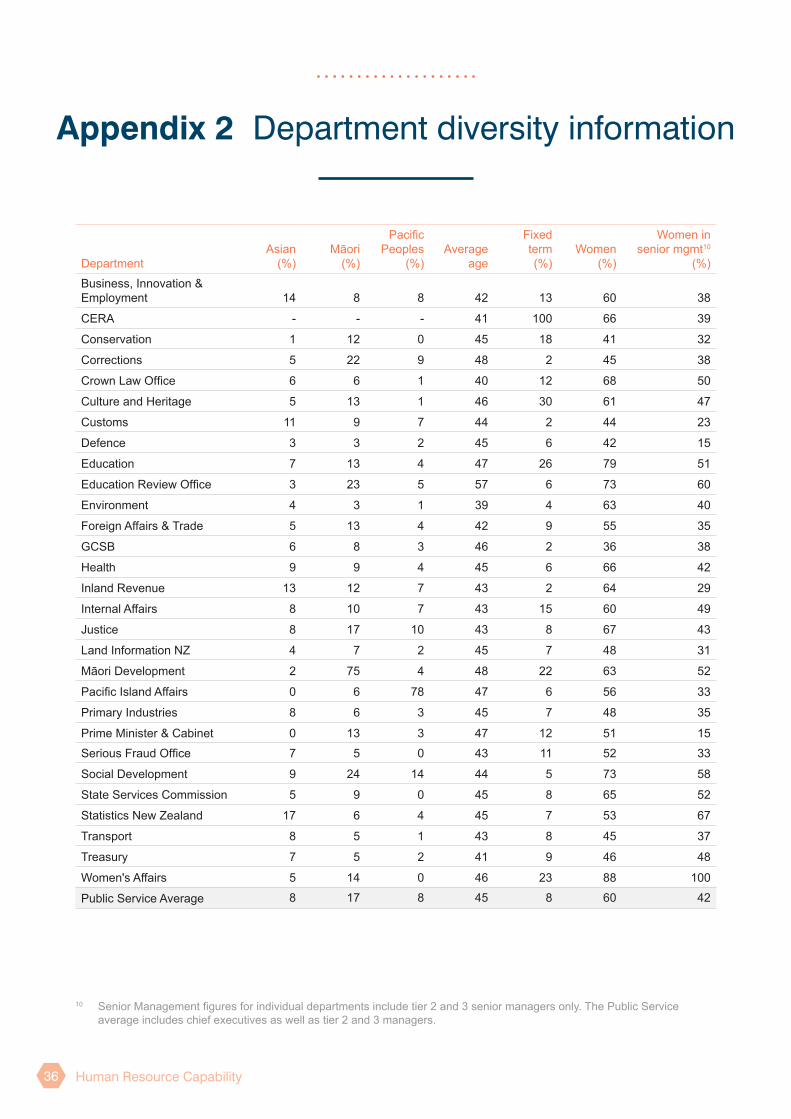
Human Resource Capability36
DepartmentAsian
(%)Māori
(%)
PacificPeoples
(%)Average
age
Fixed term (%)
Women (%)
Women in senior mgmt10
(%)
Business, Innovation & Employment 14 8 8 42 13 60 38
CERA - - - 41 100 66 39
Conservation 1 12 0 45 18 41 32
Corrections 5 22 9 48 2 45 38
Crown Law Office 6 6 1 40 12 68 50
Culture and Heritage 5 13 1 46 30 61 47
Customs 11 9 7 44 2 44 23
Defence 3 3 2 45 6 42 15
Education 7 13 4 47 26 79 51
Education Review Office 3 23 5 57 6 73 60
Environment 4 3 1 39 4 63 40
Foreign Affairs & Trade 5 13 4 42 9 55 35
GCSB 6 8 3 46 2 36 38
Health 9 9 4 45 6 66 42
Inland Revenue 13 12 7 43 2 64 29
Internal Affairs 8 10 7 43 15 60 49
Justice 8 17 10 43 8 67 43
Land Information NZ 4 7 2 45 7 48 31
Māori Development 2 75 4 48 22 63 52
Pacific Island Affairs 0 6 78 47 6 56 33
Primary Industries 8 6 3 45 7 48 35
Prime Minister & Cabinet 0 13 3 47 12 51 15
Serious Fraud Office 7 5 0 43 11 52 33
Social Development 9 24 14 44 5 73 58
State Services Commission 5 9 0 45 8 65 52
Statistics New Zealand 17 6 4 45 7 53 67
Transport 8 5 1 43 8 45 37
Treasury 7 5 2 41 9 46 48
Women's Affairs 5 14 0 46 23 88 100
Public Service Average 8 17 8 45 8 60 42
Appendix 2 Department diversity information
10 Senior Management figures for individual departments include tier 2 and 3 senior managers only. The Public Service average includes chief executives as well as tier 2 and 3 managers.
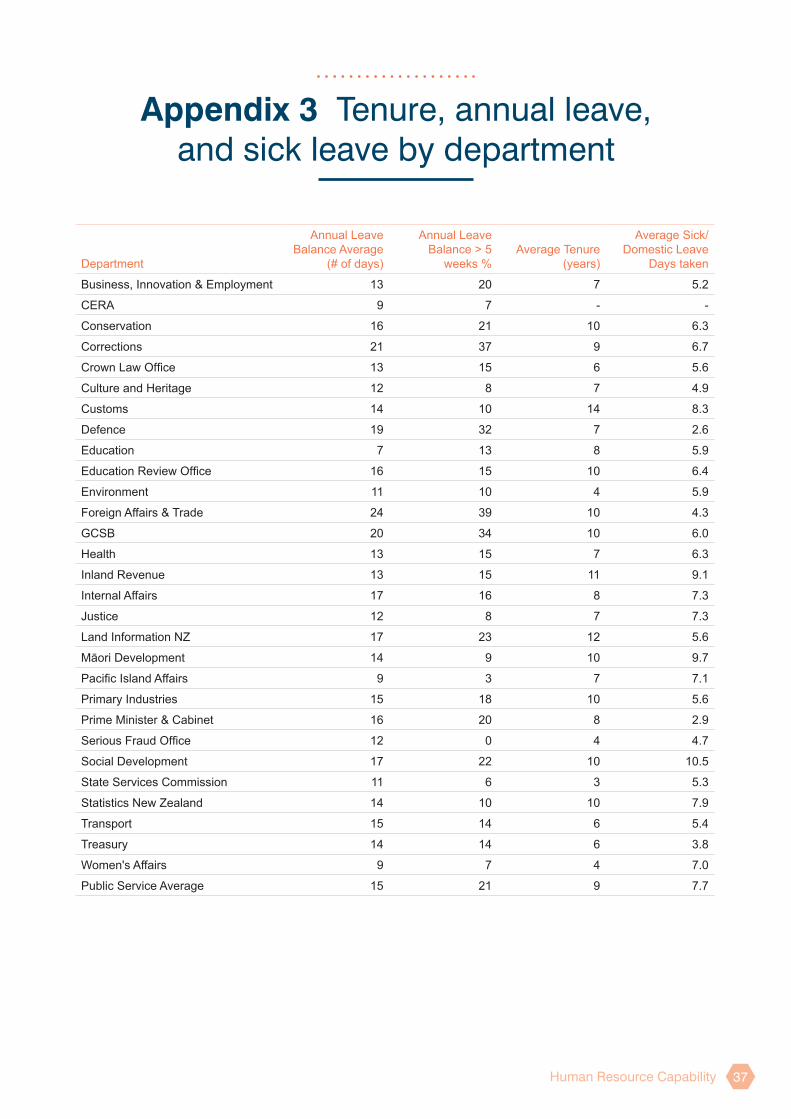
Human Resource Capability 37
Department
Annual Leave Balance Average
(# of days)
Annual Leave Balance > 5
weeks %Average Tenure
(years)
Average Sick/Domestic Leave
Days taken
Business, Innovation & Employment 13 20 7 5.2
CERA 9 7 - -
Conservation 16 21 10 6.3
Corrections 21 37 9 6.7
Crown Law Office 13 15 6 5.6
Culture and Heritage 12 8 7 4.9
Customs 14 10 14 8.3
Defence 19 32 7 2.6
Education 7 13 8 5.9
Education Review Office 16 15 10 6.4
Environment 11 10 4 5.9
Foreign Affairs & Trade 24 39 10 4.3
GCSB 20 34 10 6.0
Health 13 15 7 6.3
Inland Revenue 13 15 11 9.1
Internal Affairs 17 16 8 7.3
Justice 12 8 7 7.3
Land Information NZ 17 23 12 5.6
Māori Development 14 9 10 9.7
Pacific Island Affairs 9 3 7 7.1
Primary Industries 15 18 10 5.6
Prime Minister & Cabinet 16 20 8 2.9
Serious Fraud Office 12 0 4 4.7
Social Development 17 22 10 10.5
State Services Commission 11 6 3 5.3
Statistics New Zealand 14 10 10 7.9
Transport 15 14 6 5.4
Treasury 14 14 6 3.8
Women's Affairs 9 7 4 7.0
Public Service Average 15 21 9 7.7
Appendix 3 Tenure, annual leave, and sick leave by department
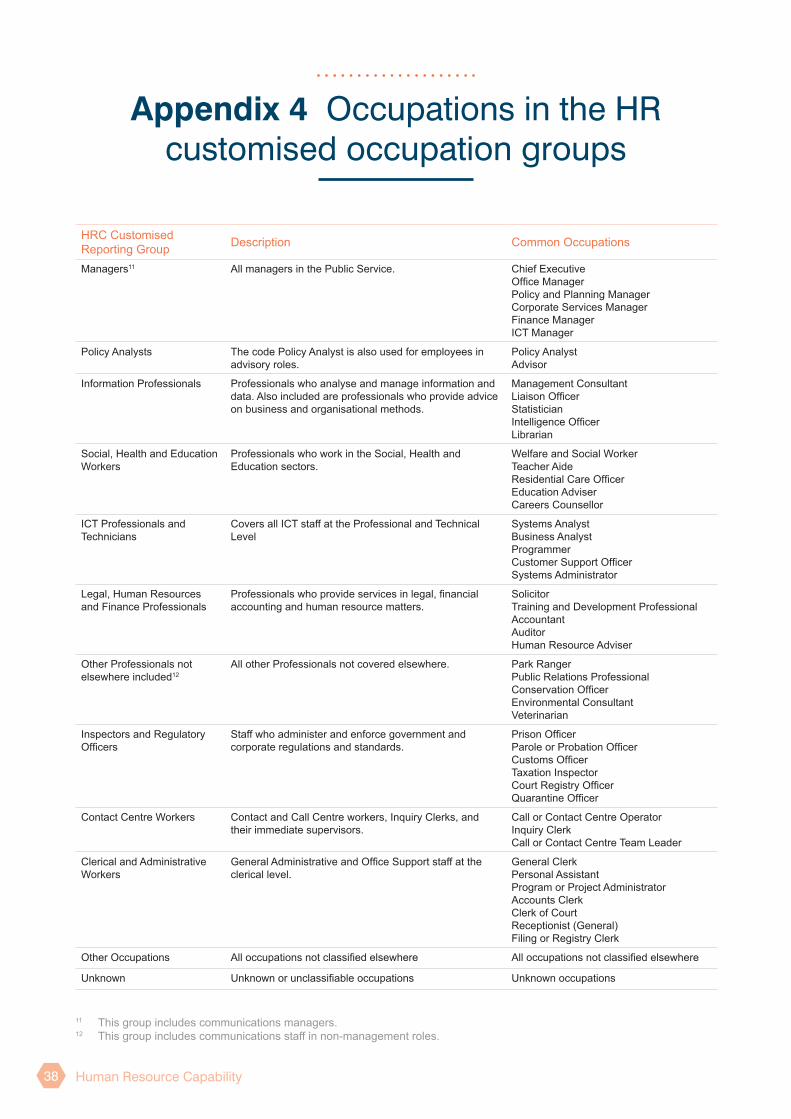
Human Resource Capability38
HRC Customised Reporting Group Description Common Occupations
Managers11 All managers in the Public Service. Chief Executive Office Manager Policy and Planning Manager Corporate Services Manager Finance Manager ICT Manager
Policy Analysts The code Policy Analyst is also used for employees in advisory roles.
Policy Analyst Advisor
Information Professionals Professionals who analyse and manage information and data. Also included are professionals who provide advice on business and organisational methods.
Management Consultant Liaison Officer Statistician Intelligence Officer Librarian
Social, Health and Education Workers
Professionals who work in the Social, Health and Education sectors.
Welfare and Social Worker Teacher Aide Residential Care Officer Education Adviser Careers Counsellor
ICT Professionals and Technicians
Covers all ICT staff at the Professional and Technical Level
Systems Analyst Business Analyst Programmer Customer Support Officer Systems Administrator
Legal, Human Resources and Finance Professionals
Professionals who provide services in legal, financial accounting and human resource matters.
Solicitor Training and Development Professional Accountant Auditor Human Resource Adviser
Other Professionals not elsewhere included12
All other Professionals not covered elsewhere. Park Ranger Public Relations Professional Conservation Officer Environmental Consultant Veterinarian
Inspectors and Regulatory Officers
Staff who administer and enforce government and corporate regulations and standards.
Prison Officer Parole or Probation Officer Customs Officer Taxation Inspector Court Registry Officer Quarantine Officer
Contact Centre Workers Contact and Call Centre workers, Inquiry Clerks, and their immediate supervisors.
Call or Contact Centre Operator Inquiry Clerk Call or Contact Centre Team Leader
Clerical and Administrative Workers
General Administrative and Office Support staff at the clerical level.
General Clerk Personal Assistant Program or Project Administrator Accounts Clerk Clerk of Court Receptionist (General) Filing or Registry Clerk
Other Occupations All occupations not classified elsewhere All occupations not classified elsewhere
Unknown Unknown or unclassifiable occupations Unknown occupations
Appendix 4 Occupations in the HR customised occupation groups
11 This group includes communications managers.12 This group includes communications staff in non-management roles.

Human Resource Capability 39
Box Plots
Box plots are used in this report to graphically represent the distribution of salaries. The line in the middle of the box is the median salary. Half of employees have a salary greater than the median and half have a salary of less than the median. Median salary is less affected by extreme values than mean (or average) salary.
The bottom of the box indicates the 25th percentile. Twenty-five percent of employees have salaries below the 25th percentile. The top of the box represents the 75th percentile. Twenty-five percent of employees have salaries above the 75th percentile. This means that 50% of employees earn salaries within the range of the box.
Around 95% of employee salaries lie between the range of the two t-bars, or whiskers. The 5% of salaries that lie outside this range (i.e. the outliers or extreme values) have been removed.
Core Government Administration
Core Government Administration refers to:
• all Public Service departments (excluding the Corrections Services section of the Department of Corrections, and the Child, Youth and Family, and Work and Income sections of the Ministry of Social Development)
• five selected Crown entities: Housing New Zealand Corporation; New Zealand Qualifications Authority; New Zealand Transport Agency; New Zealand Trade and Enterprise; and Tertiary Education Commission.
Core Government Administration excludes:
• the Corrections Services section of the Department of Corrections
• the Child, Youth and Family, and Work and Income sections of the Ministry of Social Development
• Crown entities (apart from the five noted above)
• non Public Service departments (New Zealand Defence Force, New Zealand Police, Parliamentary Service, New Zealand Security Intelligence Service, Office of the Clerk, Parliamentary Counsel Office).
State services
The State services comprises the agencies that operate as instruments of the Crown in respect of the Government of New Zealand (i.e. the Executive Branch of Government). This includes the Public Service, most
Crown entities, the Reserve Bank, a range of agencies listed on the 4th Schedule of the Public Finance Act 1989, companies listed on Schedule 4A of the Public Finance Act, and a small number of departments that are not part of the Public Service.
Public Service
Public Service departments are defined in section 27 of the State Sector Act 1988 as comprising the departments specified in Schedule 1 of the State Sector Act. As at 30 June 2014 there were 29 Public Service departments.
Core Crown
A reporting segment consisting of departments, Offices of Parliament, the NZS Fund and the Reserve Bank of New Zealand.
Total Crown
Includes the core Crown (defined above) plus Crown entities and State owned Enterprises.
Full Time Equivalent (FTE)
Each employee is assigned a FTE value between 0 and 1 depending on the proportion of full-time hours (however defined by each department) worked. For example, an employee working full-time equals 1 FTE while an employee working 60% of full time hours equals 0.6 of an FTE. The FTE values of all employees are added up to give the total number of FTE employees in an organisation.
Turnover
Turnover rates for the Public Service are derived from the exits from departments. As a result, turnover includes movements between departments and so the actual level of ‘loss’ to the Public Service is below the figures reported in this report. Three turnover measures are used:
• Core unplanned turnover primarily due to resignations of open-term employees, but also includes retirements, dismissals, and death.
• Planned turnover includes cessations of staff on fixed term employment agreements and cessations due to restructuring.
• Gross turnover includes both core unplanned and planned turnover.
Appendix 5 Definitions
Human Resource Capability40
More information on how turnover is calculated can be found at http://www.ssc.govt.nz/hrc-survey-materials.
Gender pay gap
The gender pay gap is defined as the difference between the average salary for women and the average salary for men, and is expressed as a percentage of the average salary for men.
Ethnic pay gap
Ethnic pay gaps are defined as the difference between the average salary for an ethnic group and the average salary of those not in that ethnic group, and are expressed as a percentage of the average salary of those not in the ethnic group.