human subjective response to steering wheel vibration caused by … · 2015-04-23 · 1 human...
TRANSCRIPT
1
Human subjective response to steering wheel vibrationcaused by diesel engine idleM Ajovalasit and J Giacomin*Department of Mechanical Engineering, The University of Sheffield, Sheffield, UK
The manuscript was received on 12 February 2004 and was accepted after revision for publication on 15 October 2004.
DOI: 10.1243/095440705X11167
Abstract: This study investigated the human subjective response to steering wheel vibration of thetype caused by a four-cylinder diesel engine idle in passenger cars. Vibrotactile perception was assessedusing sinusoidal amplitude-modulated vibratory stimuli of constant energy level (r.m.s. acceleration,0.41 m/s2) having a carrier frequency of 26 Hz (i.e. engine firing frequency) and modulation frequencyof 6.5 Hz (half-order engine harmonic). Evaluations of seven levels of modulation depth parameter m(0.0, 0.1, 0.2, 0.4, 0.6, 0.8, and 1.0) were performed in order to define the growth function of humanperceived disturbance as a function of amplitude modulation depth. Two semantic descriptors wereused (unpleasantness and roughness) and two test methods (the Thurstone paired-comparisonmethod and the Borg CR-10 direct evaluation scale) for a total of four tests. Each test was performedusing an independent group of 25 individuals. The results suggest that there is a critical value ofmodulation depth m=0.2 below which human subjects do not perceive differences in amplitudemodulation and above which the stimulus–response relationship increases monotonically with a powerfunction. The Stevens power exponents suggest that the perceived unpleasantness is non-linearlydependent on modulation depth m with an exponent greater than 1 and that the perceived roughnessis dependent with an exponent close to unity.
Keywords: vibration, engine, idle, subjective, perception, modulation
1 INTRODUCTION crankshaft revolutions. For an automobile engine thecrankshaft rotational speed when at idle is typicallyin the range from 600 to 840 r/min, correspondingAmplitude modulation is a commonly observed
phenomenon in the vibro-acoustic signatures of to linear frequencies from 10 to 15 Hz. The half-orderharmonic originating from combustion forces in themany types of mechanical system [1]. Amplitude
modulation is present in the vibration measured cylinder is therefore in the range from 5 to 7 Hz, asshown by the experimental measurements performedat the steering wheel of road vehicles at idle due to
the rotational irregularity of the engine [2–4]. For a by Dixon et al. [5].The second-order (H
2) and the other even-orderfour-cylinder four-stroke engine at idle amplitude
modulation occurs because of the action of the half- harmonics (H4, H
6, etc.) are caused instead by mech-
anical unbalance [6–8]. The reciprocating motion oforder engine harmonic on the second-order engineharmonic [5–7]. Comprehensive analytical treatment the pistons and of the connecting rods, combined
with the rotational motion of the crankshaft, generateof the spectral contents of multi-cylinder engines canbe found in reference [7]. What follows here is a brief inertial forces that act on the engine block. At low
engine speeds the combustion gas forces are greaterdescription of the four-cylinder case.The half-order harmonic of a four-cylinder four- than the mechanical inertial forces, but at high speeds
the opposite is true. In four-cylinder four-strokestroke engine arises because there is only a singleengines the first-order inertial forces are normallypower stroke occurring in each cylinder every twowell balanced since the crankshaft is balanced and
* Corresponding author: Department of Mechanical Engineering, the piston pairs move in opposite directions. VerticallyThe University of Sheffield, Mappin Street, Sheffield S1 3JD, UK. acting second-order forces and their multiples are
produced, however, because the two descendingemail: [email protected]
D03904 © IMechE 2005 Proc. IMechE. Vol. 219 Part D: J. Automobile Engineering
d000003904 15-12-04 12:06:34 Rev 14.05
The Charlesworth Group, Huddersfield 01484 517077
2 M Ajovalasit and J Giacomin
pistons in a four-cylinder engine travel further at that related modulation depth thresholds to the fre-a given crankshaft angle than the two ascending quency of modulation. MTF can be used to predictpistons since lateral movement of the connecting rods the depth of modulation necessary just to allow dis-accelerates the descending pistons while delaying crimination between a modulated and an unmodu-the ascending pistons. The centre of gravity of the lated waveform. In Weisemberger’s experiments theascending and descending masses therefore varies, modulated signal was frequently reported as feelingproducing a resultant force that varies periodically ‘rougher’ than the unmodulated signal. Lamore [15]twice per crankshaft revolution. Laterally acting found that high-frequency (1000–2000 Hz) sinusoidalsecond-order forces and their multiples also occur vibrations of the skin induced maximum sensitivitydue to the angle between the connecting rod and when amplitude modulation is applied at modu-the cylinder. Lateral gas and inertial forces vary lation frequencies between 100 and 300 Hz. Theperiodically twice per crankshaft revolution due to use of high-frequency stimuli makes this an atypicalthe change in direction of the connecting rod. For study, being outside the frequency range, up to aboutan idle speed in the range from 600 to 840 r/min, the 350 Hz [10], to which the tactile system is maximallycorresponding linear second-order linear frequencies responsive. No data regarding the human responseare from 20 to 28 Hz. to amplitude-modulated vibration of the type caused
Amplitude modulation of the form described by engine idle are available in the scientific literature.above is conveniently and compactly represented by Psychophysical methods developed for the scalingmeans of the modulation depth parameter m. This of sensory attributes such as perceived roughnessparameter is defined as the amount of change in the [16] or perceived intensity [17] can measure humanamplitude of the waveform, and which is expressed subjective response to many forms of non-metricas a proportion by (i.e. stimuli that can be arranged only on a nominal
scale) and metric stimuli. The end objective of suchtests is the establishment of some form of metricm=
Amax−AminAmax
(1)scale that describes the relationship between thephysical properties of the stimulus and the subjectiveThus an m value of 1.0 describes an amplitudecharacteristics of the human response. In manyvariation of the carrier sinusoid from zero to aapplications the relationship can be compactly sum-maximum, whereas an m value of 0.0 describes themarized by means of the well-known Stevens powerunmodulated version of the carrier signal (i.e. a purelaw that relates human response to numerous environ-sine wave). Owing to combustion irregularity anmental stimuli. The psychophysical test protocolsengine tends to run ‘rough’ and stall much morethemselves can be divided into two major classes:easily at lower idle speeds [4]. Also, anecdotal evi-those involving indirect rating of the stimuli bydence suggests that even slight fluctuations of enginemeans of paired comparisons and those in which aidle can cause unpleasant vibrations, leading totest subject directly provides an estimate of his or herlower customer satisfaction. Since smooth idle is anresponse by means of a fixed scale. Unfortunately,important vehicle attribute perceived by customersthe scientific literature provides little conclusive evi-[9], identification of an acceptance level of ampli-dence [18, 19] of the superiority of one protocol withtude modulation index m can provide valuablerespect to the other. It is therefore good practice toinformation to vehicle designers.evaluate the potential differences that can occur dueFor the human hand–arm system, considerableto the choice of psychophysical test protocol.psychophysical research has been performed to
This paper presents an investigation of the growthinvestigate how the amplitude and the frequency ofin the human subjective response to amplitude-a vibrotactile stimulus affects detection thresholdmodulated steering wheel idle vibration stimuli as[10–11] and difference threshold [12]. Results ofa function of the modulation depth m. Both anvibrotactile discrimination tests performed using twoindirect and a direct scaling method have beensuperimposed sinusoids at low frequency (10 Hz+used to assess stimuli under two sensory attributes30 Hz) [13] presented to the fingertip suggest that(unpleasantness and roughness) in order to evaluatethe tactile system utilizes a temporal code for ampli-possible differences. Psychophysical response scalestude discrimination on the basis of uniformity orwere constructed by means of the Thurstone law ofnon-uniformity of the sequences of perceived peakscomparative judgement [20], which provided anwithin stimulus cycles. Studies of temporal sensitivityindirect scaling method, and the category ratio Borgin the tactile system performed by Weisemberger
[14] defined a modulation transfer function (MTF) CR-10 scale [21], which is a direct scaling method.
D03904 © IMechE 2005Proc. IMechE. Vol. 219 Part D: J. Automobile Engineering
d000003904 15-12-04 12:06:34 Rev 14.05
The Charlesworth Group, Huddersfield 01484 517077
3Human subjective response to steering wheel vibration
2 TESTING OF HUMAN RESPONSE TO mobile. The seat, taken from a small Europeanautomobile, was fully adjustable in terms of horizontalAMPLITUDE-MODULATED STEERING WHEEL
VIBRATION STIMULI travel and backrest inclination.The test bench had a first resonance frequency of
350 Hz. When loaded by a human hand–arm system2.1 Experimental apparatusand tested using sinusoidal excitation at frequencies
A test facility for applying rotational vibration toof 4.0, 8.0, 16.0, 31.5, 63.0, 125, and 250 Hz at ampli-
a seated test subject was used in this study. Atudes of 0.2, 2.0, and 20.0 m/s2 r.m.s. the bench pro-
schematic representation of the steering wheel testvided a maximum total harmonic distortion (THD)
rig and associated data-conditioning and acquisitionof 15 per cent at 4 Hz and 20 m/s2 [22]. With both
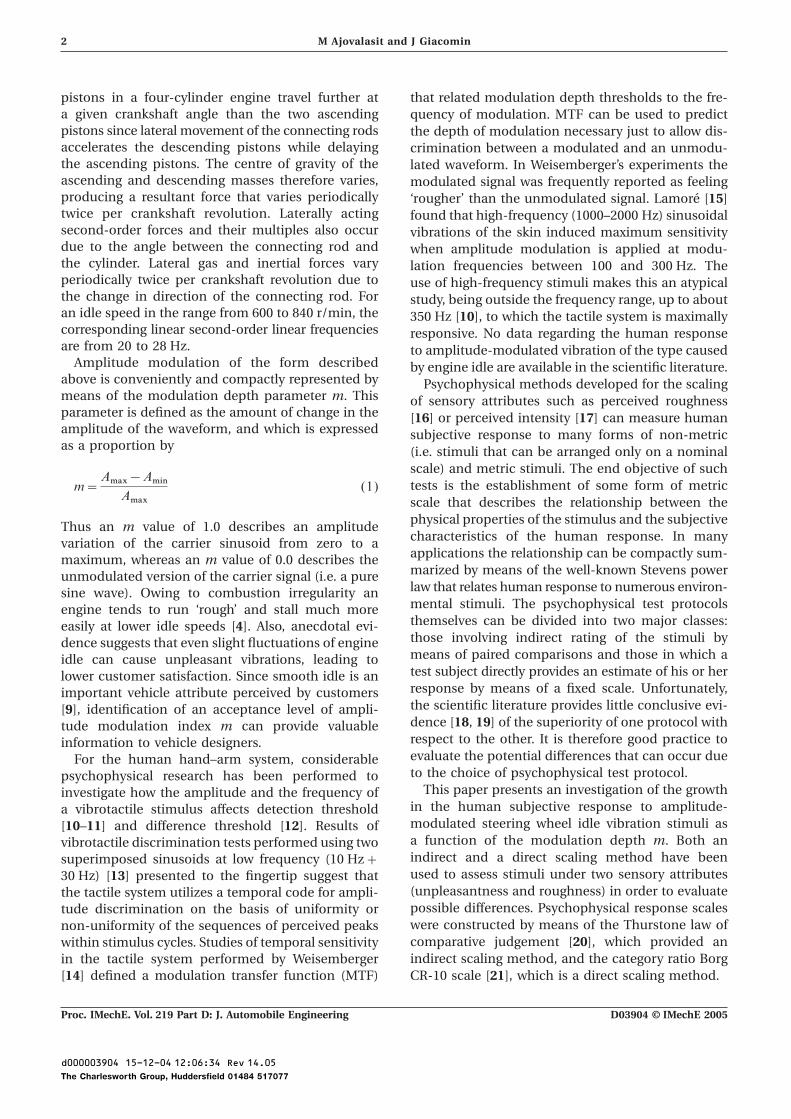
systems are shown in Fig. 1.increasing frequency and decreasing amplitude the
The rotational steering system consists of anTHD dropped to a minimum of 0.002 per cent at
aluminium wheel of 325 mm diameter connected to250 Hz and 0.2 m/s2 . During the same tests, a linear
a steel shaft which is mounted onto two high pre-fore-and-aft direction acceleration measurement
cision bearings. The shaft is connected to a G&W V20was also performed at the same point on the rigid
electrodynamic shaker and associated PA 100 powerwheel. Fore-and-aft acceleration was found to be no
amplifier by means of a steel stinger rod. Bench con-greater than −50 dB with respect to the tangential
trol and data acquisition were performed by meansacceleration in all cases measured.
of LMS Cada-X 3.5 E software and a 12-channel DifaPretesting using amplitude-modulated test stimuli
Systems Scadas III front-end unit. The accelerationshowed that the dynamic response of the test bench
obtained at the steering wheel was measured usingproduced unequal harmonic side bands due to the
an Entran EGAS-FS-25 accelerometer located onfrequency response of the shaker. Compensated
the top left side of the wheel. The acceleration wasdrive voltage signals were therefore defined which
measured in the tangential direction. The accelero-included the effect of shaker frequency response.
meter signal was amplified by means of an EntranFigure 2 presents the power spectral density (PSD) of
MSC6 signal-conditioning unit. Table 1 presents thethe target test stimuli and of the bench response
rig main geometric dimensions, which were chosensignals at a modulation depth m=1.0 for both
on the basis of data from a small European auto-the uncompensated (Fig. 2a) and the compensated(Fig. 2b) drive voltage signals. With frequency com-pensation the modulated acceleration stimuli werereproduced at the human test subject with r.m.s.errors of less than 5 per cent.
2.2 Test signals
Engine idle vibration occurring at the steering wheelof road vehicles was simulated by means of ampli-tude-modulated acceleration time histories. Sinu-soidal carriers were chosen as the best reproductionof the steering wheel idle vibration signals basedon previous research by the present authors [2].The instantaneous amplitude A(t) of a sinusoidalamplitude-modulated signal is given by
Fig. 1 Steering wheel rotational vibration test rig andassociated electronics A(t)=A0 [1+m sin(2pfmt+Q)] sin(2pfct+h) (2)
Table 1 Geometric dimensions of the steering wheel rotational vibration test rig
Geometric parameter Value
Seat H point height from floor, h1
275 mmHorizontal distance adjustable from H point to steering wheel hub centre, d 390–550 mmSteering wheel hub centre height above floor, h
2710 mm
Steering column angle with respect to floor 23°Steering wheel handle diameter 12.5 mmSteering wheel diameter 325 mm
D03904 © IMechE 2005 Proc. IMechE. Vol. 219 Part D: J. Automobile Engineering
d000003904 15-12-04 12:06:34 Rev 14.05
The Charlesworth Group, Huddersfield 01484 517077

4 M Ajovalasit and J Giacomin
Fig. 2 Test signals: (a) comparison between target and bench response acceleration beforecompensation; (b) comparison between target and bench response acceleration aftercompensation
where A0
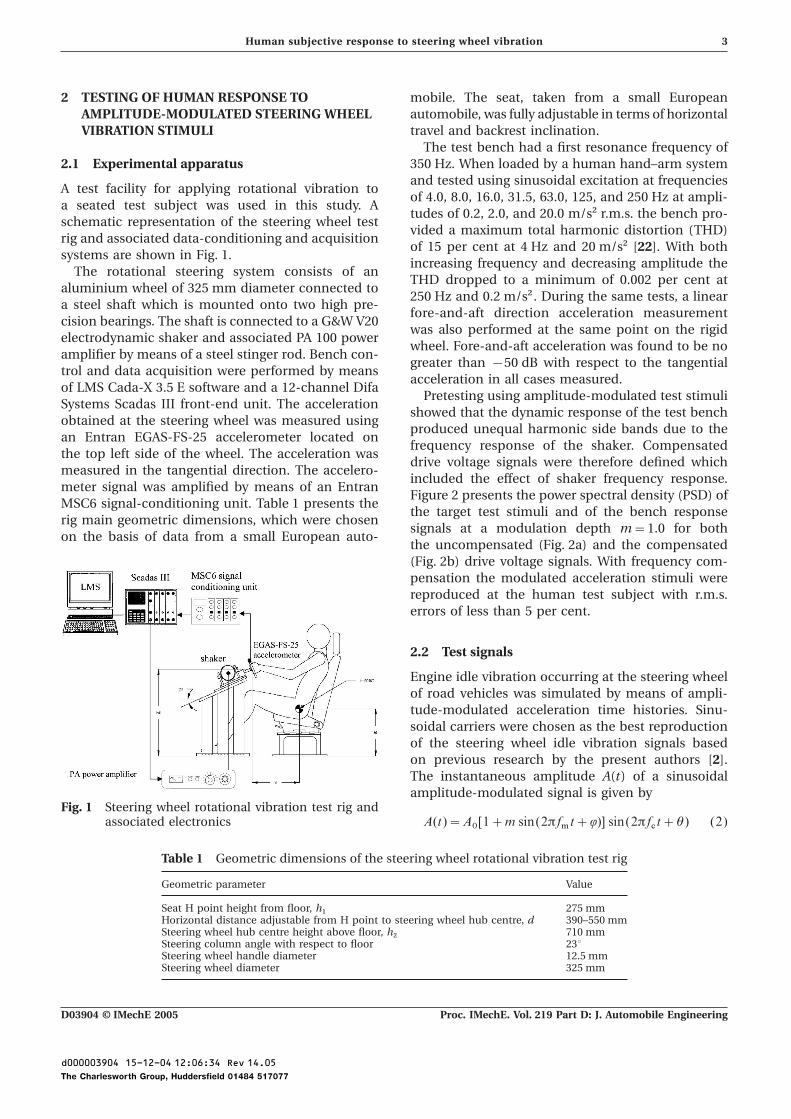
is the amplitude of the carrier signal, m is For a four-cylinder four-stroke diesel engine idleat 780 r/min [2] the firing frequency harmonic ofthe modulation depth, f
mis the modulation frequency,
fc
is the carrier frequency, t is a time increment, 26 Hz can be considered as the carrier frequency fc
and a half-order of 6.5 Hz can be considered asand Q and h are the phases of the modulating andcarrier signals respectively. In all the experiments the modulation frequency f
m. Figure 3 presents two
steering wheel idle vibration signatures measuredpresented here the phases of both the carrier and themodulating waves were chosen to be equal to zero for along the vertical (z) direction in terms of both the
time history and its relative PSD for two different fuelsimplicity (Q=0 and h=0). The frequency spectrumof the amplitude modulated waveform described by conditions. The spectra, obtained using a Hanning
window and a frequency resolution of 0.5 Hz, illus-equation (2) consists of a component at the carrierfrequency, and modulation components (side bands) trate how the energy conveyed to the steering wheel
normally covers only the low-frequency range up tothat are above and below the carrier.
Fig. 3 Steering wheel idle vibration signature along the vertical (z) axis for the weakly modulatedcondition [(a) time history and (b) its relative PSD] and the strongly modulated condition[(c) time history and (d) its relative PSD]
D03904 © IMechE 2005Proc. IMechE. Vol. 219 Part D: J. Automobile Engineering
d000003904 15-12-04 12:06:34 Rev 14.05
The Charlesworth Group, Huddersfield 01484 517077
5Human subjective response to steering wheel vibration
200 Hz. The second harmonic H2
(at about 26 Hz) vibration in the range 2–60 Hz there may be nofurther increase in discomfort sensation for stimuliand its modulation side bands can be seen to be
prominent as expected for a four-cylinder four- durations greater than approximately 2 s.In addition to the r.m.s. acceleration, the vibrationstroke engine [5–7]. With respect to similar measure-
ments performed at the engine itself, the even-order dose value (VDV) was also calculated for all theseven signals by integrating the fourth power ofharmonics H
4(52 Hz), H
6(78 Hz), and higher orders
are attenuated in the path through the mechanical the acceleration A(t) of equation (2) as defined inBS 6841 [26] and this is given bycomponent of steering system. Test results from a
fuel having a higher cetane number (52.9) are pre-sented in Figs 3a and b while results from a fuel VDV=CP T
0A4(t) dtD1/4 (4)
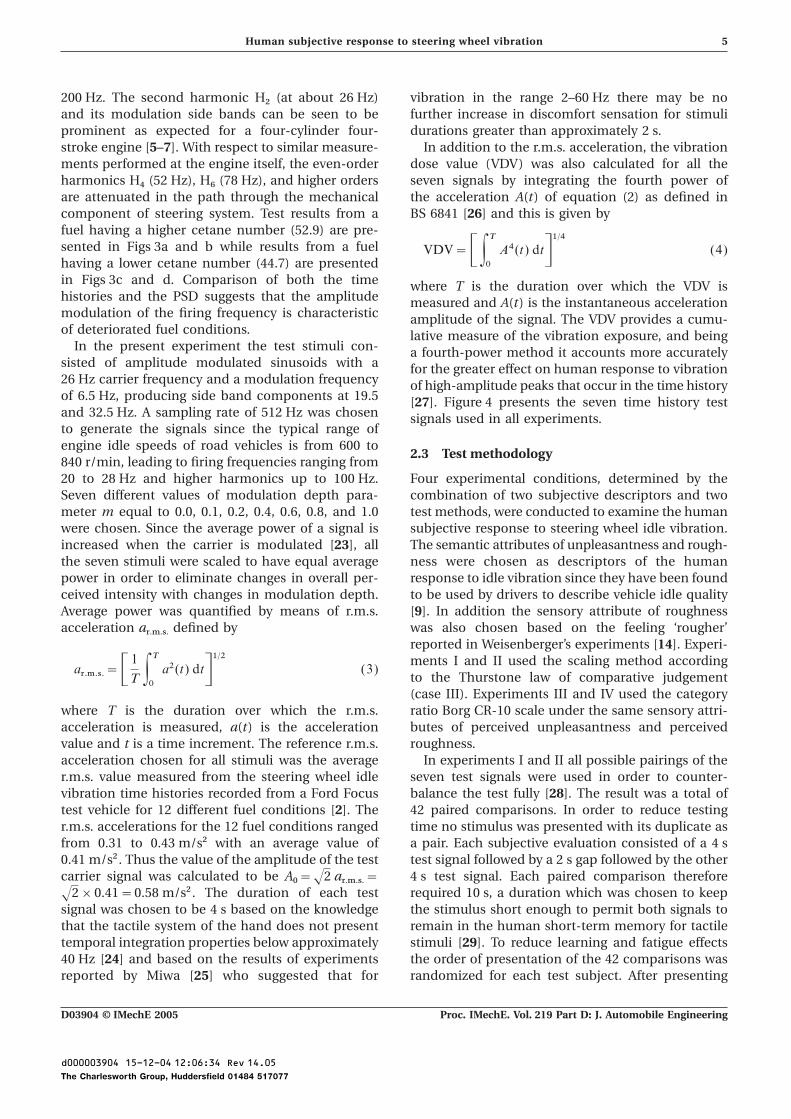
having a lower cetane number (44.7) are presentedin Figs 3c and d. Comparison of both the time where T is the duration over which the VDV ishistories and the PSD suggests that the amplitude measured and A(t) is the instantaneous accelerationmodulation of the firing frequency is characteristic amplitude of the signal. The VDV provides a cumu-of deteriorated fuel conditions. lative measure of the vibration exposure, and being
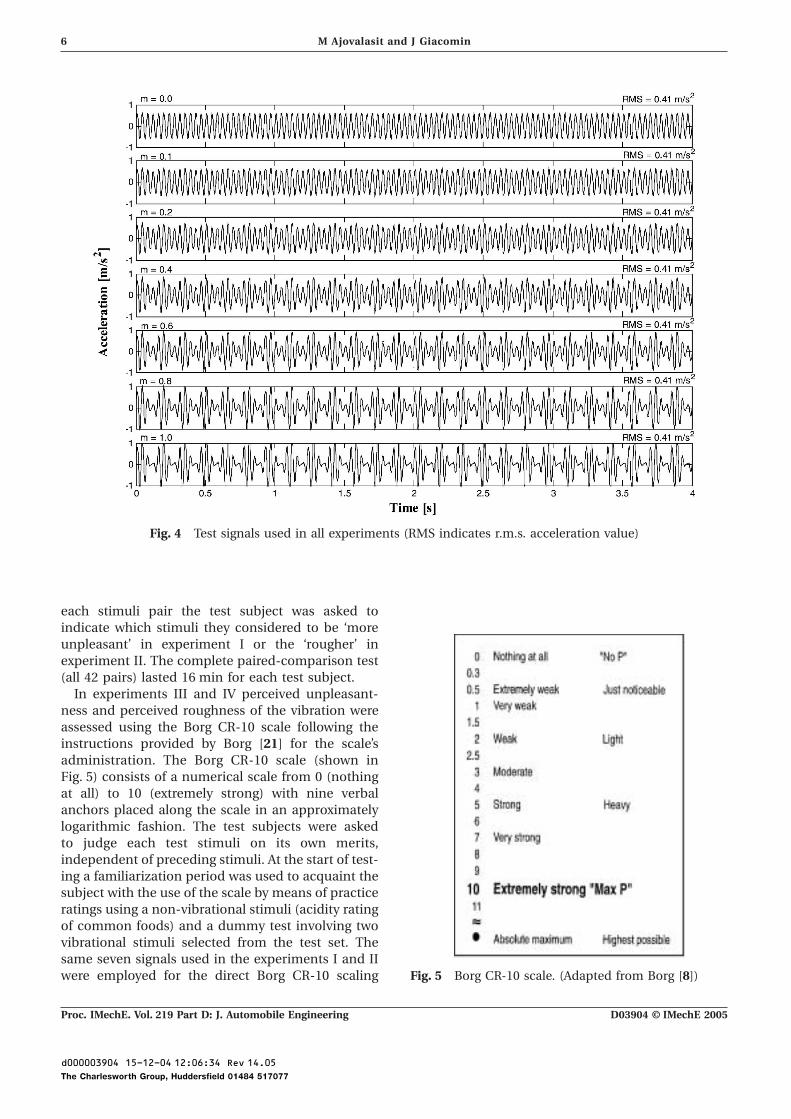
In the present experiment the test stimuli con- a fourth-power method it accounts more accuratelysisted of amplitude modulated sinusoids with a for the greater effect on human response to vibration26 Hz carrier frequency and a modulation frequency of high-amplitude peaks that occur in the time historyof 6.5 Hz, producing side band components at 19.5 [27]. Figure 4 presents the seven time history testand 32.5 Hz. A sampling rate of 512 Hz was chosen signals used in all experiments.to generate the signals since the typical range ofengine idle speeds of road vehicles is from 600 to
2.3 Test methodology840 r/min, leading to firing frequencies ranging from20 to 28 Hz and higher harmonics up to 100 Hz. Four experimental conditions, determined by the
combination of two subjective descriptors and twoSeven different values of modulation depth para-meter m equal to 0.0, 0.1, 0.2, 0.4, 0.6, 0.8, and 1.0 test methods, were conducted to examine the human
subjective response to steering wheel idle vibration.were chosen. Since the average power of a signal isincreased when the carrier is modulated [23], all The semantic attributes of unpleasantness and rough-
ness were chosen as descriptors of the humanthe seven stimuli were scaled to have equal averagepower in order to eliminate changes in overall per- response to idle vibration since they have been found
to be used by drivers to describe vehicle idle qualityceived intensity with changes in modulation depth.Average power was quantified by means of r.m.s. [9]. In addition the sensory attribute of roughness
was also chosen based on the feeling ‘rougher’acceleration ar.m.s.
defined byreported in Weisenberger’s experiments [14]. Experi-ments I and II used the scaling method according
ar.m.s.=C 1T P T0
a2(t) dtD1/2 (3)to the Thurstone law of comparative judgement(case III). Experiments III and IV used the categoryratio Borg CR-10 scale under the same sensory attri-where T is the duration over which the r.m.s.
acceleration is measured, a(t) is the acceleration butes of perceived unpleasantness and perceivedroughness.value and t is a time increment. The reference r.m.s.
acceleration chosen for all stimuli was the average In experiments I and II all possible pairings of theseven test signals were used in order to counter-r.m.s. value measured from the steering wheel idle
vibration time histories recorded from a Ford Focus balance the test fully [28]. The result was a total of42 paired comparisons. In order to reduce testingtest vehicle for 12 different fuel conditions [2]. The
r.m.s. accelerations for the 12 fuel conditions ranged time no stimulus was presented with its duplicate asa pair. Each subjective evaluation consisted of a 4 sfrom 0.31 to 0.43 m/s2 with an average value of
0.41 m/s2 . Thus the value of the amplitude of the test test signal followed by a 2 s gap followed by the other4 s test signal. Each paired comparison thereforecarrier signal was calculated to be A
0=√2 a
r.m.s.=
√2×0.41=0.58 m/s2 . The duration of each test required 10 s, a duration which was chosen to keepthe stimulus short enough to permit both signals tosignal was chosen to be 4 s based on the knowledge
that the tactile system of the hand does not present remain in the human short-term memory for tactilestimuli [29]. To reduce learning and fatigue effectstemporal integration properties below approximately
40 Hz [24] and based on the results of experiments the order of presentation of the 42 comparisons wasrandomized for each test subject. After presentingreported by Miwa [25] who suggested that for
D03904 © IMechE 2005 Proc. IMechE. Vol. 219 Part D: J. Automobile Engineering
d000003904 15-12-04 12:06:34 Rev 14.05
The Charlesworth Group, Huddersfield 01484 517077
6 M Ajovalasit and J Giacomin
Fig. 4 Test signals used in all experiments (RMS indicates r.m.s. acceleration value)
each stimuli pair the test subject was asked toindicate which stimuli they considered to be ‘moreunpleasant’ in experiment I or the ‘rougher’ inexperiment II. The complete paired-comparison test(all 42 pairs) lasted 16 min for each test subject.
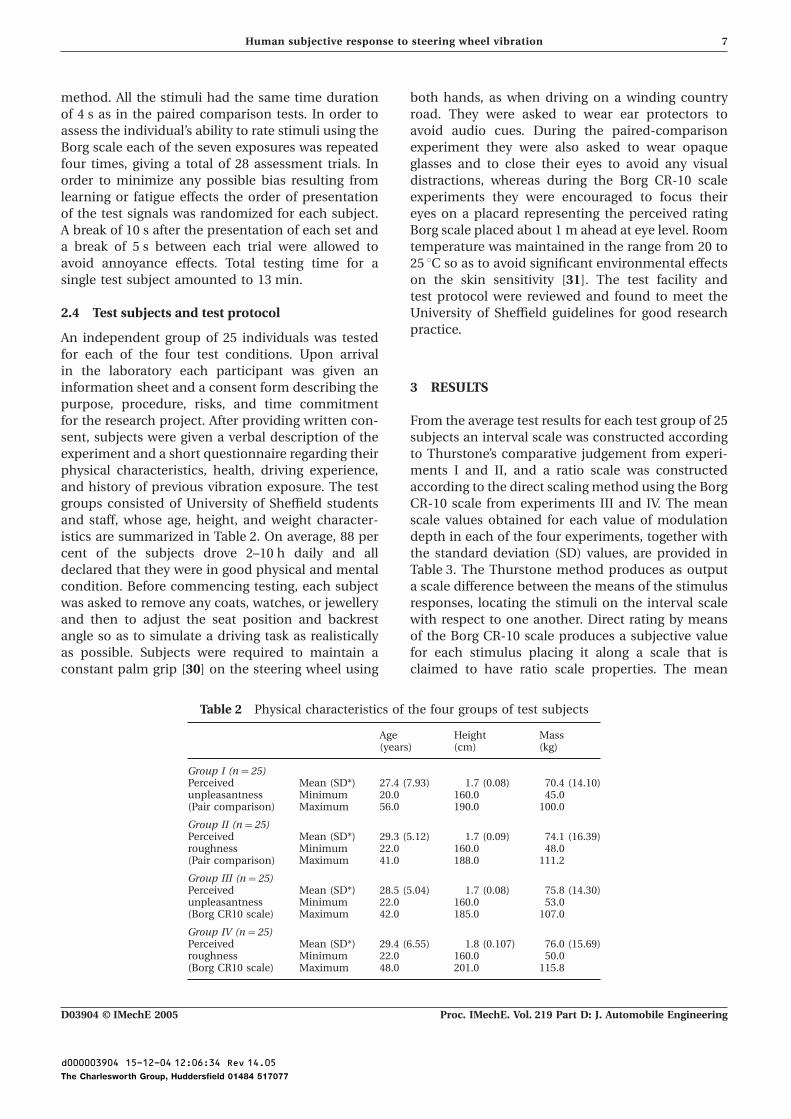
In experiments III and IV perceived unpleasant-ness and perceived roughness of the vibration wereassessed using the Borg CR-10 scale following theinstructions provided by Borg [21] for the scale’sadministration. The Borg CR-10 scale (shown inFig. 5) consists of a numerical scale from 0 (nothingat all) to 10 (extremely strong) with nine verbalanchors placed along the scale in an approximatelylogarithmic fashion. The test subjects were askedto judge each test stimuli on its own merits,independent of preceding stimuli. At the start of test-ing a familiarization period was used to acquaint thesubject with the use of the scale by means of practiceratings using a non-vibrational stimuli (acidity ratingof common foods) and a dummy test involving twovibrational stimuli selected from the test set. Thesame seven signals used in the experiments I and II
Fig. 5 Borg CR-10 scale. (Adapted from Borg [8])were employed for the direct Borg CR-10 scaling
D03904 © IMechE 2005Proc. IMechE. Vol. 219 Part D: J. Automobile Engineering
d000003904 15-12-04 12:06:34 Rev 14.05
The Charlesworth Group, Huddersfield 01484 517077
7Human subjective response to steering wheel vibration
method. All the stimuli had the same time duration both hands, as when driving on a winding countryroad. They were asked to wear ear protectors toof 4 s as in the paired comparison tests. In order to
assess the individual’s ability to rate stimuli using the avoid audio cues. During the paired-comparisonexperiment they were also asked to wear opaqueBorg scale each of the seven exposures was repeated
four times, giving a total of 28 assessment trials. In glasses and to close their eyes to avoid any visualdistractions, whereas during the Borg CR-10 scaleorder to minimize any possible bias resulting from
learning or fatigue effects the order of presentation experiments they were encouraged to focus theireyes on a placard representing the perceived ratingof the test signals was randomized for each subject.
A break of 10 s after the presentation of each set and Borg scale placed about 1 m ahead at eye level. Roomtemperature was maintained in the range from 20 toa break of 5 s between each trial were allowed to
avoid annoyance effects. Total testing time for a 25 °C so as to avoid significant environmental effectson the skin sensitivity [31]. The test facility andsingle test subject amounted to 13 min.test protocol were reviewed and found to meet theUniversity of Sheffield guidelines for good research2.4 Test subjects and test protocolpractice.
An independent group of 25 individuals was testedfor each of the four test conditions. Upon arrivalin the laboratory each participant was given aninformation sheet and a consent form describing the 3 RESULTSpurpose, procedure, risks, and time commitmentfor the research project. After providing written con- From the average test results for each test group of 25
subjects an interval scale was constructed accordingsent, subjects were given a verbal description of theexperiment and a short questionnaire regarding their to Thurstone’s comparative judgement from experi-
ments I and II, and a ratio scale was constructedphysical characteristics, health, driving experience,and history of previous vibration exposure. The test according to the direct scaling method using the Borg
CR-10 scale from experiments III and IV. The meangroups consisted of University of Sheffield studentsand staff, whose age, height, and weight character- scale values obtained for each value of modulation
depth in each of the four experiments, together withistics are summarized in Table 2. On average, 88 percent of the subjects drove 2–10 h daily and all the standard deviation (SD) values, are provided in
Table 3. The Thurstone method produces as outputdeclared that they were in good physical and mentalcondition. Before commencing testing, each subject a scale difference between the means of the stimulus
responses, locating the stimuli on the interval scalewas asked to remove any coats, watches, or jewelleryand then to adjust the seat position and backrest with respect to one another. Direct rating by means
of the Borg CR-10 scale produces a subjective valueangle so as to simulate a driving task as realisticallyas possible. Subjects were required to maintain a for each stimulus placing it along a scale that is
claimed to have ratio scale properties. The meanconstant palm grip [30] on the steering wheel using
Table 2 Physical characteristics of the four groups of test subjects
Age Height Mass(years) (cm) (kg)
Group I (n=25)Perceived Mean (SD*) 27.4 (7.93) 1.7 (0.08) 70.4 (14.10)unpleasantness Minimum 20.0 160.0 45.0(Pair comparison) Maximum 56.0 190.0 100.0
Group II (n=25)Perceived Mean (SD*) 29.3 (5.12) 1.7 (0.09) 74.1 (16.39)roughness Minimum 22.0 160.0 48.0(Pair comparison) Maximum 41.0 188.0 111.2
Group III (n=25)Perceived Mean (SD*) 28.5 (5.04) 1.7 (0.08) 75.8 (14.30)unpleasantness Minimum 22.0 160.0 53.0(Borg CR10 scale) Maximum 42.0 185.0 107.0
Group IV (n=25)Perceived Mean (SD*) 29.4 (6.55) 1.8 (0.107) 76.0 (15.69)roughness Minimum 22.0 160.0 50.0(Borg CR10 scale) Maximum 48.0 201.0 115.8
D03904 © IMechE 2005 Proc. IMechE. Vol. 219 Part D: J. Automobile Engineering
d000003904 15-12-04 12:06:34 Rev 14.05
The Charlesworth Group, Huddersfield 01484 517077
8 M Ajovalasit and J Giacomin
Table 3 Subjective raw scale mean values and in parentheses, SDs for the seven test stimuli
Stimuli Thurstone scale values Borg scale values
Modulation ar.m.s.
VDV Experiment I: Experiment II: Experiment III: Experiment IV:depth m (m/s2) (m/s1.75) relative unpleasantness relative roughness perceived unpleasantness perceived roughness
0.0 0.41 0.640 0 (0.338) 0 (0.982) 2.38 (1.212) 2.45 (0.708)0.1 0.41 0.644 −0.302 (0.288) −0.054 (0.913) 2.42 (1.087) 2.75 (0.792)0.2 0.41 0.658 −0.077 (0.386) 0.287 (1.098) 2.48 (1.080) 2.78 (0.915)0.4 0.41 0.707 0.3 (0.414) 1.113 (1.419) 3.06 (1.225) 3.37 (0.973)0.6 0.41 0.773 0.895 (0.343) 1.853 (1.256) 3.44 (1.398) 4.03 (1.186)0.8 0.41 0.847 1.16 (0.357) 2.588 (0.795) 3.79 (1.638) 4.22 (1.412)1.0 0.41 0.925 2.302 (0.182) 3.555 (0.587) 3.93 (1.628) 4.55 (1.582)
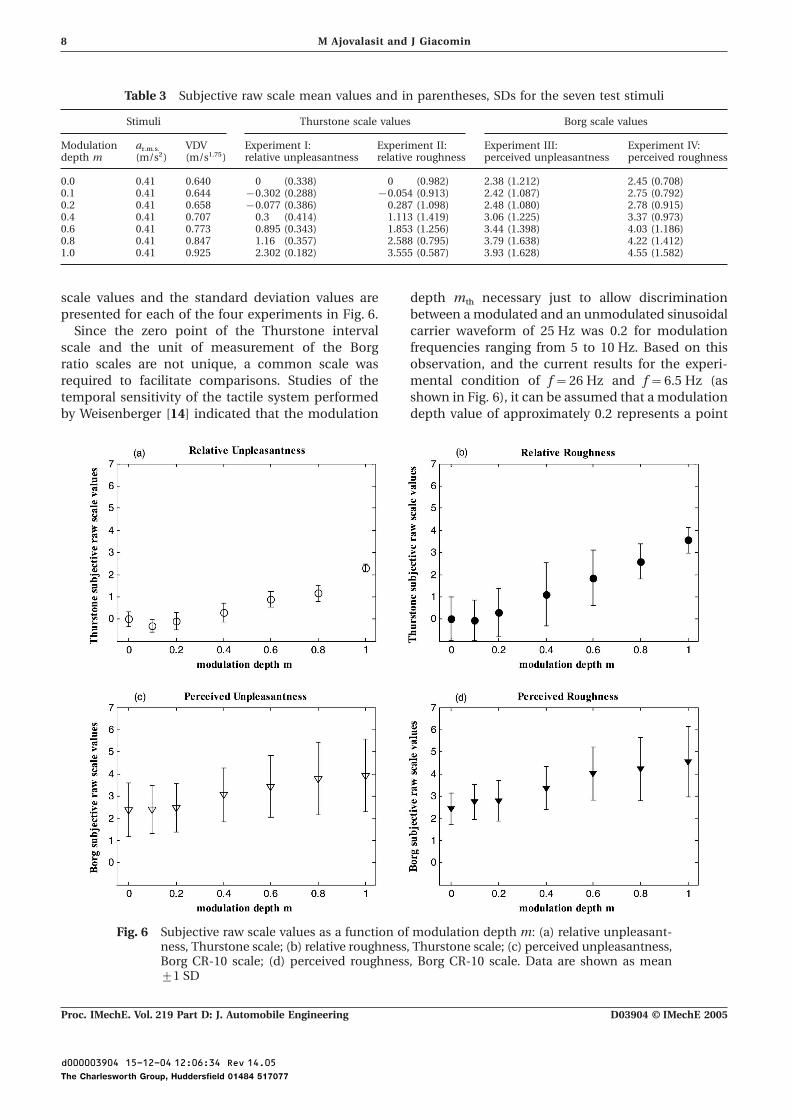
scale values and the standard deviation values are depth mth
necessary just to allow discriminationbetween a modulated and an unmodulated sinusoidalpresented for each of the four experiments in Fig. 6.
Since the zero point of the Thurstone interval carrier waveform of 25 Hz was 0.2 for modulationfrequencies ranging from 5 to 10 Hz. Based on thisscale and the unit of measurement of the Borg
ratio scales are not unique, a common scale was observation, and the current results for the experi-mental condition of f=26 Hz and f=6.5 Hz (asrequired to facilitate comparisons. Studies of the
temporal sensitivity of the tactile system performed shown in Fig. 6), it can be assumed that a modulationdepth value of approximately 0.2 represents a pointby Weisenberger [14] indicated that the modulation
Fig. 6 Subjective raw scale values as a function of modulation depth m: (a) relative unpleasant-ness, Thurstone scale; (b) relative roughness, Thurstone scale; (c) perceived unpleasantness,Borg CR-10 scale; (d) perceived roughness, Borg CR-10 scale. Data are shown as mean±1 SD
D03904 © IMechE 2005Proc. IMechE. Vol. 219 Part D: J. Automobile Engineering
d000003904 15-12-04 12:06:34 Rev 14.05
The Charlesworth Group, Huddersfield 01484 517077
9Human subjective response to steering wheel vibration
of separation between two different human response After translating the raw data on both axes thegrowth functions of human-perceived unpleasant-characteristics. Below the point m=0.2, subjects do
not perceive differences in amplitude modulation and ness and roughness of the vibration could be deter-mined as a function of the difference in modulationthe sensation magnitude can be interpreted as sen-
sory noise relative to the energy of the unmodulated depth with respect to threshold, m*=m−mth
, asshown in Fig. 8. Figure 8a presents the experi-waveform. Above the point m=0.2 the sensation
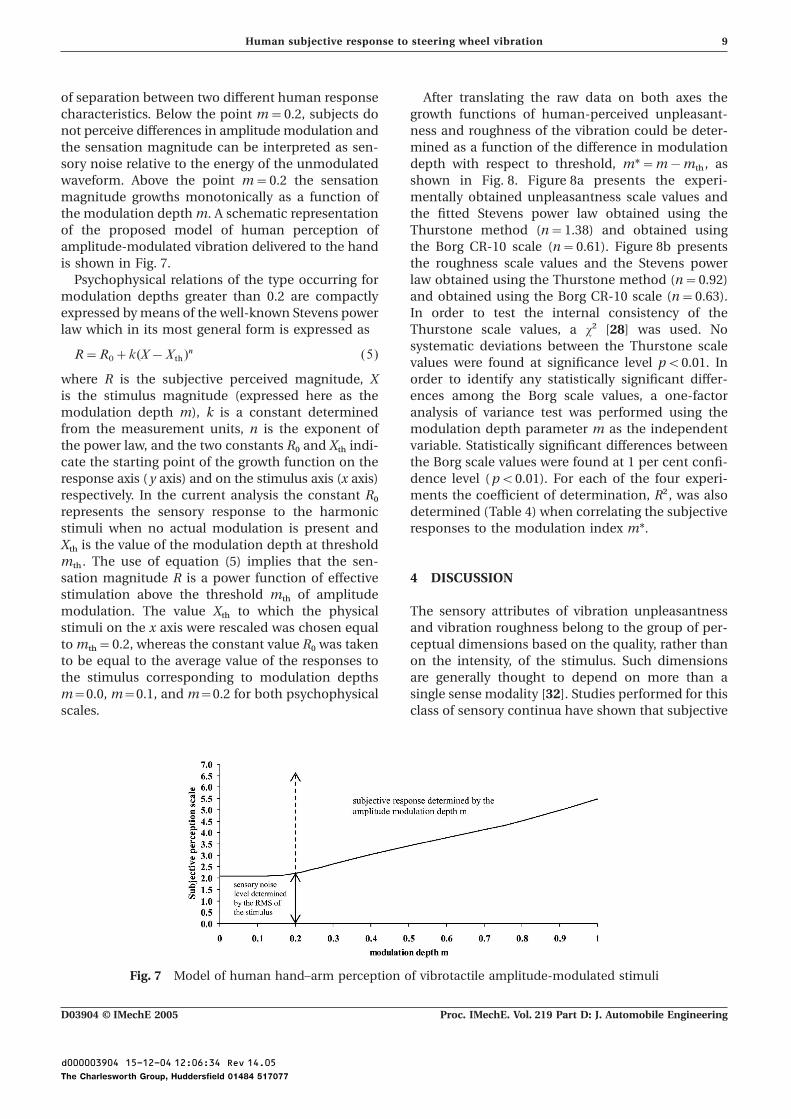
magnitude growths monotonically as a function of mentally obtained unpleasantness scale values andthe fitted Stevens power law obtained using thethe modulation depth m. A schematic representation
of the proposed model of human perception of Thurstone method (n=1.38) and obtained usingthe Borg CR-10 scale (n=0.61). Figure 8b presentsamplitude-modulated vibration delivered to the hand
is shown in Fig. 7. the roughness scale values and the Stevens powerlaw obtained using the Thurstone method (n=0.92)Psychophysical relations of the type occurring for
modulation depths greater than 0.2 are compactly and obtained using the Borg CR-10 scale (n=0.63).In order to test the internal consistency of theexpressed by means of the well-known Stevens power
law which in its most general form is expressed as Thurstone scale values, a x2 [28] was used. Nosystematic deviations between the Thurstone scale
R=R0+k(X−Xth)n (5)values were found at significance level p<0.01. Inorder to identify any statistically significant differ-where R is the subjective perceived magnitude, X
is the stimulus magnitude (expressed here as the ences among the Borg scale values, a one-factoranalysis of variance test was performed using themodulation depth m), k is a constant determined
from the measurement units, n is the exponent of modulation depth parameter m as the independentvariable. Statistically significant differences betweenthe power law, and the two constants R
0and X
thindi-
cate the starting point of the growth function on the the Borg scale values were found at 1 per cent confi-dence level ( p<0.01). For each of the four experi-response axis ( y axis) and on the stimulus axis (x axis)
respectively. In the current analysis the constant R0
ments the coefficient of determination, R2 , was alsodetermined (Table 4) when correlating the subjectiverepresents the sensory response to the harmonic
stimuli when no actual modulation is present and responses to the modulation index m*.X
this the value of the modulation depth at threshold
mth
. The use of equation (5) implies that the sen-sation magnitude R is a power function of effective 4 DISCUSSIONstimulation above the threshold m
thof amplitude
modulation. The value Xth
to which the physical The sensory attributes of vibration unpleasantnessand vibration roughness belong to the group of per-stimuli on the x axis were rescaled was chosen equal
to mth=0.2, whereas the constant value R
0was taken ceptual dimensions based on the quality, rather than
on the intensity, of the stimulus. Such dimensionsto be equal to the average value of the responses tothe stimulus corresponding to modulation depths are generally thought to depend on more than a
single sense modality [32]. Studies performed for thism=0.0, m=0.1, and m=0.2 for both psychophysicalscales. class of sensory continua have shown that subjective
Fig. 7 Model of human hand–arm perception of vibrotactile amplitude-modulated stimuli
D03904 © IMechE 2005 Proc. IMechE. Vol. 219 Part D: J. Automobile Engineering
d000003904 15-12-04 12:06:34 Rev 14.05
The Charlesworth Group, Huddersfield 01484 517077
10 M Ajovalasit and J Giacomin
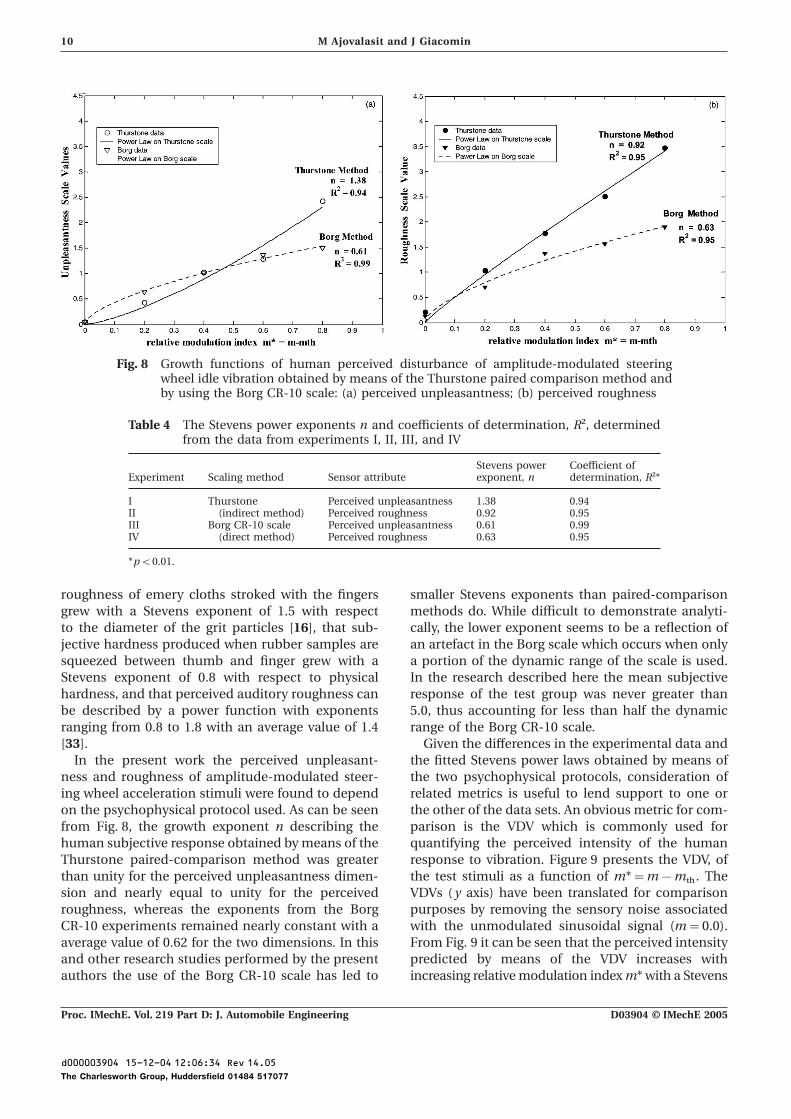
Fig. 8 Growth functions of human perceived disturbance of amplitude-modulated steeringwheel idle vibration obtained by means of the Thurstone paired comparison method andby using the Borg CR-10 scale: (a) perceived unpleasantness; (b) perceived roughness
Table 4 The Stevens power exponents n and coefficients of determination, R2, determinedfrom the data from experiments I, II, III, and IV
Stevens power Coefficient ofExperiment Scaling method Sensor attribute exponent, n determination, R2*
I Thurstone Perceived unpleasantness 1.38 0.94II (indirect method) Perceived roughness 0.92 0.95III Borg CR-10 scale Perceived unpleasantness 0.61 0.99IV (direct method) Perceived roughness 0.63 0.95
*p<0.01.
roughness of emery cloths stroked with the fingers smaller Stevens exponents than paired-comparisonmethods do. While difficult to demonstrate analyti-grew with a Stevens exponent of 1.5 with respect
to the diameter of the grit particles [16], that sub- cally, the lower exponent seems to be a reflection ofan artefact in the Borg scale which occurs when onlyjective hardness produced when rubber samples are
squeezed between thumb and finger grew with a a portion of the dynamic range of the scale is used.In the research described here the mean subjectiveStevens exponent of 0.8 with respect to physical
hardness, and that perceived auditory roughness can response of the test group was never greater than5.0, thus accounting for less than half the dynamicbe described by a power function with exponents
ranging from 0.8 to 1.8 with an average value of 1.4 range of the Borg CR-10 scale.Given the differences in the experimental data and[33].
In the present work the perceived unpleasant- the fitted Stevens power laws obtained by means ofthe two psychophysical protocols, consideration ofness and roughness of amplitude-modulated steer-
ing wheel acceleration stimuli were found to depend related metrics is useful to lend support to one orthe other of the data sets. An obvious metric for com-on the psychophysical protocol used. As can be seen
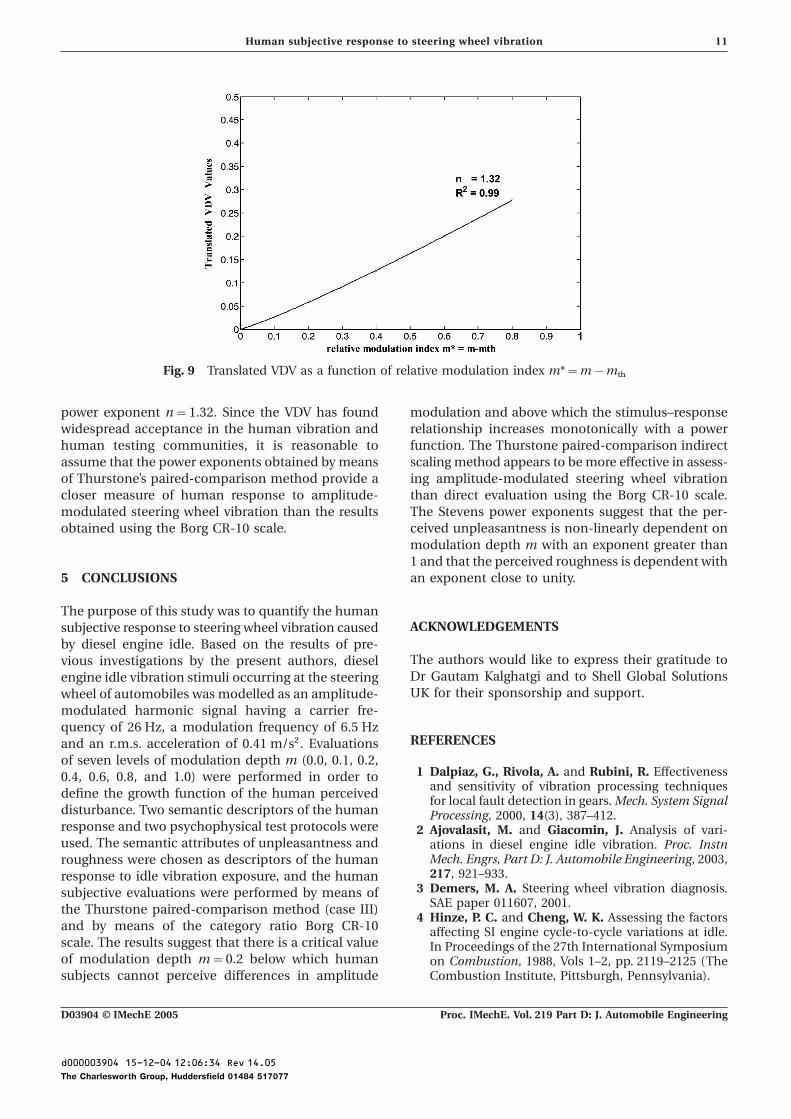
from Fig. 8, the growth exponent n describing the parison is the VDV which is commonly used forquantifying the perceived intensity of the humanhuman subjective response obtained by means of the
Thurstone paired-comparison method was greater response to vibration. Figure 9 presents the VDV, ofthe test stimuli as a function of m*=m−m
th. Thethan unity for the perceived unpleasantness dimen-
sion and nearly equal to unity for the perceived VDVs ( y axis) have been translated for comparisonpurposes by removing the sensory noise associatedroughness, whereas the exponents from the Borg
CR-10 experiments remained nearly constant with a with the unmodulated sinusoidal signal (m=0.0).From Fig. 9 it can be seen that the perceived intensityaverage value of 0.62 for the two dimensions. In this
and other research studies performed by the present predicted by means of the VDV increases withincreasing relative modulation index m* with a Stevensauthors the use of the Borg CR-10 scale has led to
D03904 © IMechE 2005Proc. IMechE. Vol. 219 Part D: J. Automobile Engineering
d000003904 15-12-04 12:06:34 Rev 14.05
The Charlesworth Group, Huddersfield 01484 517077
11Human subjective response to steering wheel vibration
Fig. 9 Translated VDV as a function of relative modulation index m*=m−mth
power exponent n=1.32. Since the VDV has found modulation and above which the stimulus–responserelationship increases monotonically with a powerwidespread acceptance in the human vibration and
human testing communities, it is reasonable to function. The Thurstone paired-comparison indirectscaling method appears to be more effective in assess-assume that the power exponents obtained by means
of Thurstone’s paired-comparison method provide a ing amplitude-modulated steering wheel vibrationthan direct evaluation using the Borg CR-10 scale.closer measure of human response to amplitude-
modulated steering wheel vibration than the results The Stevens power exponents suggest that the per-ceived unpleasantness is non-linearly dependent onobtained using the Borg CR-10 scale.modulation depth m with an exponent greater than1 and that the perceived roughness is dependent withan exponent close to unity.5 CONCLUSIONS
The purpose of this study was to quantify the humanACKNOWLEDGEMENTSsubjective response to steering wheel vibration caused
by diesel engine idle. Based on the results of pre-The authors would like to express their gratitude tovious investigations by the present authors, dieselDr Gautam Kalghatgi and to Shell Global Solutionsengine idle vibration stimuli occurring at the steeringUK for their sponsorship and support.wheel of automobiles was modelled as an amplitude-
modulated harmonic signal having a carrier fre-quency of 26 Hz, a modulation frequency of 6.5 Hz
REFERENCESand an r.m.s. acceleration of 0.41 m/s2 . Evaluationsof seven levels of modulation depth m (0.0, 0.1, 0.2,
1 Dalpiaz, G., Rivola, A. and Rubini, R. Effectiveness0.4, 0.6, 0.8, and 1.0) were performed in order toand sensitivity of vibration processing techniquesdefine the growth function of the human perceivedfor local fault detection in gears. Mech. System Signal
disturbance. Two semantic descriptors of the human Processing, 2000, 14(3), 387–412.response and two psychophysical test protocols were 2 Ajovalasit, M. and Giacomin, J. Analysis of vari-used. The semantic attributes of unpleasantness and ations in diesel engine idle vibration. Proc. Instn
Mech. Engrs, Part D: J. Automobile Engineering, 2003,roughness were chosen as descriptors of the human217, 921–933.response to idle vibration exposure, and the human
3 Demers, M. A. Steering wheel vibration diagnosis.subjective evaluations were performed by means ofSAE paper 011607, 2001.the Thurstone paired-comparison method (case III)
4 Hinze, P. C. and Cheng, W. K. Assessing the factorsand by means of the category ratio Borg CR-10 affecting SI engine cycle-to-cycle variations at idle.scale. The results suggest that there is a critical value In Proceedings of the 27th International Symposiumof modulation depth m=0.2 below which human on Combustion, 1988, Vols 1–2, pp. 2119–2125 (The
Combustion Institute, Pittsburgh, Pennsylvania).subjects cannot perceive differences in amplitude
D03904 © IMechE 2005 Proc. IMechE. Vol. 219 Part D: J. Automobile Engineering
d000003904 15-12-04 12:06:34 Rev 14.05
The Charlesworth Group, Huddersfield 01484 517077
12 M Ajovalasit and J Giacomin
5 Dixon, J., Rhodes, D. M. and Phillips, A. V. The 23 Viemeister, N. F. Temporal modulation transfergeneration of engine half orders by structural defor- functions based upon modulation thresholds.mation. In Proceedings of IMechE Conference on J. Acoust. Soc. Am., 1979, 66(5), 1364–1380.Vehicle NVH and Refinement, 1994, paper C487/032/ 24 Gescheider, G. A., Hoffman, K. E., Harrison, M. A.,94, pp. 9–17 (Professional Engineering Publishing Travis, M. L. and Bolanowski, S. J. The effects ofLimited, Bury St Edmunds and London). masking on vibrotactile temporal summation in the
6 Lichty, L. C. Combustion Engine Processes, 1967 detection of sinusoidal and noise signals. J. Acoust.(McGraw-Hill Book, New York). Soc. Am., 1994, 95(2), 1006–1016.
7 Rahnejat, H. Multi-body Dynamics: Vehicles, 25 Miwa, T. Evaluation methods for vibration effect.Machines and Mechanisms, 1998 (Professional Part 7. The vibration greatness of the pulses. Ind.Engineering Publishing Limited, Bury St Edmunds Health, 1968, 7, 143–164.and London). 26 BS 6841: 1987 Guide to Measurement and Evaluation
8 Priede, T. Noise and vibration control of the inter- of Human Exposure to Whole-body Mechanicalnal combustion reciprocating engine. In Noise and Vibration and Shock (British Standards Institution,Vibration Control Engineering, Principles and Appli- London)cations (Ed. L. L. A. V. Bernarek), 1992, pp. 665–707 27 Griffin, M. J. Handbook of Human Vibration, 1990(John Wiley, New York). (Academic Press, London).
9 Hoard, J. and Rehagen, L. Relating subjective idle 28 Torgerson, W. S. Theory and Method of Scaling, 1958quality to engine combustion. SAE paper 970035, (John Wiley, New York).1997, pp. 1–5. 29 Gilson, E. Q. and Baddeley, A. D. Tactile short-term
10 Verrilo, R. T. Psychophysics of vibrotactile stimu- memory. Q. J. Expl Psychol., 1969, 21, 180–184.lation. J. Acoust. Soc. Am., 1985, 77(1), 225–232. 30 Reynolds, D. D. and Keith, R. H. Hand–arm
11 Morioka, M. Effect of contact location on vibration vibration, Part 1: analytical model of the vibrationperception threshold in the glabrous skin of the response characteristics of the hand. J. Sound Vibr.,human hand. In Proceedings of the 34th United 1977, 51(2), 237–253.Kingdom Group Meeting on Human Responses to 31 ISO 13091-1 Mechanical Vibration–Vibrotactile Per-Vibration, 22–24 September 1999 (Ford Motor ception Thresholds for the Assessment of NerveCompany, Dunton, Essex). Dysfunction, Part 1: Methods of Measurement at
12 Gescheider, G. A., Bolanowski Jr, S. J., the Fingertips, 2001 (International StandardizationVerrillo, R. T., Arpajian, D. J. and Ryan, T. F. Vibro- Organization, Geneva).tactile intensity discrimination measured by three 32 Stevens, S. S. (Ed.) Psychophysics: Introduction tomethods. J. Acoust. Soc. Am., 1990, 87(1), 330–338. its Perceptual, Neural and Social Prospects, 1986
13 Bensmaıa, S. J. and Hollins, M. Complex tactile (Transaction Books, New Brunswick, New Jersey).waveform discrimination. J. Acoust. Soc. Am., 2000, 33 Guirao, M. and Garavilla, J. M. Perceived roughness108(3), 1236–1245. of amplitude-modulated tones and noise. J. Acoust.
14 Weisenberger, J. M. Sensitivity to amplitude- Soc. Am., 1976, 60(6), 1335–1338.modulated vibrotactile signals. J. Acoust. Soc. Am.,1986, 80(6), 1707–1715.
15 Lamore, P. J. J. Envelope detection of amplitude-modulated high-frequency sinusoidal signals by skinmechanoreceptors. J. Acoust. Soc. Am., 1986, 79(4),
APPENDIX1082–1085.16 Stevens, S. S. and Harris, J. R. The scaling of sub-
jective roughness and smoothness. J. Expl Psychol., Notation1962, 64(5), 489–494.
a acceleration (m/s2)17 Franzen, O. The dependence of vibrotactile thresholdand magnitude functions on stimulation frequency A(t) instantaneous amplitude of modulatedand signal level. Scand. J. Psychol., 1969, 10, 289–297. signal (m/s2)
18 Stevens, S. S. A metric for the social consensus. CR category ratioScience, 1966, 151, 530–541. f
ccarrier frequency (Hz)
19 Ekman, G. and Kunnapas, T. A further study off
mmodulation frequency (Hz)direct and indirect scaling methods. Scand. J. Psychol.,
Hi
engine harmonic (order)1963, 4, 77–80.m modulation depth20 Burros, R. H., A solution for case III of the law of
comparative judgment. Psychometrika, 1954, 19(1), m* modulation index equal to m−mth57–64. m
thamplitude modulation detection threshold
21 Borg, G. Borg’s Perceived Exertion and Pain Scales, MTF modulation transfer function1998 (Human Kinetics, Champaign, Illinois).
p significance level22 Giacomin, J., Shayaa, M. S., Dormegnie, E. andPSD power spectral densityRichard, L. A frequency weighting for the evaluationSD standard deviationof steering wheel rotational vibration. Int. J. Ind.
Ergonomics, 2004 (in press). VDV vibration dose value (m/s1.75)
D03904 © IMechE 2005Proc. IMechE. Vol. 219 Part D: J. Automobile Engineering
d000003904 15-12-04 12:06:34 Rev 14.05
The Charlesworth Group, Huddersfield 01484 517077