hydrodynamics: setting the scene* - nus engineering s2 hydrodynamics/s2… · marine & offshore...
TRANSCRIPT

The Lloyd’s Register Educational Trust (LRET)
Marine & Offshore Research Workshop
16-18 February, 2010 at Engineering Auditorium, NUS
Hydrodynamics: Setting the Scene*
*a selective view
Prof. Rodney Eatock Taylor and Prof. Paul Taylor
University of Oxford

Hydrodynamics:
Setting the Scene*
*a selective view
Rodney Eatock Taylor and Paul Taylor
University of Oxford
LRET Marine and Offshore Research Workshop
National University of Singapore, 16-18 February 2010

Typhoon TLP
from http://blog.kir.com/archives/002473.asp
One of our aims must be to model the
interaction of the most extreme waves with
structures in the sea.
And we must also consider hydrodynamic
models motivated by design for operational
conditions in waves
Also Resistance, Manoeuvring, Sloshing,
VIV/VIM, Hydroelasticity, ….., which are not
considered here
Hydrodynamics and Modelling

From: Summary of CESOS Workshop 2007, by Marilena Greco
Modelling using CFD

Issues raised
• Wave analysis
• Wave structure interaction
—“Near-trapping” by multiple structures in waves
— Wave-in-deck issues (waves + interaction): jackets and GBS
— Wave-induced sloshing in gaps
— Floatover
• A few comments on CFD

Time series plot of some large waves
Wave analysis

Average of largest 50% linear profiles* compared with NewWave profile+
* linearised using (average crest -average trough profile)/2
+ average shape of extreme in linear random Gaussian process (Boccotti, Lindgren)
NewWave

NewWave embedded in random record

Freak waves?
Consider behaviour near an extreme crest: set-down will decrease
crest elevation, while set-up will increase it.
The famous “New Year Wave” measured at the Draupner platform in the
North Sea. For convenience the time is set to zero under the extreme
crest.

Setdown under extreme crest?
T.A.A. Adcock & P. H. Taylor, 11th International Workshop on Wave Hindcasting and Forecasting, 2009.

T.A.A. Adcock & P. H. Taylor, 11th International Workshop on Wave Hindcasting and Forecasting, 2009.
The second order difference waves under the Draupner giant wave. Comparison of filtered
data and predicted second order difference waves based on a model of crossing seas.
(Evidence of crossing seas from meteorology, measured forces, and absence of breaking in
wave record from laser)
Setup under Draupner crest

Other evidence of set-up in crossing seas
A. Toffoli et al. / European Journal of Mechanics B/Fluids 25 (2006) 649–661

Wave climate variability
T.A.A. Adcock & P. H. Taylor, 11th International Workshop on Wave Hindcasting and Forecasting, 2009.

Wave-structure interaction
ka = 0.4
-5 0 5-6
-4
-2
0
2
4
6
0.5
1
1.5
ka = 1
-5 0 5-6
-4
-2
0
2
4
6
0.5
1
1.5
ka = 3
-5 0 5-6
-4
-2
0
2
4
6
0.5
1
1.5
ka = 5
-5 0 5-6
-4
-2
0
2
4
6
0.5
1
1.5
ray theory approx
Diffracted wave field near single vertical cylinder

1 2
34
ka = 2.2729, β = 0o
-5 0 5-6
-4
-2
0
2
4
6
1 2
34
ka = 2.2729, β = 15o
-5 0 5-6
-4
-2
0
2
4
6
1 2
34
ka = 2.2729, β = 30o
-5 0 5-6
-4
-2
0
2
4
6
1 2
34
ka = 2.2729, β = 45o
-5 0 5-6
-4
-2
0
2
4
6
2 4 6
Diffraction by arrays, near-trapping and
wave-in-deck

Near-trapping in square array
Runup at cylinder 3, β = 45

Dimensionless wave amplitude near arrays of circular and non-circular cylinders
ka = 1.831, β = 45 (simple models of a specific semisubmersible).
Influence of local geometry

Application to a GBS

2nd order behaviour – simulated using Oxford program DIFFRACT
near trapping frequency doubling : input waves at frequency f
strong local surface response at 2f
Body and free-surface grid for quadrant of the structure
(using two planes of symmetry)

End-on waves at near-trapping. β=0o, f=0.126 Hz
Incident wave

Linear amplitude response profile along
the center-line of the structure at f=0.126Hz.
2nd order sum amplitude profile along the
center-line of the structure at 2f =0.126Hz.
Where does the high response occur?
Linear diffraction calculations provide useful guidance to 2nd order behaviour

─── η(1) ─── η (2+)
─── η (1+2)=TOTAL
Predicted surface elevation
between the rear legs with
11m incident focused wave group
Tp = 14.3 s
Practical implications for concrete GBS with closely spaced columns
- water projection to high level - hitting the deck
- air down to just above the caisson (slam loading on the top?)
Walker et al., Ocean Engineering 2008
11m

Noble Denton
Waves in gap between closely spaced vessels
SAFE OFFLOAD programme (EU)
Experiments at DHI and Imperial College
have confirmed importance of large free
surface motions in the gap
As has second order boundary element
analysis at Oxford

Linear motions and elevations, beam sea 1
Floating Fixed
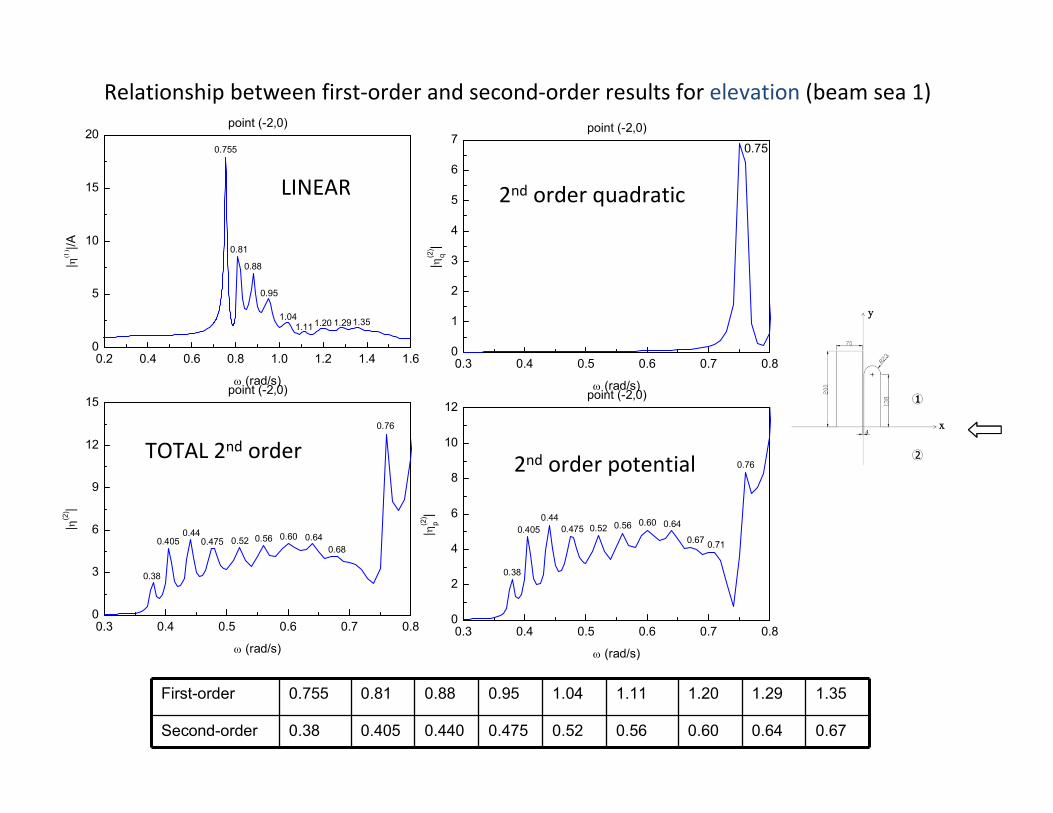
Relationship between first-order and second-order results for elevation (beam sea 1)
0.2 0.4 0.6 0.8 1.0 1.2 1.4 1.60
5
10
15
20
1.351.291.111.20
1.04
0.95
0.88
0.81
0.755
point (-2,0)
|η(1
) |/A
ω (rad/s)
0.3 0.4 0.5 0.6 0.7 0.80
1
2
3
4
5
6
70.75
point (-2,0)
|η(2)
q|
ω (rad/s)
0.3 0.4 0.5 0.6 0.7 0.80
2
4
6
8
10
12
0.76
0.670.71
0.640.600.560.520.475
0.44
0.405
0.38
point (-2,0)
|η(2)
p|
ω (rad/s)
0.3 0.4 0.5 0.6 0.7 0.80
3
6
9
12
15
0.76
0.68
0.640.600.560.520.4750.44
0.405
0.38
point (-2,0)
|η(2) |
ω (rad/s)
First-order 0.755 0.81 0.88 0.95 1.04 1.11 1.20 1.29 1.35
Second-order 0.38 0.405 0.440 0.475 0.52 0.56 0.60 0.64 0.67
LINEAR 2nd order quadratic
2nd order potentialTOTAL 2nd order


Response in gap between 2 boxes with NewWave focused
group, beam seas, broad band spectrum
Behaviour in transient waves
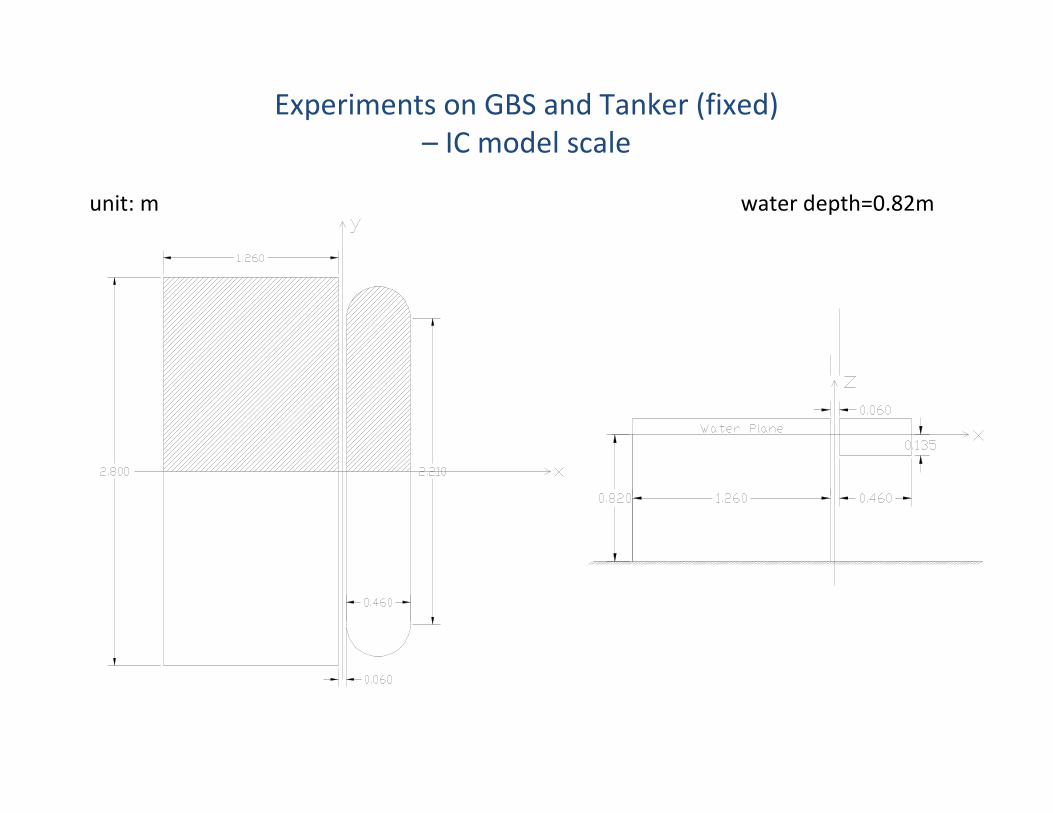
Experiments on GBS and Tanker (fixed)
– IC model scale
unit: m water depth=0.82m

First-order wave elevation at centre line
-1.2 -0.8 -0.4 0.0 0.4 0.8 1.20
1
2
3
4
5T=0.780s(beam sea 2)
Numerical (Oxford)
Experimental (IC)
|η(1) |/A
y
-1.2 -0.8 -0.4 0.0 0.4 0.8 1.20
1
2
3
4
5
6
7T=0.889s(beam sea 2)
Numerical (Oxford)
Experimental (IC)
|η(1) |/A
y
-1.2 -0.8 -0.4 0.0 0.4 0.8 1.20
1
2
3
4
5
6
7
8T=1.067s(beam sea 2)
Numerical (Oxford)
Experimental (IC)
|η(1) |/A
y
-1.2 -0.8 -0.4 0.0 0.4 0.8 1.20.0
0.5
1.0
1.5
2.0
2.5
3.0T=1.455s(beam sea 2)
Numerical (Oxford)
Experimental (IC)
|η(1) |/A
y

0 10 20 30 40 50 60 70-30
-20
-10
0
10
20
30 incident
y=0
ζ
t(s)
Tp=1.2s
0.4 0.6 0.8 1.0 1.2 1.4 1.60
5
10
15
20
0.9703
(T=1.03s)
1.2987
(T=0.77s)
1.13636
(T=0.88s)
0.9901
(T=1.01s) Numerical(Oxford)
Experimental(IC)
|η(1
) |/A
f(Hz)
First-order elevations at point (-0.03,0) in Beam Sea 2
Wave group excitation
Beam sea, tanker exposed
RAO for elevation at mid-
point of gap
Overall good agreement
- freq of peak ~2% out
- magnitude over-estimated

Floatover operations
Behaviour of flexibly connected bodies
Chevron Olokola Floatover Installation Study © Ocean Dynamics LLC

Relative heave motions of barges
based on extension of diffraction analysis for flexibly connected vessels

From: Wang, C. M. & Tay, Z. Y. Hydroelastic Analysis and Response of
Pontoon-Type Very Large Floating Structures
Link to hydroelastic analysis of flexibly connected structures

Areas needing further understanding
As discussed here
•Extreme wave statistics
•Directional nonlinear wave kinematics (with and without breaking)
•Wave structure interaction effects – various, including wave-in-deck
Other topics
•Coupled tank sloshing and vessel motions (parametric resonance, …)
•Impact pressures (compressibility effects, …)
•Hydroelasticity

Areas for further CFD development
• Unstructured adaptive grids for VOF modelling
• Overlapping grids
• Grid size ∝ (Re)9/4 (for representation of disparate length scales in turbulent flow)
• Turbulence modelling for unsteady free surface flows
• LES
• SPH
• Hybrid approaches: simple modelling to identify critical parameters (wave frequency, direction, load case, geometry), followed by very detailed CFD
– e.g. strip theory + RANSE
• Coupled and multi-scale formulations
• Benchmark results for validation
• Integration of codes into optimisation tools (as has been done for nonlinear wave resistance)

Opportunities for marine CFD
From: http://wiki.manchester.ac.uk/spheric

Opportunities for marine CFD
Courtesy:

Opportunities for marine CFD
Courtesy:

Thank you
Questions?