hyperion® system 9 bi + interactive reporting object model and
TRANSCRIPT

H Y P E R I O N ® S Y S T E M ™ 9 B I + ™
INTERACTIVE REPORTING™
R E L E A S E 9 . 2
O B J E C T M O D E L A N D D A S H B O A R D D E V E L O P M E N T S E R V I C E S D E V E L O P E R ’ S
G U I D E
VOLUME I: DASHBOARD DESIGN GUIDE

Copyright 1989-2006 Hyperion Solutions Corporation.All rights reserved.
“Hyperion,” the Hyperion logo, and Hyperion’s product names are trademarks of Hyperion. References to other companies and their products use trademarks owned by the respective companies and are for reference purpose only.
No portion hereof may be reproduced or transmitted in any form or by any means, electronic or mechanical, including photocopying, recording, or information storage and retrieval systems, for any purpose other than the recipient’s personal use, without the express written permission of Hyperion.
The information contained herein is subject to change without notice. Hyperion shall not be liable for errors contained herein or consequential damages in connection with the furnishing, performance, or use hereof.
Any Hyperion software described herein is licensed exclusively subject to the conditions set forth in the Hyperion license agreement.
Use, duplication or disclosure by the U.S. Government is subject to restrictions set forth in the applicable Hyperion license agreement and as provided in DFARS 227.7202-1(a) and 227.7202-3(a) (1995), DFARS 252.227-7013(c)(1)(ii) (Oct 1988), FAR 12.212(a) (1995), FAR 52.227-19, or FAR 52.227-14, as applicable.
Hyperion Solutions Corporation5450 Great America ParkwaySanta Clara, California 95054
Printed in the U.S.A.

Contents iii
Contents
Preface . . . . . . . . . . . . . . . . . . . . . . . . . . . . . . . . . . . . . . . . . . . . . . . . . . . . . . . . . . . . . . . . . . . . . . . ix
Audience . . . . . . . . . . . . . . . . . . . . . . . . . . . . . . . . . . . . . . . . . . . . . . . . . . . . . . . . . . . . . . . . . . . . . . x
Document Structure . . . . . . . . . . . . . . . . . . . . . . . . . . . . . . . . . . . . . . . . . . . . . . . . . . . . . . . . . . . . x
Related Documents . . . . . . . . . . . . . . . . . . . . . . . . . . . . . . . . . . . . . . . . . . . . . . . . . . . . . . . . . . . . . x
Where to Find Documentation . . . . . . . . . . . . . . . . . . . . . . . . . . . . . . . . . . . . . . . . . . . . . . . . . . . xi
Help Menu Commands . . . . . . . . . . . . . . . . . . . . . . . . . . . . . . . . . . . . . . . . . . . . . . . . . . . . . . . . . xi
Conventions . . . . . . . . . . . . . . . . . . . . . . . . . . . . . . . . . . . . . . . . . . . . . . . . . . . . . . . . . . . . . . . . . xii
Additional Support . . . . . . . . . . . . . . . . . . . . . . . . . . . . . . . . . . . . . . . . . . . . . . . . . . . . . . . . . . . . xiii
Education Services . . . . . . . . . . . . . . . . . . . . . . . . . . . . . . . . . . . . . . . . . . . . . . . . . . . . . . . . . xiii
Consulting Services . . . . . . . . . . . . . . . . . . . . . . . . . . . . . . . . . . . . . . . . . . . . . . . . . . . . . . . . xiii
Technical Support . . . . . . . . . . . . . . . . . . . . . . . . . . . . . . . . . . . . . . . . . . . . . . . . . . . . . . . . . xiv
Documentation Feedback . . . . . . . . . . . . . . . . . . . . . . . . . . . . . . . . . . . . . . . . . . . . . . . . . . . . . . xiv
PART I Overview . . . . . . . . . . . . . . . . . . . . . . . . . . . . . . . . . . . . . . . . . . . . . . . . . . . . . . . . . . . . . . . . . . . . . . 15
CHAPTER 1 Dashboards . . . . . . . . . . . . . . . . . . . . . . . . . . . . . . . . . . . . . . . . . . . . . . . . . . . . . . . . . . . . . . . . . . . . 17
Working with the Dashboard Section . . . . . . . . . . . . . . . . . . . . . . . . . . . . . . . . . . . . . . . . . . . . . . 18
Inserting a Dashboard Section . . . . . . . . . . . . . . . . . . . . . . . . . . . . . . . . . . . . . . . . . . . . . . . . 18
Deleting an Dashboard Section . . . . . . . . . . . . . . . . . . . . . . . . . . . . . . . . . . . . . . . . . . . . . . . 19
Switching Between Design and Run Modes . . . . . . . . . . . . . . . . . . . . . . . . . . . . . . . . . . . . . 19
Working with Dashboard Objects . . . . . . . . . . . . . . . . . . . . . . . . . . . . . . . . . . . . . . . . . . . . . . . . . 19
Inserting Dashboard Objects . . . . . . . . . . . . . . . . . . . . . . . . . . . . . . . . . . . . . . . . . . . . . . . . . 21
Deleting Dashboard Objects . . . . . . . . . . . . . . . . . . . . . . . . . . . . . . . . . . . . . . . . . . . . . . . . . . 21
External Content in Dashboards . . . . . . . . . . . . . . . . . . . . . . . . . . . . . . . . . . . . . . . . . . . . . . . . . . 21
Embedded Browser Control . . . . . . . . . . . . . . . . . . . . . . . . . . . . . . . . . . . . . . . . . . . . . . . . . . 22
Referencing a Name with a Single-byte Character . . . . . . . . . . . . . . . . . . . . . . . . . . . . . . . . 23
Browsing the Repository . . . . . . . . . . . . . . . . . . . . . . . . . . . . . . . . . . . . . . . . . . . . . . . . . . . . . 24
Document Options . . . . . . . . . . . . . . . . . . . . . . . . . . . . . . . . . . . . . . . . . . . . . . . . . . . . . . . . . 25
HyperLink Control . . . . . . . . . . . . . . . . . . . . . . . . . . . . . . . . . . . . . . . . . . . . . . . . . . . . . . . . . 28
Embedded Pivot Section Interactivity . . . . . . . . . . . . . . . . . . . . . . . . . . . . . . . . . . . . . . . . . . . . . 30
Setting Dashboard Properties . . . . . . . . . . . . . . . . . . . . . . . . . . . . . . . . . . . . . . . . . . . . . . . . . . . . 31
Using Design Tools . . . . . . . . . . . . . . . . . . . . . . . . . . . . . . . . . . . . . . . . . . . . . . . . . . . . . . . . . . . . 32
Layout Tools . . . . . . . . . . . . . . . . . . . . . . . . . . . . . . . . . . . . . . . . . . . . . . . . . . . . . . . . . . . . . . . 32
iv Contents
CHAPTER 2 Interactive Reporting Object Model . . . . . . . . . . . . . . . . . . . . . . . . . . . . . . . . . . . . . . . . . . . . . . . . 37
Understanding Interactive Reporting Events . . . . . . . . . . . . . . . . . . . . . . . . . . . . . . . . . . . . . . . 39
Object Level Events . . . . . . . . . . . . . . . . . . . . . . . . . . . . . . . . . . . . . . . . . . . . . . . . . . . . . . . . . 39
Active Section Level Events . . . . . . . . . . . . . . . . . . . . . . . . . . . . . . . . . . . . . . . . . . . . . . . . . . 41
Document Level Events . . . . . . . . . . . . . . . . . . . . . . . . . . . . . . . . . . . . . . . . . . . . . . . . . . . . . 41
Using the Script Editor . . . . . . . . . . . . . . . . . . . . . . . . . . . . . . . . . . . . . . . . . . . . . . . . . . . . . . . . . 42
Object Browser . . . . . . . . . . . . . . . . . . . . . . . . . . . . . . . . . . . . . . . . . . . . . . . . . . . . . . . . . . . . 43
Scripting pane . . . . . . . . . . . . . . . . . . . . . . . . . . . . . . . . . . . . . . . . . . . . . . . . . . . . . . . . . . . . . 43
Description pane and Online Help . . . . . . . . . . . . . . . . . . . . . . . . . . . . . . . . . . . . . . . . . . . . 44
Sample JavaScript Script . . . . . . . . . . . . . . . . . . . . . . . . . . . . . . . . . . . . . . . . . . . . . . . . . . . . . . . . 44
Testing Scripts Using the Execution Window . . . . . . . . . . . . . . . . . . . . . . . . . . . . . . . . . . . . . . . 44
Checking Errors Using the Console Window . . . . . . . . . . . . . . . . . . . . . . . . . . . . . . . . . . . . . . . 44
Finding/Replacing Script . . . . . . . . . . . . . . . . . . . . . . . . . . . . . . . . . . . . . . . . . . . . . . . . . . . . . . . 44
PART II Scripting Reference . . . . . . . . . . . . . . . . . . . . . . . . . . . . . . . . . . . . . . . . . . . . . . . . . . . . . . . . . . . . . 47
CHAPTER 4 Dashboard Scripting Reference. . . . . . . . . . . . . . . . . . . . . . . . . . . . . . . . . . . . . . . . . . . . . . . . . . . . 49
Understanding Functions . . . . . . . . . . . . . . . . . . . . . . . . . . . . . . . . . . . . . . . . . . . . . . . . . . . . . . . 50
Defining Functions . . . . . . . . . . . . . . . . . . . . . . . . . . . . . . . . . . . . . . . . . . . . . . . . . . . . . . . . . 50
Calling Functions . . . . . . . . . . . . . . . . . . . . . . . . . . . . . . . . . . . . . . . . . . . . . . . . . . . . . . . . . . 51
Function Scope . . . . . . . . . . . . . . . . . . . . . . . . . . . . . . . . . . . . . . . . . . . . . . . . . . . . . . . . . . . . 52
Summary of Function Types . . . . . . . . . . . . . . . . . . . . . . . . . . . . . . . . . . . . . . . . . . . . . . . . . 54
Using JavaScript Statements . . . . . . . . . . . . . . . . . . . . . . . . . . . . . . . . . . . . . . . . . . . . . . . . . . . . . 55
Conditional Statements . . . . . . . . . . . . . . . . . . . . . . . . . . . . . . . . . . . . . . . . . . . . . . . . . . . . . 55
Loop Statements . . . . . . . . . . . . . . . . . . . . . . . . . . . . . . . . . . . . . . . . . . . . . . . . . . . . . . . . . . . 58
break Statements . . . . . . . . . . . . . . . . . . . . . . . . . . . . . . . . . . . . . . . . . . . . . . . . . . . . . . . . . . . 61
Manipulating Objects with JavaScript . . . . . . . . . . . . . . . . . . . . . . . . . . . . . . . . . . . . . . . . . . . . . 62
for...in Statement . . . . . . . . . . . . . . . . . . . . . . . . . . . . . . . . . . . . . . . . . . . . . . . . . . . . . . . . . . . 62
with Statement . . . . . . . . . . . . . . . . . . . . . . . . . . . . . . . . . . . . . . . . . . . . . . . . . . . . . . . . . . . . 63
OLE Automation Controller within JavaScript (JOOLE) . . . . . . . . . . . . . . . . . . . . . . . . . . . . . 64
Exporting Scripts to Text Files . . . . . . . . . . . . . . . . . . . . . . . . . . . . . . . . . . . . . . . . . . . . . . . . . . . 66
Space-Saving Variables . . . . . . . . . . . . . . . . . . . . . . . . . . . . . . . . . . . . . . . . . . . . . . . . . . . . . . 67
Case-Sensitive Code . . . . . . . . . . . . . . . . . . . . . . . . . . . . . . . . . . . . . . . . . . . . . . . . . . . . . . . . 68
Assignment Operators Versus Comparison Operators . . . . . . . . . . . . . . . . . . . . . . . . . . . . 68
Conditional Tests . . . . . . . . . . . . . . . . . . . . . . . . . . . . . . . . . . . . . . . . . . . . . . . . . . . . . . . . . . 69
Syntax Reference . . . . . . . . . . . . . . . . . . . . . . . . . . . . . . . . . . . . . . . . . . . . . . . . . . . . . . . . . . . 70
Recalculating Results . . . . . . . . . . . . . . . . . . . . . . . . . . . . . . . . . . . . . . . . . . . . . . . . . . . . . . . 71
Designing Your Script . . . . . . . . . . . . . . . . . . . . . . . . . . . . . . . . . . . . . . . . . . . . . . . . . . . . . . 71
Code Entry . . . . . . . . . . . . . . . . . . . . . . . . . . . . . . . . . . . . . . . . . . . . . . . . . . . . . . . . . . . . . . . 72
Bypass Errors . . . . . . . . . . . . . . . . . . . . . . . . . . . . . . . . . . . . . . . . . . . . . . . . . . . . . . . . . . . . . 73
Getting Help with a Problem Script . . . . . . . . . . . . . . . . . . . . . . . . . . . . . . . . . . . . . . . . . . . 73
Contents v
CHAPTER 5 Object Model Map. . . . . . . . . . . . . . . . . . . . . . . . . . . . . . . . . . . . . . . . . . . . . . . . . . . . . . . . . . . . . . . 75
CHAPTER 6 JavaScript Examples . . . . . . . . . . . . . . . . . . . . . . . . . . . . . . . . . . . . . . . . . . . . . . . . . . . . . . . . . . . . . 85
Retrieving and Setting the Properties of an Object . . . . . . . . . . . . . . . . . . . . . . . . . . . . . . . . . . . 86
Enabling and Disabling Controls . . . . . . . . . . . . . . . . . . . . . . . . . . . . . . . . . . . . . . . . . . . . . . . . . 87
Controlling the Visibility of Graphics and Controls . . . . . . . . . . . . . . . . . . . . . . . . . . . . . . . . . . 87
Creating an OCE (connection file) . . . . . . . . . . . . . . . . . . . . . . . . . . . . . . . . . . . . . . . . . . . . . . . . 88
Displaying a Connection Login Box . . . . . . . . . . . . . . . . . . . . . . . . . . . . . . . . . . . . . . . . . . . . . . . 88
Display Differences . . . . . . . . . . . . . . . . . . . . . . . . . . . . . . . . . . . . . . . . . . . . . . . . . . . . . . . . . 89
Conversion of Detail Report Categories . . . . . . . . . . . . . . . . . . . . . . . . . . . . . . . . . . . . . . . . 89
Conversion of Data Area . . . . . . . . . . . . . . . . . . . . . . . . . . . . . . . . . . . . . . . . . . . . . . . . . . . . . 89
Conversion of Facts . . . . . . . . . . . . . . . . . . . . . . . . . . . . . . . . . . . . . . . . . . . . . . . . . . . . . . . . . 90
Conversion of Smart Reports . . . . . . . . . . . . . . . . . . . . . . . . . . . . . . . . . . . . . . . . . . . . . . . . . 90
Conversion of Graphic Objects . . . . . . . . . . . . . . . . . . . . . . . . . . . . . . . . . . . . . . . . . . . . . . . 90
Downloading Data Models . . . . . . . . . . . . . . . . . . . . . . . . . . . . . . . . . . . . . . . . . . . . . . . . . . . . . . 90
Displaying a Table Catalog . . . . . . . . . . . . . . . . . . . . . . . . . . . . . . . . . . . . . . . . . . . . . . . . . . . . . . . 91
Adding Topics to a Data Model Section . . . . . . . . . . . . . . . . . . . . . . . . . . . . . . . . . . . . . . . . . . . . 91
Setting up Topic Object Variables . . . . . . . . . . . . . . . . . . . . . . . . . . . . . . . . . . . . . . . . . . . . . . . . . 91
Adding Joins . . . . . . . . . . . . . . . . . . . . . . . . . . . . . . . . . . . . . . . . . . . . . . . . . . . . . . . . . . . . . . . . . . 91
Adding Items to the Request Line . . . . . . . . . . . . . . . . . . . . . . . . . . . . . . . . . . . . . . . . . . . . . . . . . 92
Adding a Computed Column to a Query Request Line . . . . . . . . . . . . . . . . . . . . . . . . . . . . . . . 92
Creating and Setting Variable Limits . . . . . . . . . . . . . . . . . . . . . . . . . . . . . . . . . . . . . . . . . . . . . . 92
Using a BrioQuery 5.5 Limit Dialog Box andStoring Selected Value in Text Box . . . . . . . . . . . . . . . . . . . . . . . . . . . . . . . . . . . . . . . . . . . . . . . . 92
Turning off the Page Headers for the First Page in the Report . . . . . . . . . . . . . . . . . . . . . . . . . . 93
Turning off the Prompt To Save Dialog Box . . . . . . . . . . . . . . . . . . . . . . . . . . . . . . . . . . . . . . . . 93
CHAPTER 7 TroubleShooting Scripts . . . . . . . . . . . . . . . . . . . . . . . . . . . . . . . . . . . . . . . . . . . . . . . . . . . . . . . . . . 95
Case-Sensitive Code . . . . . . . . . . . . . . . . . . . . . . . . . . . . . . . . . . . . . . . . . . . . . . . . . . . . . . . . . . . . 96
Assignment Operators Versus Comparison Operators . . . . . . . . . . . . . . . . . . . . . . . . . . . . . . . . 97
Conditional Tests . . . . . . . . . . . . . . . . . . . . . . . . . . . . . . . . . . . . . . . . . . . . . . . . . . . . . . . . . . . . . . 97
Syntax Reference . . . . . . . . . . . . . . . . . . . . . . . . . . . . . . . . . . . . . . . . . . . . . . . . . . . . . . . . . . . . . . . 99
Recalculating Results . . . . . . . . . . . . . . . . . . . . . . . . . . . . . . . . . . . . . . . . . . . . . . . . . . . . . . . . . . . 99
Designing Your Script . . . . . . . . . . . . . . . . . . . . . . . . . . . . . . . . . . . . . . . . . . . . . . . . . . . . . . . . . 100
Code Entry . . . . . . . . . . . . . . . . . . . . . . . . . . . . . . . . . . . . . . . . . . . . . . . . . . . . . . . . . . . . . . . . . . 101
Bypass Errors . . . . . . . . . . . . . . . . . . . . . . . . . . . . . . . . . . . . . . . . . . . . . . . . . . . . . . . . . . . . . . . . 101
Getting Help with a Problem Script . . . . . . . . . . . . . . . . . . . . . . . . . . . . . . . . . . . . . . . . . . . . . . 102
CHAPTER 8 Designing for the Hyperion System 9 BI + Workspace. . . . . . . . . . . . . . . . . . . . . . . . . . . . . . . . . . 103
Components . . . . . . . . . . . . . . . . . . . . . . . . . . . . . . . . . . . . . . . . . . . . . . . . . . . . . . . . . . . . . . 104
Performance . . . . . . . . . . . . . . . . . . . . . . . . . . . . . . . . . . . . . . . . . . . . . . . . . . . . . . . . . . . . . . 104
vi Contents
Highlights of the Workspace . . . . . . . . . . . . . . . . . . . . . . . . . . . . . . . . . . . . . . . . . . . . . . . . . . . 105
General Features Design and Use . . . . . . . . . . . . . . . . . . . . . . . . . . . . . . . . . . . . . . . . . . . . 107
OLAPQuery Section Design and Use . . . . . . . . . . . . . . . . . . . . . . . . . . . . . . . . . . . . . . . . . 108
Results and Table Sections Design and Use . . . . . . . . . . . . . . . . . . . . . . . . . . . . . . . . . . . . 108
Pivot Section Design and Use . . . . . . . . . . . . . . . . . . . . . . . . . . . . . . . . . . . . . . . . . . . . . . . 109
Chart Section Design and Use . . . . . . . . . . . . . . . . . . . . . . . . . . . . . . . . . . . . . . . . . . . . . . . 109
Dashboard Section Design and Use . . . . . . . . . . . . . . . . . . . . . . . . . . . . . . . . . . . . . . . . . . 110
Report Section Design and Use . . . . . . . . . . . . . . . . . . . . . . . . . . . . . . . . . . . . . . . . . . . . . . 110
Creating a Pre-Defined Drill-Down Path . . . . . . . . . . . . . . . . . . . . . . . . . . . . . . . . . . . . . . . . . 110
Chart Sizing . . . . . . . . . . . . . . . . . . . . . . . . . . . . . . . . . . . . . . . . . . . . . . . . . . . . . . . . . . . . . . . . . 112
Locating Errors . . . . . . . . . . . . . . . . . . . . . . . . . . . . . . . . . . . . . . . . . . . . . . . . . . . . . . . . . . . . . . 112
Console Window . . . . . . . . . . . . . . . . . . . . . . . . . . . . . . . . . . . . . . . . . . . . . . . . . . . . . . . . . 112
Error Logs . . . . . . . . . . . . . . . . . . . . . . . . . . . . . . . . . . . . . . . . . . . . . . . . . . . . . . . . . . . . . . . 112
try-catch block . . . . . . . . . . . . . . . . . . . . . . . . . . . . . . . . . . . . . . . . . . . . . . . . . . . . . . . . . . . 112
Controls . . . . . . . . . . . . . . . . . . . . . . . . . . . . . . . . . . . . . . . . . . . . . . . . . . . . . . . . . . . . . . . . . . . . 113
Control Object Properties . . . . . . . . . . . . . . . . . . . . . . . . . . . . . . . . . . . . . . . . . . . . . . . . . . 113
Graphics Objects . . . . . . . . . . . . . . . . . . . . . . . . . . . . . . . . . . . . . . . . . . . . . . . . . . . . . . . . . . . . . 113
Borders and Background/Font . . . . . . . . . . . . . . . . . . . . . . . . . . . . . . . . . . . . . . . . . . . . . . . . . . 114
Embedded Objects . . . . . . . . . . . . . . . . . . . . . . . . . . . . . . . . . . . . . . . . . . . . . . . . . . . . . . . . . . . 114
Events . . . . . . . . . . . . . . . . . . . . . . . . . . . . . . . . . . . . . . . . . . . . . . . . . . . . . . . . . . . . . . . . . . . . . . 116
Document Events . . . . . . . . . . . . . . . . . . . . . . . . . . . . . . . . . . . . . . . . . . . . . . . . . . . . . . . . . 116
Dashboard Section Events . . . . . . . . . . . . . . . . . . . . . . . . . . . . . . . . . . . . . . . . . . . . . . . . . . 117
Dashboard Object Events . . . . . . . . . . . . . . . . . . . . . . . . . . . . . . . . . . . . . . . . . . . . . . . . . . . 117
Client-Side JavaScript . . . . . . . . . . . . . . . . . . . . . . . . . . . . . . . . . . . . . . . . . . . . . . . . . . . . . . . . . 117
Client Status . . . . . . . . . . . . . . . . . . . . . . . . . . . . . . . . . . . . . . . . . . . . . . . . . . . . . . . . . . . . . 118
Client-Side Events . . . . . . . . . . . . . . . . . . . . . . . . . . . . . . . . . . . . . . . . . . . . . . . . . . . . . . . . . 119
Text Box Events and Properties . . . . . . . . . . . . . . . . . . . . . . . . . . . . . . . . . . . . . . . . . . . . . . 119
Alert Dialog . . . . . . . . . . . . . . . . . . . . . . . . . . . . . . . . . . . . . . . . . . . . . . . . . . . . . . . . . . . . . . . . . 120
Toolbars . . . . . . . . . . . . . . . . . . . . . . . . . . . . . . . . . . . . . . . . . . . . . . . . . . . . . . . . . . . . . . . . . . . . 120
Excluded Objects . . . . . . . . . . . . . . . . . . . . . . . . . . . . . . . . . . . . . . . . . . . . . . . . . . . . . . . . . 121
Interactive Reporting Toolbar . . . . . . . . . . . . . . . . . . . . . . . . . . . . . . . . . . . . . . . . . . . . . . . 121
Paging Icons . . . . . . . . . . . . . . . . . . . . . . . . . . . . . . . . . . . . . . . . . . . . . . . . . . . . . . . . . . . . . 122
Paging Toolbar . . . . . . . . . . . . . . . . . . . . . . . . . . . . . . . . . . . . . . . . . . . . . . . . . . . . . . . . . . . 122
Event Controls for Toolbar Display . . . . . . . . . . . . . . . . . . . . . . . . . . . . . . . . . . . . . . . . . . 123
The Workspace Document Display . . . . . . . . . . . . . . . . . . . . . . . . . . . . . . . . . . . . . . . . . . 123
Personal Pages . . . . . . . . . . . . . . . . . . . . . . . . . . . . . . . . . . . . . . . . . . . . . . . . . . . . . . . . . . . . 124
Pre-Generated HTML . . . . . . . . . . . . . . . . . . . . . . . . . . . . . . . . . . . . . . . . . . . . . . . . . . . . . 124
Section 508 Compliance . . . . . . . . . . . . . . . . . . . . . . . . . . . . . . . . . . . . . . . . . . . . . . . . . . . 124
Accessibility . . . . . . . . . . . . . . . . . . . . . . . . . . . . . . . . . . . . . . . . . . . . . . . . . . . . . . . . . . . . . . . . . 125
Primary Use Case . . . . . . . . . . . . . . . . . . . . . . . . . . . . . . . . . . . . . . . . . . . . . . . . . . . . . . . . . 125
Guided Analysis and Reporting . . . . . . . . . . . . . . . . . . . . . . . . . . . . . . . . . . . . . . . . . . . . . . . . . 125
Processing the Point of View (POV) . . . . . . . . . . . . . . . . . . . . . . . . . . . . . . . . . . . . . . . . . . 126

Contents vii
Parsing a SmartCut . . . . . . . . . . . . . . . . . . . . . . . . . . . . . . . . . . . . . . . . . . . . . . . . . . . . . . . . 126
Traverse the Object Model Tree . . . . . . . . . . . . . . . . . . . . . . . . . . . . . . . . . . . . . . . . . . . . . . 126
Object Model Exclusion List . . . . . . . . . . . . . . . . . . . . . . . . . . . . . . . . . . . . . . . . . . . . . . . . . . . . 127
User Embedded HTML . . . . . . . . . . . . . . . . . . . . . . . . . . . . . . . . . . . . . . . . . . . . . . . . . . . . . . . . 130
Glossary . . . . . . . . . . . . . . . . . . . . . . . . . . . . . . . . . . . . . . . . . . . . . . . . . . . . . . . . . . . . . . . . . . . . . . 133
Index . . . . . . . . . . . . . . . . . . . . . . . . . . . . . . . . . . . . . . . . . . . . . . . . . . . . . . . . . . . . . . . . . . . . . . . . 143

viii Contents
Preface ix
Preface
Welcome to the Hyperion System 9 BI+ Interactive Reporting Object Model and Dashboard Development Services Developer’s Guide, Volume I: Dashboard Design Guide. This preface discusses the following topics:
● “Purpose” on page x
● “Audience” on page x
● “Document Structure” on page x
● “Related Documents” on page x
● “Where to Find Documentation” on page xi
● “Help Menu Commands” on page xi
● “Conventions” on page xii
● “Additional Support” on page xiii

x Preface
PurposeThe Hyperion System 9 BI+ Interactive Reporting™ Object Model and Dashboard Development Services Developer’s Guide, Volume I: Dashboard Design Guide describes how to create custom applications in the Dashboard section, how to use JavaScript to script and to control Interactive Reporting documents (.bqys), how JavaScript programs are interpreted by the Interactive Reporting engine, how JavaScript programs are used to provide dynamic control of a document, and how JavaScript is used to respond to user events and the document life cycle.
AudienceThis book is written for developers and designers who create documents using Hyperion System 9 BI+ Interactive Reporting Studio™ and Interactive Reporting Web Client™ (those users with Data Model and Analyze, or Query and Analyze privileges) and who need to create front-ends using the Dashboard functionality.
Document StructureVolume I: Dashboard Design Guide is one of seven books that explain how to use Interactive Reporting. This book contains two main parts:
● Part I, “Overview,” provides an overview of the Dashboard section and introduces the Interactive Reporting object model and JavaScript, an object-oriented programming language.
● Part II, “Scripting Reference,” describes the structure of applications scripted in the Interactive Reporting object model and provides general reference and troubleshooting information.
Related DocumentsIn addition to the Hyperion System 9 BI+ Interactive Reporting Object Model and Dashboard Development Services Developer’s Guide, Volume 1: Dashboard Design Guide the following documentation is available:
Hyperion System 9 BI+ Interactive Reporting Studio User’s Guide provides an overview of Interactive Reporting and explains the user interface and basic commands. It includes how to retrieve data, how to query new data and change existing queries, and how to query a single database as well as multiple databases. It also covers how to work with query results.
Hyperion System 9 BI+ Interactive Reporting Object Model and Dashboard Development Services Developer’s Guide, Volume II: Object Model Guide to Properties and Collections describes the objects used in the Interactive Reporting Object Model.
Hyperion System 9 BI+ Interactive Reporting Object Model and Dashboard Development Services Developer’s Guide, Volume III: Object Model Guide to Methods describes the methods used in the Interactive Reporting Object Model.

Help Menu Commands xi
Hyperion System 9 BI+ Interactive Reporting Object Model and Dashboard Development Services Developer’s Guide, Volume IV: Object Model Guide to Properties and Constants describes the properties and constants used in the Interactive Reporting Object Model.
Hyperion System 9 BI+ Interactive Reporting Object Model and Dashboard Development Services Developer’s Guide, Volume V: Dashboard Studio Dashboard Studio presents the wizard that works with a set of extensible and customizable templates to create interactive, analytical dashboards without the need to write programming logic.
Hyperion System 9 BI+ Interactive Reporting Object Model and Dashboard Development Services Developer’s Guide, Volume VI: Architect discusses the integrated development environment for Interactive Reporting Studio, that can be used to edit and debug JavaScript.
Where to Find DocumentationAll Interactive Reporting documentation is accessible from the following locations:
● The HTML Information Map is available from the Interactive Reporting Help menu for all operating systems; for products installed on Microsoft Windows systems, it is also available from the Start menu.
● Online help is available from within Interactive Reporting After you log on to the product, you can access online help by clicking the Help button or selecting Help from the menu bar.
● The Hyperion Download Center can be accessed from the Hyperion Solutions Web site.
➤ To access documentation from the Hyperion Download Center:
1 Go to the Hyperion Solutions Web site and navigate to Services > WorldWide Support > Download Center.
Note: Your Login ID for the Hyperion Download Center is your e-mail address. The Login ID and Password required for the Hyperion Download Center are different from the Login ID and Password required for Hyperion Support Online through Hyperion.com. If you are not sure whether you have a Hyperion Download Center account, follow the on-screen instructions.
2 In the Login ID and Password text boxes, enter your e-mail address and password.
3 In the Language list box, select the appropriate language and click Login.
4 If you are a member on multiple Hyperion Solutions Download Center accounts, select the account that you want to use for the current session.
5 To access documentation online, from the Product List, select the appropriate product and follow the on-screen instructions.
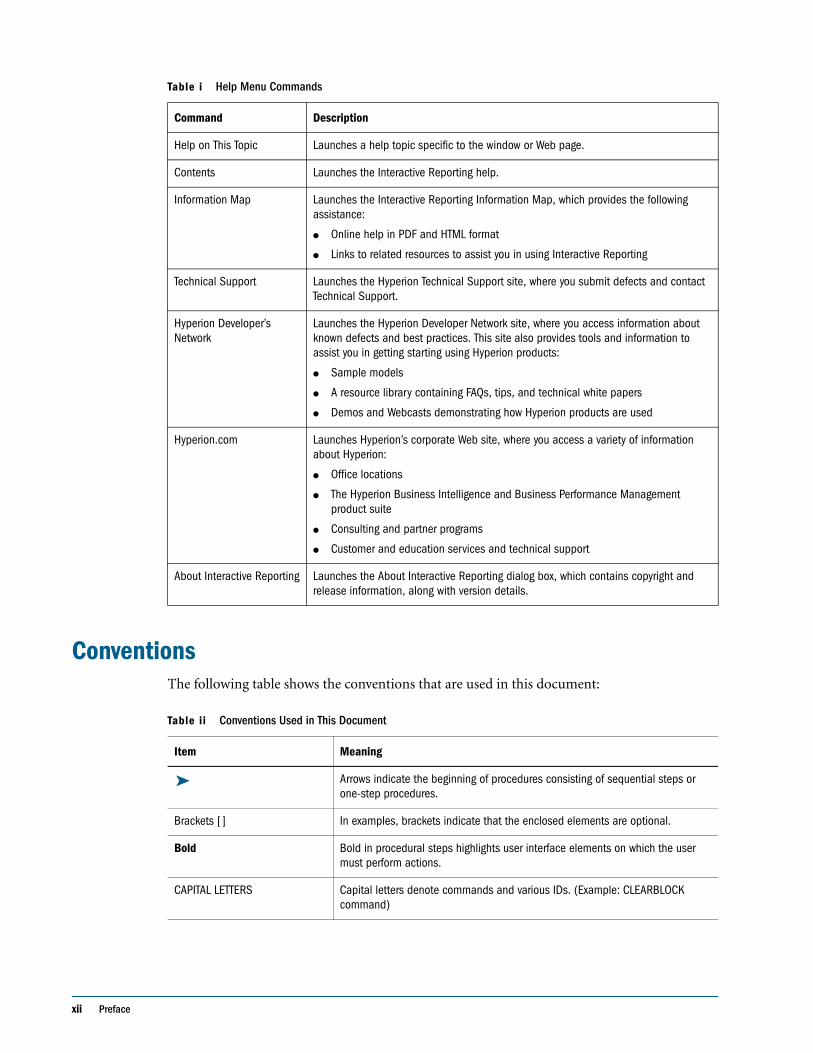
Help Menu CommandsTable i describes the commands that are available from the Help menu in Interactive Reporting.
xii Preface
ConventionsThe following table shows the conventions that are used in this document:
Table i Help Menu Commands
Command Description
Help on This Topic Launches a help topic specific to the window or Web page.
Contents Launches the Interactive Reporting help.
Information Map Launches the Interactive Reporting Information Map, which provides the following assistance:
● Online help in PDF and HTML format
● Links to related resources to assist you in using Interactive Reporting
Technical Support Launches the Hyperion Technical Support site, where you submit defects and contact Technical Support.
Hyperion Developer’s Network
Launches the Hyperion Developer Network site, where you access information about known defects and best practices. This site also provides tools and information to assist you in getting starting using Hyperion products:
● Sample models
● A resource library containing FAQs, tips, and technical white papers
● Demos and Webcasts demonstrating how Hyperion products are used
Hyperion.com Launches Hyperion’s corporate Web site, where you access a variety of information about Hyperion:
● Office locations
● The Hyperion Business Intelligence and Business Performance Management product suite
● Consulting and partner programs
● Customer and education services and technical support
About Interactive Reporting Launches the About Interactive Reporting dialog box, which contains copyright and release information, along with version details.
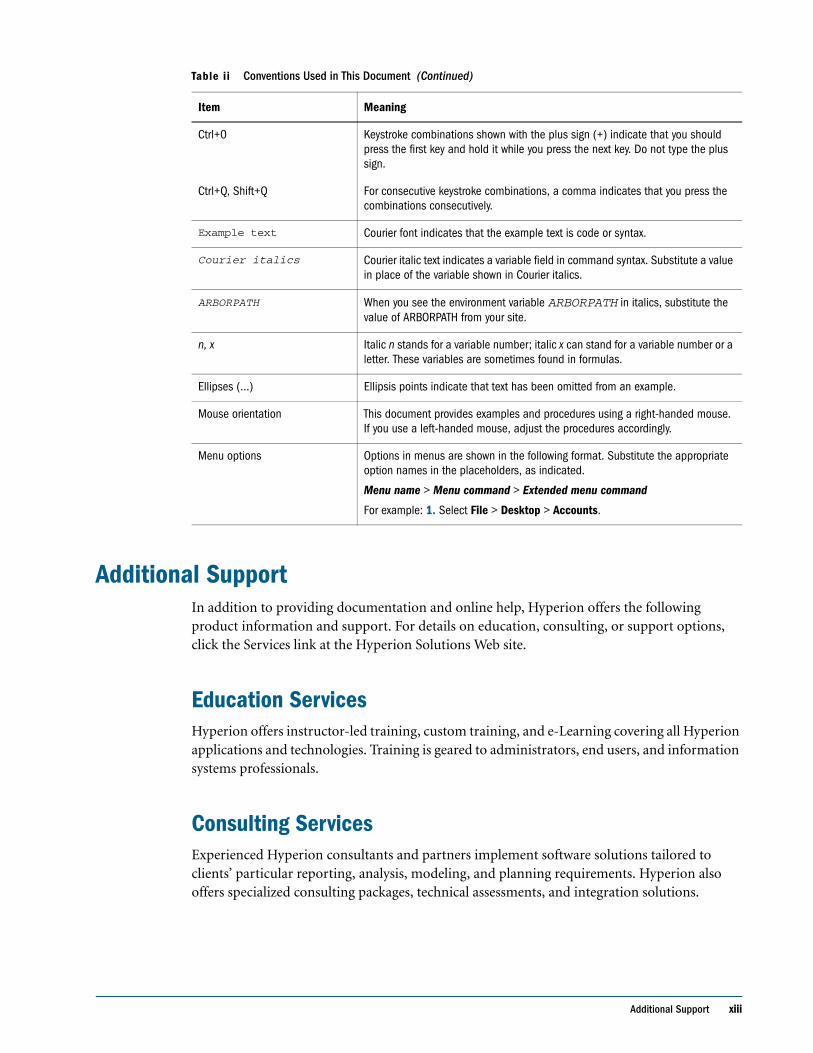
Table ii Conventions Used in This Document
Item Meaning
Arrows indicate the beginning of procedures consisting of sequential steps or one-step procedures.
Brackets [] In examples, brackets indicate that the enclosed elements are optional.
Bold Bold in procedural steps highlights user interface elements on which the user must perform actions.
CAPITAL LETTERS Capital letters denote commands and various IDs. (Example: CLEARBLOCK command)
➤
Additional Support xiii
Additional SupportIn addition to providing documentation and online help, Hyperion offers the following product information and support. For details on education, consulting, or support options, click the Services link at the Hyperion Solutions Web site.
Education ServicesHyperion offers instructor-led training, custom training, and e-Learning covering all Hyperion applications and technologies. Training is geared to administrators, end users, and information systems professionals.
Consulting ServicesExperienced Hyperion consultants and partners implement software solutions tailored to clients’ particular reporting, analysis, modeling, and planning requirements. Hyperion also offers specialized consulting packages, technical assessments, and integration solutions.
Ctrl+0 Keystroke combinations shown with the plus sign (+) indicate that you should press the first key and hold it while you press the next key. Do not type the plus sign.
Ctrl+Q, Shift+Q For consecutive keystroke combinations, a comma indicates that you press the combinations consecutively.
Example text Courier font indicates that the example text is code or syntax.
Courier italics Courier italic text indicates a variable field in command syntax. Substitute a value in place of the variable shown in Courier italics.
ARBORPATH When you see the environment variable ARBORPATH in italics, substitute the value of ARBORPATH from your site.
n, x Italic n stands for a variable number; italic x can stand for a variable number or a letter. These variables are sometimes found in formulas.
Ellipses (...) Ellipsis points indicate that text has been omitted from an example.
Mouse orientation This document provides examples and procedures using a right-handed mouse. If you use a left-handed mouse, adjust the procedures accordingly.
Menu options Options in menus are shown in the following format. Substitute the appropriate option names in the placeholders, as indicated.
Menu name > Menu command > Extended menu command
For example: 1. Select File > Desktop > Accounts.
Table ii Conventions Used in This Document (Continued)
Item Meaning
xiv Preface
Technical SupportHyperion provides enhanced telephone and electronic-based support to clients to resolve product issues quickly and accurately. This support is available for all Hyperion products at no additional cost to clients with current maintenance agreements.
Documentation FeedbackHyperion strives to provide complete and accurate documentation. Your opinion on the documentation is of value, so please send your comments by going to http://www.hyperion.com/services/support_programs/doc_survey/index.cfm.

Overview 15
P a r t I
Overview

16 Overview
Dashboards 17
C h a p t e r
1Dashboards
A Dashboard is a customizable document front-end that makes it easy for developers to build and deploy analytic applications and for end users to access information.
This chapter provides an overview of the Dashboard section and explains how to create and work with Dashboard sections, and how to use Dashboard objects and properties.
In This Chapter Dashboard Section . . . . . . . . . . . . . . . . . . . . . . . . . . . . . . . . . . . . . . . . . . . . . . . . . . . . . . . . . . . . . . . . . . . . . . . . 18
Working with the Dashboard Section . . . . . . . . . . . . . . . . . . . . . . . . . . . . . . . . . . . . . . . . . . . . . . . . . . . . . . . . . . . 18
Working with Dashboard Objects . . . . . . . . . . . . . . . . . . . . . . . . . . . . . . . . . . . . . . . . . . . . . . . . . . . . . . . . . . . . . . 19
External Content in Dashboards . . . . . . . . . . . . . . . . . . . . . . . . . . . . . . . . . . . . . . . . . . . . . . . . . . . . . . . . . . . . . . . 21
Embedded Pivot Section Interactivity . . . . . . . . . . . . . . . . . . . . . . . . . . . . . . . . . . . . . . . . . . . . . . . . . . . . . . . . . . . 30
Setting Dashboard Properties. . . . . . . . . . . . . . . . . . . . . . . . . . . . . . . . . . . . . . . . . . . . . . . . . . . . . . . . . . . . . . . . . 31
Using Design Tools . . . . . . . . . . . . . . . . . . . . . . . . . . . . . . . . . . . . . . . . . . . . . . . . . . . . . . . . . . . . . . . . . . . . . . . . 32
Dashboard Menu Command Reference . . . . . . . . . . . . . . . . . . . . . . . . . . . . . . . . . . . . . . . . . . . . . . . . . . . . . . . . . 35
18 Dashboards
Dashboard SectionThe Dashboard section provides a streamlined, push-button approach to querying a database. Through the Dashboard section, application designers can quickly combine report sections and enhanced Dashboard controls to build and deploy analytic applications that deliver prepackaged business content, including:
● Simple forms to collect multiple input parameters for a report
● Executive dashboard applications, complete with visual drill-down from high-level metrics to underlying data content
● Browser-style navigation pages to assist users in maneuvering around and between documents
Interactive Reporting Studio and Interactive Reporting Web Client enable developers to customize the Dashboard section to create an interface that focuses on precisely those views of the data that are relevant to the end user. When an end users opens a Interactive Reporting document, the customized Dashboard section is displayed as the document front-end. The user can navigate the Dashboard section with a click of a button, enter parameters, and run reports without any in-depth knowledge of the data structure or the Interactive Reporting Studio and Interactive Reporting Web Client applications. Each button click, item selection, or navigation sequence invokes a script which the Interactive Reporting Studio and Interactive Reporting Web Client applications process in the background.
You customize an Dashboard section by dragging objects from the Catalog pane to the Content pane, and then attaching scripts to them that are executed in response to an event or action.
Working with the Dashboard SectionLike other report sections, the Dashboard section is a section you add to a Interactive Reporting document. The Dashboard section always is displayed at the top of the Section pane.
Inserting a Dashboard SectionWhen you add a new Dashboard section, it is listed after any existing Dashboard sections.
➤ To insert a new Dashboard section, select Insert > New Dashboard.
Working with Dashboard Objects 19
Renaming an Dashboard SectionThe first Dashboard section inserted in a document is given the default section name of Dashboard. Subsequent Dashboard sections are numbered sequentially, for example, Dashboard2, Dashboard3, Dashboard4, and so on.
➤ To rename an Dashboard section:
1 In the Section pane, select the Dashboard section that you want to rename.
2 Select Edit > Rename Section.
The Section Label dialog box is displayed.
3 Enter a new name in the Label field and click OK.
Deleting an Dashboard Section
➤ To delete an Dashboard Section:
1 In the Section pane, select the Dashboard section that you want to delete.
2 Select Edit > Delete Section.
The Delete Section dialog box is displayed.
3 Click Delete.
Switching Between Design and Run ModesThe Dashboard section has two modes:
● Design mode – Used when designing the Dashboard section. In Design mode, the objects available to include in the Dashboard section are displayed in the Catalog pane.
● Run mode – Used when deploying the Dashboard section to end users. This is the default mode for all Dashboard sections. The Catalog pane is empty in Run mode.
All Dashboard sections are always in the same mode. Interactive Reporting documents open by default with Dashboard sections in Run mode. Changing one Dashboard section to Design mode changes all Dashboard sections to Design mode.
➤ To toggle between Design mode and Run mode, select Dashboard > Design Mode.
Working with Dashboard ObjectsThere are a variety of embeddable objects to help you construct a custom Dashboard section, including:
● Sections – Results, Chart, Pivot, Table, and OLAP sections from the active document. When you embed a section, it is automatically resized to fit. Data in embedded sections are automatically updated to reflect any changes made in the original section.
20 Dashboards
Note: In Run mode, active embedded tables and results have the Sort Ascending and Sort Descending options available on the shortcut menu. You can also resize Table and Results columns.
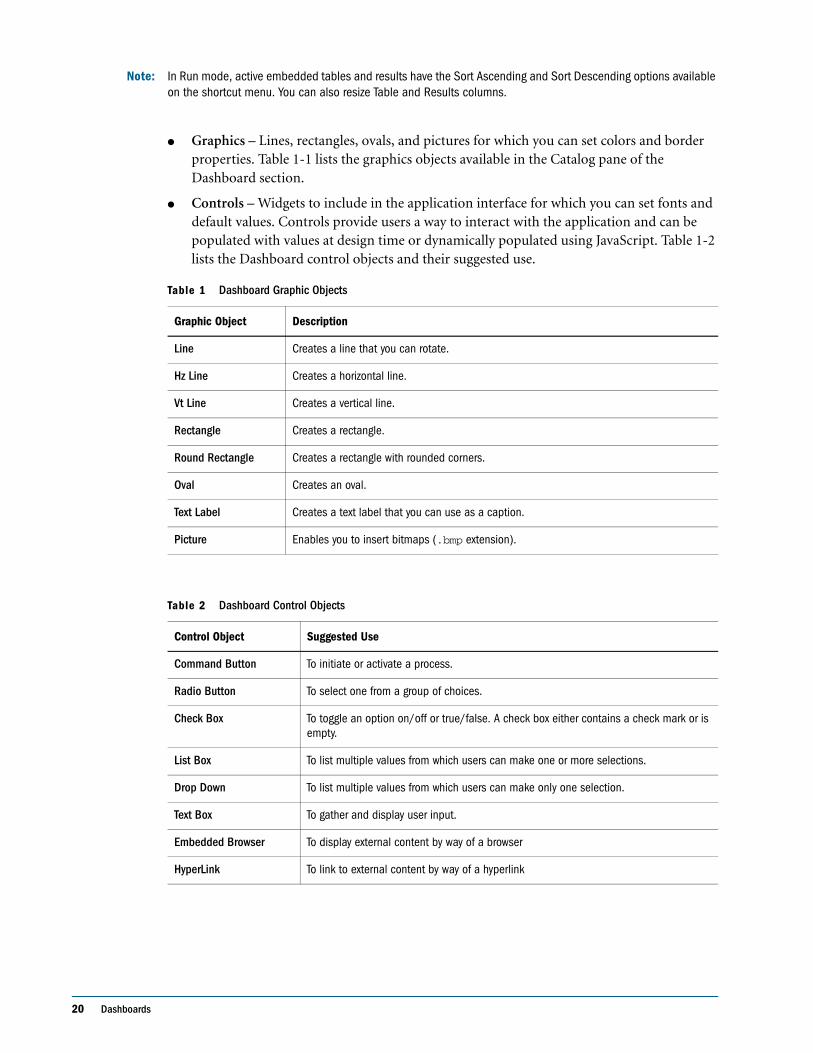
● Graphics – Lines, rectangles, ovals, and pictures for which you can set colors and border properties. Table 1-1 lists the graphics objects available in the Catalog pane of the Dashboard section.
● Controls – Widgets to include in the application interface for which you can set fonts and default values. Controls provide users a way to interact with the application and can be populated with values at design time or dynamically populated using JavaScript. Table 1-2 lists the Dashboard control objects and their suggested use.
Table 1 Dashboard Graphic Objects
Graphic Object Description
Line Creates a line that you can rotate.
Hz Line Creates a horizontal line.
Vt Line Creates a vertical line.
Rectangle Creates a rectangle.
Round Rectangle Creates a rectangle with rounded corners.
Oval Creates an oval.
Text Label Creates a text label that you can use as a caption.
Picture Enables you to insert bitmaps (.bmp extension).
Table 2 Dashboard Control Objects
Control Object Suggested Use
Command Button To initiate or activate a process.
Radio Button To select one from a group of choices.
Check Box To toggle an option on/off or true/false. A check box either contains a check mark or is empty.
List Box To list multiple values from which users can make one or more selections.
Drop Down To list multiple values from which users can make only one selection.
Text Box To gather and display user input.
Embedded Browser To display external content by way of a browser
HyperLink To link to external content by way of a hyperlink

External Content in Dashboards 21
Inserting Dashboard Objects
➤ To embed an object in an Dashboard section:
1 Choose Dashboard > Design Mode. [Ctrl+D]
2 In the Catalog pane, expand the folder that contains the object you want to insert.
3 Click the object you want to insert and drag it to the Content pane.
➤ To insert control and graphic objects:
1 Select Dashboard > Design Mode [Ctrl+D]
2 Go to the Dashboard Menu.
3 Select Dashboard > Insert Graphic > Option or Insert Control > Option.
Select a graphic or control object from the menu.
4 Click the Contents pane to insert the control or graphic.
Deleting Dashboard Objects
➤ To delete embedded sections, controls, and graphics:
1 Select Dashboard > Design Mode. [Ctrl+D]
2 In the Content pane, select the object you want to delete.
To select multiple objects, press and hold [Ctrl] while selecting objects. Notice the selection handles that display.
3 Select Dashboard > Remove Selected Items. [Ctrl+D]
External Content in DashboardsExternal web based content can be brought into your dashboard in combination with your analytical reports sections to deliver a powerful tool for your enterprise report. You can embed a stock ticker, calendar, document objects (Interactive Reporting documents, Interactive Reporting Jobs, Hyperion System 9 BI+ Production Reporting™ Jobs (SQR jobs), Hyperion System 9 BI+ Web Analysis™ (Analyzer) or Hyperion System 9 BI+ Financial Reporting™ (Hyperion Reports) or launch the content of a URL based hyperlink in a separate window.
Ttwo controls are available for working with external content, including:
● Embedded Browser control – This control is an instance of a web browser window, positioned at an arbitrary location and size on the page. It is similar to an embedded section object, except that the content is anything that can be referenced externally by a URL (and rendered in a web browser window), rather than a section. There are no recognizable events in the embedded browser and you can not create scripts on this object.
● Hyperlink control - A URL based hyperlink control. The content may be displayed in a pop-up window or the current window.

22 Dashboards
Embedded Browser ControlAn embedded browser control renders and executes in all Interactive Reporting environments (Interactive Reporting Studio Designer, Explorer, the Interactive Reporting Web Client, and the Hyperion® System™ 9 BI+ ™ Workspace™).
Like the other Dashboard controls, the Embedded Browser control shares the same standard attributes and behaviors as an existing Dashboard control as demonstrated below:
● an Embedded Browser control is added to the Dashboard section (in Dashboard design mode) by dragging an instance of the control from Catalog pane, sizing it, and setting properties.
● an Embedded Browser control uses the same common properties: Name, Visible, Locked, Tab order, Accessibility, cut/copy/paste, auto alignment and sizing.
An Embedded Browser control has additional properties that are similar to embedded sections, including:
● Show Scrollbars
● Reference to the content – For the embedded section, the reference is the name of a Chart, Pivot, or Table that is contained in the Interactive Reporting document. For the Embedded Browser control, the reference is an URL. If the content is some generic URL from the web (such as a stock ticker), the designer can reference it by simply entering the URL directly. If the content is a document in the repository, then the designer can optionally select the document and desired parameters by way of easy to use GUI controls (which create the appropriate Smartcut URL “under-the-covers”).
Note: Interactive Reporting document Report sections displayed in embedded browser objects of another Interactive Reporting document cannot be printed.
➤ To create a new instance of an Embedded Browser control:
1 Select Insert > New Dashboard to add a new Dashboard section to the document.
Inserting a new Dashboard section changes the document to Design mode. The Content pane is blank and the Catalog pane is displayed the sections, graphics, and control objects available for embedding in a Dashboard section.
2 Expand the Controls folder in the Catalog pane.
3 Drag the Embedded Browser control from the Catalog pane to the Content pane.
4 Double-click the control object to display the Objects dialog box.
5 Type a new entry in the Name field.
Enter a name that identifies the unique name of the embedded browser object. The default for the name is EmbeddedBrowser followed by a unique number identifying the Embedded Browser object.
6 Type a new entry in the Title field.
The Title field is only used when the Dashboard section is printed.
External Content in Dashboards 23
7 Select the Visible check box to display the Embedded Browser control when the Dashboard section is executed.
If the check box is not selected, the Embedded Browser control is hidden. The default value is checked.
8 Select the Locked check box to prevent the Embedded Browser control from being moved or deleted in the Dashboard Design mode. The default value is unchecked.
9 Select a scrolling option from the Show Scrollbar drop down to indicate when scroll bars get displayed on the Embedded Content control.
Available scroll bar options are:
● Always
● Never
● Automatic
Automatic is the default scroll bar option.
10 To explicitly define the URL of the content to be displayed in the Embedded Browser, type the URL address in the URL field.
When the embedded browser is rendered, the URL is used “as is” (the server information is not prepended in any circumstance).
You can reference Hyperion System 9 BI + Repository content by entering an explicit URL. In this case the URL is treated like any other external reference (there is no special authentication support).
It is important to plan how well the content of the URL is displayed in the Embedded Browser. It is possible that an action from within the embedded content could result in the entire browser being replaced rather than just the contents of the Embedded Browser control.
11 To select a repository document (and associated properties) or object to be displayed in the Embedded Browser control or HyperLink object, select the Repository check box and specify the following:
● Document – Use the document text box to manually enter the path and name of the desired Repository document.
● Browse – Click the Browse button to interactively browse the Hyperion System 9 BI + Repository for the desired document by way of the Browse dialog box. To manually enter the path and name of the desired Repository document, use the Document text box.
● Options – Launches the Document Options dialog box so that you can select display properties for a selected Hyperion System 9 BI + Workspace document. For more information, see Document Options.
12 Click OK.
Referencing a Name with a Single-byte CharacterIf you are using the Embedded Browser control of the Dashboard section to embed content from the repository, and it references a name (for example, file name, directory, section, parameter) that contains a single-byte character with a value greater than 127 (for example, accent characters), and the SmartCut encoding for URLs is set to “default”, then the characters display as scrambled and the embedded content may not display properly.

24 Dashboards
➤ To change the encoding property for SmartCuts:
1 Log in to Workspace with a user ID that has an Administrator role.
2 Select Administration on the Module menu.
3 Click the System tab and navigate to SmartCut.
4 Change the Encoding for URLs property to UTF8.
Browsing the RepositoryWith the proper authentication, you can select a desired document to embed from the Hyperion System 9 BI + Repository dialog box. Authentication is provided through an Authentication Service, which checks a user’s credentials at login time, and enables a user to connect. In addition, it determines the user’s group membership, which along with the user’s roles, affects what content and other system objects (resources) the user can view and modify.
If a user is already authenticated to a Global Service Manager (GSM), then no additional dialog box are displayed, and the Foundation Browse dialog box is displayed automatically. Authentication is assumed for Interactive Reporting Web Client and Workspace documents since they receive a URL “stamp” when created, which provides the necessary access to a GSM
If a Designer/Explorer user has not been authenticated, then the user is prompted to enter a valid server address on the Connect to Server dialog box (Tools/Connect to Foundation). When the user selects Connect (and the connection succeeds), the server address is persisted in the Windows registry. This server address can be used as the default server address if no valid address can be gleaned from the session or the Interactive Reporting document.
Once a valid server address is determined, the Interactive Reporting Studio (Designer/Explorer) application contacts the data access servlet and the user is presented with an authentication dialog box. Once the user's credentials are validated, the user is authenticated and the Hyperion System 9 BI + Repository dialog box is displayed.
➤ To login into the Hyperion System 9 BI +Repository:
1 Select the Repository checkbox on the Objects dialog box.
2 Click the Browse button.
The Connect to Server dialog box is displayed.
3 Enter a valid server address on the Connect to Server dialog box and click Connect.
The Hyperion System 9 BI + Login dialog box is displayed.
4 Type your user id and password and click Login.
Once the user has been successfully authenticated, the Browse Listing is displayed.
5 Navigate to the folder which contains the repository object that you want to embed.
6 Double-click the object to select it.
Make sure that the full path name and object name display to the right of the Selection field.
7 Click Apply.
The document name is displayed in the Document text entry field of the Object dialog box.
External Content in Dashboards 25
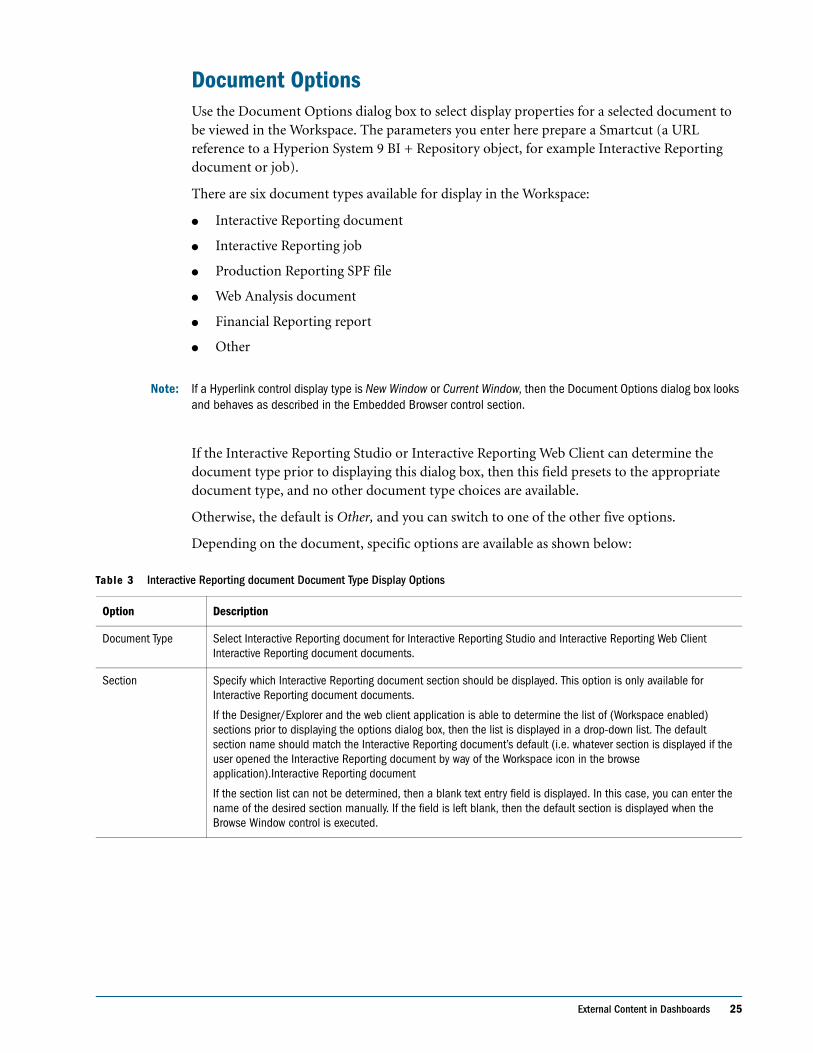
Document OptionsUse the Document Options dialog box to select display properties for a selected document to be viewed in the Workspace. The parameters you enter here prepare a Smartcut (a URL reference to a Hyperion System 9 BI + Repository object, for example Interactive Reporting document or job).
There are six document types available for display in the Workspace:
● Interactive Reporting document
● Interactive Reporting job
● Production Reporting SPF file
● Web Analysis document
● Financial Reporting report
● Other
Note: If a Hyperlink control display type is New Window or Current Window, then the Document Options dialog box looks and behaves as described in the Embedded Browser control section.
If the Interactive Reporting Studio or Interactive Reporting Web Client can determine the document type prior to displaying this dialog box, then this field presets to the appropriate document type, and no other document type choices are available.
Otherwise, the default is Other, and you can switch to one of the other five options.
Depending on the document, specific options are available as shown below:
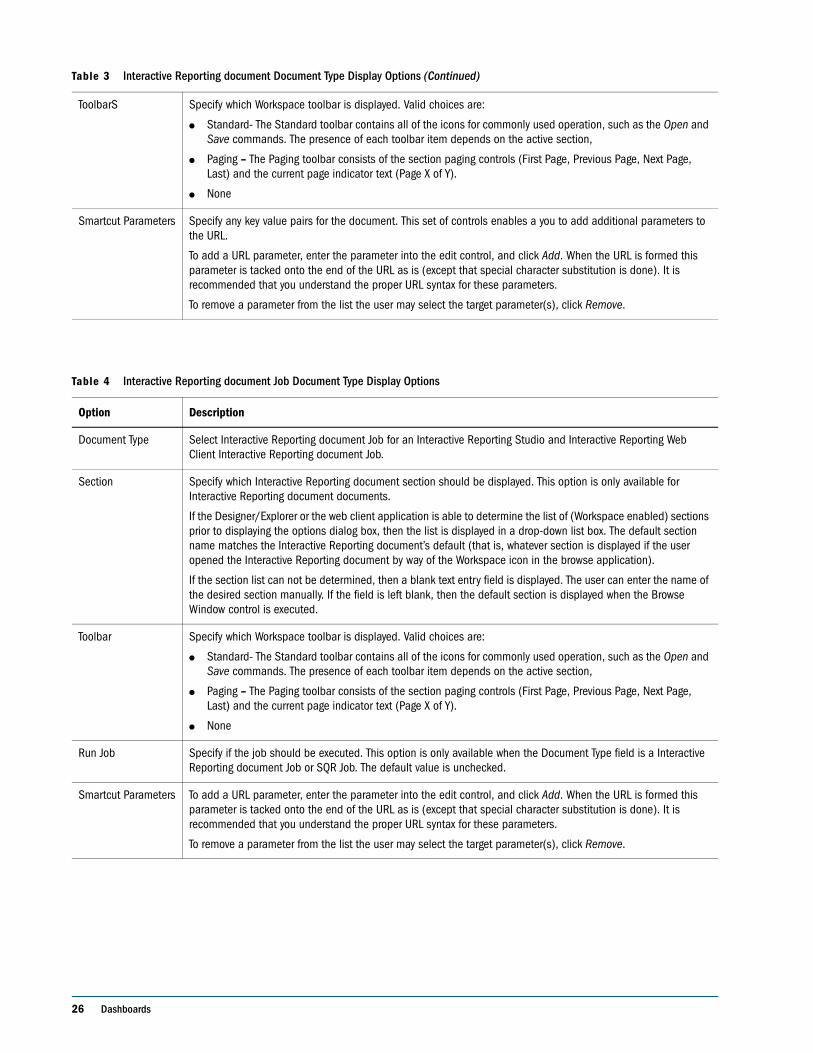
Table 3 Interactive Reporting document Document Type Display Options
Option Description
Document Type Select Interactive Reporting document for Interactive Reporting Studio and Interactive Reporting Web Client Interactive Reporting document documents.
Section Specify which Interactive Reporting document section should be displayed. This option is only available for Interactive Reporting document documents.
If the Designer/Explorer and the web client application is able to determine the list of (Workspace enabled) sections prior to displaying the options dialog box, then the list is displayed in a drop-down list. The default section name should match the Interactive Reporting document’s default (i.e. whatever section is displayed if the user opened the Interactive Reporting document by way of the Workspace icon in the browse application).Interactive Reporting document
If the section list can not be determined, then a blank text entry field is displayed. In this case, you can enter the name of the desired section manually. If the field is left blank, then the default section is displayed when the Browse Window control is executed.
26 Dashboards
ToolbarS Specify which Workspace toolbar is displayed. Valid choices are:
● Standard- The Standard toolbar contains all of the icons for commonly used operation, such as the Open and Save commands. The presence of each toolbar item depends on the active section,
● Paging – The Paging toolbar consists of the section paging controls (First Page, Previous Page, Next Page, Last) and the current page indicator text (Page X of Y).
● None
Smartcut Parameters Specify any key value pairs for the document. This set of controls enables a you to add additional parameters to the URL.
To add a URL parameter, enter the parameter into the edit control, and click Add. When the URL is formed this parameter is tacked onto the end of the URL as is (except that special character substitution is done). It is recommended that you understand the proper URL syntax for these parameters.
To remove a parameter from the list the user may select the target parameter(s), click Remove.
Table 4 Interactive Reporting document Job Document Type Display Options
Option Description
Document Type Select Interactive Reporting document Job for an Interactive Reporting Studio and Interactive Reporting Web Client Interactive Reporting document Job.
Section Specify which Interactive Reporting document section should be displayed. This option is only available for Interactive Reporting document documents.
If the Designer/Explorer or the web client application is able to determine the list of (Workspace enabled) sections prior to displaying the options dialog box, then the list is displayed in a drop-down list box. The default section name matches the Interactive Reporting document’s default (that is, whatever section is displayed if the user opened the Interactive Reporting document by way of the Workspace icon in the browse application).
If the section list can not be determined, then a blank text entry field is displayed. The user can enter the name of the desired section manually. If the field is left blank, then the default section is displayed when the Browse Window control is executed.
Toolbar Specify which Workspace toolbar is displayed. Valid choices are:
● Standard- The Standard toolbar contains all of the icons for commonly used operation, such as the Open and Save commands. The presence of each toolbar item depends on the active section,
● Paging – The Paging toolbar consists of the section paging controls (First Page, Previous Page, Next Page, Last) and the current page indicator text (Page X of Y).
● None
Run Job Specify if the job should be executed. This option is only available when the Document Type field is a Interactive Reporting document Job or SQR Job. The default value is unchecked.
Smartcut Parameters To add a URL parameter, enter the parameter into the edit control, and click Add. When the URL is formed this parameter is tacked onto the end of the URL as is (except that special character substitution is done). It is recommended that you understand the proper URL syntax for these parameters.
To remove a parameter from the list the user may select the target parameter(s), click Remove.
Table 3 Interactive Reporting document Document Type Display Options (Continued)

External Content in Dashboards 27
Table 5 Production Reporting (SQR Job) Document Type Display Options
Option Description
Document Type Select SQR Job for a Production ReportiJob.
Run Job Specify if the job should be executed. This option is only available when the Document Type field is Interactive Reporting document Job or SQR Job. The default value is unchecked.
Smartcut Parameters Specify any key value pairs for the document. This set of controls enables a user to add additional parameters to the URL.
To add a URL parameter, enter the parameter into the edit control, and click Add. When the URL is formed this parameter is tacked onto the end of the URL as is (except that special character substitution is done). It is recommended that you understand the proper URL syntax for these parameters.
To remove a parameter from the list the user may select the target parameter(s), click Remove.
Table 6 Other Display Options
Option Description
Document Type Select Other as a document type to add additional parameters to the URL.
Other Parameters Add any additional parameters in this field. For example, you could add SQR Job parameters, or Interactive Reporting document limits.
To add a URL parameter, enter the parameter into the edit control, and click Add. When the URL is formed this parameter is tacked onto the end of the URL as is (except that special character substitution is done). It is recommended that you understand the proper URL syntax for these parameters.
To remove a parameter from the list the user may select the target parameter(s), click Remove.
Table 7 Web Analysis (Hyperion Analyzer) Document Type Display Options
Option Description
Document Type Select Analyzer for a Web Analysis. document
Interactive Reporting- only Web Analysis templates are installed by the Analyzer installer for Web Analysis documents embedded in Dashboards.
Toolbar Specify which Web Analysis toolbar to display with the document. Valid option are Standard or None. The second and third Analyzer toolbars are made an option for display within the Interactive Reporting Dashboard section; however, both toolbars are treated as a single unit. Either both are shown, or both are hidden. The default setting is Standard.
Smartcut Parameters Add any additional parameters in this field that apply to the Web Analysis document. These parameters are not processed.
To add a URL parameter, enter the parameter into the edit control, and click Add. When the URL is formed this parameter is tacked onto the end of the URL as is (except that special character substitution is done). It is recommended that you understand the proper URL syntax for these parameters.
To remove a parameter from the list, select the target parameter(s), click Remove.
28 Dashboards
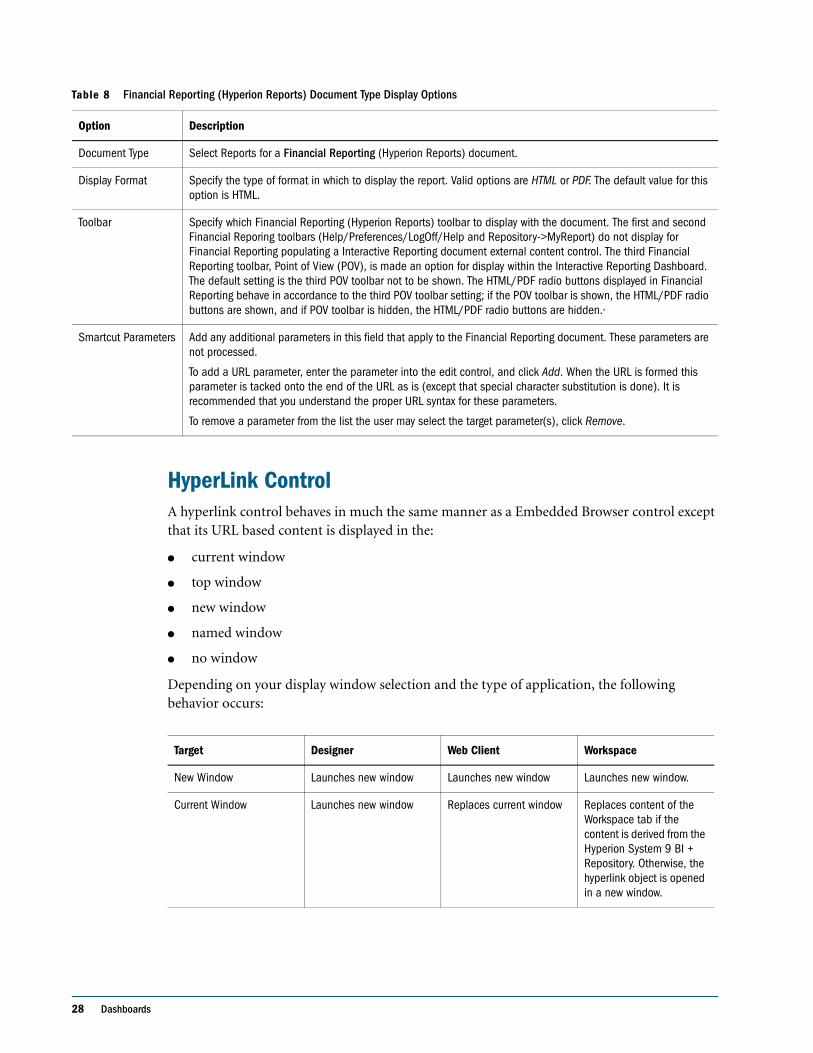
HyperLink ControlA hyperlink control behaves in much the same manner as a Embedded Browser control except that its URL based content is displayed in the:
● current window
● top window
● new window
● named window
● no window
Depending on your display window selection and the type of application, the following behavior occurs:
Table 8 Financial Reporting (Hyperion Reports) Document Type Display Options
Option Description
Document Type Select Reports for a Financial Reporting (Hyperion Reports) document.
Display Format Specify the type of format in which to display the report. Valid options are HTML or PDF. The default value for this option is HTML.
Toolbar Specify which Financial Reporting (Hyperion Reports) toolbar to display with the document. The first and second Financial Reporing toolbars (Help/Preferences/LogOff/Help and Repository->MyReport) do not display for Financial Reporting populating a Interactive Reporting document external content control. The third Financial Reporting toolbar, Point of View (POV), is made an option for display within the Interactive Reporting Dashboard. The default setting is the third POV toolbar not to be shown. The HTML/PDF radio buttons displayed in Financial Reporting behave in accordance to the third POV toolbar setting; if the POV toolbar is shown, the HTML/PDF radio buttons are shown, and if POV toolbar is hidden, the HTML/PDF radio buttons are hidden.·
Smartcut Parameters Add any additional parameters in this field that apply to the Financial Reporting document. These parameters are not processed.
To add a URL parameter, enter the parameter into the edit control, and click Add. When the URL is formed this parameter is tacked onto the end of the URL as is (except that special character substitution is done). It is recommended that you understand the proper URL syntax for these parameters.
To remove a parameter from the list the user may select the target parameter(s), click Remove.
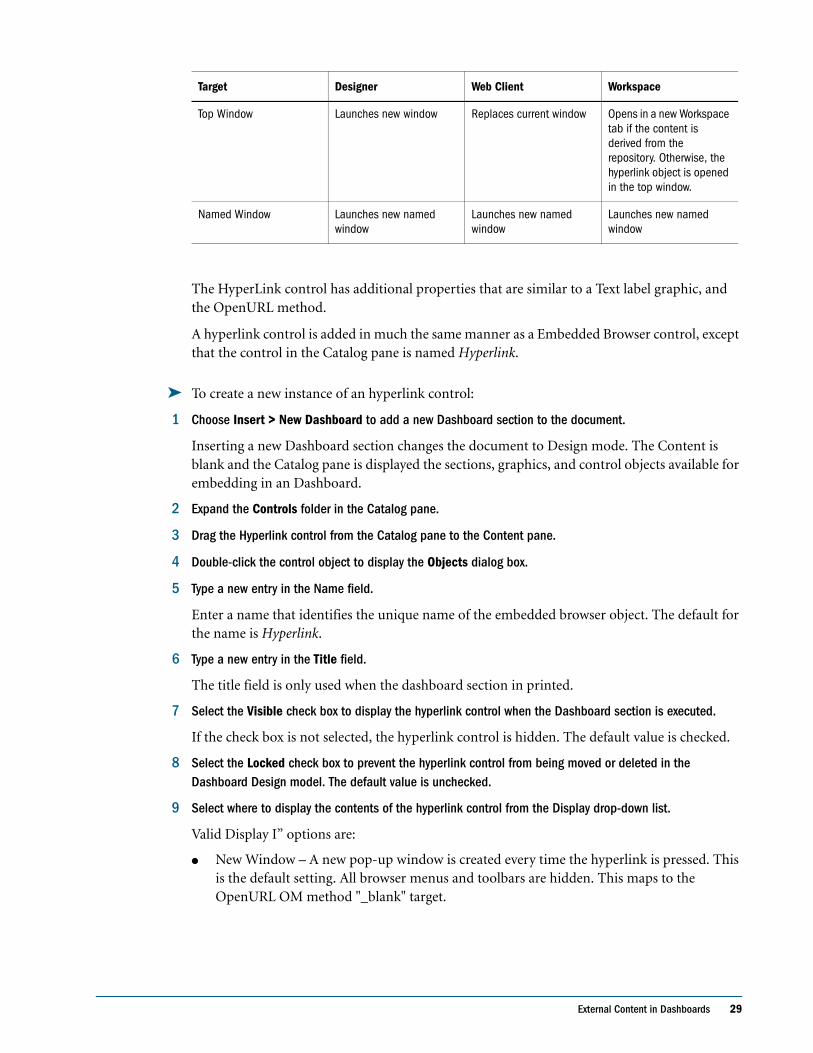
Target Designer Web Client Workspace
New Window Launches new window Launches new window Launches new window.
Current Window Launches new window Replaces current window Replaces content of the Workspace tab if the content is derived from the Hyperion System 9 BI + Repository. Otherwise, the hyperlink object is opened in a new window.
External Content in Dashboards 29
The HyperLink control has additional properties that are similar to a Text label graphic, and the OpenURL method.
A hyperlink control is added in much the same manner as a Embedded Browser control, except that the control in the Catalog pane is named Hyperlink.
➤ To create a new instance of an hyperlink control:
1 Choose Insert > New Dashboard to add a new Dashboard section to the document.
Inserting a new Dashboard section changes the document to Design mode. The Content is blank and the Catalog pane is displayed the sections, graphics, and control objects available for embedding in an Dashboard.
2 Expand the Controls folder in the Catalog pane.
3 Drag the Hyperlink control from the Catalog pane to the Content pane.
4 Double-click the control object to display the Objects dialog box.
5 Type a new entry in the Name field.
Enter a name that identifies the unique name of the embedded browser object. The default for the name is Hyperlink.
6 Type a new entry in the Title field.
The title field is only used when the dashboard section in printed.
7 Select the Visible check box to display the hyperlink control when the Dashboard section is executed.
If the check box is not selected, the hyperlink control is hidden. The default value is checked.
8 Select the Locked check box to prevent the hyperlink control from being moved or deleted in the Dashboard Design model. The default value is unchecked.
9 Select where to display the contents of the hyperlink control from the Display drop-down list.
Valid Display I” options are:
● New Window – A new pop-up window is created every time the hyperlink is pressed. This is the default setting. All browser menus and toolbars are hidden. This maps to the OpenURL OM method "_blank" target.
Top Window Launches new window Replaces current window Opens in a new Workspace tab if the content is derived from the repository. Otherwise, the hyperlink object is opened in the top window.
Named Window Launches new named window
Launches new named window
Launches new named window
Target Designer Web Client Workspace
30 Dashboards
● Current Window – If the execution application is the web client, or the Workspace, then the content replaces the entire Workspace content area (i.e. excluding surrounding browse application panes). In Designer a pop-up window is displayed.
● Top Window – If the execution application is the web client, or Workspace, then the content replaces the top-most HTML window. This maps to the OpenURL OM methods "_top" target.
● Named Window – A Named pop-up window is created. If the named window is already present, then the URL replaces the existing content of the named window. When this option is selected, a Target window edit control is displayed below the drop-down in which the user can enter the desired window name. This maps to the OpenURL method user specified target name option.
10 To explicitly define the URL of the content to be displayed in the Hyperlink control, type the URL address in the URL field.
When the Hyperlink control is rendered, the URL is used “as is” (the server information is not prepended in any circumstance).
You can reference Repository content by entering an explicit URL. In this case the URL is treated like any other external reference (there is no special authentication support).
It is important to plan how well the content of the URL is displayed in the Hyperlink control. An action from within the hyperlink content can result in the entire browser being replaced rather than just the contents of the Hyperlink control.
11 To select a repository document (and associated properties) to be displayed in the Hyperlink, select the Repository checkbox and specify the following:
● Document – Use the document textbooks to manually enter the path and name of the desired Repository document.
● Browse – Click the Browse button to interactively browse the repository for the desired document by way of the Foundation Browse dialog box. To manually enter the path and name of the desired Repository document, see the Document text box.
● Options – Launches the Document Option from which a user can select display properties for a selected Workspace document. If the display type is New Window or Current Window, then this dialog box looks and behaves as described in the Embedded Browser control section. For more information, see Document Options.
12 Click OK.
Embedded Pivot Section InteractivityPivot tables embedded as active sections in a Dashboard can be scripted to enable users to double pick on a cell and build interactivity around that cell. This feature is available on any individual fact cell in the Pivot. When the fact cell is double-clicked, the OnCellDoubleClick event is fired and any JavaScript associated with the event can be executed. The event is associated with the object in the Dashboard, not with the Pivot section itself.
Embedded Pivot Section Interactivity is available for Interactive Reporting Studio and the Interactive Reporting Web Client. It is not available for documents to be deployed in the Workspace.

Setting Dashboard Properties 31
Prior to executing the script associated with the OnCellDoubleClick event, certain properties of the object tree set. Once set, these properties are valid from anywhere within the object model that the object is accessible, such as document startup and shutdown scripts. If the Pivot is recalculated, these properties are reset to their initial, default state; as if no double click action had previously occurred. This properties include:
● “OnCellDoubleClick (Method)” on page 89,
● “FactName (Property)” on page 106,
● “CellValue (Property)” on page 50,
● “TopLabelValues (Array)” on page 225,
● “SideLabelValues (Array)” on page 208
For information on the OnCellDoubleClick event, see “Object Level Events” on page 41.
Setting Dashboard PropertiesUse the Properties box to set properties for an entire Dashboard section or for specific objects within an Dashboard section. Many Dashboard objects have unique properties. For instance, a radio button has a Radio Group property and a list box has a Multiple Selection property. Tab-order properties are section-wide, but are accessible in the Properties dialog boxes for both the overall Dashboard section as well as for the individual objects.
➤ To set properties in an Dashboard section:
1 Verify that no objects are selected in the Dashboard Content pane.
2 For specific object properties, select the object in the Dashboard Content pane.
3 Select Dashboard > Properties
The Properties dialog box is displayed. The active tab depends on the selection made prior to invoking the dialog box.
4 Click through the tabs to set properties for the selected object.
5 Click OK to apply the selected settings and close the Properties dialog box.
Available properties include:
● Alignment – Horizontal and vertical alignment, and text wrapping and rotation
● Border and Background – Border color, width, style, and shadow, and background color and pattern
● Font – family, style, size, effects (underline, overline, double overline), and color
● Object – name, title, visible, enable (control objects only), locked, scroll bars always shown, and auto-size. For embedded sections, view-only, active, or hyperlink
● Picture – file name, size, and effects for Dashboard background and graphic object pictures
● Tab Order – object path that end users follow when they press the [Tab] in Run mode
32 Dashboards
● Accessibility – user defined and auto generated descriptive 508 text for each embedded section or graphic
● Values – user-defined values that populate list box, drop down, or text box controls
Detailed information on each of these properties is presented in the online help.
Using Design ToolsInteractive Reporting Studio gives you complete control of your Dashboard section setup and provides a number of layout and navigation tools that assist you in designing effective, high-quality custom applications. These tools include:
● Design Guides
● Grids
● Rulers
Layout ToolsA rich set of layout aids is available to help you easily create professional looking Dashboard sections. All the layout tools are available from the Dashboard Menu or the Dashboard Section Toolbar.
Design GuidesDesign guides are horizontal and vertical lines that you place in your report to help you line up objects. Design guides are similar to grids in that objects automatically snap to align to the design guides.
If rulers are visible, click the ruler and drag one or more design guides from both the horizontal and vertical rulers.
➤ To toggle the display of design guides, select Dashboard > Design Guides.
A check mark is displayed next to Design Guides to indicate they are visible. Choose the option again to clear the check mark and remove the design guides.
GridsInteractive Reporting Studio and the web client provide a layout grid that automatically snaps all objects to the closest grid spot.
➤ To toggle the display of the grid, select Dashboard > Grid.
A check mark is displayed next to Grid to indicate the grid is visible. Select this option again to clear the check mark and remove the grid from view.

Using Design Tools 33
RulersHorizontal and vertical rulers help you line up items based on precise units of measure. Available units of measurement include inches, centimeters, and pixels. You select a unit by
clicking the measure indicator at the intersection of the top and left rulers.
➤ To toggle the display of the ruler, select Dashboard > Ruler.
A check mark is displayed next to Ruler to indicate the ruler is visible. Select this option again to clear the check mark and remove the ruler from view.
Dashboard Section ToolbarThe Dashboard Section toolbar provides icons that enable you to quickly maneuver multiple Dashboard objects.
● Design/Run Mode – Toggles between Design and Run modes.
● Align – Aligns several objects at the same time. Objects are aligned to the first object you select. Select the first object, then hold down [Ctrl] and select the remaining objects. Click the arrow on the Align icon and choose an alignment option: left, center, right, top, middle, or bottom.
● Make Same Size – Resizes the selected objects to the same size. Objects are resized to match the first object you select. Select the first object, then hold down [Ctrl] and select the remaining objects. Click the arrow on the Make Same Size icon and choose a resizing option: width, height, or both.
● Layer – Stacks a single object in relative position to other objects. Layer include four rearrangement options: Bring To Front, Send To Back, Bring Forward, and Send Backward. Use this feature to layer multiple objects so that only the sections of the objects you want visible are shown.
Design/Run ModeAlignMake Same SizeLayer
34 Dashboards
Navigation ToolbarUse the Navigation toolbar to return to an Dashboard section from another section when the Section catalog, Section title bar, toolbars, and menus have been turned off.
The Navigation toolbar is hidden by default, but you can use scripts to enable it. When activated, it is available in all sections and includes the Back, Forward, and Dashboard Home buttons.
Use the following scripts to work with the Navigation toolbar. The first script turns on the Navigation toolbar. The second script turns on all toolbars with the exception of the Navigation toolbar. The third script turns off all toolbars.
//Syntax for turning on Navigation toolbarToolbars["Navigation"].Visible=true;
//Syntax for turning on all toolbars except the Navigation toolbar
j=Toolbars.Count
for (i=1; i<=j; i++) {if (Toolbars[i].Name != "Navigation") {Toolbars[i].Visible=true}
}
//Syntax for turning off all toolbarsj=Toolbars.Count
for (i=1; i<=j; i++) {Toolbars[i].Visible=false
}
Dashboard Menu Command Reference 35
Dashboard Menu Command ReferenceTable 9 provides a quick reference to the commands available on the Dashboard menu and lists any related shortcuts.
Table 9 Dashboard Menu Commands
Command DescriptionKeyboard Shortcut
Shortcut Menu
Design Guides Toggles the design guides on and off.
Grid Toggles the grid on and off.
Rulers Toggles the rulers on and off.
Insert Graphic Enables you to insert a graphic element.
Insert Control Enables you to insert a control button or box.
Remove Selected Items Deletes the selected item.
Scripts Displays the Script Editor. [F8] ✔
Properties Displays the property menu for the selected item. ✔
Home Dialog box Enables you to designate a particular Dashboard section as the home Dashboard section. The default is the Dashboard section first created.
Design Mode Toggles between the design and run mode. [Ctrl+D]

36 Dashboards
Interactive Reporting Object Model 37
C h a p t e r
2Interactive Reporting Object
Model
The object model is the cornerstone for scripting a customized interface, or Dashboard, to enterprise data with JavaScript. The object model and the built-in Script Editor provide quick and easy access to all levels of the Interactive Reporting interface.
This section describes the object model and the scripting tools available to the application designer, and explains how to automate Dashboard sections using Interactive Reporting events.
In This Chapter Understanding the Object Model . . . . . . . . . . . . . . . . . . . . . . . . . . . . . . . . . . . . . . . . . . . . . . . . . . . . . . . . . . . . . . 38
Understanding Interactive Reporting Events . . . . . . . . . . . . . . . . . . . . . . . . . . . . . . . . . . . . . . . . . . . . . . . . . . . . . . 39
Using the Script Editor . . . . . . . . . . . . . . . . . . . . . . . . . . . . . . . . . . . . . . . . . . . . . . . . . . . . . . . . . . . . . . . . . . . . . . 42
Sample JavaScript Script . . . . . . . . . . . . . . . . . . . . . . . . . . . . . . . . . . . . . . . . . . . . . . . . . . . . . . . . . . . . . . . . . . . . 44
Testing Scripts Using the Execution Window . . . . . . . . . . . . . . . . . . . . . . . . . . . . . . . . . . . . . . . . . . . . . . . . . . . . . . 44
Checking Errors Using the Console Window . . . . . . . . . . . . . . . . . . . . . . . . . . . . . . . . . . . . . . . . . . . . . . . . . . . . . . 44
Finding/Replacing Script . . . . . . . . . . . . . . . . . . . . . . . . . . . . . . . . . . . . . . . . . . . . . . . . . . . . . . . . . . . . . . . . . . . . 44
38 Interactive Reporting Object Model
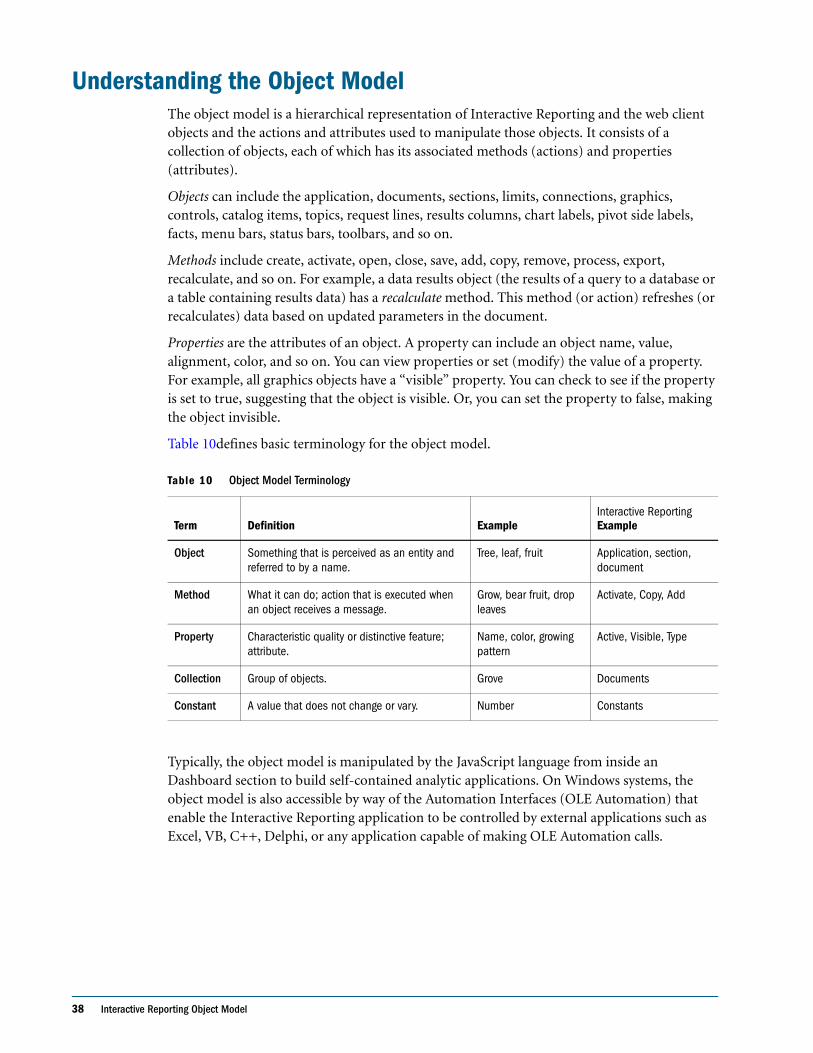
Understanding the Object ModelThe object model is a hierarchical representation of Interactive Reporting and the web client objects and the actions and attributes used to manipulate those objects. It consists of a collection of objects, each of which has its associated methods (actions) and properties (attributes).
Objects can include the application, documents, sections, limits, connections, graphics, controls, catalog items, topics, request lines, results columns, chart labels, pivot side labels, facts, menu bars, status bars, toolbars, and so on.
Methods include create, activate, open, close, save, add, copy, remove, process, export, recalculate, and so on. For example, a data results object (the results of a query to a database or a table containing results data) has a recalculate method. This method (or action) refreshes (or recalculates) data based on updated parameters in the document.
Properties are the attributes of an object. A property can include an object name, value, alignment, color, and so on. You can view properties or set (modify) the value of a property. For example, all graphics objects have a “visible” property. You can check to see if the property is set to true, suggesting that the object is visible. Or, you can set the property to false, making the object invisible.
Table 10defines basic terminology for the object model.
Typically, the object model is manipulated by the JavaScript language from inside an Dashboard section to build self-contained analytic applications. On Windows systems, the object model is also accessible by way of the Automation Interfaces (OLE Automation) that enable the Interactive Reporting application to be controlled by external applications such as Excel, VB, C++, Delphi, or any application capable of making OLE Automation calls.
Table 10 Object Model Terminology
Term Definition ExampleInteractive Reporting Example
Object Something that is perceived as an entity and referred to by a name.
Tree, leaf, fruit Application, section, document
Method What it can do; action that is executed when an object receives a message.
Grow, bear fruit, drop leaves
Activate, Copy, Add
Property Characteristic quality or distinctive feature; attribute.
Name, color, growing pattern
Active, Visible, Type
Collection Group of objects. Grove Documents
Constant A value that does not change or vary. Number Constants
Understanding Interactive Reporting Events 39
Understanding Interactive Reporting EventsCustom applications (that is, Dashboard sections) developed using Interactive Reporting and the web client are event driven. An event is an action recognized by a Interactive Reporting document, section, or Dashboard object. Interactive Reporting and the web client event-driven applications execute scripts in response to an event, such as clicking a button or opening a document. When an event occurs, Interactive Reporting and the web client invoke the script attached to the event. The order in which your application executes events depends on what the user does; there is no set sequence of actions.
Note: Interactive Reporting and the web client use JavaScript as its scripting language since the release of Interactive Reporting version 6.0. Documents scripts created using the older Brio scripting language are automatically converted to JavaScript when the document is first opened.
Interactive Reporting and the web client have a set of predefined events. You determine how these events respond by attaching a script to the event. For example, if you want a button to perform an action when clicked, you attach a script that defines your action to the OnClick event associated with the button.
Interactive Reporting predefines events as follows:
● Object Level Events – Events associated with Dashboard objects.
● Section Level Events – Events associated with Dashboard sections.
● Document Level Events – Events associated with Interactive Reporting and the web client documents.
Object Level EventsTable 11 describes the predefined events associated with Dashboard objects (embedded sections, graphics, and controls).
Note: All events starting with OnClient are executed in the client browser, and not on the server. For more information, see “Client-Side JavaScript” on page 117.
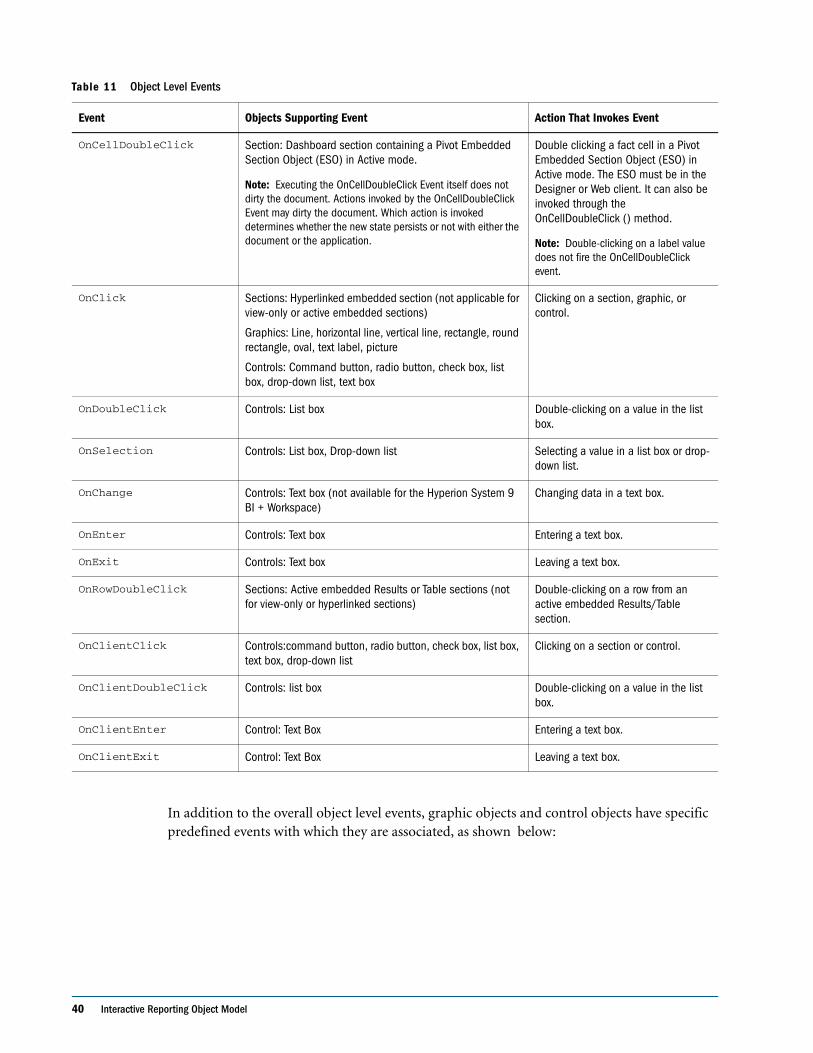
40 Interactive Reporting Object Model
In addition to the overall object level events, graphic objects and control objects have specific predefined events with which they are associated, as shown below:
Table 11 Object Level Events
Event Objects Supporting Event Action That Invokes Event
OnCellDoubleClick Section: Dashboard section containing a Pivot Embedded Section Object (ESO) in Active mode.
Note: Executing the OnCellDoubleClick Event itself does not dirty the document. Actions invoked by the OnCellDoubleClick Event may dirty the document. Which action is invoked determines whether the new state persists or not with either the document or the application.
Double clicking a fact cell in a Pivot Embedded Section Object (ESO) in Active mode. The ESO must be in the Designer or Web client. It can also be invoked through the OnCellDoubleClick () method.
Note: Double-clicking on a label value does not fire the OnCellDoubleClick event.
OnClick Sections: Hyperlinked embedded section (not applicable for view-only or active embedded sections)
Graphics: Line, horizontal line, vertical line, rectangle, round rectangle, oval, text label, picture
Controls: Command button, radio button, check box, list box, drop-down list, text box
Clicking on a section, graphic, or control.
OnDoubleClick Controls: List box Double-clicking on a value in the list box.
OnSelection Controls: List box, Drop-down list Selecting a value in a list box or drop-down list.
OnChange Controls: Text box (not available for the Hyperion System 9 BI + Workspace)
Changing data in a text box.
OnEnter Controls: Text box Entering a text box.
OnExit Controls: Text box Leaving a text box.
OnRowDoubleClick Sections: Active embedded Results or Table sections (not for view-only or hyperlinked sections)
Double-clicking on a row from an active embedded Results/Table section.
OnClientClick Controls:command button, radio button, check box, list box, text box, drop-down list
Clicking on a section or control.
OnClientDoubleClick Controls: list box Double-clicking on a value in the list box.
OnClientEnter Control: Text Box Entering a text box.
OnClientExit Control: Text Box Leaving a text box.

Understanding Interactive Reporting Events 41
Active Section Level EventsActive Section level event are events associated with Dashboard sections. The predefined section level events and the actions that invoke the events are:
● OnActivate – Entering a Dashboard section.
● OnDeactivate – Exiting a Dashboard section.
Document Level EventsDocument level events are events associated with Interactive Reporting and the web client documents. The predefined document level events and the actions that invoke the events are:
● OnStartUp – Opening an Interactive Reporting document (.bqy)
● OnShutDown – Closing an Interactive Reporting document (.bqy)
● OnPreProcess – Before a query is processed.
● OnPostProcess – After a query is processed.
The execution of document events can be enabled or disabled by using options on the Script Editor programmatically through the Object Model.
Note: The Save and Save As commands in Interactive Reporting Studio, Interactive Reporting Web Client, and Workspace do not execute the document shutdown scripts when saving the document. These scripts only execute when a document is closed.
Caution! OnShutDown events execute before any prompts in the Save dialog box.
Table 12 Events Associated with Graphic Objects
Graphic Object Event
Line OnClick
Horizontal Line OnClick
Vertical Line OnClick
Rectangle OnClick
Round Rectangle OnClick
Oval OnClick
Text Label OnClick
Picture OnClick
42 Interactive Reporting Object Model
Associating a Document Level Event By default the desktop and the web client application invoke the script attached to a document level event when the event is triggered. For example, the OnStartup document event is triggered when an Interactive Reporting document (.bqy) is opened.
On the other hand, the Hyperion Scheduler does not invoke the script attached to a document level event until the user sets the document level event for the Interactive Reporting document (.bqy) manually. The option to set the document level event is a user preference and can be set based on how the document is to be deployed (on the desktop, on the Hyperion System 9 BI + Workspace or in the Interactive Reporting Web Client).
➤ To associate a document level event:
1 Choose File > Document Scripts.
The Script Editor is displayed. Document is selected by default in the Object drop-down box and OnStartup is selected by default in the Event drop-down box.
2 In the Event Trigger drop-down box, choose the document level event that you want to associate with the Interactive Reporting document (.bqy)
OnStartup is selected by default in the Event Trigger drop-down box.
3 In the Enable For drop-down box, check the type of document the event is to be associated with.
Available types of document include: All Clients (Designer/Explorer), Thin Client (Workspace), Plug-in Client (Scheduler), SmartView (Workspace). To remove a document level event association, leave the check box blank next to the selected type of document.
Using the Script EditorUse the built-in Script Editor to add scripts to events. You can open the Script Editor for a selected object, an active Dashboard section, or a document.
➤ To add a script to a document event, select File > Document Scripts to open the Script Editor from any section other than the Dashboard section.
➤ To open the Script Editor from within the Dashboard section, in Design mode, select Dashboard > Scripts.
➤ To open the Script Editor for a selected object:, select Dashboard > Scripts.
The Script Editor contains the Object browser, the Description pane, the Events drop-down menu, and the Scripting pane.
Using the Script Editor 43
Object BrowserThe Script Editor provides an Object browser in the left pane, where it displays the object model, listing all available objects, properties, and methods. At the top of the object model hierarchy is Application, which represents the entire Interactive Reporting application and contains application-wide settings and options, methods, and properties. (For a compete flowchart of the object model, see Chapter 5, “Object Model Map.”)
Clicking any object or collection in the Object browser displays methods and properties, as well as internal objects. Double-clicking a method or property automatically generates scripts in the scripting pane of the Script Editor.
The Application object contains a Documents collection as well as an ActiveDocument collection. In the active document Sample1.bqy, methods and properties are available in two places in the object model hierarchy:
● Application > Documents > Sample1.bqy
● Application > ActiveDocument
A script that accesses multiple open documents should use the Documents path to the methods and properties of a specific document. A script that affects only the currently active document can use the ActiveDocument path.
Scripting paneUse the Scripting pane to enter scripts that are attached to specific object events (such as mouse clicks, button clicks, and so on.). Use JavaScript to control the logic and flow of your application. Use the object model to access objects, properties, and methods. Double-click an item in the Object browser and a reference to the object, property, or method automatically is displayed at the cursor location in the Script Editor.
Above the Script Editor area is a drop-down menu that includes all available events associated with the selected document, section, or object. Beside the drop-down menu is the Event Trigger drop-down menu. This menu displays the events for the control object, which is recognized as the action that invokes the script attached to the event.
After selecting the appropriate event, you can start typing in JavaScript and referencing the object model. If you need to see or edit the script that extends beyond the boundaries of the Scripting pane, use the horizontal and vertical scroll bars.
Use the Cut icon to take out selected script from the editor and send it to the Clipboard (a temporary storage place). With each subsequent copy or cut, the Clipboard contents are overwritten.
● Use the copy icon to place a copy of the selected scripted on the Clipboard.
● Use the Paste icon to place the contents of the Clipboard at the insertion point. Script, which already exists at the insertion point, is moved. Selected script is replaced when the Paste command is used.
● Use the Find/Replace icon to search for and replace script and all instances of a word, for example, you can replace Chart with Pivot.
You can cut, copy, and paste embedded sections, controls, or graphic objects in an Dashboard section.
44 Interactive Reporting Object Model
Description pane and Online HelpWhen you select an item in the object model hierarchy, a brief description of the item is displayed in the Description pane. For example, selecting the Active Document Properties item displays the description Object/Document ActiveDocument.
➤ To display Help text for specific items in the object model, select the item, then click Help.
The online help dialog box opens and displays information on the specific method or property selected, such as the type of argument expected. Online help is also accessible from the Help menu.
Sample JavaScript ScriptEach level of the object model has a Methods folder that contains actions (methods) applicable to an object at that level. You can write a script using these methods by finding the object in the Object browser and double-clicking the associated method.
Testing Scripts Using the Execution WindowYou can immediately test a script by adding it to the Execution window. For example, instead of closing and re-opening a document to test it’s OnStartup script, copy and paste the script into the Execution window and press [Enter].
Checking Errors Using the Console WindowThe Console window records all error messages that occur from the time Interactive Reporting starts until the application is closed or the window is cleared (with Edit > Clear).
Finding/Replacing ScriptThe Script Editor Find/Replace function enables you to search an entire script for strings, punctuation marks, and numbers. You can retrieve matches by treating each word as a prefix or as whole word only. Further differentiation can be made by applying a case-sensitive constraint (upper and lower case word matches).
The replace component of this function enables you to replace the first or multiple occurrence(s) of a string, punctuation mark.
Finding/Replacing Script 45
➤ To find and replace:
1 Click anywhere in the Find What field and enter your search text.
To replace the matched search text with other text, click anywhere in the Replace With field and enter the replacement text.
You can either type the entry or paste it.
2 To match the entire search text entirely, click the Match Whole Word Only field.
3 To match the exact case of the search text, click the Match Case field.
4 Select the direction from which to initiate the search in the Direction field.
5 To find and replace the next occurrence of the search text, click Replace.
To find and replace all occurrences of the search text, click ReplaceAll.
When the Find/Replace feature has finished executing, the following message is displayed: "Reached the end of the script. All instances of search item replaced" or “Reached the end of the script. Cannot find Search item”
Table 13 Find/Replace Definitions
Field Definition
Find What Enter the search criteria that you wish to search on. The search criteria can either be a string, punctuation mark or number. When you make an entry in this field without matching the whole word or case, search criteria acts as a prefix. That is, “report” matches “reporting”, “reporter” and “reported.” This function does not support wildcats.
Replace With Enter the replacement text for match.
Match Whole Word Instructs the Find/Replace feature to match only the entire text that matches exactly your search criteria. For example, “report” matches only “report”. It does not match “report” “reporting”, “reporter” and “re-ported.”
Match Case Instructs the Find/Replace feature to match only the text that matches the uppercase or lowercase letters of your search criteria. For example, if you specify “Chart”, then an entry must match the word “Chart” with a capital C. – that is, “Chart” matches only “Chart”.
Direction Specify the direction from which to initiate the search be-ginning at the insertion point. You can start the search in an upward or downward direction. By default, the direction is from downward.
Replace Finds, then replaces the first occurrence of a match. This enables you to confirm whether or not you want to make the replacement.
ReplaceAll Replaces all occurrences of a match
Close Closes the Find/Replace window.

46 Interactive Reporting Object Model

Scripting Reference 47
P a r t I I
Scripting Reference

48 Scripting Reference

Dashboard Scripting Reference 49
C h a p t e r
4Dashboard Scripting Reference
This chapterprovides reference information on using JavaScript with Hyperion Intelligence Clients and the web client.
In This Chapter Scripting Applications . . . . . . . . . . . . . . . . . . . . . . . . . . . . . . . . . . . . . . . . . . . . . . . . . . . . . . . . . . . . . . . . . . . . . . 50
Understanding Functions . . . . . . . . . . . . . . . . . . . . . . . . . . . . . . . . . . . . . . . . . . . . . . . . . . . . . . . . . . . . . . . . . . . . 50
Using JavaScript Statements . . . . . . . . . . . . . . . . . . . . . . . . . . . . . . . . . . . . . . . . . . . . . . . . . . . . . . . . . . . . . . . . . 55
Manipulating Objects with JavaScript . . . . . . . . . . . . . . . . . . . . . . . . . . . . . . . . . . . . . . . . . . . . . . . . . . . . . . . . . . . 62
Microsoft Automation Interfaces and the Object Model . . . . . . . . . . . . . . . . . . . . . . . . . . . . . . . . . . . . . . . . . . . . . . 64
OLE Automation Controller within JavaScript (JOOLE). . . . . . . . . . . . . . . . . . . . . . . . . . . . . . . . . . . . . . . . . . . . . . . . 64
Exporting Scripts to Text Files . . . . . . . . . . . . . . . . . . . . . . . . . . . . . . . . . . . . . . . . . . . . . . . . . . . . . . . . . . . . . . . . . 66
Troubleshooting Scripts . . . . . . . . . . . . . . . . . . . . . . . . . . . . . . . . . . . . . . . . . . . . . . . . . . . . . . . . . . . . . . . . . . . . . 67
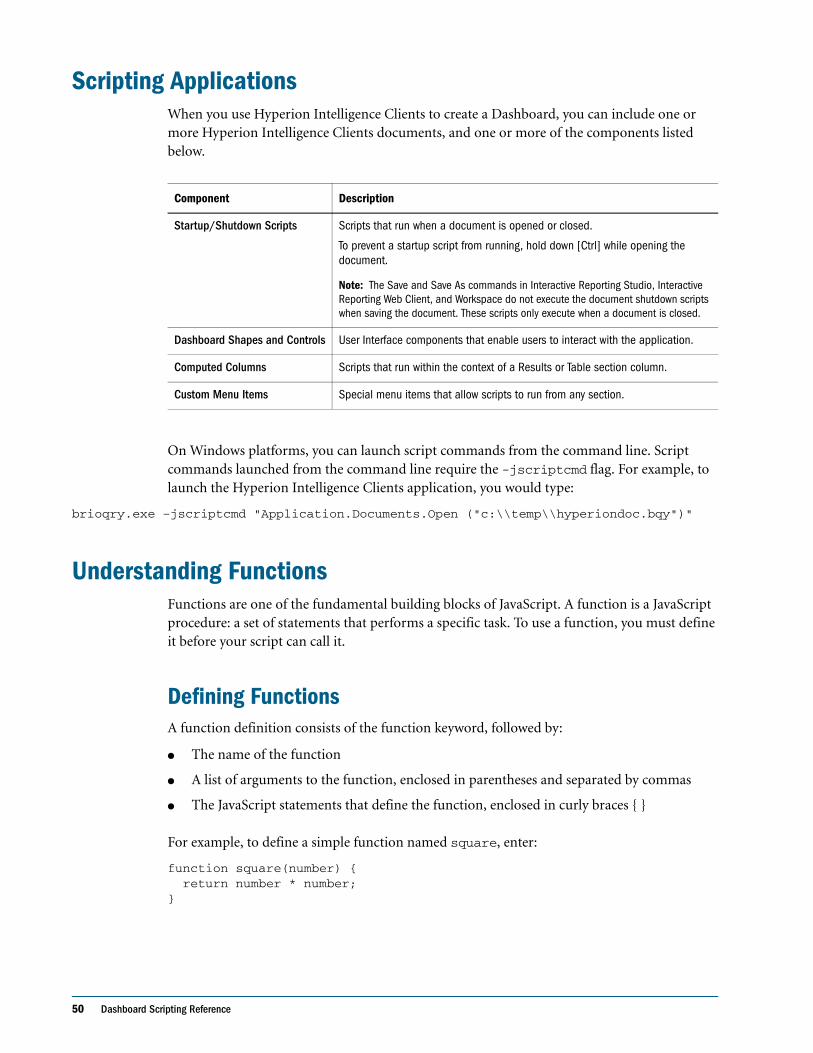
50 Dashboard Scripting Reference
Scripting ApplicationsWhen you use Hyperion Intelligence Clients to create a Dashboard, you can include one or more Hyperion Intelligence Clients documents, and one or more of the components listed below.
On Windows platforms, you can launch script commands from the command line. Script commands launched from the command line require the -jscriptcmd flag. For example, to launch the Hyperion Intelligence Clients application, you would type:
brioqry.exe –jscriptcmd "Application.Documents.Open ("c:\\temp\\hyperiondoc.bqy")"
Understanding FunctionsFunctions are one of the fundamental building blocks of JavaScript. A function is a JavaScript procedure: a set of statements that performs a specific task. To use a function, you must define it before your script can call it.
Defining FunctionsA function definition consists of the function keyword, followed by:
● The name of the function
● A list of arguments to the function, enclosed in parentheses and separated by commas
● The JavaScript statements that define the function, enclosed in curly braces { }
For example, to define a simple function named square, enter:
function square(number) {return number * number;
}
Component Description
Startup/Shutdown Scripts Scripts that run when a document is opened or closed.
To prevent a startup script from running, hold down [Ctrl] while opening the document.
Note: The Save and Save As commands in Interactive Reporting Studio, Interactive Reporting Web Client, and Workspace do not execute the document shutdown scripts when saving the document. These scripts only execute when a document is closed.
Dashboard Shapes and Controls User Interface components that enable users to interact with the application.
Computed Columns Scripts that run within the context of a Results or Table section column.
Custom Menu Items Special menu items that allow scripts to run from any section.

Understanding Functions 51
The function square takes an argument called number. The function consists of one statement that indicates to return the argument of the function multiplied by itself. The return statement specifies the value returned by the function, for example:
return number * number
All parameters are passed to functions by a value. The value is passed to the function, but if the function changes the value of the parameter, the change is not reflected globally or in the calling function. If you pass an object as a parameter to a function and the function changes the object’s properties, that change is visible outside the function. For example:
function myFunc(theObject) {theObject.make="Toyota"
}mycar = {make:"Honda", model:"Accord", year:2004}x=mycar.make // returns Hondamuffin (mycar) // pass object mycar to the functiony=mycar.make // returns Toyota (property was changed by the function)
Calling FunctionsIn a Hyperion Intelligence Clients analytical application, you can call any function that is defined in the current script context. You can also use functions that have been defined globally or at a higher scope than the current context.
Note: Use caution when working with global variables. These are visible throughout Hyperion Intelligence Clients, including to computed column calculations and Report section expressions.
Defining a function does not execute it. Defining the function simply names the function and specifies what to do when the function is called. Calling the function actually performs the specified actions with the indicated parameters. For example, you would call the function square as follows:
square(5)
The preceding statement calls the function with an argument of 5. The function executes its statements and returns the value 25.
The arguments of a function are not limited to strings and numbers. You can also pass whole objects to a function.
A function can be recursive, that is, it can call itself. For example, here is a function that computes factorials:
function factoring) {if ((n == 0) || (n == 1))
return 1else {
result = (n * factorial(n-1) )return result}
}
52 Dashboard Scripting Reference
You could then compute the factorials of 1 through 5 as follows:
a=factorial(1) // returns 1b=factorial(2) // returns 2c=factorial(3) // returns 6d=factorial(4) // returns 24e=factorial(5) // returns 120
Function ScopeFunctions are accessible within the scope in which they are created unless they are explicitly defined in a different scope. This means that a function which is defined in the OnClick() event handler of a command button can only be called by other statements in the same event handler. Example 1 shows two command buttons in an Dashboard section, MyButton and YourButton.
Example 1 // MyButtonfunction square(value){return value*value;}Alert (‘’The square of 3 equals ‘’+ square(3))
// YourButtonvar retVal = square(3) // generates a runtime errorAlert (‘’The square of 3 equals ‘’+ retVal)
The square function is only visible in the context of MyButton. As a result, a call to the square function from YourButton generates a runtime error.
Defining Functions in Different ScopesTo make your functions visible to other scripts throughout the application, you must explicitly define the scope in which your function is visible. This can be accomplished a number of different ways:
1. Using the with statement to set the current scope of a script.
2. Dynamically adding methods to objects.
3. Assigning a function to a global variable.
When you use the with statement to set the current scopes, functions defined within the with statement become visible for that object. Example 1 shows one method for expressing the two command buttons.
Example 1 // MyButtonWith (YourButton){
function square(value){
Understanding Functions 53
return value*value;}Alert (“The square of 3 equals “+ square(3))
}
// YourButtonvar retVal = square(3)Alert (“The square of 3 equals “+ retVal)
By explicitly defining the square function within the context of the YourButton object, you make the function visible to the scripts that are running behind that button. Using this syntax is not restricted to objects within Dashboard. Any object from the object model can be used in conjunction with the with statement.
Example 2 shows another way to accomplish the same behavior as Example.
Example 2 // MyButtonFunction square(value)
{return value*value;
}Alert (“The square of 3 equals “+ square(3))YourButton.square = square;
// YourButtonvar retVal = square(3)Alert (“The square of 3 equals “+ retVal)
In Example 2, a new method is added dynamically to the YourButton object. Any scripts running in the context of this object have access to the dynamically created square function.
Taking this one step further, you could create a global variable that is associated with the function as shown in Example 3.
Example 3 // MyButtonFunction square(value)
{return value*value;
}Alert (“The square of 3 equals “+ square(3)) MyGlobalFunction = square;
// YourButtonvar retVal = MyGlobalFunction(3)Alert (“The square of 3 equals “+ retVal)
In Example 3, creating a variable named MyGlobalFunction without using the var statement places that variable in the topmost scope. This makes it global.

54 Dashboard Scripting Reference
Summary of Function TypesThere are several ways to create function components:
● Global variable
● Document Variable
● Section Variable
Global variable When you declare a function at the top level of a script, other functions can read and modify it. It is treated as universally accessible since other functions can read and change it (the global variable stays in memory when you close the document).
You must carefully consider how and where you use a global variable in your script. A change made to a single component of the variable carries over to all other variables which reference it.
To call a function using a global variable, type:
glMyFunction(myParam)
Document VariableDocument variables belong and depend on the document script in which they are included. That is, a document variable is erased when the document is closed or you define another value for the variable. You can call a function in one of two ways from the same document:
myFunction(myParam)
or
ActiveDocument.myFunction(myParam)
Section VariableSection variables exist in the section and document in which they are included. Use a section variable when you need to specify elements defined from different Dashboard section, each of which declare functions with the same name.
You can call a function in this way by typing:
ActiveDocument.Sections["Dashboard"].myFunction(myParam)
The (myParam) can be defined in two ways:
this.Parent.myFunction=myFunction
In this example, “this.Parent” is the parent object of the “this” which could bea Fields or Shapes object. This is the object to which the script belongs.
or
this.myFunction=myFunction
In this example the object belongs to the OnActivate or OnDeactivate method of the section and “this” is the section object.
Using JavaScript Statements 55
Using JavaScript StatementsThis section explains how JavaScript uses conditional and loop statements to allow the execution order of a script to change based on the state of objects or the user selection. It also discusses how to use break statements to alter the execution of these control structures. It includes the following topic:
● Conditional Statements
● Loop Statements
● break Statements
● for...in Statement
● with Statement
Conditional StatementsA conditional statement is a set of commands that executes if a specified condition is true. The conditional statements supported by JavaScript are:
● if...else Statements
● inline if Statements
● switch Statements
if...else StatementsIf a logical condition is true, use the if statement to perform certain actions. If a logical condition is false, use the optional else clause to perform another action. Example 4 shows a typical if statement.
Example 4 if (condition) {statements1
}else {
statements2 }
The condition can be any JavaScript expression that evaluates to true or false. The statements to be executed can be any JavaScript statements, including deeper nested if statements. If you want to use more than one statement after an if or else statement, you must enclose the statements in curly braces {}.
Do not confuse the primitive Boolean true and false values with the Boolean object true and false values. Any object whose value is not undefined or null, including a Boolean object whose value is false, evaluates to true when passed to a conditional statement, for example:
var b = new Boolean(false);if (b) // this condition evaluates to true
56 Dashboard Scripting Reference
Note: The words if and else must be in lowercase. If you type an uppercase “i” or “e”, you get a missing syntax error. A then statement is implied for values enclosed in the curly braces { }. If you type the word then in a statement, an error message is returned.
You can also use an if...else statement to stop a script if it encounters a selected condition, for example:
if(cellvalue==0){ Alert("Cell has no value") }else{ (execute remainder of code here) }
inline if StatementsThe inline if statement is an alternative to the if...else statement. It uses the conditional operator (?) to represent the if portion of the statement; the (:) implies the else portion. It takes these three operands:
condition ? expr1 : expr2
where:
● condition – An expression that evaluates to true or false
● expr1, expr2d – Expressions with values of any type.
If condition is true, the operator returns the value of expr1; otherwise, it returns the value of expr2.
You should place the condition in () (parentheses), with each expression in single or double quotes:
((condition == value)?'expr1':'expr2')
Note: You can eliminate the condition parentheses as shown below, but omitting the quotes for strings may lead to problems: (condition?'expr1':'expr2')
It is not necessary to place quotes around numbers.
(condition?2:10)
For example, to display a different message based on the true or false value of the isMember variable, you could use this statement:
( isMember ? 'Member' : 'Not a member')
In this case, if the isMember variable evaluates to true, then the operator returns the string Member. If isMember does not evaluate to true, then the operator returns the string Not a Member.
You can also use the comparison operator:
((isMember == 'Yes' ) ? 'Member' : 'Not a member')
In this case, if the value of the variable isMember evaluates as equal to the string Yes, then the operator returns the string Member. If isMember does not evaluate as equal to the string Yes, then the operator returns the string Not a Member.
Using JavaScript Statements 57
If you want to nest inline if statements, (that is, use an inline if statement as an expression for another inline if statement), enclose the nested inline if statements in parentheses:
(1 != 1 ? 'Not Equal' : (1 < 1 ? 'Less Than': 'Equal') )
In this case, if 1 evaluates as not equal to 1, the second inline if statement is evaluated as part of the first inline if statement’s else clause. If 1 evaluates as less than 1, the operator returns the string Less Than. Since 1 is equal to 1, the operator returns the string Equal from the else clause of the second inline if statement.
Note: When you open a version 5.5 document in the 6.x version of Hyperion Intelligence Clients and the document contains computed columns with nested if...else statements, the Interactive Reporting JavaScript engine converts the if...else syntax to the inline if statement syntax. The conversion process does not alter the meaning or value of the original if...else statement.
switch StatementsA switch statement enables a program to evaluate an expression and attempts to match the expression’s value to a case label. If a match is found, the program executes the associated statement. Example 5 shows an example of a switch statement.
Example 5 switch (expression){case label :
statement;break;
case label : statement;break;
...default : statement;
}
The program first looks for a label matching the value of the expression and then executes the associated statement. If no matching label is found, the program looks for the optional default statement. If a matching label is found, the program executes the associated statement. If no default statement is found, the program executes at the statement following the end of switch.
The optional break statement associated with each case label ensures that the program breaks out of switch once the matched statement executes and continues execution at the statement following switch. If break is omitted, the program continues execution at the next statement in the switch statement.
In Example 6, if expr evaluates to “Bananas,” the program matches the value with case Bananas and executes the associated statement. When break is encountered, the program terminates switch and executes the statement following is also be executed.
Example 6 switch (expr) {case "Oranges" :
Console.Writeln("Oranges are $0.59 a pound."); break;
case "Apples" :Console.Writeln("Apples are $0.32 a pound.");

58 Dashboard Scripting Reference
break;case "Bananas" :
Console.Writeln("Bananas are $0.48 a pound."); break;
case "Cherries" :Console.Writeln("Cherries are $3.00 a pound.");break;
default :Console.Writeln("Sorry, we are out of " + i + ".");
}Console.Writeln("Is there anything else you'd like?");
Loop StatementsA loop is a set of commands that repeatedly executes until a specified condition is met. JavaScript supports the following Loop statements:
● for Statements
● do...while Statements
● while Statements
● label Statements
● continue Statements
Note: label is not itself a looping statement, but is frequently used with these statements. In addition, you can use the break and continue statements within loop statements.
Note: The for...in statement executes statements repeatedly but is used for object manipulation. For more information, see “Manipulating Objects with JavaScript” on page 62
for StatementsThe for loop repeats until a specified condition evaluates to false. The JavaScript for loop is similar to the Java and C for loop.
for ([initialExpression]; [condition]; [incrementExpression]) {
statements}
When a for loop executes, the following occurs:
1. The initializing expression initialExpression, if any, is executed. This expression usually initializes one or more loop counters, but the syntax allows an expression of any degree of complexity.
2. The condition expression is evaluated. If the value of condition is true, the loop statements execute. If the value of condition is false, the for loop terminates.
3. The statements execute.
4. The update expression incrementExpression executes and control returns to Step 2 on page 58.

Using JavaScript Statements 59
do...while Statements
The do...while statement repeats until a specified condition evaluates to false. A do...while
statement looks as follows:
do {statement
} while (condition)
The statement executes once before the condition is checked. If the condition returns true, the statement executes again. At the end of every execution, the condition is checked. When the condition returns false, execution stops and control passes to the statement following do...while.
In the following example, the do...while loop iterates at least once and reiterates until it is no longer less than five.
do {i+=1;Console.Writeln(i);
} while (i<5);
while StatementsA while statement executes as long as a specified condition evaluates to true, for example:
while (condition) {statements
}
If the condition becomes false, the statements within the loop stop executing and control passes to the statement following the loop.
The condition test occurs before the statements in the loop are executed. If the condition returns true, the statements are executed and the condition is tested again. If the condition returns false, execution stops and control is passed to the statement following while.
In Example 7, the while loop repeats as long as n < 3:
Example 7 n = 0x = 0while( n < 3 ) {
n ++x += n
}
With each iteration, the loop increments n and adds that value to x. Therefore, x and n take on the following values:
● After the first pass: n = 1 and x = 1
● After the second pass: n = 2 and x = 3
● After the third pass: n = 3 and x = 6

60 Dashboard Scripting Reference
After completing the third pass, the condition n < 3 is no longer true, so the loop terminates.
In Example 8, the while loop is an infinite loop that never terminates; that is, it executes forever because the condition never becomes false.
Example 8 while (true) {Alert("Hello, world") }
label StatementsA label provides a statement with an identifier that lets you refer to it elsewhere in your program. For example, you can use a label to identify a loop, and then use the break or continue statements to indicate whether a program should interrupt the loop or continue its execution.
The syntax of the label statement looks like this:
label : statement
The value of label may be any JavaScript identifier that is not a reserved word. The statement that you identify with a label may be any type.
In Example 9, the label markLoop identifies a while loop.
Example 9 markLoop:while (theMark == true){
doSomething();}
continue StatementsThe continue statement can be used to restart a while, do...while, for, or label statement.
In a while or for statement, continue terminates the current loop and continues execution of the loop with the next iteration. In contrast to the break statement, continue does not entirely terminate the execution of the loop. In a while loop, it jumps back to the condition. In a for loop, it jumps to the increment expression.
In a label statement, continue is followed by a label that identifies a label statement. This type of continue restarts a label statement or continues execution of a labeled loop with the next iteration. The continue statement must be in a looping statement identified by the label used by continue.
The syntax of the continue statement looks like this:
1. continue
2. continue [label]
Example 10 shows a while loop with a continue statement that executes when the value of I is three. Thus, n takes on the values one, three, seven, and twelve.

Using JavaScript Statements 61
Example 10 i = 0n = 0while (i < 5) {
i++if (i == 3)
continuen += I
}
In Example 11, a statement labeled checkiandj contains a statement labeled checkj. If continue is encountered, the program terminates the current iteration of checkj and begins the next iteration. Whenever continue is encountered, checkj reiterates until its condition returns false. When false is returned, the remainder of the checkiandj statement is completed, and checkiandj reiterates until its condition returns false. When false is returned, the program continues at the statement following checkiandj. If continue had a label of checkiandj, the program would continue at the top of the checkiandj statement.
Example 11 checkiandj : while (i<4) {
Console.Writeln(i + ""); i+=1; checkj : while (j>4) {
Console.Writeln(j + ""); j-=1; if ((j%2)==0);
continue checkj;Console.Writeln(j + " is odd.");
} Console.Writeln("i = " + i + "");Console.Writeln("j = " + j + "");
}
break StatementsUse the break statement to terminate a loop, switch, or label statement.
When you use break with a while, do...while, for, or switch statement, break terminates the innermost enclosing loop or switch immediately and transfers control to the following statement.
When you use break within an enclosing label statement, it terminates the statement and transfers control to the following statement. If you specify a label when you issue the break, the break statement terminates the specified statement.
The syntax of the break statement looks like this:
1. break
2. break [label]
The first form of the syntax terminates the innermost enclosing loop, switch, or label; the second form of the syntax terminates the specified enclosing label statement.

62 Dashboard Scripting Reference
Example 12 iterates through the elements in an array until it finds the index of an element whose value is theValue.
Example 12 for (i = 0; i < a.length; i++) {if (a[i] = theValue);
break;}
Manipulating Objects with JavaScriptJavaScript uses for...in and with statements to manipulate objects. Review the following for information on:
● for...in Statement
● with Statement
for...in StatementThe for...in statement iterates a specific variable over all of the properties of an object. For each distinct property, JavaScript executes the specified statements. A for...in statement looks like this:
for (variable in object) {statements }
The function in Example 13 takes as its argument an object and the object’s name. It then iterates over all the object’s properties and returns a string that lists the property names and their values.
Example 13 function dump_props(obj, obj_name) { var result = "" for (var i in obj) { result += obj_name + "." + i + " = " + obj[i] + "" } result += "<HR>" return result}
For an object car with properties make and model, the result would be:
car.make = Fordcar.model = Mustang

Manipulating Objects with JavaScript 63
with StatementThe with statement establishes the default object for a set of statements. JavaScript looks up any unqualified names within the set of statements to determine if the names are properties of the default object. If an unqualified name matches a property, then the property is used in the statement; otherwise, a local or global variable is used.
A with statement looks like this:
with (object){statements
}
In Example 14, the with statement specifies that the Math object is the default object. The statements following the with statement refer to the PI property and the cos and sin methods without specifying an object. JavaScript assumes the Math object for these references.
Example 14 var a, x, yvar r=10 with (Math) {
a = PI * r * rx = r * cos(PI)y = r * sin(PI/2)
}

64 Dashboard Scripting Reference
Microsoft Automation Interfaces and the Object ModelThe object model is typically manipulated by the JavaScript language from inside an Dashboard section to build self-contained analytical applications.
Because Hyperion Intelligence Clients is an OLE Automation server, on Microsoft Windows systems, the object model can be addressed by Microsoft Automation Interfaces.
You can use Microsoft Automation Interfaces to control Hyperion Intelligence Clients in external applications such as Excel, Visual Basic, C++, or any application that can make OLE Automation calls. The object model is exposed through the BrioQuery.tbl file located in the system32 directory.
Figure 1 Using the Interactive Reporting object model from the Visual Basics for Applications editor within Excel 97
OLE Automation Controller within JavaScript (JOOLE)Hyperion Intelligence Clients is an OLE Automation controller. On Windows systems, Hyperion Intelligence Clients can control external applications (that is, programmable ActiveX objects) that are OLE Automation servers. By making OLE Automation calls, Hyperion Intelligence Clients can access functionality exposed by other OLE Automation Servers. Examples of OLE Automation Servers include MS Excel and MS Visual Basic.
To write a JOOLE object reference you can define it with the following syntax:
var <variableName> = new JOOLEObject(<ProgId>)
OLE Automation Controller within JavaScript (JOOLE) 65
<ProgID> is a string that shows the installed object that you want to reference and which the Interactive Reporting Studio or Interactive Reporting Web Client passes as a reference to the object, such as Excel.Application. <ProgID> is stored in the registry and consists of a string defined as Project.ClassName.
It is recommended that JOOLE calls stored in plug-in scripts be implemented on Internet Explorer.
JOOLE is Windows operating systems inclusive only.
Tip: You cannot embed OLE objects inside a Hyperion Intelligence Clients document. Likewise, Interactive Reporting Studio or Interactive Reporting Web Client is not an OLE Server that produces OLE objects you can embed in OLE Containers.
Example 15 shows you how to invoke a new Excel Worksheet from a command button created in an Dashboard section and write "Hello World" to rows 2 and 3 in column B.
Example 15 Excel = new JOOLEObject("Excel.Application"); Excel.Visible = true;Excel.Workbooks.Add;Excel.Sheets.Item(1).Cells.Item(2).Item(2).Value = "Hello";Excel.Sheets.Item(1).Cells.Item(2).Item(3).Value = "World";Print(Excel.Sheets.Item(1).Cells.Item(2).Item(2).Value);
Example 16 shows you how to invoke Outlook from a command button created in an Dashboard section, and write “Mail generated automatically” in the body of the email. Note that Outlook launches a message that warns a program is trying to automatically send an email to the user. The user can either accept or decline the email.
Example 16 var olApp = new JOOLEObject("Outlook.Application") var olNote = olApp.CreateItem(0) olNote.To = "[email protected]"olNote.Subject = "JOOLEObject mail Example"olNote.Body = "This is an automatically generated note."//olNote.Attachments.Add (filepath)olNote.Send
If you are using JOOLE to start Outlook on Windows XP, use the following script:
var obj = Application.Shell("c:\\program Files\\outlook express\\msimn.exe")
Example 17 shows you how to invoke an existing Word document called “Hello.doc” from a command button created in an Dashboard section, display it and then print it automatically.
Example 17 /Create Word Object word = new JOOLEObject("Word.Application");// Make is Visible
66 Dashboard Scripting Reference
word.Visible = true;//Open the desired file word.Documents.Open("c:\\Hyperion\\Hello.doc");// Set Options word.Options.PrintBackground = false;//Start Printing word.ActiveDocument.PrintOut();
Example 18 shows you how to create and write text to a text file (.TXT) from your Interactive Reporting document file. The text file assumes the name of the Interactive Reporting document but appends the characters “_trace” and replaces the Interactive Reporting document extension with a .TXT extension. For example if your Interactive Reporting document is name DashboardText.bqy, then the Interactive Reporting Studio or
Interactive Reporting Web Clientcreates the text file named DashboardText_trace.txt.
Example 18 var oleApp = new JOOLEObject("Scripting.FileSystemObject")var myPath=ActiveDocument.Path.slice(0,-4)+"_trace.txt"var traceDoc=oleApp.CreateTextFile(myPath)traceDoc.WriteLine("hello from Hyperion")traceDoc.Close()
Exporting Scripts to Text FilesUse the Export Scripts To Text File feature to export JavaScript code and associated events contained in a Interactive Reporting document file into a text file (.TXT). Hyperion Intelligence Clients categorizes the text file by object name and events, and includes document and custom menu item scripts.
➤ To export a script to a text file:
1 Choose File > Export > Scripts To Text File.
The Export Script dialog box is displayed.
2 Specify the file name and location, and click Save.
Troubleshooting Scripts 67
Troubleshooting ScriptsWhen a script fails to execute due to a syntax or runtime error, you need to debug the code. Finding errors may take time depending on the length and complexity of the code. One way to prevent errors is by observing the protocols that JavaScript requires. This section explains what you need to know to help prevent and locate errors in your scripts. This section includes the following topics:
● Space-Saving Variables
● Case-Sensitive Code
● Assignment Operators Versus Comparison Operators
● Conditional Tests
● Syntax Reference
● Recalculating Results
● Designing Your Script
● Code Entry
● Bypass Errors
● Getting Help with a Problem Script
Space-Saving VariablesOne exception to the Code Entry rule is: if you plan to repeatedly use an object model path, define it as a variable to save space and keep your script compact.
For example, instead of typing:
ActiveDocument.Sections["Query"].DataModel.Connection.Username = "hyperion"ActiveDocument.Sections["Query"].DataModel.Connection.SetPassword("hyperion")ActiveDocument.Sections["Query"].DataModel.Connection.Connect
try this:
DMPath = ActiveDocument.Sections["Query"].DataModel.ConnectionDMPath.Username = "hyperion"DMPath.SetPassword("hyperion")DMPath.Connect
You must remember to treat space-saving variables like the actual object model paths. That is, insert periods between object model segments and do not add unnecessary spaces.
Also, it is generally a good idea to only include objects as part of the path. That is, make sure that your variable does not have any methods or properties segments for the object with which you want to work. For example:
LPath = ActiveDocument.Sections["Query"].LimitsLPath.Activate()
is incorrect because ActiveDocument.Sections["Query"].Limits does not have an Activate() method.
68 Dashboard Scripting Reference
However, this script is correct:
LPath = ActiveDocument.Sections["Query"]LPath.Activate()
Case-Sensitive CodeJavaScript is case sensitive and distinguishes between uppercase (capital) and lowercase (small) letters. Rules to remember include:
● All JavaScript statements (for example, var, if…else, while, switch, and so on) start with a lowercase letter. This script fails because var is capitalized:
Var StringName = "John Smith"
● All JavaScript core operators start with an uppercase letter, for example new Date(). This script fails because Date is in lowercase.
new date()
● All object model Path segments start with a capital letter, for example ActiveDocument.Sections["Dashboard"].Activate().
Both of these commands cause the script to fail because the ActiveDocument segment is not properly capitalized.
activeDocument.Sections["Dashboard"].Activate()
Activedocument.Sections["Dashboard"].Activate()
● You must refer to variables exactly as you define them. If you define a variable as:
var StringName
then you must always refer to it as StringName, not Stringname or stringName or stringname.
Assignment Operators Versus Comparison OperatorsJavaScript makes a distinction between Assignment and Comparison Operators.
This is an assignment operator:
myvar = 5
This is a comparison operator:
if (myvar == 5)
A common error is to switch the two. Keep them separate. Be particularly careful when you are assigning argument values to methods.
DMPath = ActiveDocument.Sections[”Query”].DataModel.Connection//This works…DMPath.SetPassword(“hyperion”)
//This does not!!!!DMPath.SetPassword = "hyperion"
The last line of script assigns the value “hyperion” to DMPath.SetPassword, which is probably not what you want to do.
Troubleshooting Scripts 69
Conditional TestsWhen using if statements, avoid impossible conditional tests. For example, the following script always returns “myvar is not 5!” even though myvar is 5. This is because the condition always evaluates to false. In this case, 5 is not the same as “five.”
var myvar = 5if ( myvar == "five")
{Alert("myvar = 5!")}
else{Alert("myvar is not 5!")}
It is especially important to know exactly how a variable reports in your condition. The Console.Writeln() and Alert() methods are especially useful in diagnosing problems like this. The JavaScript core operator String is used only to format myvar for the Console window:
var myvar = 5Console.Writeln(String(myvar))
if ( myvar == "five"){Alert("myvar = 5!")}
else{Alert("myvar is not 5!")}
If you are comparing the value you selected in a list box or a drop-down box to another value, make sure you know what value you are getting back before you compare it to something else. You especially want to avoid mixing up the placement of the item you selected in the control with the item’s actual value.
Sometimes it is a bit tricky to get the value you want back from one of these control boxes. Remember that list boxes have selected lists that may contain multiple values, while drop-down boxes have a selected that can contain only one value.
For example, if you have values of 4, 9, 15, 25, and 36 in your drop-down box, and you select 36, the script below returns myvar is 5!, which seems wrong.
This happens because the DropDown1.SelectedIndex returns the placement in the drop-down box of the item you selected. Your choice of 36 is the fifth item in the drop-down box. Note that the console window reports “5”.
var myvar = DropDown1.SelectedIndexConsole.Writeln(String(myvar))if ( myvar == 5)
{Alert("myvar = 5!")}
else{Alert("myvar is not 5!")}
70 Dashboard Scripting Reference
Now let’s say you have a drop-down box that contains the values of: one, two, three, four and five. The script below returns myvar = five! when you select five. However this is only because your choice five is the fifth choice in the drop-down box. However, the fifth choice is not necessarily equal to five. You can end up comparing the wrong things.
DropDown1 = ActiveDocument.Sections["Dashboard"].Shapes.DropDown1var myvar = DropDown1.SelectedIndexConsole.Writeln(String(myvar))if ( myvar == 5)
{Alert("myvar = five!")}
else{Alert("myvar is not five!")}
The script below returns the actual value you see in the drop-down box. Let’s assume again that you have a drop-down box that contains the values of: one, two, three, four and five:
DropDown1 = ActiveDocument.Sections["Dashboard"].Shapes.DropDown1var myvar = DropDown1[DropDown1.SelectedIndex]Console.Writeln(String(myvar))if ( myvar == "five")
{Alert("myvar = 5!")}
else{Alert("myvar is not 5!")}
Syntax ReferenceOn the bottom left of the Script Editor, directly above the Help button, is the Description pane. The Description pane shows you the necessary syntax for any item you select in the Object browser.
For example, in the Object browser, navigate to Application > ActiveDocument > Sections > Query > Methods, then select the Activate(). The Description pane reads:
void Activate()
This indicates that the Activate() method does not take any arguments.
Now click on the Export() method. The Description pane reads:
void Export(String Filename, BqExportFileFormat FileFormat, [optional] Boolean IncludeHeaders)
This indicates that the Export() takes three arguments, two required arguments and an one optional.
For more detailed information, click Help to open the online help for the Export() Method topic.
Troubleshooting Scripts 71
Recalculating ResultsA script that includes limits may execute slowly because it has to recalculate a complete data set each time there is a modification. You can use the SuspendRecalculate property to prevent a Results limit from recalculating after each modification.
In the following example, limit values are dynamically selected at a list box, but the recalculation occurs only after the last value is selected.
Sections[sect_name].Limits[limit_col].SuspendRecalculation = true;Sections[sect_name].Limits[limit_col].SelectedValues.RemoveAll();for(I = 1; I <= ListBox2.SelectedList.Count;I++){
NewLimitValue = ListBox2.SelectedList[I];newname += ListBox2.SelectedList[I]Sections[sect_name].Limits[limit_col].SelectedValues.Add(NewLimitValue);
}Sections["Results"].Limits["1"].SuspendRecalculation = false;Sections[sect_name].Limits[limit_col].Ignore=false; // Trigger recalculation now
Designing Your ScriptJavaScript is an interpreted, not a compiled, language and it evaluates and runs each line of code in sequence. If JavaScript finds a problem with a line of code as it attempts to run it, it simply stops. Although the Hyperion Intelligence Clients Script Editor syntax checker catches some obvious syntax errors, many errors may go unnoticed until run time.
You should identify whether each line of code executes or fails. While it may seem like a lot of work to identify each line of code in this fashion, it pays off in time saved developing your scripts. It is also an essential technique for identifying problems in your scripts. You can check the legitimacy of your scripts using the Console window.
The Console window is used to display error messages and alert values generated by the JavaScript interpreter. During a script debugging cycle, you can write messages to the Console window to track the state of variables and the progress of the script. If a syntax error is detected (and not a runtime error), the error and the line number in which it has occurred appear in the console window. Use the line number to move directly to the line where the error has occurred in the Script Editor.
You can access the Console window from any section within the document; it remains open until you close it.
The Console window also displays the buffer of all error messages that occur from when Hyperion Intelligence Clients is started. Thus, the Console window may display information that is no longer of value to you. You can choose Edit > Clear to clear the buffer contents. When the Console window is closed, the buffer size is 1,000 bytes. When the Console window is open, the buffer size is 641 bytes.
There are two major techniques to write to the Console window: the Console.Write()/ Console.Writeln() methods, and the Alert() method.
72 Dashboard Scripting Reference
The Console.Write() and Console.Writeln() methods are essentially identical. Both write to the Console window, which you can open by choosing View > Console Window. Console.Write() does not add a carriage return at the end of a line, while Console.Writeln() does add a carriage return.
Note: Console.Writeln() is spelled with a lowercase L and N, which is an abbreviation for Write Line.
Console.Writeln() is the preferred technique for most users. It allows the script to run without user interaction, and the Console windows keeps a record of each line as it is written to the Console.
In some cases, the Console.Writeln() method is less desirable. Additionally, the web client’s Console window must be closed when a script runs.
If you wish to step through a tricky section of code in your script, you should use the Alert() method.
Whichever method you use, you need to identify the beginning and end of each script as well as each line of code before it executes. In the following example, the script moves to the Query section and removes any limits.
Console.Writeln("Start Query Script")Console.Writeln("Step1")ActiveDocument.Sections["Query"].Activate()Console.Writeln("Step2")ActiveDocument.Sections["Query"].Limits.RemoveAll()Console.Writeln("Step3")Console.Writeln("End Query Script")
Based on the above script, the Console window displays:
Start Query ScriptStep1Step2Step3End Query Script
Code EntryWhenever possible, use the Object browser click to add code to the Script Editor, rather than manually typing in the JavaScript. Sometimes errors occur because you have typed an extra space or a period instead of a comma.
You can also use cut-and-paste to enter code. For example, if you define a variable as DashboardName, and then later retype it as Dashboardname (see “Case-Sensitive Code” on page 68 for more information), the difference in case causes a failure. Avoid such problems by carefully cutting and pasting whenever possible.
Troubleshooting Scripts 73
Bypass ErrorsThe try-catch block is borrowed from Java and is used to bypass errors. The general syntax for a try-catch block is:
try{do something}catch(errorname){do something with the error}finally{do something else}
For example:
QPath = ActiveDocument.Sections["Query"].Limitstry{QPath.Activate()}catch(e){Alert(e.toString())}finally{Alert("We're Done!")}
The try-catch block generally does not catch definition errors, but shows an error in the Console window at the lowercase “d” in “date()”:
try{Alert(new date())}catch(e){Alert(e.toString())}finally{Alert("We're Done!")}
Getting Help with a Problem ScriptIf you have followed all the practices described in this section and you are still not able to get your script to do what you want it to do, consider opening a call with Hyperion Solutions Customer Support at 1-877-901-4975 or email Hyperion at http://www.hyperion.com.
Hyperion Solutions Customer Support engineers does need to see your actual Interactive Reporting document that contains the script at issue. This is necessary due to the possibility of typos, and because of the relationship between a script and an individual Interactive Reporting document.
If your data is confidential, consider duplicating your Interactive Reporting document file using the sample script that ships with Hyperion Intelligence Clients. Alternatively, you might consider saving the file without results, or if results are necessary to the function of the script, you may consider limiting your results sets to only a few rows. To set this option, choose Query > Query Options.
The sooner you can locate the problem and the exact point of failure in your script, the sooner Hyperion Solutions Customer Support can analyze the issue and suggest solutions.
Be sure to specify in which section of the Interactive Reporting document the problem script resides, and within which control it can be found.

74 Dashboard Scripting Reference
Remember that a problem in one script may be as a result of something defined in a different script.
Hyperion Solutions Customer Support may need to evaluate your document start up scripts and your Dashboard section scripts, as well as the script in the particular control that is causing the problem. For this reason, we strongly recommend you use the Console.Writeln() method to identify each of your lines of code in each of your scripts to the Console window. This may make the problem self-evident.
Object Model Map 75
C h a p t e r
5Object Model Map
This chapter provides a detailed map of how objects relate to one another within the Hyperion Intelligence Clients object model. The object model map is divided according to these levels and/or sections of the object tree:
In This Chapter Object Model Hierarchy . . . . . . . . . . . . . . . . . . . . . . . . . . . . . . . . . . . . . . . . . . . . . . . . . . . . . . . . . . . . . . . . . . . . . 76
Application Level . . . . . . . . . . . . . . . . . . . . . . . . . . . . . . . . . . . . . . . . . . . . . . . . . . . . . . . . . . . . . . . . . . . . . . . . . . 77
Active Document Level. . . . . . . . . . . . . . . . . . . . . . . . . . . . . . . . . . . . . . . . . . . . . . . . . . . . . . . . . . . . . . . . . . . . . . 78
Query Section . . . . . . . . . . . . . . . . . . . . . . . . . . . . . . . . . . . . . . . . . . . . . . . . . . . . . . . . . . . . . . . . . . . . . . . . . . . . 79
Dashboard Section . . . . . . . . . . . . . . . . . . . . . . . . . . . . . . . . . . . . . . . . . . . . . . . . . . . . . . . . . . . . . . . . . . . . . . . . 80
Chart Section . . . . . . . . . . . . . . . . . . . . . . . . . . . . . . . . . . . . . . . . . . . . . . . . . . . . . . . . . . . . . . . . . . . . . . . . . . . . 81
Results, Report, and Pivot Sections . . . . . . . . . . . . . . . . . . . . . . . . . . . . . . . . . . . . . . . . . . . . . . . . . . . . . . . . . . . . 82
Table and OLAPQuery Sections. . . . . . . . . . . . . . . . . . . . . . . . . . . . . . . . . . . . . . . . . . . . . . . . . . . . . . . . . . . . . . . . 83

76 Object Model Map
Object Model HierarchyThe object model map is an expanded view of selected objects in the object model hierarchy, as seen in the Dashboard Script Editor. It starts at the highest level—the Application level—and drills down through the object hierarchy. The top levels of the object model hierarchy include:
● Application Level
● Active Document Level
● Sections
Application Level
ActiveDocument Level
Expanded Query Section
Sections
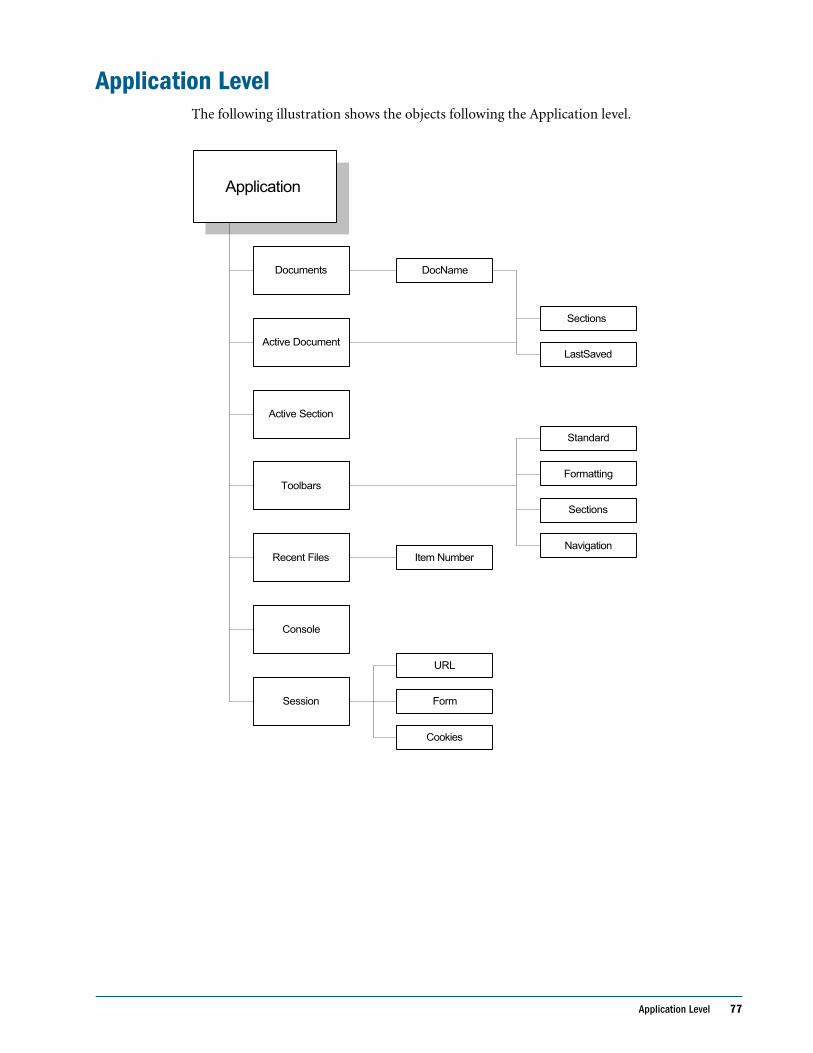
Application Level 77
Application LevelThe following illustration shows the objects following the Application level.
Active Document
Active Section
Toolbars
Recent Files
Console
Session
DocName
LastSaved
Standard
Formatting
Sections
NavigationItem Number
Form
URL
Cookies
Documents
Sections
Application
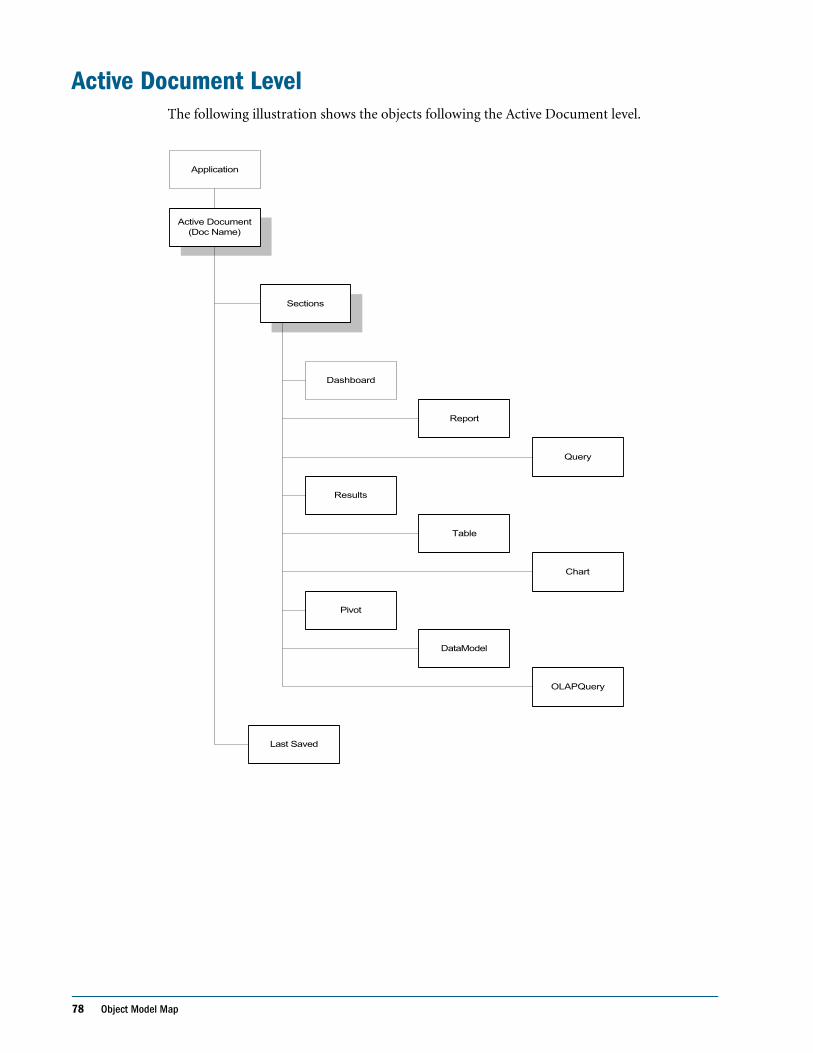
78 Object Model Map
Active Document LevelThe following illustration shows the objects following the Active Document level.
Dashboard
Sections
Query
Table
Pivot
OLAPQuery
Report
Results
Chart
DataModel
Active Document
(Doc Name)
Last Saved
Application
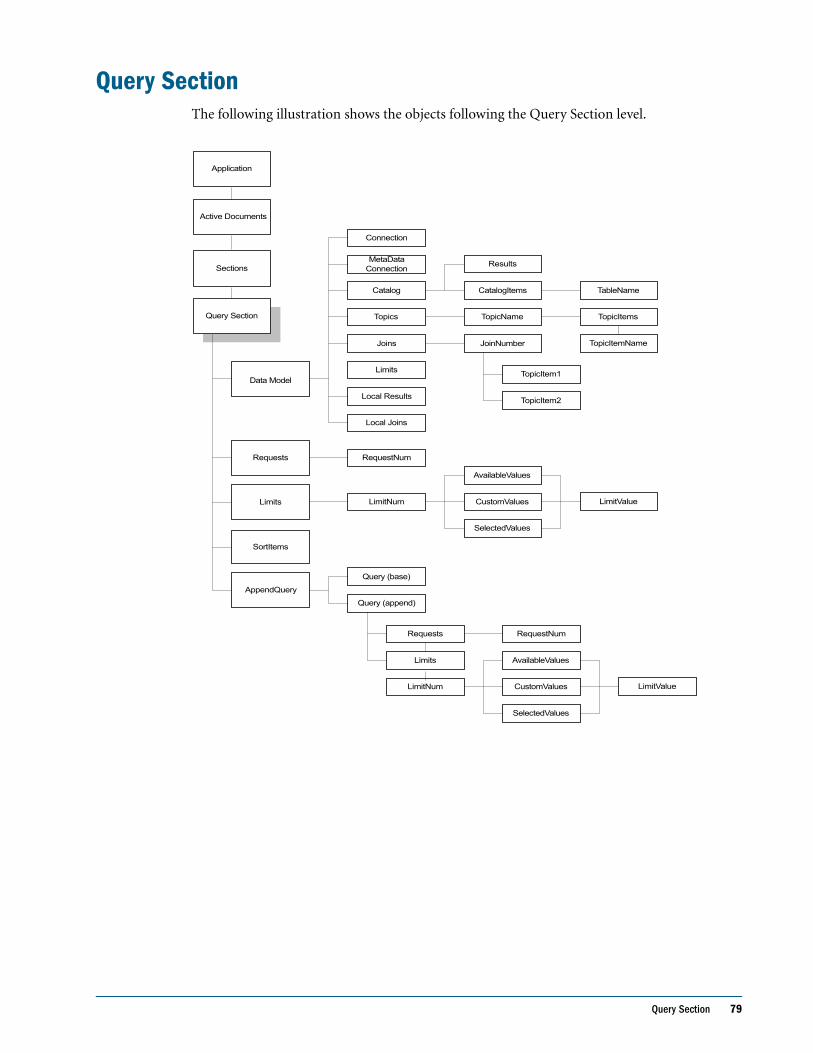
Query Section 79
Query SectionThe following illustration shows the objects following the Query Section level.
Query Section
Sections
Active Documents
Application
Data Model
Connection
MetaDataConnection
CatalogItems
Topics TopicItems
TopicItemName
Catalog
Joins JoinNumber
TopicItem1
TopicItem2
Limits
Local Results
Local Joins
Requests
Limits
RequestNum
LimitNum
AvailableValues
SelectedValues
CustomValues
SortItems
Query (base)
Query (append)
Requests RequestNum
Limits
AppendQuery
LimitValue
TableName
TopicName
Results
AvailableValues
SelectedValues
CustomValues LimitValueLimitNum
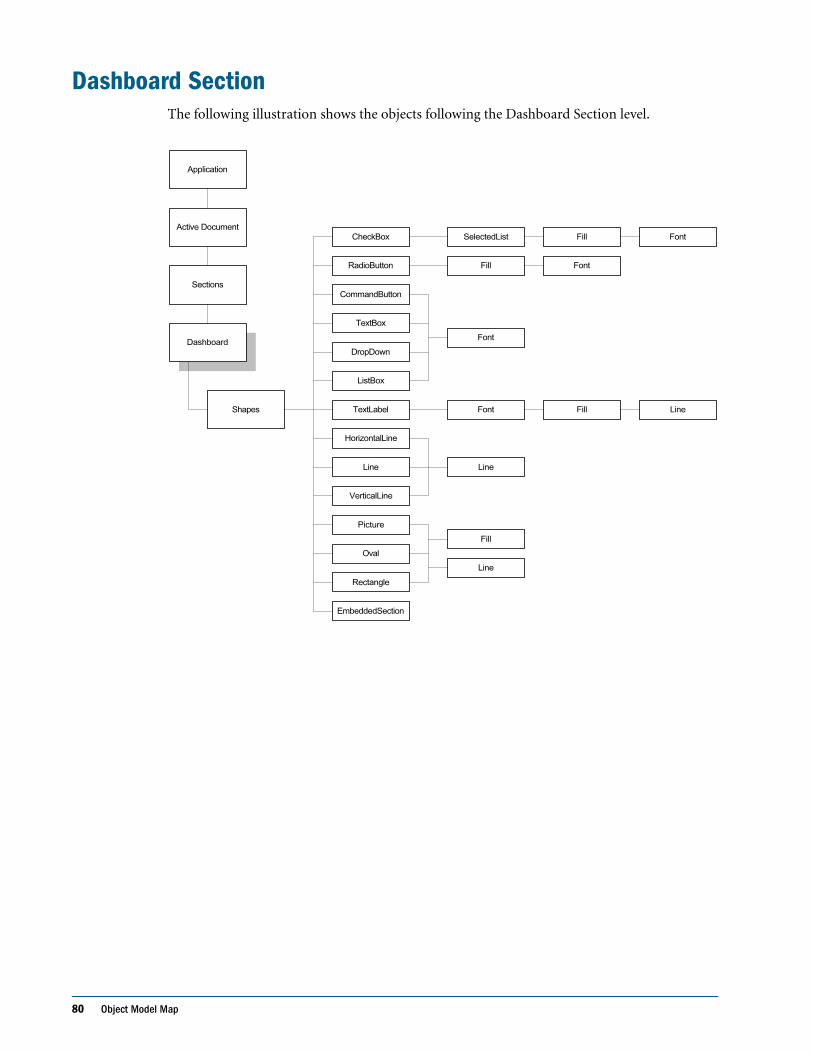
80 Object Model Map
Dashboard SectionThe following illustration shows the objects following the Dashboard Section level.
Dashboard
Sections
Active Document
Shapes
CommandButton
TextBox
DropDown
ListBox
CheckBox
RadioButton
HorizontalLine
TextLabel
VerticalLine
Line
EmbeddedSection
Picture
Font
Font
SelectedList
Rectangle
Fill
Oval
Fill Font
Line
Line
Line
Fill
Fill Font
Application
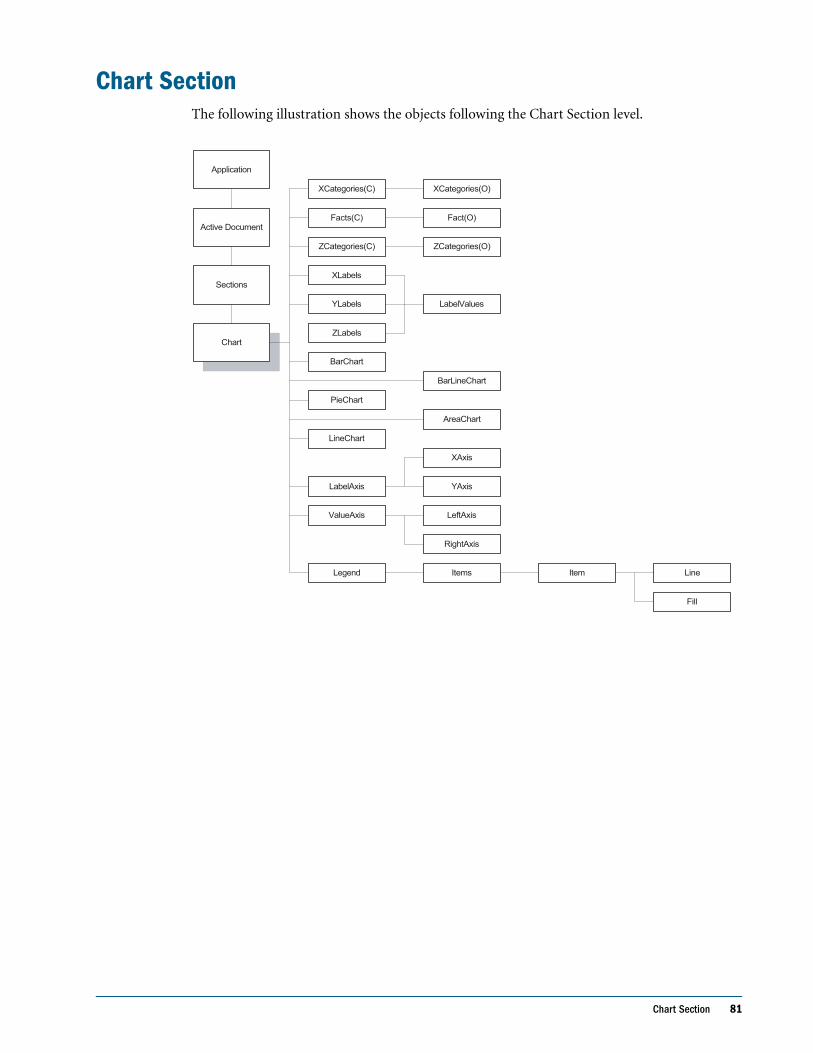
Chart Section 81
Chart SectionThe following illustration shows the objects following the Chart Section level.
Chart
Sections
Active Document
XCategories(C)
Facts(C)
ZCategories(C)
XLabels
YLabels
ValueAxis
LabelAxis
AreaChart
PieChart
BarLineChart
BarChart
LineChart
Legend
XAxis
YAxis
LeftAxis
Items
RightAxis
LabelValues
ZCategories(O)
Fact(O)
XCategories(O)
Item
Fill
Line
ZLabels
Application

82 Object Model Map
Results, Report, and Pivot SectionsThe following illustration shows the objects following the Results, Report, and Pivot Section levels.
Results
Sections
Columns Column
Limits
SortItems SortItem
AvailableValues
CustomValuesLimit
SelectedValues
TopLabels
SideLabels
Facts
PivotLabel
LimitVa
CornerLabels
DataLabels
PivotFact
Application
Active Document
Pivots
Reports
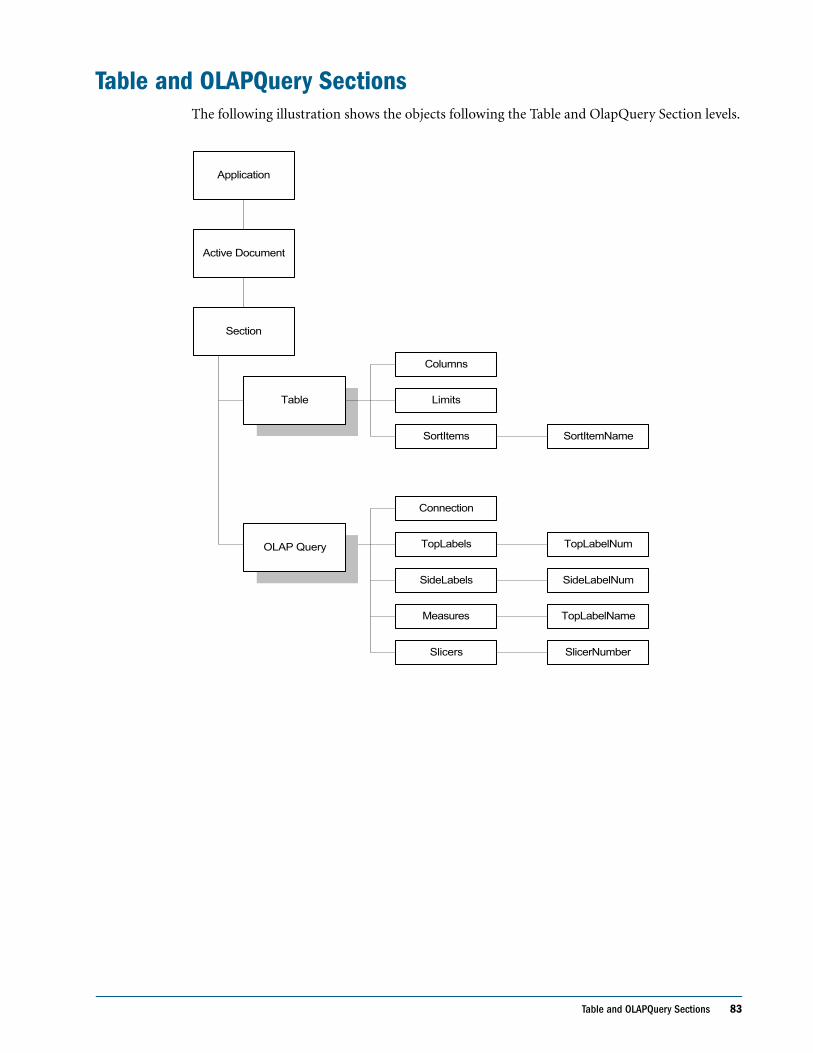
Table and OLAPQuery Sections 83
Table and OLAPQuery SectionsThe following illustration shows the objects following the Table and OlapQuery Section levels.
Table
Section
Columns
Limits
SortItems
TopLabels
Connection
SideLabels
Measures
Slicers
SortItemName
SlicerNumber
TopLabelName
SideLabelNum
TopLabelNum
Application
Active Document
OLAP Query

84 Object Model Map

JavaScript Examples 85
C h a p t e r
6JavaScript Examples
This chapter provides sample JavaScript scripts for Designer and Explorer tasks.
In This Chapter Displaying and Entering Values in a Text Box . . . . . . . . . . . . . . . . . . . . . . . . . . . . . . . . . . . . . . . . . . . . . . . . . . . . . . 86
Retrieving and Setting the Properties of an Object. . . . . . . . . . . . . . . . . . . . . . . . . . . . . . . . . . . . . . . . . . . . . . . . . . 86
Enabling and Disabling Controls. . . . . . . . . . . . . . . . . . . . . . . . . . . . . . . . . . . . . . . . . . . . . . . . . . . . . . . . . . . . . . . 87
Controlling the Visibility of Graphics and Controls . . . . . . . . . . . . . . . . . . . . . . . . . . . . . . . . . . . . . . . . . . . . . . . . . . 87
Creating an OCE (connection file). . . . . . . . . . . . . . . . . . . . . . . . . . . . . . . . . . . . . . . . . . . . . . . . . . . . . . . . . . . . . . 88
Displaying a Connection Login Box . . . . . . . . . . . . . . . . . . . . . . . . . . . . . . . . . . . . . . . . . . . . . . . . . . . . . . . . . . . . . 88
Downloading Data Models . . . . . . . . . . . . . . . . . . . . . . . . . . . . . . . . . . . . . . . . . . . . . . . . . . . . . . . . . . . . . . . . . . . 90
Displaying a Table Catalog . . . . . . . . . . . . . . . . . . . . . . . . . . . . . . . . . . . . . . . . . . . . . . . . . . . . . . . . . . . . . . . . . . . 91
Adding Topics to a Data Model Section . . . . . . . . . . . . . . . . . . . . . . . . . . . . . . . . . . . . . . . . . . . . . . . . . . . . . . . . . 91
Setting up Topic Object Variables . . . . . . . . . . . . . . . . . . . . . . . . . . . . . . . . . . . . . . . . . . . . . . . . . . . . . . . . . . . . . . 91
Adding Joins . . . . . . . . . . . . . . . . . . . . . . . . . . . . . . . . . . . . . . . . . . . . . . . . . . . . . . . . . . . . . . . . . . . . . . . . . . . . . 91
Adding Items to the Request Line. . . . . . . . . . . . . . . . . . . . . . . . . . . . . . . . . . . . . . . . . . . . . . . . . . . . . . . . . . . . . . 92
Adding a Computed Column to a Query Request Line . . . . . . . . . . . . . . . . . . . . . . . . . . . . . . . . . . . . . . . . . . . . . . . 92
Creating and Setting Variable Limits . . . . . . . . . . . . . . . . . . . . . . . . . . . . . . . . . . . . . . . . . . . . . . . . . . . . . . . . . . . . 92
Using a BrioQuery 5.5 Limit Dialog Box and Storing Selected Value in Text Box . . . . . . . . . . . . . . . . . . . . . . . . . . . . 92
Turning off the Page Headers for the First Page in the Report . . . . . . . . . . . . . . . . . . . . . . . . . . . . . . . . . . . . . . . . . . 93
Turning off the Prompt To Save Dialog Box . . . . . . . . . . . . . . . . . . . . . . . . . . . . . . . . . . . . . . . . . . . . . . . . . . . . . . . 93
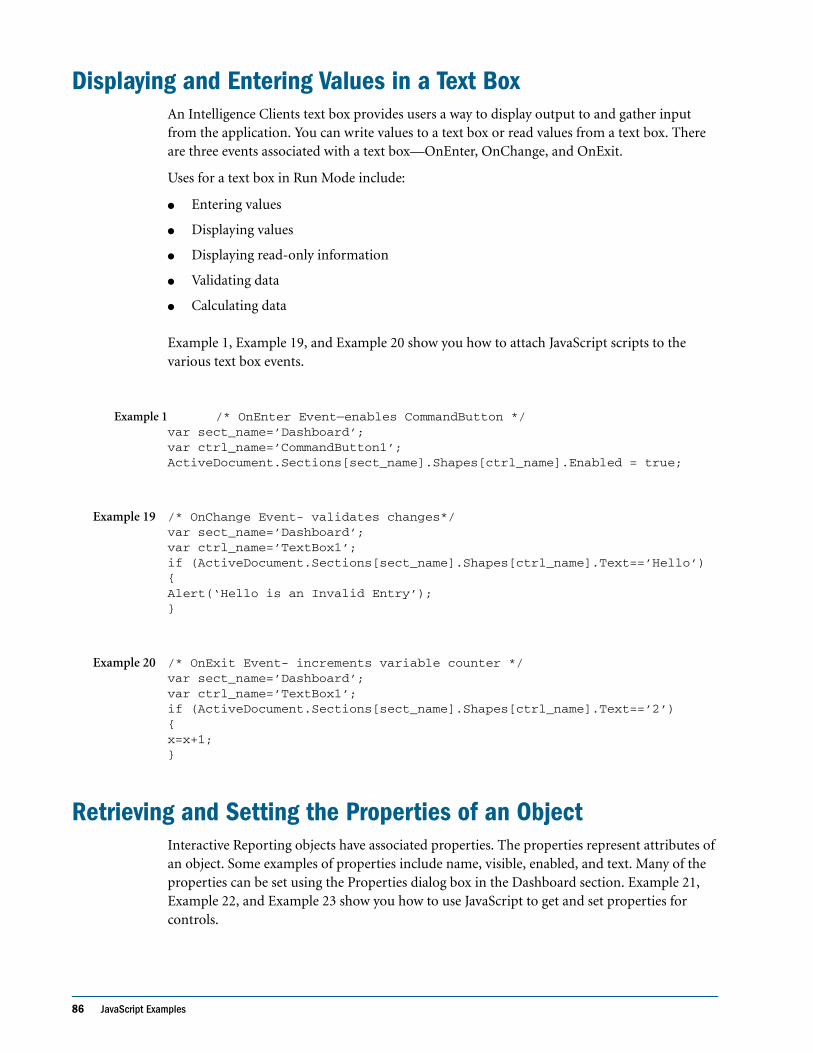
86 JavaScript Examples
Displaying and Entering Values in a Text BoxAn Intelligence Clients text box provides users a way to display output to and gather input from the application. You can write values to a text box or read values from a text box. There are three events associated with a text box—OnEnter, OnChange, and OnExit.
Uses for a text box in Run Mode include:
● Entering values
● Displaying values
● Displaying read-only information
● Validating data
● Calculating data
Example 1, Example 19, and Example 20 show you how to attach JavaScript scripts to the various text box events.
Example 1 /* OnEnter Event—enables CommandButton */var sect_name=’Dashboard’;var ctrl_name=’CommandButton1’;ActiveDocument.Sections[sect_name].Shapes[ctrl_name].Enabled = true;
Example 19 /* OnChange Event- validates changes*/var sect_name=’Dashboard’;var ctrl_name=’TextBox1’;if (ActiveDocument.Sections[sect_name].Shapes[ctrl_name].Text==’Hello’){Alert(‘Hello is an Invalid Entry’);}
Example 20 /* OnExit Event- increments variable counter */var sect_name=’Dashboard’;var ctrl_name=’TextBox1’;if (ActiveDocument.Sections[sect_name].Shapes[ctrl_name].Text==’2’){x=x+1;}
Retrieving and Setting the Properties of an ObjectInteractive Reporting objects have associated properties. The properties represent attributes of an object. Some examples of properties include name, visible, enabled, and text. Many of the properties can be set using the Properties dialog box in the Dashboard section. Example 21, Example 22, and Example 23 show you how to use JavaScript to get and set properties for controls.

Controlling the Visibility of Graphics and Controls 87
Example 21 /* Get the value of the ListBox MultiSelect property*/var sect_name=’Dashboard’;var ctrl_name=’ListBox1’;TextBox1.Text =ActiveDocument.Sections[sect_name].Shapes[ctrl_name].MultiSelect;
Example 22 /* Set the value of the CheckBox Checked property */var sect_name=’Dashboard’;var ctrl_name=’CheckBox1’;ActiveDocument.Sections[sect_name].Shapes[ctrl_name].Checked = true;
Example 23 /* Get the value of the RadioButton Group property */var sect_name=’Dashboard’;var ctrl_name=’CheckBox1’;TextBox1.Text =ActiveDocument.Sections[sect_name].Shapes[ctrl_name].Group;
Enabling and Disabling ControlsDashboard graphics and control objects have an enabled property that determines whether the object is enabled or disabled in Dashboard Run mode. When an object is enabled, users can access the control and trigger events that can perform actions. When an object is disabled, the object appears dimmed and does not recognize events when a user attempts to access the control. The enabled property is available from the Object page of the Properties dialog box for graphics and control objects. Example 24 and Example 25 show how to programmatically enable or disable a control.
Example 24 /* Enables controls */var sect_name=’Dashboard’;var ctrl_name=’TextBox1’;ActiveDocument.Sections[sect_name].Shapes[ctrl_name].Enabled = true;
Example 25 /* Disables controls */var sect_name=’DashboardDashboard’;var ctrl_name=’TextBox1’;ActiveDocument.Sections[sect_name].Shapes[ctrl_name].Enabled = false;
Controlling the Visibility of Graphics and ControlsDashboard graphics and control objects have a visible property that determines whether the object is displayed in Dashboard Run mode. When an object is visible, users can access the control and trigger events that can perform actions. When an object is invisible, the object is not displayed. The visible property is available from the Object page of the Properties dialog box for graphics and control objects. Example 26 and Example 27 show you how to programmatically make a control visible or invisible.
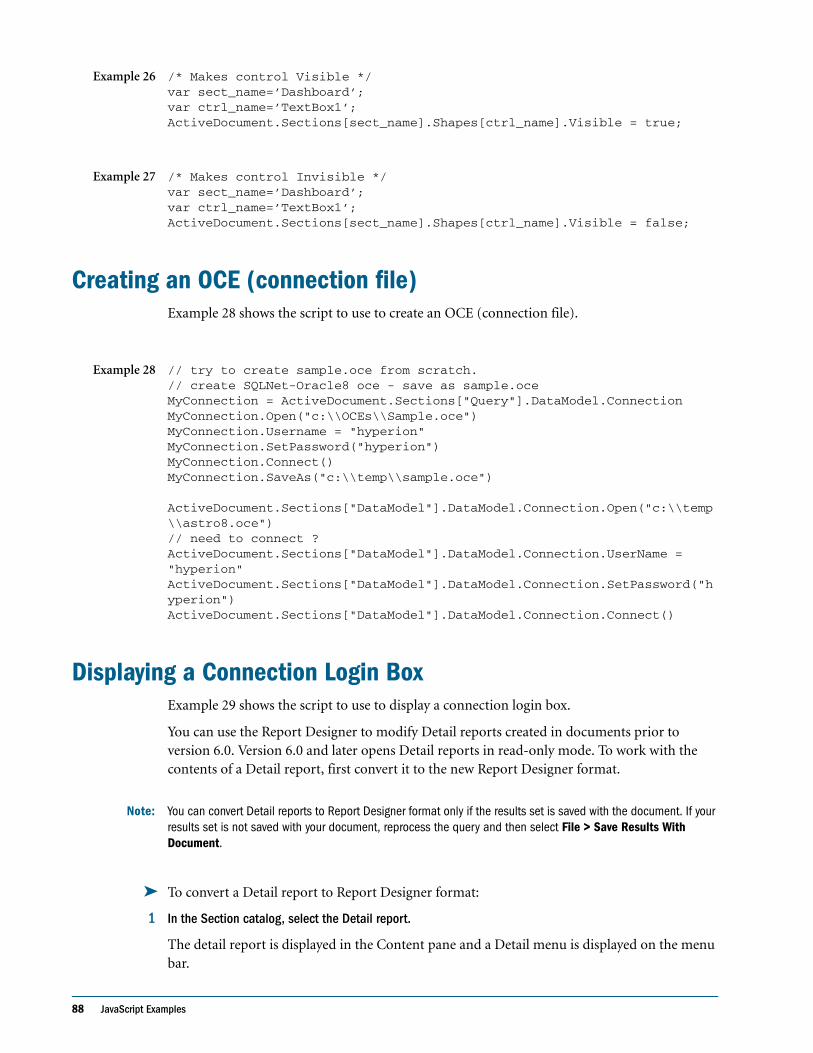
88 JavaScript Examples
Example 26 /* Makes control Visible */var sect_name=’Dashboard’;var ctrl_name=’TextBox1’;ActiveDocument.Sections[sect_name].Shapes[ctrl_name].Visible = true;
Example 27 /* Makes control Invisible */var sect_name=’Dashboard’;var ctrl_name=’TextBox1’;ActiveDocument.Sections[sect_name].Shapes[ctrl_name].Visible = false;
Creating an OCE (connection file)Example 28 shows the script to use to create an OCE (connection file).
Example 28 // try to create sample.oce from scratch.// create SQLNet-Oracle8 oce - save as sample.oceMyConnection = ActiveDocument.Sections["Query"].DataModel.ConnectionMyConnection.Open("c:\\OCEs\\Sample.oce")MyConnection.Username = "hyperion"MyConnection.SetPassword("hyperion")MyConnection.Connect()MyConnection.SaveAs("c:\\temp\\sample.oce")
ActiveDocument.Sections["DataModel"].DataModel.Connection.Open("c:\\temp\\astro8.oce")// need to connect ?ActiveDocument.Sections["DataModel"].DataModel.Connection.UserName = "hyperion"ActiveDocument.Sections["DataModel"].DataModel.Connection.SetPassword("hyperion")ActiveDocument.Sections["DataModel"].DataModel.Connection.Connect()
Displaying a Connection Login BoxExample 29 shows the script to use to display a connection login box.
You can use the Report Designer to modify Detail reports created in documents prior to version 6.0. Version 6.0 and later opens Detail reports in read-only mode. To work with the contents of a Detail report, first convert it to the new Report Designer format.
Note: You can convert Detail reports to Report Designer format only if the results set is saved with the document. If your results set is not saved with your document, reprocess the query and then select File > Save Results With Document.
➤ To convert a Detail report to Report Designer format:
1 In the Section catalog, select the Detail report.
The detail report is displayed in the Content pane and a Detail menu is displayed on the menu bar.

Displaying a Connection Login Box 89
2 Select Detail > Convert To Report.
Detail report is converted to the new Report Designer format and inserts a new Report section into the document. The original Detail report is left unchanged.
While every effort has been made to make the converted report as close as possible to the original Detail report design, you may need to clean up some reports, especially those that use computed items, multiple page headers/footers, or complex formatting.
Detail reports can be exported from the current version of the product to all of the previously supported formats, including Excel (.xls), Lotus 1-2-3 (.wks), tab-delimited text (.txt). comma-separated text (.csv), and HTML (.htm).
Display DifferencesThe page margins of a report created by the conversion process may be displayed smaller than in the original Detail report. This is because the new Report section is a WYSIWYG display that includes the unprintable area that exists outside of report margins. In version 5.x, Detail reports did not display or store information about the unprintable area. You can manually adjust the margin sizes in the converted report if needed.
If a Detail report contains multiple page header and footer sections, the current version of the product resolves these to a single page header and footer section during the conversion process. The height of the headers and footers in the converted report is equal to the combined heights of all headers and footers in the original Detail report. This may cause graphic and text objects in the headers and footers to overlap. You should manually adjust the properties, size, and/or position of these objects as necessary.
Conversion of Detail Report CategoriesDetail Report categories from Detail reports are converted into report groups in the new Report section. The converted report displays Report Group Header and Footer sections if the corresponding category header and footer bands are visible in the original Detail report. The height of these header and footer sections remains the same. Detail report category labels are converted into JavaScript-based computed fields. Display properties remain unchanged.
Conversion of Data AreaTo preserve as much of the original data and layout as possible, the conversion process translates the Detail report body information to a single table object in the body section of the converted report. This may lead to a loss of fidelity when converting complex or non-tabular style Detail reports.
90 JavaScript Examples
Conversion of FactsDuring report conversion, Detail report facts are added to the right of the dimension columns in the body section table. Number formats applied to Detail report facts are migrated to the converted report. If no number format exists, then the default number formats are applied to date, time, and number fields.
Because version 6.x uses JavaScript as the scripting, the conversion process does not automatically convert any computed facts contained in the Detail report. For computed items located in the Detail report body, the expression is omitted from the version 6.x table object. The conversion process may attempt to replace the computed column with another fact. If that occurs, simply delete the extraneous column.
For computed items located in a group header or footer, the code of the old scripting language expression is placed in a text field in the associated header/footer area to aid in manual conversion. Before you correct these placeholder items, Hyperion displays an error message in the field which reads <string>(1):unterminated string literal. The Detail report’s Surface Math option has no equivalent in the converted report and is ignored.
Conversion of Smart ReportsVersion 6.x is able to convert Detail reports containing multiple smart charts and pivot tables. Some converted smart charts may look different or even invisible once converted and displayed in the 6.x Report section. This is due to some changes in the chart section that affect the way that charts are plotted within a given sized area. As a result, embedded charts may need to be resized manually by the user.
Conversion of Graphic ObjectsCertain graphic object properties are no longer supported and are ignored during the conversion process. These properties include the shadow, sunken button, and raised button fill effects.
The width of line objects in Detail reports is expressed in whole pixels. When a report is converted, the pixel line widths are converted to the nearest point equivalent.
Downloading Data ModelsExample 29 shows the script to use to download a data model, standard query, or standard query with report from the repository.
Example 29 //download a data model, standard query or standard query with reports //from a local repository//(document name to gain the download), (type of document), (repository //owner) (group with access), (name of document)ExecuteBScript("download doc root, 'SQR', 'ts', 'PUBLIC', 'Sales")
Adding Joins 91
Displaying a Table CatalogExample 30 shows the script to use to programmatically show a listing of the available tables on your database.
Example 30 // display table catalogActiveDocument.Sections["DataModel"].DataModel.Catalog.Refresh()
Adding Topics to a Data Model SectionExample 31 shows the script to use to add topics to a data model section.
Example 31 // add topics to DataModel sectionCatItem = ActiveDocument.Sections["DataModel"].DataModel.Catalog.CatalogItems["PCW_ITEMS"]ActiveDocument.Sections["DataModel"].DataModel.Topics.Add(CatItem)
Setting up Topic Object VariablesExample 32 shows the script to use to set up topic object variables.
Example 32 // setting up topic objects variables...PCWItems = ActiveDocument.Sections["DataModel"].DataModel.Topics["PCW_ITEMS"]PCWSales = ActiveDocument.Sections["DataModel"].DataModel.Topics["PCW_SALES"]PCWCustomers = ActiveDocument.Sections["DataModel"].DataModel.Topics["PCW_CUSTOMERS"]PCWPeriods = ActiveDocument.Sections["DataModel"].DataModel.Topics["PCW_PERIODS"]
Adding JoinsExample 33 shows the script to use to add a join.
Example 33 // add join between PCW_PERIODS (Day) and PCW_SALES (Order_Date)PCWPeriods_Day = PCWPeriods.TopicItems["Day"]PCWSales_OrderDate = PCWSales.TopicItems["Order_Date"]Day_OrderDate_Join = ActiveDocument.Sections["DataModel"].DataModel.Joins.Add(PCWPeriods_Day,PCWSales_OrderDate,bqJoinSimpleEqual)

92 JavaScript Examples
Adding Items to the Request LineExample 34 shows the script to use to add items to the request line.
Example 34 // add items to the request lineActiveDocument.Sections["Query"].Requests.Add("PCW_CUSTOMERS", "Store")ActiveDocument.Sections["Query"].Requests.Add("PCW_SALES", "Store_Id")ActiveDocument.Sections["Query"].Requests.Add("PCW_SALES", "Order_Date")ActiveDocument.Sections["Query"].Requests.Add("PCW_SALES", "Delivery_Date")ActiveDocument.Sections["Query"].Requests.Add("PCW_SALES", "Units")ActiveDocument.Sections["Query"].Requests.Add("PCW_SALES", "Amount")ActiveDocument.Sections["Query"].Requests.Add("PCW_CUSTOMERS", "City")ActiveDocument.Sections["Query"].Requests.Add("PCW_CUSTOMERS", "State")ActiveDocument.Sections["Query"].Requests.Add("PCW_PERIODS", "Year")
Adding a Computed Column to a Query Request LineExample 35 shows the script to use to add a computed column to a query request line.
Example 35 // add computed column to Query request line - Amount/UnitsActiveDocument.Sections["Query"].Requests.AddComputedItem("CompItem","Amount/Units",3)
Creating and Setting Variable LimitsExample 36 shows the script to use to create and set variable limits.
Example 36 // create and set variable limit - Store_Idmylimit = ActiveDocument.Sections["Query"].Limits.CreateLimit("PCW_SALES.Store_Id")mylimit.Operator = bqLimitOperatorLessThanOrEqualmylimit.CustomValues.Add(10)mylimit.SelectedValues.Add(10)ActiveDocument.Sections["Query"].Limits.Add(mylimit)mylimit.VariableLimit = true
Using a BrioQuery 5.5 Limit Dialog Box andStoring Selected Value in Text Box
The script in Example 37 shows how to use an Interactive Reporting Filter dialog box and store the selected value in a text box.
Turning off the Prompt To Save Dialog Box 93
Example 37 ExecuteBScript("modify limit root.'Pcw Customers'.'Store Type'.'Store Type'")var limit = ActiveDocument.Sections["Query"].Limits["Store Type"]var TextBox = ActiveSection.Shapes["TextBox1"]if (!limit.Ignore){TextBox.Text = limit.SelectedValues[1]}else{TextBox.Text =""}
Turning off the Page Headers for the First Page in the ReportThe script in Example 38 shows how to turn off page headers for the first page in the report.
Example 38 if ( PageNm==1){' '}else{"Query Processed: "+ Format(new Date(), "d-mmm-yyyy")}
Turning off the Prompt To Save Dialog BoxThe script in Example 39 shows how to shut down the Interactive Reporting application on an OnShutdown event.
Example 39 Application.Quit(false)

94 JavaScript Examples
TroubleShooting Scripts 95
C h a p t e r
7TroubleShooting Scripts
When a script fails to execute due to a syntax or runtime error, you need to debug the code. Finding errors may take time depending on the length and complexity of the code. One way to prevent errors is by observing the protocols that JavaScript requires. This section explains what you need to know to help prevent and locate errors in your scripts.
In This Chapter Space-Saving Variables . . . . . . . . . . . . . . . . . . . . . . . . . . . . . . . . . . . . . . . . . . . . . . . . . . . . . . . . . . . . . . . . . . . . . 96
Case-Sensitive Code . . . . . . . . . . . . . . . . . . . . . . . . . . . . . . . . . . . . . . . . . . . . . . . . . . . . . . . . . . . . . . . . . . . . . . . 96
Assignment Operators Versus Comparison Operators . . . . . . . . . . . . . . . . . . . . . . . . . . . . . . . . . . . . . . . . . . . . . . . 97
Conditional Tests . . . . . . . . . . . . . . . . . . . . . . . . . . . . . . . . . . . . . . . . . . . . . . . . . . . . . . . . . . . . . . . . . . . . . . . . . . 97
Syntax Reference. . . . . . . . . . . . . . . . . . . . . . . . . . . . . . . . . . . . . . . . . . . . . . . . . . . . . . . . . . . . . . . . . . . . . . . . . . 99
Recalculating Results . . . . . . . . . . . . . . . . . . . . . . . . . . . . . . . . . . . . . . . . . . . . . . . . . . . . . . . . . . . . . . . . . . . . . . 99
Designing Your Script . . . . . . . . . . . . . . . . . . . . . . . . . . . . . . . . . . . . . . . . . . . . . . . . . . . . . . . . . . . . . . . . . . . . . . 100
Code Entry . . . . . . . . . . . . . . . . . . . . . . . . . . . . . . . . . . . . . . . . . . . . . . . . . . . . . . . . . . . . . . . . . . . . . . . . . . . . . 101
Bypass Errors . . . . . . . . . . . . . . . . . . . . . . . . . . . . . . . . . . . . . . . . . . . . . . . . . . . . . . . . . . . . . . . . . . . . . . . . . . . 101
Getting Help with a Problem Script . . . . . . . . . . . . . . . . . . . . . . . . . . . . . . . . . . . . . . . . . . . . . . . . . . . . . . . . . . . . 102
96 TroubleShooting Scripts
Space-Saving VariablesOne exception to the Code Entry rule is: If you plan to repeatedly use an object model path, define it as a variable to save space and keep your script compact.
For example, instead of typing:
ActiveDocument.Sections["Query"].DataModel.Connection.Username = "hyperion"ActiveDocument.Sections["Query"].DataModel.Connection.SetPassword("hyperion")ActiveDocument.Sections["Query"].DataModel.Connection.Connect
try this:
DMPath = ActiveDocument.Sections["Query"].DataModel.ConnectionDMPath.Username = "hyperion"DMPath.SetPassword("hyperion")DMPath.Connect
You must remember to treat space-saving variables like the actual object model paths. That is, insert periods between object model segments and do not add unnecessary spaces.
Also, it is generally a good idea to only include objects as part of the path. That is, make sure that your variable does not have any methods or properties segments for the object with which you want to work. For example:
LPath = ActiveDocument.Sections["Query"].LimitsLPath.Activate()
is incorrect because ActiveDocument.Sections["Query"].Limits does not have an Activate() method.
However, this script is correct:
LPath = ActiveDocument.Sections["Query"]LPath.Activate()
Case-Sensitive CodeJavaScript is case sensitive and distinguishes between uppercase (capital) and lowercase (small) letters. Rules to remember include:
● All JavaScript statements (for example, var, if…else, while, switch, and so on) start with a lowercase letter. This script fails because var is capitalized:
Var StringName = "John Smith"
● All JavaScript core operators start with an uppercase letter, for example new Date(). This script fails because Date is in lowercase.
new date()
● All object model Path segments start with a capital letter, for example ActiveDocument.Sections["Dashboard"].Activate().
Both of these commands cause the script to fail because the ActiveDocument segment is not properly capitalized.
activeDocument.Sections["Dashboard"].Activate()
Activedocument.Sections["Dashboard"].Activate()

Conditional Tests 97
● You must refer to variables exactly as you define them. If you define a variable as:
var StringName
then you must always refer to it as StringName, not Stringname or stringName or stringname.
Assignment Operators Versus Comparison OperatorsJavaScript makes a distinction between Assignment and Comparison Operators.
This is an assignment operator:
myvar = 5
This is a comparison operator:
if (myvar == 5)
A common error is to switch the two. Keep them separate. Be particularly careful when you are assigning argument values to methods.
DMPath = ActiveDocument.Sections[”Query”].DataModel.Connection//This works…DMPath.SetPassword(“hyperion”)
//This does not!!!!DMPath.SetPassword = "hyperion"
The last line of script assigns the value “hyperion” to DMPath.SetPassword, which is probably not what you want to do.
Conditional TestsWhen using if statements, avoid impossible conditional tests. For example, the following script always returns “myvar is not 5!” even though myvar is 5. This is because the condition always evaluates to false. In this case, 5 is not the same as “five.”
var myvar = 5if ( myvar == "five")
{Alert("myvar = 5!")}
else{Alert("myvar is not 5!")}
It is especially important to know exactly how a variable reports in your condition. The Console.Writeln() and Alert() methods are especially useful in diagnosing problems like this. Note that the JavaScript core operator String is used only to format myvar for the Console window:
var myvar = 5Console.Writeln(String(myvar))
98 TroubleShooting Scripts
if ( myvar == "five"){Alert("myvar = 5!")}
else{Alert("myvar is not 5!")}
If you are comparing the value you selected in a list box or a drop-down box to another value, make sure you know what value you are getting back before you compare it to something else. You especially want to avoid mixing up the placement of the item you selected in the control with the item’s actual value.
Sometimes it is a bit tricky to get the value you want back from one of these control boxes. Remember that list boxes have selected lists that may contain multiple values, while drop-down boxes have a selected that can contain only one value.
For example, if you have values of 4, 9, 15, 25, and 36 in your drop-down box, and you select 36, the script below returns myvar is 5!, which seems wrong.
This happens because the DropDown1.SelectedIndex returns the placement in the drop-down box of the item you selected. Your choice of 36 is the fifth item in the drop-down box. Note that the console window reports “5”.
var myvar = DropDown1.SelectedIndexConsole.Writeln(String(myvar))if ( myvar == 5)
{Alert("myvar = 5!")}
else{Alert("myvar is not 5!")}
Now let’s say you have a drop-down box that contains the values of “one,” “two,” “three,” “four” and “five.” The script below returns myvar = five! when you select “five.” However this is only because your choice “five” is the fifth choice in the drop-down box. However, the fifth choice is not necessarily equal to five. You can end up comparing the wrong things.
DropDown1 = ActiveDocument.Sections["Dashboard"].Shapes.DropDown1var myvar = DropDown1.SelectedIndexConsole.Writeln(String(myvar))if ( myvar == 5)
{Alert("myvar = five!")}
else{Alert("myvar is not five!")}
The script below returns the actual value you see in the drop-down box. Let’s assume again that you have a drop-down box that contains the values of “one,” “two,” “three,” “four” and “five:”
Recalculating Results 99
DropDown1 = ActiveDocument.Sections["Dashboard"].Shapes.DropDown1var myvar = DropDown1[DropDown1.SelectedIndex]Console.Writeln(String(myvar))if ( myvar == "five")
{Alert("myvar = 5!")}
else{Alert("myvar is not 5!")}
Syntax ReferenceOn the bottom left of the Script Editor, directly above the Help button, is the Description pane. The Description pane shows you the necessary syntax for any item you select in the Object browser.
For example, in the Object browser, navigate to Application > ActiveDocument > Sections > Query > Methods, then select the Activate(). The Description pane reads:
void Activate()
This indicates that the Activate() method does not take any arguments.
Now click on the Export() method. The Description pane reads:
void Export(String Filename, BqExportFileFormat FileFormat, [optional] Boolean IncludeHeaders)
This indicates that the Export() takes three arguments, two required arguments and an one optional.
For more detailed information, click Help to open the online help for the Export() Method topic.
Recalculating ResultsA script that includes limits may execute slowly because it has to recalculate a complete data set each time there is a modification. You can use the SuspendRecalculate property to prevent a Results limit from recalculating after each modification.
In the following example, limit values are dynamically selected at a list box, but the recalculation occurs only after the last value is selected.
Sections[sect_name].Limits[limit_col].SuspendRecalculation = true;Sections[sect_name].Limits[limit_col].SelectedValues.RemoveAll();for(I = 1; I <= ListBox2.SelectedList.Count;I++){
NewLimitValue = ListBox2.SelectedList[I];newname += ListBox2.SelectedList[I]Sections[sect_name].Limits[limit_col].SelectedValues.Add(NewLimitValue);
}
100 TroubleShooting Scripts
Sections["Results"].Limits["1"].SuspendRecalculation = false;Sections[sect_name].Limits[limit_col].Ignore=false; // Trigger recalculation now
Designing Your ScriptJavaScript is an interpreted, not a compiled, language and it evaluates and runs each line of code in sequence. If JavaScript finds a problem with a line of code as it attempts to run it, it simply stops. Although the Intelligence Clients Script Editor syntax checker catches some obvious syntax errors, many errors may go unnoticed until run time.
You should identify whether each line of code executes or fails. While it may seem like a lot of work to identify each line of code in this fashion, it pays off in time saved developing your scripts. It is also an essential technique for identifying problems in your scripts. You can check the legitimacy of your scripts using the Console window.
The Console window is used to display error messages and alert values generated by the JavaScript interpreter. During a script debugging cycle, you can write messages to the Console window to track the state of variables and the progress of the script. If a syntax error is detected (and not a runtime error), the error and the line number in which it has occurred appear in the console window. Use the line number to move directly to the line where the error has occurred in the Script Editor.
You can access the Console window from any section within the document; it it remains open until you close it.
The Console window also displays the buffer of all error messages that occur from when Intelligence Clients is started. Thus, the Console window may display information that is no longer of value to you. You can choose Edit > Clear to clear the buffer contents. When the Console window is closed, the buffer size is 1,000 bytes. When the Console window is open, the buffer size is 641 bytes.
There are two major techniques to write to the Console window: the Console.Write()/ Console.Writeln() methods, and the Alert() method.
The Console.Write() and Console.Writeln() methods are essentially identical. Both write to the Console window, which you can open by choosing View > Console Window. Console.Write() does not add a carriage return at the end of a line, while Console.Writeln() does add a carriage return.
Note: Console.Writeln() is spelled with a lowercase L and N, which is an abbreviation for Write Line.
Console.Writeln() is the preferred technique for most users. It allows the script to run without user interaction, and the Console windows keeps a record of each line as it is written to the Console.
In some cases, the Console.Writeln() method is less desirable. Additionally, web client’s Console window must be closed when a script runs.
If you wish to step through a tricky section of code in your script, you should use the Alert() method.

Bypass Errors 101
Whichever method you use, you need to identify the beginning and end of each script as well as each line of code before it executes. In the following example, the script moves to the Query section and removes any limits.
Console.Writeln("Start Query Script")Console.Writeln("Step1")ActiveDocument.Sections["Query"].Activate()Console.Writeln("Step2")ActiveDocument.Sections["Query"].Limits.RemoveAll()Console.Writeln("Step3")Console.Writeln("End Query Script")
Based on the above script, the Console window displays:
Start Query ScriptStep1Step2Step3End Query Script
Code EntryWhenever possible, use the Object browser click to add code to the Script Editor, rather than manually typing in the JavaScript. Sometimes errors occur because you have typed an extra space or a period instead of a comma.
You can also use cut-and-paste to enter code. For example, if you define a variable as DashboardName, and then later retype it as Dashboardname (see “Case-Sensitive Code” on page 96 for more information), the difference in case causes a failure. Avoid such problems by carefully cutting and pasting whenever possible.
Bypass ErrorsThe try-catch block is borrowed from Java and is used to bypass errors. general syntax for a try-catch block is:
try{do something}catch(errorname){do something with the error}finally{do something else}
For example:
QPath = ActiveDocument.Sections["Query"].Limitstry{QPath.Activate()}catch(e){Alert(e.toString())}finally{Alert("We're Done!")}
102 TroubleShooting Scripts
The try-catch block generally does not catch definition errors, but shows an error in the Console window at the lowercase “d” in “date()”:
try{Alert(new date())}catch(e){Alert(e.toString())}finally{Alert("We're Done!")}
Getting Help with a Problem ScriptIf you have followed all the practices described in this section and you are still not able to get your script to do what you want it to do, consider opening a call with Hyperion Solutions Customer Support at 877-901-4975 or email http://hyperion.com.
Hyperion Solutions Customer Support engineers does need to see your actual Interactive Reporting document that contains the script at issue. This is necessary due to the possibility of typos, and because of the relationship between a script and an individual Interactive Reporting document.
If your data is confidential, consider duplicating your Interactive Reporting document file using the sample script that ships with Hyperion Intelligence Clients. Alternatively, you might consider saving the file without results, or if results are necessary to the function of the script, you may consider limiting your results sets to only a few rows. To set this option, choose Query > Query Options.
The sooner you can locate the problem and the exact point of failure in your script, the sooner Hyperion Solutions Customer Support can analyze the issue and suggest solutions.
Be sure to specify in which section of the Interactive Reporting document the problem script resides, and within which control it can be found.
Remember that a problem in one script may be as a result of something defined in a different script.
Hyperion Solutions Customer Support may need to evaluate your document start up scripts and your Dashboard section scripts, as well as the script in the particular control that is causing the problem. For this reason, we strongly recommend you use the Console.Writeln() method to identify each of your lines of code in each of your scripts to the Console window. This may make the problem self-evident.

Designing for the Hyperion System 9 BI + Workspace 103
APPENDIX
8Designing for the Hyperion
System 9 BI + Workspace
As the designer of an Dashboard section to be deployed in the Workspace, you have a rich variety of tools to create a professional looking Dashboard dashboards. This section contains aids and known limitations for deploying an Dashboard section on the Workspace.
In This Appendix Architecture of the Workspace . . . . . . . . . . . . . . . . . . . . . . . . . . . . . . . . . . . . . . . . . . . . . . . . . . . . . . . . . . . . . . . 104
Highlights of the Workspace . . . . . . . . . . . . . . . . . . . . . . . . . . . . . . . . . . . . . . . . . . . . . . . . . . . . . . . . . . . . . . . . . 105
Summary of Design Considerations by Section . . . . . . . . . . . . . . . . . . . . . . . . . . . . . . . . . . . . . . . . . . . . . . . . . . . 107
Chart Sizing. . . . . . . . . . . . . . . . . . . . . . . . . . . . . . . . . . . . . . . . . . . . . . . . . . . . . . . . . . . . . . . . . . . . . . . . . . . . . 112
Controls . . . . . . . . . . . . . . . . . . . . . . . . . . . . . . . . . . . . . . . . . . . . . . . . . . . . . . . . . . . . . . . . . . . . . . . . . . . . . . . 113
Graphics Objects . . . . . . . . . . . . . . . . . . . . . . . . . . . . . . . . . . . . . . . . . . . . . . . . . . . . . . . . . . . . . . . . . . . . . . . . . 113
Embedded Objects . . . . . . . . . . . . . . . . . . . . . . . . . . . . . . . . . . . . . . . . . . . . . . . . . . . . . . . . . . . . . . . . . . . . . . . 114
Borders and Background/Font . . . . . . . . . . . . . . . . . . . . . . . . . . . . . . . . . . . . . . . . . . . . . . . . . . . . . . . . . . . . . . . 114
Events. . . . . . . . . . . . . . . . . . . . . . . . . . . . . . . . . . . . . . . . . . . . . . . . . . . . . . . . . . . . . . . . . . . . . . . . . . . . . . . . . 116
Client-Side JavaScript . . . . . . . . . . . . . . . . . . . . . . . . . . . . . . . . . . . . . . . . . . . . . . . . . . . . . . . . . . . . . . . . . . . . . 117
Alert Dialog . . . . . . . . . . . . . . . . . . . . . . . . . . . . . . . . . . . . . . . . . . . . . . . . . . . . . . . . . . . . . . . . . . . . . . . . . . . . . 120
Toolbars . . . . . . . . . . . . . . . . . . . . . . . . . . . . . . . . . . . . . . . . . . . . . . . . . . . . . . . . . . . . . . . . . . . . . . . . . . . . . . . 120
Guided Analysis and Reporting . . . . . . . . . . . . . . . . . . . . . . . . . . . . . . . . . . . . . . . . . . . . . . . . . . . . . . . . . . . . . . 125
Object Model Exclusion List . . . . . . . . . . . . . . . . . . . . . . . . . . . . . . . . . . . . . . . . . . . . . . . . . . . . . . . . . . . . . . . . . 127
User Embedded HTML . . . . . . . . . . . . . . . . . . . . . . . . . . . . . . . . . . . . . . . . . . . . . . . . . . . . . . . . . . . . . . . . . . . . . 130
104 Designing for the Hyperion System 9 BI + Workspace
Architecture of the WorkspaceThe Workspace generates dynamic HTML, providing users with interactive capabilities to their Interactive Reporting documents from a browser interface. Performing actions such as drilling into data, processing for new data, changing chart types, and swinging pivots, instructs the Workspace to generate new HTML pages on demand.
ComponentsThe Workspace is comprised of the following components:
● Hyperion Interactive Reporting HTML Servlet – This servlet acts as a broker of information between the browser and the Intelligence Service.
● Hyperion Interactive Reporting Service – The Hyperion Interactive Reporting Service is the back-end component that opens and manages Interactive Reporting document documents and renders HTML versions of the documents to send back to the Hyperion Interactive Reporting HTML Servlet.
● Data Access Service (DAS) – The Data Access Service is responsible for and manages all database requests.
PerformanceThe Workspace offers several performance benefits. With the exception of HTML Pregeneration, the other additions—Partial Document Loading, Multithreading, Distributed Components, and Disk Caching—are transparent and cannot be configured by the end-user. This topic includes the following sections:
● HTML Pregeneration
● Partial Document Loading
● Multithreading
● Distributed Components
● Disk Caching of Interactive Reporting document Documents
Highlights of the Workspace 105
HTML PregenerationUsers are offered an option to pregenerate HTML. Pregeneration of HTML is used to enable higher performance. Instead of opening a Interactive Reporting document file and generating the entire document in HTML on-demand, the HTML for specified sections is retrieved from the repository. The gains in performance are apparent on initial access. This is very useful for frequently accessed pages (however, this feature should not be used when row-level security is used unless care is taken to pre-generate reports appropriate for all users who can access the document). Configuration of this option is available from the Export dialog in Designer/Explorer/web client and the Hyperion System 9 BI + Browse Servlet Workspace Options.
Partial Document LoadingInstead of requiring an entire Interactive Reporting document to always load into memory, only the required sections of a Interactive Reporting document are loaded.
MultithreadingInstead of a single process executing serially on a single thread or several processes executing on multiple individual threads (requiring greater memory overhead), a single process is split up to execute in parts concurrently on multiple threads (in a multitasking or multiprocessing environment) to achieve the same end result.
Distributed ComponentsInstead of a centralized software system, software components are modularized and deployed anywhere within a network with communication coordinated by messages passed between the components.
Disk Caching of Interactive Reporting document DocumentsInstead of requiring disk access for every request of a Interactive Reporting document document, recently read data from disk is stored in memory for faster access.
Highlights of the WorkspaceInteractive Reporting features supported in the Workspace:
● Drill down, and drill into (Chart and Pivot)
● Drill anywhere (Chart, Pivot)
● Swing a Pivot
● Add and remove totals (Pivot)
● Add and remove items (Results, Chart, and Pivot)
106 Designing for the Hyperion System 9 BI + Workspace
● Data functions (Chart, Pivot)
● Add, remove, and modify cume (cumulative) (Chart, Pivot)
● Surface values (Pivot)
● Show and hide items in all sections
● Sorting in all sections
● Grouping labels (Chart, Pivot)
● Add and remove grand and break totals (Results)
● Specify chart type (Chart)
● Set Legend on XYZ Axis (Chart)
● Show values (Bar, Pie, Line Charts)
● Processing of relational and OLAP queries
● Recognition of document events, Dashboard section events, and most Dashboard object events
● Interaction with Dashboard controls
● Most Dashboard embedded section objects
● Most Dashboard and Report graphics objects
● Most of the Interactive Reporting Object Model
● Definition and manipulation of Limits through the Object Model
● Most web client Adaptive States (only four of the six adaptive states apply to the Workspace product). The Adaptive States Query and Analyze and Data Model and Analyze are not completely available, since only the view, process, and analyze portions of those adaptive states are honored. Also note that Adaptive States override Roles when Roles are defined.
● When Process All occurs (for Dashboard and Report section) or when the ProcessAll() method is called (for all other sections), the user is prompted for all connection information up front and prior to processing (instead of prompted for connection information following each query process).
● All error handling goes to log files—there is no console window equivalent, but most errors are displayed to user.
● When there are no data items supplied for a section, the browser popup menu is overwritten with a single “add item” pop-up menu.
● When a section is empty, a blank content area is displayed.

Summary of Design Considerations by Section 107
Summary of Design Considerations by SectionThough much of the functionality in the Interactive Reporting products are available in the Workspace, there are features that are not present either as a result of specification or limitations of the HTML standard. Select a section from the list below to view a summary of features available in the Interactive Reporting that are not available or behave differently in the Workspace, including:
● General Features Design and Use
● Query and Data Model Sections Design and Use
● Results and Table Sections Design and Use
● Pivot Section Design and Use
● Chart Section Design and Use
● Dashboard Section Design and Use
● Report Section Design and Use
General Features Design and UseThe Workspace:
● Does not support document creation capabilities.
● Does not support layout definition capabilities.
● Does not support formatting capabilities (whatever is defined in the published document is displayed, but formatting capabilities are available by way of the object model).
● Cannot hide/show, insert/delete, duplicate, or rename sections (but this functionality is available by way of the object model).
● Cannot set or read tools options (i.e. default formats)
● Does not export to Text, Excel, Lotus, or JPEG formats.
● Does not support export of Scripts to Text.
● Does not support native print capabilities, but can print using the browser, Acrobat (PDF format), or by way of the Scheduler.
● Does not support password-protected documents.
● Does not support custom menus.
● Cannot insert, delete, or show page headers/footers.
● Limited support for the OLAP section from the user interface —only support for sort, drill-up/drill-down, auto-size width (but additional OLAP functionality is available by way of the object model).
108 Designing for the Hyperion System 9 BI + Workspace
Query and Data Model Sections Design and UseThe Workspace:
● Does not support access to the Data Model section from the user interface (but a user can access sections by way of the object model).
● Variable limits can be applied, but not programmatically.
● Defaults automatically to first Join Path when there is more than one Join Path in a Query.
● Does not support canceling a query.
● The Query Log and Custom SQL options are not available.
● A subquery is indented in the Section pane, but it is displayed as a regular query in the Content pane. A subquery cannot be added through the Hyperion System 9 BI + Workspace.
● If a Interactive Reporting document contains a union query, the first query is displayed. The Request and Filter panes in the Outliner for the union query are read-only. In addition, there is no Union Controller line. A new Union Query section cannot be created.
● Local Results can be displayed, but a new local result table cannot be created.
● Derived queries can be displayed, but a new derivable query cannot be created.
OLAPQuery Section Design and UseThe Workspace:
● Does not support drill through.
● Does not support ad-hoc OLAPQuery capabilities from the user interface (but OLAPQuery building is available by way of the object model).
● Does not support access to OLAPQuery sections from the user interface (but can access sections by way of the object model).
● Does not support any kind of limits from the user interface (but can access by way of the object model). Variable limits can be applied, but not programmatically.
● Does not support canceling a query.
Results and Table Sections Design and UseThe Workspace:
● Does not support importing of Results sets.
● Does not support sorting of computed columns based on order functions.
● Cannot show or hide row numbers.
● Cannot insert, delete, or modify computed columns (but can do by way of the object model).
● Does not support column-grouping capabilities.

Summary of Design Considerations by Section 109
● Does not support suppression of duplicates.
● Does not support setting of spotlighter conditions (whatever is defined in the published document is displayed, but formatting capabilities are available by way of the object model).
● Does not support enabling of grid lines, borders, or background (whatever is defined in the published document is displayed, but formatting capabilities are available by way of the object model).
Pivot Section Design and UseThe Workspace:
● Does not support drill-to-detail.
● Cannot insert, delete, or modify computed columns (but can access sections by way of the object model).
● Cannot change or restore pivot label names.
● Does not support manual refresh of data (but can access sections by way of the object model).
● Cannot enable pivot data label or corner label.
● Does not support Chart-This-Pivot function.
● Cannot set or remove pivot page breaks.
Chart Section Design and UseThe Workspace:
● Does not support drill-to-detail.
● Does not support resizing of individual Chart components.
● Cannot insert, delete, or modify computed columns (but can access sections by way of the object model).
● Does not support manual refresh of data (but can access sections by way of the object model).
● Does not support Pivot-This-Chart function.
● Cannot select the chart legend.
● Cannot specify chart legend location in chart.
● Cannot reorder items in chart.
● Cannot change or restore chart label names.
● Cannot rotate pie chart.
110 Designing for the Hyperion System 9 BI + Workspace
Dashboard Section Design and UseThe Workspace:
● Cannot access Dashboard design mode.
● Cannot define Dashboard tab order (whatever is defined in the published document is the order).
● Does not support Dashboard embedded section objects that are active; they behave like hyperlink property.
● Does not support Dashboard embedded section objects that are view-only with AutoSize=OFF; they behave like hyperlink property.
● Does not support the following events: OnRowDoubleClick (Active ESOs), DoubleClick (ListBox), OnChange (TextBox), OnEnter (TextBox).
● Does not support the following graphics objects: diagonal line, round rectangle, or oval. An automatic substitution of graphics objects occurs: diagonal line is replaced with line, round rectangle is replaced with rectangle, and oval is replaced with rectangle.
● Does not support text label object alignment and rotation properties.
● When using the DropDown control, the OnSelection event is not executed if the first selection made by the user is the first item on the list—this is an HTML limitation. To resolve the problem, select any other item prior to selecting the first item, or make the first item in the DropDown a blank entry.
● Command Button text wrap is only available when using Internet Explorer; it is not available when the 508 Accessibility feature is enabled or when using other web browsers.
Report Section Design and UseThe Workspace:
● Does not allow an end user to build or layout reports.
● Does not support the following graphics objects: diagonal line, round rectangle, or oval. An automatic substitution of graphics objects occurs: diagonal line is replaced with line, round rectangle is replaced with rectangle, and oval is replaced with rectangle.
● Does not support text label object alignment and rotation properties.
● Data Path field is set to local path.
Creating a Pre-Defined Drill-Down PathYou can set up predefined drill-down paths for use in the Workspace to proceed directly to the next level of detail as defined in the Data Model. A drill-down path is associated with a dimensional table, which consists of numerous attributes about a specific business process, such as a product line or geographical location. As the designer, you specify the order or relation of items that users drill down into when performing Chart or Pivot analysis.
Creating a Pre-Defined Drill-Down Path 111
Topic items in a dimensional table become part of the pre-defined drill-down path based on the order they appear in the dimension. You can flag any individual item as a fact value which
excludes it from the drill-down path. Unlike the equivalent feature in Designer, there is no option to include a missing item in the Pivot and Chart items if it has not been defined in the drill-down path. In the Hyperion System 9 BI + Workspace the drill-down path is accessed by the shortcut menu item: “Drilldown into (ITEM_NAME).” Any drill-down path deployed in the Workspace is not context-sensitive from a label (unlike the Designer version of the drill-down path). When an end user selects the drill-down from the shortcut menu, all available drill-down paths are displayed. Each drill-down path shows the topic item which is being drilled down into, and the label item from which it was drilled. An item that has been drilled into adds the returned value as a new Pivot or Chart label item automatically.
The definition of the drill-down path originates in the Data Model or Query tables. You can modify topics items to identify them as are dimensional or fact values. Dimensional values can be used in a drill path; fact values can not. All Pivots and Charts sections derived from a Data Model that includes a drill- down path, also inherit the definitions. This feature may be used to augment the existing Drill Anywhere option in the Interactive Reporting Studio and Interactive Reporting Web Client, or the administrator can choose to disable Drill Anywhere, and leave users the ability to drill up and down this pre-defined path only.
➤ To define a drill-down path in the Query or Data Model section:
1 Click the topic window header to select it.
2 Choose View > Properties.
The Topic Properties dialog box is displayed. By default, topic items display in the order in which they are defined in the underlying table. You can modify topics to hide selected items, or you can change the item order.
3 Define the drill path:
● Click Sort to sort all items alphabetically.
● Click Hide All and Show All to toggle the display of all items in the topic.
4 Click Set as Dimension to establish the item order in which a user can drill-down during Chart or Pivot analysis.
The order of the drill path is defined under Items to Display. Click the Up and Down buttons to move selected items up or down in the topics list.
5 When you have defined the drill-down path, click OK.
➤ To eliminate an item from the drill-down path:
If you intend to use a topic item on the Request line, but eliminate it from the drill down path, be sure to add the topic to the Request line before completing the steps below.
1 Select the table to which the item belongs and click Properties on the shortcut menu.
The Topic Item Properties dialog box appears.
2 Select the item from the Items to Display list and double click the item
The asterisk (*) displayed to the left of the topic item is removed.
3 Click OK.

112 Designing for the Hyperion System 9 BI + Workspace
Chart SizingWhen working with Charts in Interactive Reporting, there are multiple rectangular regions. By default, there is one "global" rectangular region, referred to as the "size object." Normally the "graphic object," which contains the Chart itself, fits inside the size object, as do other objects (such as those holding the Chart legend and the Chart labels). By manipulating the relative sizes of these objects, it is possible to affect the rendering of the chart in HTML format (in the Workspace, export the section as HTML or JPEG), causing clipping of the elements. To avoid clipping the HTML-rendered chart, ensure that all the chart elements fit inside the global object. (You can see the rectangular outline of these objects by clicking on various portions of the chart.)
Locating ErrorsWhen a script fails to execute due to a syntax or runtime error, it becomes necessary for you to debug the code. Finding errors may take time depending on the length and complexity of the code. One way to reduce the number of errors is prevention. You prevent errors by observing the protocols that JavaScript requires. For more information, see “TroubleShooting Scripts” on page 95.
Console WindowThe Console window, which is used to display the buffer of all errors and is often used as a means for debugging, is not available from the Workspace user interface.
Error LogsThe Workspace displays errors to an.HTML dialog box or generates an entry to one of the error logs. The error logs included the following:
● Hyperion Interactive Reporting BI1 [server] log
● Hyperion Interactive Reporting Data Access Service [server] log
● Hyperion Interactive Reporting DAServlet log
● Hyperion Interactive Reporting HTMLServlet message log
For information about interpreting any of the above logs, consult with the Hyperion Solutions Customer Service Department.
try-catch blockYou can also test the usefulness of syntax or isolate a sequence of steps in a complicated script, by using the try_catch block. See “Bypass Errors” on page 101 for more information.

Graphics Objects 113
ControlsControl objects can be inserted into an Dashboard section to provide users with a way to interact with the application dynamically. Interactive Reporting document documents created for displaying support the following controls:
● Command Button
● Radio Button
● Check box
● List Box
● Drop Down
● Text Box
● Embedded Browser object
● Hyperlink object
Control Object PropertiesBasic object properties such as name, visible, auto-size, etc., are accessible through the Object Model, but not through the Workspace user interface. Some limitations do apply to control properties as described in Table 14.
Graphics ObjectsEnd users can display graphics in a document from the Workspace, but cannot insert them into an Dashboard section from the Workspace
As a designer the following graphics are available for you to use in the Workspace document as shown in the. If you have existing object that is not supported in the Workspace, either substitute or omit altogether these graphics altogether.
Table 14 Special Considerations for Control Objects
Control Object Control Object Property Behavior
Command Button Text wrap is only available in the Internet Explorer browser. Text wrap in a command button is not available when the 508 Accessibility feature is enabled.
Note: In Netscape7, a command button with a multi-line title property is not text wrapped when viewed through the browser using the Workspace.
Drop Down The OnSelection event does not fire when the first selection from the dropdown is the first item on the list. It is recommended that you enter a blank entry for the first item or instruct users not to select the first item of the list as a first selection.
Text Box The OnEnter and OnChange events do not fire from the Workspace.
Note: A dashboard text box with the password property set to TRUE and viewed in the Workspace displays only the bottom half of the cursor in the very top of the text box. It should display an asterisk (*) for each character typed. All functionality remains intact. This is a visual issue and behaves incorrectly only with Netscape browsers.

114 Designing for the Hyperion System 9 BI + Workspace
Note: All graphics support the OnClick event.
Borders and Background/FontThe Workspace enables you to apply the border and background and font properties for graphic objects in the object model, but these properties cannot be modified by the end user viewing the document on the Workspace.
Embedded ObjectsA Results, Pivot, Chart, Table and OLAP section can be embedded in any Interactive Reporting document intended for viewing in the Workspace. Embedding inserts the display of that section directly into the work area, and keeps live with the data content that the original section is based.
Currently, there are two properties which define the level of end user interaction with an embedded section:
● View only – Enables viewing of static reports only. A static report is the visual drawing of the report. It is displayed as currently defined in the native report section, but it is a visual display only (it is displayed as a thumbnail in the Dashboard section). The user has no interaction capabilities with the report.
● Hyperlink – Enables users to easily navigate to the original section from the embedded section by clicking the thumbnail in the Dashboard section
The Active property, available in the Designer/web client, is not enabled for an embedded section in the Workspace.
If the embedded section has the view only property set, the following object properties apply:
Table 15 Special Considerations for Graphic Objects
Graphic Object Properties
Textlabel Overline effect, doubleoverline effect, vertical and horizontal rotation, vertical and horizontal rotated up and down rotation.
Line n/a
Horizontal Line n/a
Rectangle n/a
Round Recanted n/a
Oval n/a
Picture Picture Clip Effect (upper left corner clip of the image), Picture Tile Effect
Embedded Objects 115
● If the "Scrollbars Always Shown" property of the embedded section is enabled, vertical and horizontal scrollbars display adjacent to but outside the defined object's container boundary and does not obstruct the object. Vertical and horizontal scrollbars are always present.
● If the scrollbar property for the embedded section object is not set, vertical and horizontal scrollbars display only when the object has focus (when the user selects the object). The scrollbar is adjacent to but outside the defined object's container boundary and not obstruct the object. The scrollbars continue to show until the user applies focus to another object, selects a toolbar button (other than the Workspace paging toolbar buttons) or until the Dashboard section is exited.
● Scrolling of the object using either of the object's scrollbars (vertical or horizontal) scroll only the current page of the parent section.
● If Auto-Size is enabled, the object data is scaled to fit within the object's container boundary and no scrolling of the object is enabled.
For each of the following sections below, the view only embedded section object behaves accordingly:
● Results/Table – Selection of any columns, rows or column titles is not permitted. No Workspace speed menu options which typically display for the Results/Table section are available for the object.
● OLAPQuery/Pivot – Selection of any report cells or handles is not permitted. No Workspace speed menu options which typically display for the OLAPQuery and Pivot section selections are available for the object.
● Chart – Selection of any labels, bars, lines or pie slices is not be permitted. No Workspace speed menu options which typically display for the Chart section selections are available for the object.
Embedded section objects use the following paging standards:
● If the parent section has multiple pages and the embedded section object has focus, the Workspace toolbar paging buttons become enabled so that you can use paging feature. Selection of these toolbar buttons cause the updated page view to display within the embedded section object borders.
● This paging of the embedded section is independent of the parent section paging. The paging of each embedded section is also independent of other embedded section objects in the same dashboard section which share the same parent section.
● Hyperlink objects cannot have page view updated.
● Hyperlink objects are displayed in a new tab in the Workspace if the content of the object is derived from the repository and you set the object to display in the top window. If you select the current window and the content is from the repository, the repository content replaces the content of the current tab. Otherwise, the content is displayed in a new window.
● If an action is performed on the parent section which causes the current page view of the embedded section object to be no longer valid, the embedded section object view returns to the next valid page.
116 Designing for the Hyperion System 9 BI + Workspace
● Other actions performed on the parent section which are not related to paging, such as column modification, or formatting, are always propagated to all of the child embedded section objects (regardless of active page or embedded section object mode). The embedded section object in these cases keep their current page views.
● Because the display of the embedded section object scrollbars can display outside of the object's defined boundary, designers including the embedded section objects in their Dashboard sections need to take care in placing other objects or controls in the area where these scrollbars are drawn to avoid obstructing them.
● When you connect to a machine to start the BI Service on Windows, make sure the color property setting for the display is 16-bits or higher. If the color property setting is less than 16-bits, users may encounter extremely long response times when opening Chart sections of Interactive Reporting document documents. This is an important pre-startup step, especially when starting the services remotely (for example using VNC, Terminal Services, Remote Administrator or Timbuktu, etc.), because many remote administration clients connect with only 8-bit colors by default.
EventsThe Interactive Reporting Studio and Interactive Reporting Web Client have events that can fire in an Interactive Reporting document, generally as the result of user activity. These events are defined within three groups: Document, Dashboard Section, and Dashboard Objects. When deploying a document for use on the web, consider the specific characteristics of each of the events you intend to add to your document.
Specifically, you need to evaluate how the event behaves with a Interactive Reporting document which contains pre-generated sections.
For example, a document section may have pregenerated html. Typically, a designer pregenerates the html for a section to improves the initial response of a section (since the BIService is not accessed).
Document EventsAll Document Events are supported including:
● OnStartUp (Document) Event
● OnShutDown (Document) Event
● OnPreProcess {Document) Event
● OnPostProcess (Document) Event
Document events can be explicitly turned on or off. For more information, see “Document Events” on page 116.

Client-Side JavaScript 117
Dashboard Section EventsAll events associated with the Dashboard section are supported, including the OnActivate and OnDeActivate Events.
Dashboard Object EventsDashboard object events which are supported include:
● OnClick
● OnExit (TextBox control only. The OnExit event does not execute when a user navigates from a TextBox to a neutral region. A neutral region is defined as any content area that is not a control or graphic). OnSelection (DropDown control only)
Non-supported events include:
● OnRowDoubleClick (Active Embedded objects)
● OnDoubleClick (ListBox)
● OnChange (TextBox)
● OnEnter (TextBox)
Note: The OnRowDoubleClick Event is not supported at this time since Active embedded objects display only as hyperlinked embedded sections in the Workspace.
Client-Side JavaScriptClient-side JavaScript enables you to designate scripts that run in the client’s browser session. It is a useful tool when you need to validate form information, enabling a fast response to a mouse click, form input and page navigation. For example, you can script a JavaScript function on the HTML page to confirm that users have typed valid information such as an address and telephone number. The embedded JavaScript checks the information and can display a dialog if the information is invalid without any server response. The server is still tasked to validate non-scriptable browser functions; however; client-side JavaScript enables you to avoid form redrawing, server processing and the download of data especially if an HTML page has high traffic.
Note: Non-supported Object Model methods and properties associated with OnClientXXX event scripts are ignored by MicroSoft Internet Explorer and Safari. When Netscape7 and Mozilla encounter non-supported Object Model methods and properties, the remainder of the script does not execute. Only the following methods and properties in the Object Model can be associated with OnclientXXX scripts:
● TextBox.Text
● TextBox.Enable
● TextBox.Visible
118 Designing for the Hyperion System 9 BI + Workspace
● TextBox.Font
● TextBox.Scrollable
● TextBox.Name
● TextBox.Password
● TextBox.Type
Client StatusClient-side JavaScript instructs the server code to run or not by the following status indicators:
● ActiveSection.ClientScriptStatus
● Object.ClientScriptStatus
For example, if the client-side JavaScript (which might be activated by a command button) determines that a user did not check an option or entered alphabetic data instead of numeric, the server side JavaScript does not run until the user types the correct data.
Use the ActiveSection.ClientScriptStatus status indicator when you need to coordinate an action between objects. This indicator takes a Boolean value.
Use the Object.ClientScriptStatus status indicator to initiate an action for an independent objects. The “object” in the Object.ClientScriptStatus status indicator is replaced with the object’s name such as CommandButton1.ClientScriptStatus (“object” does not exist on its own). This indicator also takes a Boolean value. Note that an independent object is still subject to the script status settings of the ActiveSection
The behavior of the status indicators settings is shown below.
For example, consider a dashboard with a user ID, password, Submit, and a Cancel button. The password text field contains a client-side script that enforces at least a 6 character long, alphanumeric password.
Table 16 Status Indicator Settings
Indicator Value ActiveSection.ClientScriptStatus Object.ClientScriptStatus
True Initialization occurs when a server side script completes.
For client-side script run in the Workspace, this occurs when the browser page is refreshed.
For client-side script run in the Interactive Reporting Studio and Interactive Reporting Web Client, this occurs at the conclusion of a server side script’s execution, even if the page is not redrawn.
Initialization occurs when the client-side script for the object starts to run.
False No server side script is executed. No server side script is executed.

Client-Side JavaScript 119
If the ActiveSection.ClientScriptStatus were set to “false”, and if the user clicks “Submit” without typing the correct password, the client-side script does not send the invalid password to the server. However, the “Cancel” button could reset the ActiveSection.ClientScriptStatus to “true” and enables any cancel logic which has been implemented at the server level to run.
Client-Side EventsThe Client-side events display in the Event Trigger dropdown of the Script Editor. All events shown below are executed in the Workspace browser, and not on the server.
Text Box Events and PropertiesDesigners can use the events and properties of a Text Box when creating client-side JavaScript. Events that have both client and server side components both run, but the server side events of Text Boxes do not execute in the Workspace. Both client and server side events of text box run in Interactive Reporting Studio and Interactive Reporting Web Client.
The properties of Text Boxes that are exposed to Client-Side JavaScript are:
● TextBox.Text
● TextBox.Enable
Table 17 Client-Side Object Level Events
Event Objects Supporting Event Action That Invokes Event
OnClientClick Controls:command button, radio button, check box, list box, drop-down list, text box
Clicking a control.
OnClientDoubleClick Controls: List box Clicking a control.
OnClientEnter Control: Text Box Entering a text box.
OnClientExit Control: Text Box Leaving a text box.
OnClientSelection Control: Drop Down Selecting an item in a drop down
Table 18 Client-Side Events Associated with Control Objects
Control Object Event
Command Button OnClientClick
Radio Button OnClientClick
Check Box OnClientClick
List Box OOnClientClick, OnDoubleClick
Drop Down OnClientClick, OnClientSelection
Text Box OnClientClick, OnClientEnter, OnClientExit,
120 Designing for the Hyperion System 9 BI + Workspace
● TextBox.Visible
● TextBox.Font
● TextBox.Scrollable
● TextBox.Name
● TextBox.Password
● TextBox.Type
Alert DialogThe Workspace supports the use of an alert dialog box. This dialog box is a modal window that displays a message to the end user. It includes an OK button for the user to close the dialog. Before the user can continue with other work on the browser, the dialog box must be dismissed.
In the Workspace, the alert dialog box is displayed as a full web page. The Alert() method can be called from any supported event, with the exception of OnStartUp and OnShutDown events.
Up to three buttons can be displayed on the dialog with custom names. When the user selects a button, an integer is returned corresponding to the number of the button. If the user selects button #1, the number 1 is returned and so on.
The syntax used to create the alert dialog in the object model is:
Expression.Alert(Prompt As String, [Title As String], [Button1Text As String], [Button2Text As String], [Button3Text As String]) As Integer
ToolbarsControl of what toolbars display for the Workspace versions of an Interactive Reporting document is governed by the Toolbars collection in the Interactive Reporting Object Model. Toolbars can be hidden from view to limit the users ability to control the Interactive Reporting document or displayed as needed. For example, the Standard and Format toolbars can be hidden when the Interactive Reporting document is opened. Toolbars can also be added to the display to extend the users ability to navigate should other navigation means be restricted. This feature is available by way of the Navigation toolbar.
All methods and properties, including all individual collection object properties, of the Toolbars collection are at your disposal for displaying or hiding toolbars in the Workspace. Note the Toolbar collection objects do not have any associated methods.
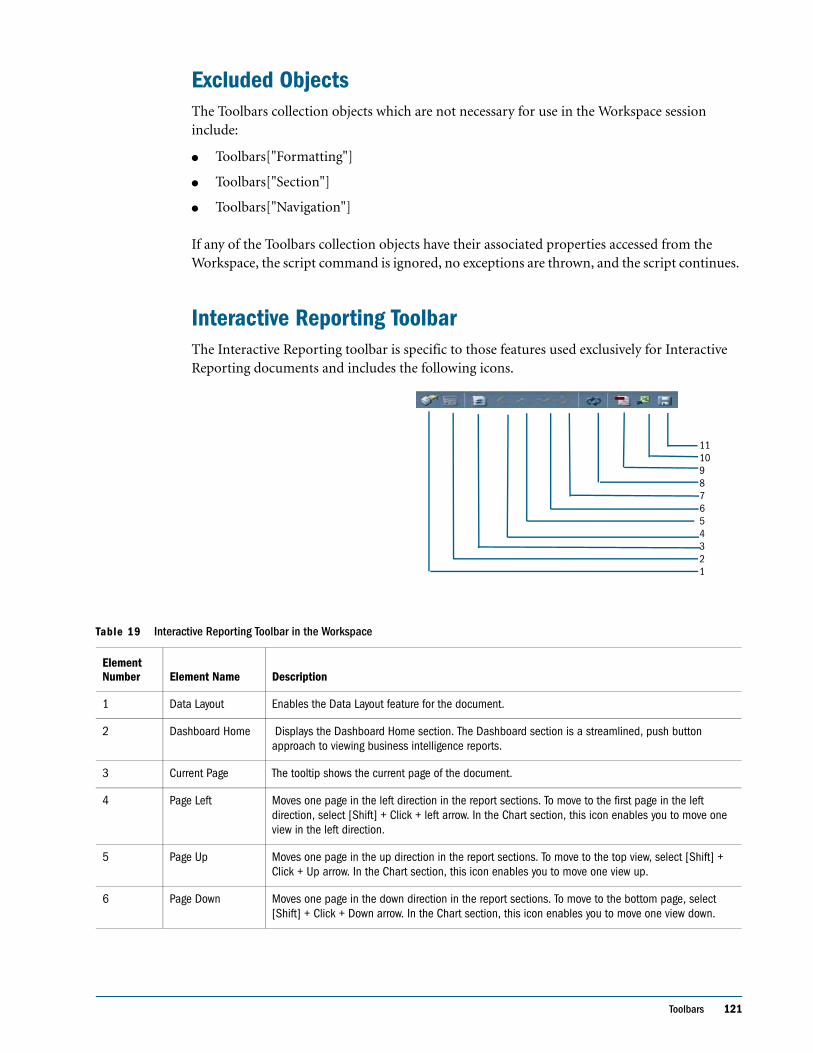
Toolbars 121
Excluded ObjectsThe Toolbars collection objects which are not necessary for use in the Workspace session include:
● Toolbars["Formatting"]
● Toolbars["Section"]
● Toolbars["Navigation"]
If any of the Toolbars collection objects have their associated properties accessed from the Workspace, the script command is ignored, no exceptions are thrown, and the script continues.
Interactive Reporting ToolbarThe Interactive Reporting toolbar is specific to those features used exclusively for Interactive Reporting documents and includes the following icons.
Table 19 Interactive Reporting Toolbar in the Workspace
Element Number Element Name Description
1 Data Layout Enables the Data Layout feature for the document.
2 Dashboard Home Displays the Dashboard Home section. The Dashboard section is a streamlined, push button approach to viewing business intelligence reports.
3 Current Page The tooltip shows the current page of the document.
4 Page Left Moves one page in the left direction in the report sections. To move to the first page in the left direction, select [Shift] + Click + left arrow. In the Chart section, this icon enables you to move one view in the left direction.
5 Page Up Moves one page in the up direction in the report sections. To move to the top view, select [Shift] + Click + Up arrow. In the Chart section, this icon enables you to move one view up.
6 Page Down Moves one page in the down direction in the report sections. To move to the bottom page, select [Shift] + Click + Down arrow. In the Chart section, this icon enables you to move one view down.
1110987 654321
122 Designing for the Hyperion System 9 BI + Workspace
Paging IconsDepending on how a report was designed, you may see an abbreviated version of the Interactive Reporting toolbar referred to as the Paging toolbar. This version of the Interactive Reporting toolbar contains the appropriate navigation controls for moving around the report.
The Toolbars collection Standard object has the associated Properties:
● Toolbars["Standard"].Visible
● Toolbars["Standard"].Name
● Toolbars["Standard"].Type
Paging ToolbarThe Paging toolbar is an abbreviated version of the Workspace standard toolbar and consists of the section paging controls (First Page, Previous Page, Next Page, Last Page) and the current page indicator text (Page X of Y). The buttons behave in the same manner and become active just as the like buttons of the Workspace Standard toolbar. The Paging Toolbar looks as follows:
7 Page Right Moves one page in the right direction in the report sections. To move to the first view in the right direction, select [Shift] + Click + right arrow. In the Chart section, this icon enables you to move one view right.
8 Refresh Refreshes only the current section against the database server to dynamically retrieve the most current data set, with the exception of the Dashboard and Report sections. When the Refresh command is selected in the Dashboard and Report sections, all queries in the document are refreshed. Queries are refreshed in the order in which they are displayed in the section catalog of the full client. For example, in a document with three queries, Query1, Query2, and Query3, the queries are executed in that order when “Refresh All” is pressed.
9 Export to PDF Exports a section to Portable Document Format (PDF) and launches it inside your browser if the PDF MIME type is set in your browser. The PDF format is created by Adobe and can be viewed outside of your browser if you have Adobe Acrobat Reader installed. Adobe Acrobat Reader can be downloaded from Adobe’s web site at http://www.adobe.com/products/acrobat/readstep.html. If the PDF MIME type is not set in the browser, the browser “Save As” dialog is invoked.
10 Export to XLS Exports a section to MS Excel and launches it inside your browser if the mime type has been set to recognize the XLS file extension Thereafter, saving the file locally or manipulating the file is all done by way of the MS Excel application. If the mime type is not set to recognize the XLS file extension, you are prompted with a Save As Dialog and must specify a local destination to save the XLS file for future viewing of the data with the MS Excel.
11 Save Saves the file locally and launches the document in the Interactive Reporting Web Client so that you can view and save the Interactive Reporting document t to your desktop for offline viewing. The Interactive Reporting document can only be viewed by the full desktop or web client. If the web client has not been installed, the browser is launched automatically.
Tip: If you want to save the document to the Repository, use the File > Save or File > Save As command.
Table 19 Interactive Reporting Toolbar in the Workspace (Continued)
Toolbars 123
The Toolbars Collection Paging object has the associated Properties:
● Toolbars["Paging"].Visible
● Toolbars["Paging"].Name
● Toolbars["Paging"].Type
The Paging toolbar type is available as a constant value in the BqToolbars group. If you try to access the Paging toolbar in Designer or web client, the script command is ignored, no exception thrown, and the script continues.
Event Controls for Toolbar DisplayThe Object Model commands for toolbar display have full control on which toolbars display in an Workspace document or are defined for an embedded section in the Personal Pages.
The following script commands can be executed using any of the Object Model supported trigger events within the Workspace for the display of toolbars:
● Document Scripts Trigger Events (OnStartup, On Shutdown, OnPreProcess, OnPostProcess)
● Dashboard Section Display Trigger Events (OnActivate, OnDeactivate)
● Dashboard Object Trigger Events (OnClick, OnSelection, OnExit)
The Workspace Document DisplayThe general rules governing the display of the Standard and Paging toolbars are:
● Only one of the two Workspace toolbars can be displayed at any given time.
● If any scripts are executed which set both toolbar Visible properties equal to true, only the latter script execution is reflected in the display, and the visible property of the former is returned to false.
● It is possible that no toolbars are displayed in the Workspace.
● The Page X of Y field displays the current page of the section with an unknown Y value until the you navigate to the last page of the section. If you use the SHIFT + toolbar button combination to navigate to the last page, all pages are generated and the Page # tooltip icon shows the correct page position and total page value. Subsequent navigation continues to show the current and total page numbers, and persists for the entire session.
Page LeftPage UpPage DownPage Right

124 Designing for the Hyperion System 9 BI + Workspace
If the section has fields in the section that show the 'Page x of y' value, these fields match the page # toolbar icon tooltip.If the Interactive Reporting document file is saved without the Results from which the section is derived and the Interactive Reporting document file is process, only the first page is generated. This icon is informational only.
These rules are consistent with the current rules enforced by the Personal Page Display Properties radio buttons (see below).
Personal PagesThe display of toolbars for Personal Pages using the Interactive Reporting Object Model script commands supersede any toolbar display settings which are specified by the Personal Pages owner.
The document designer, and not the Personal Pages owner, should determine which functionality and options of the document are available to the end user. Script commands to show or hide toolbars for the embedded Interactive Reporting document sections within the Personal Pages are executed even if these script commands alter the Personal Pages owner's toolbar display selection.
If no Object Model script commands governing the toolbar display are contained in the Interactive Reporting document, the Personal Pages toolbar display selections are enforced.
Pre-Generated HTMLChanges in the toolbar display are not supported when Interactive Reporting document documents are published and pre-generation of the section HTML is selected. Since the Object Model script commands which would govern the display of the toolbars are not executed at publish time, the pre-generated HTML for each of the sections contain the Standard toolbar.
Section 508 ComplianceThe following Section 508 Compliance behavior exists for toolbars in the Interactive Reporting document:
● The first page line (invisible link) is reached by the Alt+H keystroke regardless of the toolbar present on the page or which toolbar is shown.
● The invisible link enables a user to skip the entire Paging toolbar.
● ALT text for all toolbar buttons on the Paging toolbar is included.
● When in 508 Compliant mode, the Toolbar Collection Object Property ‘Visible’ must show/hide the correct version of the Standard or Paging toolbar.
Guided Analysis and Reporting 125
AccessibilityThe Accessibility property enables designers of Dashboard section to display an alternate Dashboard section and. or object which can be more accessible to disabled user.
This Accessibility property is a read-only boolean (true/false) and exists as a Document Collection Object property as shown below:
Document[<collection index value or document file name>].AccessibilityActiveDocument.Accessibility
The setting of this property is determined by the '508 Compliance Preferences' user setting set in the Browse Publish application and persists for the duration of the Interactive Reporting document session. The property is not persisted with the document.
Primary Use CaseThe Accessibility property is set when a user with the Accessibility option enabled ('508 Compliance Preferences' setting) selects a document link from the document list for display in the Workspace. The rules governing which boolean value applies to the property are cited below:
If you select a document from his/her document list and:
● The Accessibility option is enabled in the Browse Publish application, the property is set to TRUE
● The Accessibility option is disabled, the property is set to FALSE
The default value for this property is FALSE.
The property is not set when selections are made on the web client document link, regardless of the user's Accessibility status as web client is not Section 508 compliant.
Guided Analysis and ReportingGuided Analysis and Reporting enables you to select a point-of-view (POV) context from one Hyperion product and seamlessly pass that same context for immediate use in another Hyperion product. Guided Analysis and Reporting eliminates the need for you to launch the secondary product and drill down to the same POV context by placing the secondary product in the context selected from within the first product.
For example, if you are navigating through a bar chart in Hyperion Analyzer and require comparable information from a relational data source, you can select a bar on the chart (as the POV) and choose the Related Content option. Depending on the type of link established at design time, an Interactive Reporting document Interactive Reporting document is launched or you are prompted navigate to a specific Interactive Reporting document. In either case, the Workspace launches the Interactive Reporting document and shows a relational chart depicting the POV sent from Web Analysis.
126 Designing for the Hyperion System 9 BI + Workspace
In another case, you might review a published report and need further analysis. Again using the POV from a grid, you can select the Related Content option and view related information display POV sent from Reports, such as OLAP or relational data sources.
Behind the scenes on the Hyperion Analyzer and Hyperion Reports, a direct or embedded link is defined, and the designer selects a Interactive Reporting document to which to send the POV. When a Interactive Reporting document is selected, a SmartCut is created and the Workspace client is invoked.
A SmartCut is a link in the form of a special URL to an item in the Hyperion Foundation Repository. In this case, the Smartcut includes parameters defining the POV.
http://Aserver.hyperion.com/Hyperion/browse/get/AFolder/Test.bqy?store=21&product=A&year=2003
Processing the Point of View (POV)As a designer of POV linked Interactive Reporting document documents, you provide a script to parse the SmartCut, identify the relevant POV information, navigate the Interactive Reporting Object Model, and apply the POV values where and if appropriate.
➤ To process a POV:
1 Get the SmartCut for the Hyperion Analyzer or Hyperion Reports document.
2 For all known Interactive Reporting document documents published to the Repository (and thus, exposed to Hyperion Analyzer and Hyperion Reports to select as documents to pass POV information), provide an OnStartUp script that does the following:
● Parse the SmartCut using JavaScript and the Object Model Sessions object.
● Identify the POV parameters and assign to global variables.
● Traverse the Object Model tree and apply applicable values where and if appropriate.
Parsing a SmartCut3 Use Sessions object in the Object Model to parse the SmartCut.
4 Extract all relevant data and store in global variables.
Here is an example of using the Session object to extract values from the sample SmartCut above:
var store_id = Session.URL.Item(‘store’);var product_id= Session.URL.Item(‘product’);var year_id= Session.URL.Item(‘year’);
Traverse the Object Model Tree5 Starting from the root of the Object Model Tree, traverse relevant branches/nodes.
6 Apply values to relevant properties.
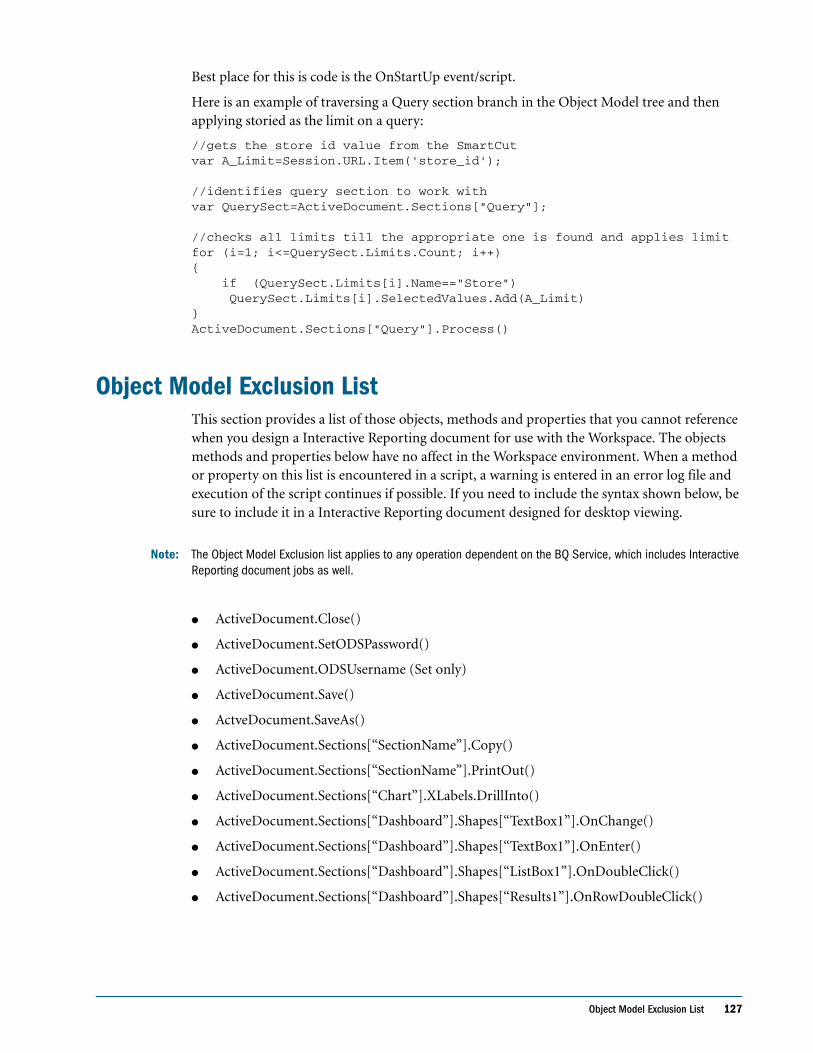
Object Model Exclusion List 127
Best place for this is code is the OnStartUp event/script.
Here is an example of traversing a Query section branch in the Object Model tree and then applying storied as the limit on a query:
//gets the store id value from the SmartCutvar A_Limit=Session.URL.Item('store_id');
//identifies query section to work withvar QuerySect=ActiveDocument.Sections["Query"];
//checks all limits till the appropriate one is found and applies limitfor (i=1; i<=QuerySect.Limits.Count; i++){ if (QuerySect.Limits[i].Name=="Store") QuerySect.Limits[i].SelectedValues.Add(A_Limit)}ActiveDocument.Sections["Query"].Process()
Object Model Exclusion ListThis section provides a list of those objects, methods and properties that you cannot reference when you design a Interactive Reporting document for use with the Workspace. The objects methods and properties below have no affect in the Workspace environment. When a method or property on this list is encountered in a script, a warning is entered in an error log file and execution of the script continues if possible. If you need to include the syntax shown below, be sure to include it in a Interactive Reporting document designed for desktop viewing.
Note: The Object Model Exclusion list applies to any operation dependent on the BQ Service, which includes Interactive Reporting document jobs as well.
● ActiveDocument.Close()
● ActiveDocument.SetODSPassword()
● ActiveDocument.ODSUsername (Set only)
● ActiveDocument.Save()
● ActveDocument.SaveAs()
● ActiveDocument.Sections[“SectionName”].Copy()
● ActiveDocument.Sections[“SectionName”].PrintOut()
● ActiveDocument.Sections[“Chart”].XLabels.DrillInto()
● ActiveDocument.Sections[“Dashboard”].Shapes[“TextBox1”].OnChange()
● ActiveDocument.Sections[“Dashboard”].Shapes[“TextBox1”].OnEnter()
● ActiveDocument.Sections[“Dashboard”].Shapes[“ListBox1”].OnDoubleClick()
● ActiveDocument.Sections[“Dashboard”].Shapes[“Results1”].OnRowDoubleClick()
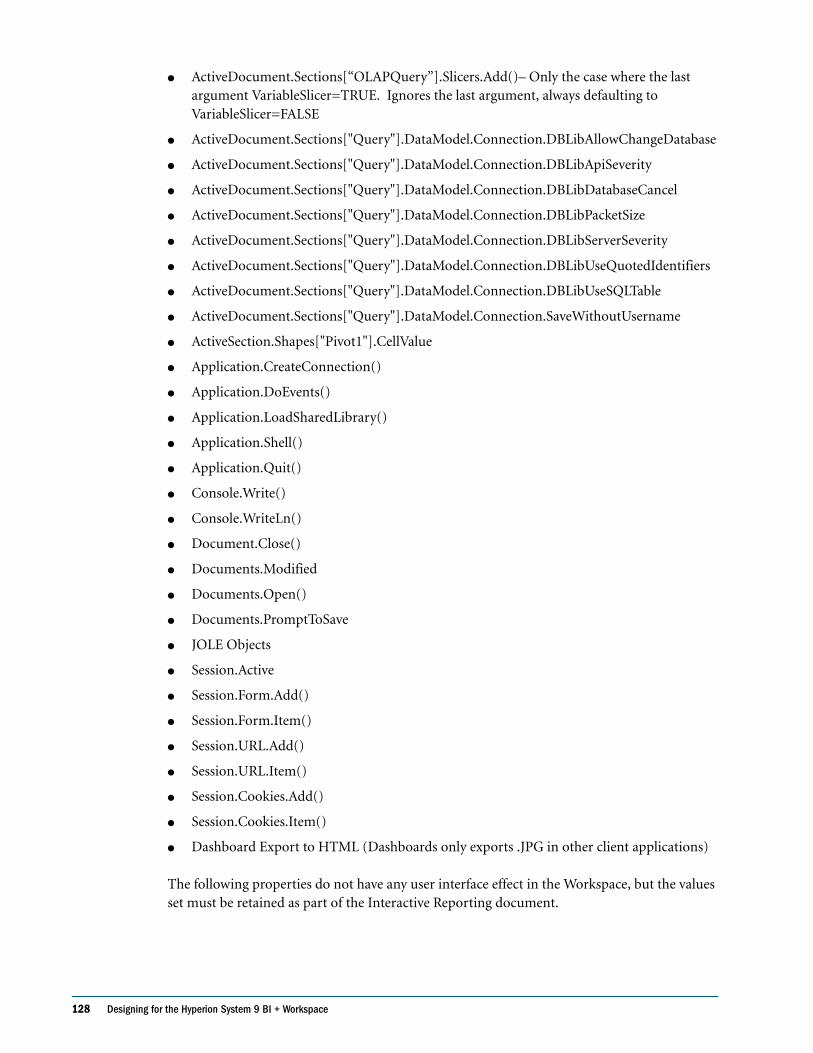
128 Designing for the Hyperion System 9 BI + Workspace
● ActiveDocument.Sections[“OLAPQuery”].Slicers.Add()– Only the case where the last argument VariableSlicer=TRUE. Ignores the last argument, always defaulting to VariableSlicer=FALSE
● ActiveDocument.Sections["Query"].DataModel.Connection.DBLibAllowChangeDatabase
● ActiveDocument.Sections["Query"].DataModel.Connection.DBLibApiSeverity
● ActiveDocument.Sections["Query"].DataModel.Connection.DBLibDatabaseCancel
● ActiveDocument.Sections["Query"].DataModel.Connection.DBLibPacketSize
● ActiveDocument.Sections["Query"].DataModel.Connection.DBLibServerSeverity
● ActiveDocument.Sections["Query"].DataModel.Connection.DBLibUseQuotedIdentifiers
● ActiveDocument.Sections["Query"].DataModel.Connection.DBLibUseSQLTable
● ActiveDocument.Sections["Query"].DataModel.Connection.SaveWithoutUsername
● ActiveSection.Shapes["Pivot1"].CellValue
● Application.CreateConnection()
● Application.DoEvents()
● Application.LoadSharedLibrary()
● Application.Shell()
● Application.Quit()
● Console.Write()
● Console.WriteLn()
● Document.Close()
● Documents.Modified
● Documents.Open()
● Documents.PromptToSave
● JOLE Objects
● Session.Active
● Session.Form.Add()
● Session.Form.Item()
● Session.URL.Add()
● Session.URL.Item()
● Session.Cookies.Add()
● Session.Cookies.Item()
● Dashboard Export to HTML (Dashboards only exports .JPG in other client applications)
The following properties do not have any user interface effect in the Workspace, but the values set must be retained as part of the Interactive Reporting document.
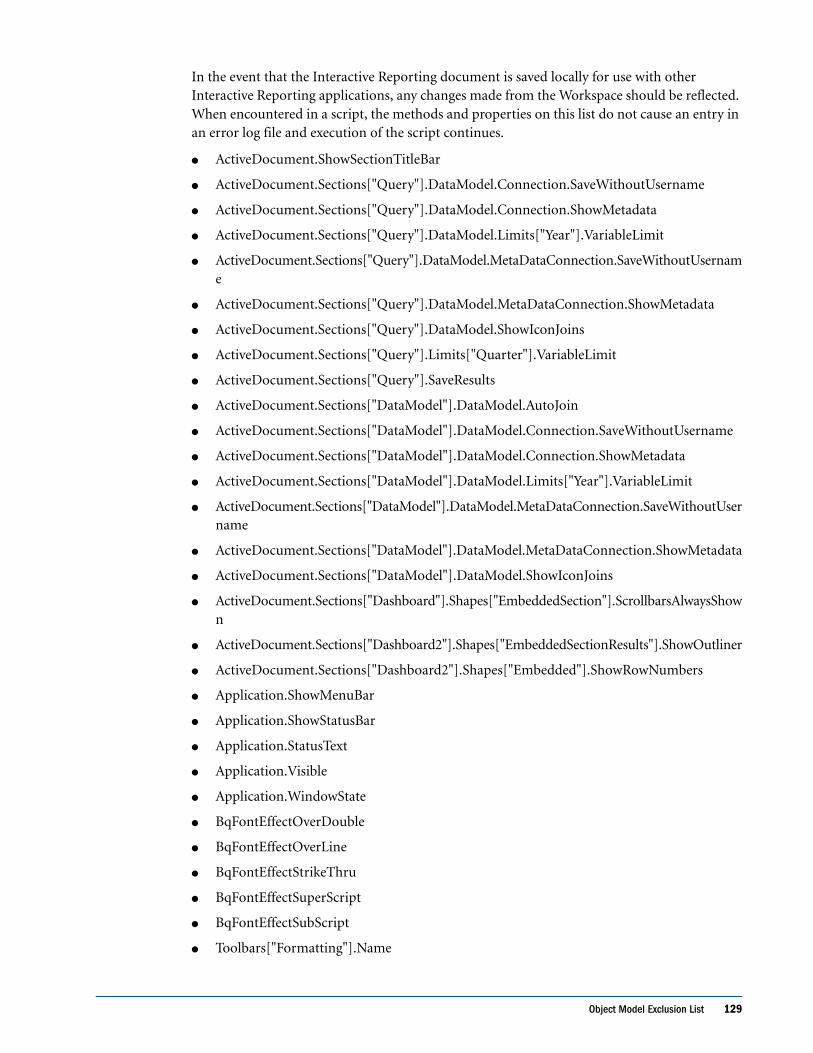
Object Model Exclusion List 129
In the event that the Interactive Reporting document is saved locally for use with other Interactive Reporting applications, any changes made from the Workspace should be reflected. When encountered in a script, the methods and properties on this list do not cause an entry in an error log file and execution of the script continues.
● ActiveDocument.ShowSectionTitleBar
● ActiveDocument.Sections["Query"].DataModel.Connection.SaveWithoutUsername
● ActiveDocument.Sections["Query"].DataModel.Connection.ShowMetadata
● ActiveDocument.Sections["Query"].DataModel.Limits["Year"].VariableLimit
● ActiveDocument.Sections["Query"].DataModel.MetaDataConnection.SaveWithoutUsername
● ActiveDocument.Sections["Query"].DataModel.MetaDataConnection.ShowMetadata
● ActiveDocument.Sections["Query"].DataModel.ShowIconJoins
● ActiveDocument.Sections["Query"].Limits["Quarter"].VariableLimit
● ActiveDocument.Sections["Query"].SaveResults
● ActiveDocument.Sections["DataModel"].DataModel.AutoJoin
● ActiveDocument.Sections["DataModel"].DataModel.Connection.SaveWithoutUsername
● ActiveDocument.Sections["DataModel"].DataModel.Connection.ShowMetadata
● ActiveDocument.Sections["DataModel"].DataModel.Limits["Year"].VariableLimit
● ActiveDocument.Sections["DataModel"].DataModel.MetaDataConnection.SaveWithoutUsername
● ActiveDocument.Sections["DataModel"].DataModel.MetaDataConnection.ShowMetadata
● ActiveDocument.Sections["DataModel"].DataModel.ShowIconJoins
● ActiveDocument.Sections["Dashboard"].Shapes["EmbeddedSection"].ScrollbarsAlwaysShown
● ActiveDocument.Sections["Dashboard2"].Shapes["EmbeddedSectionResults"].ShowOutliner
● ActiveDocument.Sections["Dashboard2"].Shapes["Embedded"].ShowRowNumbers
● Application.ShowMenuBar
● Application.ShowStatusBar
● Application.StatusText
● Application.Visible
● Application.WindowState
● BqFontEffectOverDouble
● BqFontEffectOverLine
● BqFontEffectStrikeThru
● BqFontEffectSuperScript
● BqFontEffectSubScript
● Toolbars["Formatting"].Name
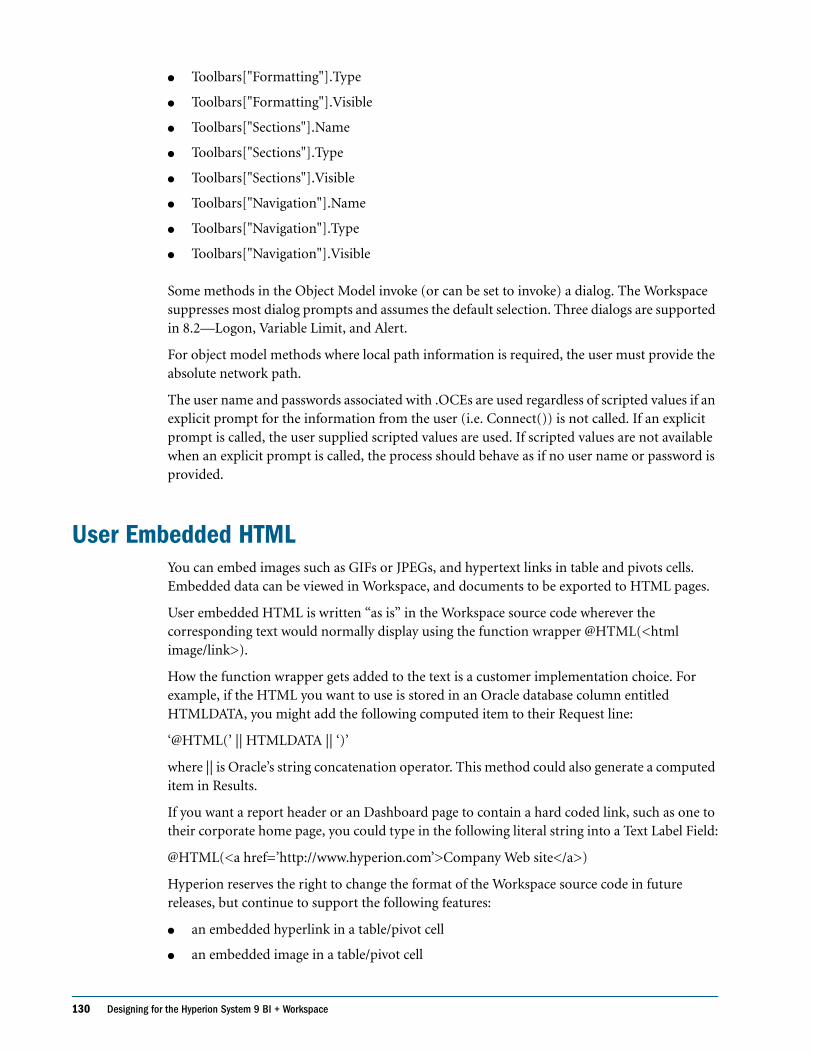
130 Designing for the Hyperion System 9 BI + Workspace
● Toolbars["Formatting"].Type
● Toolbars["Formatting"].Visible
● Toolbars["Sections"].Name
● Toolbars["Sections"].Type
● Toolbars["Sections"].Visible
● Toolbars["Navigation"].Name
● Toolbars["Navigation"].Type
● Toolbars["Navigation"].Visible
Some methods in the Object Model invoke (or can be set to invoke) a dialog. The Workspace suppresses most dialog prompts and assumes the default selection. Three dialogs are supported in 8.2—Logon, Variable Limit, and Alert.
For object model methods where local path information is required, the user must provide the absolute network path.
The user name and passwords associated with .OCEs are used regardless of scripted values if an explicit prompt for the information from the user (i.e. Connect()) is not called. If an explicit prompt is called, the user supplied scripted values are used. If scripted values are not available when an explicit prompt is called, the process should behave as if no user name or password is provided.
User Embedded HTMLYou can embed images such as GIFs or JPEGs, and hypertext links in table and pivots cells. Embedded data can be viewed in Workspace, and documents to be exported to HTML pages.
User embedded HTML is written “as is” in the Workspace source code wherever the corresponding text would normally display using the function wrapper @HTML(<html image/link>).
How the function wrapper gets added to the text is a customer implementation choice. For example, if the HTML you want to use is stored in an Oracle database column entitled HTMLDATA, you might add the following computed item to their Request line:
‘@HTML(’ || HTMLDATA || ‘)’
where || is Oracle’s string concatenation operator. This method could also generate a computed item in Results.
If you want a report header or an Dashboard page to contain a hard coded link, such as one to their corporate home page, you could type in the following literal string into a Text Label Field:
@HTML(<a href=’http://www.hyperion.com’>Company Web site</a>)
Hyperion reserves the right to change the format of the Workspace source code in future releases, but continue to support the following features:
● an embedded hyperlink in a table/pivot cell
● an embedded image in a table/pivot cell

User Embedded HTML 131
In addition the Interactive Reporting Studio and Interactive Reporting Web Client cannot guarantee the format or appearance of a cell data adjacent to a cell in which the HTML has been defined by the user. If you define HTML in a cell to be viewed in a non-HTML context (such as web client, Designer or Explorer), any embedded information is displayed as text.
➤ To embed your own image or hyperlink into a table or pivot cell:
1 Select the cell in which to embed the image or hyperlink.
2 Type the following wrapper information in the cell:
@HTML(<HTML image/link>)
When the Interactive Reporting Studio and Interactive Reporting Web Client encounters the @HTML wrapper, it is stripped from the cell and the content up to but not including is exported “as is”, without any character substitutions. The parentheses () also gets stripped.

132 Designing for the Hyperion System 9 BI + Workspace
Glossary 133
A B C D E F G H I J K L M N O P Q R S T U V W X Y Z
Glossary
Adaptive Report Level The level of privilege that a user can
interact with an Interactive Reporting document. The
adaptive report levels are View Only; View and Process;
Analyze; Analyze and Process; Query and Analyze; and
Data Model, Query, and Analyze. When a document is
published, groups of users are granted access to it with
specific Adaptive Report level privileges.
ADR (also called as sync) See automatic distributed
refresh.
aggregate filter filters placed on aggregated request line
items or aggregated meta topic items.
API Application Programmer Interface
API Socket (DaAPISock) The API (such as ODBC, SQL
Net, and so on) or protocol level information used when
connecting to a database that has been abstracted in an
API Socket. Interactive Reporting have one API socket for
each supported API/communication protocols.
application aerver A panework for developing
applications that provides fundamental capabilities
required by many applications such as session and resource
management, and security.
auditing The monitoring of Interactive Reporting
Repository objects to determine usage patterns.
automatic distributed refresh The process of
synchronizing locally saved documents and the version in
the repository.
auto-join An administrator can configure a connection
file to cause joins to occur automatically for users using the
Auto-Join feature. Auto-Join can be configured one of
three ways: Best Guess, Custom, and Server-Defined.
auto-process The automatic processing of a query.
axes Straight lines on a chart used for measurement and
categorization. Typically the X-axis and the Z-axis are both
used for categories while the Y-axis is used for
quantification (for example, Facts/Values). Pie charts only
use the X-axis for its categories and the Y-axis for its
Facts/Values.
catalog A collection of database tables and local results.
This is the information the user can use in a data model or
query.
Catalog pane Shows a list of elements available to the
active section. For example, if Query is the active section,
the Catalog pane displays a list of database tables. If Pivot is
the active section, the Catalog pane displays a list of results
columns. If Dashboard is the active section, the Catalog
pane displays a list of embeddable sections, graphic tools,
and control tools.
categories Groupings by which the data is organized (for
example, month).
CGI See Common Gateway Interface.
chart A graphical representation of data. Users create
charts to convert raw data into eloquent, visual
information.
Chart section With a varied selection of chart types, and
a complete arsenal of OLAP tools like group and drill-
down, the Chart section is built to support simultaneous
graphic reporting and ad-hoc analysis.
client/server A network architecture in which each
computer or process on the network is either a client
(requests information) or a server (delivers requested
information).
134 Glossary
A B C D E F G H I J K L M N O P Q R S T U V W X Y Z
clustered bar charts Occurs when the categories are
viewed side by side within a given category, useful for side
by side category analysis. Clustering is only done with
vertical bar charts.
Common Facilities One of the four categories of objects
defined by the Object Management Architecture (OMA).
The Common Facilities is a collection of services that
many applications may share, but the services are not as
fundamental as Object Services. For example, Print Facility
and Mobile Agent Facility.
computed item A virtual column (as opposed to a column
that is physically stored in the database or cube) that can
be calculated by the database during a query, or by an
Interactive Reporting in the Results section. They are
calculations of new data based on functions, data items,
and operators provided in the dialog box. They can be
included in reports or reused to calculate other data.
connection file See interactive reporting database
connection file.
Controls Folder Contains prebuilt items that can be
added to your Dashboard section, such as list boxes, radio
buttons, and command buttons. You can then attach
scripts to the controls embedded in the Dashboard section
to execute actions.
correlated subqueries Subqueries that are evaluated once
for every row in the parent query. A correlated sub query is
created by joining a topic item in the subquery with one of
the topic items in the parent query.
cross join Creates a query where none of the tables is
joined. Every row in one table is joined to every row in
another table.
cube The data in OLAP databases (MS Plato, Hyperion
System 9 BI + Analytic Services, MetaCube) is stored in 3-
dimensional cubes, which is different from standard
relational databases (2-dimensional). Cubes are made up of
dimensions and measures. A cube may have dozens of
dimensions.
DaConnect (aka DaConn) An Interactive Reporting’s
main connectivity class. Contains all the connectivity
specific information. Instance of a connection class is
made whenever Interactive Reporting needs to connect to
any database.
Daemon-mode BQ The Hyperion client/server
executable. It is spawned in daemon mode by node JREs.
The role of the daemon-mode BQ is simply to execute
database queries and return results.
Dashboard Allows you to build and deploy analytic
applications. Analytical applications focus on delivering
significant prepackaged business content that is
encapsulated within an application. With Interactive
Reporting, customers and independent software vendors
can leverage their knowledge of industry specific best
practices and assemble their own analytical applications
for deployment to end users using the Web. Combining
embeddable Report sections with enhanced Dashboard
controls into a visual workspace and hooking up
interactivity between these controls and the native Brio
Software application, an application designer can quickly
create a variety of robust applications.
Dashboard Home A button that returns you to the Dashboard section designated as the Dashboard Home section. If you have only one Dashboard section,
Dashboard Home returns to that section. If you have
several Dashboard sections, the default Dashboard Home
is the top Dashboard section in the Catalog pane. In
Design mode you can specify another Dashboard section
to be the Dashboard Home section.
DaSession When a client needs to perform an operation
such as select, insert, update on a database, a session is
created. The life time of a session synchronizes with the
operation’s duration. Sessions are created when a client
needs to perform operations on the database and are
destroyed when the operation is considered complete.
data function Computes aggregate values, including
averages, maximums, counts and other statistics, which
summarize groupings of data. You can use data functions
to aggregate and compute data from the server before it
reaches the Results section, or compute different statistics
for aggregated totals and items in the other analysis
sections.
data model A representation of a subset of actual database
tables that acts as a menu for the query-builder. Data
models are the sources for building the Request, Filter, and
Sort lines in a query section. You create a data model by
dragging database tables from the Catalog pane into the
Content pane. The data model displays database tables
graphically as topics when they are in the Content pane.
Glossary 135
A B C D E F G H I J K L M N O P Q R S T U V W X Y Z
Data models can be distributed through the Hyperion
System 9 BI + repository and used by end users to create
their own queries.
database function A predefined formula in a database.
database server A computer that stores database
management system software (DBMS, for example,
Oracle, Sybase, Hyperion System 9 BI + Analytic
Services™, and a database shared by a network of
computer clients. Most databases are used in a client/server
environment.
By storing data on a single, powerful machine on a
network, the data is centralized and accessible to many
users. The server ensures that the data is maintained
correctly and serves as a traffic cop to regulate client
machine access to the data. The server’s computing power
is also useful in computing and filtering data from the
database before it reaches your workstation. For small or
localized databases, your own computer can act as both
database server and client.
datatype The type of data stored in a specific column in a
database. For example, data can be stored as a numeric
datatype.
date group A feature in the Results and Table sections
that separates a date into Year, Quarter and Month
columns. The display format for the new Month column is
automatically set to mmm so that the month names sort
chronologically (as opposed to alphabetically) in the
report sections. Quarters are based on the calendar year,
beginning January 1.
designer A client/server-based tool that delivers query,
analysis, and reporting capabilities and centralized
solution administration for developers, database
administrators, and system administrators.
design guide Design guides are similar to grids in that
objects automatically snap to line up with the design
guides. Design guides are placed at user-specified locations
in the work area. There are horizontal and vertical design
guides. The design guides will draw as a blue line across
the work area, with the ability to drag the guide to any new
location.
design mode A toggled environment used to build and
modify Dashboard sections. In Design mode, you build
Dashboard sections with an array of prebuilt control items
and graphic items.
Designers can switch out of design mode to test Dashboard
features and deploy them to end users. Design mode is
only available in Dashboard sections. Interactive Reporting
Navigator users cannot switch to Dashboard Design mode.
detail view Displays a topic as a database table. When you
select Detail view, the database returns ten sample rows
from the associated table. Each topic item displays as a
database field. Detail view enables users to browse a sample
of the raw data, which is useful when unfamiliar with the
data model or the underlying data. Users cannot view a
meta topic in Detail view.
dimension In an OLAP database cube, categories of
information are called dimensions. Examples of
dimensions may be Location, Products, Stores, and Time.
In an Interactive Reporting, related, nonquantifiable items
in a topic are also referred to as dimensions, such as
Contact or Store Name.
dimension (legend dimension) The current axis
categorization or grouping method. This can be set to the
X, Y, or Z-axis for most chart types. For line and area
charts it can only be set to the Y or Z-axis. For pie charts it
is always set to the X-axis. When you change the Legend
Dimension the color is distributed along the new axis you
change to.
dimension tab In the Pivot section, the tab that enables
you to pivot data between rows and columns.
dimension table Consists of numerous attributes about a
specific business process. Each row in a dimension table is
unique.
drill anywhere Allows you to drill into and add items to
pivot reports residing in the Results section, without
having to return to the Query section or trying to locate
the item in the Catalog pane. Drill Anywhere items are
broken out as new pivot label items.
drill to detail Allows you to retrieve items from a data
model that are not in the Results section, without having
to rerun the original query. This feature provides the
ability to interactively query the database and filter the
data that is returned. Drill to Detail sets a filter on the
query based on the user’s selection and adds the returned
value as a new pivot label item automatically.
drilldown Allows you to progressively narrow your focus
on a selected chart category. Very useful when you have too
many categories on a particular axis.
136 Glossary
A B C D E F G H I J K L M N O P Q R S T U V W X Y Z
embedded section A Interactive Reporting section that is
embedded in a Smart report or other Interactive Reporting
section. All embedded sections maintain live data content
and formatting from the original section. Reprocessing the
query, or modifying the original section automatically
updates the embedded section display.
Explorer A client/server-based tool that delivers query,
analysis, and reporting capabilities for power users who
need to directly access data sources—or to explore the
information organized in prebuilt data models stored in
the repository.
Expression Line Displays displays the JavaScript syntax
for each item displayed in a report. Use this line to build
equations in the Report section. For ease of use, it can be
undocked and resized.
extranet An intranet that is partially accessible to
authorized outsiders. Extranets are secured by user names
and passwords.
fact table A table that stores business activity measures.
Most fact tables are extremely large. Each row in a fact
table contains numeric measures (fully additive measures,
nonadditive measures and/or semiadditive measures) and
foreign keys to each dimension table.
facts The numeric values that are broken up in the body of
the Pivot section. To add facts to the Pivot, put Results
columns from the Catalog pane into the Outliner’s Facts
pane. Facts are the numeric values in a relational database
that are available to analyze. In an OLAP Query, they are
called measures.
facts/values The data that is being visually represented,
usually a numeric amount (for example, $15,000)
file server A computer and storage device dedicated to
storing files.
filter (Relational) Constraints placed on topic items or
request line items to filter them to a certain set of values.
Filters appear on the Filter Line in Interactive Reporting.
For example, although the database may display worldwide
sales figures for all stores, you may only want to see sales
for stores in Germany. Filters make data sets retrieved
through a query more efficient and manageable by filtering
out unnecessary information.
filters (Multidimensional) Filters enable you to define and
apply filters to the query once Top or Side Labels have been
added to the query. You set a filter by applying comparison
operators on the values for a specific member. Additional
server-specific functions are available based on the selected
OLAP database cube. Filters are built to include or exclude
data according to specific criteria. Filters can be set on any
level in a dimension. However, they must be one of the
labels in the Outliner. Filters can be made of members of
one of the dimensions or selected by a measure. OLE DB
for OLAP has other filter operator types (Top N, Top Sum,
Top N %, Bottom N, Bottom N %, Bottom Sum.)
Hyperion System 9 BI + Analytic Services™ and
MetaCube have their own operator types. In Hyperion
System 9 BI + Analytic Services and MetaCube, filters can
be done on measures. In OLE DB for OLAP, filters cannot
be placed on measures.
foreign key A database column or set of columns
included in the definition of a referential integrity
constraint.
fully additive measure Attributes in a table that can have
their values added together across any dimension.
grain The level of detail at which measures in a table are
recorded is referred to as the grain.
grouping columns This feature, in the Results and Table
sections, creates a new column in a dataset by grouping
data from an already existing column. Grouping columns
consolidate nonnumeric data values into more general
group values and map the group values to a new column in
the dataset.
hardwire mode In hardwire mode whenever the OLAP
Query is changed, the database is queried to fetch new
cube data. In contrast, process mode is manually
controlled. You add or remove several items to the
Outliner, and then press Process to query the database.
When determining whether to use hardwire mode or
process mode, consider the size of the cube in which you
are working.
hierarchy In an OLAP database cube, a hierarchy
organizes a dimension’s levels and corresponding members
into parent and child relationships. For the levels in a
Location dimension, the hierarchy would have Country as
the parent of the child City and City as the parent of the
child Address.

Glossary 137
A B C D E F G H I J K L M N O P Q R S T U V W X Y Z
home Abstract base interface that some Lightning
interfaces derive from. Provides basic methods to
manipulate and create Bean objects.
HTML See Hypertext Markup Language.
Hypertext Markup Language A programming language
used to create World Wide Web pages, with hyperlinks and
tags that explain how to format the information on the
screen.
icon view Shrinks a selected topic to an icon in the
Content pane. The topic remains part of the data model,
but is deactivated and can not be accessed by the query.
Associated items are removed from the Request line when
a topic is made into an icon, and the topic is not
recognized as joined to other topics. Icon view is helpful in
restricting the use of server time when a topic is
infrequently used, and does not have to be active at all
times.
imported Files Excel, Text, or CSV files imported into
Interactive Reporting. The information in the file goes into
a table or a results object. Imported results can be used in
other queries (like regular results) for local join purposes.
Indexes Indexes are created in a database to increase the
performance of data retrieval. Just as book indexes help to
locate specific information faster, database indexes provide
a faster access path to table data. Indexes are created on
one or more columns of a table.
integrity constraints Constraints on tables that guarantee
the data adheres to certain business rules. Integrity
constraints are defined with a table and are stored as part
of the table definition, central to the database data
dictionary, so that all database applications adhere to the
same set of rules.
internal function Built-in formulas, defined in the
Interactive Reporting application.
interactive reporting database connection file
Encapsulate and store connection information used to
connect Hyperion applications to a database. Interactive
Reporting Database Connection file specify the database
API (ODBC, SQL*Net, etc.), database software, the
network address of the database server, and your database
user name. Once created, a user can specify the Interactive
Reporting Database Connection file and database
password and logon. An Interactive Reporting Database
connection file is required for a Interactive Reporting
document to use a database. the file extension is .oce.
Interactive Reporting Repository A specific group of
tables created using Interactive Reporting on a database
server and used to store Interactive Reporting document
objects, including data models and standard queries.
Administrators can use the Designer client to upload these
objects to the repository for end-users to download,
providing a template for query and report building.
Documents built from repository objects can be version-
controlled or audited through a link to the repository.
internet A global network connecting millions of
computers. Unlike online services, which are centrally
controlled, the Internet is decentralized by design. Each
Internet computer, called a host, is independent.
interval Equal subdivisions within a given scale. The
interval can be set manually or to best fit.
intranet A network belonging to an organization, usually
a corporation, accessible only by organization members,
employees or other authorization users. Intranet Web sites
look and act just like any other Web site, but the firewall
surrounding an intranet fends off unauthorized access.
ISAPI This is a shared library that implements HTTP
using Microsoft’s Web server plug-in API (ISAPI). Thus it
is appropriate for customers with Microsoft Web servers.
Functionally it is equivalent to our CGI. Its advantage is
that it is far more scalable than a CGI executable.
item A visual representation of a database column that is
a member of a topic in the Query section. Items are used to
create queries and reports. For example, the Customer
Topic may have items including Name, Address, and
Phone. You select items from data model topics to build
the Request, Filter, and Sort lines in the query section.
138 Glossary
A B C D E F G H I J K L M N O P Q R S T U V W X Y Z
JavaScript The scripting language for Interactive
Reporting products. Interactive Reporting 8.0 include the
Netscape JavaScript interpreter (version 1.4). JavaScript
and Dashboard’s Object Model allow application
developers to use the full functionality of the industry-
standard scripting language to control Interactive
Reporting applications.
job repository A set of database tables that store a queue
of scheduled jobs. There can be multiple job repositories in
an organization.
join A relational database concept indicating a link
between two topics. A join typically occurs between
identical or similar items within different topics. Joins
allow row records in different tables to be linked on the
basis of shared information in a column field. For example,
a row record in the Customer table is joined to a related
record in the Orders table when the Customer ID value for
the record is the same in each table. This allows the order
record to be linked with the record of the customer who
placed the order. If you request items from unjoined
topics, the database server has no way to correlate the
information between the two tables and leads to awkward
datasets and run-on queries.
Interactive Reporting display joins visually in the
workspace between topics to indicate joins between
database tables. Users can also create new joins that are not
already specified in the database.
join path A predetermined join configuration for a data
model. Administrators create join paths for users to select
the type of data model needed in a user-friendly prompt
upon processing a query. Join paths ensure that the correct
tables in a complex data model are used in a query.
JRE (Java Runtime Environment) This is the Java
interpreter used to run the Java Server.
legend box An informative box containing color-keyed
labels to identify the data categories of a given dimension.
layer Stacks a single object in relative position (sends
back and front, or brings forward or backward) to other
objects.
level Similar types of members in an OLAP database cube
are grouped at the same level. For example, using the
members listed in a Location dimension, France, the USA,
and Japan belong to the Country level. Paris, Palo Alto,
and Tokyo belong to the City level. 35 Main Street belongs
to the Address level.
limit joins Joins between a database table and a local
results object. The topic item being joined is limited by the
values of the column being joined in of the local results
object. A limit join is one of the options that you can
choose in a Modify Join operation between a topic item
and a local results item.
linked data model Documents that are linked to a master
copy in a repository. When changes are made to the
master, users are automatically updated with the changes
when they connect their duplicate copy to the database.
local computed meta topic items Computed item
definitions evaluated by the Interactive Reporting results
engine. Local computed items are created to be meta topic
items. They can be dragged to the request line like regular
topic items. The only difference is that the results engine
evaluates these items as opposed to the database.
local joins A join between a local results object and a
database table or another local results object. Interactive
Reporting perform the actual join in this case.
local filters filters placed on the local dataset in the Results
section, as opposed to the Query section. Filters in the
Query section restrict the data retrieved by the query to the
desktop. Local filters screen data from view in the Results
set; although it is still there, you cannot see the data that
has been excluded or use it in reports unless the filter is
removed.
local Results Results of other queries within the same
data model. These results can be dragged into the data
model to be used in local joins. Local results are displayed
in the catalog when requested.
locked data model Data Models that are locked cannot be
modified by a user.
Manager See Server.
Glossary 139
A B C D E F G H I J K L M N O P Q R S T U V W X Y Z
master data model A Data Model that exists
independently and has multiple queries that reference it as
a source. When using a master data model, the text
“Locked Data Model” appears in the Content pane of the
Query section. This means that the data model is linked to
the master data model displayed in the Data Model
section, which may be hidden by an administrator.
MDX (Multi Dimensional eXpression) The language used
to give instructions to OLE DB for OLAP- compliant
databases (MS Plato), as SQL is the language used for
relational databases. When you build the OLAPQuery
section’s Outliner, Interactive Reporting translate your
requests into MDX instructions. When you process the
query, MDX is sent to the database server. The server
returns a collection of records to your desktop that answer
your query. See SQL.
measures Numeric values in an OLAP database cube that
are available for analysis. Measures may be margin, cost of
goods sold, unit sales, budget amount, and so on. See
Facts.
members In an OLAP database cube, members are the
content values for a dimension. In the location dimension,
they could be Palo Alto, Paris, Tokyo, 35 Main Street, USA,
France, Japan, and so on. These are all member values for
the location dimension.
metatopic A customized, virtual topic, built from regular
topics that reflects the exact topic and item structure of
database tables. Metatopics allow items from disparate
topics to be consolidated in a single topic, simplifying its
appearance and reducing its conceptual resemblance to the
underlying database structure. You can choose to view a
data model in terms of its original topics, metatopics, or a
combination of both.
metadata Data about data. Stored in database tables,
metadata describes the history, content, and function of
database tables, columns and joins in understandable
business terms. Metadata can overcome the awkward
names or ambiguous abbreviations often used in a
database. For example, in a table named CUST_OLD,
metadata may use a descriptive business name, such as
Inactive Customers.
mime type A browser mapping of a file type to either a
helper application or a plug-in. When a browser attempts
to open a file of a particular mime type, it either loads the
associated plug-in or launches the associated helper
application. A file’s mime type is determined either by a)
the file extension or b) the HTTP header. Plug-ins tell
browsers what mime types they support and what file
extensions correspond to that mime type.
Hyperion’s web based products support the following
mime types: application/x-brioquery mime type (for .bqy
files). This is the default mime type our web based
products support and are ordinary Hyperion files.
application/x-brioquerydata (for .bqd files). These are data
files in text or Excel format, whose extension has been
changed to .bqd. When a Hyperion Web client is launched
to open a BQD file, it imports the data and executes any
Interactive Reporting Studio or Interactive Reporting Web
Client script or JavaScript the file contains.
morphing Mechanism by which Hyperion’s web based
products provide document security.
multidimensional database A database that stores data in
a format often referred to as a cube, such Hyperion System
9 BI + Analytic Services, MS OLAP, MetaCube, and so on.
See also Relational database and OLAP database.
nonadditive measure Attributes in a table that cannot be
added across any dimension, such as a percentage value
(for example, margin rate).
NSAPI A shared library that implements HTTP using
Netscape’s Web server plug-in API (NSAPI). It is
equivalent to our CGI. Its advantage is that it is far more
scalable than a CGI executable.
Nesting Nesting means that one set of data values appears
as a sub-division within each of the data values at a higher
level of data. For example in the Pivot section, if you place
more than one data label in an Outliner panel, the Pivot
report displays the second set of labels inside each of the
labels of the first data items. The second labels are nested
within the first. This means they represent sub-divisions
with another "higher level" category.
null value A null value is absent of data. Null values are
not equal to zero.
OCE See interactive reporting database connection file.
Glossary 140
A B C D E F G H I J K L M N O P Q R S T U V W X Y Z
OCE Wizard Wizard or set of screens used to create a new
OCE or modify an existing OCE.
OLAP database A database that stores its information in
cubes. Cubes contain dimensions and measures. A cube
can have dozens of dimensions. Cubes are built to hold
aggregated data, which anticipate how users think about
business models. Cubes deliver this information efficiently
and quickly.
OLAPQuery section Analyzes and interacts with data
stored in an OLAP cube. When you use Interactive
Reporting to connect to an OLAP cube, the document
immediately opens an OLAPQuery section. The
OLAPQuery section displays the structure of the cube as a
hierarchical tree in the Catalog pane. Queries are built by
dragging measures and dimension levels or members
directly into the Outliner panes.
OOA Object Oriented Analysis.
OOA&D Object-Oriented Analysis & Design.
IOpen Client DBLib API to connect to Sybase, Redbrick,
SQL Server, and so on.
Open Metadata Interpreter The Tables, Columns, Joins,
Lookups and Remarks tabs available in the connection
wizard when you edit a custom metadata source. These
tabs allow Hyperion administrators to specify a customer
source of metadata that can be accessed through SQL
statements, and provided to end users with data models.
Outliners Drag-and-drop command lines used in the
Pivot, Chart, OLAPQuery and Report sections. Each
Outliner pane corresponds to a specific layout element of
the report. When an item is dragged to an Outliner pane,
the item assumes the layout attributes of the respective
report element. Data appears simultaneously in the
Content pane with the appropriate formatting.
pivot dimension row or column of labels that
corresponds to an item in the Catalog pane.
Pivot section The section used to create crosstab reports
and analyze data.
pivot table Analytical tools that resemble spreadsheets or
crosstabular reports. A pivot table overlays a dynamic
datacube, which allows data to be sliced and diced for ad-
hoc, interactive, and multidimensional analysis.
pivoting In the Pivot section, the ability to change a label
from a top to a side (or a side to a top) orientation with a
simple click and swing of the label’s Dimension tab.
plot area The area bounded by the X-, Y-, and Z-axis. For
pie charts, it is the rectangular area immediately
surrounding the pie.
predefined drill paths Enables a user to drill directly to
the next level of detail, as defined in the data model.
primary key A database column or set of columns
included in the table definition of the PRIMARY KEY
constraint. Primary key values uniquely identify the rows
in a table. Only one primary key is defined per table.
query A set of database instructions to return an answer
set to a specific question. Each row returned in the Results
section of a document is an answer to the question posed
in the Query section.
query computed items Item definitions created by the
user. This can include other request line items or topic
items and or database functions. The definition is sent to
the database and the database evaluates them.
Query Log Log of all SQL statements sent to the database
(also referred to as SQL Log).
relational database A database that stores its information
in tables related or joined to each other by common pieces
of information called keys. Tables are subdivided into
column fields that contain related information. Column
fields have parents and children. For example, the
Customer table may have columns including Name,
Address, and ID number. Each table contains row records
that describe information about a singular entity, object,
or event, such as a person, product, or transaction. Row
records are segmented by column fields. Rows contain the
data that you retrieve from the database. Database tables
are linked by Joins. (See also join)
report Group In the report section, embedded reports
and tables are grouped by other data items. Items placed in
the Groups Outliner break information into these
dimensional groupings. For example, your table may
include the name, contact information, and sales for each
of your distributors. This table gains in clarity when
broken into groupings that classify the stores by
geographical region, year, or both.
Glossary 141
A B C D E F G H I J K L M N O P Q R S T U V W X Y Z
Report section A dynamic, analytical report writer, that
provides users with complex report layouts and easy to use
report building tools. Pivot tables, tables, and charts can be
embedded in a report. The report structure is divided into
group headers and body areas, with each body area
containing a table of data. Tables are created with
dimension columns and fact columns. These tables are
elastic structures. Multiple tables can be ported into each
band, each originating from the same or different result
sets.
repository Central location used to store data models,
queries and queries with reports. Repository is usually a
database chosen by the user.
Request Line Holds the list of items requested from the
database server and that will appear in the user’s results.
Request Line items Columns listed in the request line.
Results section A section in an Interactive Reporting
document that contains the dataset derived from a query.
Data is massaged in the Results section for use in the
report sections.
run mode A toggled environment used to test Dashboard
sections. It simulates a Navigator user’s view of the section.
In Run mode, you can not add any features, but you can
use features that are part of the deployed Dashboard
sections. See also Dashboard and design mode.
scalar function Scalar functions (in contrast to data
functions) do not aggregate data or compute aggregate
statistics. Instead, scalar functions compute and substitute
a new data value for each value associated with a data item.
scale The range of values that allow you to gauge how
much each category represents. This range can be either at
equal intervals or at logarithmic interval. The scale can be
set manually or to best fit.
script A series of instructions for a computer. Scripts are
activated when an event occurs, such as clicking a button
or selecting an item from a drop down list. Interactive
Reporting’s scripting language is JavaScript.
Section pane Lists all the sections that are available in the
current Interactive Reporting document.
Section Title Bar A navigational aid under the toolbars
that provides a means of moving between sections and
toggling section-specific tools and gadgets, such as the
outliner.
semiadditive measure Attributes in a table that can be
summarized across some dimensions, but not all.
server computed meta topic items Metatopic item
definitions created by the user. These items can use any of
the database functions available, or any of the other topic
items in the data model. These items are evaluated by the
database.
Session Socket (DaSessionSocket) Abstracts session
information specific to each database or API.
simple join Retrieves rows to create a query where the
values in joined columns match.
slicer An axis that filters the data in an OLAPQuery. Only
individual members can be used in a slicer. A slicer can be
thought of as a third axis in a OLAP Query. The other axis
are the Side Labels and the Top Labels. Every dimension
folder contains a members subfolder named “Values
for…” that dimension. This subfolder contains the
members that are eligible for the slicer.
snapshot A a local (readonly) copy of table data that
originates from one or more remote master tables.
spring A tool which allows you to maintain O relative
vertical spacing between dynamic
objects. That is, you can "spring" one object to another so
that if the first object is moved, increased or diminished,
the second object moves in the same flow.
sort Conditions placed on request line items to sort the
results in ascending or descending order. These are
displayed in the sort line in an Interactive Reporting.
SQL See Structured Query Language.
SQL Net Oracle’s native API to connect to an Oracle
database.
stacked charts A chart where the categories are viewed on
top of one another for visual comparison. This type of
chart is useful for subcategorizing within the current
category. Stacking can be used from the Y- and Z-axis in all
chart types except pie and line. When stacking charts the
Z-axis is used as the Fact/Values axis.
Stored Procedure Precoded queries in languages other
than SQL. This is a feature available in some database
software. Interactive Reporting can run stored procedures
and retrieve the Results.
Glossary 142
A B C D E F G H I J K L M N O P Q R S T U V W X Y Z
Structure View A view that displays a topic as a list of
component items allowing users to see and quickly select
individual data items. Structure view is the default view
setting.
Structured Query Language The language used to give
instructions to relational databases. When you build the
query section’s Request, Filter, and Sort lines, Interactive
Reporting translate your requests into SQL instructions.
When you process the query, the SQL instructions are sent
to the database server. The server returns a collection of
records to your desktop that answers your query. This
reply is displayed as the Results section. You can look at the
SQL generated by a query in the Query Log, or code a
query directly in SQL using the Custom SQL window.
subquery A query embedded within another query.
surface values A setting in the Pivot section to base
aggregate calculations on the values in the report, rather
than the values in the Results section.
synonym An alias for a database table or view. It is a
direct reference to a table view.
table The basic unit of data storage in a database.
Database tables hold all of the user-accessible data. Table
data is stored in rows and columns.
Table Catalog Displays tables, views, and synonyms to
which users have access. Users drag tables from the Table
catalog to the Content pane to create data models in the
Query section.
Table section Used to create tabular-style reports. It is
identical in functionality to the Results section, including
grain level (table reports are not aggregated). Other
reports can stem from a Table section.
top and side labels In the Pivot section, labels are the
column and row headings on the top and sides of the pivot.
These define categories by which the numeric values are
organized.
topic A a visual representation of a database table in the
Content pane. Topics are part of data models displayed in
the Query section and can contain one or more items.
topic items Individual items in a topic or metatopic.
topics Visual representation of tables in the database,
related by joins that link certain items in each topic. Each
topic title bar displays the topic’s name. The topic shows a
list of items, one for each column in the database table.
underlying values Another name for Results values.
When Use Surface Values is disabled in a Pivot section,
aggregate calculations are based on values in the Results
section.
Union/Intersection/Minus Queries Queries created to
perform set operations such as Union, Intersection, and
Minus. These queries are created by the Append Query
option.
variable filters Filters that prompt users to enter or select
filter values before the queries are processed on the
database.
view A custom-tailored presentation of the data in one or
more database tables. Views do not actually contain or
store data; rather, they derive their data from the tables on
which they are based, referred to as the base tables of the
views.
web client A Web tool that delivers query, analysis, and
reporting functionality for intranet, Internet, or extranet
access to information. Based on user profiles or report-
level security, the client environment adapts in six stages
from full query, analysis, and reporting with data refresh to
static report viewing.
Weighted averages Weighted averages can also be used to
apply different levels of importance to a given item. To
calculate a weight you take the expected amount divided
by the actual amount.
World Wide Web (WWW) A system of Internet servers
that support specially formatted documents. The
documents are formatted in a language called HTML
(HyperText Markup Language) that supports links to
other documents, as well as graphics, audio, and video
files.
zoom Sets the magnification of a report. Sets the
magnification of the report. The report can be magnified
to fit the whole page, page width or a percentage of
magnification based on 100%.

Index Symbols 143
A B C D E F G H I J K L M N O P Q R S T U V W X Y Z
Index
Symbols.bmp, 20
Aactive document level, 78
adding
items to the request line, 92
joins, 91
topics to a data model section, 91
application level, 77
assignment operators
versus comparison operators, 68, 97
automation controller, OLE, 64
Bbackground and border properties, 25 to 28
BMP files, 20
boxes, 20
break statements
using, 61
browser, Object, 43
buttons
command, 20
radio, 20
bypassing
errors, 73, 101
Ccalling functions, 51
case-sensitive code, 68, 96
Catalog pane
in Design and Run modes, 19
Chart section, 81
check boxes
definition, 20
checking errors, Console window and, 44
code entry, 72, 101
code, case-sensitive, 68, 96
collection, definition, 38
command buttons
definition, 20
commands, EIS section, 35
commands, Help menu, xi
conditional statements, 55
conditional tests, 69, 97
connection files, scripting, 88
Console window, using to check errors, 44
constant, definition, 38
consulting services, xiii
Content toolbar, 121
continue statements
using, 60
control events, 119
control objects
events associated with, 119
list of, 20
controller, OLE automation, 64
controlling graphics and controls visibility, example, 87
controls
enabling and disabling, 87
converting detail reports, ?? to 90
creating
Dashboard sections, 18
OCEs (connection files), 88
variable limits, 92
Cutting Script, 43
144 Index D
A B C D E F G H I J K L M N O P Q R S T U V W X Y Z
DDashboard section
control objects, 20
creating, 18
default mode, 19
events, 41
graphic objects, 20
layout tools in, 32
menu commands, 35
properties, 31
renaming, 19
Dashboards, 17
data models, downloading, 90
default
mode, 19
defining functions, 50, 52
deleting
Dashboard sections, 19
objects, 21
Description pane, 44
design guides, 32
Design Guides command, 35
Design mode, 19
Design/Run Mode command, 35
designing scripts, 71, 100
Detail reports, converting, 88
disabling controls, 87
display differences, 89
displaying
connection login boxes, 88
rulers, 33
Table catalog, 91
values in text boxes, 86
do...while statements
using, 59
document level
active, 78
documents
conventions used, xii
feedback, xiv
documents, accessing
Hyperion Download Center, xi
Hyperion Solutions Web site, xi
Information Map, xi
online help, xi
downloading data models, 90
drop-down boxes
definition, 20
Eeducation services, xiii
EIS section
enabling and disabling controls, 87
object model map, 80
toolbar, 33
Embedded Pivot Section Interactivity, 30
embedding objects, 21
enabling controls, 87
entering code, 72, 101
errors
bypassing, 73, 101
checking using the Console window, 44
events, 39
example scripts, 87
Execution window, using to test scripts, 44
Export
to XLS, 122
exporting scripts, 66
Ffiles
BMP, 20
text, exporting scripts to, 66
Finding/Replacing Script, 44
for statements
using, 58
for...in statements
using, 62
functions
calling, 51
defining, 50
Ggetting
help with problem scripts, 73, 102
graphic objects
events associated with, 41
list of, 20
graphics and controls, controlling the visibility of, 87

Index H 145
A B C D E F G H I J K L M N O P Q R S T U V W X Y Z
graphics, inserting, 35
Grid command, 35
grids, 32
guides, design, 32
Hheaders, page, turning off, 93
Help menu commands, xi
help, online, 44
hierarchy, object model, 76
Home Dialog command, 35
horizontal lines, 20
Hyperion Consulting Services, xiii
Hyperion Download Center
accessing documents, xi
Hyperion Education Services, xiii
Hyperion product information, xiii
Hyperion support, xiii
Hyperion Technical Support, xiv
Iif statements, inline, 56
if...else statements
using, 55
including
limit values in URLs submitted to ODS, 93
inline if statements, 56
Insert Control command, 35
Insert Graphic command, 35
inserting
Dashboard sections, 18
EIS objects, 21
Intelligence Clients
scripting applications in, 50
Interactive Reporting object model See object model
JJavaScript
case-sensitivity, 68, 96
entering syntax, 72, 101
examples, 85
improving performance, 71, 99
manipulating objects with, 62
OLE automation controller within, 64
sample, 44
troubleshooting, 67, 95
JOOLE, 64
-jscriptcmd, 50
Llabeled statements, 60
using, 60
labels, text, 20
layout tools, 32
lines, 20
list box
definition, 20
loop statements, 58
Mmanipulating objects with JavaScript, 62
map, object model, 75
member, OLAP, 139
menu commands, EIS section, 35
methods
definition, 38
Microsoft automation interfaces, 64
models, data, downloading, 90
modes, switching between Design and Run, 19
MS Excel, 64
MS Outlook, 64
Nnaming Dashboard sections, 19
Navigation toolbar, 34
navigation, object model, 75
OObject browser, 43
object level events, 39 to 40, 119
object model
description pane, 44
hierarchy, 76
map, 75
Microsoft automation interfaces, 64
navigating, 75
online help, 44
terminology, 38
object properties
setting with JavaScript, 86
objects
146 Index P
A B C D E F G H I J K L M N O P Q R S T U V W X Y Z
control, 20
definition, 38
deleting, 21
embedding, 21
graphic, 20, 41
in Catalog pane, 19
inserting, 21
manipulating with JavaScript, 62
section, 19
OLAP, member, 139
OLAPQuery section, object model map, 83
OLE automation controller, 64
OnCellDoubleClick, 40
OnChange, 40
OnClick, 40
OnClientClick, 40
OnClientDoubleClick, 40
OnClientEnter, 40
OnClientExit, 40
OnDoubleClick, 40
OnEnter, 40
OnExit, 40
online help, 44
OnRowDoubleClick, 40
OnSelection, 40
ovals, 20
Ppage headers, turning off for first page in reports, 93
pictures, 20
Pivot section, object model map, 82
processing queries
using prompt for database logon, 93
Prompt To Save dialog box, turning off, 93
properties
background and border, 25 to 28
definition, 38
retrieving object, 86
setting Dashboard, 31
setting object, 86
Properties command, 35
QQuery section, object model map, 79
Rradio buttons
definition, 20
recalculating results, 71, 99
rectangles, 20
references
syntax, 70, 99
Remove Selected Items command, 35
renaming, Dashboard ections, 19
renaming,Dashboard sections, 19
Report section
object model map, 82
toolbar, 33
reports, turning off page headers for first page in, 93
Results section, object model map, 82
results, recalculating, 71, 99
retrieving object properties, 86
round rectangles, 20
rulers, 33
Rulers command, 35
Run mode, switching to, 19
Ssample scripts
Add a Computed Column to a Query Request line, 92
Add Items to The Request line, 92
Add Joins, 91
Add Topics to a Data Model Section, 91
Create an OCE, 88
Display a Table Catalog, 91
Setup Topic Objexts Variables, 91
Turn off page headers for the first page in the Reporter, 93
Using a BrioQuery 5.5 Limit Dialog Box andStoring Selected Value in Text Box, 93
script commands, launching, 50
Script Editor
Description pane, 70, 99
using, 42
scripting
applications, 50
Scripting pane, 43
scripting, finding and replacing, 44
Scripts command, 35
scripts, exporting to text files, 66
Index T 147
A B C D E F G H I J K L M N O P Q R S T U V W X Y Z
scripts, testing, Execution window and, 44
scripts, troubleshooting, 67
section level events, 41
section objects, 19
sections
Chart, 81
EIS, 80
Query, 79
setting
Dashboard properties, 31
object properties, 86
topic object variables, 91
space-saving variables, 67, 96
statements
break, 61
conditional, 55
continue, 60
do...while, 59
for, 58
for...in, 62
if...else, 55
inline if, 56
label, 60
loop, 58
switch, 57, 127
while, 59
with, 63
stopping a script, 56
switch statements
using, 57
switching between Design and Run modes, 19
syntax reference, 70, 99
TTable section, object model map, 83
technical support, xiv
testing scripts, Execution window and, 44
tests, conditional, 69, 97
text box, 20
text files, exporting scripts to, 66
text labels, 20
toolbar, Navigation, 34
tools, layout, 32
troubleshooting scripts, 67
turning off
page headers, 93
Prompt To Save dialog box, 93
Uunderstanding
functions, 50
Interactive object model, 38
Interactive Reporting events, 39
User Embedded HTML, 130
using
BrioQuery 5.5 Limit dialog box, 92
Console window, to check errors, 44
design tools, 32
Execution window, to test scripts, 44
JavaScript statements, 55
ODS user name as limit, 92
Script Editor, 42
Vvariables
space-saving, 67, 96
vertical lines, 20
Visual Basic, 64
Wwhile statements
using, 59
windows
Console, 44
Execution, 44
with statements
using, 63
working
with Dashboard objects, 19
with Dashboard sections, 18

148 Index W
A B C D E F G H I J K L M N O P Q R S T U V W X Y Z