i-cistarget: an integrative genomics method for the ... · pdf filei-cistarget: an integrative...
TRANSCRIPT

i-cisTarget: an integrative genomics method for theprediction of regulatory features and cis-regulatorymodulesCarl Herrmann1,2,*, Bram Van de Sande3, Delphine Potier1,3 and Stein Aerts3,*
1TAGC – Inserm U1090 and Aix-Marseille Universite, Campus de Luminy, 2Departement de Biologie,Campus de Luminy, Aix-Marseille Universite, 13288 Marseille, France and 3Laboratory of ComputationalBiology, Center for Human Genetics, University of Leuven, 3000, Leuven, Belgium
Received April 5, 2012; Revised May 10, 2012; Accepted May 13, 2012
ABSTRACT
The field of regulatory genomics today is charac-terized by the generation of high-throughput datasets that capture genome-wide transcription factor(TF) binding, histone modifications, or DNAseIhypersensitive regions across many cell types andconditions. In this context, a critical question is howto make optimal use of these publicly availabledatasets when studying transcriptional regulation.Here, we address this question in Drosophilamelanogaster for which a large number ofhigh-throughput regulatory datasets are available.We developed i-cisTarget (where the ‘i’ stands forintegrative), for the first time enabling the discoveryof different types of enriched ‘regulatory features’ ina set of co-regulated sequences in one analysis,being either TF motifs or ‘in vivo’ chromatinfeatures, or combinations thereof. We havevalidated our approach on 15 co-expressed genesets, 21 ChIP data sets, 628 curated gene sets andmultiple individual case studies, and show thatmeaningful regulatory features can be confidentlydiscovered; that bona fide enhancers can beidentified, both by in vivo events and by TF motifs;and that combinations of in vivo events andTF motifs further increase the performance ofenhancer prediction.
INTRODUCTION
Understanding the principles of transcriptional regulationremains one of the greatest challenges in functionalgenomics, despite years of intensive investigations.
Spectacular advances in experimental technologies, suchas ChIP-seq (1), FAIRE-seq (2) and RNA-seq (3)represent obvious breakthroughs in this field, as theyallow interrogating regulatory activity at the genome-widescale, and are becoming available to most research groups(4,5). However, interpretation of these genome-widedatasets, as well as their integration into a unified modelof cis-regulation that includes computational motif predic-tions remains challenging for many biologists, given theamount of information and the lack of appropriate tools.Two typical situations are often encountered in genomicsstudies. First, given a set of co-expressed genes, an imme-diate question is whether these genes share regulatorymotifs and, if so, which transcription factors (TFs) mayco-regulate these genes, or a significant subset thereof.Secondly, given a set of genomic loci identified throughDNase-Seq, FAIRE-seq, or ChIP-Seq, motif discoverycan be applied in a similar fashion as to co-expressedgene sets, with the aim to confirm the presence of thetargeted TF (for ChIP-seq against TFs), uncover novelco-factors, but also disentangle the noisy input set intodirect target regions of different TFs. Many tools havebeen developed in recent years to predict enriched motifsin a set of co-expressed genes [e.g. using proximalpromoter sequences such as Clover (6), oPOSSUM (7),PASTAA (8) and PSCAN (9); or to discover de novomotifs, such as oligo-analysis (10), MEME (11) andMotifSampler (12)]. With the increased use of ChIP-Seq,several of these methods have been adjusted to alsoanalyse ChIP peak datasets (e.g. oPOSSUM), andseveral new methods have appeared, such as peak-motifs(13) and MEME-ChIP (14).However, with the increasing amount of genome-wide
data being generated, another question could be whethersome previously identified events (such as DNA bindingor histone modifications through ChIP, or DNAse
*To whom correspondence should be addressed. Tel: +33 4 91 82 87 11; Fax: +33 4 91 82 87 01; Email: [email protected] may also be addressed to Stein Aerts. Tel: +32 16 33 07 10; Fax: +32 6 34 71 81; Email: [email protected]
The authors wish it to be known that, in their opinion, the first two authors should be regarded as joint First Authors.
Published online 20 June 2012 Nucleic Acids Research, 2012, Vol. 40, No. 15 e114doi:10.1093/nar/gks543
� The Author(s) 2012. Published by Oxford University Press.This is an Open Access article distributed under the terms of the Creative Commons Attribution Non-Commercial License (http://creativecommons.org/licenses/by-nc/3.0), which permits unrestricted non-commercial use, distribution, and reproduction in any medium, provided the original work is properly cited.

hypersensitive sites, collectively referred to as ‘in vivoevents’ or iVE in the rest of this article), possibly in adifferent biological context, are found enriched in ourset of genes or genomic loci. For example, one could askwhether genes found to be highly expressed during adifferentiation process through RNA-seq are enriched inChIP-seq peaks for a particular TF, identified in anindependent study; or, whether open chromatin regionsisolated using FAIRE-seq are enriched in particularhistone modifications, identified in ChIP-seq experiments.In addition, besides individual enriched motifs or iVEs, itoften appears that a particular combination of thesefeatures drives the activity of regulatory regions, as wasshown in many recent studies (15–17). Hence, whileenrichment in a particular motif indicates that a regionis potentially targeted by a TF, its combination with aparticular histone modification indicates that the regionsare actually active in the condition investigated. Giventheir coverage in terms of conditions investigated,large-scale consortia such as ENCODE (18), modEncode(4), or the Berkeley Drosophila Transcriptional NetworkProject (BDTNP) (19) provide a unique opportunity toaddress these questions. Hundreds of datasets,investigating histone modifications, chromatin states,chromatin-binding protein and TF-binding events formany cell-lines or developmental stages make it moreand more likely that an independent dataset willshow an enrichment for some features present in theselarge-scale repositories.Here we present a novel method, called i-cisTarget
(integrative cisTarget), with the aim to tackle these twochallenges: (i) identifying enriched regulatory features,as motifs or iVEs, in a set of co-expressed genes orrelated genomic loci; (ii) using these features to predictcis-regulatory modules (CRMs), either around the set ofgenes provided, or among the genomic loci submitted,and infer regulatory networks. We have implementedi-cisTarget for Drosophila, as a proof-of-concept, butalso because Drosophila is one of the mostly usedmulti-cellular model organisms to study transcriptionalregulation and the cis-regulatory code during develop-ment, given its relatively compact genome, the genetictools to manipulate gene regulatory networks, and its suit-ability for in vivo enhancer validations. Indeed, many ofthe CRM prediction methods based on TF motif cluster-ing and TF motif conservation have been originallydeveloped and validated in Drosophila, such as Cluster-Buster (20), SWAN (21), Stubb (22), StubbMS (23),Ahab (24), cisDecoder (25) and e-cisAnalyst (26). Ini-cisTarget we use an approach based on whole-genomerankings, combined with recovery statistics (27). Thisapproach has been proven to be very powerful for motifdiscovery, both in Drosophila (28,29) and in the humangenome (30,31). Here we modify this methodology tocalculate enrichment for iVEs, motif features, motifcombinations, iVE combinations and mixed motif/iVEcombinations (hence ‘regulatory features’ in general).Importantly, i-cisTarget allows for the analysis of bothgenomic loci (e.g. ChIP peak datasets) and co-expressedgene sets (e.g. from microarrays and RNA-Seq).
Methods that incorporate iVEs for CRM predictionhave been recently developed, such as CENTIPEDE(32), CHROMIA (33), PriorsEditor (34) orCRMDecoder (35) but these methods focus on genome-wide CRM prediction using user-selected ‘tracks’ withiVEs. CRMDecoder does extract enriched iVEs froma training set of CRMs, before applying these towhole-genome scoring (i.e. supervised CRM discovery),but this method is not designed to work on gene sets,nor does it use TF motifs to predict TF target CRMsand regulatory networks.
Given that CRM prediction is greatly aided by iVEs(36,37), a key challenge is to develop methods thatidentify the most informative iVEs using the results fromhigh-throughput experiments as input. In addition tofeature discovery, an important challenge is to use thesefeatures in the next step to identify direct target CRMs ofTFs and to map gene regulatory networks. In this article,we present a new method, called i-cisTarget, to tackle thischallenge. We first describe the methodology used ini-cisTarget, and then show the results of several large-scalevalidation experiments and its application to large bench-mark datasets that we assembled for this study, includingChIP data and co-expressed gene sets. We assess theperformance of i-cisTarget in terms of motif and iVEenrichment, the prediction of CRMs, and the predictionof target genes. Finally, we compare the features andthe performance of i-cisTarget to other availablecomputational methods for cis-regulatory sequenceanalysis.
MATERIALS AND METHODS
Partitioning the non-coding genome
Our analyses rely on a partition of the non-coding regionsof the genome into non-overlapping regions. Thispartitioning is based on the PhastCons score (38)(Supplementary Figure S1, black track). We use thePhastCons WIG files indicating, for each nucleotide ofthe genome, its PhastCons score between 0 and 1. Thisscore is averaged over a sliding window of 100 bp, andregions of at least 100 bp with an averaged PhastConsscore >0.1 are extracted. This yields a set of disjointregions (Supplementary Figure S1, orange track), withgaps between them. Suppose we have two regions ri andrj, and we call Gij the gap between them. We now extendthe regions ri and rj on both ends, up to the midpoint ofGij. The extended regions are now called Ri and Rj. Thefull set of {Ri} represents a partitioning of the wholegenome (Supplementary Figure S1, light orange track).Since we are interested in regulatory features outsidecoding regions, we now subtract all coding regions fromour set {Ri}; this subtracting is done at the nucleotidelevel, i.e. certain regions will be shortened, while othersfully included in coding regions will be fully removed(Supplementary Figure S1, yellow track). Additionally,regions containing a binding site for a class I insulatorare split at the binding site (Supplementary Figure S1,green track). The exon subtraction and insulator splittingmight produce small regions at the 50/30 edges of genes or
e114 Nucleic Acids Research, 2012, Vol. 40, No. 15 PAGE 2 OF 17

near insulator-binding sites; in order to avoid the presenceof these small regions, we scan all resulting regions andmerge regions <500 bp with surrounding regions until theresulting merged region is >500 bp. Note that we mergeregions with the smallest of its surrounding regions first.The complete procedure yields 136 353 regions (referred toas 136K regions) of average size 790 bp (median 751 bp)that cover the entire non-coding part of the Drosophilamelanogaster genome (Supplementary Figure S1, redtrack). Using all 900 CRMs and reporter constructs inthe RedFly 3.0 database, we determined that on average,85% of their sequence is covered by a single region of our136K partition. This proportion reaches 90% if we restrictthis analysis to the 103 CRMs referenced as ‘minimalCRMs’ in the database, i.e. those that have been experi-mentally shown to be of minimal size. In addition, themajority of these minimal CRMs (all except three) donot show insulator sites. Thus, the genomic regionscorrespond well to CRMs and candidate CRMs.
Scoring with position weight matrices
The entire 136K region collection is scored for thepresence of (conserved) homotypic clusters of bindingsites modelled by a position weight matrix (PWM) asdescribed previously (28). Briefly, Cluster-Buster (20) isused for the detection of these motif clusters. Cluster dis-covery is performed for the complete library of PWMs,resulting in a score-based ranking of the 136K regions foreach motif in the collection. To improve the specificity ofthe predicted motif clusters, sequence conservation is alsotaken into account. Orthologous regions in 11 relatedDrosophila species are scored for the presence of theseclusters, namely D. simulans, D. yakuba, D. virilis,D. erecta, D. pseudoobscura, D. persimilis, D. ananassae,D. sechellia, D. grimshawi, D. mojavensis and D. willistoni.To find the corresponding regions in these species, theUCSC liftOver procedure from the Kent tools suite (39)is used. LiftOver utilizes a pre-computed genome locationtransformation between different genome assemblies andspecies, using the chain files obtained from pair-wisewhole genome alignments (40). We allow for non-uniquemapping of a reference region to a related genome, takingonly the region with the highest motif score into accountfor the final integration.
Combining the rankings across species via order statis-tics (OS) culminates in a single ranking for each motif inthe collection. OS is a probabilistic method to evaluate theprobability (q-value) of observing a particular configur-ation of ranks across the different related species bychance (41,42). This results in a q-value for each regionbased on the species specific ranks and thus effectivelyintegrates all comparative genomics information in asingle ranking for each PWM in our library, therebyallowing for motif movement within each region.
Scoring with iVEs
The definition of regions bound by TFs or marked byhistone modifications from ChIP data depends on thepeak calling algorithm used; many have been defined,but their level of agreement depend on the type of data
considered, and the validity of the control model used.In order to remain as unbiased as possible, we decidedto rely on continuous normalized density distributions(reads or tilling array intensities) rather than discrete inter-vals to score genomic regions. Normalized density distri-butions for ChIP-seq and ChIP–chip data are downloadedfrom the modEncode, BDTNP and Furlong Lab websitein .wig or .sgr format, and converted to BedGraph format(note that this conversion is merely a format conversion,and does not correspond to a definition of ChIP peaks);each of the 136K regions is intersected with each of thesecontinuous density profiles for each iVE using theBedTools (43), and the average per base score for eachregion and each profile is computed. Based on this scorean overall ranking of all regions in the non-coding genomeis derived. In this way, a collection of 420 iVEs wascompiled (see main text, Supplementary Table S1 andSupplementary Materials and Methods section).
Mapping gene signatures and ChIP peak locations tothe genome partitioning
For each D. melanogaster gene annotated in FlyBaserelease 5.37, a candidate regulatory region was defined.Based on these regulatory regions associated witha gene, the corresponding regions of the 136K genomepartition are obtained using BedTools (43). By defaultthis regulatory region is composed of the 5-kb upstreamregion, limited by the nearest upstream gene, the 50-UTRand the first intron. We do not consider coding exons ofinput genes (genes in the co-expressed gene set) to be can-didate CRMs, therefore coding exons that reside in theseputative regulatory regions are removed. Indeed, to ourknowledge the known enhancers that overlap with codingexons are located in neighbouring genes, and not inthe transcribed gene itself (44). We refer to a particulardefinition of candidate regulatory regions for a gene as ademarcation. Multiple other demarcations wereassembled; including a demarcation defined not onlybased on the 5-kb upstream region, but extended withthe full transcript of a gene excluding the coding exons.In addition, a demarcation that extends the aforemen-tioned demarcation by a 5-kb downstream region limitedby the nearest downstream gene and a demarcation thatcombines a 10-kb upstream region with the full transcriptand the 10-kb downstream region were also created.All these demarcations are available via the web interfaceand the effect on the performance was investigated on abenchmark of genesets (Supplementary Figure S2). For allthe analyses performed in this article, we used demarca-tions based on the Release 5.12 (October 2008) FlyBasegene annotation. These candidate regulatory regions areinitially determined for genes annotated with FBgn iden-tifiers. Via conversion tables available from FlyBase thatmap between different gene nomenclatures, demarcationsfor genes defined by annotation IDs (i.e. CG numbers)and symbols were also derived, enabling the analysis ofgene signatures supplied in these different gene nomencla-tures. To determine the regions of the genome partitionthat correspond to an input set of ChIP peak genomiclocations, we use BedTools. Only the regions that have
PAGE 3 OF 17 Nucleic Acids Research, 2012, Vol. 40, No. 15 e114

a minimal overlap of 40% with a ChIP peak or acandidate regulatory region are retained. The overlapfraction is defined as the number of nucleotides thatoverlap between region and ChIP peak or regulatoryregion divided by the number of nucleotides in thegenome partition region.
Enrichment analysis via cumulative recovery curves
Enrichment is calculated using cumulative recovery curvesas described before (28). Briefly, given a set of candidate(or ‘foreground’) regions, corresponding to the regulatoryregions associated with a set of co-expressed genes or withthe genomic locations of a collection of ChIP peaks, thosefeatures are identified for which the top fraction oftheir associated 136K regions ranking is enriched forthese candidate regions. To this end, the recovery ofthese regions based on the ranking associated with eachfeature in our collection is assessed by calculating the cu-mulative recovery of these regions with increasing regionrank. Of special interest is the early retrieval of foregroundregions, therefore the area under the curve (AUC) for thetop ranked regions is used as a metric to quantify theenrichment of these regions at the top of a ranking.The threshold that defines the ‘top’ is a parameter forthe user and is set at 1% by default.The distribution of this AUC metric for all features
provides a method to define exceptionally goodrecovery, as the normalized enrichment score [NES=(AUC�AUCmean)/AUCstd)]. The NES is computedfor each feature, and only features associated with arecovery above a certain threshold are considered asenriched features. In the online i-cisTarget application,the threshold can be chosen by the user, and is set toNES� 2.5 by default. In the analysis of ChIP peak datasets, the motif signal is usually much stronger than inco-expressed gene sets, allowing for a more stringentsetting of the threshold for ChIP (e.g. NES� 4) toincrease the specificity. Because features compiled fromdifferent sources may have different AUC distributions,we group these features in different databases. Thisallows for database-specific enrichment analysis. Notethat the calculation of the feature rankings is performedonly once and reused for multiple recovery analyses ondifferent region sets. This effectively reduces the compu-tational burden for the calculation of recovery curves,making i-cisTarget an on-the-fly analysis tool.
Validation of motif feature enrichment
To assess the performance of i-cisTarget several bench-marks were created for which the responsible motif(or multiple motifs) for each gene signature and ChIPpeak set in the benchmark is known, i.e. 15 gene signa-tures curated from the literature and 40 ChIP datasets(see ‘Results’ and ‘Discussion’ section). To compensatefor the redundancy in the large PWM collection used byi-cisTarget, the enriched features for each benchmark setare clustered via STAMP (see section on PWM libraryand motif clustering in the Supplementary Materials andMethods) and the enriched cluster of motifs are rankedbased on their best ranked motif. The metric used to
quantify the performance of i-cisTarget is the best,i.e. lowest, rank of the motif cluster that contains atleast one known motif.
Candidate enhancer prediction
i-cisTarget not only predicts the features enriched in a setof co-regulated genes or ChIP peaks. Using the recoverycurve for an enriched feature, a list of candidate enhancersfor that feature is also provided. These candidate enhan-cers are defined as a subset of the ‘foreground’ regions,i.e. the fraction of the 136K regions that map to theChIP peaks or the putative regulatory regions associatedwith the set of co-regulated genes. More precisely, themaximum deviation of the recovery curve associatedwith an enriched feature from the average recovery overthe entire feature database plus two standard deviations istaken as a threshold on the foreground regions, rankedbased on the 136K regions ranking linked with thatparticular feature. Additionally, the enhancers that arenot part of the foreground set but are nonetheless highlyranked for an enriched feature can also be retrieved.This extends the set of predicted target enhancersbeyond the initial foreground set.
Fine-tuning the analysis by combining enriched features
The ranking-based framework allows for the creationof new features based on existing ones. Because everyavailable feature is represented as a ranking ofnon-overlapping regions covering the completenon-coding genome of Drosophila, they can be combinedvia OS (see section on Scoring with PWMs). From a subsetof the enriched in vivo and motif features in a i-cisTargetanalysis new combinations can be created, either aspairwise combinations, or by collapsing more than twofeatures into a single feature. These newly createdfeatures can be assigned to any feature database usedin the initial analysis for assessment of their enrichment.
Validation of candidate enhancer prediction
To validate the enhancers predicted by i-cisTarget, wecalculate the positive predictive value (PPV, also referredto as precision) and true positive rate (TPR, also calledsensitivity or recall) based on a set of known true enhan-cers. True enhancers are defined as the subset of the 136Kregions that overlap with the true binding regions fora TF, which are derived from a ChIP based in vivo assayor from a database compiling known CRMs such as theRedFly database.
These metrics can be summarized in the F1 measure,the harmonic mean of PPV and TPR: F1-measure=2* [(TPR*PPV)/(TPR+PPV)]. A perfect prediction,i.e. only true enhancers are discovered and also all ofthem, corresponds to a value of 1. If all predictedenhancers are unknown, the F1-measure is 0.
Prediction of HSF and Mef2-binding sites
For HSF, we used the binding locations determined in (44)consisting of 708 unbound HSF motifs. For MEF2, wepredicted TFBS using the available MEF2 in TRANSAC
e114 Nucleic Acids Research, 2012, Vol. 40, No. 15 PAGE 4 OF 17

(V$MEF2_02, V$MEF2_03) using Matrix-Scan from theRSA-tools suite (45). We used a threshold of 9 on theTFBS score, and removed all sites that overlap a MEF2ChIP–chip peak within 100 bp, resulting in 4557 predicted,unbound MEF2 sites.
Comparison with other tools
The Linux executable was downloaded and installedfor CRMDecoder (35); 370 bed files where downloadedfrom (i) the modEncode website and (ii) the BDTNPwebsite (DNAseI hypersensitive sites only).
Availability
i-cisTarget is available via an easy to use web interface(http://med.kuleuven.be/lcb/i-cisTarget), providing accessto a ‘version 1.0’ database of 4238 motif features and the420 iVEs used in this article, and to an updated ‘version2.0’ database with 6383 PWMs and 536 iVEs. All types ofanalysis can be performed via this interface, includingcombining enriched features, using the optimal targets ofan enriched feature as input set for another analysis (seriali-cisTarget analysis), and retrieving genome-wide CRMpredictions. Additionally, a UCSC custom track with
the predicted motifs and CRMs for enriched PWMfeatures can be calculated.
Supplementary materials and methods
The Supplementary Materials and Methods containfurther information about: Collections of motifs andiVEs used; PWM library and motif clustering; supportfor both gene signatures and genomic loci; extending lessabundant feature databases for enrichment analysis;Combining gene sets and genomic loci for validationpurposes; and Analysis of FlyBase TermLink sets.
RESULTS
A new genome-wide scoring and enrichment scheme
Figure 1 shows the components of i-cisTarget. The userinput to i-cisTarget is a set of gene identifiers, for examplea set of co-expressed genes, or a set of genomic loci(e.g. ChIP peaks) in a bed file. The output is a list ofenriched features, either motifs or iVEs, and for each ofthese features, a list of highly enriched regions for thisparticular feature, representing potential CRMs. Theinput set is mapped to a database of 136353 predefined
Figure 1. Flowchart of i-cisTarget. The 136K regions are scored in batch (i.e. offline) with collections of PWMs and iVEs, yielding PWM and iVErankings respectively. An input set of genes or genomic loci is mapped to the 136K set to obtain a set of foreground sequences. The enrichment ofthe foreground sequences is calculated in all rankings using recovery curves and statistics. Top ranking regions for enriched features representcandidate CRMs.
PAGE 5 OF 17 Nucleic Acids Research, 2012, Vol. 40, No. 15 e114

genomic regions—called the 136K set—that covers theentire non-coding genome (see ‘Materials and Methods’section Partitioning the non coding genome andSupplementary Figure S1). The subset of genomicregions that overlaps with the input set determines theforeground set (see ‘Materials and Methods’ sectionMapping gene signatures and Supplementary Figure S3for details on how the optimal overlap is determined).Next, the enrichment of the foreground set for regulatoryfeatures is tested, relative to the entire 136K set. To allowfor complex scoring methods including Hidden MarkovModels, for cross-species conservation of motif occur-rences, and for including thousands of features, we haveseparated the actual scoring and ranking of the 136K setfrom the enrichment calculation (Figure 1). Offline, the136K set is scored for clustered and conserved occurrencesof motifs, using thousands of PWMs and for average peakintensities using hundreds of iVE data sets (Table 1,Supplementary Table S1 and Supplementary Materialsand Methods). Online, we determine the AUC of thecumulative recovery curve of the candidate regions alongthe ranked list of all 136K regions (see ‘Materials andMethods’ section Enrichment via cumulative recoverycurves), and convert the AUC scores into normalizedenrichment scores (NES) (see Supplementary Figure S4for an example analysis). We observed that differentfeature types can result in different AUC distributions,and therefore use as a default setting in i-cisTarget tonormalize the AUC scores separately for each featurecollection. This way, the NES scores become comparable,and different feature types can be presented in one outputtable (Supplementary Figure S4).
Identification of regulators and functional regionson datasets of genomic loci
We have applied i-cisTarget to several ChIP–chip andChIP-Seq experiments (Supplementary Table S1).
We have first evaluated the ability of i-cisTarget to findenrichment for the expected motifs, on a collection ofChIP datasets for which the targeted TF is known: 25ChIP-seq datasets for 22 TFs from the BDTNP consor-tium, 15 ChIP–chip dataset for five TFs from E. Furlong’slab (46), and one additional ChIP-seq dataset fromGuertin et al. (44). These sets are tested for motifenrichment using version 1.0 of the PWM library(Table 1).
For the BDTNP dataset, i-cisTarget can identify thecorrect motif in 18 out of the 25 cases (the TF MED ischipped at three different stages and HB at two differentstages), and in 11out of 25 cases this motif is among thethree top motifs (Figure 2A, see section Validation of motiffeature enrichment in ‘Material and Methods’ section forthe details). For the Daughterless dataset, the motif isfound with a NES of 3.9, which is just below our stringentthreshold of 4. The more difficult cases are D, DL, GT,MED, TLL and BAP, for which the expected motif is notfound as significantly enriched. De novo motif discoveryalso fails to find these motifs, indicating that these datasetsthe expected motif is indeed not enriched among theseChIP peaks (data not shown). For the mesodermaldataset, which contains ChIP–chip results for MEF2,BIN, BAP, TIN and TWI, the correct motif is amongthe top three scoring motifs in all cases, except for theMEF2_4h-6h and the BAP datasets. Finally, weconfirmed the good performances in motif-enrichmenton the ChIP-seq dataset of Guertin et al. (44), consistingof 422 regions bound by heat-shock factor (HSF) in S2cells, in which the HSF motif (M01244-V-HSF2_02, firstmotif) reaches an impressive NES of 26.1. The heatmapthus highlights the high sensitivity of our motif enrichmentapproach, as well as its specificity, given that most cellsare empty in the heatmap, except for some knownco-factors: Bagpipe and Biniou in the visceral mesoderm(47); or Knirps and Hunchback in the blastoderm (19).Furthermore, the NES score not only provides a qualita-tive indication of possible binding of the correspondingTF, but it also provides quantitative information on theamount of binding, as can be seen on the example of theZelda motif. The 15 mesodermal datasets have variousNES scores which seem to be higher for early datasets.Using a published ChIP-seq dataset on Zelda (48), weshow that the amount a actual overlap of Zelda-bindingevents with the 15 mesodermal datasets is highlycorrelated to the NES score of the correspondingZelda motif (Supplementary Figure S5).
We next turned to iVE enrichment. We used as a firsttest the same HSF dataset mentioned previously (44), anda control set of 708 control regions that contain predictedHSF-binding sites but with no evidence of HSF binding inthe ChIP data, taken from (44). Running i-cisTargeton both datasets using PWMs and iVEs yields the HSFmotif as the feature with the highest NES in both datasets(respectively 26.1 and 23). This comes as no surprise, giventhat the control set was based on the presence of a highaffinity TFBS. Therefore, the motif alone cannot distin-guish bound from unbound regions. Turning to iVEs,19 have a NES> 4 in the bound set, versus 6 in theunbound control dataset (Figure 2B). Among the
Table 1. Available features in i-cisTargeta
Version 1.0(used in the text)
Version 2.0(available online)
Motifs 3731 PWMs: 6383 PWMs:1. JASPAR (74) Updated databases used2. TRANSFAC (78) in version 1.0+3. FlyFactorSurvey (77) 1. YeTFaSCo (82)4. Tiffin (75) 2. hPDI (81)5. Elemento et al. (76)6. Stark et al. (79)7. SelexConsensus (75)
In vivoevents
420 iVEs: 536 iVEs:1. modENCODE (4) Updated databases used in2. BDTNP (80) version 1.0, now categorized as:3. Furlong laboratory
(46)1. TF binding
(109 data sets)4. chromatin states (4) 2. non-TF-binding
(216 data sets)3. histone modifications
(211 data sets).
aComplete description of the available features can be found inSupplementary Materials and Methods.
e114 Nucleic Acids Research, 2012, Vol. 40, No. 15 PAGE 6 OF 17
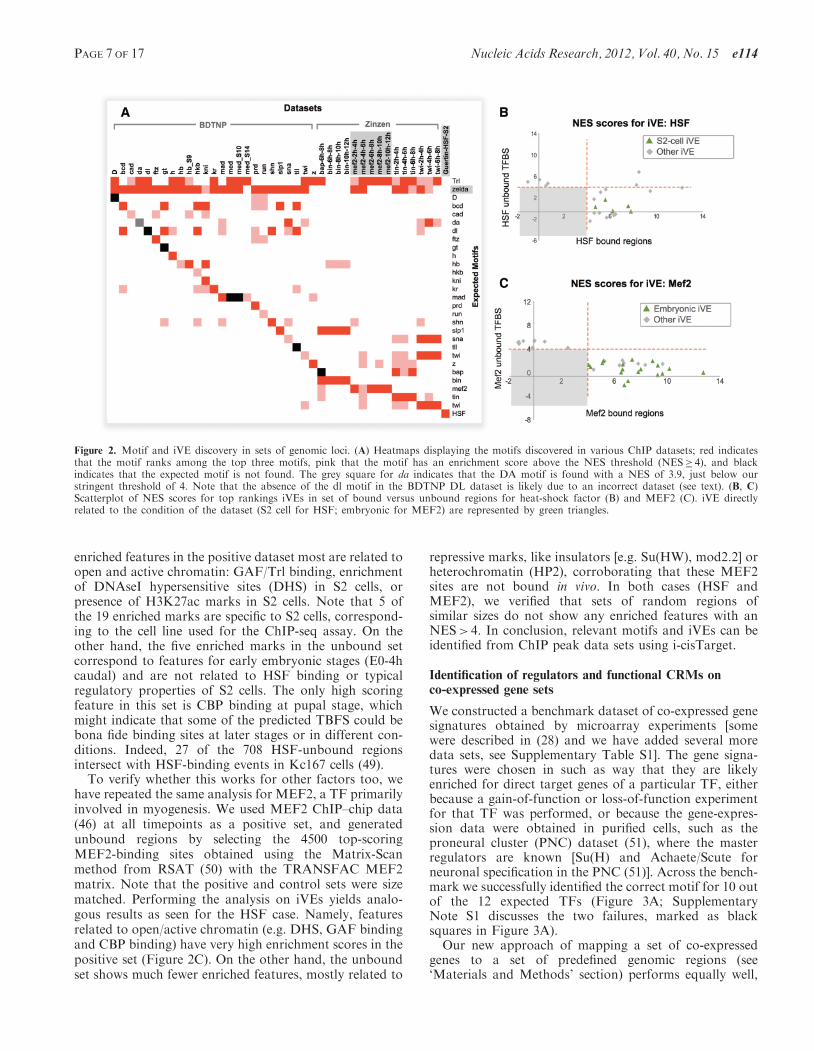
enriched features in the positive dataset most are related toopen and active chromatin: GAF/Trl binding, enrichmentof DNAseI hypersensitive sites (DHS) in S2 cells, orpresence of H3K27ac marks in S2 cells. Note that 5 ofthe 19 enriched marks are specific to S2 cells, correspond-ing to the cell line used for the ChIP-seq assay. On theother hand, the five enriched marks in the unbound setcorrespond to features for early embryonic stages (E0-4hcaudal) and are not related to HSF binding or typicalregulatory properties of S2 cells. The only high scoringfeature in this set is CBP binding at pupal stage, whichmight indicate that some of the predicted TBFS could bebona fide binding sites at later stages or in different con-ditions. Indeed, 27 of the 708 HSF-unbound regionsintersect with HSF-binding events in Kc167 cells (49).
To verify whether this works for other factors too, wehave repeated the same analysis for MEF2, a TF primarilyinvolved in myogenesis. We used MEF2 ChIP–chip data(46) at all timepoints as a positive set, and generatedunbound regions by selecting the 4500 top-scoringMEF2-binding sites obtained using the Matrix-Scanmethod from RSAT (50) with the TRANSFAC MEF2matrix. Note that the positive and control sets were sizematched. Performing the analysis on iVEs yields analo-gous results as seen for the HSF case. Namely, featuresrelated to open/active chromatin (e.g. DHS, GAF bindingand CBP binding) have very high enrichment scores in thepositive set (Figure 2C). On the other hand, the unboundset shows much fewer enriched features, mostly related to
repressive marks, like insulators [e.g. Su(HW), mod2.2] orheterochromatin (HP2), corroborating that these MEF2sites are not bound in vivo. In both cases (HSF andMEF2), we verified that sets of random regions ofsimilar sizes do not show any enriched features with anNES> 4. In conclusion, relevant motifs and iVEs can beidentified from ChIP peak data sets using i-cisTarget.
Identification of regulators and functional CRMs onco-expressed gene sets
We constructed a benchmark dataset of co-expressed genesignatures obtained by microarray experiments [somewere described in (28) and we have added several moredata sets, see Supplementary Table S1]. The gene signa-tures were chosen in such as way that they are likelyenriched for direct target genes of a particular TF, eitherbecause a gain-of-function or loss-of-function experimentfor that TF was performed, or because the gene-expres-sion data were obtained in purified cells, such as theproneural cluster (PNC) dataset (51), where the masterregulators are known [Su(H) and Achaete/Scute forneuronal specification in the PNC (51)]. Across the bench-mark we successfully identified the correct motif for 10 outof the 12 expected TFs (Figure 3A; SupplementaryNote S1 discusses the two failures, marked as blacksquares in Figure 3A).Our new approach of mapping a set of co-expressed
genes to a set of predefined genomic regions (see‘Materials and Methods’ section) performs equally well,
Figure 2. Motif and iVE discovery in sets of genomic loci. (A) Heatmaps displaying the motifs discovered in various ChIP datasets; red indicatesthat the motif ranks among the top three motifs, pink that the motif has an enrichment score above the NES threshold (NES� 4), and blackindicates that the expected motif is not found. The grey square for da indicates that the DA motif is found with a NES of 3.9, just below ourstringent threshold of 4. Note that the absence of the dl motif in the BDTNP DL dataset is likely due to an incorrect dataset (see text). (B, C)Scatterplot of NES scores for top rankings iVEs in set of bound versus unbound regions for heat-shock factor (B) and MEF2 (C). iVE directlyrelated to the condition of the dataset (S2 cell for HSF; embryonic for MEF2) are represented by green triangles.
PAGE 7 OF 17 Nucleic Acids Research, 2012, Vol. 40, No. 15 e114

if not better, compared to ‘gene-based’ approaches(28,30,31) (Supplementary Figure S6). However, theregion-based approach now also allows identifyingenriched iVEs on gene sets, besides PWMs. We rani-cisTarget on the Zelda LOF and the PNC gene setsfrom the benchmark, this time using both the 3731PWMs and 420 iVE features. Remarkably, in bothcases, by normalizing each type of regulatory featuresseparately, the final ranking of regulatory featurescontains a mixture of PWM and iVEs among the topranked features. On the Zelda LOF dataset, the top twomotif clusters are the Zelda/VFL motif (best representa-tive motif: elemento-CAGGTAG; NES=15.5) and theBCD motif (best representative: selexconsensus-oc,NES=5.17); indeed, the fact that an independentbicoid-related iVE is found highly enriched (BDTNP-BCD; NES=4.36) confirms that the motif cluster islikely representing BCD, rather than OC or GSC.Moreover, several enriched iVEs are pointing at Caudal(modEncode-MAT_GFP_7T-E-0-4h, BDTNP-cad) asan important co-factor of Zelda, while another enrichediVE from a different datasource is early Twist(Furlong-TWI-2-4h; NES=5.10). Interestingly, theseTFs have recently been shown to be key players in thematernal to zygotic activation, together with Zelda andSTAT92E, which is also found among the enriched iVEs(modEncode-MAT_Stat92E_E0-12h; NES=3.01) (52).Finally, several features related to H3K27me3, apolycomb-related repressive mark, are found enriched, inaccordance with the tight early transcriptional controlthrough PcG complexes.On the PNC data set the enriched PWMs represent
the characteristic TFs involved in PNCs [Su(H) and
Achaete/Scute] and several other relevant TFs (Pointedand Grainyhead) (Supplementary Figure S7; the entirei-cisTarget results are available from our website).Among the most enriched iVEs from BDTNP on thePNC set are BDTNP-da (NES=6.74), derived fromChIP against the proneural partner Daughterless (DA)and BDTNP-MED (NES=4.95), derived from ChIPagainst Medea, which is an effector of the dpp-signallingpathway. This is an interesting finding in the light of therecent discovery that SMAD proteins, the vertebratehomologues of Medea, co-operatively bind to CRMswith cell-type specific master regulators, such as Myod1in myotubes, Oct4 in ESCs and PU.1 in pro-B cells (53).Our finding of DA-ChIP and MED-ChIP co-operation inproneural clusters cells suggests that Smad/Medeaco-operativity with a master TF may be a conservedphenomenon. Finally, several iVEs from modENCODEare among the top features, including the H3K27me3ChIP data and POLII binding. Although polII bindingis historically linked with proximal promoters, severalrecent lines of evidence indicate it can be generallyassociated with CRMs, even with distal CRMs (16,54,55)
To confirm that i-cisTarget identifies meaningful iVEsfrom gene sets, we selected cases for which both gene-expression data and sets of genomic loci are available,and compared the enrichment scores of features on bothtypes of datasets. These are the Zelda and MEF2 cases,having a LOF gene set (56,57), as well as a ChIP datasetsof binding locations (46,48,57) This is an interestingconfiguration, which allows us to tackle the question ofregulatory feature enrichment from two independentperspectives, in particular for iVEs; indeed, if theenriched iVEs identified in gene sets are truly related to
Figure 3. Motif and iVE discovery in gene sets. (A) Heatmaps displaying the motifs discovered in various gene sets datasets; red indicates that themotif ranks among the top three motifs, pink that the motif has an enrichment score above the NES threshold (NES� 2.5), and black indicates thatthe expected motif is not found. (B, C) Scatterplot of NES scores for gene sets related to a mutant condition of a TF, and the correspondingChIP dataset for this TF; the red dashed line indicates the NES threshold of 2.5 for the gene set.
e114 Nucleic Acids Research, 2012, Vol. 40, No. 15 PAGE 8 OF 17

CRMs regulating these genes, then the same iVEs shouldalso be enriched in the corresponding ChIP datasets orCRMs. If not, then the identified iVEs might rather berelated to specific regions of the 136K regions overlappingthe genes (e.g. promoters, TSS, introns) other thanenhancer regions. The result of the comparativei-cisTarget analysis (see ‘Material and Methods’ sectionCombining gene sets and genomic loci for validationpurposes) is striking (Figure 3B–C): apart from a fewexceptions, the majority of enriched iVEs detected in thegene sets are also enriched in the corresponding CRM set.This is particularly true for iVEs that are directly relatedto the biological context investigated (embryonic featuresfor the Mef2 case, S2-related features for the Zelda case).This indicates that, starting from a set of co-expressedgenes, i-cisTarget is able to highlight the iVEs thatare related to their co-regulation by common TFs. Thisconfirms the validity and robustness of our feature enrich-ment approach in detecting specific features (motifs and
iVEs) from a gene set that are relevant for the actualCRMs regulating these genes.
i-cisTarget accurately predicts candidate CRMsfrom gene setsEach enriched feature selects a subset of highly rankedregions from the input set. We reasoned that these arecandidate CRMs regulating the set of input genes, andverified this on the two test cases presented above; wefirst used the Zelda ChIP-seq mentioned previously asan independent validation for the CRM predictions onthe Zelda LOF gene set. The optimal thresholddetermined by i-cisTarget leads to 72 direct target CRMpredictions for the CAGGTA motif, of which 62 (86%)intersect a Zelda ChIP peak (Figure 4A). This representsa 3.6-fold increase of the precision rate (i.e. positivepredictive value or PPV) compared to the input (198 ofthe 831 input regions, or 24%, overlap with a Zelda ChIPpeak) and clearly illustrates the high precision of the target
Figure 4. Assessment of CRM prediction performance. Scatterplots showing the precision/recall performances of CRM prediction for the zelda geneset (A) and the proneural gene set (C); precision/recall can be summarized into a F1-score, which is shown as histograms for both datasets (B, D).Feature combinations are represented in red, iVEs in green and motifs in blue. Feature sources are abbreviated as ME for modEncode, B forBDTNP.
PAGE 9 OF 17 Nucleic Acids Research, 2012, Vol. 40, No. 15 e114
CRM predictions based on predefined genomic regions.We performed this analysis also on enriched iVEs, andon combinations of PWMs and iVEs (see ‘Materials andMethods’ section Fine-tuning the analysis by combiningenriched features). i-cisTarget is based on ranking statisticsand therefore allows to combine features from the same oracross databases using OS, without the need to re-scorea genomic sequence and to re-normalize scores acrossdifferent feature types (41). We assessed whether thecombination of motifs with iVEs can increase the PPVon CRM detection. Indeed, several of these combinationslead to significant increases in the precision and/or recallof the prediction (Figure 4A), as well as the F1-score(Figure 4B; see ‘Materials and Methods’ sectionValidation of candidate enhancer predictions): BDTNP-CAD combined with the CAGGTAG motif reachesa PPV of 98% (87/89) and a TPR of 43% (87/198), thusoutperforming each of the individual features. The highestrecall (54%) is obtained for the combination ofBDTNP-TLL with CAGGTAG.In the analysis of the PNC gene set, we have no
ChIP data for Su(H) or the proneural factor to indicatethe true CRMs. Here, we used all annotated CRMsfrom RedFly as true CRMs, in total 82 CRMsoverlapping with 85 regions (min. 40% overlap), ofwhich many are active in the PNC (e.g. enhancers in theE(spl) complex or the Achaete–Scute complex). Herewe assess whether, starting from the co-expressed genes,the true CRMs can be identified, by following thehighly ranked genomic regions for a particular enrichedfeature.Indeed, we observe a significant enrichment in true
positive CRMs in the top ranking regions of enrichedfeatures. The best individual feature is BDTNP-DA,corresponding to the best NES score in i-cisTarget(PPV=22.4%, as compared to the 85 positive regionsversus the 1476 input regions, corresponding to 6%,Figure 4C). Note that BDTNP-MED shows a similarresult, corroborating our hypothesis that the DA andMED TFs co-operatively bind to proneural enhancers.The low PPV values are due to the small number ofvalidated CRMs in RedFly, and is likely largelyunderestimated. Interestingly, we found that again thecombination of two features, particularly a PWM andan iVE, outperforms individual features in terms ofprecision/recall. The best feature combinations, in termsof the F1 score increase compared to the input, are theSU(H) PWM combined with either DA or MED ChIPdata (Figure 4D). Four of the target predictions for[E-box, BDTNP-DA] are shown as example inSupplementary Figure S7 as UCSC Genome Browserimages.In conclusion, the analysis on co-expressed genes
results in meaningful regulatory features, both PWMfeatures and iVEs. Using any of these top-enrichedfeatures, or combinations thereof, leads to the predictionof direct target genes (a subset of the set of input genes)and target CRMs, operating in the gene-regulatorynetwork (GRN) underlying the biological process understudy.
i-cisTarget allows fast analysis of hundreds of data setsand predicts tissue-specific gene regulatory networks
i-cisTarget can analyse a set of genes, or a set of genomicloci (even thousands of regions) in a few seconds. We havetherefore implemented a batch analysis function in theonline i-cisTarget application, allowing to perform oneanalysis with hundreds of data sets (using the GMT fileformat, see Supplementary Materials and Methods). Toillustrate the potential of this feature, we analysed a largecompendium of 628 sets of genes that are co-expressed inthe same cell type or anatomical structure in the fly (basedon immunohistochemistry or in situ hybridization) (58).Despite the sparse knowledge of validated tissue-specificco-localization, we identified in 290 sets an enriched motiffor at least one TF that is co-localized in the same tissue.Moreover, in 188 sets, the number of tissue-specific TFsfor which the motif is enriched, was significantly higherthan expected by chance (Data not shown). This meansthat for these 188 sets the predicted TF-target relations areof high confidence and can be used to draw regulatorysubnetworks that connect the co-expressed genes. Asan example, we present the i-cisTarget analyses forfour of these sets, namely ‘adult mushroom body’(FBbt:00003684), ‘Kenyon cells’ (Fbbt:00003686; a childterm of adult mushroom body), ‘Pericardial cells’(FBbt:00005058) and ‘Cardioblast’ (FBbt:00001666).First, on a set of 48 genes expressed in the mushroombody and a set of 15 genes expressed in the encompassedKenyon cells, we identified the motifs of three TFs thathave a known role in these cells, namely Eyeless, MEF2and ECR (59,60,83). Hence, of the six TFs annotated asexpressed in these cells, three are predicted as master regu-lators by i-cisTarget. This leads to several new interesting,high-confidence target gene predictions from which wederived a predicted GRN (Figure 5A). These predictionsprovide new insight into the role of the master regulator inthe Drosophila brain, Eyeless, for which we predictmultiple target genes like fru, Fas2, hh, Appl, tll andMef2. The prediction that EY could drive the hedgehogpathway during development of the mushroom body bydirectly controlling hh at the transcriptional level baressimilarities to eyeless being upstream of the hedgehogpathway during retinal determination, where thehedgehog pathway drives the movement of the morpho-genetic furrow, downstream of eyeless (61). It is remark-able that the few TFs annotated with these FBbt terms areso highly interconnected. The same is true for the TFsinvolved in heart development, as shown in the networksdrawn for pericardial cells and cardioblast (Figure 5B–C).These two networks show similarity and differencesbetween cardioblasts and pericardial cells in terms ofTF-target interactions. tinman and Mef2 are expressed inboth cell types, and the IVEs and/or motifs for both TFsare found for both sets, while the other TFs are specific forone cell type (hth, Doc2 and Antp are expressed only incardioblasts where their motifs are found enriched).Surprisingly, in the heart cases only the correspondingiVE for MEF2 (MEF2 ChIP data) is found enriched,while in the mushroom body data set both the MEF2motif and the iVE were found. It is possible that
e114 Nucleic Acids Research, 2012, Vol. 40, No. 15 PAGE 10 OF 17
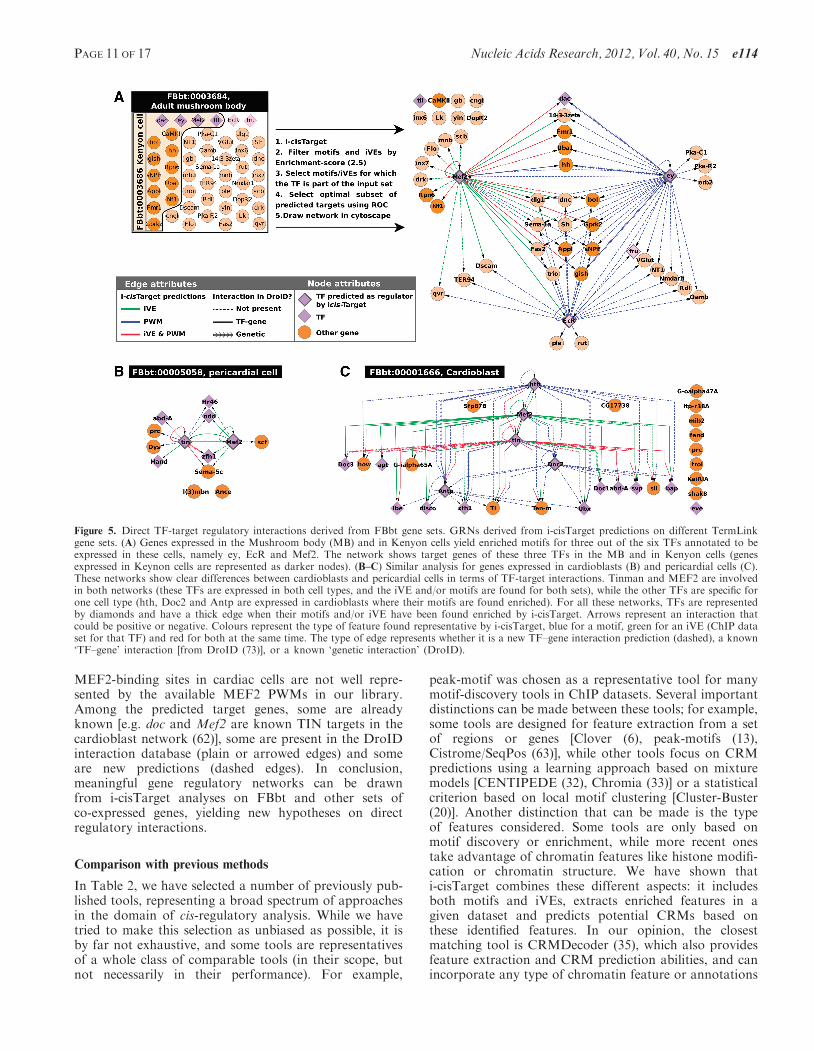
MEF2-binding sites in cardiac cells are not well repre-sented by the available MEF2 PWMs in our library.Among the predicted target genes, some are alreadyknown [e.g. doc and Mef2 are known TIN targets in thecardioblast network (62)], some are present in the DroIDinteraction database (plain or arrowed edges) and someare new predictions (dashed edges). In conclusion,meaningful gene regulatory networks can be drawnfrom i-cisTarget analyses on FBbt and other sets ofco-expressed genes, yielding new hypotheses on directregulatory interactions.
Comparison with previous methods
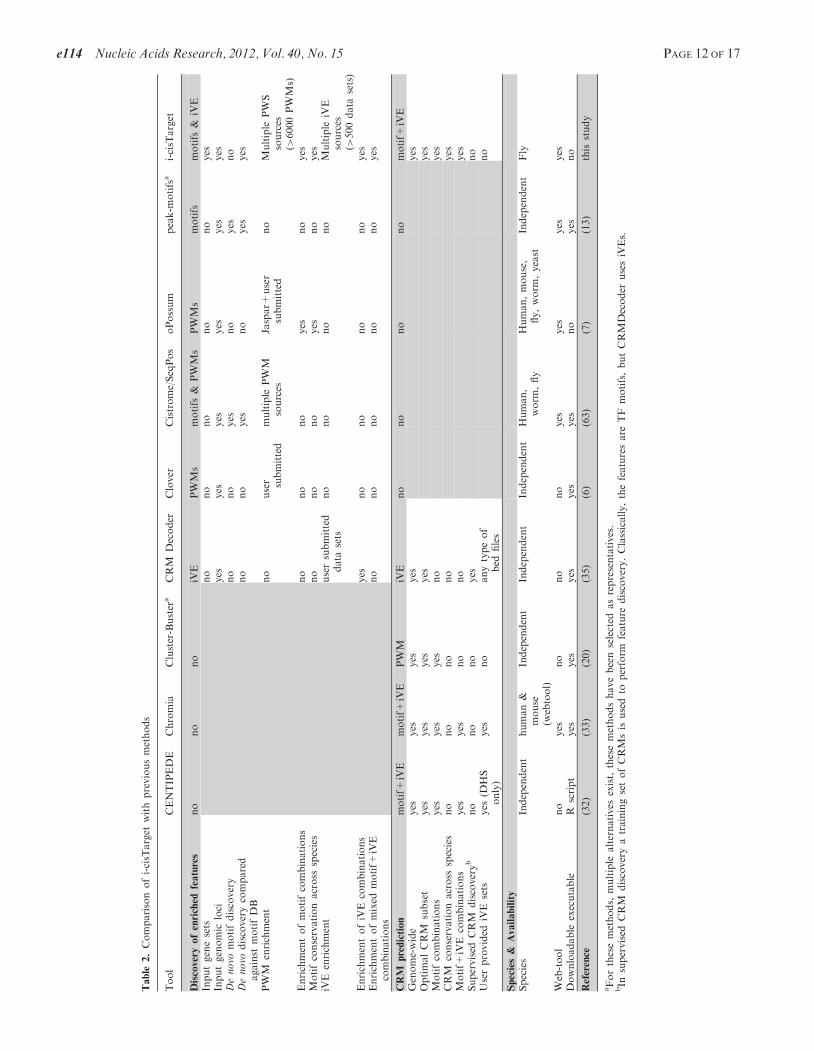
In Table 2, we have selected a number of previously pub-lished tools, representing a broad spectrum of approachesin the domain of cis-regulatory analysis. While we havetried to make this selection as unbiased as possible, it isby far not exhaustive, and some tools are representativesof a whole class of comparable tools (in their scope, butnot necessarily in their performance). For example,
peak-motif was chosen as a representative tool for manymotif-discovery tools in ChIP datasets. Several importantdistinctions can be made between these tools; for example,some tools are designed for feature extraction from a setof regions or genes [Clover (6), peak-motifs (13),Cistrome/SeqPos (63)], while other tools focus on CRMpredictions using a learning approach based on mixturemodels [CENTIPEDE (32), Chromia (33)] or a statisticalcriterion based on local motif clustering [Cluster-Buster(20)]. Another distinction that can be made is the typeof features considered. Some tools are only based onmotif discovery or enrichment, while more recent onestake advantage of chromatin features like histone modifi-cation or chromatin structure. We have shown thati-cisTarget combines these different aspects: it includesboth motifs and iVEs, extracts enriched features in agiven dataset and predicts potential CRMs based onthese identified features. In our opinion, the closestmatching tool is CRMDecoder (35), which also providesfeature extraction and CRM prediction abilities, and canincorporate any type of chromatin feature or annotations
Figure 5. Direct TF-target regulatory interactions derived from FBbt gene sets. GRNs derived from i-cisTarget predictions on different TermLinkgene sets. (A) Genes expressed in the Mushroom body (MB) and in Kenyon cells yield enriched motifs for three out of the six TFs annotated to beexpressed in these cells, namely ey, EcR and Mef2. The network shows target genes of these three TFs in the MB and in Kenyon cells (genesexpressed in Keynon cells are represented as darker nodes). (B–C) Similar analysis for genes expressed in cardioblasts (B) and pericardial cells (C).These networks show clear differences between cardioblasts and pericardial cells in terms of TF-target interactions. Tinman and MEF2 are involvedin both networks (these TFs are expressed in both cell types, and the iVE and/or motifs are found for both sets), while the other TFs are specific forone cell type (hth, Doc2 and Antp are expressed in cardioblasts where their motifs are found enriched). For all these networks, TFs are representedby diamonds and have a thick edge when their motifs and/or iVE have been found enriched by i-cisTarget. Arrows represent an interaction thatcould be positive or negative. Colours represent the type of feature found representative by i-cisTarget, blue for a motif, green for an iVE (ChIP dataset for that TF) and red for both at the same time. The type of edge represents whether it is a new TF–gene interaction prediction (dashed), a known‘TF–gene’ interaction [from DroID (73)], or a known ‘genetic interaction’ (DroID).
PAGE 11 OF 17 Nucleic Acids Research, 2012, Vol. 40, No. 15 e114
Table
2.Comparisonofi-cisT
arget
withpreviousmethods
Tool
CENTIPEDE
Chromia
Cluster-Buster
aCRM
Decoder
Clover
Cistrome/SeqPos
oPossum
peak-m
otifsa
i-cisT
arget
Discovery
ofenriched
features
no
no
no
iVE
PWMs
motifs
&PWMs
PWMs
motifs
motifs
&iVE
Inputgenesets
no
no
no
no
no
yes
Inputgenomic
loci
yes
yes
yes
yes
yes
yes
Denovo
motifdiscovery
no
no
yes
no
yes
no
Denovo
discoverycompared
against
motifDB
no
no
yes
no
yes
yes
PWM
enrichment
no
user submitted
multiple
PWM
sources
Jaspar+
user
submitted
no
Multiple
PWS
sources
(>6000PWMs)
Enrichmentofmotifcombinations
no
no
no
yes
no
yes
Motifconservationacross
species
no
no
no
yes
no
yes
iVE
enrichment
usersubmitted
data
sets
no
no
no
no
Multiple
iVE
sources
(>500data
sets)
EnrichmentofiVE
combinations
yes
no
no
no
no
yes
Enrichmentofmixed
motif+
iVE
combinations
no
no
no
no
no
yes
CRM
prediction
motif+
iVE
motif+
iVE
PWM
iVE
no
no
no
no
motif+
iVE
Genome-wide
yes
yes
yes
yes
yes
OptimalCRM
subset
yes
yes
yes
yes
yes
Motifcombinations
yes
yes
yes
no
yes
CRM
conservationacross
species
no
no
no
no
yes
Motif+
iVE
combinations
yes
yes
no
no
yes
Supervised
CRM
discoveryb
no
no
no
yes
no
Userprovided
iVE
sets
yes
(DHS
only)
yes
no
anytypeof
bed
files
no
Species&
Availability
Species
Independent
human&
mouse
(webtool)
Independent
Independent
Independent
Human,
worm
,fly
Human,mouse,
fly,worm
,yeast
Independent
Fly
Web-tool
no
yes
no
no
no
yes
yes
yes
yes
Downloadable
executable
Rscript
yes
yes
yes
yes
yes
no
yes
no
Reference
(32)
(33)
(20)
(35)
(6)
(63)
(7)
(13)
this
study
aForthesemethods,
multiple
alternatives
exist,
thesemethodshavebeenselected
asrepresentatives.
bIn
supervised
CRM
discoveryatrainingsetofCRMsis
usedto
perform
feature
discovery.Classically,thefeaturesare
TF
motifs,butCRMDecoder
usesiVEs.
e114 Nucleic Acids Research, 2012, Vol. 40, No. 15 PAGE 12 OF 17

in bed format, provided by the user. Two noticeabledifferences with i-cistarget are: (i) CRMDecoder doesnot include TF motifs for CRM predictions; and (ii)CRMDecoder only analyses sets of genomic loci and notco-expressed gene sets. We thus restricted the comparisonof both tools to genomic loci, using iVEs extracted frommodEncode, including DHS data from the BDTNPproject. Since CRMDecoder does not take motifs intoaccount, we applied it to the HSF and MEF2 datasetsdescribed previously consisting of truly bound regions,pooled with unbound regions containing the motif,asking to what extend these two classes of regions couldbe discriminated by iVEs.
On the MEF2 dataset, which consists of 8009 bound and7045 unbound regions (called ‘training set’), CRMDecoderselects 210 significant features, and identifies 3622 CRMsof which 1933 intersect with 6761 regions in the trainingset; 5306 of these 6761 regions are MEF2-bound regions(PPV=79%). i-cisTarget on the other hand selects 19 sig-nificantly enriched iVEs with NES score> 4. The topranking iVE (BDTNP-DHS-stg11) selects 1841 regionsthat intersect 3313 regions of the training set, and 3119of these are MEF2-bound regions (PPV=94%).
On the HSF dataset consisting of 422 bound and 708unbound regions, CRMDecoder identified DHS in Kc167and S2 cells and Adult male and female CBP as the topranking features (highest CCD score) is a list of 76 signifi-cant features (out of 369 features). Using these significantfeatures, CRMDecoder predicted 2553 CRMs of which324 overlap 388 of the training regions. Of these 388regions, 307 are bound by HSF in vivo, hence a PPV of79%. On the same dataset, i-cistarget identified 17 iVEwith a NES score >4, among which Adult and PupaeCBP (rank 1,2,3), Kc167 and S2 DHS, as well as PolII.The top ranking feature (AdultMale CBP) selects 238 highranking regions, which overlap 238 of the training regions,with 201 of these being bound, thus a PPV of 84%. Whilethe PPVs of both tools are comparable in the latter case, itis important to note that i-cisTarget achieves this resultusing one single feature. Taking advantage of the ability ofour tool to easily combine features, we can combineAdultMale_CBP with hypersensitive regions in S2 cells;this combination now achieves a PPV of 90%, hence asignificant increase over the single feature. This compara-tive study shows that i-cisTarget is the only method thatcombines iVE discovery, motif discovery and CRMprediction and that i-cisTarget outperforms existingtools when overlapping functionalities are compared.
DISCUSSION
The last 15 years many bioinformatics methods and toolshave been developed for cis-regulatory sequence analysis(64). Broadly, they can be divided in two categories. Thefirst category is methods for motif discovery on a set ofco-regulated sequences, such as MEME-like approaches(dozens of methods and extensions exist). The secondcategory are methods for CRM prediction throughwhole-genome scanning using one or more knownmotifs as input, often using Hidden Markov Models and
sequence conservation cues [see (65) for a review]. A fewmethods, such as phylCRM/Lever, ModuleMiner andcisTargetX combine both approaches and show increasedmotif discovery performance, even when very largeupstream regions and introns are included in theanalysis (28,30,31). The concept of these integrativemethods is to apply genome-wide CRM scoring, includingcomparative genomics cues, for many different models(e.g. PWMs), followed by the identification of thoseparticular models that yield the highest accuracy on aset of co-expressed genes. In this work we have introducedthree important novelties into a new method, calledi-cisTarget. The first is the a priori determination of136K regions to be scored, which leads to an increasedflexibility. In particular, this partitioning of the genomeallows to analyse both data sets of genomic loci (by select-ing all 136K regions that overlap these loci) andco-expressed gene sets (by selecting all 136K regions thatfall in the upstream and intronic space of all genes in theset). In this study we obtained good results for a genomesegmentation using sequence conservation (phastCons)combined with insulator sites, and excluding codingexons. However, we envision that improvements can bemade on the genome segmentation, for example byincluding coding exons (66) or using a segmentation thatis guided by the high-throughput data sets (i.e. the iVEs)themselves. The latter can become practical as more andmore data sets are generated with overlapping results,which may ultimately converge to a defined set of regula-tory regions. The second novelty is the generalization ofregulatory feature discovery, with the possibility toidentify enriched motifs (as PWMs) but also enrichediVEs such as ChIP-peaks, and active/repressive chromatinmarks. The third novelty is the ability to perform anycombination of regulatory features, even across differenttypes of features (e.g. a motif with a ChIP or DHSfeature).Taken together, these features allow analysing most
kinds of high-throughput data available in Drosophila,and to combine several analyses using the same tool fordifferent datasets. For example, it is possible to combinethe analysis of binding location data for a particular factor(ChIP) with the analysis of the corresponding expressiondata in mutant conditions for this factor, as we haveshown for MEF2 (57) and Zelda (48,56).We have applied our tools on various datasets, distin-
guishing gene sets from sets of genomic loci. For gene sets,we have shown that i-cisTarget identifies the enrichment ofthe correct motif in most gene sets we investigated; failuresto do so might be explained by the specificity of thebinding motif to certain conditions or tissues. EnrichediVEs can lead to interesting new hypotheses, such as theco-operation between daughterless and Medea, inferredfrom the PNC set analysis, that resembles the recentdiscovery of Smad co-operation with master regulators(53); or the prediction of new TF-target and TF-TFinteractions across cell types in Drosophila, as wasdemonstrated for Kenyon cells, pericardial cells andcardioblasts (Figure 5). Moreover, the discovered motifslead to CRM predictions in the 5 kb+50-UTR+firstintron of the input genes that have a high specificity to
PAGE 13 OF 17 Nucleic Acids Research, 2012, Vol. 40, No. 15 e114
be regulatory regions, as was demonstrated on the zeldaLOF dataset (56) and the PNC dataset (51). A currentlimitation of i-cisTarget, when analysing gene sets, is thearbitrary assignment of genomic regions to the gene set.Multiple demarcations are available at the i-cisTarget webtool, for example [5-kb upstream limited to upstreamgene, 50-UTR, and first intron] or [10-kb upstreamlimited, 50-UTR, all introns, 30-UTR and 10-kb down-stream limited to downstream gene] (see ‘Materials andMethods’ section). A future challenge remains identifyingvery distal enhancers and enhancers overlapping thecoding sequence of nearby genes (66). A simple extensionof the sequence search space, including more sequence andincluding intronic and exonic sequences fromneighbouring genes, will not solve the problem. Indeed,when applying i-cisTarget to 100-kb upstream and down-stream sequence of the TSS (this search space includes100% of REDfly CRMs), without truncating thissequence at neighbouring genes, the performance dropsdramatically (see Supplementary Figure S2).We also used several ChIP datasets to investigate the
performance of i-cisTarget on sets of genomic loci. Here,as for the gene sets, i-cisTarget performs very well inrecovering the expected motif from a comprehensivelibrary of motifs, but also highlights the involvements ofother factors, such as Zelda or Trl in embryonic datasets.While motif discovery or enrichment is also performed byseveral other tools (45,67), i-cisTarget adds the possibilityto search for additional iVEs. We have shown that aTF-binding site (TFBS) does not necessarily correspondto a binding event. While potential binding sites for HSFor MEF2 cannot be distinguished from actual bindingevents based on motif enrichment alone, adding iVEsclearly selects marks typical for active chromatin as thebest discriminant between actually bound or unboundsites. We emphasize that this result is obtained ab initio,without any prior knowledge of which are the relevantiVEs. Hence, additional signals are needed for a TF tobind to a motif sequence, and these are often related tomarks of open or active chromatin: DNAse hypersensitivesites, binding of pioneering factors such as Trl or Zelda,whose role as a general precursor of chromatin openinghas only very recently been hypothesized (48).Interestingly, while in both HSF and Mef2 cases, thebound motifs present an enrichment for active features(GAF/Trl, CBP/p300, or DHS), the pattern of enrichedfeatures for unbound motifs is quite different. Namely,the unbound MEF2 motifs present an enrichment forrepressive chromatin marks [Su(HW) or heterochromatinlike features], while the unbound HSF motifs do notpresent any of these marks, consistent with what wasreported in Guertin et al. (44). This might suggest adistinct mechanism of negative regulation through chro-matin conformation between developmental processesand stress response pathways.A feature of our approach that is not found in alterna-
tive studies is the ability to easily combine any number offeatures to investigate the synergistic effect of differentfeatures. Being based on ranks, using OS allows an‘on-the-fly’ re-ranking of the 136K regions using particu-lar combinations. We showed on the PNC and zelda gene
set that combinations of PWM and iVE yield higher1%-AUCs meaning a much higher specificity in the highranking regions (Figure 4). This last result shows thattranscriptional regulation is not a linear process, in thesense that the contributions of the combination of regula-tory features is more than the addition of individualcontributions, revealing a synergistic mechanism ofaction. Moreover, the fact that many different regulatoryfeatures are found enriched in the datasets we have studiedpreviously confirms that transcriptional regulation isintrinsically a highly combinatorial process.
These two aspects (combinations and synergy) havealready been extensively described before in the contextof the enhanceosome model of regulation (68,69). In par-ticular, in Drosophila, analysis of a collection of curatedCRMs showed that they are typically characterized bya combination of different TFBSs (70,71). This heterotypicmodel has been shown to be the general rule, whilehomotypic CRMs are generally restricted to earlyembryogenesis (71).
However, these descriptions focused on combinatorialregulation by TFs alone. Here, we have confirmed recentevidence that this combinatorial regulation extends toother kinds of regulatory features such as histone modifi-cations, binding of chromatin-modifying proteins or tran-scriptional co-factors such as CBP. Hence, we proposethat the notion of heterotypic model of regulation shouldbe extended to describe any combination of regulatoryfeatures, including motifs and chromatin-relatedfeatures. Similarly to the CRM finding procedure consist-ing of finding clusters of TFBS for different TFs (26),we introduce and show that searching for ‘clusters’ ofregulatory features can improve the predictive power ofregulatory sequence analysis.
While our method currently applies to Drosophila, it canin principle be extended to any other organism for whichlarge-scale collections of in vivo datasets are available, andin particular to human. The much greater size ofnon-coding regions in human, and the lower proportionof functional DNA in the human genome (72), wouldhowever require to pre-select candidate regulatoryregions, as using a full partition of the completenon-coding genome would become computationallyuntractable and would contain too high noise levels. Weare currently working on implementing i-cisTarget forhuman, using the collection of ENCODE datasets.
SUPPLEMENTARY DATA
Supplementary Data are available at NAR Online:Supplementary Table 1, Supplementary Figures 1–7,Supplementary Materials and Methods andSupplementary Note 1.
ACKNOWLEDGEMENTS
The authors thank Serge Plaza, Morgane Thomas-Chollier, Klaas Vandepoele and Jacques van Helden forinsightful comments on the manuscript. We are grateful toFlyFactorSurvey Database, FlyBase, E. Furlong,
e114 Nucleic Acids Research, 2012, Vol. 40, No. 15 PAGE 14 OF 17

BDTNP, and modEncode for making their data setspublicly available.
FUNDING
Research Foundation Flanders (FWO) [G.0704.11N];University of Leuven [CREA/10/014, PF/10/016];Human Frontiers Science Program (HFSP) [RGY0070/2011]; Foundation Against Cancer [2010-154 to SA]; CHis ANR partner of the ERASysBio+ initiative under theEU ERA-NET Plus scheme in FP7. BvdS is funded bya fellowship from Vlaamse Liga tegen Kanker. Fundingfor open access charge: Research Foundation Flanders[G.0704.11N] and ANR-ERASysBio+.
Conflict of interest statement. None declared.
REFERENCES
1. Park,P.J. (2009) ChIP-seq: advantages and challenges ofa maturing technology. Nat. Rev. Genet., 10, 669–680.
2. Song,L., Zhang,Z., Grasfeder,L.L., Boyle,A.P., Giresi,P.G.,Lee,B.-K., Sheffield,N.C., Graf,S., Huss,M., Keefe,D. et al. (2011)Open chromatin defined by DNaseI and FAIRE identifiesregulatory elements that shape cell-type identity. Genome Res., 21,1757–1767.
3. Wang,Z., Gerstein,M. and Snyder,M. (2009) RNA-Seq: arevolutionary tool for transcriptomics. Nat. Rev. Genet., 10,57–63.
4. Roy,S., Ernst,J., Kharchenko,P.V., Kheradpour,P., Negre,N.,Eaton,M.L., Landolin,J.M., Bristow,C.A., Ma,L., Lin,M.F. et al.(2010) Identification of functional elements and regulatory circuitsby Drosophila modENCODE. Science, 330, 1787–1797.
5. Hawkins,R.D., Hon,G.C. and Ren,B. (2010) Next-generationgenomics: an integrative approach. Nat. Rev. Genet., 11, 476–486.
6. Frith,M.C., Fu,Y., Yu,L., Chen,J.-F., Hansen,U. and Weng,Z.(2004) Detection of functional DNA motifs via statisticalover-representation. Nucleic Acids Res., 32, 1372–1381.
7. Ho Sui,S.J., Fulton,D.L., Arenillas,D.J., Kwon,A.T. andWasserman,W.W. (2007) oPOSSUM: integrated tools for analysisof regulatory motif over-representation. Nucleic Acids Res., 35,W245–W252.
8. Roider,H.G., Manke,T., O’Keeffe,S., Vingron,M. and Haas,S.A.(2009) PASTAA: identifying transcription factors associated withsets of co-regulated genes. Bioinformatics, 25, 435–442.
9. Zambelli,F., Pesole,G. and Pavesi,G. (2009) Pscan: findingover-represented transcription factor binding site motifs insequences from co-regulated or co-expressed genes. Nucleic AcidsRes., 37, W247–W252.
10. Turatsinze,J.-V., Thomas-Chollier,M., Defrance,M. and vanHelden,J. (2008) Using RSAT to scan genome sequences fortranscription factor binding sites and cis-regulatory modules.Nat. Protoc., 3, 1578–1588.
11. Bailey,T.L. and Elkan,C. (1994) Fitting a mixture model byexpectation maximization to discover motifs in biopolymers.Proc. Int. Conf. ISMB, 2, 28–36.
12. Thijs,G., Lescot,M., Marchal,K., Rombauts,S., De Moor,B.,Rouze,P. and Moreau,Y. (2001) A higher-order backgroundmodel improves the detection of promoter regulatory elements byGibbs sampling. Bioinformatics, 17, 1113–1122.
13. Thomas-Chollier,M., Herrmann,C., Defrance,M., Sand,O.,Thieffry,D. and van Helden,J. (2011) RSAT peak-motifs: motifanalysis in full-size ChIP-seq datasets. Nucleic Acids Res., 40, e31.
14. Machanick,P. and Bailey,T.L. (2011) MEME-ChIP: motif analysisof large DNA datasets. Bioinformatics, 27, 1696–1697.
15. Wang,Z., Zang,C., Rosenfeld,J.A., Schones,D.E., Barski,A.,Cuddapah,S., Cui,K., Roh,T.-Y., Peng,W., Zhang,M.Q. et al.(2008) Combinatorial patterns of histone acetylations andmethylations in the human genome. Nat. Genet., 40, 897–903.
16. Kharchenko,P.V., Alekseyenko,A.A., Schwartz,Y.B., Minoda,A.,Riddle,N.C., Ernst,J., Sabo,P.J., Larschan,E., Gorchakov,A.A.,Gu,T. et al. (2011) Comprehensive analysis of the chromatinlandscape in Drosophila melanogaster. Nature, 471, 480–485.
17. Filion,G.J., van Bemmel,J.G., Braunschweig,U., Talhout,W.,Kind,J., Ward,L.D., Brugman,W., de Castro,I.J., Kerkhoven,R.M.and Bussemaker,H.J. (2010) Systematic protein location mappingreveals five principal chromatin types in Drosophila cells. Cell,143, 212–224.
18. Boyle,A.P., Song,L., Lee,B.-K., London,D., Keefe,D., Birney,E.,Iyer,V.R., Crawford,G.E. and Furey,T.S. (2011) High-resolutiongenome-wide in vivo footprinting of diverse transcription factorsin human cells. Genome Res., 21, 456–464.
19. MacArthur,S., Li,X.-Y., Li,J., Brown,J.B., Chu,H.C., Zeng,L.,Grondona,B.P., Hechmer,A., Simirenko,L., Keranen,S.V.E. et al.(2009) Developmental roles of 21 Drosophila transcription factorsare determined by quantitative differences in binding to anoverlapping set of thousands of genomic regions. Genome Biol.,10, R80.
20. Frith,M.C., Li,M.C. and Weng,Z. (2003) Cluster-Buster: findingdense clusters of motifs in DNA sequences. Nucleic Acids Res.,31, 3666–3668.
21. Kim,J., Cunningham,R., James,B., Wyder,S., Gibson,J.D.,Niehuis,O., Zdobnov,E.M., Robertson,H.M., Robinson,G.E.,Werren,J.H. et al. (2010) Functional characterization oftranscription factor motifs using cross-species comparison acrosslarge evolutionary distances. PLoS Comput. Biol., 6, e1000652.
22. Sinha,S., Liang,Y. and Siggia,E. (2006) Stubb: a program fordiscovery and analysis of cis-regulatory modules. Nucleic AcidsRes., 34, W555–W559.
23. Sinha,S., Schroeder,M.D., Unnerstall,U., Gaul,U. and Siggia,E.D.(2004) Cross-species comparison significantly improvesgenome-wide prediction of cis-regulatory modules in Drosophila.BMC Bioinformatics, 5, 129.
24. Rajewsky,N., Vergassola,M., Gaul,U. and Siggia,E.D. (2002)Computational detection of genomic cis-regulatory modulesapplied to body patterning in the early Drosophila embryo.BMC Bioinformatics, 3, 30.
25. Brody,T., Yavatkar,A.S., Kuzin,A., Kundu,M., Tyson,L.J.,Ross,J., Lin,T.-Y., Lee,C.-H., Awasaki,T., Lee,T. et al. (2012)Use of a Drosophila genome-wide conserved sequence database toidentify functionally related cis-regulatory enhancers. Dev.Dynamics, 241, 169–189.
26. Berman,B.P., Nibu,Y., Pfeiffer,B.D., Tomancak,P., Celniker,S.E.,Levine,M., Rubin,G.M. and Eisen,M.B. (2002) Exploitingtranscription factor binding site clustering to identifycis-regulatory modules involved in pattern formation in theDrosophila genome. PNAS, 99, 757–762.
27. Subramanian,A., Tamayo,P., Mootha,V.K., Mukherjee,S.,Ebert,B.L., Gillette,M.A., Paulovich,A., Pomeroy,S.L.,Golub,T.R., Lander,E.S. et al. (2005) Gene set enrichmentanalysis: a knowledge-based approach for interpretinggenome-wide expression profiles. PNAS, 102, 15545–15550.
28. Aerts,S., Quan,X.-J., Claeys,A., Naval Sanchez,M., Tate,P.,Yan,J. and Hassan,B.A. (2010) Robust target gene discoverythrough transcriptome perturbations and genome-wide enhancerpredictions in Drosophila uncovers a regulatory basis for sensoryspecification. PLoS Biol., 8, e1000435.
29. Potier,D., Atak,Z.K., Sanchez,M.N., Herrmann,C. and Aerts,S.(2012) Using cisTargetX to predict transcriptional targets andnetworks in Drosophila. Methods Mol. Biol., 786, 291–314.
30. Warner,J.B., Philippakis,A.A., Jaeger,S.A., He,F.S., Lin,J. andBulyk,M.L. (2008) Systematic identification of mammalianregulatory motifs’ target genes and functions. Nat. Methods, 5,347–353.
31. Van Loo,P., Aerts,S., Thienpont,B., De Moor,B., Moreau,Y. andMarynen,P. (2008) ModuleMiner - improved computationaldetection of cis-regulatory modules: are there different modes ofgene regulation in embryonic development and adult tissues?Genome Biol., 9, R66.
32. Pique-regi,R., Degner,J.F., Pai,A.A., Gaffney,D.J., Gilad,Y. andPritchard,J.K. (2010) Accurate inference of transcription factorbinding from DNA sequence and chromatin accessibility data.Genome Res., 21, 447–455.
PAGE 15 OF 17 Nucleic Acids Research, 2012, Vol. 40, No. 15 e114

33. Won,K.-J., Ren,B. and Wang,W. (2010) Genome-wide predictionof transcription factor binding sites using an integrated model.Genome Biol., 11, R7.
34. Klepper,K. and Drabløs,F. (2010) PriorsEditor: a tool for thecreation and use of positional priors in motif discovery.Bioinformatics, 26, 2195–2197.
35. Kang,K., Kim,J., Chung,J.H. and Lee,D. (2011) Decoding thegenome with an integrative analysis tool: Combinatorial CRMDecoder. Nucleic Acids Res., 39, e116.
36. Heintzman,N.D., Stuart,R.K., Hon,G., Fu,Y., Ching,C.W.,Hawkins,R.D., Barrera,L.O., Van Calcar,S., Qu,C., Ching,K.A.et al. (2007) Distinct and predictive chromatin signatures oftranscriptional promoters and enhancers in the human genome.Nat. Genet., 39, 311–318.
37. Bonn,S., Zinzen,R.P., Girardot,C., Gustafson,E.H., Perez-Gonzalez,A., Delhomme,N., Ghavi-Helm,Y., Wilczynski,B.,Riddell,A. and Furlong,E.E.M. (2012) Tissue-specific analysis ofchromatin state identifies temporal signatures of enhancer activityduring embryonic development. Nat. Genet., 44, 148–56.
38. Siepel,A., Bejerano,G., Pedersen,J.S., Hinrichs,A.S., Hou,M.,Rosenbloom,K., Clawson,H., Spieth,J., Hillier,L.W., Richards,S.et al. (2005) Evolutionarily conserved elements in vertebrate,insect, worm, and yeast genomes. Genome Res., 15, 1034–1050.
39. Rosenbloom,K., Taylor,J., Schaeffer,S., Kent,J., Haussler,D. andMiller,W. (2008) Phylogenomic resources at the UCSC GenomeBrowser. Meth. Mol. Biol., 422, 133–144.
40. Kent,W.J., Baertsch,R., Hinrichs,A., Miller,W. and Haussler,D.(2003) Evolution’s cauldron: duplication, deletion, andrearrangement in the mouse and human genomes. PNAS, 100,11484–11489.
41. Aerts,S., Lambrechts,D., Maity,S., Van Loo,P., Coessens,B., DeSmet,F., Tranchevent,L.-C., De Moor,B., Marynen,P., Hassan,B.et al. (2006) Gene prioritization through genomic data fusion.Nat. Biotech., 24, 537–544.
42. Stuart,J.M., Segal,E., Koller,D. and Kim,S.K. (2003) Agene-coexpression network for global discovery of conservedgenetic modules. Science, 302, 249–255.
43. Quinlan,A.R. and Hall,I.M. (2010) BEDTools: a flexible suite ofutilities for comparing genomic features. Bioinformatics, 26,841–842.
44. Guertin,M.J. and Lis,J.T. (2010) Chromatin landscapedictates HSF binding to target DNA elements. PLoS Genet., 6,e1001114.
45. Thomas-Chollier,M., Defrance,M., Medina-Rivera,A., Sand,O.,Herrmann,C., Thieffry,D. and van Helden,J. (2011) RSAT 2011:regulatory sequence analysis tools. Nucleic Acids Res., 39,W86–W91.
46. Zinzen,R.P., Girardot,C., Gagneur,J., Braun,M. andFurlong,E.E.M. (2009) Combinatorial binding predictsspatio-temporal cis-regulatory activity. Nature, 462, 65–70.
47. Jakobsen,J.S., Braun,M., Astorga,J., Gustafson,E.H.,Sandmann,T., Karzynski,M., Carlsson,P. and Furlong,E.E.M.(2007) Temporal ChIP-on-chip reveals Biniou as a universalregulator of the visceral muscle transcriptional network. GeneDev., 21, 2448–2460.
48. Harrison,M.M., Li,X.-Y., Kaplan,T., Botchan,M.R. andEisen,M.B. (2011) Zelda binding in the early Drosophilamelanogaster embryo marks regions subsequently activated at thematernal-to-zygotic transition. PLoS Genet., 7, e1002266.
49. Gonsalves,S.E., Moses,A.M., Razak,Z., Robert,F. andWestwood,J.T. (2011) Whole-genome analysis reveals that activeheat shock factor binding sites are mostly associated withnon-heat shock genes in Drosophila melanogaster. PLoS One, 6,e15934.
50. Turatsinze,J.-V., Thomas-Chollier,M., Defrance,M. and vanHelden,J. (2008) Using RSAT to scan genome sequences fortranscription factor binding sites and cis-regulatory modules. Nat.Protoc., 3, 1578–1588.
51. Reeves,N. and Posakony,J.W. (2005) Genetic Programs Activatedby Proneural Proteins in the Developing Drosophila PNS. Dev.Cell, 8, 413–425.
52. Tsurumi,A., Xia,F., Li,J., Larson,K., Lafrance,R. and Li,W.X.(2011) stat is an essential activator of the zygotic genome in theearly Drosophila embryo. PLoS Genet., 7, e1002086.
53. Mullen,A.C., Orlando,D.A., Newman,J.J., Loven,J., Kumar,R.M.,Bilodeau,S., Reddy,J., Guenther,M.G., DeKoter,R.P. andYoung,R.A. (2011) Master transcription factors determinecell-type-specific responses to TGF-b signaling. Cell, 147, 565–576.
54. Ørom,U.A., Derrien,T., Beringer,M., Gumireddy,K., Gardini,A.,Bussotti,G., Lai,F., Zytnicki,M., Notredame,C., Huang,Q. et al.(2010) Long noncoding RNAs with enhancer-like function inhuman cells. Cell, 143, 46–58.
55. Hemberg,M. and Kreiman,G. (2011) Conservation oftranscription factor binding events predicts gene expression acrossspecies. Nucleic Acids Res., 39, 7092–7102.
56. Liang,H.-L., Nien,C.-Y., Liu,H.-Y., Metzstein,M.M., Kirov,N.and Rushlow,C. (2008) The zinc-finger protein Zelda is a keyactivator of the early zygotic genome in Drosophila. Nature, 456,400–403.
57. Sandmann,T., Jensen,L.J., Jakobsen,J.S., Karzynski,M.M.,Eichenlaub,M.P., Bork,P. and Furlong,E.E.M. (2006) A temporalmap of transcription factor activity: Mef2 directly regulates targetgenes at all stages of muscle development. Dev. Cell, 10, 797–807.
58. McQuilton,P., St Pierre,S.E. and Thurmond,J. (2012) FlyBase101-the basics of navigating FlyBase. Nucleic Acids Res., 40,D706–D714.
59. Noveen,A., Daniel,A. and Hartenstein,V. (2000) Earlydevelopment of the Drosophila mushroom body: the roles ofeyeless and dachshund. Development, 127, 3475–3488.
60. Watts,R.J., Hoopfer,E.D. and Luo,L. (2003) Axon pruning duringDrosophila metamorphosis: evidence for local degeneration andrequirement of the ubiquitin-proteasome system. Neuron, 38,871–885.
61. Roignant,J.-Y. and Treisman,J.E. (2009) Pattern formation in theDrosophila eye disc. Int. J. Dev. Biol., 53, 795–804.
62. Reim,I. and Frasch,M. (2010) Genetic and genomic dissection ofcardiogenesis in the Drosophila model. Pediatr Cardiol, 31, 325–334.
63. Liu,T., Ortiz,J.a, Taing,L., Meyer,C.A., Lee,B., Zhang,Y.,Shin,H., Wong,S.S., Ma,J., Lei,Y. et al. (2011) Cistrome: anintegrative platform for transcriptional regulation studies. GenomeBiol., 12, R83.
64. Aerts,S. (2012) Computational strategies for the genome-wideidentification of cis-regulatory elements and transcriptionaltargets. Curr. Top. Dev. Biol., 98, 121–145.
65. Van Loo,P., Marynen,P. and Loo,P.V. (2009) Computationalmethods for the detection of cis-regulatory modules. Brief Bioinf.,10, bbp025.
66. Birnbaum,R.Y., Clowney,E.J., Agamy,O., Kim,M.J., Zhao,J.,Yamanaka,T., Pappalardo,Z., Clarke,S.L., Wenger,A.M.,Nguyen,L. et al. (2012) Coding exons function as tissue-specificenhancers of nearby genes. Genome Res., 22, 1059–1068.
67. Bailey,T.L. (2011) DREME: motif discovery in transcriptionfactor ChIP-seq data. Bioinformatics, 27, 1653–1659.
68. Merika,M. and Thanos,D. (2001) Enhanceosomes. Curr. Opin.Genet. Dev., 11, 205–208.
69. Carey,M. (1998) The enhanceosome and transcriptional synergy.Cell, 92, 5–8.
70. Kantorovitz,M.R., Kazemian,M., Kinston,S., Miranda-saavedra,D., Zhu,Q., Robinson,G.E., Gottgens,B., Halfon,M.S.and Sinha,S. (2009) Motif-blind, genome-wide discovery ofcis-regulatory modules in Drosophila and mouse. Dev. Cell, 17,568–579.
71. Li,L., Zhu,Q., He,X., Sinha,S. and Halfon,M.S. (2007)Large-scale analysis of transcriptional cis-regulatory modulesreveals both common features and distinct subclasses. GenomeBiol., 8, R101.
72. Ponting,C.P. and Hardison,R.C. (2011) What fraction of thehuman genome is functional? Genome Res., 21, 1769–1776.
73. Murali,T., Pacifico,S., Yu,J., Guest,S., Roberts,G.G. andFinley,R.L. (2011) DroID 2011: a comprehensive, integratedresource for protein, transcription factor, RNA andgene interactions for Drosophila. Nucleic Acids Res., 39,D736–D743.
74. Portales-Casamar,E., Thongjuea,S., Kwon,A.T., Arenillas,D.,Zhao,X., Valen,E., Yusuf,D., Lenhard,B., Wasserman,W.W. andSandelin,A. (2009) JASPAR 2010: the greatly expandedopen-access database of transcription factor binding profiles.Nucleic Acids Res., 38, D105–D110.
e114 Nucleic Acids Research, 2012, Vol. 40, No. 15 PAGE 16 OF 17

75. Down,T.A., Bergman,C.M., Su,J. and Hubbard,T.J.P. (2007)Large-scale discovery of promoter motifs in Drosophilamelanogaster. PLoS Comp. Biol., 3, e7.
76. Elemento,O. and Tavazoie,S. (2005) Fast and systematicgenome-wide discovery of conserved regulatory elements using anon-alignment based approach. Genome Biol., 6, R18.
77. Zhu,L.J., Christensen,R.G., Kazemian,M., Hull,C.J.,Enuameh,M.S., Basciotta,M.D., Brasefield,J.A., Zhu,C.,Asriyan,Y., Lapointe,D.S. et al. (2011) FlyFactorSurvey: adatabase of Drosophila transcription factor binding specificitiesdetermined using the bacterial one-hybrid system. Nucleic AcidsRes., 39, D111–D117.
78. Matys,V., Kel-Margoulis,O.V., Fricke,E., Liebich,I., Land,S.,Barre-Dirrie,A., Reuter,I., Chekmenev,D., Krull,M.,Hornischer,K. et al. (2006) TRANSFAC and its moduleTRANSCompel: transcriptional gene regulation in eukaryotes.Nucleic Acids Res., 34, D108–D110.
79. Stark,A., Lin,M.F., Kheradpour,P., Pedersen,J.S., Parts,L.,Carlson,J.W., Crosby,M.A., Rasmussen,M.D., Roy,S.,
Deoras,A.N. et al. (2007) Discovery of functional elements in 12Drosophila genomes using evolutionary signatures. Nature, 450,219–232.
80. Li,X.-yong, MacArthur,S., Bourgon,R., Nix,D., Pollard,D.A.,Iyer,V.N., Hechmer,A., Simirenko,L., Stapleton,M., LuengoHendriks,C.L. et al. (2008) Transcription factors bind thousandsof active and inactive regions in the Drosophila blastoderm.PLoS Biol., 6, e27.
81. Xie,Z., Hu,S., Blackshaw,S., Zhu,H. and Qian,J. (2010) hPDI: adatabase of experimental human protein-DNA interactions.Bioinformatics, 26, 287–289.
82. de Boer,C.G. and Hughes,T.R. (2012) YeTFaSCo: a database ofevaluated yeast transcription factor sequence specificities. NucleicAcids Res., 40, D169–D179.
83. Kurusu,M., Nagao,T., Walldorf,U., Flister,S., Gehring,W.J. andFurukubo-Tokunaga,K. (2000) Genetic control of development ofthe mushroom bodies, the associative learning centers in theDrosophila brain, by the eyeless, twin of eyeless, and Dachshundgenes. Proc. Natl Acad. Sci. USA, 97, 2140–2144.
PAGE 17 OF 17 Nucleic Acids Research, 2012, Vol. 40, No. 15 e114