i i would like to thank steinar kristoffersen, ivar
TRANSCRIPT

UNIVERSITY OF OSLODepartment of Informati sIndoor Positioning -Te hnologies, Servi esand Ar hite turesMari Saua SvalastogCand S ient Thesis7th May 2007


i
I would like to thank Steinar Kristoffersen, Ivar Jørstad, my parents, my colleagues,and Nils Christophersen for help and motivation to finish this work.

ii

Abstract
This thesis is about Location Based Computing Systems (LBCS), with emphasison their underlying positioning systems. The first part of the thesis introduces athree-layered reference model for discussing LBCS, and gives background infor-mation on positioning systems in general—components, designs, properties, andtechniques. It also includes an overview of existing systems for indoor positioning.
The second part of the thesis introduces a case study, which consists of two parts.One is an in-depth overview of a specific Location Based Service (LBS) called amobile electronic tour guide, a service typically implemented on hand-held deviceswhich are given to visitors at different exhibitions as a means for enhancing theirexperience of it. This results in a requirements specification. The other part ofthe case is a detailed description of a given museum, as an example of an indoorexhibition.
The third part of this thesis is an analysis of existing positioning solutions againstthe requirements specification and museum description. Based on the learningfrom this analysis, two proposals are provided. The first is adecision flow diagramwhich can help future developers to choose positioning system for a given LBS.The other is the proposal of a system wide service oriented architecture for futureLBCSs, which can improve on the short-comings of existing systems’ ability toaccomodate various environments and services.
iii

iv ABSTRACT

Contents
Abstract iii
1 Introduction 1
1.1 Problem Statements . . . . . . . . . . . . . . . . . . . . . . . . . 4
1.2 Method . . . . . . . . . . . . . . . . . . . . . . . . . . . . . . . 5
1.3 Contributions . . . . . . . . . . . . . . . . . . . . . . . . . . . . 6
1.4 Related Work . . . . . . . . . . . . . . . . . . . . . . . . . . . . 7
1.5 Document Structure . . . . . . . . . . . . . . . . . . . . . . . . . 7
2 Location Based Computing Systems 9
2.1 Introducing a Model for Discussing LBCSs . . . . . . . . . . . . 9
2.2 Fundamentals of Positioning Systems . . . . . . . . . . . . . . . 11
2.2.1 Positioning System Components . . . . . . . . . . . . . . 12
2.2.2 Positioning System Designs . . . . . . . . . . . . . . . . 13
2.2.3 Positioning System Properties . . . . . . . . . . . . . . . 14
2.2.4 Position Sensing Techniques . . . . . . . . . . . . . . . . 17
2.3 Sensor Fusion . . . . . . . . . . . . . . . . . . . . . . . . . . . . 22
2.4 Summary . . . . . . . . . . . . . . . . . . . . . . . . . . . . . . 22
3 Indoor Positioning Technologies 23
3.1 General Properties of Wireless Technology . . . . . . . . . . .. 23
3.1.1 Waves . . . . . . . . . . . . . . . . . . . . . . . . . . . . 24
v

vi CONTENTS
3.1.2 Propagation Mechanisms . . . . . . . . . . . . . . . . . . 25
3.1.3 Frequency Regulations . . . . . . . . . . . . . . . . . . . 27
3.2 Infrared (IR) . . . . . . . . . . . . . . . . . . . . . . . . . . . . . 27
3.2.1 IrDA . . . . . . . . . . . . . . . . . . . . . . . . . . . . 27
3.2.2 Diffuse IR . . . . . . . . . . . . . . . . . . . . . . . . . . 28
3.2.3 IR-based Positioning Systems . . . . . . . . . . . . . . . 28
3.3 Radio Frequency (RF) . . . . . . . . . . . . . . . . . . . . . . . 29
3.3.1 The 802.11 WLAN Family . . . . . . . . . . . . . . . . . 29
3.3.2 The 802.15 WPAN Family . . . . . . . . . . . . . . . . . 31
3.3.3 Radio Frequency Identification (RFID) . . . . . . . . . . 35
3.4 Ultrasound (US) . . . . . . . . . . . . . . . . . . . . . . . . . . . 37
3.5 Other Positioning Technologies . . . . . . . . . . . . . . . . . . . 38
3.5.1 Electromagnetic Sensing . . . . . . . . . . . . . . . . . . 38
3.5.2 Optical Systems . . . . . . . . . . . . . . . . . . . . . . 39
3.5.3 Detecting Physical Contact . . . . . . . . . . . . . . . . . 39
3.6 Summary . . . . . . . . . . . . . . . . . . . . . . . . . . . . . . 39
4 Existing Indoor Location Systems 41
4.1 The Classic Four . . . . . . . . . . . . . . . . . . . . . . . . . . 42
4.1.1 Active Badge . . . . . . . . . . . . . . . . . . . . . . . . 42
4.1.2 Active Bat . . . . . . . . . . . . . . . . . . . . . . . . . 43
4.1.3 Cricket . . . . . . . . . . . . . . . . . . . . . . . . . . . 44
4.1.4 RADAR . . . . . . . . . . . . . . . . . . . . . . . . . . . 46
4.2 Infrared-based Location Systems . . . . . . . . . . . . . . . . . . 47
4.2.1 PARCTAB . . . . . . . . . . . . . . . . . . . . . . . . . 47
4.2.2 Locust Swarm . . . . . . . . . . . . . . . . . . . . . . . 48
4.2.3 IRIS-LPS . . . . . . . . . . . . . . . . . . . . . . . . . . 48
4.3 Radio-based Location Systems . . . . . . . . . . . . . . . . . . . 49
CONTENTS vii
4.3.1 WLAN Based Systems . . . . . . . . . . . . . . . . . . . 49
4.3.2 Bluetooth Based Systems . . . . . . . . . . . . . . . . . . 50
4.3.3 PAL650 UWB System . . . . . . . . . . . . . . . . . . . 52
4.4 Ultrasound-based Location Systems . . . . . . . . . . . . . . . . 53
4.4.1 DOLPHIN . . . . . . . . . . . . . . . . . . . . . . . . . 53
4.4.2 Bristol Indoor Positioning System . . . . . . . . . . . . . 54
4.4.3 Ultrasonic 3D Position Estimation Using a Single BaseStation . . . . . . . . . . . . . . . . . . . . . . . . . . . 54
4.5 Summary . . . . . . . . . . . . . . . . . . . . . . . . . . . . . . 55
5 Location Based Services for Indoor Exhibitions 57
5.1 Problem Area . . . . . . . . . . . . . . . . . . . . . . . . . . . . 58
5.1.1 Characteristics of Indoor Exhibitions . . . . . . . . . . . 58
5.1.2 Mobile Electronic Tour Guides . . . . . . . . . . . . . . . 59
5.2 Case: The Astrup Fearnley Museum of Modern Art . . . . . . . . 66
5.2.1 Detailed Description . . . . . . . . . . . . . . . . . . . . 66
5.2.2 Museum Application Requirements . . . . . . . . . . . . 68
5.3 Summary . . . . . . . . . . . . . . . . . . . . . . . . . . . . . . 75
6 Analysis 77
6.1 Structured Analysis . . . . . . . . . . . . . . . . . . . . . . . . . 77
6.1.1 Category 1 Systems . . . . . . . . . . . . . . . . . . . . . 78
6.1.2 Category 2 Systems . . . . . . . . . . . . . . . . . . . . . 84
6.1.3 Category 3 Systems . . . . . . . . . . . . . . . . . . . . . 87
6.1.4 Technologies or Systems Not Analysed . . . . . . . . . . 90
6.2 Discussion . . . . . . . . . . . . . . . . . . . . . . . . . . . . . . 91
6.2.1 Simplifying and Rating the Analysis Results . . . . . . . 92
6.2.2 Analysis Results vs Positioning Techniques . . . . . . . .93
6.2.3 Analysis Results vs Positioning Techniques and Technology 96

viii CONTENTS
6.2.4 Better Solutions with Sensor Fusion? . . . . . . . . . . . 98
6.3 Results and Suggestions . . . . . . . . . . . . . . . . . . . . . . 99
6.3.1 Decision Flow Diagram for Choosing Positioning System 99
6.3.2 Applying Service Oriented Architectures (SOA) for Loca-tion Based Computing Systems . . . . . . . . . . . . . . 102
6.4 Summary . . . . . . . . . . . . . . . . . . . . . . . . . . . . . . 107
7 Conclusion 109
7.1 Achievements and Results . . . . . . . . . . . . . . . . . . . . . 109
7.2 Critical review and Future Work . . . . . . . . . . . . . . . . . . 110

List of Figures
1.1 Different types of contextual information can be utilised to enhanceservices. . . . . . . . . . . . . . . . . . . . . . . . . . . . . . . . 2
1.2 Example of an electronic museum guide. . . . . . . . . . . . . . . 3
2.1 A three-layered model for discussing location based services andthe technologies used to realise them . . . . . . . . . . . . . . . . 10
2.2 Components of a positioning system . . . . . . . . . . . . . . . . 12
2.3 Remote-positioning vs self-positioning . . . . . . . . . . . .. . . 13
2.4 Different transmitter coverages and configurations . . .. . . . . . 15
2.5 The different stages in the life cycle of a positioning system . . . . 17
2.6 Trilateration in 2D. . . . . . . . . . . . . . . . . . . . . . . . . . 19
2.7 Triangulation in 2D. . . . . . . . . . . . . . . . . . . . . . . . . . 20
2.8 Larger vs smaller cells and coverage in a proximity system . . . . 21
3.1 This chapter will review wireless technologies that canbe used forindoor positioning. This is a part of the positioning layer.. . . . . 24
3.2 Wave properties . . . . . . . . . . . . . . . . . . . . . . . . . . . 24
3.3 Examples of reflection, refraction, and diffraction . . .. . . . . . 26
3.4 ZigBee physical device types . . . . . . . . . . . . . . . . . . . . 34
3.5 A summary of passive vs active RFID . . . . . . . . . . . . . . . 36
4.1 This chapter will review existing location systems and their under-lying positioning systems. . . . . . . . . . . . . . . . . . . . . . 42
ix

x LIST OF FIGURES
4.2 An Active Badge . . . . . . . . . . . . . . . . . . . . . . . . . . 43
4.3 A prototype headset used in IRIS-LPS. . . . . . . . . . . . . . . . 49
5.1 This chapter will review location based services on layer 3. . . . . 57
5.2 Traditional museum guide using a megaphone so that everyone inthe group can hear him. . . . . . . . . . . . . . . . . . . . . . . . 59
5.3 The Cyberguide system . . . . . . . . . . . . . . . . . . . . . . . 62
5.4 Infrared transmitters in the fresco room in Torre Aquila. . . . . . . 63
5.5 TaggedX technical set-up . . . . . . . . . . . . . . . . . . . . . . 64
5.6 Layout of the Astrup Fearnley museum. Ground floor above,andlower ground floor below. The gray areas are the exhibition areas.The white areas include restrooms, shop, information center etc. . 67
5.7 Pictures from the case study exhibition . . . . . . . . . . . . . .. 69
5.8 Requirements prioritised . . . . . . . . . . . . . . . . . . . . . . 74
6.1 Summary table for structured analysis . . . . . . . . . . . . . . .78
6.2 Examples of RFID SD/CF readers . . . . . . . . . . . . . . . . . 82
6.3 Examples of RFID reader costs . . . . . . . . . . . . . . . . . . . 82
6.4 Summary of analysis . . . . . . . . . . . . . . . . . . . . . . . . 91
6.5 Revised and sorted summary table from the analysis . . . . .. . . 93
6.6 Summary table of triangulation and scene analysis systems . . . . 94
6.7 Summary table of proximity systems . . . . . . . . . . . . . . . . 94
6.8 Number of rooms vs number of artefacts, and possible system choices. 97
6.9 Summary table of systems with regards to positioning techniqueand technology . . . . . . . . . . . . . . . . . . . . . . . . . . . 98
6.10 Decision Flow Diagram . . . . . . . . . . . . . . . . . . . . . . . 100
6.11 The main technologies of XML Web Services, which can be usedto realise a service oriented architecture. . . . . . . . . . . . . .. 103
6.12 Substituting one positioning system for another without requiringchanges in the layers above. . . . . . . . . . . . . . . . . . . . . 104
6.13 Mapping the layers of our reference model to services ina SOA. . 104

LIST OF FIGURES xi
6.14 The architecture of most LBCSs today. . . . . . . . . . . . . . . .105
6.15 SOA concept applied for LBCS. . . . . . . . . . . . . . . . . . . 106
6.16 Using SOA system wide for increased flexibility. . . . . . .. . . 106

xii LIST OF FIGURES

Chapter 1
Introduction
Context-aware computing is a computing paradigm in which services can discoverand take advantage of contextual information.Context is defined in [1] as anyinformation that can be used to characterise the situation of an entity. This meansthat almost any information available at the time of an interaction can be seen ascontext information, such as time of day, noise level, who you are with, accessibledevices, and availability of resources like battery, display, network, or bandwidth.An example of contextual information is given in figure 1.1 onthe following page.
Services that can extract, interpret and use contextual information are said to becontext-aware. One of the most used types of context islocation. A large range ofservices are based on knowing where something or somebody is—they arelocationaware, or location based. The latter term has recently become the more common,and will be used throughout this thesis.
Location based services (LBSs) can be divided into several categories. These aregiven below with examples for each category:
Navigation Car navigation with best-route suggestion or indoor navigation sup-port in large buildings using an electronic map, e.g. in museums, plants orhospitals.
Location-sensitive information Digital distribution of content to mobile devicesbased on their location, like weather cast services, routing of telephone calls,mobile advertising, and electronic museum guides which allow a visitorequipped with a mobile device to get additional informationabout the arte-facts in close proximity to him.
Tracking Tracking of people or valuable assets, like children, elderly people andexpensive equipment, or tracking of large amounts of objects in supply chainmanagement or in a warehouse.
1

2 CHAPTER 1. INTRODUCTION
Figure 1.1: Different types of contextual information can be utilised to enhanceservices.
Security Monitoring and access control.
Directory services Where in this building is the nearest printer? Where is thenearest hairdresser saloon?
Emergency servicesA mobile user can call for assistance and at the same timeautomatically reveal his exact location to the emergency service called, likepolice, ambulance, automotive assistance, etc.
To be able to provide such location based services, we need anunderlying positionsensing system, henceforth only referred to as thepositioning system. In chapter 2(see section 2.1 on page 9) we will define and discuss the use ofthe wordspositionandlocation in detail.
The satellite-based Global Positioning System (GPS) is theprevalent of all currentpositioning systems. It enables a GPS receiver anywhere on earth to determine itsposition free of charge with an accuracy within 15 metres. This is sufficient for awide range of services—according to an article published inScientific AmericanMay 2004 [2], GPS now serves more than 30 million users worldwide. The bigdisadvantage with GPS is that because the receiver needs line of sight to at leastfour satellites in the sky, it won’t work inside buildings orin other cases wherethere are obstructions between the GPS receiver and the satellites. In addition, theaccuracy is too low for most LBSs used in indoor environments.
A lot of research in the cellular telephone networks community the last few yearshave been focused on how these networks can be used for positioning. These sys-tems have the advantage of functioning both indoors and outdoors, but as with GPS

3
Figure 1.2: Example of an electronic museum guide.
they typically lack the accuracy needed for indoor use. One of the best solutionspresented this far has an accuracy of 5 metres [3].
This thesis addresses the field ofLocation Based Computing Systems(LBCSs) forindoor environments. An LBCS consists of one or more location based services(LBSs), and the underlying technologies used to realise them. As we saw above, alarge range of LBSs exist. These put different requirementson the underlying po-sitioning technology. In this thesis, we will focus on LBSs in the domain of indoorexhibitions, like museums, galleries, fairs, and the like.In recent years, a lot ofresearch has been performed in this domain, especially onmobile electronic tourguides(see figure 1.2). A mobile electronic tour guide is a means forenhancingthe experience of a visitor to an exhibition, for example a museum. The visitor willbe equipped with an electronic device with a screen, which can communicate to itsuser where he or she is on a map. It can also provide the visitorwith informationabout the different artefacts he or she is looking at. The reason for choosing theexhibitions domain and electronic tour guides is that they face the underlying po-sitioning system with all the typical requirements all indoor LBSs do. In addition,they have the more specific requirements needed to support a service which pro-vides the user with information about the artefacts in his immediate surroundings,which adds an extra challenge to the positioning system. As it is likely that LBSswill be more and more advanced, we choose a complex LBS which help us revealrequirements posed to the positioning technology and the challenges faced in thisarea.
Many indoor positioning systems exist, representing a broad range of differentpositioning techniques and technologies. The problem is that current systems oftenare results of research that focus on solving one specific property of the positioning

4 CHAPTER 1. INTRODUCTION
system, typically at the cost of sacrificing other importantproperties. For example,positioning systems with millimetre accuracy exist, but they are so expensive thatonly the military or film industry can afford them. Another example is systemsthat do not need any wired infrastructure. This makes them easy to install, but atthe cost of time-consuming maintaining as batteries need tobe replaced at all thewireless infrastructure nodes. Another problem with this field of research is that itis relatively young. A lot of solutions and early trials havebeen described in theliterature, but few of them are very in-depth or are investigated further by otherresearchers.
This thesis will show that choosing which positioning solution to use for a givenLBS is difficult. This will be revealed by using a simulated case, in which a com-plex location based electronic tour guide is to be implemented in a given museum.To better understand the challenges faced by the positioning system supporting thisLBS, the first chapters will give a general introduction to positioning systems andtechnologies. When the case has been introduced, an extensive analysis of existingpositioning solutions against the LBS requirements is performed. Finally, a toolfor choosing positioning system for future LBCSs and a proposal of an improvedLBCS architecture are discussed.
1.1 Problem Statements
The goal of this thesis is threefold: First, it is to give a detailed introduction tothe field of indoor LBCSs and their challenges. Second, it is to provide sometools that can help others in need for a positioning system tochoose among themany possible solutions that exist. Third, we will look for an architecture proposalthat can be used by future positioning system developers to deal with importantchallenges we have identified.
The general problem statement has been the following:
What kind of positioning system would best fulfil the requirementsof location based services used in indoor exhibitions?
In order to answer this statement, six specific problem statements have been de-fined.
1. How is positioning done?
2. What technologies exist that may be used for positioning?
3. What are the requirements and challenges of positioning systems supportingLBSs in indoor exhibitions?

1.2. METHOD 5
4. Are there any currently available positioning systems that meet these require-ments and challenges?
5. Is it possible to formalise the procedure of selecting positioning system ac-cording to given requirements?
6. Are there any severe limitations of existing LBCSs?
Statement number three above implies that we have to find out what the require-ments of such LBSs are. We also need to know something about the premises thathouses the exhibition. Thus, we have chosen to use a case to help us with gather-ing such knowledge. The case used is the NorwegianAstrup Fearnley Museum ofModern Art. More on the use of this case will be discussed in section 1.2.
1.2 Method
The following methods have been used in this thesis to address the problem state-ments.
Theory Study An extensive theory study of positioning systems in general, po-sitioning techniques, wireless technologies, existing positioning systems and loca-tion based tour guides is carried out. Many technological details are left out, thegoal is to get an overall understanding of the positioning system research field, andnot how the technology is realised.
In the initial phase of the work with this thesis, much emphasis and effort was putin finding state of the art literature. A recent brief search for the main topics inthe thesis was performed, but revealed little new on the field. It seems like thefield of indoor positioning has been “stabilised”, in that current research is mostlyconcerned with improvements of existing solutions.
Case Study As stated in the problem statements section, we will need exten-sive information about LBS requirements and the exhibitionpremises where it willoperate, before we can evaluate if existing positioning solutions can sufficientlysupport this service. As a means for gathering all this information, we will use asemi-hypothetical, or semi-simulated, case. As we are not going to implement ordevelop a positioning solution, we don’t need a real case where the customer spec-ifies the requirements. Rather, we use a simulated case, where we can add all therequirements we want. The main advantage of using a simulated case, is that wecan include as many details as possible, and by this increasethe possibility that thecase will provide valuable learning for future use. A real case typically includes

6 CHAPTER 1. INTRODUCTION
some specific requirements that are not relevant to others, or have too few detailsto be of any interest.
The case we will use is a mobile electronic tour guide in the Norwegian AstrupFearnley Museum for Modern Art. The reason for calling the case semi-simulated,is that we will use real premises and exhibitions, but that the requirements for thetour guide will be artificial, that is, made by us and not a customer.
To get a better understanding of what is going on in the museum, interview andobservationwas used. A person with extensive knowledge about the museumwasinterviewed. She had been working as a receptionist and guide at the museum forseveral years. To complement the interview, two days were spent in the museum,with an exhibition change in between. How the exhibits were arranged, what kindof artefacts there were, the number of artefacts, how visitors behaved and so onwere observed.
Analysis A requirements specification for a tour guide LBS based on thecase isdeveloped, and an analysis of existing positioning solutions against these require-ments is performed. Also taken into account is the specific premises of the AstrupFearnley museum. For each system we assume that it is going tobe used for theLBS in the given museum, and evaluate how well the requirements are fulfilled. Tomake it easier to draw some general conclusions from the analysis, tables are usedfor representing the results in different ways.
1.3 Contributions
There are three main contributions in this thesis. First, itgives a detailed introduc-tion to the field of indoor location based computing systems (LBCSs) in general,with emphasis on the underlying positioning systems. Then it provides an intro-duction to the domain of indoor exhibitions and mobile electronic tour guide LBSsused in these.
Second, this thesis provides a proposal of a tool called adecision flow diagram.This is supposed to help others to choose what kind of positioning system theyshould use, based on their LBS requirements and the premisesin which it willoperate.
Last, as a consequence of the problems with choosing the right positioning system,this thesis suggests a new flexible architecture for future LBCSs, based on the ser-vice oriented architecture (SOA) concept. The goal of this architecture is to make iteasy to substitute one positioning system with another, with changing requirementsfrom LBSs.

1.4. RELATED WORK 7
1.4 Related Work
A lot of positioning systems have been proposed, both academic and commercial.These use a variety of different positioning techniques andtechnologies. The Ac-tive badge system [4] from 1992 is among the first positioningsystems described.It provided room scale accuracy for tracking people in an office building. Threeother systems followed, with the aim of solving different challenges of the Activebadge system. Active bat [5] provided a much higher accuracyat centimetre level,Cricket [6] focuses on solving privacy issues and removing wires from the infras-tructure, and RADAR [7] tries to utilise already existing WLAN infrastructure forpositioning, removing the need for special infrastructurecompletely. Since thesesystems, the “Classic Four”, there has been a boom of other solutions. Some posi-tioning solutions have even been made with electronic tour guides and exhibitionsin mind, like in Cyberguide [8], Torre Aquila [9] and TaggedX[10]. The short-coming of most solutions is that they focus on only a limited set of positioningrequirements, or on a specific LBS.
Taxonomies have been developed to aid developers of location based services tochoose positioning system [11, 12]. This work include a listof different positioningsystem properties that should be evaluated. This is very useful for getting a deeperunderstanding of a certain positioning system, but is less valuable in cases wherehelp for choosing which positioning system to use should be decided. This isbecause it does not take into account the premises in which the system is to beinstalled, or how the building is used. Much emphasis shouldalso be on the specificdomain the positioning system is a part of.
Architectures for LBCSs have been proposed in [13, 14, 15]. However, most of theexisting systems today are proprietary.
1.5 Document Structure
In addition to this introductory chapter, this thesis consists of six more chapters.
Chapter 2 starts with introducing a reference model for discussing Location BasedComputing Systems (LBCSs). It then gives an introduction tothe field of position-ing systems by evaluating their components, designs, properties, and how position-ing can be done.
An overview of wireless technologies that can be used to implement a positioningsystem is provided inchapter 3.
In chapter 4, existing positioning systems are described.
In chapter 5, an introduction to mobile electronic tour guides and positioning tech-

8 CHAPTER 1. INTRODUCTION
nology for indoor exhibitions is provided, together with a description of the mu-seum used in the case study. A requirements specification is developed.
Chapter 6 starts with a detailed analysis of existing positioning solutions accord-ing to the requirements specification developed in chapter 6. Then follows a dis-cussion of the analysis results, which leads to our two proposals: a decision flowdiagram that can help choosing positioning system for an LBS, and a SOA basedarchitecture for future LBCSs.
Chapter 7 provides the conclusion of this thesis. It includes a discussion of howthe thesis has managed to answer the problem statements, a list of contributions,limitations of the thesis and future work.

Chapter 2
Location Based ComputingSystems
This chapter is an introduction to what we in this thesis willcall Location BasedComputing Systems (LBCSs). As the use of the terms position,location, position-ing systems and location systems can be confusing, we will define these terms andprovide a three-layered reference model which will be used throughout the thesisas a means for guiding the reader on which level in the LBCS thediscussed issuesare handled.
The bottom layer in our reference model is the positioning system. This is wherethe actual physical positioning occurs. Various issues on positioning systems willbe described in detail in this chapter, to provide an understanding of the issues thatare to be considered when working with such systems. Issues belonging to layer 2and layer 3 in our model will be discussed in chapter 4 and chapter 5.
2.1 Introducing a Model for Discussing LBCSs
As mentioned in the introduction to chapter 1, the wordspositionandlocationaresometimes used interchangeably. Others refer to “position” as a point in space witha specified 3D coordinate, and to “location” as a defined placeor area with an as-signed label [16]. Thus, any x,y,z triple in a given reference grid, for example aposition on earth given by latitude, longitude and altitude, is a position. Positionsare often said to be physical, while locations as defined above are said to be sym-bolic. A system providing physical positions can usually beaugmented to providecorresponding symbolic location information. An example can be to find the near-est printer given the physical position. In this thesis we will use these distinguisheddefinitions of position and location:
9

10 CHAPTER 2. LOCATION BASED COMPUTING SYSTEMS
Figure 2.1: A three-layered model for discussing location based services and thetechnologies used to realise them
Position is a point in space with a specific 2D or 3D coordinate withrespect to a certain reference grid.
Location is a defined place or area with an assigned label.
We will also assume a three-layered model for discussing location based services(LBSs) and the technologies used to realise them (see figure 2.1). There are tworeasons for introducing this model:
1. It will help clarify how we distinguish a positioning system from a locationsystem in this thesis, although they are often used interchangeably by others.
2. It emphasises the major components of an LBCS, and allows us to focus onthe interfaces between these.
Together, the three layers in our model constitute what we will call a LocationBased Computing System (LBCS). We will refer to this model and the respectivelayers throughout the thesis.
Our model is similar to the Open System Interconnect (OSI) reference model forcomputer networks. It is a layered model, where each layer builds on the layerbelow. Interfaces between the layers can be used to achieve decoupling betweendifferent parts of a system, as a layer can be substituted by another without havingto alter components at other layers. Similar models are alsosuggested by others.The six-layerLocation Stackis a set of design abstractions for location systems forubiquitous computing [13]. Other models are the four-layersystem architecturessuggested in [15, 14].
With respect to LBCSs architectures, this thesis is concerned with achieving flex-ible introduction of positioning systems, and flexible introduction of LBSs. Our

2.2. FUNDAMENTALS OF POSITIONING SYSTEMS 11
model is therefore a simplified version of the ones referred to above, focusing pri-marily on flexibility between layer 1 and 2 and between layer 3and 2. The othermodels consider also internal organisation of what we referto as layer 2, but thisis out of scope for this thesis.
By flexibility we mean that different positioning systems could be used in the pro-visioning of location information to an LBS, and that new positioning systemscould be added without the need for changes in the LBS. For this we need a middlelayer, which takes care of translating positions (i.e. fromthe positioning layer) tolocations which can be used by the LBSs. Without this middle layer, each LBSwould have to be designed to take advantage of positions fromeach positioningsystem.
The three layers of our model are described below, starting with the lowest layer asthe other two build on this one:
Positioning System In layer 1, we find the positioning systems. This is where theactual, physical positioning occurs. Sensor hardware and low level softwaregather raw sensor data, compute positions based on these data, and convertthem to standardised physical position representations which are accessibleby layer 2. These representations could be for example x,y,ztriples, or MACaddress pairs of receivers and sensed entities. We will lookmore at thecomponents and processes of the positioning layer in section 2.2. In chapter3 we will look at technologies that can be used for positioning.
Location System The location systems in layer 2 are used to provide meaning tophysical positions provided by layer 1. This could be to givea symbolic labelto a position, like “close to object A” or “in room B”, or to plot the positionon a map. The location system also maintains databases that map physicalpositions with symbolic locations and vice versa. This enables services onlayer 3 to make use of the position information.
Location Based Services (LBSs)In layer 3 we find the location based services(LBSs), like those described in the introduction to chapter1. In chapter 5 wewill look closer at several such services, which together constitute a mobileelectronic tour guide.
2.2 Fundamentals of Positioning Systems
We will now look closer at the positioning systems in layer 1 in our proposed three-layered model. First, we will look at the components of such systems, and then wewill describe two different positioning system designs. Then follows an overviewof positioning system properties, we introduce the concept“sensor fusion”, andfinally we will look at how positioning can actually be done.
12 CHAPTER 2. LOCATION BASED COMPUTING SYSTEMS
Figure 2.2: Components of a positioning system
2.2.1 Positioning System Components
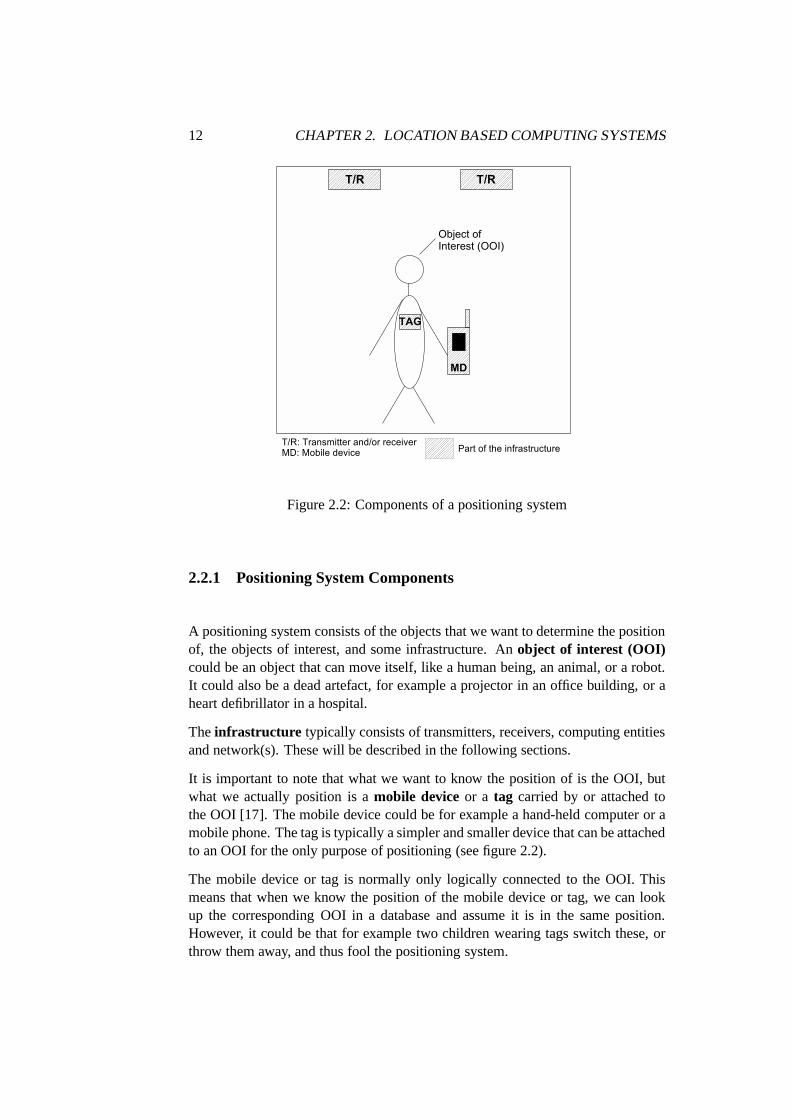
A positioning system consists of the objects that we want to determine the positionof, the objects of interest, and some infrastructure. Anobject of interest (OOI)could be an object that can move itself, like a human being, ananimal, or a robot.It could also be a dead artefact, for example a projector in anoffice building, or aheart defibrillator in a hospital.
Theinfrastructure typically consists of transmitters, receivers, computingentitiesand network(s). These will be described in the following sections.
It is important to note that what we want to know the position of is the OOI, butwhat we actually position is amobile deviceor a tag carried by or attached tothe OOI [17]. The mobile device could be for example a hand-held computer or amobile phone. The tag is typically a simpler and smaller device that can be attachedto an OOI for the only purpose of positioning (see figure 2.2).
The mobile device or tag is normally only logically connected to the OOI. Thismeans that when we know the position of the mobile device or tag, we can lookup the corresponding OOI in a database and assume it is in the same position.However, it could be that for example two children wearing tags switch these, orthrow them away, and thus fool the positioning system.

2.2. FUNDAMENTALS OF POSITIONING SYSTEMS 13
Figure 2.3: Remote-positioning vs self-positioning
2.2.2 Positioning System Designs
The objects of interest (OOIs) are associated with either the positioning infrastruc-ture transmitters or the receivers, and this gives two different system designs [11,12]. These are described in figure 2.3. Inremote-positioning, a. to the left inthe figure, the OOIs are associated with the transmitters, and receivers are placedin the surrounding environment. The transmitters emit signals that are detectedby the receivers and sent to a central computing entity for processing and positiondetermination. In aself-positioningscheme, b. to the right in the figure, the OOIsare associated with the receivers which detect signals emitted from surroundingtransmitters. The computing is done by a device carried by orattached to the OOI,which the receiver is connected to or integrated in. How the positioning is donewill be described in section 2.2.4 on page 17.
By using remote-positioning, the burden of the computing islaid on the infrastruc-ture. This means that the transmitter device or tag associated with the OOI couldbe relatively simple, and thus typically use less power, have smaller form factorand be less expensive than a device or tag in a self-positioning scheme.
On the other hand, using self-positioning could help ensureprivacy. In systemswhere human beings are being tracked, by positioning of a tagattached to theperson or a mobile device known to be used by a certain person,privacy is animportant issue. A location based computing system should not violate any privacyrights, and for a location based service to be accepted and adopted by its usersit also needs to be trusted. Gathered information should notbe used for otherpurposes than agreed upon in advance, and the user should be able to turn thetracking feature off at any time.

14 CHAPTER 2. LOCATION BASED COMPUTING SYSTEMS
2.2.3 Positioning System Properties
This section will review the properties of a positioning system [11, 17]. These arenecessary to understand, as a positioning system requirements specification for alocation based service typically is based on them, as we willsee in chapter 5, andas they are used to compare different positioning systems.
Accuracy and Related Properties
Accuracy is the most obvious property to consider when evaluating andcomparingdifferent positioning systems. Accuracy is a measure of thecloseness of one ormore positions to a position that is known and defined in termsof an absolutereference system [18]. “Absolute” means that it uses a shared reference grid forall the OOIs, so that two objects at precisely the same place will report equivalentpositions. The known position is often referred to as the “true position”. Accuracyis given in kilometres, metres, centimetres etc.
Precision, on the other hand, is a measure given in percent, and is basedon arelative reference system that is unique to the device making the measurements.For example, if the OOI is a lost valuable asset with an attached transmitter, eachreceiver device that is searching for it reports the object’s position relative to itself.Precision is a measure of repeatability, and it tells us how often we can expect to geta given accuracy. For example, if 95% of a system’s position readings are within10 cm of the true position, it would be said to have an accuracyof 10 cm 95% ofthe time, or 10 cm at 95% confidence.
The accuracy of position information needed vary from application to application.For example, finding a nearby printer requires less accuracythan finding a book ina large library [19]. In general, the accuracy and precisionrequired dictate the costand complexity of the positioning system. Positioning systems that provide highaccuracy tend to require a lot of specialised infrastructure or expensive mobiledevices.
Closely related to the accuracy of a positioning system is the update rate or po-sition rate—how often the position of an OOI is computed. High update rate iscrucial for systems which goal is to trace users or objects inreal-time. Other sys-tems can manage with lower update rates, but all systems should have an updaterate which matches the accuracy to capture as many changes aspossible.
Another property that is related to accuracy isadaptive fidelity. A positioningsystem with adaptive fidelity can “adjust its precision in response to dynamic sit-uations such as partial failures or directives to conserve battery power” [11]. Forexample, if a mobile device in a self-positioning system needs to detect signalsfrom four different transmitters to compute its accurate position and it only receives

2.2. FUNDAMENTALS OF POSITIONING SYSTEMS 15
Figure 2.4: Different transmitter coverages and configurations
signals from two transmitters, it cannot compute its accurate position. However,it could still know something about its position by knowing which transmitters itreceives signals from and where these are placed. Or, to conserve battery power,mobile devices in a remote-positioning system could decrease their signalling ratewhen they are not moving.
Research has shown that as long as users are informed about the status of the po-sition accuracy, precision and update rate, periods with lower performance are ac-cepted. When the user is informed he can adjust his expectations [20, 21]. Like-wise, it is clever to represent the estimated inaccuracy of positions to users, toreduce confusion if for example a position showed on a map does not match thereal world [22].
Scale and Scalability
The scale of a positioning system is another important property. Objects can belocated worldwide, within a metropolitan area, throughouta building, or within asingle room. A measurement unit that can be used to describe scale is the coveragearea per unit of infrastructure. From figure 2.4 we can see some different coverageconfigurations. The crosses are transmitters with a coverage area given by theradiusr. In a) we can see that there is one transmitter, which does not have goodenough reach to cover the whole room. OOIs in the corners would not be detected.In b) there are four transmitters, but these have even smaller coverage so there arestill areas that are not covered (outside the circles). In ) there are two transmitterswith longer reach, and we can see that the areas without coverage is smaller, andthat there is one area that is covered by both transmitters (shaded).
In addition to physical reach, scale includes the system’s ability to position severalobjects simultaneously. In an office covering several floorsin a large building, hun-dreds of personnel and maybe thousands of items of equipmentmight be tracked.A measurement of this ability is the number of objects the system is able to positionper unit of infrastructure per time interval.

16 CHAPTER 2. LOCATION BASED COMPUTING SYSTEMS
Scalability denotes how easily a system scales, that is how easy it is to expand thesystem either by physical coverage or by adding more and moreOOIs. Typically, asystem is expanded by adding more infrastructure, which canbe very cumbersomeand expensive.
Easy Deployment, Integration and Configuration
A positioning system’s infrastructure should be easy to deploy, to integrate intothe existing environment and to configure. Deployment is made easy by smallamounts of transmitters/receivers and none or little specialised cabling. As wewill see in the next chapter, some positioning systems can actually take advantageof existing computer networks as a means of determining positions, thus savinga lot of work during implementation. In a system using tags attached to OOIs,these should be small, lightweight, and wireless so that motion of the objects is nothindered and that they do not disturb the wearer. Transmitters/receivers placed inthe environment and power cords and network cables should beunobtrusive. Whenthe infrastructure is in place, the configuration of the system should require as littlemanual work as possible.
Power Consumption
As we saw above, little specialised cabling makes deployment easier. Thus, severalpositioning systems have wireless transmitters and/or receivers in their infrastruc-ture [23, 20]. However, wireless devices need a power source, typically a batteryalthough alternative sources such as solar panels can also be used. In a large systemthere will be a great number of transmitters and/or receivers distributed over a largearea, and maintaining batteries on all these could be a cumbersome task [4, 24].Thus, a wired infrastructure network has the advantage of easier power feedingthan a wireless infrastructure.
To minimise the task of replacing or recharging batteries onwireless infrastructuretransmitters, the signal rate is a very important design issue [4]. As we saw in thediscussion of accuracy and update rate (see 2.2.3 on page 14), higher signal ratemay lead to better accuracy. On the other hand, with lower signal rate the batterieswill last much longer, reducing the task of maintaining them. One solution to thisproblem could be to use anadaptive signalling rate(see also adaptive fidelity insection 2.2.3 on the page before). For example, in a system called Active Badge(see section 4.1.1 on page 42), the signalling units in the badges (tags) worn bypersonnel have a light-dependent component that make them increase the time in-terval between emitted signals to save power when the badge is left in a dark roomor a drawer. Another issue which affects power consumption is the signal strength.More strength gives longer range and better coverage, but requires more power.

2.2. FUNDAMENTALS OF POSITIONING SYSTEMS 17
Figure 2.5: The different stages in the life cycle of a positioning system
Costs
Figure 2.5 shows the different stages in the life cycle of a positioning system:purchase, deployment, configuration, monitoring, maintaining, and reconfigura-tion/extension. It is important to remember that costs is not only related to initialhardware and software investments, but to all the other stages as well. The morestaff required in the different stages, the more expensive the positioning systemwill be.
According to [11] the costs of a positioning system can be assessed in several ways,not only by the most common use of the term which is capital costs. Other types ofcosts can be time costs, space costs and incremental costs. In some cases, limitedtime or space available might be the main constraints when choosing a positioningsystem, not capital costs.
Limitations
All positioning systems have some limitations, which are very important to beaware of. Some systems will not function in certain environments, for exampleindoors, and some systems need line of sight, that is, no obstructions, betweenthe mobile device and the transmitters/receivers for communication to occur. Ingeneral, we assess functional limitations by considering the characteristics of theunderlying technologies that implement the positioning system. We will studythese technologies in chapter 3.
2.2.4 Position Sensing Techniques
To be able to understand positioning systems, we need to knowhow positioningcan be done. A great number of different positioning systemsexist, but the vastmajority of them are built on one of four basic techniques that can be used indi-vidually or in combination to determine the position of an object. This section willgive an overview of these general techniques.

18 CHAPTER 2. LOCATION BASED COMPUTING SYSTEMS
Dead Reckoning
Dead reckoningis a positioning technique that is based on the concept of directionand distance from a known starting point [25]. It was used by navigators in thedays of Columbus, and is used today for example by some GarminGPS-receiverswhen they temporarily lose contact with the satellites. Such a receiver will justcontinue to use its current heading and speed to project position [26].
When dead reckoning is used in several steps, each starting point depends on theprevious estimates made. This leads to increased possibility of positioning er-rors. The strength of dead reckoning is that a large infrastructure is not requiredto locate an object, but this also means that it relies on specialised equipment forself-positioning.
Trilateration and Triangulation
Trilateration and triangulation are positioning techniques that use the geometricproperties of triangles to compute an object’s position [27]. They differ in thattrilateration uses distance measurements in the computation, while triangulationuses both distances and angles. The term “triangulation” isoften used about eithertechnique, but in this thesis we will use the two different terms to clarify whichtechnique is used.
Trilateration Trilateration computes the position of an object by measuring itsdistance from reference points placed in known positions. When we know thedistance between an object and a reference point, we know that the object’s positionis somewhere on a circle with the reference point as centre and the distance asradius. If we also know the object’s distance to a second reference point, we getanother circle. The two circles intersect at two points, andone of these points isthe position of the object. By measuring the distance to a third reference point, weget three circles which will intersect in only one point. This is the position of theobject. Figure 2.6 on the facing page shows a position, the black dot, computed bymeasuring the distance to the three reference points A, B, and C.
What we have just described assumes that the object and the reference points are inthe same plane. In three-dimensional space we have spheres instead of circles, anddistance measurements to at least four reference points arerequired. The object’sposition will now be given by the intersection of the four spheres.
Domain-specific knowledge may reduce the number of requireddistance measure-ments needed in trilateration. When facing geometric ambiguity, one of the possi-ble positions can often be eliminated by introducing some domain-specific rules.For example, if a positioning system based on trilaterationis used at only one floor

2.2. FUNDAMENTALS OF POSITIONING SYSTEMS 19
Figure 2.6: Trilateration in 2D.
in a building, three reference points can be enough for three-dimensional position.This is because one of the two possible positions given by three intersecting sphereswill be on another floor of the building. This position could easily be eliminated,and the fourth distance measurement is not required.
There are two main approaches to measuring the distances required by the trilater-ation technique. These are by time of flight, or by attenuation.
Time of Flight Measuring distance using time of flight (TOF) means to measurethe time it takes to travel between two points of interest at aknown velocity1.One of the points may be an object moving away from the other ata knownvelocity for a given time interval, but the more typical caseis where bothpoints are approximately stationary and we observe the difference in trans-mission time and arrival time of an emitted signal. To be ableto determinetime of flight between a transmitter and a receiver, agreement about time isnecessary. This means that they have to be synchronised.
Attenuation The intensity of an emitted signal decreases with distance from thetransmitter. The decrease relative to the original intensity is the attenuation.If we know the original strength of the signal, and a functioncorrelatingattenuation and distance for this type of signal is known, wecan estimate thedistance between a transmitter and a receiver. The degradation of the signalis highly dependent on the surrounding environment, and empirical modelsfor path loss have been made for many typical situations, like for differentsignals penetrating walls of different materials.
1Velocity = Known direction and speed

20 CHAPTER 2. LOCATION BASED COMPUTING SYSTEMS
Figure 2.7: Triangulation in 2D.
A quantity called thePosition Dilution Of Precision(PDOP) is used to describethe relative reduction in the certainty of a computed position based on trilateration.PDOP depends solely on the relative geometry of the OOI and the transmitters orreceivers of the infrastructure, and thus provides a means for determining whetherthat geometry will result in a well-defined or more uncertainposition measurement.A low value of PDOP indicates a good relative geometry, and isachieved when thetransmitters or receivers are spread out in the environment[17].
Triangulation Triangulation uses angle measurements in addition to distancemeasurements to determine the position of an object. An example is given in fig-ure 2.7. Two reference points (A and B) are required, and the angles between theobject to be positioned and a zero degree reference vector ismeasured. In the figurethis vector is the same as the line drawn between A and B. By knowing one lengthmeasurement, for example between the reference points, thelaw of sines can beused to compute the position. Two-dimensional triangulation requires two anglemeasurements and one length measurement. With three dimensions, an additionalazimuth measurement is needed.
Proximity Sensing
A proximity based positioning technique determines when anobject is “near”, orin proximity to, a known position. The object’s presence is sensed using a physicalphenomenon with limited and known range. This could be by detecting physicalcontact, or by detecting wireless signals. Examples of the first could be pressureand touch sensors like floor sensors or touch screens.
When detecting wireless signals, the accuracy of the position depends on the range

2.2. FUNDAMENTALS OF POSITIONING SYSTEMS 21
Figure 2.8: Larger vs smaller cells and coverage in a proximity system
of the device in the known position. If the range, and thus thecoverage areas, ofthe devices in known positions are small, a large amount of devices are neededto provide coverage of the entire environment. This could beexpensive and time-consuming to deploy and maintain. However, many devices with short range inknown positions provide better accuracy than fewer deviceswith longer range (seefigure 2.8). The coverage area of an infrastructure transmitter is often called acell.
Scene Analysis
Visual scene analysisis a positioning technique which uses features of a sceneobserved from a particular point of view to draw conclusionsabout the positionof the observer or of objects in the scene [27]. For example, observations madeby a head-mounted camera can be matched to features recordedin a database withcorresponding positions.
Signal strength profiling, also called fingerprinting, is another form of scene anal-ysis. Signal strength from all transmitters in range are measured and recorded incertain positions throughout the area in which positioningis to take place. Allthese measurements are stored in a database, together with the associated knownposition. The position of a mobile device can then be determined by measuring sig-nal strengths from the transmitters in range, and comparingthese data with signalstrengths in the database.
The advantage of scene analysis is that the location of objects can be inferred usingpassive observation and features that do not correspond to geometric angles ordistances. As we will see in the next chapter, use of wirelesstechnology couldmake distance and angle measurements a challenging task. The disadvantage withscene analysis is that it is based on making empirical models, which require alarge amount of manual work. In addition, changes in the environment can requirereconstruction of, or a completely new, data set. In fact, many environments changeso often that several datasets should be made in advance. Forexample, a data set

22 CHAPTER 2. LOCATION BASED COMPUTING SYSTEMS
representing a large office may vary greatly with the time of day or day of week.On weekends there are much less people in the area, and duringweekdays there aremuch more people coming and going at 9 am and 4 pm than during work hours.By using different datasets representing different situations, better positioning ispossible.
2.3 Sensor Fusion
Sensor fusion is the use of information provided by several different sensor systemsin parallell. An example of extensive use of sensor fusion isthe robot industry,especially when researchers try to build robots that behavelike human beings. Suchrobots are equipped with different specialised sensors forsimulating sight, hearing,smell, touch, navigation, and so on. By using a combination of sensor technologieswith different capabilities, the quality of information provided by the system canbe increased. In the domain of positioning systems, sensor fusion can for exampleprovide better accuracy.
The challenge with sensor fusion is that it requires a more complex infrastructure,is more difficult to manage, and may supply an application with contradictory posi-tion information which needs to be managed in a proper way to be useful. It wouldbe advantageous to hide details of the positioning from the applications, so thatdifferent technologies can be used at the same time without the application needto now how to handle the different technologies, and to minimise the effects ofchanges [11, 17]. This means that sensor fusion is the responsibility of the locationsystem in layer 2 of our reference model, not the positioninglayer which we havedescribed in this chapter.
2.4 Summary
In this chapter we have introduced a three-layered reference model for discussinglocation based computing systems (LBCSs) and the technologies used to imple-ment them. Then we discussed components, designs, properties, and techniquesfor positioning systems at layer 1 in more detail. In the nextchapter we will dis-cuss challenges with wireless technology and look at the different technologies thatcan be used to implement indoor positioning systems. An understanding of the un-derlying technologies will help to understand the possibilities and limitations ofactual positioning systems.

Chapter 3
Indoor Positioning Technologies
In chapter 1 we saw that the satellite based Global Positioning System (GPS) doesnot work well within buildings or in other areas where there are no line of sight toat least four GPS satellites. Even if we could use the GPS system as it is indoors,the accuracy of about 15 metres would not be sufficient in manyapplications. Thisis also true for mobile cellular technology (which works indoors)—the accuracy istoo low for many indoor applications. Thus, researchers areseeking other ways todetermine positions in indoor environments, based on wireless technology.
There are three major groups of wireless technologies commonly used for indoorpositioning, depending on which type of communications medium they are basedupon. The first group is positioning technologies that are based on infrared light.The second group consists of all the different technologiesthat are based on radiotransmissions. The third group is based on ultrasound. After a brief introductionto wireless technology in general, this chapter will reviewwireless technologies tosee how they can be used for positioning. Understanding the underlying technolo-gies is important because it explains the physical possibilities and limitations of apositioning system. With regards to our three-layered reference model, we are stillat layer 1 as showed in figure 3.1 on the next page.
3.1 General Properties of Wireless Technology
To understand wireless technology, we need to know something about waves.These are the carriers of information between transmittersand receivers in a wire-less system. By encoding information onto waves, they can beused for wirelesscommunication as in radio and mobile phones.
23

24 CHAPTER 3. INDOOR POSITIONING TECHNOLOGIES
Figure 3.1: This chapter will review wireless technologiesthat can be used forindoor positioning. This is a part of the positioning layer.
Figure 3.2: Wave properties
3.1.1 Waves
A wave can be described by its energy, wavelength, and frequency (see figure 3.2).Energy is shown by the amplitude. Wavelength is the distancebetween one wavecrest to the next, and the frequency denotes how many wave crests that passes agiven point in a second. The measurement unit for frequency is called Hertz (Hz).Depending on these properties, which are mathematically related, waves behavevery differently. For example, a wave with long wavelength and thus low frequencyneeds less energy to travel, and is able to penetrate more materials than a wave withhigh frequency.
The waves that are most commonly used for communication are electromagneticwaves and soundwaves. Electromagnetic waves are related toelectrical and mag-netic fields, and what distinguish them from other waves is that they can travelwithout a medium, through a vacuum as in empty space.

3.1. GENERAL PROPERTIES OF WIRELESS TECHNOLOGY 25
The most commonly used electromagnetic waves for communication are radiowaves and infrared light waves. The radio waves have wave lengths from longerthan a football field to shorter than a football, and are used to carry signals forradio, television, mobile phones etc. Infrared light wavesare divided in the longerfar infrared wavelengths with size of a pin head, to the shorter near infrared withsize like cells in our body—microscopic. The first group is actually thermal heatlike the red we can see from a fire, while the near infrared cannot be felt and iswhat is being used for example in TV remote controls.
Sound waves differ from electromagnetic waves in that they are mechanical waves,which means that they need a medium to travel through, such asair, water, metaletc. Sound is a compression waveform, and is created by the vibration of someobject, and detected when the sound wave causes a sensor to vibrate. However,sound has the standard characteristics of any waveform. Theamplitude of a soundwave is the same as its loudness, and the frequency is how highor low the sound is.The speed of sound in air is approximately 344 metres/secondat room temperature.
The human ear is capable of detecting sound waves of frequencies between ap-proximately 20 Hz to 20 000 Hz. Sound with a frequency below 20Hz is knownas infrasound, and sound with frequency above 20 000 Hz is known as ultrasound.As we will see later in this thesis, ultrasound is used by manypositioning systems.
3.1.2 Propagation Mechanisms
Wireless communication is more difficult than wired communications because thereare so many obstacles and changes that affect the signals on their way from thetransmitter to the receiver. The four basic wireless propagation mechanisms aredescribed below:
Reflection Reflection occurs when a wave hits an object that is large compared tothe wave’s wavelength, and results in the wave bouncing off the surface ofthe object.
Refraction Refraction is the change in direction of a wave due to a changein itsspeed. This is most commonly seen when a wave passes from one mediumto another.
Diffraction Diffraction occurs when waves are obstructed by a surface with sharpedges. The waves will bend around such obstacles, like the corner of a wall.
Scattering Scattering occurs when a wave hits objects that are small compared tothe wave’s wavelength.
This means that how a wave will behave when hitting an obstacle depends on itsproperties (energy, wavelength and frequency) compared tothe obstacle’s proper-

26 CHAPTER 3. INDOOR POSITIONING TECHNOLOGIES
Figure 3.3: Examples of reflection, refraction, and diffraction
ties (size and material). It should be noted that in some cases we depend on thesemechanisms, they are not only negative. For example, diffraction could help usreach areas which without it would have been dead-spots.
The effects of the propagation mechanisms are as follows:
Multipath Different signal components may travel by different paths from a trans-mitter to the receiver. The components experience different delays, hencethey won’t reach the receiver at the same time. This results in a distorted ver-sion of the transmitted signal at the receiver. This is a challenge for examplewhen using time of flight, which we discussed in section 2.2.4on page 19.Pulses traveling indirect and hence longer paths should be ignored, but thisis made difficult by the fact that the direct and indirect pulses look identical.This has to be dealt with, and one solution is to statistically prune away re-flected measurements by aggregating multiple receivers’ measurements andobserving the environment’s reflective properties.
Multipath within buildings is strongly influenced by the layout of the build-ing, the construction material used, and the number and typeof objects inthe building.
Shadowing Signals blocked by obstructing structures.
Attenuation The strength of waves decrease with distance between transmitterand receiver. The transmitter’s power and the receiver’s sensitivity determinethe distance over which they can communicate. In section 2.2.4 on page 19,we saw that attenuation can be used to determine distance. However, in en-vironments with many obstructions, measuring distance using attenuation isusually less accurate than by time of flight, due to the signalpropagationmechanisms described above. These effects cause the attenuation to corre-late poorly with distance.

3.2. INFRARED (IR) 27
In other words, the typical problems faced are signals that are too weak to be de-tected by the receiver, dead-spots, noise and interference. We will look at frequencyregulations to minimise interference problems in the next section.
3.1.3 Frequency Regulations
The transmitters and receivers involved in wireless communication are tuned tooperate in a given frequency range. The frequency spectrum used by wirelesstechnology is highly regulated, and can be seen as a hindrance for the wirelessindustry. But, at the same time regulation is necessary for coping with interferenceproblems.
Until 1985, vendors had to apply for frequency licenses to operate their wirelessproducts. Then, the Federal Communications Commission (FCC) of the UnitedStates authorised the Industrial, Scientific and Medical (ISM) frequency bands at2.4GHz for unlicensed spread spectrum and wideband communications use. Thisaccelerated the development in the wireless industry [28].
3.2 Infrared (IR)
Infrared wireless communication makes use of the invisiblespectrum of light justbelow red in the visible spectrum. This means that IR communication is blockedby obstacles that block light—almost everything solid. Infrared can be used incommunication outdoors with Gbit/s data rates, for exampleto connect local areanetworks in different buildings. But, in such cases laser isused as the opticalsource, and this is not suitable for most indoor use because of the potential safetyhazard and high cost. The optical source normally used indoors is light emittingdiodes (LEDs), similar to those used in the remote controls of consumer electron-ics. Thus, IR modules can be small, low cost and consume little power. Since IRsignals cannot penetrate through walls, it is suitable for sensitive communicationbecause it won’t be accessible outside the room or building.There are no restric-tions for using the infrared frequencies.
IR is used in two different ways, direct IR and diffuse IR. As an example of directIR we give an overview of the IrDA standard. Then follows an overview of diffuseIR.
3.2.1 IrDA
One method for infrared communication has been specified by the Infrared DataAssociation (IrDA) [29]. This method has become a recognised standard com-

28 CHAPTER 3. INDOOR POSITIONING TECHNOLOGIES
monly called just IrDA, and is the one used by most mobile phones and notebookand hand-held computers. IrDA is a point-to-point ad-hoc data transmission stan-dard designed for very low-power communications. It uses direct IR, which meansthat line of sight is required—the communicating devices must "see" each other.IrDA operates over a distance of 0 to 1 metre at speeds of up to 16 Mbps, soon toleapfrog from 100 to 500 Mbps. With its narrow 30 degree anglecone IrDA is bestsuited for point-and-shoot style applications, since it isusually required that thedevices engaged in communication are aligned with (pointedat) each other. Thisimplies that IrDA communication is between two devices at a time only, since asingle access point cannot be shared by several users.
3.2.2 Diffuse IR
When using diffuse IR, the transmitted IR signals are stronger than those used fordirect IR, and thus they have longer reach (9–12 metres) [30]. In addition, wideangle LEDs are used, which emit signals in many directions. Because the signalsare easily blocked and reflected, they will bounce around theroom. This meansthat diffuse infrared allows many-to-many connections, does not require direct lineof sight, and can be uni-directional or bi-directional. Since infrared light doesn’ttravel through walls, diffuse IR is suitable for connectingdevices which are in thesame room. The effective range of diffuse IR limits cell sizes to small- or medium-sized rooms, so that in larger rooms, multiple infrared sensors must be used [11].It should be noticed that although diffuse IR works without line of sight, the datarate decreases severely in such cases.
One problem with diffuse infrared systems is that they have difficulty in locationswith fluorescent lighting or direct sunlight because the infrared emissions theselight sources generate may interfere with the signals [11].Another problem is thatdiffuse infrared links often create delays, since it takes time for the signals to travelto the wall or other objects that causes reflection and get back to the destination.
3.2.3 IR-based Positioning Systems
IR-based positioning systems tend to use proximity detection by monitoring wire-less cellular access points. Positioning systems based on direct IR typically rely ona human user taking explicit actions for positioning to occur, due to the short rangeand the requirements for line of sight and device alignment.When using diffuseIR, the user can remain passive because the IR signals that bounce around the roomwill find any present IR receivers on their own. This also means that diffuse IR canbe used where there are no human user, for example in a system which locatesequipment tagged with IR receivers.

3.3. RADIO FREQUENCY (RF) 29
3.3 Radio Frequency (RF)
A very important characteristic of radio waves is their ability to penetrate solid,non-metal objects. This implies that there is no line of sight requirement betweenRF transmitters and receivers. It also implies that RF communication is not inher-ently secure, and that it is subject to uncontrolled interference. Special care mustbe taken to avoid this and to protect sensitive communication. Last, RF transmit-ters and receivers typically consume more power than IR devices, and most part ofthe radio frequency spectrum is strictly regulated, so FCC certification is required.
3.3.1 The 802.11 WLAN Family
The IEEE 802.11 Wireless Local Area Network (WLAN) standardwas ratified inJune 1997 [28]. The standard defines the protocol and compatible interconnectionof data communication equipment via the air in a local area network (LAN) usingthe carrier sense multiple access protocol with collision avoidance (CSMA/CA)medium sharing mechanism.
Two configurations are specified in the 802.11 standard: ad-hoc and infrastructure.The ad-hoc mode enables mobile devices to communicate directly without the useof an access point, like a peer-to-peer network. All stations are usually independentand equivalent, and no infrastructure is needed. Such a network is closed, with noaccess to the Internet. In the more commonly used infrastructure mode, accesspoints bridge mobile stations and the wired network. The radio range and thesurrounding environment of an access point determines the coverage area, or cellsize, for that access point. By placing the access points so that their coverageareas overlap, the mobile stations can seamlessly move between the access pointswithout losing network contact. This is called roaming. A handoff occurs whenthe mobile station goes from one access point to the next. A protocol1 has beenspecified which standardises this handoff information, so that access points fromdifferent vendors can communicate with each other. A singleaccess point cansupport a small group of users.
The 802.11 standard can use either infrared or radio as physical medium. Thetype of infrared transmission used is diffuse infrared, with a typical range of 10metres. This, and the fact that the communication quality issensitive to the en-vironment (e.g. the number of reflected surfaces and line of sight paths), limitsthe use of infrared and is the reason why vendors usually adopt radio as commu-nication medium. The standard specifies two different radiofrequency physicallayers, both primarily operating at the 2.4 GHz ISM band: Direct Sequence SpreadSpectrum (DSSS) and Frequency Hopping Spread Spectrum (FHSS).
1The Inter Access Point Protocol (IAPP) specified by the 802.11f committee

30 CHAPTER 3. INDOOR POSITIONING TECHNOLOGIES
IEEE 802.11b
In September 1999, the IEEE 802.11 standard from 1997 was officially revised [28].The new standard was called 802.11b, or 802.11 High Rate. It still operates on the2.4 GHz frequency band, but provides a data rate up to 11 Mbps with fallback ratesof 5, 2, and 1 Mbps. This standard also promises interoperability among productsof different vendors, and the 802.11b networks have successfully conquered theWLAN market and are widely used in homes, cafes, airports, hotels, and at univer-sity campuses. But with such widespread use, interference problems within the 2.4GHz ISM band become a major issue. Bluetooth devices (to be discussed in sec-tion 3.3.2 on the next page) and a lot of medical and householdequipment also usethis frequency band, e.g. cordless phones and microwave ovens. This interferenceissue and the wish for even faster speed led to the specification of an additionalstandard, the 802.11a described in the next section.
Performance measurements indicate that the 802.11b data rate slows down sub-stantially the greater the distance between the access point and the mobile station.The maximum data rate of 11 Mbps is typically achievable up to100+ feet. Be-tween 100+ feet and 175+ feet the data rate is typically 5.5 Mbps, and from 175+up to 225 feet the data rate is 2 Mbps. The 802.11a and g in the following sectionsare also subject to a such decrease in data rates with distance. In general, the datarates of all three standards are considered to be 50-100 metres.
IEEE 802.11a
The IEEE 802.11a standard was approved in September 1999 as asolution to theintereference problems in the ISM band [28]. This standard uses the 5 GHz fre-quency band, which means that it is not compatible with 802.11b. It uses Orthogo-nal Frequency Division Multiplexing (OFDM), which provides data rates up to 54Mbps and beyond. Required speeds are 6, 12 and 24 Mbps with optional speeds upto 54 Mbps. But this high data rate is only achieved with a range less than 25 feet.The data rate then gradually decline with distance. The drawback with this stan-dard, in addition to the incompatibility with 802.11b, is that the 5 GHz spectrumis not license-free in all countries. This led to yet anotherstandard, the 802.11gdescribed in the next section.
IEEE 802.11g
The 802.11g standard was ratified in June 2003 to enhance the 802.11b technol-ogy. Two optional modulations were specified, Packet BinaryConvolution Code(PBCC) which supports 22 Mbps and 33 Mbps for payload data rate, and OFDMwhich supports at most 54 Mbps. These are both compatible with 802.11b.

3.3. RADIO FREQUENCY (RF) 31
WLAN as Positioning Technology
As with IrDA, the different WLAN standards were not designedto determine po-sition of mobile devices. But still, these wireless networktechnologies can offersufficient position determination to be useful in many location based services. Thebig advantage of using WLAN to determine positions of mobiledevices in the net-work is that the infrastructure is often already in place, since wireless networks hasbecome so common. In addition, the cost of the access point can’t be beat; it seemslike vendors are practically giving away Wi-Fi access points. On the other hand, aswith any wireless LAN application, potential performance degradation should betaken into account. A location based computing system invokes the transmissionof overhead packets over the wireless LAN in order to implement positioning al-gorithms. This additional overhead may significantly lessen throughput availableto users. Thus, a solution that minimises the transmission of packets should besought. Also, because of the large physical range, Wi-Fi technology consumes alot of power, limiting its use in many small battery-poweredmobile devices.
WLAN access points could be used for proximity sensing, but because of the widerange of WLAN access points the accuracy would be coarse-grained and not veryuseful for indoor location based applications. Thus, as we will see in chapter 5,most WLAN based positioning systems are based on scene analysis and signalstrength profiling, or trilateration using attenuation to determine distances.
3.3.2 The 802.15 WPAN Family
IEEE 802.15 is the IEEE working group for Wireless Personal Area Networks(WPANs). This group is developing standards for short-range personal wirelessnetworks consisting of devices such as PCs, hand-held and pocket computers, mo-bile phones, next-generation pagers, digital cameras, video cameras, and other de-vices.
Bluetooth (IEEE 802.15.1)
The IEEE 802.15.1 standard, based on Bluetooth v1.1, is a short-range wirelessvoice and data communications protocol which employs RF technology [31]. TheBluetooth project was begun by Ericsson in 1994, and the Bluetooth Special Inter-est Group (SIG) formed in May 1998 to develop an open specification for globallyavailable short-range wireless RF communications.
Bluetooth operates in the unlicensed 2.4 GHz spectrum, and must cope with in-terference from IEEE 802.11 (see 3.3.1 on page 29), baby monitors, garage dooropeners, cordless phones, microwave ovens and other RF communications tech-nologies which also use this frequency.

32 CHAPTER 3. INDOOR POSITIONING TECHNOLOGIES
The Bluetooth network model is one of peer-to-peer communications based uponproximity networking (see 2.2.4 on page 20). When two Bluetooth enabled de-vices come within range of each other, they can establish a Bluetooth link, whereone device acts as master and the other as slave. Any Bluetooth equipped devicecan assume either role. The connection establishment process can take up to 10seconds, but it can often be accomplished in less than 5.
A master may communicate with up to 7 “active” slaves and up to255 “parked”slaves.These devices are said to form a piconet. The use of parked mode, that the slavesmaintain synchronisation but do not listen for transmissions from the master, al-lows the master to communicate with the whole piconet by exchanging active andparked slaves to maintain up to seven active connections. Inparked mode slavesare less responsive, but it permit greater power conservation. The master-slave rela-tionship is important for low-level communications, but ingeneral devices operateas peers to each other.
When two or more piconets partially overlap in time and space, a scatternet isformed. This topology provides a flexible method by which devices can maintainmultiple connections. This is especially useful for mobiledevices which frequentlymove into and out of proximity to other devices.
Bluetooth is designed to be a very low power technology, withestimated nominalpower at 100 mW although this is product dependent. Nominal link range for thestandard 0 dBm Bluetooth radio is approximately from 10 cm to10 metres, omni-directional, but power amplified 20 dBm radios with range of about 100 metres arealso possible. The 1.0 specification focuses on 10 metre range. The Bluetooth datarate is currently 1 Mbps.
Bluetooth as Positioning Technology The Bluetooth SIG has several workinggroups that focus on specific parts of the technology or on supporting services.One of these groups are the Local Positioning group, which investigates the use ofBluetooth wireless technology for positioning.
Like mentioned in the previous section, Bluetooth is based upon proximity net-working. Bluetooth devices form mini-cells, and when enough such cells are in-stalled, the position of a transmitter can be given by knowing which cell it is com-municating with. However, as we will see in the next chapter,Bluetooth can alsobe used in trilateration and scene analysis systems.
Bluetooth has with its omni-directional characteristic problems discovering the in-tended recipient. A Bluetooth device must perform a timeconsuming discoveryoperation that will find many of the other devices in the room.Close proximityto the intended recipient will not help. The user will be forced to choose from alist of discovered devices. Choosing the proper device willoften require specialinformation from the other person (e.g. 48-bit device address or friendly name).

3.3. RADIO FREQUENCY (RF) 33
The advantages of Bluetooth are that in addition to positioning information italso provides some limited data communications, about 700 kbps (vs. 11Mbpsin 802.11), and that two devices communicating don’t need tobe aligned, theydon’t even have to be visible to each other so they can be in different rooms.
The biggest disadvantage of Bluetooth technology is that itrequires a lot of rela-tively expensive receiving cells. The greater the number ofcells, the smaller thesize of each cell and hence greater accuracy, but more cells increase the cost of pur-chase and installation. Another consideration is the need to have a host computerto support the Bluetooth radio to be located, so it is currently impractical to locateobjects that don’t have a built-in computer.
It is expected that Bluetooth hardware is likely to remain more expensive than IrDAhardware owing to the complexity of the underlying technology, although the costdifference probably will narrow over time. Current prices for an IrDA moduleversus a Bluetooth module is about 2 and 5 USD.
Because of the 2.4 GHz spectrum which Bluetooth is using being unlicensed, newuses for it are to be expected, and as the spectrum becomes more widely used, radiointerference is more likely to occur.
IEEE 802.15.4 and ZigBee
The IEEE 802.15.4 specification defines the physical and MAC layers of a low-complexity, low-cost, low-data rate solution which makes multi-month to multi-year battery life possible. It is operating in three unlicensed frequency bands, 2.4GHz and 915 MHz for North America, and 868 MHz for Europe. The achieveddata rates for the different frequencies are 250 kbps (up to 30 metres), 40 kbps, and20 kbps. The IEEE 802.15.4 standard was first released in 2003, and updated in2006 [32, 33].
The ZigBee standard provides network, security, and application support servicesoperating on top of the IEEE 802.15.4 specification. It is capable of autonomouslyconnecting over 64 000 nodes in a network, consisting of subnetworks with 255nodes in star, cluster, or mesh topologies. As ZigBee nodes can operate at dis-tances ranging from 5 to 500 metres depending on the surrounding environment,very large networks are possible both regarding large number of devices and largecoverage areas. Range is easily adjusted with power[34].
There are two different physical device types used for ZigBee nodes, called FullFunction Device (FFD) and Reduced Function Device (RFD). Their different char-actersistics are showed in figure 3.4 on the following page. In a ZigBee network,at least one FFD is required, to act as a network coordinator.Since these devicesconsume more power than the RFDs they are generally line powered.

34 CHAPTER 3. INDOOR POSITIONING TECHNOLOGIES
Figure 3.4: ZigBee physical device types
ZigBee is designed for low-duty-cycle networks, where nodes spend much of theirlife asleep. A typical conversation between two devices generally takes a few mil-liseconds, allowing the transceiver to go back to sleep quickly. Thus, nodes usevery little power, and can operate for years on a pair of alkaline AA batteries with-out any operator intervention.
A basic ZigBee node is very small, has low complexity, low cost. It consists of amultichannel two-way radio and a microcontroller on a single piece of silicon, andcould be delivered in a plastic package the size of a pinkie fingernail. Retail price ofradio tranceivers compliant with the standard is rapidly approaching $1, and single-package radio/applications processor/memory products are currently about $3 andwill probably continue to fall with increasing volumes. Thefirst ZigBee productsare expected in stores in 2007. Potential applications are sensors, interactive toys,smart badges, remote controls, and home automation.
Ultra Wide Band (UWB) and IEEE 802.15.3a
The term ultra wideband (UWB) was first used by DARPA in 1989. But the tech-nology behind the name has been known since the 1960s as short-pulse technology,in which the basic concept is to develop, transmit and receive an extremely shortduration burst of radio frequency (RF) energy. These burstsrepresent from one toonly a few cycles of an RF carrier wave, and the resultant waveforms are extremelybroadband. Duty cycles are very low, resulting in low average energy densities.The pulses are typically generated by impulse- or step-excited antennas and filters.
The conventional definition of UWB described above is quite unlike modern UWBvariants. From 2002, the FCC came up with a new, broader definition of UWB,which defines UWB as a RF signal occupying a portion of the frequency spectrumthat is greater than 20% of the center carrier frequency, or has a bandwidth greaterthan 500 MHz [35, 36, 37].
From the two definitions above we can see that UWB is a communication chan-nel that spreads information out over a very wide portion of the frequency spec-trum [38, 39]. This allows the UWB transmitters to consume very little transmit

3.3. RADIO FREQUENCY (RF) 35
energy, while transmitting large amounts of data. In addition, UWB will not in-terfere with existing RF systems if proper designed, has high multipath immunity,will be low cost like Bluetooth components, and will enable radios to fit withinsmall-size devices. UWB is proposed as a wireless replacement of wired USBand Firewire standards used among devices in a personal areanetwork. Wirelessconnection for multimedia applications requiring in excess of 100 Mbps can berealised.
There are few technical hurdles for UWB, but it faces severalregulatory hurdlesin regard to interoperability. The FCC approved low power UWB with maximumradiated power of -41.3dBm/MHz to operate in an unlicensed spectrum from 3.1GHz to 10.6 GHz in the US in February 2002. The strict power limitation is inorder to limit the interference with other communication systems. There are lim-ited adoption by other regulatory agencies around the world. Europe and Japanapproval is in the process, while others are waiting to see how UWB performs inthe US.
There are currently two competing UWB specifications that both hope to eventuallybe defined as the IEEE 802.15.3a standard (member of the WPAN family). Whichone, if either, the standard group chooses is not yet known, and how widely UWBwill be adopted in the future is uncertain.
The main difference between the two competing UWB specifications is the wayin which they spread the data signal across the frequency spectrum. The Multi-band OFDM Alliance (MBOA) special interest group uses OFDM like 802.11aand 802.11g, while the former Motorola subsidiary Freescale Semiconductor usesdirect sequence technology.
UWB as Positioning Technology UWB technology has been shown to possessa unique advantage for high accuracy positioning, even in the presence of severemultipath, by the use of short-pulse RF waveforms which permit accurate determi-nation of the TOA and the time of flight of a burst transmissionfrom a short-pulsetransmitter to a corresponding receiver. This require special, sensitive, high speeddetection circuitry at the receivers. With distances computed from the time of flightat several receivers, the position of the UWB transmitter can be determined by tri-lateration, as we saw in 2.2.4 on page 18.
3.3.3 Radio Frequency Identification (RFID)
Radio frequency identification (RFID) is a generic term usedto describe a systemthat transmits the identity of an object or person wirelessly using radio waves [40].It is grouped under the broad category of automatic identification technologies.
The RFID technology is most commonly used to automatically identify objects

36 CHAPTER 3. INDOOR POSITIONING TECHNOLOGIES
Figure 3.5: A summary of passive vs active RFID
in large systems. RFID-tags are attached to all the objects in a system that theowners want to keep some information about, so that this information easily can beretrieved and used later. The RFID-tags consist of a microship which can typicallystore up to 2 kilobytes of data, and a radio antenna. A reader device is used toretrieve information from the tags, and depending on the tags used between 20 and1,000 tags can be read each second. The best tags also work effectively even whensituated within one-half inch of each other [41].
There are two broad categories of RFID systems: active and passive. These aresummarised in figure 3.5. The passive RFID systems use passive RFID tags, whichhave no transmitter and no power source. They work by drawingpower from thereader, which emits electromagnetic waves, and communicates its data by reflect-ing back energy to the reader. In contrast, the active tags used in active RFIDsystems have a transmitter and their own power source. They broadcast signals forall the readers within range to read. The range is typically between 20 to 100 me-tres for active tags, while the passive tags have read rangesfrom a few centimetresup to about 9 metres. The cost of passive tags ranges from 20 cent when bought inlarge volumes to several dollars with special packaging, while the active tags canbe $10 to $50 or more. These tags are not mass-produced in large numbers, so theyare typically used in in-house systems where the tags can be reused.
RFID systems use low, high, ultra-high, or microwave frequencies. Active tagsusually operate at 455 MHz, 2.45 GHz, or 5.8 GHz, and passive tags uses 124,125, 135 kHz, 13.56 MHz, 860-960 MHz, and 2.45 GHz and others.The dif-ferent properties of these frequencies make them useful fordifferent applications.Higher frequency gives better range but is harder to controlbecause energy is sentover long distances and is easier reflected. The radio waves can bounce off sur-faces and reach tags you did not want to read. RFID signals maybe subject tointerference from machinery or other RF-based systems, butfortunately not from802.11-systems.

3.4. ULTRASOUND (US) 37
RFID as Positioning Technology Passive RFID tags can only be located by as-sociating them with the reader that reads them. If high accuracy is required andthe readers are not carried by a person, the system needs a lotof readers, whichmake the system expensive. Active tags can act as transponders which broadcastonly when near a reader, or they can act as beacons which broadcast at pre-settime intervals. The beacon functionality makes it possibleto use RFID in real-timesystems where the precise location of objects needs to be tracked. The readersare placed in known positions, read the tags, and transmits the tag id, it’s ownid and a time stamp to a host computer system which can track the objects. Themost common RFID applications are asset-tracking, manufacturing, supply chainmanagement, retailing, payment systems (e.g. road tolls),and security and accesscontrol.
3.4 Ultrasound (US)
Ultrasound does not penetrate solid walls, and does not require line of sight be-tween the tags and the detector. Ultrasound waves are mechanical waves, and donot interfere with electromagnetic waves. The ultrasound signals have relativelyshort communications range [42].
The disadvantages of a system using ultrasound are loss of signal due to obstruc-tion; false signals due to reflections; and interference from high frequency soundssuch as keys jangling. There are commercial systems which solve these prob-lems with great success, but these systems are expensive, typically costing over$15,000 [43].
Ultrasound as Positioning Technology Positioning with ultrasound is suitablefor both proximity sensing and multilateration. Especially for applications whereroom scale accuracy is sufficient, proximity sensing with ultrasound is very effec-tive since ultrasound does not penetrate walls. Such use is suitable for personell andasset/equipment tracking in large buildings. In addition,the fact that ultrasound isrelatively short range can be an advantage in such a system, because large halls oropen areas can be divided in several zones, thus giving better accuracy [42]. Onthe other hand, it can be expensive to cover a large building with this solution.
In systems where high accuracy is required, multilateration 2.2.4 on page 18 canbe used to achieve centimetre accuracy. Distances are calculated by measuringultrasound time of flight. For very high accuracy, several fixed infrastructure sta-tions must be used, increasing cost and complexity. The frequencies typically usedare 40–75 kHz, permitting accurate transmitter-receiver distance measurements atranges up to 10 metres [17]. The lower bound of frequencies that can be usedare limited because we want to use frequencies above those that humans can hear,
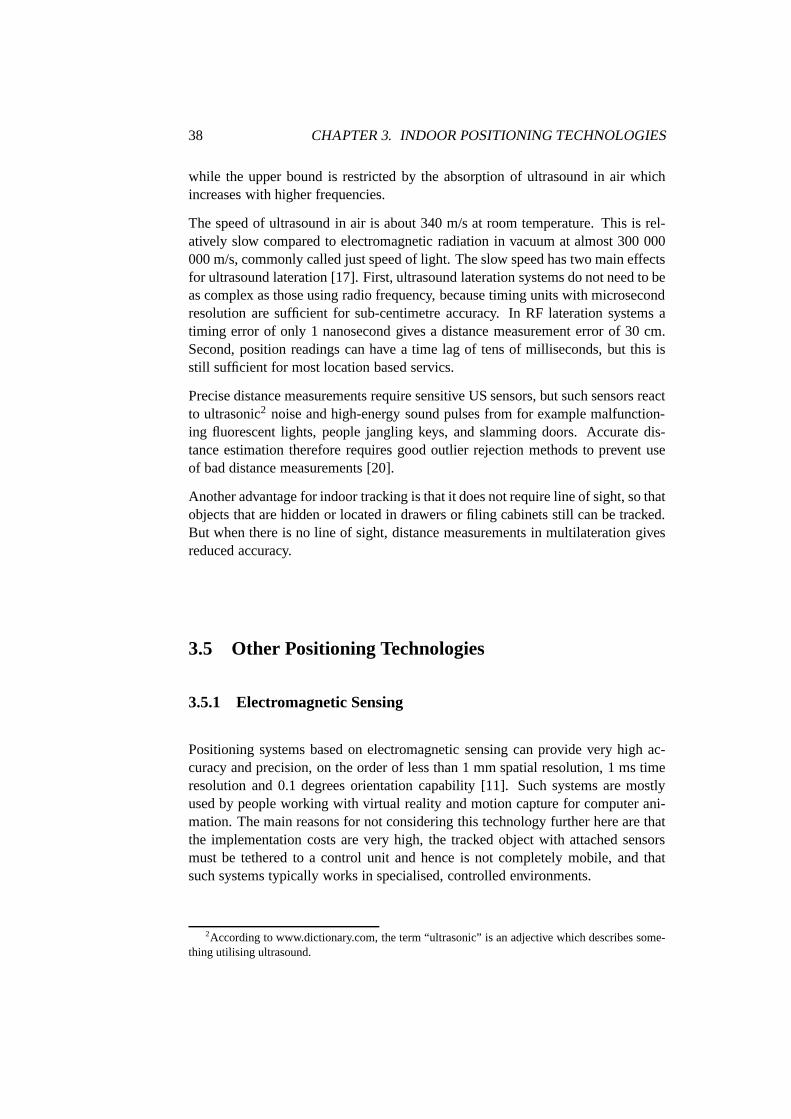
38 CHAPTER 3. INDOOR POSITIONING TECHNOLOGIES
while the upper bound is restricted by the absorption of ultrasound in air whichincreases with higher frequencies.
The speed of ultrasound in air is about 340 m/s at room temperature. This is rel-atively slow compared to electromagnetic radiation in vacuum at almost 300 000000 m/s, commonly called just speed of light. The slow speed has two main effectsfor ultrasound lateration [17]. First, ultrasound lateration systems do not need to beas complex as those using radio frequency, because timing units with microsecondresolution are sufficient for sub-centimetre accuracy. In RF lateration systems atiming error of only 1 nanosecond gives a distance measurement error of 30 cm.Second, position readings can have a time lag of tens of milliseconds, but this isstill sufficient for most location based servics.
Precise distance measurements require sensitive US sensors, but such sensors reactto ultrasonic2 noise and high-energy sound pulses from for example malfunction-ing fluorescent lights, people jangling keys, and slamming doors. Accurate dis-tance estimation therefore requires good outlier rejection methods to prevent useof bad distance measurements [20].
Another advantage for indoor tracking is that it does not require line of sight, so thatobjects that are hidden or located in drawers or filing cabinets still can be tracked.But when there is no line of sight, distance measurements in multilateration givesreduced accuracy.
3.5 Other Positioning Technologies
3.5.1 Electromagnetic Sensing
Positioning systems based on electromagnetic sensing can provide very high ac-curacy and precision, on the order of less than 1 mm spatial resolution, 1 ms timeresolution and 0.1 degrees orientation capability [11]. Such systems are mostlyused by people working with virtual reality and motion capture for computer ani-mation. The main reasons for not considering this technology further here are thatthe implementation costs are very high, the tracked object with attached sensorsmust be tethered to a control unit and hence is not completelymobile, and thatsuch systems typically works in specialised, controlled environments.
2According to www.dictionary.com, the term “ultrasonic” isan adjective which describes some-thing utilising ultrasound.

3.6. SUMMARY 39
3.5.2 Optical Systems
Optical systems either use a set of cameras placed at static points in the environ-ment to monitor objects in that environment, or the cameras are attached to anobject so that the object’s position and orientation can be determined relative tostatic points placed around the environment [17]. Different methods for computingpositions using these schemes can be used, but they will not be discussed here. Al-though levels of accuracy and resolution similar to those ofelectromagnetic track-ing can be achieved, the disadvantages of optical systems make them unsuitablefor most but a few types of applications. The cameras requireline of sight, needsubstantial amounts of processing power to analyse captured frames, tend to beexpensive and mechanically complex, and are most useful in well-constrained en-vironments.
3.5.3 Detecting Physical Contact
As we saw in section 2.2.4 on page 20, one of the methods for proximity sensing isto detect physical contact. For example, there exist systems which have embeddedpressure sensors in the floor [11, 5], and by capturing footsteps or by analysingthe distribution of weight across the floor, the presence of moving objects can beinferred. The major advantage with these systems is that no tags or devices areneeded, but they suffer from poor scalability and high incremental costs to installthe pressure sensors. In addition, they can only provide two-dimensional position-ing, and it is hard to distinguish objects from each other. Other systems may usetouch sensors, but these also suffer more or less from the disadvantages alreadymentioned.
3.6 Summary
We have now reviewed wireless technologies that can be used for indoor position-ing. These are divided into three groups, based on which physical carrier theyuse: infrared, radio or ultrasound. An understanding of thedifferent technologies’characteristics is necessary for understanding possibilities, challenges and limita-tions in positioning systems. In the next chapter, we will look closer at positioningsystems used by existing location systems.

40 CHAPTER 3. INDOOR POSITIONING TECHNOLOGIES

Chapter 4
Existing Indoor Location Systems
From reading the previous chapters, we have learned about the basics for under-standing positioning systems. In chapter 2 we learned abouttheir components,designs, properties, and how they actually can decide positions. In chapter 3 westudied wireless technologies and how these can be used for positioning.
In this chapter we will finally examine existing location systems that have beendescribed in the literature or that are commercially available. With reference toour three-layered model, we are talking about layer 1 and layer 2, as shown infigure 4.1 on the next page. A location system in layer 2 includes an underlyingpositioning system, turns the physical positions from thissystem into locations,and does all the work needed before a location based service can make use of theselocations.
While there are too many location systems to describe them all, an attempt is madeto choose a representative collection which shows the variety of solutions. Thisknowledge will be applied in the next chapters, where we willlook at a specificcase where a museum needs a location system to support a mobile electronic tourguide, and analyse if existing technologies and systems arecapable of meetingtheir needs.
Although we will look at both academic and commercial systems in the following,academic systems are given most emphasis. The reason is thatwith commercialsystems it is often difficult to get behind the scenes and see the details of howthe systems work. We should also keep in mind that what commercial companiesclaim that their systems are able to provide, is sometimes overstated or true in onlyvery limited situations.
41

42 CHAPTER 4. EXISTING INDOOR LOCATION SYSTEMS
Figure 4.1: This chapter will review existing location systems and their underlyingpositioning systems.
4.1 The Classic Four
When reading literature on location systems, four systems quickly stand out asthey are referred to almost everywhere: theActive Badge, Active Bat, Cricket, andRADARsystems. Thus, we will call them “The Classic Four”. The Active Badgesystem from 1992 is among the first indoor LBCSs, and as we willsee in thefollowing sections, the others followed more or less directly as attempts to dealwith limitations in this system in three very different ways. Later systems are oftenbased on findings from these four different solutions. Thus,the “classic four” aredescribed in detail in the following sections, and then follow brief descriptions ofother systems, grouped after which technology they are based on.
4.1.1 Active Badge
The Active Badge system [44, 4] was developed at Olivetti Research Laboratory1
between 1989 and 1992. The original system is able to locate individuals in abuilding by monitoring their presence in different rooms. This is done by equip-ping rooms with one or more networked sensors, which detect diffuse infraredtransmissions emitted by Active Badges. The badges are wornby individuals, andthey emit unique identifiers every 10 seconds [24] or on demand. In the latter case,the badge can be told to transmit by pressing a button on it. A master station ispolling the sensors for information about which badges theyhave recently seen,and the location of the badge can be determined on the basis ofthis information.The range of the system is about 30 metres, and line of sight isnot necessary [24].The conventional batteries of the badges last for about one year with the time in-tervals between emissions set to 10 seconds [24].
In an experiment with the Active Badge system, a hybrid technology solution isused to offer more fine grained location [4]. Low-powered radio transmitters are
1Now AT&T Laboratories Cambridge

4.1. THE CLASSIC FOUR 43
Figure 4.2: An Active Badge
placed where the badges should discover special zones. Whena badge noticesthe presence of a radio frequency field, it codes a signal intothe infrared signalwhich identifies which radio field it has moved into. The badgethen immediatelytransmits this message. The radio transmitters are typically placed at desks, andpower-adjusted to have a range of about an arm’s length [24].A further extensionto the Active Badge system has been to also track equipment, by attaching slightlymodified equipment badges to objects. Equipment is not as mobile as people, sothe time interval between emitted signals is increased to five minutes, thus savingmore power.
The largest single Active Badge system has been deployed at Cambridge Univer-sity Computer Laboratory, where over 200 badges and 300 sensors were in dailyuse. An experiment with equipment badges and desk scale location technology isalso implemented, with about 200 items of badged equipment and about 50 desksidentified by using the hybrid radio/infrared scheme [24].
4.1.2 Active Bat
In the previous section we saw that the Active Badge system could provide room-scale location information. By using radio transmitters inaddition to the infraredsensors, finer grain location was possible in dedicated locations. Since many ap-plications need more fine-grained position information andsometimes also orien-tation information, the AT&T researchers have in more recent work developed theActive Bat location system [45]. In this system, people and objects to be locatedare equipped with wireless devices called Bats, and receivers connected by a wirednetwork are installed in known, fixed positions in the ceiling. In addition, the sys-tem includes a number of base stations. A base station periodically transmits aradio message which contains a Bat identifier. Simultaneously, it sends a reset sig-nal to the receivers in its range over the wired network. As a response to the radiomessage, the identified Bat transmits an ultrasonic pulse. The now synchronisedreceivers record the time of arrivals of the pulse, which areused to compute posi-

44 CHAPTER 4. EXISTING INDOOR LOCATION SYSTEMS
tion by lateration (see 2.2.4 on page 18). Because all receivers are ceiling-mounted,the transmitters are always below them. Thus, position calculation can be done us-ing only three distance measurements, rather than the four required in the generalcase [5]. This is an example of domain specific knowledge which makes computa-tion easier, as mentioned in section 2.2.4 on page 18.
An ultrasonic transmission from a Bat is mainly emitted in one direction, becausethe wearer’s body or the object shadows the ultrasonic signals. Knowing the patternof receivers that detect the signal tells something about the object’s orientation [5].Another, better solution to determine orientation is to place several Bats at known,non-collinear positions on the same object, and calculate these Bats’ positions.
The Bat system is installed in a three-floor, 1,000m2 office building with 750 re-ceiver units, three radio cells, and 200 Bats. The Bats measure about 8 x 4 x 2 cm,and draw power from a single AA lithium cell which with low-power features hasa lifetime of about 1 year. One of the low-power features is that each Bat has amotion detector, which helps the base stations to locate only the Bats that are mov-ing. To simplify maintenance, telemetry can be obtained from Bats, and they canbe reprogrammed in the field over wireless or wired networks.3D positioning inActive Bat is accurate to within 3 cm about 95 percent of the time [45]. The maxi-mum position update rate across each radio cell is 150 updates per second. Signalsfrom simultaneously triggered Bats are encoded in a way thatallows receivers todistinguish among them.
4.1.3 Cricket
Researchers from MIT started to work on the Cricket indoor location system fall1999, and Cricket v1 got its first users by the spring of 2001 [20, 6]. In July 2004Cricket v2—which addresses most of the shortcomings of the previous version—was ready. Cricket hardware units are commercially available, and hardware designand software are open-source [46].
Cricket is the result of the five design goals given below [6]:
User privacy Cricket was designed to avoid the user privacy problem inherent inprevious tracking systems like Active Badge ( 4.1.1 on page 42) and ActiveBat ( 4.1.2 on the page before), by letting deviceslearn their location ratherthan having the system tracking them. Thus, Cricket invertsthe architectureof those earlier systems [20]; instead of having the mobile device emittingsignals to be received by the infrastructure, in Cricket theinfrastructure emitssignals that the mobile device receive and use to infer its location. Thus,Cricket is a self-positioning system, while Active Badge and Active Bat areremote-positioning systems (discussed in 2.2.2 on page 13).

4.1. THE CLASSIC FOUR 45
Decentralised administration There should be no need for a central entity tokeep track of each component in the system, and no explicit coordination be-tween infrastructure transmitters. This, and the choice ofa self-positioningarchitecture, helps the system scale easily, and makes it easy to employ sincethe transmitters don’t need to be connected to each other or to any other in-frastructure [20].
Network heterogeneity Cricket should be able to provide information to devicesregardless of their type of network connectivity. This is achieved by decou-pling the Cricket system from other data communication mechanisms.
Low cost The Cricket devices can be made from inexpensive, commercial off-the-shelf components, resulting in a price of less than $10 for each de-vice [6]. They are also commercially available at $225 (in low volumes)in the U.S. [47].
Portion-of-a-room granularity The system should accurately demarcate bound-aries between rooms and parts of rooms. The first is easy, since ultrasounddoesn’t travel through walls, but it is also designed to accurately demarcatevirtual parts of a room which correspond to different spaces.
Cricket can provide two forms of location information, names associated withrooms or parts of rooms—calledspace identifiers—and position coordinates. Themost common way to use Cricket is to place Cricketbeaconson walls and/or ceil-ings, and attach Cricketlistenersto host devices whose location needs to be ob-tained. The beacon and listener hardware are identical, thedifference is in therunning software [46]. This makes the Cricket infrastructure quite flexible, in thatyou can also run the beacon on a moving device, or configure allCricket devicesto simultaneously function as both a beacon and a listener [46].
The Cricket system works by having the beacons periodicallybroadcast their po-sition information—space identifier and/or position coordinates2— on a radio fre-quency (RF) channel. Simultaneously, they also broadcast an ultrasonic pulse.Listeners that are in the radio range of a beacon, have line ofsight to it, and are inthe ultrasonic range from it, will thus receive both an RF signal and an ultrasonicsignal. Because RF travels about106 times faster than ultrasound, the listener canthen use the time difference of arrival between the start of the RF signal and thecorresponding ultrasonic pulse to infer its distance from the beacon. This is howCricket solve the problem with synchronising the beacons and the listeners. Thelistener provides the location information of the beacon and the associated distanceto the host device through an API, and the listener or host device infers its positionfrom such information from multiple beacons.
2Actually, in v2, the beacons send their unique ID’s, and the applications download a databasewhich maps beacon ID’s and space/coordinate information [20].

46 CHAPTER 4. EXISTING INDOOR LOCATION SYSTEMS
There are also disadvantages with the Cricket architecture[20]. Since the Cricketbeacons broadcast their location information, this has to be given to them in ad-vance when deploying the system. Configuring spatial information in the beaconsis easy, while configuring accurate position coordinates iscumbersome. Continoustracking of objects is harder because a listener hears only one beacon at a time,and updating the position thus takes longer time and is more complex. Cricket alsoneeds a distributed beacon scheduling scheme to avoid RF andultrasound colli-sions at the listeners. Finally, the power consumption of the Cricket units is high,and the batteries have to be replaced pretty often. Attempting to solve this prob-lem an adaptor was made for plugging the beacons directly in the wall outlets, butthis is laying constraints on where beacons could be placed.Another solution is touse solar cells which use energy from the fluorescent lighting system often used inoffice buildings. This works fairly well and may be the futuresolution, althoughsome problems still exist for example in dim lighting or whenthe lights are turnedoff. Regarding the latest Cricket listeners, they interface to a host using a compactflash interface. Thus, they can draw power from the host, eliminating the need fora battery.
Cricket can be as accurate as between 1 and 3 cm in real deployments [46]. Theradios run at a frequency of 433 Mhz, with the default transmit power level andantennas providing a range of about 30 metres indoors when there are no obstacles.The maximum ultrasound range is 10.5 metres when the listener and the beacon arefacing each other and there are no obstacles between them.
4.1.4 RADAR
RADAR is a radio-frequency (RF) based system for locating and tracking users in-side buildings. The system was developed by researchers from Microsoft Research,and their work was published in two articles early 2000 [7, 19]. The goal was toovercome an important limitation of earlier systems: the need for specialised in-frastructure implemented solely for locating users. The approach was to make useof existing RF wireless local area networks (WLANs) to provide accurate user lo-cation and tracking capabilities. In this way the costs of the positioning system canbe dramatically lowered because no additional hardware is required. It should benoted that RADAR’s goal is the opposite of the network heterogeneity design goalof Cricket in the previous section. Cricket provides location information to devicesregardless of their type of network connectivity at the costof requiring additionalinfrastructure, while RADAR eliminates the need for such extra infrastructure atthe cost of providing location information of WLAN-devicesonly.
The base stations in a RADAR-enhanced WLAN system are positioned to pro-vide overlapping coverage, and broadcast beacons periodically. Mobile WLAN-equipped receivers record beacon signal strengths, which can be used to infer

4.2. INFRARED-BASED LOCATION SYSTEMS 47
distance for use in trilateration (see 2.2.4 on page 19 and 2.2.4 on page 18). Todetermine locations, RADAR uses a radio map—a database thatmaps measuredsignal strengths to position coordinates. The major part ofthe work in deployingRADAR is to construct this Radio Map, which can be built usingtwo differentapproaches. In the first, empirical approach, a mobile user is walking around thebuilding and explicitly measure and record base station signal strengths at differentknown locations. In the second approach, a mathematical model of indoor RF sig-nal propagation is used. The first approach is superior in terms of accuracy, whilethe latter makes deployment easier.
To improve accuracy RADAR usescontinous user tracking, which means to useinformation from the past to make better guesses of user location. This is based onphysical constraints, in that the user is very likely to be near a previous location.The aliasing problem, that two locations that are physically far apart is close toeach other in signal strength, can be solved using this technique. The aliasingproblem may arise if for example there is an obstruction between a receiver anda base stations that are close to each other, while there is noobstruction betweenthe base station and a receiver that is farther away. By knowing the user’s previousposition, measurements with large deviations can be discarded. Another techniqueused by RADAR to improve accuracy isenvironment profiling, which is to usemultiple Radio Maps representing different environmentalconditions, for examplehow crowded a place is. Human bodies consist of a lot of water,and water absorbsRF signals. Thus, a Radio Map created after work hours with very few people inthe building will not reflect the environment at a different time, like lunch hour,very well.
RADAR has been deployed in an area of 980 square metres with over 50 rooms,covered by three base stations. The accuracy is about 2-3 metres—about the sizeof a typical office room—50% of the time with the empirical radio map approach.With the radio propagation model the accuracy is about 4.3 metres 50% of the time.
4.2 Infrared-based Location Systems
4.2.1 PARCTAB
The PARCTAB system [48, 49] was a research prototype developed at XeroxPARC between 1992 and 1995. This system is similar to the Active Badge sys-tem in that it provides room scale positioning accuracy by utilising a networkedinfrastructure that listens for diffuse infrared transmissions from the users’ de-vices. These, the PARCTABs, are personal digital assistants (PDAs) with severalIR diodes spaced around the case and they also have a multi directional receiver.The IR diodes used are wide angle LEDs to ensure diffuse infrared emissions.

48 CHAPTER 4. EXISTING INDOOR LOCATION SYSTEMS
The networked tranceivers have 24 IR emitters spaced with 15degree intervals forcomplete coverage in all directions, and two detectors thatprovide 360 degreesviewing angle. The range is about 6 metres, and when placed inthe ceiling inthe middle of a room it provides very good coverage. The diffuse emissions makeLOS not necessary, because tranceivers and PARCTABs can sense infrared lightreflected from surfaces. The researchers report that if there already are a networkedcomputer in the room it would only take about 15 minutes to install a tranceiver.
4.2.2 Locust Swarm
Locust Swarm [23] is another infrared system. It differs from the Active Badge andPARCTAB systems in that the infrastructure nodes, the Locusts, are wireless andthat they broadcast their location information for the user’s device to listen to toensure user privacy. The Locusts are measuring about 3 x 8 cm,and are connectedto a small solar cell panel measuring about 15 x 15 cm. They areplaced in the grillsbeneath overhead fluorescent lights, and draw all their power in this way and don’tneed batteries. One Locust covers an area of about 6 metres indiameter, dependingon the distance to the floor. In 1999 one Locust could be made for under $20. Theuser device could be any device with a proper infrared receiver.
4.2.3 IRIS-LPS
IRIS-LPS (Infrared Indoor Scout) is an optical infrared local positioning systemdeveloped at the Darmstadt University of Technology in Germany, and publishedin 2003 [50]. The system consists of a number of IR emitting tags and a stationarymounted stereo camera. All hardware is made of cheap off-the-shelf components.
The stereo camera consists of two USB cameras with 120 degreelenses mounted20 cm from each other. The cameras measure angle of arrival oflight emitted fromthe tags, and this is used to triangulate the tags. The light results in a bright spotin the image, and the size and the density of the spot is used todetermine distance.The stereo camera is connected to a PC which decompress the images and performsthe real-time image processing. There could be up to 100 tags.
To determine the accuracy of the system it was installed in a lecture hall. Thecamera was mounted in front of the blackboard, three metres above the floor. Itcovered almost the entire room, which measures 15 x 9 metres.The tag itselfis smaller than the battery, and consists of one LED with a narrow angle of 20degrees and range over 10 metres. An exposure time of 1/500 second is enough forthe camera to detect the signal. The accuracy decrease with increasing distance andangle from the camera and was about 8 cm in near range and 16 cm when coveringa room of about 100m2.

4.3. RADIO-BASED LOCATION SYSTEMS 49
Figure 4.3: A prototype headset used in IRIS-LPS.
In an application using the positioning system the users wore headsets with eightIR diodes mounted on top of it, each covering 45 degrees. Thiswas done to geta greater total coverage, because smaller angle gives better range. By letting thediodes point in different directions very good coverage is achieved. By placing theemitting diodes on the head, the problem with IR requiring line of sight was solved.
4.3 Radio-based Location Systems
4.3.1 WLAN Based Systems
Ekahau
Ekahau [51] is a Finnish company that offers real time, multi-floor location track-ing of WiFi-devices or WiFi-tags in any standard Wi-Fi network (802.11 a/b/g).Average accuracy up to 1 metre in less than a second is achieved indoors by use of5–7 access points, or 2–3 metres average accuracy by use of 3–5 access points. Thepatented Ekahau location-sensing system is a software-only solution that workswith any off-the-shelf Wi-Fi access point. No proprietary infrastructure is needed.Both zone based tracking, to report the device location by zone name, and con-tinuous real-time positioning of precise x, y, floor, heading, speed, etc. locationcoordinates are supported. The system is able to locate over100 devices per sec-ond on a typical desktop PC, and more with more powerful hardware.
Ekahau uses aprobabilistic approachto location sensing [52]. Signal strength datafrom various known locations infer a model that can be used tomake predictionsabout the location associated with a set of new signal strength data. Building sucha model involves the construction of a probability functionwhich estimates theprobability that a particular measurement corresponds to aparticular position. Thiscan be seen as a special case of the scene analysis technique used in RADAR.The first big advantage with Ekahau’s approach is that the time needed for sitecalibration (a walk-through in the environment to collect sample points for building

50 CHAPTER 4. EXISTING INDOOR LOCATION SYSTEMS
the model) is much shorter than for building a radio map as used by RADAR.Approximate time needed is only 1 hour per 1,200m2. The second big advantageis that minor environment changes like number of people or furniture arrangementdo not require re-calibration of the positioning model. Partial re-calibration is onlyrequired when access points are moved or heavy structures are modified in thecoverage area.
Cordis RadioEye
The Cordis RadioEye System (CRE) is a Norwegian price winning technology3
for indoor positioning which is able to provide the physicalcoordinates of 802.11bWiFi devices. The system consists of a roof mounted unit—a RadioEye—measuring25x25x7 cm with advanced antenna technology that can be compared to the faceteye of a fly. By analysing the signal spectrum of microwaves emitted from the mo-bile devices, the system can determine their coordinates aslong as there is line ofsight between the RadioEye and the devices. This positioning technique is uniqueand patented by Radionor [53].
CRE is able to provide accuracy up to 50 cm,or it could provide coverage of 2000square metres per RadioEye. Devices can be monitored with a coverage angleof 110 degrees, and a tradeoff between coverage and accuracyis required sinceaccuracy decreases when the coverage area gets bigger. The system is able tocompute 1000 positions per second [54].
A Norwegian company has tried both the Radionor and Ekahau solutions. Theyreport that EPE has longer latency in delivering location than the RadioEye, whichmeans that this system may not be as real-time as they claim. Auser movingrapidly may have moved far between two position updates.
4.3.2 Bluetooth Based Systems
An Indoor Bluetooth-based Positioning System
A team from Hanover has implemented a Bluetooth-based indoor positioning sys-tem [55]. The system is based on self-positioning, where theposition estimationoccurs in the mobile device without the need of changes in thealready fixed in-stalled Bluetooth network. Positioning is done by trilateration using received signalstrength (RSSI). Achieved positioning error for the systemis given by a deviationof 2 metres on average.
For precise position estimation, the correlation between distance and RSSI has to
3The 2004 European IST-Prize, The Rosing Prize for IT Productof the Year 2003, and The RosingCreativity Prize 2003

4.3. RADIO-BASED LOCATION SYSTEMS 51
be determined (see 2.2.4 on page 19). Because of the radio propagation effectsand potentially no LOS, caused by for example the person holding the Bluetoothdevice, the equation for signal propagation in free-fields is not suited for the indoorarea. To approximate the correlation between signal strength and distance that fitsthe environmental conditions an empirical approach is taken. This is described inthe training phase below.
The implemented system consists of three Bluetooth access points and one Blue-tooth enabled PDA. The room is 46m2 and virtually divided in 1 x 1 metre sections.The work with splitting the premises in sections and placingthe access points iscalled thepreparatory phase. To obtain a good approximation function betweenthe RSSI and the access point distances, several measurements are recorded ineach of a number of randomly chosen sections. This is called the training phase.The mean of all measurements belonging to one section and access point formsthe reference value of the RSSI in the section. The third phase is called theloca-tion phase. Here the distances to the access points are determined based on RSSImeasurements, and the trilateration method is employed to find the position of thePDA.
The Bluetooth specification does not provide any means for extracting the RSSIvalue directly, so that this value has to be computed from another value. It turnsout that this limits the maximal distance between an access point and the mobiledevice to 8 metres, and thus restricts the coverage of the positioning system. Inaddition, the accuracy of the value which the computed RSSI is inferred from isalso not standardised, and depends on the Bluetooth hardware manufacturer.
BIPS
BIPS [56] is another Bluetooth-based indoor positioning system, which is simi-lar to the IR-based Active Badge system. Both systems are designed for trackingpeople with room-scale accuracy by cellular proximity sensing throughout a build-ing. BIPS uses this to offer a service that allows a mobile user to visualise on hisportable, Bluetooth-enabled device the shortest path he has to follow in order toreach another mobile user inside the same building. To do this, the system keepslocation information about all users in a central database.
BIPS defines a room as a space that can fit into a circle of 10 metres radius, sincethis is the maximum coverage area of a Bluetooth device. The system consists of aset of Bluetooth cells, one for every significant room of the building. The Bluetoothaccess points are interconnected via an Ethernet LAN with a central server machinecontaining the location database. The database is updated whenever an access pointdetects a new device in its coverage area.
As we saw in the section about the Bluetooth standard ( 3.3.2 on page 31), a po-

52 CHAPTER 4. EXISTING INDOOR LOCATION SYSTEMS
tentially time-consuming process is required to establisha connection between amaster and a slave. This is the major concern of BIPS. The masters (the accesspoints) must dedicate a certain percentage of their workingtime to device discov-ery and the remaining time to serve the slaves (the mobile devices). BIPS has doneexperiments for defining the scheduling policy of a master, and found that if themaster spends 3.84 seconds on device discovery, then 95% of the slaves will bediscovered on average. This is satisfactory for BIPS, and itmeans that the averageload of tracking service is about 24% of the operational cycle.
Bluetooth Indoor Localisation System (BILS)
This system is able to determine the position of any Bluetooth-enabled mobile de-vice with an intended accuracy of about 1 metre in indoor environments. The majoradvantage of the system besides the good accuracy is that additional hardware isneeded only on the stationary base stations. No hardware or software need to beadded or changed on the mobile Bluetooth-devices to be located [57].
One of the four base stations needed to determine location inthree dimensions isalso master station, and it broadcasts a data packet containing a correlation code.When the other base stations receive this signal, they startinternal time measure-ment counters. When the mobile device receives the signal, it replies by broadcast-ing the same data packet again, which upon arrival at the basestations stops thetime measurements. The four base stations measure the TDOAsfor the signal trav-eling from the mobile to the base stations using specialisedcorrelation hardware.The measurements are then collected at a host PC, where the position of the mobilewill be calculated and evaluated by DTDOA taking the local coordinates of the basestations into account. The big advantage with this scheme isthat the base stationsdon’t need to be synchronised with each other or with the mobile devices, since itis time differences that are measured and not time of arrivals. It is the specialisedcorrelation hardware at the base stations that make it possible to determine the ex-act receive time, but because of the very high accuracy requirements it is mainlylimited to line of sight conditions, because obstructions will introduce propagationdelays which will make the time measurements mirror wrong distances. Thus, thebase stations should be placed in the upper corners of a room.
4.3.3 PAL650 UWB System
An example of an UWB positioning system is the PAL650 system,an FCC ap-proved, commercial precision asset location system which is being used for track-ing of high valued assets in hospitals, factories, and military facilities. The systemconsists of a set of active UWB tags, one of which is used as calibration or refer-ence tag, UWB receivers, and a central processing hub. Threeor more receivers

4.4. ULTRASOUND-BASED LOCATION SYSTEMS 53
are placed at known positions within or around the area to be monitored. At startupthe system is calibrated by monitoring data from the reference tag which is placedat a known location. The tags produce bursts of short-pulse RF emissions onceevery second, and the time difference of arrival (TDOA) of the bursts are mea-sured at the various receivers and sent back to the central hub for processing. Thetags are powered by one 3.0-V 1A-h Lithium cell battery, which lasts for approxi-mately 4 years. The range of a tag in indoor environments is typically 60 metres,between several walls, and an absolute tag positioning accuracy better than 30 cmis routinely achieved [36].
4.4 Ultrasound-based Location Systems
4.4.1 DOLPHIN
The Active Bat and Cricket systems described in the previoussections are able toprovide very precise indoor positioning. But, deploying these systems in large-scale environments require manual configuration of a large number of infrastruc-ture sensor nodes, because these are required to have inherent knowledge of theirpositions4. DOLPHIN5 is an ultrasonic positioning system developed to reducesuch configuration costs [58, 59].
DOLPHIN is similar to Active Bat and Cricket in that a reference node broadcastan RF signal and an ultrasonic signal simultaneously so thatsurrounding nodescan measure the TDOA used for distance measurement. With three such measure-ments position can be computed by trilateration. The difference in DOLPHIN isthat by using a distributed positioning algorithm only a fewnodes have to be pre-configured with their exact position. For example, if reference nodes A-C are usedby node D to determine its position, node E can determine its position based onnodes B-D and so on. With this approach even nodes outside thecoverage area ofthe reference nodes can be positioned.
The disadvantage of DOLPHIN’s approach is that a positioning error in a nodeaffects all later positioning determinations based on thisnode, direct or indirect. Inthe test implementation of the system, which consists of only 3 reference nodes andfour other nodes, the positioning accuracy at a node using only reference points forpositioning was less than 5 cm, degrading to 10-15 cm in nodesthat used this firstnode for positioning. This error propagation problem is unavoidable, but can beminimised by proper placement and number of reference nodes. It should also benoted that the current test implementations of DOLPHIN assumes that all devices
4The researchers behind the Cricket system are working on automatic BeaconConfig algorithms,but these are not working satisfactory yet.
5Distributed Object Locating System for Physical-space Internetworking

54 CHAPTER 4. EXISTING INDOOR LOCATION SYSTEMS
are static. Handling moving devices and techniques for improving the accuracy arethe current focus of the researchers behind DOLPHIN.
4.4.2 Bristol Indoor Positioning System
The Bristol indoor positioning system (Bristol) is anotherultrasonic system thattries to cope with one of the disadvantages of the Active Bat and Cricket systems.The goal is to reduce costs by using only minimal infrastructure and readily avail-able components. A simple system covering a room of about 4 x 7metres andproviding accuracies of 10–15 centimetres can be implemented for only $150 [43].As in the Active Bat system, a radio signal is used for synchronising transmittersand receivers, and distances are computed by measuring timeof flight of ultrasonicsignals. The system is self-positioning and uses four ceiling-mounted transmittersconnected to a transmitter module containing the ultrasonic drivers, the microcon-troller and the radio transmitter. The receiver is attachedto a host computer or tothe shoulder of a person. Line of sight is required. A rechargeable 9 v battery in thereceiver module will last only for one day. However, the system is easy to installand requires no calibration after the initial installation. But for large scale use thecosts will increase.
Bristol is tested with several configurations. Four US transmitters can also cover a8 x 8 m room with an accuracy of 15 cm, or a 8 x 16 m room with 20 cm accuracy.A larger configuration of 6 US transmitters at a height of seven metres covers a 10x 18 m room, with accuracy better than 25 cm.
4.4.3 Ultrasonic 3D Position Estimation Using a Single BaseStation
In the previous section we saw that reducing the amount of infrastructure is a wayto reduce costs. A novel experiment is described in [60, 61],where only one basestation is needed to determine the position of objects in a room using ultrasound.In a box-shaped, empty room with LOS conditions, accuracieswere usually betterthan 20 centimetres. However, in a non-empty room and/or in acase of no LOS,the accuracy degrades to 2.5–3 metres 95% of the time.
The idea behind the method is to use reflections from walls, floor and ceiling asvirtual sources of ultrasonic signals into the room insteadof real ones in the form oftransmitting base stations. An ultrasonic signal consistsof amplitude peaks causedby acoustic reflections, and makes up a pattern that depends on the receiver positionand orientation. This pattern is called asignature, and it can be predicted by anacoustic room model. Position determination is done by a method calledsignaturematching, where the signature for many given positions are first predicted. Thenany measured signature in the mobile device can be compared to the predictedsignatures to find the one with the closest match. The approach is similar to that

4.5. SUMMARY 55
of RADAR, in that it uses scene analysis that requires preparations to be done inadvance to build the data set measurements are to be comparedwith. If this methodcould be done with nearly automatically preparations and realistic environments inthe future, it could be a very attractive solution.
In addition to the acoustic reflections method described above, an experiment isconducted which uses an array of ultrasonic transducers at the base station. Thismakes it possible to determine the direction of arrival of received signals, or tosteer transmitted signals in certain directions. Then TDOAmeasurements can beused to compute positions. In a non-empty room with LOS the accuracy with thisapproach was below 1.4 metres 95%, degrading to 3.2 metres when no LOS.
It should be noted that the experiments conducted so far haveshown many chal-lenges that have to be solved before these approaches can be used in real-life envi-ronments, but such solutions may prove suitable for specialapplications.
4.5 Summary
In this chapter, we have reviewed a total of 17 existing location systems. Foursystems are based on infrared technology, eight are based ondifferent radio tech-nologies, and five are based on ultrasound. In addition to using different wirelesstechnologies, these systems show how the different positioning techniques and de-signs described in chapter 2 can be used. Thus, we should by now have a goodunderstanding of how positioning and location systems work, and their challenges.We can now procede with the location based services at layer 3in our referencemodel, which builds on the positioning systems in layer 1 andthe location systemsi layer 2. Location based services will thus be the focus of the next chapter.

56 CHAPTER 4. EXISTING INDOOR LOCATION SYSTEMS
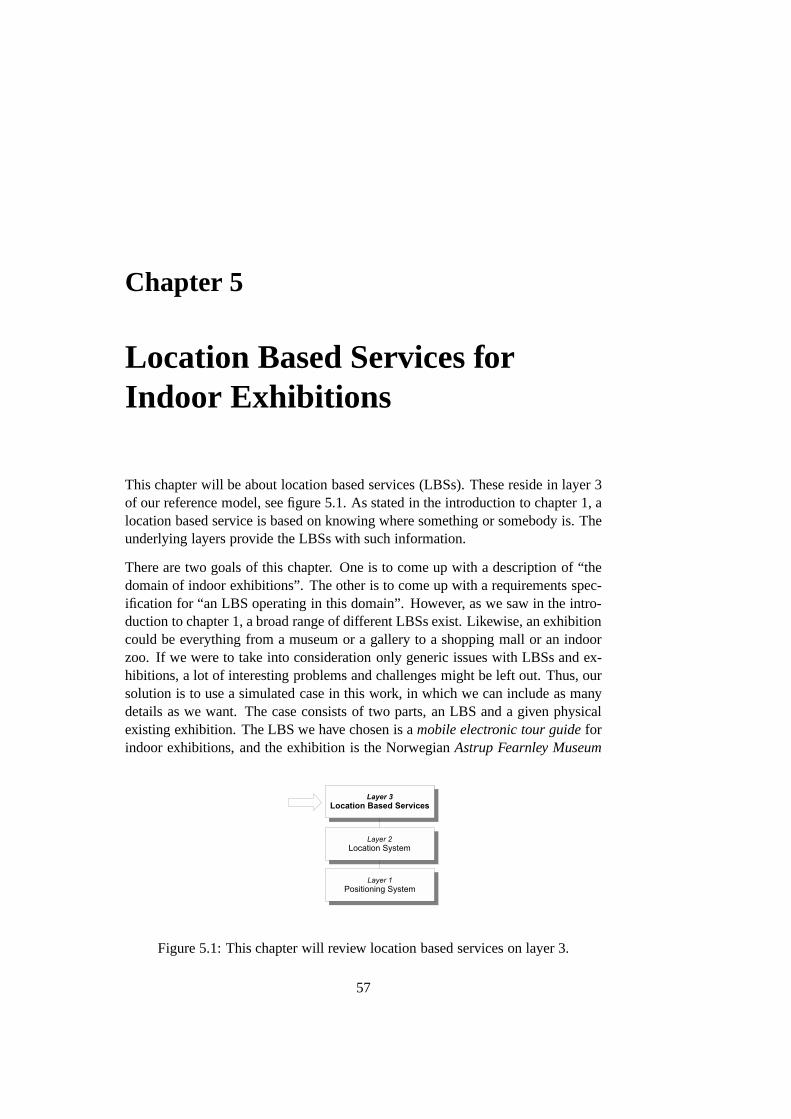
Chapter 5
Location Based Services forIndoor Exhibitions
This chapter will be about location based services (LBSs). These reside in layer 3of our reference model, see figure 5.1. As stated in the introduction to chapter 1, alocation based service is based on knowing where something or somebody is. Theunderlying layers provide the LBSs with such information.
There are two goals of this chapter. One is to come up with a description of “thedomain of indoor exhibitions”. The other is to come up with a requirements spec-ification for “an LBS operating in this domain”. However, as we saw in the intro-duction to chapter 1, a broad range of different LBSs exist. Likewise, an exhibitioncould be everything from a museum or a gallery to a shopping mall or an indoorzoo. If we were to take into consideration only generic issues with LBSs and ex-hibitions, a lot of interesting problems and challenges might be left out. Thus, oursolution is to use a simulated case in this work, in which we can include as manydetails as we want. The case consists of two parts, an LBS and agiven physicalexisting exhibition. The LBS we have chosen is amobile electronic tour guideforindoor exhibitions, and the exhibition is the NorwegianAstrup Fearnley Museum
Figure 5.1: This chapter will review location based services on layer 3.
57

58CHAPTER 5. LOCATION BASED SERVICES FOR INDOOR EXHIBITIONS
of Modern Art. The reason for calling the case “simulated” is that we have come upwith requirements ourselves—they are not coming from a realclient. The reasonfor this is the same as for not using a generic description. However, the selectedmuseum is real.
The result of this chapter is a requirements specification for our chosen LBS and adescription of the museum. These will be used in chapter 6, where we will analysethe location systems from chapter 4 to see whether any of these are able to fulfilthe requirements.
5.1 Problem Area
Before we introduce our specific case, we will look at exhibitions and mobile elec-tronic tour guides in general. First, based on what we have learned about challengeswith indoor positioning so far in this thesis, we will try to come up with a list ofcharacteristics of indoor exhibitions that may influence anindoor positioning sys-tem. Then, we will learn about electronic tour guides. This is an important part ofthis thesis, as it is what we will base our requirements specification on.
5.1.1 Characteristics of Indoor Exhibitions
In chapter 2 we learned how positioning can be done. In chapter 3 we learnedthat wireless communication, and thus positioning, in indoor environments is chal-lenging, and in chapter 4 we saw how different positioning systems have beenimplemented. Based on this learning, we have come up with a list of characteris-tics below that should be taken into consideration when working with positioningsystems for indoor exhibitions:
• Layout of the premises where the positioning system will beinstalled. Thisincludes for example the number, size and shape of rooms, storeys and par-titioning walls.
• Construction materials of walls, ceilings, floors, windows and so on.
• Furniture, partitioning walls, etc. that the premises arefitted out with.
• The placement and number of artefacts in the exhibition.
• How often the exhibition is changed.
• The number of visitors and how they are typically distributed around theexhibition, both physically and timewise.

5.1. PROBLEM AREA 59
Figure 5.2: Traditional museum guide using a megaphone so that everyone in thegroup can hear him.
Actually, these characteristics could be valuable to look at for any indoor locationbased computing system.
5.1.2 Mobile Electronic Tour Guides
Our LBS example will be a mobile electronic tour guide. We will define such aguide as a mobile physical device that could replace a human guide in an exhibi-tion. This means that it is possible to store information on the device or use thedevice to retrieve information stored on a server over a communications medium.In addition, the device has at least one output channel, so that the stored or retrievedinformation can be revealed to its user. The information is supposed to guide thevisitor while he is at the exhibition. The main reason for replacing human guideswith electronic guides is that each visitor then can have hisown personal guide.This offers the visitor with much more freedom, because he can choose what hewould like to see, when he wants to see it, and for how long he wants to see it. Be-cause the visitor only needs to focus on those parts of the exhibition he finds mostinteresting, he can spend more time at these and thus get morein-depth informationabout them.
In the definition provided above it was stated that the electronic guide could replacea human guide. It should be mentioned here that the electronic guide also couldreplace any other means of guiding in an exhibition, like posters with text, illus-trations or pictures, touch screens, static mounted head-phones and so on. The bigadvantage with the mobile, personal electronic guide over such static guiding toolsis that the visitor will avoid spending time in queues for access to the additionalinformation.
As we have now seen, electronic guides can serve as substitutes for human guides

60CHAPTER 5. LOCATION BASED SERVICES FOR INDOOR EXHIBITIONS
and static guiding tools for their users. The first such guides appeared in the 1950sand 60s, and the devices used were portable reel-to-reel players and cassette play-ers. They allowed the users to listen to pre-recorded information about the dif-ferent artefacts in their own pace, without having to followa human guide in agroup. While audio-only guides still are much in use today, in more modern formssuch as MP3-players for example, a new generation of guides has arrived with thedevelopment of the hand-held computers, especially the personal digital assistants(PDAs). These devices are able to provide the user with full multimedia content,that is information in the form of text, sound, images and video.
The development of new technology and increasing research interest in the field ofenhancing exhibition experiences have led to a broad range of suggestions to whata modern electronic tour guide should be able to provide. A summary is givenbelow, where the suggestions are divided into four groups which differ in type ofuse of the tour guide.
Enhance the visitor experienceThe most basic idea of enhancing the user ex-perience in an exhibition is to provide the user with additional informationabout the different artefacts he is watching. For example, avisitor that standsin front of a painting can be provided with information aboutthe work itself,the painter, the artistic style of the era, and so on.
Ease the visitor experienceA tour guide implemented on a mobile device with ascreen can provide the user with a map of the premises. The mapcan be usedfor navigation, to guide the user along different pre-defined routes or a routegenerated automatically from the visitor’s preferences, or it can help clarify-ing where the user has already been. The map can also contain informationabout where the toilets, emergency exits, cafeteria and so on is situated. Ifthe user comes to the exhibition as part of a group, he could see where theothers are on the map. The map could also report about congestions andqueues so that the visitor could avoid these.
Management tool Many tour guides have the ability to record the visitor’s actionswhile at the exhibition, like the order in which he watched the different arte-facts, which ways he walked between them, how much time he spent at theobjects, and what information he requested on the device. The exhibitionowners can use this information to make statistical data about the behaviourof the visitors, which can be analysed and used to improve thesystem. Forexample, the visitors’ navigation patterns may reveal congestion spots withinthe museum that the management could solve by re-organisingthe exhibi-tion. In a real-time system the management could even use such data to makequick decisions regarding employee allocation to sectionswhere additionalneeds emerge.
Extending the museum experience to before and after the visit In addition to pro-

5.1. PROBLEM AREA 61
vide the visitor with additional information while at the exhibition, the visitorcould be offered to prepare his excursion at home. By loggingon to the exhi-bition’s web site through the Internet, he could browse the different contentof the exhibition and selecting those he is most interested in. Upon arrival atthe exhibition at a later point, the visitor is provided withan electronic guidethat can give a guided tour based on the visitor’s pre-selection.
In those cases where the visitor either makes his own route inadvance asmentioned above, and/or the system at the exhibition records the visitor’sactions while at the exhibition, it is easy to automaticallygenerate a CD orpersonal web site for the visitor which contains information about all arte-facts he has shown an interest in during the visit. In this waythe learningcould be improved because it is easy for the visitor to go backand review allthat he has seen.
Mobile Electronic Tour Guides and Positioning Systems
To be able to provide the services described in the previous section, a positioningsystem is required. We saw that the most basic idea of enhancing the experiencefrom an exhibition visit is to let the guide provide the visitor with additional infor-mation about the artefacts he is watching. For the guide to dothis, it has to knowwhich artefact the visitor is currently watching. The simplest way to do this is tomark each artefact with a number, and then let the visitor enter the number belong-ing to the artefact in question on his device. The corresponding information is thenrevealed on the device [62].
There are two main reasons that this very simple and low-costsolution will nothold in many tour guide applications. First, this solution will not provide navi-gation support, and second, the user will have to take an active part. Whether theusers should be actively involved in the positioning process, or whether they shouldremain passive, is a very important issue developers of LBSshave to consider, asit put very different requirements on the underlying positioning system. Anactiveuserhas to perform some action for the system to do the positioning. For example,the user can be equipped with a hand-held device. When the user sees an interest-ing artefact, he can point his device at a sensor attached to the artefact, and by thistell the system that he is present. He will then receive some information about thisartefact. On the other hand, apassive userdoes not have to perform any specificaction for the positioning to occur. He could wear a tag on hisjacket that is auto-matically positioned by a surrounding infrastructure without the user being awareof it. In general, providing positioning capability to systems with passive users ismuch more challenging than to systems with active users.

62CHAPTER 5. LOCATION BASED SERVICES FOR INDOOR EXHIBITIONS
Figure 5.3: The Cyberguide system
Existing Location Based Tour Guides
We will now look at examples of how positioning technology has already beenused in electronic tour guides. Only indoor systems are included.
Cyberguide The Cyberguide project [8] took place at Georgia Institute of Tech-nology during a one year period in 1996/97. Project researchers and students devel-oped prototypes of a location based tour guide that could support a visitor to one ofthe labs during monthly open houses. The visitor was provided with a PDA1 witha map of the lab, with symbols representing the different projects demonstrated atdifferent places in the lab. When the visitor clicks on a symbol, information aboutthe project is displayed on the screen. All information is stored on the PDA.
The positioning capability of Cyberguide was used to automatically scroll the mapso that the user and his immediate surroundings would alwaysbe in the picture.Positioning information was based on proximity sensing, byhaving a special IRreceiver connected to the PDA listening for infrared signals (beacons) emitted fromTV remote control units hanging from the ceiling. Each unit made up a smallcell, and position was updated when the user moved into a new cell. Figure 5.3illustrates this.
1From the Apple MessagePad series, running Newton OS. In salefrom 1995–98.

5.1. PROBLEM AREA 63
Figure 5.4: Infrared transmitters in the fresco room in Torre Aquila.
Torre Aquila Torre Aquila is a tower at the Buonconsiglio Castle in Trento, Italy.In this tower there is a room with a large fresco, which coversall four walls witha total of eleven different panels (see figure). Researchersfrom The Trentino Cul-tural Institute have developed a prototype of a multimedia museum guide, which issupposed to enhance an audio presentation of the fresco by showing the visitor pic-tures of the parts of the panel which is currently spoken of ona PDA [9]. The ideais that this will make it easier for the visitor to identify details in large, complexpaintings while simultaneously listening to an audio commentary.
As in the Cyberguide project, an infrared based proximity technique is used forpositioning. IR transmitters are installed in front of eachof the eleven panels, andthe PDA has an infrared receiver. When the system detects a visitor in front of apanel, a picture of that panel is displayed on the PDA. If the user does not move,the panel will be highlighted on the screen and the visitor can click on it to start apresentation about the panel.
Pilot tests of the prototype, conducted in 2003, showed thatmost of the test userspointed directly at the infrared transmitters with the PDA to speed up the position-ing.
TaggedX TaggedX (Tagged Exhibition) is a location based museum guide projectthat was implemented at the Natural History Museum of Aarhusin Denmark in2003 and 2004 [10]. The museum has both a permanent exhibition and severaltemporary exhibitions. The technical set-up of the TaggedXsystem is given in fig-

64CHAPTER 5. LOCATION BASED SERVICES FOR INDOOR EXHIBITIONS
Figure 5.5: TaggedX technical set-up
ure 5.5. The artefacts that the visitors are going to get additional information aboutin this case are stuffed animals. These are tagged with passive RFID tags, andeach visitor PDA is equipped with a Compact Flash (CF) RFID reader by using anextension sleeve. When the visitor moves his PDA within 3 cm of an animal, theCF reader reads the unique ID and provides it to the PDA. The PDA then sends arequest to a central server using WLAN, asking for information that correspondsto this ID. The information is retrieved from a database and sent back to the PDA.The battery life of the PDA is two hours when constantly in use.
The MUSE Project The MUSE project [63, 64, 65] is an industrial researchproject in the domain of cultural heritage and tourism. The first report on theproject was published in 2000, and articles on the evaluation of pilot tests werepublished in 2004.
The MUSE project has developed a general framework for implementing context-aware applications that can deliver multimedia content andservices on severaldifferent devices—from powerful, stationary computers with large wall-mountedscreens to mobile devices. For mobile use, a proprietary wearable terminal calledWHYRE has been built. This device plays the role as a personalcontext-awaremultimedia guide for use in museums and architectural sites. WHYRE can detectposition and orientation by several different sensors and WLAN. The sensors can
5.1. PROBLEM AREA 65
provide position, azimuth, roll, and pitch information, and there are also a digitalcompass, two acceleroscopes, and a gyroscope included in WHYRE. In the pilottests, users’ approximate positions were detected by a positioning algorithm basedon signals received by WLAN access points. Orientation is tracked by a combina-tion of inertial and geomagnetic sensors. The WHYRE device is very expensive,and weighs nearly three pounds.
Nidaros The work with an electronic tour guide for visitors to Norway’s mostfamous cathedral Nidaros, was published in 2004 [66]. Thesetour guides areWLAN-equipped iPAQ PDAs, and positioning information is provided by the com-mercially available Cordis RadioEye system described in section 4.3.1 on page 50.This system claims that it is able to determine the position of all WLAN-equippeddevices in its range with an accuracy of up to 50 cm. However, in the tour guideprototype, the RadioEye was found not to be accurate enough.The virtual zonesthe cathedral was divided into were relatively small, and required an accuracy ofabout 1 metre. Tests showed that this was not achieved.
The RadioEye was placed above an entrance, 15 metres above the floor. The accu-racy is influenced by obstacles between the mobile device andthe RadioEye, andby the angle between them. Thus, the placement of RadioEyes is very importantto get maximum accuracy. However, with large angle and some obstructions, theaccuracy is still as good as about 2 metres.
Shared Mixed Reality in the Lighthouse The goal of this research (from 2003)was to make a mixed reality system, where physical and digital users can sharea museum visit together in real time [?]. This is done by using a virtual reality(VR) version of the museum. In this way, social experiences could be supportedat a distance, letting the visitors collaborate and discussthe exhibitions like if theywere at the museum together. Location awareness is a powerful resource for sucha shared experience, which in this project was produced using PDAs, an ultrasonictracking system, a 3D representation of the gallery, 2D maps, and mixed realityexhibitions. Two other resources are a common audio channelthrough the use ofan Internet voice conference system and a common information space.
Awareness of the other users locations and orientations areused to indicate whatthey are looking at and what they are doing. The physical users are equippedwith a PDA, which has a sensor package that is part of the ultrasonic locationsystem described in section 4.4.2 on page 54. The sensor package also includes anelectronic compass for orientation information. The location and orientation aredisplayed on a map, along with the locations and orientations of the other visitors.The VR user sees the other users as avatars on his screen.

66CHAPTER 5. LOCATION BASED SERVICES FOR INDOOR EXHIBITIONS
5.2 Case: The Astrup Fearnley Museum of Modern Art
The Astrup Fearnley Museum of Modern Art in Oslo, Norway, is aprivate contem-porary art museum that produces temporary exhibitions of international art [67]. Itwas chosen because it is a popular museum, it is privately held by people withmoney (which they may spend on new technology), and they haveshown an in-terest in electronic museum guiding. The museum has alreadyimplemented someform of enhanced visiting by providing their visitors with additional informationabout the artefacts. Their concept is called “Artists on theMobile Phone”. The vis-itor is given a list of number-artist pairs, and can call a telephone number with theirown mobile phone and then select a number code from the list. The audio contentvaries between the artists themselves talking about their art works, and guides fromthe museum talking about the art works. The cost of this service is NOK 30,-, inaddition to local rate. The customer is charged the cost via SMS and on receipt ofthe SMS you may use the service repeatedly for two hours.
5.2.1 Detailed Description
Here follows a detailed description of the Astrup Fearnley museum. It tries to coverthe list of exhibition characteristics given in section 5.1.1 on page 58.
The Astrup Fearnley museum is part of a bigger building. It isabout 2500m2, withexhibition areas on two different floors. The distance from floor to ceiling variesin the different halls, from 3.5 metres to 10.5 metres. Figure 5.2.1 on the next pageshows the layout and measures of the two floors. It should be noted that someof the walls in the figure are temporary walls. Between each exhibition a joinercomes in and takes down and builds up new walls so that the premises will fit therequirements of the next exhibition.
The large curved wall is made of concrete. The stairs are steel with steps of oak.The floor is Portugeese sandstone called Cascais Azul. Thereare a few windows,but they are all covered with plastic blinds.
In 2005 the museum hosted three exhibitions between January22 and December11. The first and the second exhibition lasted for about four months each, while thelast exhibition lasted for two months. Between exhibitionsthe museum is closedfor visitors while the old exhibition is replaced by a new one. In 2005 this tooktwo and three weeks, respectively. Except these periods, the museum is open to thepublic for free, six days a week.
In 2005 there were about 117 000 visitors to the museum. By using the informationabove to make an estimate of how many days that year the museumwas open weget about 250 days. This means that there were an average of 468 visitors eachday, but there are typically more in the beginning of an exhibition. By using this

5.2. CASE: THE ASTRUP FEARNLEY MUSEUM OF MODERN ART 67
Figure 5.6: Layout of the Astrup Fearnley museum. Ground floor above, andlower ground floor below. The gray areas are the exhibition areas. The whiteareas include restrooms, shop, information center etc.

68CHAPTER 5. LOCATION BASED SERVICES FOR INDOOR EXHIBITIONS
number and divide it by opening hours, which is six hours on average through theweek, there are approximately 78 visitors at any time in the museum. These arenormally evenly spread out.
Weekdays from 11am to 2pm there are guided tours for school classes, one at atime and with a maximium of 30 students per class. There is also possible to orderguided tours at any time for groups of maximum 30 people.
Visitor numbers varies a lot from time to time, but the estimates can still give us anidea of how crowded the museum is by taking some logical assumptions. The firstdays of an exhibition it is very crowded, and there are less people at other times.Weekdays have more groups than weekends etc.
I did my on-site research of the museum on December 7 og 9 2005 in the afternoon.There were between 20 and 40 visitors in the museum at that time. The exhibitionI watched is called “Uncertain States of America - American Art in the 3rd Millen-nium”. The exhibition consists of a variety of different kinds of artwork, which istypical for a contemporary art exhibition (see also figure 5.7 on the facing page):
Paintings and pictures There were traditional paintings hanging on the walls, andthere were canvases or panels in varying sizes leaning to thewalls.
Stand-alone artefactsWith stand-alone I mean artefacts, typically sculptures ormodels of any kind that is standing or lying on the floor. In this particularexhibition there were many artefacts on the floor. The size ofthese artefactswere typically about half the size of a human body or same sizeas a humanbody, but there were also a few very large installations.
Showcase artefactsThis means that the artefact is placed inside a showcase ofglass, which is typically placed on a pedestal.
Television and projector installations It is more and more common that the art-works are video or film. In these cases the installation consists of a televisionor projector and a screen, canvas or just the wall, and in somecases a coachor several chairs. One of the rooms were actually completelyempty, withonly a projector in one of the upper corners that made funny patterns on thefloor and that was it.
Because of the trend with increasing number of video installations, the mu-seum have to split the exhibition areas into several smallerrooms because itis supposed to be dark or quiet.
5.2.2 Museum Application Requirements
We will now establish a requirements specification for a mobile electronic tourguide which is to be used by the Astrup Fearnley museum. What they want is

5.2. CASE: THE ASTRUP FEARNLEY MUSEUM OF MODERN ART 69
Figure 5.7: Pictures from the case study exhibition

70CHAPTER 5. LOCATION BASED SERVICES FOR INDOOR EXHIBITIONS
an electronic guide that provides all the services and features described in the endof section 5.1.2 on page 60. In this section these services and features are turnedinto more formal requirements which will be used throughoutthe analysis whichfollows in section 6.1 on page 77.
Functional Requirements
The functional requirements specify the services or functions of the system—whatthe system must accomplish.
FR1 The electronic museum guide should present the user with multimedia contentcorresponding to the artefact(s) he is most likely to be interested in at anytime.
FR2 The electronic museum guide should offer the user with a map of the museum.The map should be automatically updated to show the area in which the usercurrently is (e.g. which floor), and where in this area he is (e.g. which room).
FR3 The user should be able to get information about where in the museum hisco-visitors and representatives from the staff are.
FR4 The management should be able to get information about wherein the mu-seum visitors and staff are.
FR5 The system should record the user’s actions while in the museum.
This implies that the museum application will consist of at least six components:a mobile hand-held device, a map, a positioning mechanism, rich multimedia con-tent, databases for location information and multimedia content, and communica-tion channels. The device used for the electronic guide and the communicationchannels are described in more detail below, because these components imposesome important constraints on the system design. The positioning mechanism isthe most important component in our case, and will be furtherdescribed in the nextsection called non-functional requirements.
It should be noted that it is very important to address privacy issues in a systemlike this, which is actually monitoring its users, both staff and visitors (refer to theprivacy discussion in section 2.2.2 on page 13). However, inmost cases this canbe solved by explaining the person to be monitored the reasons for doing it, andby providing him with the opportunity to switch the positioning mechanism offwhenever he wants to.

5.2. CASE: THE ASTRUP FEARNLEY MUSEUM OF MODERN ART 71
Device Requirements and Constraints To be able to show multimedia content,the mobile end-user device needs a screen and an audio outputchannel. It shouldalso have some input channels, like buttons or a touch screen, and it must be easy tocarry around. The commercially available devices today that best suits these char-acteristics, are the personal digital assistants (PDAs). The drawback with thesedevices is that they have limited processing power and limited memory and batterycapacity. One of the implications from this is that most of the multimedia contentthat the PDA should present have to be stored on a server, and that it must be de-cided what data to store on the device, and what data to be streamed upon request.Regular textual content could be stored on the PDA.
As mobile phone technology improves, these are promising for use as tour guidesinstead of the PDAs. Mobile phone screens get larger, battery capacity improves,and they are equipped with several means for communication.For example, theNokia N95 mobile phone has a large screen, GPS, WLAN, Bluetooth and IR. Thebig advantage of using visitors’ own mobile phones as tour guides, is that the mu-seum does not have to invest in user devices. The disadvantage is that mobilephone screens will probably always be smaller than PDA screens, that visitor’shave to dowload an application upon arrival at the museum, and the huge varietyof phones that would have to be supported. In the following, we use a PDA as theuser device in the Astrup Fearnley museum.
A tour guide prototype for mobile phones was made for the Nobel Peace Centerin Oslo, Norway, in 2005. In this prototype, a new means for positioning wasalso developed, in cooperation with Radionor, the providerof the Cordis RadioEyesystem described in this thesis. A new SIM card for mobile phones was developed,so that the phone could be positioned using WLAN and Cordis RadioEye.
Communication The mobile device needs to communicate with a central systemfor a lot of different reasons. It will request for content, its locally stored contentwould need to be updated, messages may be sent between visitors and between thevisitor and staff or the central system. In addition, position information must beexchanged between the device and the system. As we have seen in earlier chapters,some communications systems such as WLAN can also be used forpositioning.An important issue regarding the underlying positioning system is thus whetherit should be coupled with the communication system or not. Inthe following,we assume that a WLAN network is installed in the Astrup Fearnley museum forcommunication purposes like those mentioned above.
Non-functional Requirements: The Positioning System Requirements
By reviewing the functional requirements in section 5.2.2 on the facing page, wecan see that they all depend on an underlying positioning system, which should

72CHAPTER 5. LOCATION BASED SERVICES FOR INDOOR EXHIBITIONS
cover the 1800m2 of exhibition areas. The electronic museum guide application’srequirements of this positioning system is given below. They are based on thelocation system properties outlined in section 2.2.3 on page 14.
User involvement
PR1: The user should be passive.
This first requirement could equally well be called semi-passive or semi-active.What it means is that the user should be told that his positionrelative to the dif-ferent artefacts in the museum determines which artefacts the PDA automaticallywill provide information about, but the user should not haveto be required to per-form certain actions for the positioning to occur. This means that the user will haveto walk about and be near the artefacts he is interested in information about, buthe should not have to walk very close to the artefact, point toit, read instructionsposters, etc.
Accuracy, precision, and update rate
PR2: The system should know in which room the visitor is at anytime, with a con-fidence level of 95%.
This requirement will cover functioanl requirements FR2-FR4. For FR2, the userwill be presented with a map of the building or a part of the building, and the roomthe user is currently in will be highlighted. For the user this room-scale accuracyis good enough, since there is no added value in knowing exactly where in a roomhe is in this kind of application. He is most likely to see thatfor himself.
One advantage by room-scale accuracy is that the positioning update rate can belower than in a case with continous real-time tracking of a small dot representingthe user, thus potentially saving power or reducing the amount of infrastructure.But, it is important that the system is designed so that it quickly detects when auser enters a new room.
Since the system knows where a visitor is at any time, it knowswhere all visitorsare. By storing the positioning information about all visitors centrally, a user canget information about other visitors he came to the museum with (as long as thesehave agreed to it) upon request to the system (FR3). As response small symbolsfor each co-visitor could be displayed in the different rooms on the map, and/orthe user could be presented with a list of name-room pairs textually. Informationabout staff members can be stored in the same way, and the management could getinformation about both visitors and staff (FR4).
PR3: The system should know which artefact the user is most likely to want ad-ditional information about at any time, based on where he is.An accuracy of 2

5.2. CASE: THE ASTRUP FEARNLEY MUSEUM OF MODERN ART 73
metres is sufficient.
This requirement is based on two assumptions. The first is that there is very un-likely that there are so many artefacts within a radius of twometres from the userthat the PDA will show too many “hits” or miss out some “hits”.The second isthat 2 metres is the longest distance when the user still feels that he is “near” anartefact.
Scale and scalability
PR4: The system should be able to handle 200 concurrent users, and crowds of upto 40 users packed closely together.
PR5: The positioning system should scale well regarding both physical reach andhandling larger amounts of MOs.
Scalability is not very important in our particular case, but for the solution to beused in other museums as well this is very important. It is also possible that themuseum will expand its exhibition areas in the future, and itis clever to be awareif this would be a problem with the existing positioning system.
Deployment and integration
PR6: The system infrastructure should be easy to install andconfigure.
PR7: The system infrastructure should not disturb its users.
PR8: The system infrastructure should be easy to reconfigurewith new exhibitions.
This includes both replacement of hardware components in the infrastructure andreconfiguration of the system.
Power consuption
PR9: The user should be able to stay in the museum a whole day (six hours) withouthaving to worry about recharging any batteries.
PR10: The museum staff should spend a minimum of time and effort recharging orreplacing any batteries.
Cost
PR11: The costs should be as low as possible.

74CHAPTER 5. LOCATION BASED SERVICES FOR INDOOR EXHIBITIONS
Figure 5.8: Requirements prioritised
Deciding Requirement Priority
To give priorities to the requirements is not an easy task. They are all importantto us, that is why they are chosen as our requirements. Still,some are more im-portant than others, and it is important to clearify this before starting the analysiswork because it makes it possible to compare different solutions to each other in astructured way.
The result of deciding requirement priority is given in figure 5.8. Below followsome of the arguments for ending up with this result.
The top three requirements in figure 5.8 makes sure that the positioning system isable to do what we want it to do. The fourth requirement ensures that the museumcould afford it. Requirements 5–7 says something about how much extra work isput on the museum staff (or on hired extra personnel). They are internally rangedas they are because number five represents continuos work, number six representsa work process that will happen about four times a year (with each new exhibition),and number seven will typically be a one time only happening.
Requirement number eight and nine are very important for theuser experience.However, together with requirement number ten it may be possible to adjust ourrequirements only a little if these are not fullfilled. For example, if the battery onthe PDA only lasts for four hours and not the required six, thevisitors could bemade aware of this and it would not be a big deal. It might be rare anyway thata visitor spends the whole day in the museum. Or if the user device includes aheadset that is somewhat bulky, it is still likely that many of the visitors interestingin using a PDA in the museum would not care about this. If the positioning systemdoes not manage to support as many as 200 concurrent users, the museum couldreduce this number by only providing PDAs to 100 visitors at atime. This isactually not unlikely, because buying and managing 200 PDAsis maybe over the

5.3. SUMMARY 75
top for most museums.
The “least important” requirement is scalability. The reason for this is that scalabil-ity is not necessary for an initial set-up of the system to work. One could say thatscalability has a big influence at the system from the start because the “effectivity”of the infrastructure plays a big role—that is how much more space is covered orhow many new users can be supported by adding one piece of infrastructure. Al-though this is true this is covered by other requirements here, such as how easythe system is to install and whether the hardware costs are low (which both meanmore scalable infrastructure). However, scalability is important if the system is tobe expanded at a later time, and it often also say something about how well theparticular system would suit other buildings with different environments.
5.3 Summary
In this chapter, we have looked at a selected location based service, amobile elec-tronic tour guide, for use in indoor exhibitions. First, we gave a list of importantcharacteristics with indoor exhibitions. Then, we described electronic tour guidesin detail. This formed the basis for a requirements specification for our tour guide.
In addition, we gave a detailed description of a selected exhibition, a modern artmuseum. In the next chapter, we will analyse location systems from chapter 4against the requirements specification and museum description, to see if any ofthese systems can be used to provide location information toour tour guide in asufficient way.

76CHAPTER 5. LOCATION BASED SERVICES FOR INDOOR EXHIBITIONS
Chapter 6
Analysis
In the previous chapter, a requirements specification for the positioning system tobe used in the Astrup Fearnley museum was developed. In this chapter, a thoroughanalysis of whether any of the already existing positioningsolutions described inchapter 4 or 5 will fulfil the museum’s needs, is performed. Each solution is re-viewed in a structured manner in section 6.1. Then follows a discussion of findingsin section 6.2 on page 91. Finally, in section 6.3 on page 99, we will try to makesome important lessons learned in this thesis more general and easily available foruse by others. However, as will be shown, this is very challenging. Thus, we willalso propose a new architecture for future LBCSs, which can reduce the risk ofchoosing a solution that does not work as intended.
6.1 Structured Analysis
The positioning system requirements PR1 to PR11 were sortedin prioritised orderin figure 5.8 on page 74. These requirements will be reviewed for most of thesystems from chapter 4 and chapter 5, and the results will be summarised in a tablelike the one in figure 6.1 on the following page. The requirement with highestpriority is on the leftmost side, and the least important oneis at the rightmost side.If a requirement is marked with an “X”, it means that it is not fulfilled. If it ismarked with a “/”, it means that the requirement is only partly fulfilled. No markmeans that the requirement is fulfilled. The reason for doingit this way instead ofthe opposite, with marks for requirements that are fulfilled, is that it makes the tableeasier to read. What we are interested in are the requirements that are not fulfilled,and this is made more explicit by marking only these and leavethe others empty.There are more requirements that are fulfilled than are not fulfilled. Systems thatare not analysed and the reasons for this are given in section6.1.4 on page 90.
77

78 CHAPTER 6. ANALYSIS
Figure 6.1: Summary table for structured analysis
The analysis will start by reviewing existing location based tour guide systems de-scribed in section 5.1.2 on page 62. This group of systems will be calledCategory1 systems. It is natural to start with these systems, because they havebeen imple-mented in the same domain as we are interested in. Then followtheCategory 2systems. These are similar to those in the first group, but used for other LBSs andin other domains. The third group, theCategory 3 systems, consists of the rest ofthe systems described in chapter 4.
The analysis of a system will be based on a scenario where the system is to beinstalled in the Astrup Fearnley museum, which was described in section 5.2.1 onpage 66. Assumptions are made when necessary, for example because informationon some aspects of a solution is not available. All requirements are reviewed,but only those requiring explicit explanations are discussed in the text. A briefconclusion of each system’s suitability for use is given, and a summary of thewhole analysis is shown in figure 6.4 on page 91.
6.1.1 Category 1 Systems
The Category 1 systems are the location systems used by the different tour guidesdescribed in chapter 5. These are Cyberguide, Torre Aquila,TaggedX, CordisRadioEye (used in the Nidaros project) and Bristol (used in the Shared MixedReality project).
Cyberguide
Cyberguide, described in section 5.1.2 on page 62, uses TV remote control unitshanging from the ceiling as infrastructure transmitters (beacons). The IR range ofsuch units vary, and can be as good as 5 metres. By using a unit with several LEDs,a coverage area of 2 metres radius at waist height is possible.

6.1. STRUCTURED ANALYSIS 79
In the original set-up, the Cyberguide system required special IR receivers con-nected to the PDA. Today, there exist a lot of plug-in programs which can turn theIrDA port on a mobile device into a receiver that can receive signals from remotecontrols.
Room scale accuracy using Cyberguide technology is possible by placing beaconsjust inside the entrance of all rooms. Because most rooms in the Astrup Fearnleymuseum have more than one possible entrance, the number of such beacons wouldbe about 18 for the ground floor. To support 2 metre proximity sensing to artefacts,beacons would also have to be placed above each artefact, or group of artefactsif these are placed very close to each other relative to the coverage area of thebeacon. For the exhibition on display during our site surveyin the museum, thiswould mean adding 27 more beacons for the ground floor, makingthe total amountof beacons 45.
It should be noted that in some cases it might be necessary to have several beaconsper artefact. For example, if an artefact is very large and wide and placed in themiddle of a room, it might be necessary to have beacons on several sides of theartefact. If only one beacon is used and it is placed right above the artefact, therange of it might not reach outside the artefact itself. If the beacon is placed on theouter edge of the artefact it won’t cover visitors coming from all directions.
The prices of remote controls range from $10 to several hundred dollars, dependingon their functionality and IR hardware. A $40 remote with IR capabilities thatwould cover our needs was found, but as all remotes it has a lotof functionalityand a housing with buttons that we don’t need for it to function as a Cyberguidebeacon. It would not be difficult to make simpler beacons at lower costs. However,if $40 remotes are used, the total beacon costs would be $1800, which is not a veryhigh cost for a complete sensor infrastructure. With more research, it is also likelythat a cheaper remote that does the job could be found.
The Cyberguide beacons have to be ceiling mounted. Althoughno wires areneeded, it would be a time-consuming task to mount 45 beaconsfor one floor (andthe other floor is twice as large). In the two areas of the museum where the ceiling–floor distance is above 7 and 10 metres, the beacons would haveto be hanging fromthe ceiling down to normal ceiling height due to limited range. One of the biggestdisadvantages with the Cyberguide system is that the cumbersome installation pro-cess would have to be repeated with each new exhibition. Because the new artefactsmay be arranged in a completely different way, many or all of the beacons have tobe moved accordingly. One could think that it would be betterto mount as manybeacons as is needed to cover the whole floor during the first installation, and justmap new artefacts to the appropriate beacons. Then it would not be necessary tomove any beacons. However, this would require a tremendous installation effort, ahuge amount of beacons and a more difficult beacon/artefact mapping process. Thechallenging indoor environment is also likely to cause problems with non-intended

80 CHAPTER 6. ANALYSIS
beacon signals reaching receivers which normally are outside their reach.
The biggest problem with using Cyberguide in the Astrup Fearnley museum wouldbe to change beacon batteries. For this to not be a problem, the batteries wouldhave to last for at least four months, because then they couldbe replaced whileremounting the beacons between two exhibitions. As the beacons continuouslyemit their IDs at short time intervals, and because they haveseveral LEDs andprovide relatively long range, batteries would need to be replaced too often.
Conclusion The disadvantages with the Cyberguide solution is that it would betime-consuming and cumbersome to install, to reconfigure, and to maintain beaconbatteries.
Torre Aquila
The Torre Aquila system, described in section 5.1.2 on page 62, operates withonly 1 metre IR range. This means that our requirement of 2 metres proximitysensing can not be fulfilled. It also means that the user wouldhave to take an activepart for room scale positioning to occur, for example by pointing his device at aspecial “Entering new room” transmitter by the room entrance. The reason for thisis that some of the openings between rooms are wider than 2 metres, so even iftransmitters were placed all around the entrance, their signals may not reach thereceiver at the PDA.
If we were to use the Torre Aquila system although it does not support 2 metresaccuracy, a new problem may arise. Because of the limited range, the visitorswould have to get very close to an artefact for positioning tooccur. The resultcould be queues at the most popular artefacts. The Torre Aquila system wouldalso be cumbersome to install, as the transmitters are wired, and one transmitter isneeded for every artefact.
Conclusion The biggest problem with the Torre Aquila solution is that the rangeis too limited. 2 metres proximity sensing can not be achieved, and room scaleaccuracy would require an active user. This makes Torre Aquila a bad candidatefor use in the Astrup Fearnley museum.
TaggedX and Passive RFID in General
The TaggedX system, described in section 5.1.2 on page 63, could not be used inthe Astrup Fearnley museum because the tag/reader range is only a few centime-tres. As in the Torre Aquila case, limited range violates therequirements for 2

6.1. STRUCTURED ANALYSIS 81
metres proximity sensing and a passive user. Room scale accuracy is difficult, andqueueing problems are likely to occur. The user would have tobe very active—walking really close to the artefacts, and then hold his PDA next to the artefact’stag. This solution could be replaced by a much simpler and cheaper solution, wherethe user enters given numbers for the artefacts he is interested in.
As just described, the TaggedX solution violates our three most important require-ments due to its limited range. However, it does fulfil all theother requirements.Thus, it is interesting to look closer at passive RFID in general, to see how itcan solve all these other requirements. RFID technology wasdescribed in sec-tion 3.3.3 on page 35.
When a new exhibition is about to be set up, a lot of new artefacts arrive at themuseum. Before each artefact is placed in its proper location in the exhibitionareas, a member of the staff could attach a passive RFID tag toit. The tag’s ID isread with a hand-held reader and stored in a database, together with an artefact-IDand a room-ID. This work does not add much time or effort to theregular workingprocess. The advantages with using passive RFID tags are that they are cheap,and they do not need their own power source. No battery maintaining or wiring isnecessary.
The museum visitors are equipped with PDAs with RFID-readers. When a readercomes within range of an artefact-tag as the visitor walks about in the museum, itreads the artefact-ID and transmits it to a central server through WLAN. The centralserver looks up the tag-ID in the database, and finds out whichartefact the user isclose to and sends the correct content to the PDA through WLAN. It also checkson the room-ID, and if this is different from the last readingit sends an updatedmap to the PDA. Depending on how much storage capacity the PDAhas, some ofthis work may happen on the PDA without needing data from the central server.For example, information about the most popular artefacts could be pre-stored onthe PDA, together with these artefacts’ IDs. When the RFID reader detects theseIDs, it can show the right content without contacting the central server.
In some exhibitions the distribution of artefacts might be scarce. In this case, wepropose to introduce tags which we will calltracking tags. These are similar to theartefact tags, except they are not associated with an artefact-ID, only a room-ID.These tags can be placed where appropriate, for example justinside room entranceswhere artefacts are placed far into the room. During set up, after all artefacts ofan exhibition is placed around the areas, a staff member could take a walk throughthe museum and look for places where tracking-tags are needed. In this way thevisitor will always have an updated map.
We will now look at the possibility for having a passive RFID solution with betterrange, preferably about 2 metres. The problem is that current RFID-readers thatare small enough to be used in combination with a PDA, for example readers witha Compact Flash (CF) or Secure Digital (SD) interface, have very low range, max-

82 CHAPTER 6. ANALYSIS
Figure 6.2: Examples of RFID SD/CF readers
Figure 6.3: Examples of RFID reader costs
imum 10 cm (see figure 6.2). This means that the users will haveto be very activeand move close to the tags for reading to occur. This will be very disturbing for theuser, and it may also cause congestions at popular artefactsbecause all the usershave to walk very close up to it for reading to occur, before they can get informa-tion about it. Furthermore, figure 6.3 shows that RFID readers get very expensivewith increasing range. For use in a proximity solution as we have described, wewould need a range of about 2 metres. This will give a reader cost of $3000, whichis very expensive (prices from spring 2006).
Conclusion TaggedX or other passive RFID solutions would be easier to installthan the Torre Aquila solution, as the infrastructure RFID tags are wireless. Exceptfor this, it faces the same problems as the Torre Aquila solution, as the tag/readerrange is very limited. The cost of readers that could give longer range is very high.However, technology is always improving and prices are likely to drop, so passiveRFID may be a very promising solution in the future.
The Cordis RadioEye
The Cordis RadioEye (CRE) system used in the Nidaros projectrequires line ofsight for accurate positioning (see section 5.1.2 on page 65). This means that wewould need one RadioEye in every room in the Astrup Fearnley museum, eighton the ground floor and nine at the lower ground floor. Since thePDAs used byvisitors, management and staff can have built-in WLAN support, no additionalhardware is needed at the client side.
With CRE, there are no extra hardware that draws battery power from the PDA.

6.1. STRUCTURED ANALYSIS 83
However, the WLAN connection is always on, and this draws much power. Withtodays technology, the PDA battery would not last for the required six hours.
The accuracy of the CRE system is typically 1–2 metres or better. This suits ourproximity requirement of 2 metres very well. It was reportedin the Nidaros projectthat such accuracy was not achieved, but the reason for this is probably that theRadioEye was placed 15 metres above the floor at one side of a room. In the AstrupFearnley museum, the RadioEye would be placed in the middle of the room atheights of about 3, 4, 7 and 10 metres, and the rooms are smaller than the cathedralgallery. This should provide much better coverage and accuracy.
The RadioEyes have to be mounted in the ceiling and connectedto a power out-let, and then they have to be configured. After this initial installation, the systemdoes not have to be reconfigured, unless a new room is set up. Inthis case a newRadioEye would have to be installed.
The CRE system is a commercial product, and the cost of each RadioEye is almost$8000. The Astrup Fearnley museum would need 17 RadioEyes tocover all rooms,making the total sensor infrastructure costs $136000. The CRE system will thus bea much more cost-effective solution in buildings with larger and fewer rooms thanin our case.
Conclusion Because one RadioEye is needed in every room, and the AstrupFearnley museum consists of many rooms, the CRE solution will be expensive.Otherwise, it fulfils most of our requirements.
The Bristol US Positioning System
The Bristol positioning system was used in the Shared Mixed Reality project de-scribed in section 5.1.2 on page 65. To implement this systemin the Astrup Fearn-ley museum, four networked ultrasonic transmitters would have to be mounted inthe ceiling in every room. An RF transmitter in each room is also required. Aspecial receiver would have to be connected to each PDA. Preferably, it should beplaced on the users’ head or shoulder, since line of sight is required.
At the ground floor, there are five rooms that could be covered with a four US trans-mitters configuration. The largest room would probably needat least ten transmit-ters to be covered. In the two smallest rooms there might be only one transmitterto detect the presence of a person in the room. The total amount of US transmit-ters needed is thus 32, on the ground floor only. In addition, there are the radiotransmitters, and they all have to be connected with wires.
Bristol positioning hardware could be made for about $150 per room. In our casethe total hardware costs for the ground floor would be about $1050, which is af-

84 CHAPTER 6. ANALYSIS
fordable. Costs of wiring and receiver costs must be added.
The Bristol positioning system requires line of sight for accurate measurements tooccur. Thus, the receiver should be placed on the visitors’ head or shoulder.
Conclusion The main disadvantage with the Bristol positioning system is that itis very cumbersome to install.
6.1.2 Category 2 Systems
The category 1 systems that have been analysed this far are all used for positioningin electronic tour guides. Now, we will analyse positioningsystems that are similarto these, but implemented in other domains.
Locust Swarm
The Locust Swarm system, described in section 4.2.2 on page 48, is very similarto the Cyberguide system. Wireless IR transmitters calledLocustsbroadcast theirIDs, for receivers at the user devices to listen to. A Locust can cover an area of6 metres in diameter, depending on the distance above the floor. By reducing thesignal strength, the coverage area can be reduced. The system description andanalysis are almost identical to that of the Cyberguide system, and will not berepeated.
The difference between the Cyberguide and the Locust Swarm systems is that thelatter tries to solve the problem of changing batteries in the infrastructure nodes byequipping them with solar cells and place them in fluorescentlamps. In the AstrupFearnley museum, there are three problems with this solution. The first is that thisplace restrictions on where Locusts can be placed, because there has to be a lampthere. The second is that it is not unusual that some of the exhibition rooms are keptdark, for example when showing light installations or videopresentations. The lastproblem is the places where the ceiling–floor distance is very high. The Locusts’range would then be too short to reach down to the mobile devices.
Conclusion The Locust Swarm system is very similar to the Cyberguide systemand has the same disadvantages. It suggests to use solar cells instead of batteriesat the infrastructure nodes, but in the Astrup Fearnley museum, most nodes willstill require batteries.

6.1. STRUCTURED ANALYSIS 85
IRIS-LPS
For using the IRIS system, described in section 4.2.3 on page48, a stereo camerawould have to be mounted in each room. If the room is larger than 15 x 9 metres,an additional camera would be needed. In the Astrup Fearnleymuseum, this wouldresult in 9 cameras at the ground floor.
The visitors will have to wear headsets, with a transmittingIR tag made of 4 LEDsand a battery mounted on top of it. A LED with a transmitting angle of 20 degreeshad a range of more than 10 metres. By choosing LEDs with widerangles andshorter range, we can get the range and coverage area we need.A tag batterysupporting 4 LEDs can last for a minimum of six hours.
The first problem with IRIS is that it is cumbersome to install. Cameras have tobe mounted in every room, and they have to be connected with a central computer.The second problem is that the headsets will be somewhat bulky, so a proper designis important.
Conclusion The IRIS system may be a little cumbersome to install, and it requiresa bulky headset.
Active RFID
Passive RFID was discussed in 6.1.1 on page 80. Its biggest advantages are that thetags do not need their own power source, and their low cost. Inthe case of activeRFID (described in section 3.3.3 on page 35), the tags are much more expensive,they will need their own power source and the readers are at least as expensive asthose in figure 6.3 on page 82. Thus, we will not analyse this approach any further.
Conclusion By using active RFID we will solve the passive RFID range problem,but at the cost of much more expensive tags that need their ownpower source, andstill very high reader costs. Active RFID is thus not a good solution at this time.
BILS
BILS, described in section 4.3.2 on page 52, is similar to theBristol system. Themain difference is that it uses Bluetooth instead of ultrasound and radio waves.Four Bluetooth base stations with additional special hardware are required in everyroom. The Bluetooth range is 10 metres, so the biggest room atground level inthe Astrup Fearnley museum would require more than four basestations. The totalamount of base stations would be about 36, only at the ground level.
86 CHAPTER 6. ANALYSIS
Each base station has to be placed in a fixed known location, because its coordi-nates are used in the position calculation. They must also beconnected to a hostcomputer, which performs the position calculations. As BILS requires line of sight,the base stations should be placed in the upper corners of a room.
The Bluetooth module on the mobile device will draw much power from the PDA.
Conclusion BILS would be cumbersome to install in the Astrup Fearnley mu-seum. It also has a strict line of sight requirement, and the use of Bluetooth willdraw much power from the mobile device.
PAL650 (UWB)
The PAL650 system (see section 4.3.3 on page 52) is similar toBristol and BILS,as it needs four receivers, or actually three receivers and areference tag, in fixedknown positions. But the range is six times longer than with BILS, so it is better atcovering large rooms. This means that less infrastructure is needed. One advantageof PAL650 over BILS, is that the museum visitors wear tags that are only logicallyconnected to the PDA. Thus, it does not draw power from the PDA. The lifetimeof a tag battery is as long as four years. The other advantage with PAL650 is thatit does not require line of sight.
Conclusion The disadvantage of the PAL650 system is that it is cumbersome toinstall, like Bristol and BILS.
Active Bat
The Active Bat system from section 4.1.2 on page 43, is testedwith 750 receiverscovering an area of 1000m2. In the Astrup Fearnley museum, this would meanthat about 1350 receivers would be needed to cover the exhibition areas on the twofloors. All the 1350 receivers have to be mounted in the ceiling in known fixedlocations. This would be a tremendous work, and makes the Active Bat systema bad candidate for the Astrup Fearnley museum—and any otherindoor locationbased computing system covering several large rooms. The only case where thishuge installation effort could be defended, is when centimetre accuracy is requiredin a limited area.
Conclusion The tremendous effort of installing the infrastructure makes ActiveBat a bad candidate for all location based computing systemsspanning large areasor several rooms.

6.1. STRUCTURED ANALYSIS 87
Cricket
Cricket was described in section 4.1.3 on page 44. The ultrasonic range of theCricket beacons decide how many such beacons are required inan area. The rangeis 10.5 metres when there is line of sight, but this is not always the case. Thus, anassumption is made that the range is minimum 5 metres in the worst case scenario.By having nine beacons in each of the similar sized rooms at the ground floor inthe museum, and some more and some less in the much bigger and smaller rooms,the total amount of beacons at this floor will be about 84. The amount of beaconsthat make up the Cricket infrastructure is high, but they arecompletely wireless,and thus much easier to install than wired sensors. However,they are dependenton their own power source, so battery maintaining might be a burden. Anothermajor problem is that the beacons need to be configured with their exact position.This may be solved by auto beacon configuration algorithms inthe near future, butthe power problem will still exist. The Cricket listeners are attached to the PDAsthrough the CF slot, and draw power from the PDA.
Conclusion The Cricket solution is not suitable for the Astrup Fearnleymuseum.The large amount of beacons require a very good auto configuration algorithm anda better battery solution first.
6.1.3 Category 3 Systems
In this category, we find the rest of the systems described in this thesis that are notbelonging to category 1 or category 2.
Active Badge
The Active Badge system (see section 4.1.1 on page 42) could be used for roomscale accuracy only, or it could also be used for small scale proximity sensing byusing a hybrid IR/radio scheme. For the room scale only solution, one networkedIR sensor would be mounted in each room. 8 sensors would thus be required at theground floor. The visitors wear badges which transmit IDs that are associated withtheir PDAs. The central server gets information about whereeverybody is, and cansend the proper information to the different PDAs. In the hybrid scheme, there areradios placed at each artefact in addition to the infrared sensor network. The radiotransmitters could be wired for power, or they could use batteries. Their range canbe adjusted with power.
If our goal is room scale accuracy only, the Active Badge system is a good can-didate. Its only disadvantage is that the sensors have to be wired, so that some

88 CHAPTER 6. ANALYSIS
work has to be done during installation. But, in our case onlyone sensor would berequired in each room, so this should not be too difficult.
In the hybrid scheme the two different cases have different problems. If the radiosare power-adjusted to about 2 metres range, their batterieswould have to be re-placed pretty often. If the radios are wired, installation and reconfiguration wouldbe cumbersome, and the wires may be disturbing. For example,in cases where theartefact is placed in the middle of a room, the wire would haveto cross the floor orbe hanging from the ceiling.
Conclusion The original Active Badge system is a good solution for providingroom scale accuracy, but it does not support 2 metres proximity. A hybrid schemewith radios can be used to solve this problem, but then other problems arise. Wiredradios cause a lot of problems, and are thus not interesting.Wireless radios imposea problem of changing their batteries.
BIPS
BIPS (see section 4.3.2 on page 51) is very similar to the original Active Badgesystem, and could be used in the same way. The only differenceis that insteadof using diffuse infrared, the sensors use Bluetooth. This means that the sensors’range is 10 metres, and that there are some problems with handling many usersbecause of the slow device discovery process. Thus, the Active Badge would bea better choice if room scale accuracy is the only goal. In ourcase, however, wewould have to place wireless sensors at all artefacts for reaching 2 metres prox-imity. Because of their range, power consumption and devicediscovery problems,using Bluetooth in this way would not be a good choice.
Conclusion BIPS is similar to the original room-scale Active badge system. Itis not suitable for 2 metres proximity sensing, due to the Bluetooth characteristicssuch as power consumption and slow device discovery.
RADAR
RADAR (see section 4.1.4 on page 46) has been deployed in an area of 980 squaremetres with over 50 rooms, covered by three base stations. This means that threebase stations are enough to cover the ground floor (600m2) of the Astrup Fearnleymuseum, and that three or four base stations are enough to cover the lower groundfloor (1200m2). The PDAs are equipped with WLAN, so no other hardware isneeded.

6.1. STRUCTURED ANALYSIS 89
A radio map must be built to map measured signal strengths to position coordinates.Using the radio propagation model, only 4.3 metres accuracywas achieved. Thus,we would have to use the empirical approach, which provides accuracy of 2-3metres 50% of the time. Constructing the radio map takes time, and the museumwould need help from experts to do it. For better accuracy, maps for differentsituations should be made, and all these maps would have to bemade again witheach new exhibition introducing larger changes. Thus, although the hardware costsare very low, the configuration process will cost both time and money.
More and more buildings are equipped with WLAN today. If thisis already inplace, no additional hardware would be necessary, or the only thing required is toadd a base station or two, or to place the base stations in other locations. However,existing WLANs may be more usual in office buildings, learning institutions andcafes than in museums. Still, installing three WLAN base stations is not verydifficult or time-consuming, and the prices are very low.
Conclusion The accuracy/precision combination of RADAR is not sufficient forour tour guide, and the radio map construction process(es) would have been bothtime-consuming and expensive.
Ekahau
Ekahau (see section 4.3.1 on page 49) is very similar to RADAR, in that it uses(existing) WLAN infrastructure for positioning. Accuracyof 1 metre is possibleby using 5–7 access points, and the probabilistic approach reduces the time neededfor site calibration to about 1 hour per 1200m2. The site calibration of the As-trup Fearnley museum would then take about 90 minutes only. The second bigadvantage with Ekahau compared to RADAR, is that minor environment changesdo not require re-calibration of the positioning model. Partial re-calibration is onlyrequired when base stations are moved, or heavy structures are modified.
Conclusion As with RADAR, constructing the positioning model in Ekahautakestime, but much less time. A few more base stations are required, but these are lowcost and easy to install and provide better accuracy. Reconfiguration is also easier.Ekahau is a commercially available software product, but experts are required todo the walk through. The software and service costs may be high.
Hanover
The Hanover system is also similar to RADAR, but instead of using existing WLANinfrastructure, it relies on an existing Bluetooth infrastructure. Because the Blue-

90 CHAPTER 6. ANALYSIS
tooth range is much lower than the WLAN range, a minimum of three base stationsare necessary in every room. Another disadvantage with the Hanover over RADARis that using Bluetooth draws more power from the PDA.
Conclusion The Hanover system is most interesting in cases where a Bluetoothnetwork is already in place, or where there is no WLAN network.
6.1.4 Technologies or Systems Not Analysed
Some of the systems included in chapter 4 and 5 are not analysed further. Thereasons for this are given below.
The MUSE project (see section 5.1.2 on page 64) provides little detailed informa-tion on the positioning solution used, except that it uses WLAN. This is alredaycovered by other systems.
The only difference between the analysed Active Badge system and the PARCTABsystem (see section 4.2.1 on page 47), is the use of a badge versus a special PDA.Since this is the only major difference and we would like to use existing commer-cially available PDAs, only the Active Badge system was analysed.
DOLPHIN (see section 4.4.1 on page 53) is currently only handling positioning ofstatic devices, and is thus not interesting to us. However, it should be noted that itsauto configuration algorithms may be used by Cricket and Active Bat systems inthe future.
The ultrasound system which requires only one base station (see section 4.4.3 onpage 54) is very interesting research, as it would be similarto the IRIS-LPS and theCordis RadioEye systems in that only one unit of positioninghardware is requiredin each room. However, even though experiments show an accuracy of 2–3 metres,this is in ideal situations in a lab, and not in a changing and dynamic environmentlike a museum.
ZigBee technology was described in section 3.3.2 on page 33.In section 6.1.1 onpage 80, we analysed solutions based on passive RFID, and found that a proximitysolution with tagged artefacts is a very promising solution. However, limited rangemakes it difficult to realise. It would be interesting to see if ZigBee technologycould be used instead of passive RFID in such a solution. However, this will needa lot of testing, and is suggested as future work.
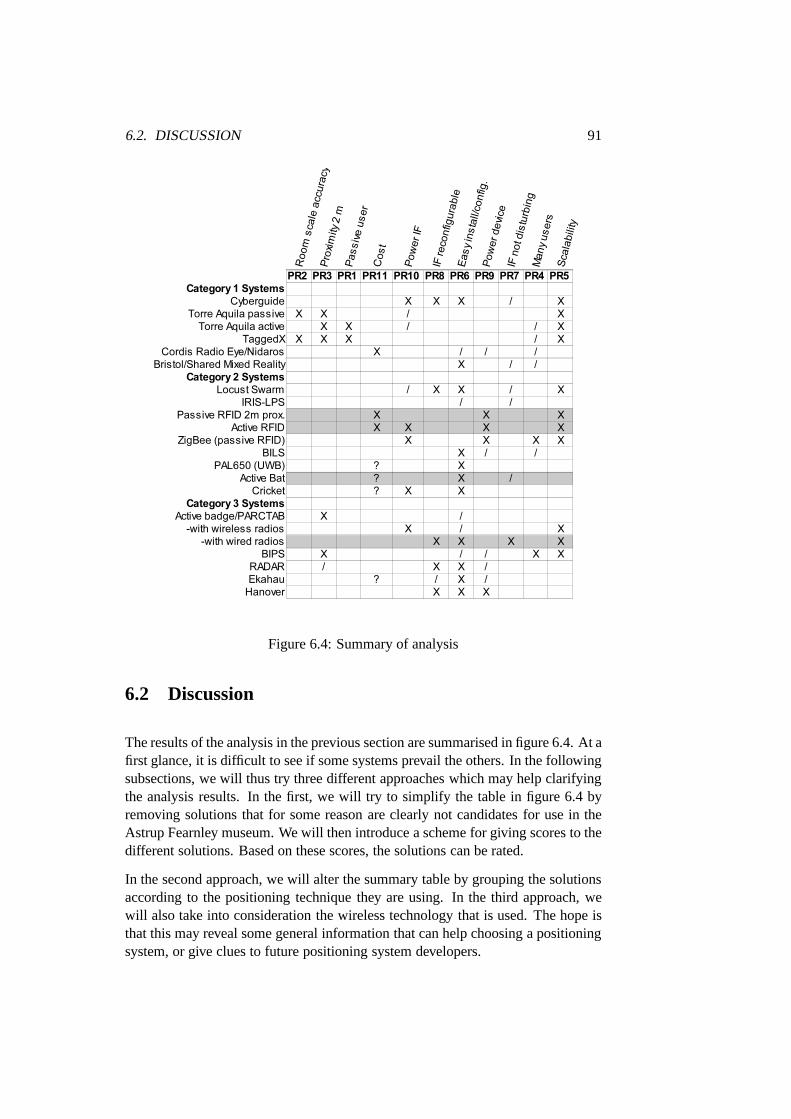
6.2. DISCUSSION 91
Figure 6.4: Summary of analysis
6.2 Discussion
The results of the analysis in the previous section are summarised in figure 6.4. At afirst glance, it is difficult to see if some systems prevail theothers. In the followingsubsections, we will thus try three different approaches which may help clarifyingthe analysis results. In the first, we will try to simplify thetable in figure 6.4 byremoving solutions that for some reason are clearly not candidates for use in theAstrup Fearnley museum. We will then introduce a scheme for giving scores to thedifferent solutions. Based on these scores, the solutions can be rated.
In the second approach, we will alter the summary table by grouping the solutionsaccording to the positioning technique they are using. In the third approach, wewill also take into consideration the wireless technology that is used. The hope isthat this may reveal some general information that can help choosing a positioningsystem, or give clues to future positioning system developers.

92 CHAPTER 6. ANALYSIS
6.2.1 Simplifying and Rating the Analysis Results
Our first approach in trying to make it easier to extract useful information fromthe analysis results, is to remove systems that are clearly not candidates for use inthe Astrup Fearnley museum. First, we remove the solutions which has an “X”for one or more of the three leftmost columns (PR2, PR3, or PR1). As stated insection 5.2.2 on page 74, these requirements ensure that thesolution is able to dowhat we want. Systems with an “X” here fail to do so. Thus, theyare not interestingto discuss any further, and can be left out so that the table gets easier to read. Whenthese systems are removed, the three columns can be removed altogether, as theyare now empty.
The fourth requirement from the left before we remove any columns is PR11—Cost. Because this is a requirement with a lot of uncertainty, we will remove thisone also, but take it into consideration again in later discussions.
We then remove the rows with grey backgrounds. As we saw in theconclusion ofeach of these systems during the analysis, their unfulfillment of at least one of therequirements but the four leftmost is so severe that it eliminates the solution for usein the Astrup Fearnley museum altogether.
To make it easier to sort the systems from “most suitable” to “least suitable”, wewill use a simple weighting scheme. There are seven requirements left, with themost important one still on the leftmost side and the least important on the right-most side. We start on the leftmost side and give this requirement weight seven,the next requirement six and so on. Thus, if a requirement hasan “/”, it is given ascore of it’s weight. If it has an “X”, it is given a score of it’s weight times 2, asthis is a more severe case. Finally, all the scores a system gets are summarised in atotal score. Low score means better suitability. The resultof this process is givenin figure 6.5 on the next page, with the most suitable systems at the top and theleast suitable at the bottom.
Findings from Simplifying and Rating the Analysis Results
As we can see in figure 6.5 on the facing page, IRIS-LPS seems tobe the bestchoice for use in the Astrup Fearnley museum. It actually fulfills all our require-ments to some extent. One or two cameras has to be mounted in each room, de-pending on room size, but this work should not be too much to overcome. Users ofthe museum guide will have to wear the transmitter tag in the form of a headset, butthis should not be a major problem as the same headset should be used for soundand most users are used to this.
The Cordis RadioEye system is also a very good candidate, butit might be expen-sive. This solution is very good for museums or other indoor environments with

6.2. DISCUSSION 93
Figure 6.5: Revised and sorted summary table from the analysis
few and/or large rooms, because then only a small number of the relatively expen-sive RadioEyes are needed. One solution for the Astrup Fearnley museum to keepthe costs down could be to install RadioEye’s in most rooms except the smallest.Because very small rooms are likely to have fewer artefacts,it would be sufficientto know that the user has entered a specific room. This could beinferred fromknowledge about the different RadioEyes’ placements and which RadioEye sawthe user last before he disappeared out of view.
6.2.2 Analysis Results vs Positioning Techniques
In chapter 2, the different positioning techniques triangulation, proximity sensing,and scene analysis were described. The second approach to interpret the analysisresult in figure 6.5, is to group the systems according to the positioning techniquethey are based upon. The hypothesis is that we will see some general differences.
Findings from Analysis Results vs Positioning Techniques
The first part of figure 6.6 on the following page shows the systems that are basedon the triangulation method. As we can clearly see, they are all able to do what wewant. Their main problem is that they are cumbersome to install and/or configure.

94 CHAPTER 6. ANALYSIS
Figure 6.6: Summary table of triangulation and scene analysis systems
Figure 6.7: Summary table of proximity systems

6.2. DISCUSSION 95
This is because their infrastructure is wired, and all except Cordis and IRIS need alot of infratructure installed in each room. But, once in place, they are doing a verygood job.
The scene analysis systems are given in figure 6.6 on the preceding page below thetriangulation systems. These systems take time to configure, and thus violate therequirements for initial set-up, as do the triangulation systems. In addition, thesesystems also take time to reconfigure if changes in room or artefact layout in a newexhibition are substantial.
By comparing figure 6.6 on the facing page with the summary table for the prox-imity systems in figure 6.7 on the preceding page, it is easy tonotice that thereare much more diversity between the proximity systems. While using a proximitysolution can solve the installation/configuration hurdle faced by most triangulationsystems, it introduces other problems. For example, we can see that many prox-imity systems fail to fulfill requirement PR10, which is typically not a problemwith triangulation systems. The main problem with proximity systems is that theyput very demanding requirements on the infrastructure nodes. To be able to ful-fill all our requirements such nodes have to be small, lightweight, and low cost.Their range should be 2 metres, they should use very little power, and handle manysimultaneous users. None of the solutions we have analysed have nodes with ahardware/software combination to do all this. There are twomain problems thathave to be overcome, cost and battery life, both on transmitter and receiver device.
We have now seen that triangulation systems seem to be betterthan proximitysystems and scene analysis systems. Their main problem is that installation andconfiguration is cumbersome. The Astrup Fearnley museum consists of 18 rooms,and equipping all of these with minimum four wired base stations in precise knownpositions is a big task. But if the number of rooms had been smaller, this workmight be worthwile.
Having stated this, it would be interesting to look closer atthe case with a proximitysolution when the number of rooms is high, like in the Astrup Fearnley museum.We did already say that this could solve the initial set-up problems. What is themain reason that current solutions will not work in Astrup Fearnley? The answer isthe high number of artefacts on display in the museum. If the number of artefactswere smaller, more of our requirements would be fulfilled. For example, the jobwith replacing batteries on infrastructure nodes (PR10) would be a smaller one.
The discussion above is summarised in figure 6.8 on page 97. The X-axis is thenumber of rooms in the museum, and the Y-axis is the number of artefacts. Wehave seen that the triangulation systems fulfill many of our requirements exceptthat they are difficult to install. This means that if the number of rooms is smallit could be worth doing the job. However, at some point (r) we reach a number ofrooms where it is no longer cost effective to use a triangulation method. Instead,we could use a proximity solution with wireless infrastructure nodes, because there

96 CHAPTER 6. ANALYSIS
is no wiring or other time-consuming installing involved. However, such a solutiontypically performs worse with increasing number of artefacts, because they needbattery replacements.
“Many” rooms or artefacts is not a very accurate measurement. The values forranda depend on many different factors, such as the the special premises, time,money available in the analysed case. A rule of thumb may be that r is somewherebetween 5–10, anda about 20, depending on battery life time of the infrastructurenodes and number of staff to change the batteries.
The different solutions we have analysed are plotted in the figure. It shows thatseveral systems could be used if the museum had fewer rooms and fewer arte-facts. We can also see that several systems can handle many artefactsor manyrooms. The Astrup Fearnley museum has both many rooms and a high number ofartefacts. This places it in the upper right quadrant. As we have seen earlier, theIRIS-LPS system and the Cordis RadioEye system are the only systems that couldbe used. However, if prices drop and battery technology improves, proximity solu-tions based on passive or active RFID technology could also be used.
6.2.3 Analysis Results vs Positioning Techniques and Technology
We have now found the existing solutions that would be most suitable to use forpositioning in the Astrup Fearnley museum. We have also seenthat the number ofrooms and the number of artefacts in a museum are important properties that in-fluence the type of positioning system that should be chosen.We will now includethe technology used by the positioning system in the discussion, to see if this couldreveal some complementary information. Figure 6.9 on page 98 shows the newextended table.
Findings from Analysis Results vs Positioning Techniques and Technology
There are mainly three findings from figure 6.9 on page 98.
1. Few systems use the scene analysis positioning techniquecompared to trian-gulation and proximity sensing. The main reason is that for such a system towork well, a lot of work is required beforehand to build maps or databases.These also have to be continously updated.
2. IR-based systems are typically proximity systems. The reason is the limitedrange of IR-signals, and the fact that they are so easily blocked. Althoughdiffuse IR helps increase range, the signals are altered every time they hitsomething on their way and it is difficult to interpret the signals correctly at
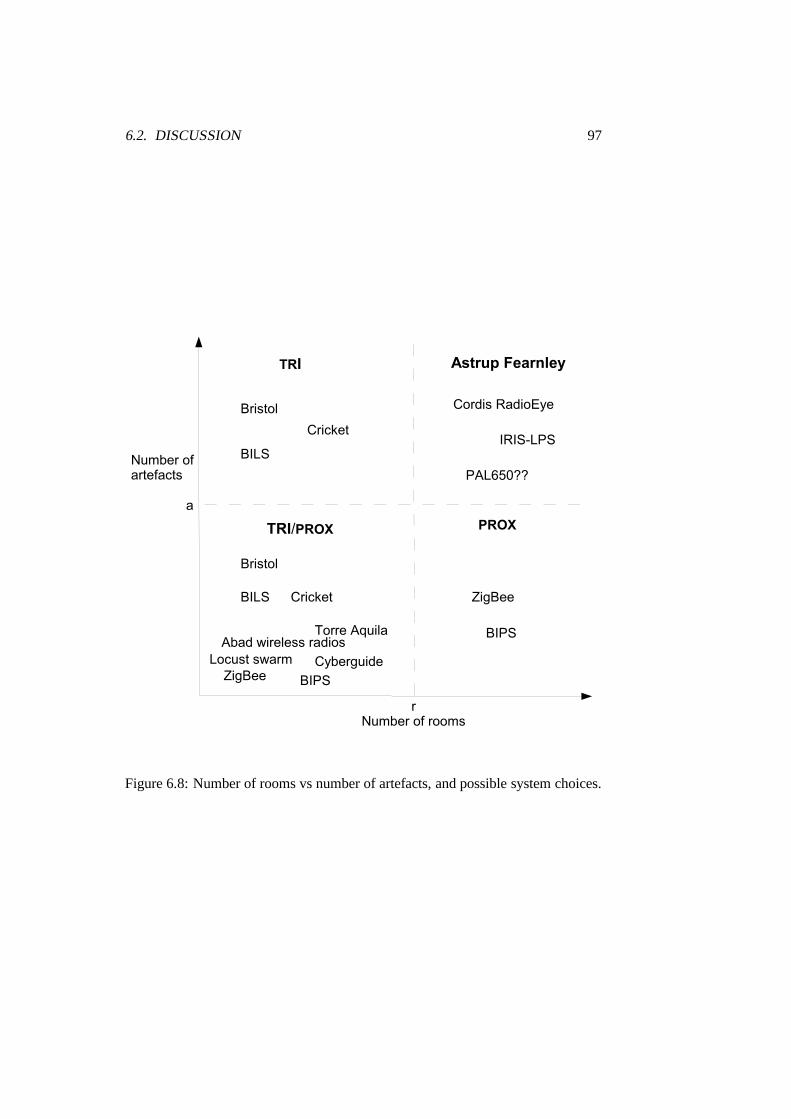
6.2. DISCUSSION 97
Figure 6.8: Number of rooms vs number of artefacts, and possible system choices.

98 CHAPTER 6. ANALYSIS
Figure 6.9: Summary table of systems with regards to positioning technique andtechnology
the receiver. A proximity solution does only need to detect asignal, it is notusing it for further computation of position.
3. Systems using triangulation for positioning are typically based on radio and/orultrasound technology. As described above, IR-signals aretoo easily dis-torted and can not be used for the precision computing in triangulation. Thus,the more robust radio or ultrasound signals are used. As we have seen, manysolutions use both to get even better accuracy.
6.2.4 Better Solutions with Sensor Fusion?
As we saw in section 2.3 on page 22, sensor fusion—using more than one sensorsystem—could help improve a technology solution. Could we use a combination ofsolutions we have analysed to get a solution that would fulfill all our requirementsbetter than IRIS-LPS or Cordis RadioEye? Unfortunately, when it comes to theproximity systems none of them would be wise to combine, as the hardware and/orcost constraints are not overcome by having more of what causes the problem.The same is true for combining triangulation solutions. Combining a proximitysolution with a triangulation system or a scene analysis system is no good either,as this will add the problem of installing/reconfiguring andby this removing thispotential advantage with a proximity system. Thus, sensor fusion will not help in

6.3. RESULTS AND SUGGESTIONS 99
our case. The electronic museum guide application that our particular positioningsystem is going to support, have too many conflicting requirements.
6.3 Results and Suggestions
While none of the systems we have analysed fulfil all our requirements, there aretwo candidates that stick out. The best solution seems to be to use the IRIS-LPSsystem. The second best solution would be Cordis RadioEye with no RadioEyesin the smallest rooms. However, it is important to remember that while Cordis isa commercially available system, IRIS-LPS is a research project only. Thus, allhardware infrastructure and software have to made based on the prototypes fromthe project. This means that choosing Cordis is a much easierand safer solution,although more expensive.
We have seen that our electronic tour guide put many and conflicting requirementson the underlying positioning system. Although we reached aresult for our specificLBS here, it would be valuable to extract important learningfrom the process anduse this to provide a generic tool which can be used by others that are to choosea positioning system for supporting an indoor LBS. This willbe the focus of thenext section.
Because it is so hard to choose positioning system, the consequences of makinga bad choice should be minimised, and it should be easy to switch to or add newpositioning technologies as they become available. Thus, we will propose a flexiblearchitecture for LBCSs based on the service oriented architecture (SOA) concept,which can help realise this. This will be the focus of section6.3.2 on page 102.
6.3.1 Decision Flow Diagram for Choosing Positioning System
Our work has shown that a thorough investigation of the domain the positioningsystem is going to be a part of, is necessary. For example, we have seen that otherproperties than those in our requirements specification were crucial, especially thenumber of rooms and number of artefacts at the exhibition. The method we haveused to find a positioning system is summarised below:
1. Perform a domain analysis and a specific analysis of clientpremises
2. Decide functional requirements
3. Decide non-functional requirements
4. Prioritise the non-functional requirements
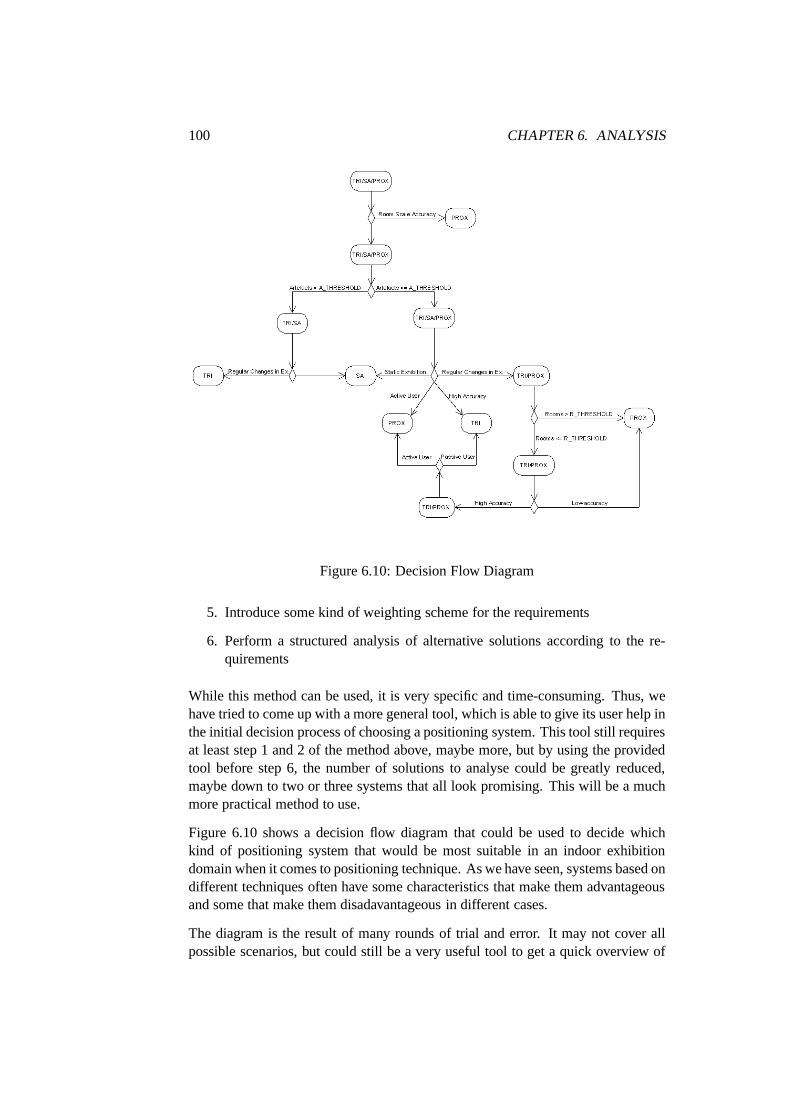
100 CHAPTER 6. ANALYSIS
Figure 6.10: Decision Flow Diagram
5. Introduce some kind of weighting scheme for the requirements
6. Perform a structured analysis of alternative solutions according to the re-quirements
While this method can be used, it is very specific and time-consuming. Thus, wehave tried to come up with a more general tool, which is able togive its user help inthe initial decision process of choosing a positioning system. This tool still requiresat least step 1 and 2 of the method above, maybe more, but by using the providedtool before step 6, the number of solutions to analyse could be greatly reduced,maybe down to two or three systems that all look promising. This will be a muchmore practical method to use.
Figure 6.10 shows a decision flow diagram that could be used todecide whichkind of positioning system that would be most suitable in an indoor exhibitiondomain when it comes to positioning technique. As we have seen, systems based ondifferent techniques often have some characteristics thatmake them advantageousand some that make them disadavantageous in different cases.
The diagram is the result of many rounds of trial and error. Itmay not cover allpossible scenarios, but could still be a very useful tool to get a quick overview of

6.3. RESULTS AND SUGGESTIONS 101
possible solutions and their advantages and drawbacks in given premises. It shouldbe noted that the diagram can be used in general, not only by tour guides that issimilar to the one we described in chapter 5. However, there are two requirementsthat should be present: The user should be provided with information about theartefact he is most likely to be interested in at any time, andthe user should beprovided with a map showing where he is.
At the beginning of the decision process we have three possible outcomes: a trilat-eration or triangulation based solution (TRI), a scene analysis based solution (SA),or a proximity based solution (PROX). The first question to ask is whether the LBSwill suffice with room scale accuracy or not. If it does, a proximity solution wouldbe the best choice, as it could do with very limited infrastructure.
If better accuracy is required, we have found that the most important issue to con-sider is wether there are “many” or “few” artefacts in the exhibition. As theseare subjective measures, we suggest to introduce an artefact threshold value calledA_THRESHOLD. This value has to be determined in each case, and is dependenton the combined hardware/software costs of an artefact sensor used in a proxim-ity solution with one sensor per artefact, and management and deployment timeof these, compared to available resources (for example manpower and budget). Aspecification of this value is suggested for future work. If the number of artefactsexceeds A_THRESHOLD, a proximity solution could be excluded as a candidatesolution.
To determine whether to use a TRI or a SA solution in a system with many artefacts,we could ask if the exhibition is static or if there are regular exhibit changes (withsubstantial changes so that reconfiguration is necessary).If the exhibit is mainlystatic, an SA solution is preferred as this will in general require less infrastructurethan a TRI solution. However, if there are frequent changes aTRI solution is a bet-ter choice. The initial set-up may be very time-consuming, but once in place it willwork regardless of changes in the exhibit. With an SA solution time-consumingreconfiguration is required with each exhibit.
If the number of artefacts is below the A_THRESHOLD value, weare still leftwith all three solutions. This is an easier case to solve. We then use the questionof static vs non-static exhibit changes again as we did above, to decide if SA is theright solution or should be eliminated.
As we can see in the figure, there are two questions that can be asked initially afterdecided that the system has few artefacts. If the system needs sub-metre accuracyand the user is passive, the only possible solution is TRI. Ifthe user can be active,PROX is preferred.
If we have a system with few artefacts and frequent exhibition changes, the numberof rooms could help decide whether to use TRI or PROX. Again, we could use athreshold value inferred from the actual case to decide the limit. The value depends

102 CHAPTER 6. ANALYSIS
on the deployment time and costs for the TRI solution. If the number of rooms ishigh (exceeds R_THRESHOLD), PROX is preferred. If the number of rooms isbelow R_THRESHOLD, the required accuracy level can decide whether to usePROX or TRI. If high accuracy is required, the requirement for an active user orthe lack of such a requirement finally settles whether to use PROX or TRI.
As with A_THRESHOLD, R_THRESHOLD, and maybe also a value forhigh vslow accuracy, should be discussed further and are suggestedfor future work. Someof the decisions here rely on a cost analysis, which is out of scope of this thesis.Our work has mainly been concerned with technological aspects with regards toLBCS requirements.
6.3.2 Applying Service Oriented Architectures (SOA) for Location BasedComputing Systems
Many traditional Location Based Computing Systems (LBCS) are completely pro-prietary. By this, we mean that their interfaces and interconnections between com-ponents of the systems are closed and not accessible by othersystems. The LBCSsmight have an internal layering and modularisation, but notone which can be ex-ploited easily by other systems. We suggest that future LBCSs adapt asystem wideService Oriented Architecture. This will be described in the following, after a briefintroduction to the SOA concept.
The SOA Concept
Service-orientationhas become a very popular concept in recent years, and is usedin a broad variety of applications. A definition of Service Oriented Architecture(SOA) is given in [68]:
Service oriented architecture (SOA) is a paradigm for organising andutilising distributed capabilities that may be under the control of dif-ferent ownership domains.
Entities like people, organisations, and applications create capabilities to solve orsupport problems and needs, and these can be used by other entities. A serviceinSOA is the mechanism which enables access to one or more capabilities. This isdone through a pre-describedservice interface, which includes specific protocols,commands and other means for supporting information exchange. For interactionto occur, services must be visible to each other, which meansthat entities must bemade aware that the service exists. This is often effected bydiscovery mechanisms.Interaction can then occur through exchange of messages, and the result is typicallya response to a request.

6.3. RESULTS AND SUGGESTIONS 103
Figure 6.11: The main technologies of XML Web Services, which can be used torealise a service oriented architecture.
XML Web Services technologies are commonly used to realise aSOA. This isa set of standards and protocols based on XML, which covers the requirementsof a SOA. The main technologies of XML Web Services are SOAP1, WSDL2, andUDDI3 (see figure 6.11). Communication between services can be performed usingSOAP, a simple XML based protocol to let applications exchange information overHTTP, or simply put, a protocol for accessing a Web Service. WSDL is an XMLbased language for describing Web Services and how to accessthem. UDDI is adirectory service where entities can register and search for Web services, and isused for service discovery purposes [69].
Architecture Proposal for Future LBCSs
Based on the three-layered model of an LBCS used throughout this thesis, includ-ing a positioning layer, location layer, and an application(LBSs) layer, a SOA forLBCSs is now introduced. The goal of this approach is to make it easy for differ-ent systems to interact and collaborate. For example, it would be advantageous ifthe lower layer positioning mechanism could be substitutedfor another one (seefigure 6.12 on the next page), without having to worry about the upper layers. Thiscould for example be due to LBS requirements changes. This way, a mobile devicewhich should be positioned could be provided with several means for positioning,and the appropriate technology could be chosen based on the requirements spec-ified by the application. Recent cellular phones can be positioned by either GPSor GSM, and the Location API (JSR-179) defined by the Java Community Processabstracts the details from the application developer by providing him with the sameinterface for using both positioning technologies. However, this architecture is stillrather static, as it is not possible to add other positioningtechnologies than thepredefined ones.
An LBCS can be built according to the SOA concept by mapping each of the lay-ers in our three-layered model into a service on their own, see figure 6.13 on thefollowing page. In addition to these services (representedby Sn in the figure),the SOA must also include a discovery-mechanism (represented byD in the fig-
1Previously Simple Object Access Protocol, but now only called SOAP2Web Services Description Language3Universal Description, Discovery and Integration
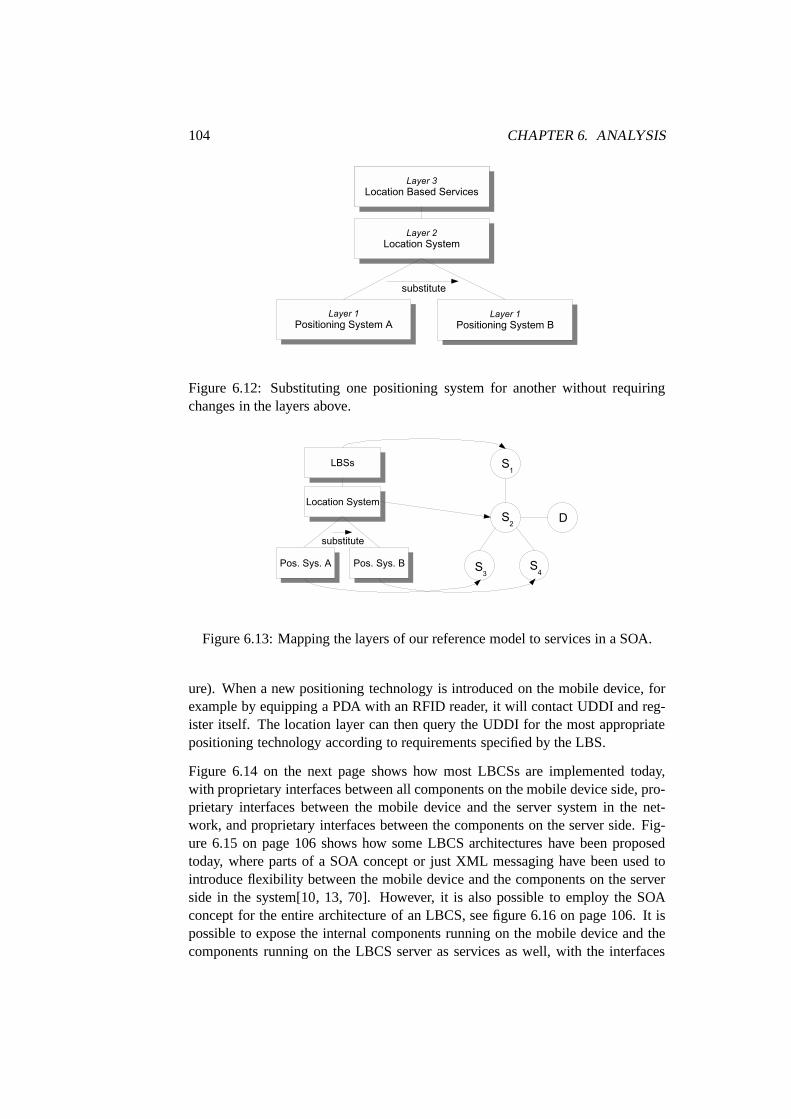
104 CHAPTER 6. ANALYSIS
Figure 6.12: Substituting one positioning system for another without requiringchanges in the layers above.
Figure 6.13: Mapping the layers of our reference model to services in a SOA.
ure). When a new positioning technology is introduced on themobile device, forexample by equipping a PDA with an RFID reader, it will contact UDDI and reg-ister itself. The location layer can then query the UDDI for the most appropriatepositioning technology according to requirements specified by the LBS.
Figure 6.14 on the next page shows how most LBCSs are implemented today,with proprietary interfaces between all components on the mobile device side, pro-prietary interfaces between the mobile device and the server system in the net-work, and proprietary interfaces between the components onthe server side. Fig-ure 6.15 on page 106 shows how some LBCS architectures have been proposedtoday, where parts of a SOA concept or just XML messaging havebeen used tointroduce flexibility between the mobile device and the components on the serverside in the system[10, 13, 70]. However, it is also possible to employ the SOAconcept for the entire architecture of an LBCS, see figure 6.16 on page 106. It ispossible to expose the internal components running on the mobile device and thecomponents running on the LBCS server as services as well, with the interfaces
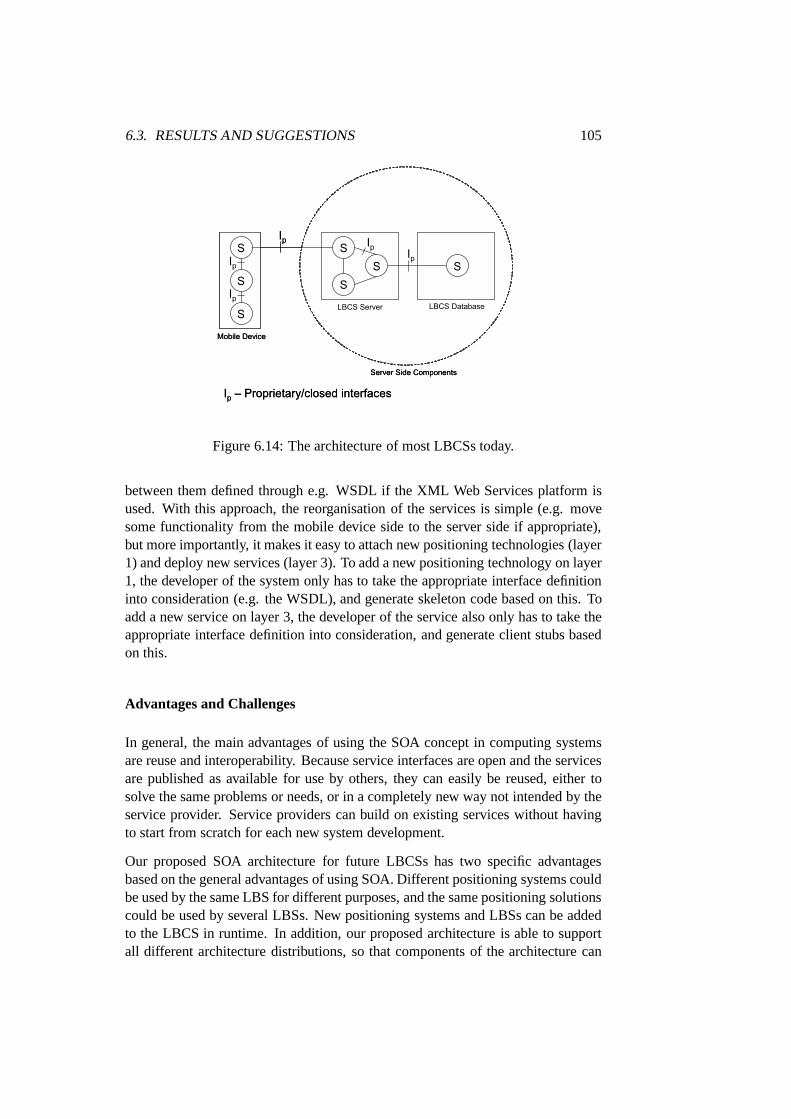
6.3. RESULTS AND SUGGESTIONS 105
Figure 6.14: The architecture of most LBCSs today.
between them defined through e.g. WSDL if the XML Web Servicesplatform isused. With this approach, the reorganisation of the services is simple (e.g. movesome functionality from the mobile device side to the serverside if appropriate),but more importantly, it makes it easy to attach new positioning technologies (layer1) and deploy new services (layer 3). To add a new positioningtechnology on layer1, the developer of the system only has to take the appropriate interface definitioninto consideration (e.g. the WSDL), and generate skeleton code based on this. Toadd a new service on layer 3, the developer of the service alsoonly has to take theappropriate interface definition into consideration, and generate client stubs basedon this.
Advantages and Challenges
In general, the main advantages of using the SOA concept in computing systemsare reuse and interoperability. Because service interfaces are open and the servicesare published as available for use by others, they can easilybe reused, either tosolve the same problems or needs, or in a completely new way not intended by theservice provider. Service providers can build on existing services without havingto start from scratch for each new system development.
Our proposed SOA architecture for future LBCSs has two specific advantagesbased on the general advantages of using SOA. Different positioning systems couldbe used by the same LBS for different purposes, and the same positioning solutionscould be used by several LBSs. New positioning systems and LBSs can be addedto the LBCS in runtime. In addition, our proposed architecture is able to supportall different architecture distributions, so that components of the architecture can
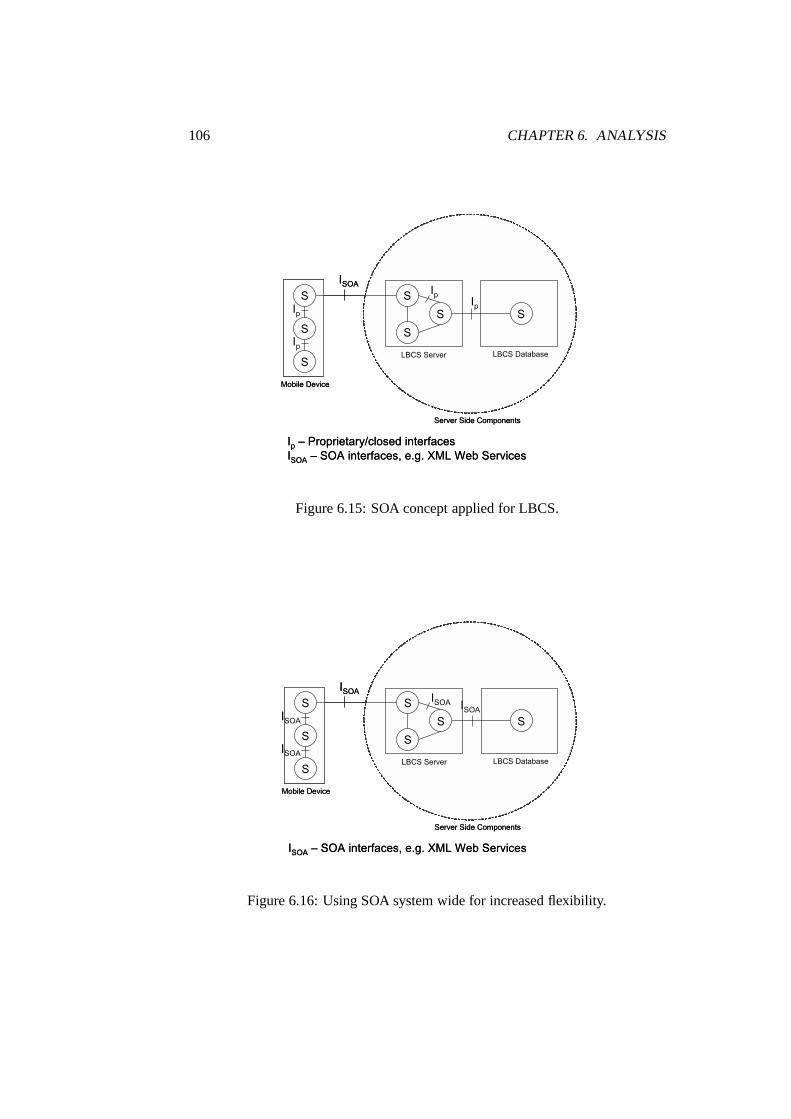
106 CHAPTER 6. ANALYSIS
Figure 6.15: SOA concept applied for LBCS.
Figure 6.16: Using SOA system wide for increased flexibility.

6.4. SUMMARY 107
be placed where it is most appropriate with regards to the specific LBCS. For ex-ample, in some LBCSs the layers from our reference model willbe implementedsolely on the mobile device, while in others some layer components will be im-plemented on the mobile device and some at the server side. Some systems mayeven have most components at the server side, and only a thin client on the mobiledevice.
The main challenge for our proposed system wide SOA to be successful, is that ageneral agreement is reached with regards to a common semantics or ontology forLBCSs, as standard XML Web Services do not consider the semantics of interfaces.
6.4 Summary
In this chapter we have applied all the knowledge gathered inthe previous chap-ters. First, we analysed a range of different location systems from chapter 4 againsta complex requirements specification made in chapter 5. We found that two solu-tions, called IRIS-LPS and Cordis RadioEye, seemed to be able to cover our needs.However, we realised that this specific result might not be very useful for others.Thus, we tried to extract some general knowledge from the work with the thesis,and turn it into a tool that more easily could be used by others. The result was adecision flow diagram which may help emphasising important characteristics withindoor positioning, and the choice of positioning solution. In addition, we alsoproposed a new architecture for future LBCSs, based on the concept of ServiceOriented Architectures (SOA), which will ensure increasedflexibility.

108 CHAPTER 6. ANALYSIS

Chapter 7
Conclusion
In this final chapter we will discuss how this thesis managed to answer the problemstatements given in section 1.1 on page 4. We will also summarise our contribu-tions, and discuss limitations of the thesis and future work.
7.1 Achievements and Results
This thesis is trying to find the answer to the question“What kind of positioningsystem would best fulfil the requirements of location based services used in in-door exhibitions?”The first answer found is that this is highly dependent on threethings:
1. The location based service that is to be supported by the positioning system.
2. The premises in which the system is to be implemented.
3. The exhibition(s) on display.
Thus, we suggest that thorough research and preparations are performed in theseareas before choosing a positioning system. Then, it would be valuable to make useof a framework which could take specific parameters describing your LBS, yourpremises and typical exhibitions as input, and give the bestsuitable positioning sys-tem as output. However, as there are so many different and conflicting parameters,this proved rather difficult. But, by going up one level, fromthe existing position-ing system implementations to a categorisation of positioning techniques, a usefuldecision flow diagram was made, which hopefully can guide future developers andowners in the decision process.
The second answer to the problem statement is that because there is substantialuncertainty about different positioning systems suitability as support for different
109

110 CHAPTER 7. CONCLUSION
LBSs, future LBCS should be built using a very flexible architecture that allows foreasy changes of positioning mechanisms. A selected positioning system might notwork as well as intended, or new positioning technology becomes available thatseems to be a better solution than the current. Thus, positioning solutions shouldbe developed according to a flexible LBCS architecture, which makes it easy tosubstitute one positioning mechanism with another one, without having to replacethe entire LBCS, for example middleware, databases and services.
Although not directly, we will claim that the general problem statement is success-fully answered. We can also see from the summarised list of contributions belowthat the specific problem statements were successfully answered.
• An overview of the field of positioning systems in general, and positioningtechniques and technologies in particular.
• A detailed description of the domain of indoor exhibitionsand location basedmobile electronic tour guides.
• An overview and an extensive analysis of existing positioning systems againstrequirements from a complex tour guide.
• A decision flow diagram which may help clarify consequencesof choosingdifferent positioning systems, and by this also help in thisselection process.
• Suggestion of a new flexible architecture for LBCSs based ona service ori-ented architecture (SOA) concept.
7.2 Critical review and Future Work
As there are so many different parameters to take into consideration when choos-ing positioning system in an LBCS, it is not likely that our general decision flowdiagram covers all different scenarios. Thus, it is important that this tool is notused as a rule for choosing type of positioning system, but ashelping guidelinesto get a quick initial overview over different positioning system possibilities andconsequences of using them. Future work with the idea of sucha decision flowdiagram could result in a more inclusive and powerful tool. It could be extendedto cover more parameters, be restructured in more effectiveways, and maybe alsobe used for both indoor and outdoor cases, regardless of domain. The thresholdvalues should be further examined.
With regards to the proposed system wide SOA architecture for future LBCSs, itshould be noted that this is very early work. A minimum set of methods a position-ing system should support must be developed, and standardisation issues discussed.Test implementation should be carried out, especially to see how well mobile de-vices can handle the overhead (network and processing) introduced by existing

7.2. CRITICAL REVIEW AND FUTURE WORK 111
technologies for SOA realisation. However, future mobile devices will have evenbetter processing capacity than today, so this should not bea problem in the nearfuture.

112 CHAPTER 7. CONCLUSION

Bibliography
[1] Anind K. Dey and Gregory D. Abowd. Towards a better understandingof context and context-awareness. Workshop on The What, Who, Where,When, and How of Context-Awareness, 2000 Conference on Human Fac-tors in Computing Systems (CHI 2000), apr 2000. Available online at:ftp://ftp.cc.gatech.edu/pub/gvu/tr/1999/99-22.pdf.
[2] Per Enge. Retooling the Global Positioning System.Scientific American,pages 90–97, May 2004.
[3] Veljo Otsason. Accurate indoor localization using wideGSM fingerprinting.Master’s thesis, University of Tartu, 2005.
[4] Roy Want, Andy Hopper, Veronica Falc ao, and Jonathan Gibbons.The Active Badge location system.ACM Trans. Inf. Syst., 10(1):91–102, 1992. Available online at: http://www-lce.eng.cam.ac.uk/ publica-tions/files/tr.92.1.pdf.
[5] Andy Ward, Alan Jones, and Andy Hopper. A new location techniquefor the active office. IEEE Personal Communications, 4(5):42–47, Oc-tober 1997. Available online at: http://www-lce.eng.cam.ac.uk/ publica-tions/files/tr.97.10.pdf.
[6] Nissanka B. Priyantha, Anit Chakraborty, and Hari Balakrishnan. The Cricketlocation-support system. InMobile Computing and Networking, pages 32–43, 2000. Available online at: http://nms.lcs.mit.edu/papers/ cricket.pdf.
[7] Paramvir Bahl and Venkata N. Padmanabhan. RADAR: An in-building RF-based user location and tracking system. InIEEE INFOCOM, pages 775–784,March 2000.
[8] Gregory D. Abowd, Christopher G. Atkeson, Jason Hong, Sue Long, RobKooper, and Mike Pinkerton. Cyberguide: A mobile context-aware tourguide.Baltzer/ACM Wireless Networks, 3:421–433, 1997.
113

114 BIBLIOGRAPHY
[9] Massimo Zancanaro, Oliviero Stock, and Ivana Alfaro. Using cinematic tech-niques in a multimedia museum guide. InMuseums and the Web 2003: Se-lected Papers. Archives & Museum Informatics, March 2003. Available on-line at: http://peach.itc.it/papers/maw2003.pdf.
[10] Taggedx. http://www.taggedx.dk. 06.04.2006.
[11] Jeffrey Hightower and Gaetano Borriello. Location systems for ubiquitouscomputing.IEEE Computer, 34(8):57–66, August 2001. Available online at:http://citeseer.ist.psu.edu/article/rey01location.html.
[12] Vasileios Zeimpekis, George M. Giaglis, and George Lekakos. A taxonomyof indoor and outdoor positioning techniques for mobile location services.SIGecom Exch., 3(4):19–27, 2003.
[13] Jeffrey Hightower, Dieter Fox, and Gaetano Borriello.The location stack.Technical report, University of Washington, Department ofComputer Sci-ence and Engineering, July 2003.
[14] Patrick Röder, Mario Hoffmann, and Matthias Ritscher. A dis-tributed framework for location sensing systems. http://www.patrick-roeder.de/projects/locserver.pdf.
[15] Mike Hazas, Christian Kray, Hans Gellersen, Henoc Agbota, Gerd Kortuem,and Albert Krohn. A relative positioning system for co-located mobile de-vices. 2005.
[16] Cliff Randell and Henk Muller. Digital hopscotch: Exploringthe relationship between positioning accuracy and location size.Sixth International Conference on Ubiquitous Computing - Work-shop: Playing with Sensors, September 2004. Available online at:http://www.cs.bris.ac.uk/Publications/Papers/2000432.pdf.
[17] Andrew Martin Robert Ward. Sensor-driven Computing. PhD the-sis, University of Cambridge, August 1998. Available online at:http://www.uk.research.att.com/bat/ sdc.pdf.
[18] Andrew Harrington. What’s the difference between accuracy and precision?Online: http://www.geoplace.com/gw/2000/1000/1000gps.asp.
[19] Paramvir Bahl, Venkata N. Padmanabhan, and Anand Balachandran. En-hancements to the RADAR user location and tracking system. TechnicalReport MSR-TR-2000-12, Microsoft Research, February 2000.
[20] Hari Balakrishnan, Roshan Baliga, Dorothy Curtis, Michel Goraczko,Allen Miu, Bodhi Priyantha, Adam Smith, Ken Steele, Seth Teller, andKevin Wang. Lessons from developing and deploying the cricket in-door location system. Available online at: http://nms.lcs.mit.edu/projects/cricket/V1Exp.pdf, November 2003.

BIBLIOGRAPHY 115
[21] Keith Cheverst, Nigel Davies, Keith Mitchell, and Adrian Friday. Therole of connectivity in supporting context-sensitive applications. InPro-ceedings of the 1st International Symposium on Handheld andUbiquitousComputing, pages 193–207. Springer-Verlag, 1999. Available online at:http://www.guide.lancs.ac.uk/ RoleOfConnectivity.pdf.
[22] B.Brown, I.McColl, M.Chalmers, A.Galani, C.Randell,and A.Steed. Lessonsfrom the lighthouse: Collaboration in a shared mixed reality system. InPro-ceedings of the CHI 2003 Conference on Human Factors in Computing Sys-tems, pages 577–584. ACM Press, April 2003.
[23] T. Starner, D. Kirsch, and S. Assefa. The locust swarm: An environmentally-powered, networkless location and messaging system. InProceedings of the 1st International Symposium on Wearable Computers, pages 169–170, October1997.
[24] Andy Harter and Andy Hopper. A distributed location system for the activeoffice. IEEE Network, 8(1), January 1994. Available online at: http://www-lce.eng.cam.ac.uk/ publications/files/tr.94.1.pdf.
[25] Shun yuan Yeh, Keng hao Chang, Chon in Wu, Hao hua Chu, andJane Yungjen Hsu. GETA sandals: a footstep location tracking system.Springer Per-sonal and Ubiquitous Computing Journal (PUC), special issue for Location-and Context-Awareness, February 2007.
[26] Dale DePriest. Getting a fix with your Garmin.http://www.gpsinformation.org/dale/gpsfix.htm.
[27] Jeffrey Hightower and Gaetano Borriello. Location sensing techniques. UWCSE 01-07-01, University of Washington, Computer Science and Engineer-ing, Seattle, WA, July 2001. Technical report, companion to[11].
[28] Jui-Hung Yeh, Jyh-Cheng Chen, and Chi-Chen Lee. WLAN standards.IEEEPotentials, 22(4):16–22, 2003.
[29] What is infrared and where is it used?http://irda.org/displaycommon.cfm?an=1&subarticlenbr=14.
[30] James J. Carter. Light wireless: Infrared as a practical alterna-tive to radio frequency communication systems. Available online:http://users.cafwap.net/s̃dcp/members/carter_wp.html. 12.05.2005.
[31] Brent A. Miller and Chatschik Bisdikian.Bluetooth Revealed: The Insider’sGuide to an Open Specification for Global Wireless Communications. Pren-tice Hall PTR, 2001.
[32] William C. Craig. Zigbee: Wireless control that simplyworks. Technicalreport, ZMD America, Inc. and ZigBee Alliance, 2004.

116 BIBLIOGRAPHY
[33] Jon Adams and Bob Heile. Busy as a ZigBee.IEEE SPECTRUM, October2006.
[34] What is ZigBee. http://www.palowireless.com/zigbee/whatis.asp.
[35] Robert J. Fontana. Recent developments in short pulse electromagnetics oruwb the old fashioned way. Presentation held for Microwave Theory andTechniques Society and Northern VA Communications Society, March 2004.Available online at: http://www.multispectral.com/pdf/IEEE030904.pdf.
[36] Robert J. Fontana. Recent system applications of short-pulse ultra-wideband(UWB) technology. IEEE Microwave Theory and Tech., 52(9), September2004.
[37] Inc. Multispectral Solutions. Uwb frequently asked questions.http://www.multispectral.com.
[38] Jim Geier. Ultra-wideband: Fast, short-rangewireless, January 2005. Available online at:http://www.mobilepipeline.com/specwatch/011205_specwatch.jhtml.
[39] Ketan Mandke, Haewoon Nam, Lasya Yerramneni, Christian Zuniga,and Ted Rappaport. The evolution of ultra wide band radio forwirelesspersonal area networks. Technical report, University of Texas at Austin,September 2003. Available online at: http://www.ece.utexas.edu/ wire-less/TP%2039,%20High%20Frequency%20Electronics,%20Sept%2003.pdf.
[40] Inc. RFID Journal. A guide to understanding rfid.http://www.rfidjournal.com/article/gettingstarted/. Source valid May25.
[41] Inc Symbol Technologies. Rfid and the mainstream supplychain -seven steps to rfid sanity. http://www.symbol.com/products/whitepapers/rfid_mainstream_sc.html. March 30, 2006.
[42] Sonitor Technologies AS. The ultrasound advantage.http://www.sonitor.com/technology/. Source valid May 26.
[43] Cliff Randell and Henk Muller. Low cost indoor positioning system. InProceedings of the 3rd international conference on Ubiquitous Comput-ing, pages 42–48. Springer-Verlag, September 2001. Availableonline at:http://www.cs.bris.ac.uk/Publications/ Papers/1000573.pdf.
[44] AT&T Laboratories Cambridge. The Active Badge system.Online:http://www.uk.research.att.com/ab.html.
[45] Mike Addlesee, Rupert Curwen, Steve Hodges, Joe Newman, Pete Steggles,Andy Ward, and Andy Hopper. Implementing a sentient computing system.IEEE Computer Magazine, 34(8):50–56, August 2001.

BIBLIOGRAPHY 117
[46] MIT Computer Science and Artificial Intelligence Lab.Cricket v2 User Manual, July 2004. Available online at:http://nms.lcs.mit.edu/projects/cricket/v2man.html.
[47] Crossbow Technology Inc. MCS Cricket Series (MCS410).http://www.xbow.com/Products/productsdetails.aspx?sid=116. Sourcevalid June 19.
[48] Norman Adams, Rich Gold, Bill N. Schilit, Michael Tso, and Roy Want. Aninfrared network for mobile computers. InProceedings USENIX Symposiumon Mobile & Location-independent Computing, pages 41–52, August 1993.
[49] Roy Want, Bill Schilit, Norman Adams, Rich Gold, Karin Petersen, John El-lis, David Goldberg, and Mark Weiser. The PARCTAB ubiquitous computingexperiment. Technical report, Xerox Palo Alto Research Center, mar 1995.Available online at: http://sandbox.parc.xerox.com/parctab/csl9501.ps.Z.
[50] Erwin Aitenbichler and Max Mühlhäuser. An ir local positioning system forsmart items and devices. InProceedings of the 23rd IEEE International Con-ference on Distributed Computing Systems Workshops (IWSAWC03), pages334–339. IEEE Computer Society, May 2003.
[51] http://www.ekahau.com/products/. Source valid June17.
[52] George Roussos. Location sensing technologies and applications. JISC Tech-watch Report TSW 02–08, School of Computer Science and Information Sys-tems, Birkbeck College, University of London, November 2002. Availableonline at: http://www.jisc.ac.uk/uploaded_documents/tsw_02-08.pdf.
[53] Odd R. Valmot. Radioøyet ser deg.Teknisk Ukeblad, (31):10–11, September2003.
[54] Radionor Communications AS. Cordis radioeye localisation technology.http://www.radionor.no/Downloads/radionor_white_paper.pdf. Source validJune 9.
[55] Silke Feldmann, Kyandoghere Kyamakya, Ana Zapater, and Zighuo Lue. Anindoor bluetooth-based positioning system: Concept, implementation and ex-perimental evaluation. InProceedings of the International Conference onWireless Networks, pages 109–113, June 2003.
[56] G. Anastasi, R. Bandelloni, M. Conti, F. Delmastro, E. Gregori, andG. Mainetto. Experimenting an indoor bluetooth-based positioning service.In ICDCSW ’03: Proceedings of the 23rd International Conference on Dis-tributed Computing Systems. IEEE Computer Society, 2003.
[57] Gunter Fischer, Burkhart Dietrich, and Frank Winkler.Bluetooth indoor lo-calization system. In1st Workshop on Positioning, Navigation and Commu-nication 2004 (WPNC’04), pages 147–156. Shaker Verlag, 2004.

118 BIBLIOGRAPHY
[58] Hiroyuki MORIKAWA Yasuhiro FUKUJU, Masateru MINAMI andTomonori AOYAMA. DOLPHIN: An autonomous indoor positioning systemin ubiquitous computing environment.IEEE ISORC, 2003. Available onlineat: http://www.mlab.t.u-tokyo.ac.jp/publications/2003/ fukuju-isorc03.pdf.
[59] Hiroyuki Morikawa Masateru Minami, Kazuki Hirasawa and TomonoriAoyama. Implementation and evaluation of a distributed ultrasonic posi-tioning system. InProceedings of First International Workshop on Net-worked Sensing Systems, pages 75–78, June 2004. Available online at:http://www.mlab.t.u-tokyo.ac.jp/ publications/2004/minami-inss-04.pdf.
[60] Esko O. Dijk, Kees van Berkel, Ronald M. Aarts, and EvertJ. van Loenen.Ultrasonic position estimation using a single base station. In European Sym-posium on Ambient Intelligence (EUSAI 2003), pages 143–148, November2003.
[61] Esko O. Dijk. Indoor Ultrasonic Position Estimation using a Single BaseStation. PhD thesis, Eindhoven University of Technology, September 2004.Available online at: http://alexandria.tue.nl/extra2/200412423.pdf.
[62] The home of mobile multimedia guides. http://www.lapavalley.com/.
[63] Franca Garzotto, Tullio Salmon Cinotti, and Massimiliano Pigozzi. De-signing multi-channel web frameworks for cultural tourismapplications:the MUSE case study. InMuseums and the Web 2003: SelectedPapers. Archives & Museum Informatics, 2003. Available online at:http://www.archimuse.com/mw2003/papers/ garzotto/garzotto.html.
[64] Tullio Salmon Cinotti, Giuseppe Raffa, Luca Roffia, Franca Garzotto,Rossana Muzii, Viviana Varlese, Maurizio Malavasi, and Stefania Galasso.Evaluating context-aware mobile applications in museums:Experiencesfrom the muse project. InMuseums and the Web 2004: SelectedPapers. Archives & Museum Informatics, 2004. Available online at:http://www.archimuse.com/mw2004/papers/ salmon/salmon.html.
[65] Tullio Salmon Cinotti, Raviprakash Nagaraj, GiuseppeMincolelli, GiuseppeRaffa, Luca Roffia, and Fabio Sforza. WHYRE: a context-awarewearablecomputer for museums and archaeological sites. InProceedings of the EighthInternational Symposium on Wearable Computers (ISWC’04), pages 174–175, November 2004. Available online at: http://csdl.computer.org/comp/proceedings/iswc/2004/2186/00/21860174.pdf.
[66] Sigurd Gimre and Hege Servold. Generic framework for development oflocation-aware applications. Master’s thesis, NorwegianUniversity of Sci-ence and Technology, 2004.
[67] Astrup Fearnley museum of modern art. http://www.afmuseet.no/, December2005.

BIBLIOGRAPHY 119
[68] The OASIS consortium.Reference model for Service Oriented Architecture1.0, August 2006.
[69] Web building tutorials. http://www.w3schools.com/.
[70] Ulf Rerrer. Location-aware web service architecture using wlan positioning.OTM Workshops, 2005.