i i(iiit'll - defense technical information center measured upon venous blood, blood gases and...
TRANSCRIPT

I AD-A239 247 C
I .Final Report
I "Definition of Oxygen Tolerance in Man"(Predictive Studies V)I
I Contract N00014-81-C-0826
Naval Medical Research and Development Command
and
Office of Naval ResearchI
7-------.- .
31 December 1987
IC.J. Lambertsen, M.D.
Principal Investigator
Institute For Environmental Medicine
University of Pennsylvania Medical Center
Philadelphia, PA 19104-6068II 91-06215
/IIII /i I(IiIt'll t l ih i /ll ' l; 9

I* CONTENTS
This Abstract Report is comprised of Four Component Summary reports froma comprehensive investigation of effects and time courses of oxygen poisoningin human organ systems, during a collaborative research program ofuninterrupted breathing of 100 percent oxygen at 3.0, 2.5, 2.0 and 1.5 ATA.Completion of the extensive data correlations will extend beyond the date ofContract "Final Report". The present component reports include
* Pag-es
1. Definition of Tolerance to Continuous Hyperoxia in Man: 3-21An Abstract Report of Predictive Studies V.
C.J. Lambertsen, J.M. Clark, R. Gelfand, J.B. Pisarello,W.H. Cobbs, J.E. Bevilacqua, D.M. Schwartz, D.J. Montabana,C.S. Leach, P.C. Johnson, and D.E. Fletcher.
2. Pulmonary Tolerance in Man to Continuous Oxygen Exposure at 22-343.0, 2.5, 2.0, and 1.5 ATA in Predictive Studies V.J.M. Clark, R. Gelfand, N.D. Flores, C.J. Lambertsen, andJ.B. Pisarello.
3. Effects on Respiratory Homeostasis of Prolonged, Continuous 35-45Hyperoxia at 1.5 to 3.0 ATA in Man in Predictive Studies V.R. Gelfand, J.M. Clark, C.J. Lambertsen, and J.B. Pisarello.
4. Human Circulatory Responses to Prolonged Hyperbaric Hyperoxia 46-55in Predictive Studies V.J.B. Pisarello, J.M. Clark, C.J. Lambertsen, and R. Gelfand.
Index of Publications (1940-1984)
I
IAcknowledgement
By interagency agreement, this collaborative Program was supported inpart by NMRDC Contract N00014-81-C-0826, NASA contract NAS9-17238, and theState of Pennsylvania through the Benjamin Franklin Partnership.
Individual Summary Reports are reproduced from Proceedings of the NinthInternational Symposium on Underwater and Hyperbaric Physiology.
II

I
DEFINITION OF OXYGEN TOLERANCE IN MAN
(PREDICTIVE STUDIES V)
m INSTITUTE FOR ENVIRONMENTAL MEDICINEUNIVERSITY OF PENNSYLVANIA
mSUMMARY
This Program is critical to all present efforts to improveusefulness of oxygenation in medicine and to advance in diving andaerospace activity. Oxygen combines useful effects critical toprevention and relief of hypoxia, with serious toxic effects whichlimit oxygen use in diving, decompression and therapy ofdecompression accidents. It also recognized that opportunity nowexists, through research, to improve the tolerance to oxygen atnormal and higher ambient pressures, with potentially largeapplication to manned undersea and aerospace operations, totherapy and to prevention of residual effects of oxygen poisoning.
I The scope of the Program is based upon more than thirty yearsof leadership in oxygen tolerance investigation by the staff ofthe Institute For Environmental Medicine. Such studies have ledto the requirement to search beyond the pulmonary toxicity andcentral nervous system convulsions long recognized as prominentconsequences of oxygen poisoning.
I Goals of the extensive Predictive Studies V research programare to define inherent oxygen tolerance in normal man underconditions that are relevant to therapeutic and aerospaceoperations. Specific aims of this program have includedinvestigation of the rates of development of oxygen poisoning ofcritical organ functions at 02 pressures of 1.0, 1.5, 2.0, 2.5,and 3.0 ATA (the high levels of oxygen pressures encountered inmedicine including hyperoxic therapy, in undersea activity and intherapy of diving and altitude decompression sickness).
I Concurrent measurements of oxygen effects are made on a broadrange of vital organ systems and functions. For measurement ofchanges in sensory and brain function, monitoring ofelectroencephalographic activity and intermittent evoked corticalelectrical response are accompanied by repeated measurements ofperceptual, cognitive, and psychomotor function. Visual functionsare monitored by repeated measurements of visual acuity, visualfields, color vision, dark adaptation, and 2-flash discriminationthresholds, with electroretinography in selected conditions.Auditory function is measured by pure tone air conductionaudiometric determinations of hearing thresholds. Vestibularreactivity is intermittently tested by thermal stimulation.Changes in blood electrolyte, hormonal and cellular compositionare measured upon venous blood, blood gases and pH upon arterialblood. Observations of neurologic oxygen tolerance are correlatedwith rate of development of pulmonary toxicity, throughmeasurements of the vital capacity and maximal flow rates duringinspiration and expiration and other selected indices of pulmonaryfunction.

II
The range of inspired oxygen pressure of 1.0, 1.5, 2.0, 2.5,and 3.0 ATA was selected for continuous exposure because pulmonaryoxygen intoxication occurs at 1.0, 1.5, and 2.0 ATA in the absenceof obvious neurologic effects of oxygen toxicity, while definiteneurologic symptoms precede the development of prominent pulmonaryeffects at 3.0 ATA, and because the actual rates of occurrence andrecovery of mental or sensory decrement were unknown at any ofthese pressures. In addition, the measurements provide necessaryguidelines for the design of the following Predictive Study VIaimed at (a) optimizing the effectiveness of programmedintermittency of hyperoxic exposure as the most rational methodfor increasing tolerance to oxygen over a wide range of usefuloxygen pressures, and (b) combined use of synthetic bloodsubstitutes and hyperoxygenation to improve oxygen deliverywithout limitations of oxygen toxicity.
III
LA
I STATEMENT A PER TELECONBETH HARRIS NAVAL MEDICALRESEARCH & DEVELOPMENT COMMANDCC IE 04AI BETHESDA, MD 20814-5044
(2)

II
9th hIternazional Symposium on Underwater and Hyperbaric PhysiologyUndersea and Hyperbaric Medical Society, Bethesda. MD. 1987
II
I DEFINITION OF TOLERANCE TO CONTINUOUS HYPEROXIA IN MAN:AN ABSTRACT REPORT OF PREDICTIVE STUDIES V
C. 1. Lambertsen. J. M. Clark, R. Gel/and. J. B. Pisarello. IV. H. Cobbs. J. E.Bevilacqua. D. ,f. Schwartz. D. J. Montabana, C. S. Leach, P. C. Johnson, andD. E. Fletcher
This abstract report has a dual purpose. One purpose is to provide theoverall goals, design, and procedures of Predictive Studies V. The subordinatepurpose is to describe specific elements of neural effects produced byprolonged hyperoxia. Summary observations on other functions are consideredin related papers in this proceedings and elsewhere (1-5).
Predictive Studies V is a multiyear, collaborative investigation of oxygenpoisoning in normal men, during uninterrupted exposures to oxygen over therange of hyperbaric oxygen exposure most useful in diving, treatment of gaslesion diseases, and general hyperbaric medicine.
The investigation followed approximately 20 yr of prior investigations ofoxygen effects in animals and human subjects, during which necessary concepts
II of design selection of critical target functions, methods, and safety proceduresaccumulated to a degree that justified the extensive searches into unknown,essentially unexpiored aspects of human oxygen toxicity.
The investigation was designed to determine rates of development andrecovery for oxygen-induced effects on multiple selected organ, tissue, or cellfunctions. It was expected that the nature of specific toxic effects, rates ofdevelopment, and rates of recovery would differ at different pressures ofhyperoxic exposure. Therefore the systematic overall studies were carried outto include exposure to several different pressures of inspired 02. The pressuresselected for 100% breathing selected were 3.0, 2.5, 2.0, and 1.5 ATA. At eachpressure a duration of exposure greater than previously systematically inves-tigated was selected. The design thus provided the basis for definition ofoxygen "dose-response" in terms of pressure, duration, and effect. It provided
I(
I!3

1
C. J. Lambertsen et al.
for the analytic derivation of oxygen tolerance tables for multiple criticalorgan functions over the probable range of usefulness for continuous oxygenexposure.
In this fundamental design, the resting condition and continuous oxygenexposure were chosen to allow determinations of maximuni tolerance of tissueor organ functions at each level of inspired oxygen pressure. The results wouldthereby provide the necessary (and presently unavailable) baselines forimportant medical uses of oxygen in general hyperbaric oxygen therapy, and inhyperoxic treatment of gas lesion diseases in undersea and aerospace activity.The results would also provide the essential baselines for subsequent investi-gations in man of adverse or advantageous modifying factors relating to rateof development of oxygen poisoning or its effects (e.g., interrupted oxygenexposures, work, drug administration, carbon dioxide inhalation or retention,narcosis, respiratory gas density).
In the investigation emphasis was given not only to pulmonary oxygenpoisoning, but to functions for which information concerning rates of devel-opment and recovery have been essentially unexplored in man at toxic oxygenpressures greater than I atm (e.g., neurologic, respiratory, cardiovascular,endocrine, renal).
BackgroundThis program had its origins in the awareness that, in most uses of
oxygen for therapy, the essential life element oxygen combincs desirableeffects critical to relief of hypoxia in some tissues, with potentially lethaltoxic effects of hyperoxia in other tissues. In the absence of adequateinformation concerning human oxygen tolerance, fear of oxygen poisoning has
for many years limited the therapeutic and operational use of hyperoxia to itsfull potential. This information concerning actual tolerance is needed to replacethe arbitrary and nonoptimal patterns of diver and patient oxygen exposureemployed over the past several decades. The required detailed definition oftoxic effect and recovery encompasses organ systems and functions beyond theoccurrence of pulmonary "irritation" and the occurrence of a convulsion.
At the onset of the Predictive Studies V program, the status of detailedinformation concerning development and recovery in human organ oxygenpoisoning is grossly indicated by Fig. 1. Such studies of human pulmonaryoxygen poisoning had not been accomplished at oxygen pressures greater than2.0 atm or even between 1.0 and 2.0 atm.
Except for symptomatic, brain circulatory, and EEG observations (6-10)no systematic investigation of human CNS oxygen tolerance had been accom-plished at pressures greater than I ATA. While physiologic effects of oxygenhave been investigated to pressures as high as 4.0 ATA (10-14), systematicdeterminations of onset and recovery of toxic effects of oxygen on cardio-vascular and other critical organ functions had not been made at pressures
greater than 2.0 ATA.
III(4,)

II
ITolerance to Continuous HyperoxiaI
A. PU 4NA.Y 3. CENT AL NERVOUS SYSTEMI x~o~/R/ / Eoi. oZoz .ToI.uoc).Rc
*. 1.0
C. OT4!R flJI-T!O!IS
*2. *C?:EOFCNORAN
2. /
T1:E (HRS(
Fig'. 1. Statua of information concerning human tolerance to continluoul hyperoxia.
I Against the background of prior investigations, it was recognized that noI organ or system (e.g., the brain, the eye, the heart, or even the lung) has a
single function, single oxygen dose, or single oxygen tolerance in any hyper-I oxic exposure (6) (Fig. 2). It was therefore a goal of the program to measureI not only effects on multiple organ systems, but discrete effects within thesystem being investigated.
"- I Moreover, it was considered philosophicaiiy that development of cyto-chemical oxygen poisoning began from the moment of exposure to hyperoxia,and progressed at a rate related to the absolute pressure of oxygen at the
discrete sitem ofg the olruarn phoce inohed Fution everessong)hs of
these myriad loci of oxygen poisoning in any tissue or organ system could beI expected to develop at different rates, and in much of the mass of body tissue
the progressive poisoning will not become physiologically obvious and must besought by selective chemical searching.
I Because any observed effects of oxygen poisoning must be recognized asconsequences of a pathologic process, it was considered that measurements ofrates of recovery had even greater significance than the operationally impor-
I ~ tant measures of rates of developnment of adverse effects.n pFor these several reasons cited, the overall Predictive Study of HumanOxygen Tolerance combined measurements of rates of development and recov-hery of measurable physiologic changes, with measurement of corresponding
chemical changes reflected in blood.
IIIII (5)

C. J. Larnbertsen et al.
KIDNEY
SKI
E-~1000- 10
a.S
to BRAI 100
IARTERY TISSUE CAPILLARY VEIN
Fig. 2. Fail in P0 2 across the capillary bed In various tissues dl-ring oxygen breathing at 3.5ATA. From Lambertsen (6).
I (6)

ITolerance to Continuous Hyperoxa
Goal of Program DesignIn our previous investigations aimed at defining human pulmonary
tolerance to hyperoxia, a system of pulmonary oxygen tolerance curves wasderived (6, 15, 16) (Fig. 3). For these, based on decrements in vital capacity,measurements obtained in studies by several investigators at oxygen pressuresof 2.0, 1.0, 0.8, 0.7, and 0.5 ATA were combines (15, 16). This subsequentlyallowed predictive estimation of cumulative pulmonary toxic dose (CPTD) foroxygen, in terms of a unit pulmonary toxic dose (UPTD) defined as thatproducing the toxic effect of 100% 0, for I min at I ATA (17, 18).
An applied goal of Predictive Studies V has been to obtain the measure-ments necessary to improve on these previously derived pulmonary oxygentolerance curves, and to generate the information required for equivalentoxygen tolerance tables for other critical organ or tissue functions, includingbrain, sensory, neural, muscle, cardiac, blood, and endocrine.
4.0
~4. Oecrement in Lung Vital Capacity
733.0- 35 Hrs.
2.0 ....... 12 Hrs.
1.5 . ... . .......................
0 ~ ~ ~ ~ .. .. ....I, t I. . .]
o.o Pr.minen. To.i.i.
I Duration of Oxygen Greathing (hours)Fg. 3. Progression of pulmonary oxmygen toxiy during continuous exposure to hyperx..
Shaded ares represents levels of inspired P0 2 at which Investigations had been carried out before
Predictive Studies V. Black dots indicate pressure/durations for oxygen exposures in present
program. Modified from Larnbertsen (6).
PROCEDURES AND METHODS
I Oxygen exposure pressure and duration limits planned, and approved bythe formal university procedures for research involving human beings, are asoutlined in Table I.
I
I (7)

I
U C. J. Lambertsen et al.
I Young men were selected as subjects from volunteers, following thesuccessful completion of detailed clinical medical examinations includingspecial examinations of the systems under study (e.g., auditory/vestibular,neurologic, ophthalmologic, cardiac, pulmonary, hematologic). Numbers ofsubjects to be used at each pressure were determined by needs and practicalityof statistical evaluation, as a particular toxic effect was encountered.
I Table IPlanned Pressures and Duration& of Hyperoxic Exposures
Ambient Pressure, ATA P0 2 , ATA Duration, h
1.0 0.21 24
1.5 1.5 182.0 2.0 122.5 2.5 63.0 3.0 3.5
To accomplish the fundamental and applied goals cited required repeatedmeasurements of multiple functions (Table 2) before, during, and after expo-sures of the normal subjects to each of the several different increased oxygenpressures (Fig. 4). It is clearly not possible or necessary to measure each ofthese functions continuously over the entire period of an oxygen exposure.Modules of measurement performance were therefore used, as in previousPredictive Studies (19, 20) (Fig. 5). These were repeated before, at plannedtimes during, and after the oxygen exposures. At the highest oxygen pressure(3.0 ATA), measurements were repeated at short intervals. At the lowerdegrees of hyperoxia, intervals between measurement modules could be longer(Fig. 4).
The study was begun with investigations at 3.0 ATA to assure detectionof any neurologic or other effects not encountered or searched for in priorstudies at 2.0 or 1.0 ATA. This emphasis provided guidance in final design andsafety for the exposures at lower pressures. On the same basis the study atthe intermediate pressure of 2.5 ATA was then performed last, to assureawareness and preparation for investigations of potential interactions of neural,pulmonary, cardiovascular, and other effects.
Details of subject instrumentation, measurement, and analysis will beprovided in the full documentation of major study components. The methodsemployed will be cited below in describing specific observations.
U SUMMARY OF OBSERVATIONS
Throughout the study the most striking observations related to effects onvisual function, on the lung, and probable interactions of preconvulsive neural
I
I (8)

Tolerance to Continuous Hyperoxia
Table 2
Measurements During Continuous Oxygen Exposure in Man
Electroencephalography
clinical interpretation
spectral analysis
re.ponse to photic stimulation
Visual function
visual evoked cortical responsealectroratinography (dark and light adapted)
fields (rodenstock perimeter)
pupillary reaction
actcommodation
color vision
Auditory-vestibular function
audiometry (air conduction)
brainstem auditory evoked response
high frequency audiography
eye tracking, nystagmography
Icaloric stimulation
Muscle power (skeletal, respiratory)
I Performance (perceptual, cognitive, and psychomoter)
Pulmonary function
flow-volume loopsspirometry
density dependent flow rates
closing volumes
peak inspiratory and expiratory pressures
airway resistance and conductance
frequency dependence of compliance
carbon monoxide diffusing capacity
arterial blood gaes and acidity (Pc02 , P0 2 , pli)
3Cellular and chemical composition of bronchoalveolar lavage fluid
Respiration-respirator", &&s exchange
Temperature
I
~(9)

II
C. 3. Lambertsen et al.ITable 2 Cont.
Cardiovascular function
electrocardiographycardiac output, rate, stroke volumemean thoracic impedanceblood pressure, systemic vascular resistanceorthostat'c reflex responses
Liver blood flow and function
Renal function
IEndocrine activity, via plasma hormone levelsinsulin
cortisol
aldosterone
vasopressin
growth hormonebeta-endorphin
adrencocorticotropic hormonethyroid stimulating hormone
Hematologic effects
S- ----- - ------------------ --
02I - - - - 4 I ------
2 4 6 a O 10 2 16 24H"OJF OXYGEN EXPOSURI£
Fig. 4. Plan for continuous oxygen exposures in man.
I I

II
Tolerance to Continuous HyperoxiaI:3 is 3S0 * Is $ s ' a to i .les 112 170 13 I'm ISO
II " Ip KV I I P I
IS TvC L i li.C V S LVO A oYKCS
- I'UL CAI? '
'* T .* (CCV0£T5
VI PLCV PIM CC= ~PC , cc,: T ,. €OcMtTIVC. rITCOGqc-TOROILATC RICK? tT'. IPSC I CWTXCT L ENS. FATC
* ASZI AL SLOOD CXStS
- LI S FITVCA C Pte rmc?1Ii
S LCT2OC cPnL*Cx
PV-V%.A.T VCwl"TIlC.S CIw- C.C_
*[€ L. T Pt )4 I tcn rltoUtSICT -UOICM9TIP'F
It?* Tt I54* CL 7,RC-Iak
*5V l. ln V CV IL,IACa I u, A ICS ISASIZNT P IP O s ~t
I , I tt~I [ t I.A.: .5o,-=T,. .
m 31 I I I II I 'a a It 265 31 111 I 15 I s*
Fi;. S. Predictiye Studi-- V measurement module for 2.0 ATA and 1.S ATA studies.
activity with effects on cardiovascular and respiratory-pulmonary functions.Table 3 indicates in simple form the presence or absence of an oxygen-
related effect for major components of the overall study. Relations of theseeffects are summarized below. Details of specific observations and circum-stances will be provided elsewhere.
Mental and Psychomotor FunctionConsciousness was maintained throughout each oxygen exposure, even up
to the moment of occurrence of a convulsion at 3.0 ATA in 1 subject. Theselected measures of mental and psychomotor function (short-term memory,visual reaction time, finger dexterity, and general reasoning, all administeredby the IFEM Performance Measurement System) have been remarkably stable ateach of the oxygen pressures investigated. While no significant decrementsoccurred, comparisons of mental and psychomotor performance during oxygenexposure at 3.0 ATA and air at 1.0 ATA indicate that small "learning trends"in air exposure may have been masked during this highest oxygen exposure.
Convulsion and Associated MeasurementsOnly I convulsion has occurred during the entire sequence of the
Predictive Study V exposures. This followed 3.0 h of oxygen breathing at 3.0ATA.
II
i (11)

I
C. 1. Lambertsen etal.
I Table 3Summary of Specific Toxic Effects Observed
0 2 ATA
Function 1.S 2.0 2.5 3.0
Brain cortical
Convulsion a 0 0
Perception, cognition, psychomotor o o a a
Pre-convulsive cortical electrical activity (EEG) 0 a a a
Somatosensory evoked potential a
Thermal a ? 7
Respiratory 0 ? ?
Neuromuscular powerHAnd grip a a a a
Inspiratory a 0 a a
Expiratory a a a a
Cardiovascular ? a
Pulmonary
Hearing/vestibular
Hearing thresholds o o a
Auditory brainstem potentials a o o a
Vestibular response a a o o
Visual
Central vision acuity a 0 a a
Peripheral vision a 0 0
Retinal electrical response (ERG) a *
Pattern evoked cortical potential a 0 0 o
Color vision a a a a
Accommodation 0 •
Pupil size, reactivity o a e
Hepatic
Renal
Endocrine * *
Blood *
Key: a = Measured, no change; e Change observed; = Measured, not reported here; ?Change observed. May be physiologic or mixed effect.
Ii (12)

Tolerance to Continuous Myperoxia
Normal mental and psychomnotor performance measurements were ob-tained 30 min before the convulsion. An observation of large significance was anormal subject-investigator cooperative performance of audiometric measure-I ment at 3.0 ATA of oxygen, during the 4-mmn period before the occurrence ofconvulsion. This confirms the equivalent observation in open-sea divingthat capability for intelligent performance is retained up to the moment ofI abrupt electrical disorganization that initiates the convulsion (2]).
Respiratory and thermal changes associated with the single convulsion,during oxygen exposure at 3.0 ATA, are shown in Figs. 6 and 7. Respira-tory comnponents and end-tidal gases were monitored because each is related tothe neural or neurochemnical control of respiration, which were thereforeconsidered in the program design as potential targets of neurologic oxygenpoisoning, rather than having primary relation to direct pulmonary oxygenI poisoning. The findings represent the first such tracking of preconvulsiverespiratory events, and complement equivalent preconvulsive measurements ofbrain circulation and metabolism (10).
3AIA OXYGEN coY-US . IAtA AI
I.I
_J~ S-ne S.b,.CI-< -_9 S III.... . ....
Z ......... . . . . . . . ..... .............
..........................................................
U~~~~~~~~ .. . . . . . ................
-g 40-1 .....
00- I IRESPIRATORY
0 800- I.. .......... ............ . ......
9 0 '9'S tIC"I I ....................
0 30 60 90 20 150 18 200 240 270 _',CELAPSED TIME trtom start of oxygen breathing at 3ATA *minutes)
Fig. a. Efrecta on ventilation Of 02 breathing at 3 ATA for 3.5 h. Comparison of 1 subject whoI convulsed with group of 12 subjects.
(13)

I
I C. J. Lambertsen et al.
A progressive decrease in respiratory frequency occurred before theconvulsion. An associated rise in end-tidal Pcoz, in spite of increased tidalvolume, indicated a decrease in alveolar ventilation. The special significance ofthe rise in alveolar Pco, is the inevitable effect of hypercapnia on brainblood vessels, with a cerebral vasodilatation, increased blood (oxygen) flow,and consequent exposure of brain tissue to further increase in oxygen partialpressure. A vicious cycle of accelerated progression of brain oxygen poisoningshould result (6, 10, I1).
The fall in deep body temperature before convulsion resembles thatobserved in toxic oxygen exposures of small animals (22). The rise followingthe oxygen convulsion reflects the vigorous physical tonic and clonic "exercise"of the generalized convulsion (21).
2ATA - OXYGEN C:NZ USON IATA - Ail
'7 I , .. L _' .,- --I
360 owus5, ne
(N- 2 ICCufn conv c Clsiosio
3605
._
CIEL P EDTME(rm trtoDove b a thi n efau rise -minle
Fig. 7. Eetsoboytrprtu o0 2 breathing[ a; S ATA for 3.5 h. Comparison ot" 1subject who onvuled with oof m ubjects.
Recovery of consciousness was characteristic of previous experience in~oxygen convulsions (21), with a time course equivalent to that in recovery
from an episode of grand real epilepsy. Monitoring of EEG, EGG, impedancecardiograph, and temperature were continuous during and following theconvulsion. Other postoxygen exposure measurements were begun 1 h after theSonset of the convulsion.
II
I(14)

I!
ITolerance to Continuous Hyperoxia
l Brain Cortical Electrical Activity (ECG-EEG)Change in brain cortical electrical activity (measured from 12 scalp
electrodes placed according to International 10-20 System) was not evident incontinuous clinical recordings during oxygen exposure at rest, even at 3.0 ATAfor 3.5 h. Definite EEG changes were found at 3.0 ATA in only 2 subjects.One, cited above, had classical EEG manifestations of the seizure at 3.0 h ofexposure, and postictal phases of a typical oxygen convulsion. No preconvulsiveEEG changes were observed. The other subject h;.' an approximately 10-sinterval of flat EEG in association with a 20-s perid of hypotensive loss ofconsciousness due to an episode of extreme bradycardia immediately after a 2.5h exposure. Return to consciousness was accompanied by a mild clonic seizureand a 30-s interval of disorganized EEG activity, followed by resumption ofnormal EEG activity.
No clinically evident EEG changes were observed in any subjects during 5to 6-h exposures at 2.5 ATA, 8 to 12-h exposures at 2.0 ATA, and 16 to 19-hexposures at 1.5 ATA. Detailed energy spectral analyses of the taped EEGrecords obtained at 3.0, 2.5, 2.0, and 1.5 ATA are not complete at this stage.
Somatosensory Evoked Cortical ResponseNo evident changes in somatosensory cortical evoked response (stimulus tomedian.nerve at wrist) were observed in any subject at 3.0 ATA oxygen
exposure. The measurement was not utilized at the lower exposure pressures.
Tempera(ure RegulationDeep body temperature (rectal) was continuously monitored, along with
repeated measurements of carbon dioxide production, in search for toxic neuralor metabolic disruptions of temperature regulation. Following an onset lag afterstart of hyperoxia, progressive hypothermia was found at 3.0 ATA in the singlesubject who experienced an oxygen convulsion (Fig. 7), in most subjects at 2.5and 2.0 ATA, but in none of the subjects at 1.5 ATA.
Respiration and Respiratory ReactivityDetails of ventilatory changes in prolonged oxygen exposures are des-
cribed in this symposium (3). This investigation of respiratory control wasemphasized for its vital importance as a neurologic control system, the normalfunctions and reactivity of which could be quantitatively examined for evidenceof toxic disruptions.
Previously described physiologic increases in ventilation, with associateddecreases in end-tidal Pco 2 (6), were observed in all hyperbaric exposureconditions of this study. No clear indication of diminished effectiveness ofrespiratory control function occurred except in the subject who experienced aconvulsion at the 3.0 ATA oxygen pressure. An important finding related tosafety in hyperoxic exposures was that respiratory reactivity, either to carbondioxide or to hypoxic stimuli, was not diminished in spite of observation ofreduced carotid chemoreceptor response in cats following extreme oxygen
I
I(15)

C. J. Lambertsen et al.Ipoisoning at I ATA (23).
Cardiobascular-Neurologic InteractionsRecognizing the dual central neurologic control cf cardiac activity (vagal,
sympathetic) and the importance of baroreceptor reflex regulation of bloodpressure, cardiac electric activity (ECG) was monitored continuously, withperiodic measurement of orthostatic reflex function. Effects on cardiovascularfunction were observed at all oxygen pressures investigated (4). These rangedfrom the previously documented bradycardia (8, 12), to a single episode ofexaggerated bradycardia resulting in loss of consciousness and a grossdiminution of the normal tachyardial response to standing. Details of each ofthese observations are provided in a companion report in this proceedings (4).Their special significance is the indication of oxygen-induced neurologic(presumably vagal) influence on cardiac rate function, with the additionalpossibility of oxygen effect on intrinsic cardiac electrical functions.
3 Pulmonary FunctionsThe extensive previous studies of pulmonary oxygen poisoning at 0.5 to
2.0 ATA (12, 24) were successfully expanded to include oxygen exposures at1.5, 2.0, 2.5, and 3.0 ATA. Descriptions of measurements provided in thisproceedings (2) reveal differences in rates of onset and rates of recovery atthe several different levels of hyperoxic exposure, and contribute the firstempirical data establishing pulmonary oxygen tolerance guidelines at oxygenpressures greater than 2.0 atm. Special significance in this component of thePredictive Study is given to the observations during oxygen exposure at 2.5ATA of an abrupt and large decrease in vital capacity, superimposed on theprogressive decrement characteristic of that induced by lower oxygen pressures.This abrupt respiratory handicap, as for the above-mentioned exaggeratedbradycardia, requires consideration and investigation of a possible neurologicinfluence on lung structures directly poisoned by oxygen.
Neuromuscular PowerPotential neural or neuromuscular effects of prolonged hyperoxia were
investigated in relation to respiratory and pulmonary functions, and to functionof purposeful muscular activity. The observations indicate no serious handicapto motor, respiratory, or pulmonary functions.
Skeletal muscle force and endurance were measured by handgrip dynamo-meter, with maximum force and duration of maintenance of 80% of maximumforces recorded electrically. Maximum force showed less than 10% increment ordecrement from preexposure control levels. Endurance changes were within20% of controls. For both force and maintenance of force, improvementoccurred in exposure to oxygen at 3.0, 1.5 ATA, and 0.2 ATA, whereas smalldecrement was associated with exposure to 2.0 and 2.5 ATA 02'
(
•.1 (16)

I
Tolerance to Continuous Hyperoxia
U Maximum Respiratory Pressures
Maximum inspiratory pressures at residual volume of functional residualcanacity were not consistently decreased during and after oxygen breathing at1.5, 2.0, 2.5, or 3.0 ATA. Maximum expiratory pressures at both total lungcapacity and functional residual capacity were decreased most consistently by amean value of about 17% near the end of the prolonged exposures at 1.5 ATA02. However, similar decrements also occurred during prolonged periods of airbreathing at 1.0 ATA.
Auditory-Vestibular FunctionAuditory-vestibular function was determined under controlled conditions
(Hearing Laboratory) before oxygen exposure, and repeated about 10 h aftertermination of oxygen exposure. These measurements were supplemented byperformance of extended high frequency audiometry during oxygen exposures(Fig. 5), along with monitoring of brainstem auditory evoked responses. Nosignificant difference in any of the measured hearing functions was found incomparison with control exposures to 0.2 ATA 02. The I subject who convulsedafter 3.0 h of oxygen exposure at 3.0 ATA performed normally on a full-range,high-frequency audiometric test that was in progress at the onset of theconvulsion.
Electronystagmographic responses to caloric stimulation were subnormalin many subjects after oxygen exposures at 2.5, 2.0, and 1.5 ATA. Since thismeasurement requires maintenance of an alert mental state and can beinfluenced by subject fatigue, the finding may not be specifically due tohyperoxia. Similar changes were found in some control subjects after 20-h airexposures at 1.0 ATA.
Effects on Visual FunctionsThe initial observation of oxygen-induced decrease in peripheral visual
fields was made by Behnke et al. (12) in a subject exposed continuously tooxygen at 3.0 ATA for 3.5 h. This essentially unexplored neural effect ofhyperoxia required measurements of multiple components of visual function ateach of the oxygen pressures of this Predictive Study. The effects observedthus far in continuous oxygen exposure at 3.0, 2.5, 2.0, and 1.5 ATA aresummarized in Table 4 and Fig. 8.
SIGNIFICANCE
In this integrated investigation of oxygen tolerance in normal menpermitted detailed examination and quantitation of oxygen effects in a mannernot possible without the cooperative and intelligent intercommunicationbetween subject and investigator. The information obtained therefore is notonly more detailed and extensive than could be obtained through thepreliminary research in various lower animals; it is of direct and permanentrelevance to the expanding importance of hyperoxygenation in diving,
I
i (17)

II
C. 1. Larnbertsen et ai.
I
:~ii ii;., 4, -I
: ~-'~, ~
I 4' -.
C0
1 U S UCCC C C C4 41 41 4'
3 4,
I 0
3
4,0
.3 ~ -~ ~ -* ~4, 41 C -
4' C. ~S E 4' 4'
30I 4, , uV 4* 44- C C C C41 41 4' 41
4, 4, 4, 440 C C C CI 0 0 0 0
C-. 3
41 .~
C~ ~C C 4' C CU - 0 A A
3 a * 4 .4
C - wC C C
3 .4W A A4, *3C @4 4, 4,*4, C C C
:~.. ~41 I..
- Q 0I -~ CU CU -
II1 (18)

II
Tolerance to Continuous Hyperoxia
I *-30-
z 0
I _3 -I¢
-J< -40
<3 -go
U -70
UJCL -ao0I -"_ON 02' 7_, OFF 0
I0 1 2 3 1
TIME (hours)
Fig. 8. Pe-ipheral visual field changei in man during and after oxygen exposure at 3.0 ATA.
aerospace, hyperbaric, and general medicine.Details of quantitative measurements made on multiple organ systems
establish function, tissue, and chemical targets which can be most rationallyand profitably investigated at each different level of oxygen pressure/durationexposure. The overall program is further intended to provide the essentialbaselines for both basic and applied research related to extension of oxygentolerance by overcoming the limits posed by oxygen poisoning. This topic willremain at the forefront of research endeavor related to life, medicine,undersea activity, and ultimate aerospace operations.
The present study in resting subjects is a prerequisite to investigation ofoxygen effects in active physical states, in exposures to external environmentalstresses, or in attempts to modify oxygen effect by pharmacologic means. It isfor the present considered that basic chemical processes of oxygen poisoning,which generated the functional changes observed in resting subjects, will alsooccur in situations of large practical importance in nonresting states such asunderwater swimming or performance of other physical vork. However, it isconsidered that the oxygen dose (PO2) experienced in some tissues will bemodified by carbon dioxide (11), whereas the oxygen dose in other tissue sites(e.g., lung) will not. It is also considered that functional influences of certainof these chemical changes will be modified by factors such as exercise, andother influences will not. The availability of baseline information in the resting
III (19)

II
C. J. Lambertsen et al.
I state provides the opportunity to investigate these considerations, and makes itpossible to investigate the influences of factors modifying oxygen tolerance,including intermittent exposure and drugs.
References
3 Lamberteen CJ, Clark J, Celfand R, et al. Predictive Studies V-Tolerance of human
organs and functions to continuous hyperoxia. Undersea Biomed Re 1.984; 11(Suppi
1):3 4.1:2. Clark JM, Gelfand R, Flores ND, Lambertsen CJ, Pisarello J. Pulmonary tolerance in
man to continuous oxygen exposure at 3.0, 2.S, 2.0, and L.S ATA in Predictive Studies
V. In: Bove AA, Bachrach AJ, Greenbaum Li Jr, ed. Proceedings of the ninth sympo-
sium on underwater and hyperbaric physiologry. Bethesda, MD: Underwater and Hyper-baric Medical Society, 1987.
3. Gelfand R, Clark JM, Lambertsen CJ, Pisarello J. Effects on respiratory homeost.sis of
prolonged continuous hyperoxia in man at 1.S to 3.0 ATA in Predictive Studies V. In:
Bove A.A, Bachrach AJ, Greenbaum LJ Jr, eds. Underwater and hyperbaric physiolog'y
IX. Proceedings of the 9th international symposium on underwater and hyperbaric
physiology. Bethesda, MD: Underwater and Hyperbaric Medical Society, 1987.
4. Pisarello JB, Clark JM, Gelfand R, Lambertsen C1. Human circulatory responses to
prolonged hyperbaric hyperoxia in Predictive Studies V. In: Hove AA, Bachrach Ai,Greenbaum LJ Jr, eds. Underwater and hyperbaric physioloiy IX. Proceedings of the 9th
international symposium on underwater and hyperbaric physiolo y. Bethesda, MD:
Underwater and Hyperbaric Medical Society, 1987.S. Clark JM, Gelfand R, Flores ND, Pisarello JB, Lambertsen Ci. Pulmonary mechanics and
gas exchance in man during and after oxygen exposure at 1.5 ATA for 16 to 19 h. Am
Rev Respir Die 1986; 133:A31.
6. Lamberteen CJ. Effects of hyperoxia on organs and their tissues. In: Robin ED, ed.
Extrapulmonary manifestaticns of respiratory disease. New York: Marcel Dekker,
1978:239-303.
7. Yarbrough OD, Welham W, Brinton ES, Behnke AR. Symptorms of oxygen poisoning andlimits of tolerance at rest and at work. U.S. Naval Experimental Diving Unit, Project
X-337 (Sub. No. 62, Rep 1). Washington, DC, 1947.
8. Donald KW. Oxygen poisoning in man. Br Mod 3 1947; 1:687-672, 712-717.
9. Cohn R, Cersh I. Changes in brain potentials during convulsions induced by oxygen
under pressure. J Neurophysiol 1945; 8:156-160.
10. Lambertsen CJ, Kough RH, Cooper DY, Emmel GL, Loeschcke HH, Schmidt CF. Oxygen
toxicity. Effects in man of oxygen inhalation at I and 3.6 atmospheres upon blood gastransport, cerebral circulation and cerebral metabolism. J Appi Physiol 1953; 5:471-486.
11. Lambertsen Ci, Ewing JH, Kough RH, Gould R, Stroud MW ll. Oxygen toxicity. Arterial
and Internal jugular blood gas composition in man during inhalation of air, 100% 02
and 2% CO 2 in 02 at 3.5 atmospheres ambient pressure. i Appl Physiol 1955; 8:255-263.
12. Behnke AR, Forbes HS1, Motley EP. Circulatory and visual effects of oxygen at 33 atmospheres pressure. Am J Physiol 1936; 114:436-442.
I3(20)
I

I Tolerance to Continuous I-yperoxia
313. Whalen RE, SaItEmain HA, Holloway DH Jr, %fclntosh HD, Dieker HO, Brown IW Jr.
Cardiovascular and blood gas responses to hyperbaric oxygenation. Am J1 Cardiol 1965;
15:628-646.14. Egger OWN Jr, Paley HW, Leonard 33, Warren JV. Ifemodynamic responses to oxygen
breathing in man. J Appi Physiol 1962; 17:75-79.I. Clark 3M, Lambertsen CJ). PulMOnary oxygen tolerance and the rate of development of
pulmonary cxygen toxicity in man at 2 atmosphe~cs inspired PO2 . In: Lambertsen CJ,
ed. Underwater physiology. Proceedings of the third symposium on underwater physi-
ology. Baltimore-, Williams & Wilkins, 1967:439-451.6. Clark J3M, Lambertmen CJ. Rate of development of pulmonary 0., toxicity in man duringI 02 breathing at 2.0 ATA. J1 Appi Physiol 1971; 30:739-752.
17. Peterson RE. Tracking of cumulative oxygen toxicity dose in diving, decompression and
therapy. In: Lambertsen CJ, ed. Decompression sickness and its therapy. Allentown, PA:
Air Products & Chemicals. 1979:125-141.I18. Bardin H, Lambertsen CJ. A quantitative method for calculating pulmonary oxygentoxicity. Use of the "Unit Pulmonary Toxicity Does' (UPTD). Institute for Environ-
mental Medicine Report. Philadelphia: University of Pennsylvania, 1970.319. Lamnbertsen CJ, Celfand R, Peterson RE, et al. Human tolerance to He, Ne and N, at
respiratory gas densities equivalent to He-0 2 breathing at depth% to 1200, 2000, 3000,
4000 and 5000 feet of sea water. Aviat Space Environ Med 1977; 48:843-855.
20. Lambertgen CJ, Celfand R, Clark 3M, eds. Predictive Studies IV. W ork capability andI physiological effects in He-02 excursions to pressures of 400-800-1200 and 1600 feet of
sea water. Institute for Environmental Medicine Report 78-1. Philadelphia: University of
Pennsylvania, 1978.I21. Lambertsen C3. Effects of oxygen at high partial pressure. In: Fenn WO, Rahn H, eds.Handbook of physiology. Sec. 3, Respiration, vol. 2. Washington, DC: American Physio-
logical Society, 1965:1027-1046.
22. Puglia CD, Clauser EM , Clauser SC. Core temperature response of rats during exposure
to oxygen at high pressure. J1 AppI Physiol 1974; 36:149-153.23. Lahiri S, Mokashi A, Mulligan E, Andronikou S. Loss of carotid chemoreflex function ins
oxygen toxicity. Fed Proc. 1985; 44:1000.
24. Clark 3M, Lambertsen CJ. Pulmonary oxygen toxicity: a review. Pharmacol Rev 1971;
3 Acknowledgment
Suppoted In part by NMRDC contract N00014-81-C-0826, NASA contract NAS9-17238, and
the State of Pennsylvania through the Benjamin Franklin Partnership.

II
9th International Symposium on Underwater and Hyperbaric PhysiologyUndersea and Hyperbaric Medical Society, Bethesda. MD. 1987
II
PULMNONARY TOLERANCE IN MIAN TO CONTINUOUS OXYGENEXPOSURE AT 3.0, 2.5, 2.0, AND 1.5 ATA INPREDICTIVE STUDIES V
J. M. Clark. R. Gel/and. N. D. Flores, C. J. Lambertsen. and J. B. Pisarello
I This summary report is part of a comprehensive study of specific organoxygen tolerance (Predictive Studies V). Oxygen effects on pulmonary functionwere measured in normal, resting men who breathed oxygen continuously at3.0, 2.5, 2.0, and 1.5 ATA to predefined limits of CNS, cardiac, or pulmonarytolerance (1-3). Pulmonary-related measurements obtained before and afterexposure included arterial blood gases while breathing air at rest and duringexercise; carbon monoxide diffusing capacity; spirometry; flow-volume loopson air and helium-oxygen; nitrogen closing volumes; airway resistance; and lungcompliance. Arterial blood gases on oxygen and maximum respiratory pressureswere measured early and late in the oxygen exposure period, whereas flow-volume maneuvers and spirometry were repeated at regular intervals duringoxygen exposures. Comparisons of data obtained over the range of oxygenpressures will be emphasized in this presentation. Parameters selected forcomparison include lung volumes and flow rates, lung compliance, and COdiffusing capacity.
In preparation for this series of experiments, it was anticipated thatoxygen tolerance would be limited by neurologic effects of oxygen toxicity at3.0 ATA and by pulmonary effects at 2.0 and 1.5 ATA, with oxygen exposure at2.5 ATA in a transitional zone between neurologic and pulmonary limitations(1, 4, 5). Based on all the information that was available at the outset of thisstudy, maximum exposure durations were established for each oxygen pressureand, as part of a comprehensive system to ensure safety of the subjects,criteria were established for exposure termination before the predeterminedlimits. The selected limits of continuous exposure duration were 3.5 h at 3.0ATA, 6 h at 2.5 ATA, 12 h at 2.0 ATA, and 20 h at 1.5 ATA.
IU(22)I

J. M. Clark et al.
Our previously derived pulmonary oxygen tolerance curves (4, 5) wereused to predict degrees of pulmonary effect for the maximal durations ofexposure at each pressure (Fig. I). The curves indicated that continuousoxygen exposures of 12 h at 2.0 ATA and 20 h at 1.5 ATA would both produceaverage vital capacity (VC) decrements of 15 to 20% and would therefore belimited by pulmonary effects of oxygen toxicity. On the other hand, it did notseem likely that pulmonary intoxication would be limiting at 3.0 and 2.5 ATA,where predicted VC decrements for maximal exposure durations were about 4and 8%, respectively.
I 5.0
, ' 0_. Decrement in Lung Vital Capacity
p.
C
O 2.0-0,
.........
ICI No PoietToxicity
O0 5 to I15 2b A_, 30
Duration of Oxygen Breathing (hours)
Fig. 1. Predicted pulmonary oxygen tolerance in man. Points indicate predicted changes in VCfor maximum exposure durations at 3.0, 2.5, 2.0, and 1.5 ATA.
Progression of Subjective Pulmonary Symptoms During Oxygen Exposureat 3.0, 2.5, 2.0, and 1.5 ATA
At regular intervals during oxygen exposure, each subject was given a listof symptoms that are known to be caused by pulmonary or neurologic oxygentoxicity (4). The symptoms were rated as absent (0), mild (1+), moderate (2+),or severe (3+), and average ratings for the entire subject group were calcu-lated. An overall "pulmonary symptom" rating was derived by combining aver-age ratings for chest pain, cough, chest tightness, and shortness of breath.Pulmonary symptom ratings were then plotted against duration of exposure foreach oxygen pressure (Fig. 2). Pulmonary symptoms were moderate (2+) on the
I(3

II
I Pulmonary Tolerance in Man
average by the end of oxygen exposure at 1.5 and 2.0 ATA, and mild (1+)before exposure termination at 2.5 and 3.0 ATA. Rates of symptom develop-ment increased progressively, as expected, with increase in oxygen pressure.However, the increment in the rate of symptom progression for the transitionfrom 1.5 to 2.0 ATA was much greater than that observed for comparabletransitions to 2.5 and 3.0 ATA. It is possible that longer oxygen exposures at2.5 and 3.0 ATA, beyond the tolerance limits found at these pressures, wouldbe associated with a wider separation of pulmonary symptom curves than thatobserved for mild symptoms.
x 1.5 ATA (N=9)
o 2.0 ATA (N=7)
3- SEVERE * 2.5 ATA (N-8)
2 - &ER 3.0 ATA (Nz10)
.
I C 2+ MODERATE
02.5 ATA 2.0 AA
x -- 1.5 AlAI~ ~~~1 -IMILD x . T
3. 0 ATA
I I I I I I I
0 2 4 6 8 10 12 14 16 18 20
Exposure Hours
Fig. 2. Pulmonary symptoms during oxygen exposure at 3.0, 2.S, 2.0, and 1.5 ATA. The overall
pulmonary symptom curve for each oxygen pressure combines average ratings for chest pain,cough, chest tightness, and shortness of breath.
Rates of Development of Pulmonary Intoxication During Oxygen Exposure at3.0, 2.5, 2.0, and 1.5 ATA
In parallel with periodic assessment of symptoms, rates of development ofpulmonary intoxication during oxygen exposure at 2.5, 2.0, and 1.5 ATA weremonitored by repeated performance of flow-volume maneuvers and spirometry.Pulmonary function was evaluated objectively only before and after the 3.5 hexposures at 3.0 ATA. Of the many lung volumes and flow rates that weremeasured, VC was selected for comparison across different pressures, because
I (24)

III
J. M. Clark et al.
it decreased consistently and significantly at each of the oxygen pressures thatwere studied (Fig. 3). Data shown for the 1.5 and 2.5 ATA exposures representaverage measurements in 9 and 8 subjects, respectively. The 2.0 ATA curvedescribes average data obtained previously in I I subjects (6) and more recentlyin 7 additional subjects. All 3 curves were derived by fitting regression linesto the data for each pressure on probability-linear coordinates and thentranslating the lines to linear-linear coordinates. The single point for 3.0ATA is an average of measurements obtained in 13 subjects about 2 to 4 hpostexposure.
E, O -- 2.5 AT,I. 5 ATAa, I + -3.0 ATA 2.0TA
U) 0
i x 1.5 ATA (N-9)2+ " 2 ,0 A "rk M - M 1
0 , , , - 71
" 2 *. A A 1,N=:8 )- + A 3.0 ATA (N- 13)4 rPost-Exoosure)
- 6
I 1.5 ATA
I- -2 ATAo 2.5 ATA-
o 1 4-14
-16
*-18
-20
I -22L0 2 4 6 8 10 12 14 16 18
Exposure HoursFig. 3. Pulmonary symptoms and VC changes in man during oxygen expiture at 3.0, 2.5, and 2.0,
and 1.5 ATA. Vital capacity measurements during the oxygen exposures at L.S and 2.5 ATA were
obta. ed in the present series of experiments. The 2.0 ATA data represent 2 groups of subjects.
The last exposure point (0) is the average value for 7 subJects In the present series of experi-
ments. All other points at 2.0 ATA are average data from an earlier group of 11 subjects (6).
II (25)

Pulmonary Tolerance in Man
The curves for 1.5, 2.0, and 2.5 ATA all show a progressive fall in VCwith continued duration of exposure, and the rates of fall are greater athigher oxygen pressures. Location of the 3.0 ATA point between the 2.0 and2.5 ATA curves is not inconsistent, because these measurements were obtainedafter 2 to 4 1 of recovery from the previous exposure. At the outset of thisstudy, the rapid rate of vital capacity recovery after exposure to oxygenpressures above 2.0 ATA was not expected. Rates of recovery from similar vitalcapacity decrements at different oxygen pressures are compared below.
Figure 3 also compares rates of decrease in VC at 2.5, 2.0, and 1.5 ATAwith progression of pulmonary symptoms at the same pressures. The data showthat prominent decrements in VC were concurrent with mild symptoms and aretherefore consistent with the conclusion that pulmonary symptoms did notcontribute significantly to the observed changes in lung volumes and flow
__ rates. This confirms the overall impression of investigators who remained insidethe chamber that the subjects were highly motivated and delivered maximaleffort even when symptoms were prominent.
Abrupt Exacerbation of Pulmonary Effects at 2.5 ATAThe 8 subjects who breathed oxygen at 2.5 ATA for an average duration
of 5.7 h had a VC decrement of nearly 18%. This observed change was morethan twice the prediction of about 8% from our previously derived pulmonaryoxygen tolerance curves (Fig. 1). However, if the data for 2 subjects who hadvery I-rge changes in lung volumes and flow rates are excluded from thegroup, the average decrease in vital capacity at the end of oxygen exposurefor the remaining 6 subjects is 9.3%, which agrees well with the predictedchange of 8%.
Percent changes in VC and maximal mid-expiratory flow rate (FEF2 5 7 5 )during oxygen exposure at 2.5 ATA and during the early recovery period at 1.0ATA for I of the 2 subjects with large changes are shown on Fig. 4. Bothparameters decreased during the early exposure period, reversed partially, andthen decreased prominently near the end of a 5.1 h exposure. Percent changesin VC and FEF 2 5 .7 5 at the end of oxygen exposure were 44 and 67%,respectively. During the first 1.5 h of recovery at 1.0 ATA, VC remained atabout the same level, but FEF 2 s.7 s fell further to a decrement of 87 to 88%.Vital capacity recovered to a level 22% below the preexposure control value at2 h of recovery and was decreased by only 5% at 5 h postexposure. Mid-expiratory flow rate increased only slightly at 2 h and then rose sharply towithin 2% of the control value by 5 h of recovery. During the period ofmaximal pulmonary function impairment at 1 to 2 h of recovery, the subjecthad no chest pain and only mild cough and dyspnea. He was not wheezing andfelt that he could inspire fully, but rapid expiration was very difficult for him.
The observed rapid rates of development and reversal of oxygen effectsin this subject are more commonly associated with neurologic rather thanpulmonary effects of oxygen toxicity and are consistent with an interaction of
(26)

II3 J. M. Clark et al.
0
5-
I -15
-25
* -30
-3 5- -VC-
z.J 40--4
-45
z -50uLJQc- -55 -FEF 25 75I "az.
-60
-65
-7 t t
-75 ON 0F
-8002 02
3 -85
-90 - - EXPOSURE _. RECOVERY2.5 ATA 02
- 1.0 ATA AIR, I I I I I I I t
HOURS
Fig. 4. Changes in VC and maximal FEF 2 5 .7 5 ha I man duringC and after oxygen exposure at 2.5
ATA. Values obtained during a 5.1 h exposure and the flrst 5 h of recovery are shown. Control
measurements at 2.5 ATA were obtained during early oxygen exposure. Preexposure control
measurements at 1.0 ATA were used for the postexpoeure data.
I
3 (27)

II
Pulmonary Tolerance in Man
I toxic effects on the CNS and lungs (4, 7). Such an interaction could explainthe observation that 2 of 8 subjects at 2.5 ATA developed pulmonary effects ofoxygen toxicity much more rapidly than predicted from pulmonary tolerancecurves derived from measurements at oxygen pressures of 2.0 ATA or less.
Patterns of Oxygen Effects on Lung Volumes and Flow Rates atDifferent Oxygen Pressures
Comparison of relative changes in selected lung volumes and flow ratesafter oxygen exposure at 3.0, 2.5, 2.0, and 1.5 ATA revealed that the changesobserved after exposure at 3.0 and 2.5 ATA had a different pattern than thosefound after exposure at 2.0 and 1.5 ATA (Fig. 5). The measurements selectedfor comparison are the forced vital capacity (FVC), I-s forced expired volume(FEV 1 .0 ), FEFs.7 , and peak expiratory flow rate (PEFR). Although thechanges observed after exposure at 3.0 ATA are generally the smallest inmagnitude, their interrelationships are most consistent with an increase insmall, peripheral airway resistance as a cause of the associated restriction inexpiratory flow rates (8, 9). Large airway resistance, as measured in a bodyplethysmograph (10), was not significantly altered after any of the oxygenexposures.
FIE, 3.0 ATA IN-13)
* 'I, 2.5 ATA (N-81
P-F , 2.0 ATA IN-6I
.... . .. . " I M 4, 0P-F " 1.5 ATA (N-91
fl:.~ ~ S.Pten f af:: Pe't chng Ilo rae afe oxgn suea.., .,20-40 -35 -30 -25 -2O -I5 -10 -5 0 .5 10
Percent Change
Fig. 5. Patterns of effects on lung[ volumes and flow rates after oxygen exposure at 3.0, 2.S, 2.0,
and 1.5 ATA. Average changes in selected lung volumes and flow rates measured at comparablepootexposure intervals after oxygen exposures at 3.0, 2.S, 2.0, and 1.5 ATA are shown. Changes inthe same parameters measured near the end of oxygen exposure at 2.5, 2.0, and 1.S ATA werelarger, but the smaller postexposurs values were used for comparison with the data for 3.0 ATA,where pulmonary function was not evaluated during exposure to allow more time for measurements
of neurolo~ic functior.,.
I

I
J.M. Clark et al.
IAfter exposure at 3.0 ATA, PEFR known to be highly effort dependent(11), was not significantly changed, whereas FVC had a statistically significantbut quantitatively small reduction. The largest change was in the FEF 25. 7 ,which is effort independent (11). In addition, the FEVy. 0 was reduced morethan FVC. A similar pattern of effects was found after oxygen exposure at 2.5ATA except that all changes were larger and PEFR was also significantlyreduced.
It is of interest that FEF25 .7 s were not significantly reduced eitherduring or after oxygen exposure at 2.0 and 1.5 ATA, despite the fact thatthese exposures caused the most prominent pulmonary symptoms and VCdecrements. The observed patterns of effects are consistent with theinterpretation that small airway function is impaired more selectively byoxygen exposure at 3.0 and 2.5 ATA than at 2.0 and 1.5 ATA.
Recovery of VC After Oxygen Exposure at 2.5, 2.0, and 1.5 ATAVital capacity was measured repeatedly at 1.0 ATA after oxygen exposure
at 2.5, 2.0, and 1.5 ATA to determine rates of recovery (Fig. 6). The mostrapid recovery occurred after exposure at 2.5 ATA, where an average VCdecrement of 4.4% at 2.2 h postexposure was not statistically significant.Recovery of VC after exposure at 1.5 ATA was also relatively rapid. Theaverage value was still significantly reduced by 7.4% at 13 h postexposure, butwas slightly above the preexposure control at 24 h. Despite the similarity ofpulmonary symptoms and VC changes at the termination of oxygen exposures at2.0 and 1.5 ATA (Fig. 3), recovery was slower after the 2.0 ATA exposure. Anaverage decrement of 6.6% at 24 h postexposure was statistically significant,but a 3.6% reduction at 48 h was not.
Performance of bronchoalveolar lavage at about 9 h after both the 2.0and 1.5 ATA exposures provided additional evidence of different recoverystates. This procedure is known to cause transient reductions in lung volumesand flow rates (12). The 2.0 ATA subjects had a reversal of recovery, asindicated by pre- and postlavage VC values of -12.9 and -20.3%, respectively,whereas the i.5 ATA subjects continued to recover with pre- and postlavagechanges of -12.7 and -7.4%, respectively.
Effects on Lung ComplianceDynamic and static lung compliance were measured in a body plethys-
mograph with an intraesophageal balloon (13) before and after oxygen exposureat 2.5, 2.0, and 1.5 ATA. Dynamic lung compliance at breathing rates of 15, 30,and 60 was not reduced after oxygen exposure at any pressure.
Static lung compliance was not altered after oxygen exposure at 2.5 ATA,but it was significantly reduced after the 2.0 and 1.5 ATA exposures (Fig. 7).Again, exposure at 2.0 ATA for an average time of 9.7 h produced greaterchanges than exposure at 1.5 ATA for 17.6 h. Both overall lung compliance andspecific lung compliance (compliance per liter of lung volume) were signif-icantly reduced by 30.8 and 36.8%, respectively, after exposure at 2.0 ATA.
I1(29)

I
I Pulmonary Tolerance in Man
* +5
0 / - Pre-Exposure Control Value
-5 -2.5 ATA (N-9)(N-a)
Clr" -C '-2.0 ATA * Statisticatly Significant Difference
-N 15)
E -'50-20
I -25
12 18 24 30 36 42 48 54 60 66 72
Hours Post-Exposure
Fig. 6. Recovery of VC after oxygen exposure at 2.S, 2.0, and .5 ATA. Average percent changes
in VC relative to preexposurs control values are shown, and statistically significant differences areIndicated. Recovery from pulmonary oxygen poisoning was followed more closely in these subjectsthan in any previous group.
Following the 1.5 ATA exposure, only the 25.7% reduction in specific lungcompliance was statistically significant.
Effects on Pulmonary Diffusing Capacity for Carbon MonoxideAverage values of pulmonary diffusing capacity for carbon monoxide.
measured by the single breath method (14), were significantly reduced afteroxygen exposure at 2.5, 2.0, and 1.5 ATA, but not after the 3.0 ATA exposure(Fig. 8). The 3.0 ATA data indicate that oxygen effects on pulmonary gasexchange occur later than effects on lung volumes and flow rates during theprogression of pulmonary intoxication at that pressure (15). Average carbonmonoxide diffusing capacity after oxygen exposure at 1.5 ATA was signifi-cantly reduced only at 13 h postexposure, but after exposure at 2.0 and 2.5ATA, average decrements, though small, were statistically significant for atleast 8 to 9 d. The magnitude of change after exposure at 2.0 ATA exceededthat after exposure at either 1.5 or 2.5 ATA.
Because average values measured at 8 to 18 d postexposure had not fullyreturned to preexposure control levels, extended follow-up measurements wereobtained from 2 wk to 5 mo. after oxygen exposure. Average values for the
Ii (30)

II
IJ. N1. Clark et al.
* LUNG COMPLIANCE (CL) 2.0 ATA
- SPECIFIC LUNG COMPLIANCE (CL/FRC)
* Statistically Significant Difference
I I LUNG COMPLIANCE (CL) 1.5 ATA
(N=9)* SPECIFIC LUNG COMPLIANCE (CLIFRC)
-40 -35 -30 -25 -20 -15 -10 -5 0Post-Exposure %A From Pre-Exposure Control Value
Fig. 7. Effects of oxygen exposure at 2.0 and 1.5 ATA. on lung compliance. StatIc lung COmpli-
2nce was calculated from a plot of lung volume against intrathoracie pressure during slow,controlled inspiration. Measurements were obtained about 4 h postexposure in both series ofexperiments. Follow-up measurements at 3 to S wk postexpoeure were normal in all subjects.
subject groups exposed at 1.5 and 2.5 ATA had fully returned to the preex-posure control level, whereas the diffusing capacity for the 2.0 ATA group wasreduced by only 0.6 ml.min' .mmHg 1 or less than 2% of the control value.Four of the 7 subjects in this group were not available for long-term follow-up, and it was necessary to use values obtained earlier in the postexposureperiod. Pulmonary diffusing capacity for carbon monoxide may prove to be asensitive index of complete recovery from pulmonary oxygen poisoning.
SUMMARY AND CONCLUSIONS
Rates of pulmonary symptom intensification and decrease in VC areprogressively increased with elevation of inspired oxygen pressure. AlthoughVC decrements occur concurrently with symptoms, the lung volume changesbecome prominent when symptoms are still mild. In contrast to the progressivefall in VC with increasing pulmonary intoxication at each oxygen pressure thatwas studied, patterns of associated changes in other lung volumes and flowrates are not the same at each oxygen pressure. The observed patterns ofeffects are consistent with the interpretation that small airway function isimpaired more selectively by oxygen exposure at 3.0 and 2.5 ATA than byexposure at 2.0 and 1.5 ATA.
Ii (31)

III
Pulmonary Tolerance in Man
I0 Pe-Eosure Control Value 0
m 3.0 ATA * Slahstically Significant o 2• N - Ml o lle e n c e )I~ ~~ Oifs O4 c:
-2.0 .UE _10 5 A)
.__q -30
Z--4.0 -12 C
IN-7)-14°u 5 .0 N-4 7
I10 12 14 16 I8 Follow-Up
Days Post-Exposure
Fig. 8. Lun; carbon monoxide diffusing capacity in man after oxygen exposure at 3.0, 2.5, 2.0,and 1.S ATA. Average changes in carbon monoxide diffusing capacity relative to preexposurecontrol values are shown, and statistically significant differences are indicated. Subsequent
measurements of diffusing capacity in all subjects who were available for follow-up equaled or
exceeded the preexposurs control value.
Magnitude of decrement in vital capacity does not always reflect overalldegree of pulmonary intoxication or subsequent rate of recovery. Despitesimilar VC changes after oxygen exposure at 2.0 ATA for nearly 10 h andexposure at 1.5 ATA for almost 18 h, the 2.0 ATA exposure caused greaterimpairment of pulmonary function and required a longer recovery period.Conversely, the rapid occurrence of large decrements in VC during oxygenexposure at 2.5 ATA was followed by an equally rapid rate of recovery afterexposure termination. Rapid onset and reversal of oxygen effects on the lungat high pressures ,re consistent with interaction of neurologic and pulmonaryeffects of oxygen toxicity.
No single measure of pulmonary function is ideally satisfactory formonitoring rate of pulmonary intoxication during oxygen exposure or. fortracking rate of recovery after exposure termination. In the absence of asingle measure that accurately monitors progression and reversal of pulmonaryoxygen poisoning, one possible approach involves the development of acomposite index of pulmonary intoxication that incorporates multiple measuresof pulmonary function. A second approach that can be used in lieu of or alongwith the first involves selective applications of one or more toxicity indices tospecific conditions of exposure or recovery. An important objective in thecontinuing analysis of pulmonary data obtained during and after continuous
(32)

III
J. M. Clark et al.
H oxygen exposures at 1.5 to 3.0 ATA consists of testing the accuracy and
precision of such methods for defining pulmonary oxygen tolerance in man.
I References
1. Lambertsen Cl, Clark IM, Celfand R, et al. Definition of tolerance to continuous
hyperoxia in man. An abstract report of predictive studies V. In: Bove .A.A, Bachrach
AJ, Greenbaum LJ, eds. Undersea and hyperbaric physiology IX. Proceedings of the
ninth symposium on underwater and hyperbaric physiology. Bethesda, MD: Underwater
and Hyperbaric Medical Society, 1987.
2. Gelfand R, Clark JM, Lambertesen Cl, Pisarello JB. Effects on respiratory homeostasis of
prolonged continuous hyperoxia at I.S to 3.0 ATA in man in predictive studies V. In:
Bove AA, Bachrach Al, Greenbaum LJeds. Undersea and hyperbaric physiology IX.Proceedings of the ninth symposium on underwater and hyperbaric physiology. Bethesda,MD: Underwater and Hyperbaric Medical Society, 1987.
3. Pisarello 3B, Clark JM, Lambertsen CJ, Gelfand R. Human circulatory responses to
prolonged hyperbaric hyperoxia in predictive studies V. In: Bove AA, Bachrach AJ,Greenbaum LI, eds. Undersea and hyperbaric physiology IX. Proceedings of the ninth
symposium on underwater and hyperbaric physiology. Bethesda, MD: Underwater and
Hyperbaric Medical Society, 1987.
4. Clark JM. Oxygen toxicity. In: Bennett PB, Elliott DH, eds. The physiology andmedicine of diving and compressed air work, 3rd ed. London: Balli re-Tindall, 1983:200-
238.
5. Lambertsen Cl. Effects of hyperoxia on organs and their tissues. In: Robin ED, ed.
Extrapulmonary manifestations of respiratory disease, vol. 3. In: Lenfant C, ed. Lung
biology in health and disease. New York: Marcel Dekker, 1978:239-303.
6. Clark JM, Lamberteen CJ. Rate of development of pulmonary 02 toxicity in man during
02 breathing at 2.0 atm abe. J Appl Physiol 1971; 30:739-752.
7. Clark JM, Lamberteen CJ. Pulmonary oxygen toxicity: a review. Pharmacol Rev 1971;
23:37-133.a. Mcfadden ER, Keker R, Holmes B, deGratt WJ. Small airway disease: an assessment of
the tests of peripheral airway function. Am I Med 1974; 67:171-181.
9. Mcfadden ER, Linden DA. A reduction in maximum mid-expiratory flow rate. A
splrographlc manifestation of small airway disease. Am J Med 1972; S2:725-737.
10. Dubois AB, Boteiho SY, Comroe JH. A new method for measuring airway resistance in
man using a body plethysmograph: values in normal subjects and In patients with
respiratory disease. J Clin Invest 1966: 3S:327-33S.
11. Metsger LF, Altos* MD, Fishman AP. Evaluation of pvlmonary performance. In: Fishman
AP, ed. Pulmonary diseases and disorders. New York: McGraw Hill, 1980:1751-1777.
12. Tilles DS, Goldenheim PD, Hales CA. Bronchoalveolar lavage causes deterioration in
lung function. Am Ray Reep Dis 1984; 129:A67.
13. Mead J, Whittenber;'er JL. Physical properlies of hurman lun;4s measured during
spontaneous respiration.1 Appi Phyaiol 1953; 5:779-796.
(33)I

III
Pulmonary Tolerance in Man
14. Ogilvie CM, Forster RE, Blakemore WS, Morton TW. A standardized breath holdingtechnique for the clinical measurement of the diffusing capacity of the lung for carbonmonoxide. J Clin Invest 1957; 36:1-17.
15. Clark IM, Lambertmen CJ, Pisarello 1B, Jackson RFf, Gelfand R. Cardiopulmonary effectsof continuous 0 2 exposure at 3.0 ATA for 3.5 hours in man. Undersea Biomed Res 1984;(1)Suppl:29.
Acknowledgment
Supported in part by NMRDC contract N00014-81-C-0826, NASA contract NAS9-17238, andthe State of Pennsylvania through the Benjamin Franklin Partnership.
IIIIII
III
(34 )I

III
91h International Symposiuni oni Underwater and Hyperbaric PhysiologyUtidersea and Hyperbaric Medical Society, Bethesda, 14D. 1987
II
EFFECTS ON RESPIRATORY IIOMEOSTASIS OF PROLONGED,CONTINUOUS HYPEROXIA AT 1.5 TO 3.0 ATA IN MAN INPREDICTIVE STUDIES V
R. Gel/and. J. M. Cla,',:. C. J. Lambertsen. and J. B. Pisarello
Acute hyv;.roxia at 1.0 to 3.0 ATA produces well-known effects onrespirator' homeostasis and on the respiratory response to CO, (1) which arerapid jr, inset following administration of oxygen. These effects are mediatedby a direct action of hyperoxia on peripheral respiratory chemoreceptors, andby in indirect action of hyperoxia on CNS acid-base balance. During spontan-eous breathing of 100% oxygen, even at I ATA, electrical activity of thecarotid body is diminished (2). Central venous Pco 2 rises due to reduction inthe CO 2 buffering capacity of hemoglobin (I). The result of these two opposingactions on respiratory drive (decrement due to reduced peripheral input to theCNS; increment due to elevated Pco 2 in the CNS) is a net increase inventilation and reciprocal decrease in arterial CO2 tension (1). Furthermore,suppressed electrical activity of the peripheral chemoreceptors in hyperoxiacontributes to a reduction in slope of the ventilatory response to CO 2(respiratory CO2 reactivity) (3). These "physiologic" effects of hyperoxia areconsidered modifications of otherwise intact physiologic processes, not theresult of its "toxic" effects (I).
The several phases of Predictive Studies V (4) have involved prolonged
exposures of men to continuous hyperoxia at 3.0, 2.5, 2.0, and 1.5 ATA fordefinition of CNS oxygen tolerance and for investigation of effects of pro-longed hyperoxia on CNS and other organ functions (4-6). Its design providedan opportunity to search for toxic effects of supranormal oxygen pressuresthat might develop in respiratory functions only during extended exposures.Before these investigations there was virtually no information concerning sucheffects of prolonged toxic exposures to hyperoxia on respiratory functions inman. There is little current information even in animals (7, 8).
II (3)

II
3 R. Gelfand et al.
Ventilation and related parameters were measured in this program forseveral purposes. They were to: a) monitor the subject's respiratory status forsafety, b) investigate potential changes in these parameters as possibleindicators of hyperoxic effects on the integrated neural and neurochemicalmechanisms of respiratory control, c) investigate changes in these parametersas potential indicators of hyperoxic effects on neuromechanical functions ofthe airways, lungs, and respiratory muscles, and d) investigate changes inventilatory responses to hypercapnia and to hypoxia as potential indicators ofhyperoxic effects on chemoreception of CO 2 and 02.Since changes in body temperature can alter ventilation (9), and hyper-oxia has been associated with decrease in body temperature of rats (10), rectaltemperature was monitored in all phases of Predictive Studies V, both as apotential indicator of CNS 0, toxicity and for its potential effects as amodifier of 0 2 -related ventilatory change.
PROCEDURES AND METHODS
Oxygen Pressure-Time ExposuresThe Predictive Studies V Program includes continuous hyperoxic expo-
sures at pressures of 1.5, 2.0, 2.5, and 3.0 ATA, with normoxic controls at 1.0ATA (Fig. I). This summary report does not include information obtained at 2.0ATA because that series is at present incomplete. Respiratory reactivity to CO 2I• and hypoxic ventilatory response were measured at i.0 ATA both before andafter the exposures to hyperoxia at 1.5 and 2.5 ATA.
3 3.0 ATA 022.5 ATA
D 2.0 ATA' V 1 O .5 A TA
N IW %a: I
OXYGEN EXPOSURE TIME thrs)CO 2 REACTIVITY CO REACTIVITYHYPOXIA RESPOHSE HYPOXIA RESPOUSE
Respiratory-metabolic measurements during quiet period of EEG recording:
Ventilation End-tidal Pco 2Tidal volume Rate of C02 eliminationFrequency
Fig. 1. Pressure-time "profiles* for Predictive Studies V investigations at 3.0, 2.S, 2.0, 1.5, and0.2 ATA oxygen pressure. Symbols (X) indicate approximate times at which ventilatory messure-menta were made during quiet periods of EEG recording.
I (36

Respiratory Homeostasis
Procedures for Measurement of Ventilatory Parameters During HyperoxicExposures
Inspired respiratory flow, end-tidal Pco 2, body temperature, and inspiredoxygen concentration were monitored continuously. Expired gas was accumu-
1 lated in a bag over a 3-rin collection period for measurement of volume andanalysis of gas composition. These collection periods were scheduled duringpredetermined "quiet" intervals when the subject was at rest for recording theEEG. These intervals were a component part of integrated "measurementmodules," during which sequences of measurements were made related to avariety of physiologic systems in these investigations of specific organ oxygentolerance (4). The pressure-time profiles indicating times at which restingventilatory parameters were measured at each exposure pressure are shown inFig. 1.
Apparatus for Measurement of Resting Ventilatory ParametersDuring Hyperoxic Exposures
Inspiratory flow for each breath was measured by pneumotachograph,recorded onto a magnetic tape recorder, and displayed on an oscilloscope forvisual monitoring of flow pattern. Expired gas was collected into a meteoro-logical balloon which was emptied promptly through the chamber hull to a dry
gasometer for measurement of collected volume. A portion of this gas wasbypassed through electronic gas analyzers to determine mixed expired CO2 and02 concentrations. A sample of expired gas from each expiration was divertedfrom the space just distal to the expiratory check valve of the subject'slightweight oronasal mask (approx. 100 cc dead space) through the chamberhull to a rapid response CO2 analyzer for measurement of end-tidal PCo 2. Th'eend-tidal values were recorded for all breaths as the peaks of the end-expiratory "washout" curves. Mean values of end-tidal Pco2 for each expired-gas collection period were obtained from the largest peak values, correspondingto the largest tidal volumes in the period. This procedure minimized the effectof mask dead space and provided close agreement between end-tidal andarterial Pco 2 values. A sample of gas was taken from a fitting on the mask toa rapid response oxygen analyzer outside the chamber for measurement ofinspired 02 level. Any leak which might dilute the oxygen within the maskcould thereby be detected rapidly. Chamber ambient and subject rectal temper-atures were monitored with thermistor sensors.
Procedures and Apparatus for Pre- and Postexposure Measurement ofVentllatory Responses to Hypercapnia and to Hypoxia at 1.0 ATA
Preexposure ventilatory responses to progressive hypercapnia and to
progressive hypoxia of supine subjects were determined in duplicate, in a3laboratory room at 1.0 ATA by rebreathing methods (i, 12), an hour or morefollowing a light breakfast. They preceded the 1.5 ATA exposures by about 6 hand were 10 h before exposure at 2.5 ATA. Postexposure measurements were3obtained 2 or 3 h after exposure at 1.5 or 2.5 ATA, respectively. Little or no
II

R. Gelfand et al.
sleep was possible in the intervening period, and sustenance was primarily a 5%dextrose solution by continuous intravenous infusion, supplemented by lightcarbohydrate snacks.
RESULTS
Focus in this summary report is on comparison of mean values at thedifferent hyperoxic pressures investigated. Results are presented in Fig. 2 forI ventilation, end-tidal Pco,, and rate of CO 2 elimination; in Fig. 3 for venti-latory responses to C02; in Fig. 4 for ventilatory responses to hypoxia; and inFig. 5 for body temperature changes.
VENlTILAT ION
.ATA0 n83
'- -3.0 ATA 0. (n-121I 10 AlA Al- -n1.5 ATA 0:i. (n-9 n-1z
0- C MANGE 0
END-TIDAL PcO2
--2 "1.0 ATA AlA _ "- ,CHA4(E - 0
0 4 .- I- ATA 0,~. 6 ~2 ATAO 2
I ~ ~ E -8 30TO11 -10 3.0A ,
- CO2 EUMINATION RATE
S0-
Fi. . .)c A To xga 0 .2 1. 5, 2., A nd30IRo etiain n-ia!P Oadr
o(C 2 0 liinaion ChaTe re pepoueeeenelvinAIR at10A.
(38)

Respiratory Homeostasis
60-SU9J TK<0B T POST-ExPOSURE50O 3 0 11/tlllOrr
40 PRE-EXPOSUR E
3 0 ilmillorr
* 40
I _ _ _ _ _ _ _ _ _
z 900 SUEU. 8A,
80. POST-EXPOSURE7 S Ilmnltorr
60o
*50*
40
30
-Go-
EiD-I4 A TENSION60END-tOALCARBON DIOXIDE TNIN(or
I Fig. 3. Effects of hyperoxia on ventilstory" response to CO 2 in 2 subjectsi following exposure at
2.S ATA 02. S.. text for explanation.
I Ventilation, End 'Tidal Pco2 , and CO2 Elimination RateU ~Increments in mean values of' ventilation and decrements in mean valuesof end-tidal Pco 2 occurred during hyperoxia at 1.5, 2.5, and 3.0 ATA (Fig. 2).
I The increased ventilation was greater in magnitude early in exposure at 2.5I and 3.0 ATA than it was early in the 1.5 ATA exposures. Correspondingly, thedecrements in end-tidal Pco 2 were greater at 2.5 and 3.0 ATA than they wereearly in exposure at 1.5 ATA.
These changes were of' the same magnitude and did not progress with
time at the 2.5 and 3.0 ATA pressures. In contrast, although the changes inventilaticn and end-tidal Pco2 at i.5 ATA were smaller in magnitude than
I were those at 2.5 and 3.0 ATA early in exposure, these changes did becomeI greater over time. By the end of the 1.5 ATA exposures, the increment in
ventilation and decrement in Pco 2 were as great as those at the higherII (319)
Z17III

UR. Gelfand etal
1 40-
I30 SUEJ
P OST-EXPOSURE
E 10 PRE-EXPOSURE(PETCO 2 -44 lorr)
zw
>40- SUBJ. GL
30-- POST-EXPOSURE(PETCOz -42 lorrn1 20-
PRE-EXPOSURE
10- (PETCO 2 -42 torr)
I40 60 80 100END-TIDAL OXYGEN TENSION (tort)
Fig. 4. Effects of hyperoxia on hypoxic ventilatory response in 2 subjects following exposure atI 1.5 ATA 02- See text for explanation.
pressures. There were relatively small increments in mean values of ventilationand correspondingly small changes in mean values of end-tidal PCo 2 duringnormoxic control "exposures."
Changes in rate of CO2 elimination were small and not progressive at anyof the exposure conditions. This parameter was sufficiently stable to not
influence the effects of hyperoxia on ventilatory or thermal homeostasis.
(40)

II
Respiratory Homeostasis
Air Control and 1.5 ATA 0r
37,8 A 1S A
DIURNAL TEMP CYCLE , . .- . - .2-AT BO REST
0o o 02--Nwi 0 J.' 2 ATA 0% JG
-4 .4
n" ' 3621 ... . .. . . . .. . . .
2.0 ATA and 2.5 ATA 02
>-_ 37 6 B 02 ON
0 e 2.5 ATA 02 10 0c3 2
37.0, F0 ATAo2 HI o 180 2 0
2 1:4 .0 ATA 0,
6.'
6.2 C ' F I ' I ' i ' 1 ' I '0200 0600 1000 NOON 1400 ,Boo 2200
TIME OF DAY
I Fig. S. Body temperatures of individual subjects during exposures. Overall patterns of change aretypical for the subjects at each oxygen pressure. See text for explanation.
1 Respiratory CO2 ReactihityFollowing exposures to oxygen at 0.2, 1.5, and 2.5 ATA, mean values of
respiratory CO 2 reactivity were increased above preexposure values for the 1.5and 2.5 ATA exposure groups. Mean pre- and postexposure reactivities were 3.3and 4.9 liter.min'l.Torr - 1 Pco2 , respectively, for the 1.5 ATA exposuregroup. Corresponding values for the 2.5 ATA group were 3.1 and 4.8liter- min- .Torr- Pco 2. Individual results for 2 of the subjects from thisgroup are shown in Fig. 3 to illustrate the range of responses among subjects.For subject TK (top) there was no change in reactivity, whereas for subjectBM (bouom), postexposure reactivity was more than doubled. Reactivity wasincreased by 100% or more in 4 of the 1.5 ATA and in 4 of the 2.5 ATA O2subjects, whereas in the other subjects changes were small. All the individualpostexposure respiratory CO 2 reactivities observed fall into the range ofresponses of healthy subjects (13). Respiratory CO 2 reactivities measured onsubsequent days in the 2.5 ATA O2 group were back at the preexposure controllevel.
II (4,1)
I

II
R. Gelfand et al.UVentilatory Responses to Progressike Hypoxia
In no subject was the hypoxic ventilatory response abolished. Thepostexposure hypoxic ventilatory responses were usually displaced above thepreexposure curves after exposure at 1.5 ATA 0,, but not after the 2.5 ATAexposures. There was no increase in degree of curvature in some subjects (Fig.4, top). Other subjects had an increase in degree of curvature (Fig. 4, botloni).Quantitative analyses of the hypoxic ventilatory responses, which wereobtained before and after the exposures to 0.2, 1.5, and 2.5 ATA 02, are notcurrently available. By inspection, the degree of curvature (related to hypoxicrespiratory sensitivity) may be increased somewhat in 4 of 9 subjects followingexposure to 1.5 ATA 02, and in 3 of 8 subjects following exposure to 2.5 ATA0,. Of these 7 subjects with possibly increased hypoxic sensitivity, 6 also hadincreased respiratory C0 2 reactivity.
Thermal Homeostasis\With a single exception, patterns of change in body temperature were
similar for individual subjects of the 1.0 ATA air exposure series and the 1.5ATA 02 exposure series. Individual patterns of temperature change are shownin Fig. 5; A shows temperature "profiles" for single subjects at 1.0 ATA airand at 1.5 ATA 02, along with diurnal temperature change of normal indi-viduals on bed rest (14), with nocturnal sleep. The natural diurnal cycle isabsent for both the subject at 1.0 ATA air and at 1.5 ATA 02. The patterns ofchange at these two pressures are virtually identical. In contrast to theincrements in body temperature at 1.0 ATA air and 1.5 ATA 02, body temper-atures decreased following the initiation of hyperoxia at 2.0 and 2.5 ATA (Fig.i 5SB).
DISCUSSION
Altered respiratory homeostasis during prolonged hvperoxia vas evidentin the subjects at each of the pressures investigated, in the form of increasedventilation and decreased PETCO . The initial changes, which persisted, werepresumably physiologic in origin (1). Within the preplanned pressure time limitsselected for these exposures, the observed effects were not of sufficientmagnitude to impair function. However, continued hyperoxic exposure beyondthe limits of these investigations could result in progressive changes offunctional significance.
Persistent mild increment in ventilation and decrement in end-tidal Pco 2during hyperoxia at 3.0 and 2.5 ATA were similar in magnitude to those seenin man during shorter exposures to oxygen at 3.5 ATA (15). Although thesechanges did not progress over the hyperoxic exposures in the majority ofsubjects at 2.5 and 3.0 ATA (Fig. 3), functionally significant changes inrespiratory parameters did develop progressively over the 30 min precedingonset of seizure in the single subject who experienced an 0 2-related convul-sion at 3 h of exposure at 3.0 ATA (4, 6, 16).
4!I 2

Respirazory HcmeostasisIThe smaller early exposure increment in ventilation during hyperoxia at
1.5 ATA most likely reflects lesser intensity of the same effects that causedventilation to increase at 2.5 and 3.0 ATA. The progressive increase inventilation later in the 1.5 ATA exposure reflects either progressive develop-ment of toxic effects of hyperoxia directly on mechanisms concerned with theregulation of respiration, or indirect effects related to progressive increase inseverity of pulmonary symptoms (5). It is predictable that the difference in gasdensity between air at 1.0 ATA (reference level) and oxygen even at 3.0 ATAhad only a negligible effect on ventilation (17).
The decrease in end-tidal Pco 2 observed at 1.5, 2.5, and 3.0 ATA (Fig. 2,center) were entirely a consequence of increased ventilation, since the rates ofCO 2 elimination (Fig. 2, lottorn), and most likely the metabolic rates as well,did not change significantly during hyperoxia as compared to preexposurelevels. This current observation for prolonged hyperoxia confirms an earlierobservation for a shorter exposure to oxygen at 3.5 ATA (15).
Respiratory reactivity to carbon dioxide is reduced below air-breathinglevels when it is measured during brief exposures to hyperoxia (3), due tosuppression by hyperoxia of peripheral chemoreceptor activity (2) and possiblydue to reduction of central respiratory chemoreceptor reactivity as well (18).For several reasons, respiratory CO, reactivity could not be measured duringthe oxygen exposures of Predictive Studies V; therefore the effect of hyperoxiaon respiratory CO, reactivity during prolonged oxygen breathing at 1.5 and 2.5ATA cannot now be assessed.
I Sleep deprivation has been reported to reduce hvpercapnic ventilatoryresponse to CO.; 24 h of sleeplessness reduced reactivity by 24% in 13 healthymen (19). This was not confirmed in the 5 subjects of the 1.0 ATA air x20 h experiment series of Predictive Studies V. Nevertheless the potentialeffect of sleep deprivation must be considered in investigations involvingprolonged periods of wakefulness.
It is important to note that ventilatory responses to progressive hypoxiawere not abolished in any of the subjects of Predictive Studies V. Abolition ofcarotid body reactivity to hypoxia as well as its associated ventilatory responsehas been reported for cats exposed to oxygen at 1.0 ATA for 65 h (20).Rather, the enhanced hypoxic responses (Fig. 4) observed for some of thesubjects of the 2.5 and 1.5 ATA 02 exposure series could be related toincreased input from peripheral receptors or enhanced central responsiveness toperipheral stimuli.
Altered thermal homeostasis manifested as progressive drop in body coretemperature with rate of fall proportional to degree of hyperoxia has beenreported for rats (10). A similar effect was expected to be more difficult todetect in man due to immensely greater body mass. Initially, body temperaturewas recorded only intermittently during the 3.0 ATA 02 exposures whichinitiated Predictive Studies V, because it was felt that 3.5-h exposure was toobrief to allow any derangement of thermal homeostasis to be expressed.Observed temperature changes were unremarkable until a distinct fall in bodyI
I('.3)
I
II
R. Gelfand et al.
temperature was observed in the single subject who experienced an oxygen-related seizure in the periods preceding and following the convulsion (4, 16).Continuous recordings of body temperature were made in all subsequentexposures. Preliminary analysis indicates that thermal homeostasis may bealtered in man by hyperoxia at oxygen pressures greater than 1.5 ATA (Fig. 5).Since rate of CO 2 elimination did not change over the exposure periods (Fig.2), the observed decreased temperatures seem unrelated to metabolic changes.The observed small decrements are not physiologically important, and are of nosignificance to use of hypoxia in therapy or in decompression for increasedrate of inert gas elimination.
SUMMARY
Altered respiratory homeostasis was evident during exposures at 2.5 and3.0 ATA 02 as nonprogressive increment in ventilation and reciprocal decre-ment in FETCo . During exposure at 1.5 ATA 02 these changes were progres-sive. Mean values of respiratory reactivity to CO 2 were somewhat increasedfollowing prolonged hyperoxia at 1.5 and 2.5 ATA, as compared to preexposuremean values. Hypoxic ventilatory response was unchanged or enhanced afteroxygen exposures at 1.5 and 2.5 ATA. Observed respiratory and body temper-ature changes were not of sufficient magnitude to impair function.
I References
1. Lambertsen CJ. Effects of hyperoxia on organs and their tissues. In: Robin ED. ed.Extrapulmonary manifestations of respiratory disease, vol. 8. In: Lenfant C, ed. Lungbiology in health and disease. New York: Marcel Dekker, 1978:239-303.
2. Leitner LM, Pages B, Puccinell R, Dejour. P. Etude simultanee de la ventilation et desdecha.ges des chemorecepteuree du glomue carotidien ches Is chat. I1. Au coursd'inhalations breves d'anhydride carbonique. Arch lnt Pharmacodyn 1965; 154:427.
3. Lambertsen Ci, Hall P, \Voilman 11, Goodman MW. Quantitative interactions of increasedP0 2 and PCO 2 upon respiration in man. Ann NY Acad Sol 1963; 109:731.
4. Lamberteen CJ, Clark IM, Gelfand R, et al. Definition of tolerance to continuoushyperoxia in man. An abstract report of Predictive Studies V. In: Bove AA, BachrachAJ, Greenbaum LJ Jr, eds. Underwater and hyperbaric physiology IX. Proceedings of the
ninth symposium on underwater and hyperbaric physiology. Bethesda, MD: Underwaterand Hyperbaric Medical Society, 1987.
S. Clark JM, Gelfand R, Flores ND, Lambertsen CL, Pisarello JB. Pulmonary tolerance inman to continuous oxygen exposure at 3.0, 2, 2.0, and 1.S ATA in Predictive Studies
V. In: Bove A.A, Bachrach AJ, Greenbaum Li Jr, eds. Proceeding. of the ninth sympo-sium on underwater and hyperbaric physiology. Bethesda, MD: Underwater and Hyper-3 baric Medical Society, 1987.
4I
I Respiratory Homeosta-sis
6. Pitarello JB, Clark 3.M, Lambertsen CJ, Ceifand R. Human circulatory response toprolonged hyperbaric hyperoxia in Predictive Studies V. In: Bove AA, Bachrach AJ,Greenbaum Li Jr, eds. Underwater and hyperbaric physiology LX.Froceedings of theninth symposium on underwater and hyperbaric physiology. Bethesda, MD: Underwater
and Hyperbaric Medical Society, 1987.7. Sirncn AJ, Tor~ati D. Effects of hy-perbaric oxygen on heart, brain, and lung functions
:a :at. Un e~sez B1cmed Res 1SE2; ^(Z).263-275.8. Matalon S, Nesarajah MS, Farhi L.E. Pulmonary and circulatory changes in conscious
sheep exposed to 100% 02 at 1 ATA. J Appl Physiol 1982; 53(l):110-116.
9. Peterson ES, Vejby-Christensen H. Effect of body temperature on steady state venti-I latlon and metabolism. Act& Physiol Scand 1973; 89:342.10. Puglia CD, Glauser EM, Glauser SC. Core temperature response of rate during exposure
to oxygen at high pressure. J AppI Physiol 1974; 36(2):149-153.11. Read DJC. A clinical method for asseing the ventilatory response to carbon dioxide.I Au t Ann Med 1967-68; 16-17:20-32.12. Rebuck AS, Campbell EJlM. A clinical method for assessing the ventilatory response to
hypoxis. Am Rev Respir Die 1974; 102:34S.13. Rebuck AS, Read 3. Patterns of ventilatory response to CO 2 during recovery from
severs asthma. Clin Sci 1971; 41:13-21.14. Aschoff 1, Wever R. Kern and schale inm warmehaushalt des menschen. Naturwiesen-
schaften 1958; 20:(47.I 15. Lambertsen Ci, Stroud MW Ill, Could RA, Kough RH, Ewing .IH, Schmidt CF. Oxygentoxicity. Respiratory responses of normal men to inhalation of 6 and 100 percentoxygen under 3.5 atmospheres pressure. J1 Appl Physiol 1953; 5(9):487-494.
16. Gelfand R, Clark 3Mf, Lambertsen C, Jackson R, Pisarello J. Hyperoxia at 3.0 ATA for315 hours (in Predittive Studies V). Effects on ventilatory parameters. Undersea BiomedRev Iri85; 12:(1)Suppl:19-20.
17. Gelfand R, Lambertsen CJ, Strauss R, Clark JM, Puglia CD. Human respiration at restI in rapid compression and at high pressures and gas densities. 3 Appi Physiol 1983;54(1):290-303.
18. Gelfand R, Lambertsen CJ. Dynamic respiratory response to abrupt change of inspired
C0 2 at normal and high P0 2. 3 AppI Physiol 1973; 35:903-913.19. White DP, Douglas NJ, Pickett CK, Zwillich CW, Weil JV. Sleep deprivation and the
control of ventilation. Am Rey Respir Die 1983; 128:984-986.I 20. Lahlri 3, Mokushi A, Mulligan E, Andronikou S. Loss of carotid chemoreflex function inoxygen toxicity. Fed Proc 1985; 44(4):1000.
3 Acknowledgment
Supported in part by NMRDC contract NO0014-81-C-0826. NASA contract NAS9- 17238, and3 the State of Pennsylvania through the Benjamin Franklin Partnership.
(45)

91h International Symposium on Underwater and Hyperbaric PhysiologyUndersea and Hyperbaric Medical Society, Bethesda. MD, 1987
II
HUMAN CIRCULATORY RESPONSES TO PROLONGED HYPERBARICHYPEROXIA IN PREDICTIVE STUDIES V
J. B. Pisarello. J. Mf. Clark. C. J. Lambertsen. and R. Gelfanid
In its various applications, oxygen breathing in man is limited by toxiceffects that become more severe as inspired oxygen pressure and exposureduration are increased. Although all tissues, organs, and systems are potentiallysusceptible to oxygen effects, only pulmonary and CNS manifestations ofoxygen poisoning have been studied extensively during long exposures. Withrespect to cardiocirculatory phenomena during oxygen breathing in man, mostprevious studies have focused on acute responses (I, 2), whereas thoseinvestigations that contained prolonged exposures have not included detailedevaluation of circulatory parameters (3, 4). Consequently, relatively little isknown about physiologic and toxic effects of prolonged hyperbaric oxygenexposure on the cardiocirculatory system in man.
This summary report presents selected results of cardiocirculatorymeasurements in healthy volunteers who breathed 100% 02 continuously at 3.0ATA for up to 3.5 h, at 2.5 ATA for up to 6.0 h, at 2.0 ATA for up to 11.9 h,and at 1.5 ATA for up to 19.0 h. These data were collected as part of a broadprogram of investigation (Predictive Studies V) designed to measure effects ofhyperbaric hyperoxia on human organ systems and functions (5-7).
3 METHODS
Each experiment included air breathing, sea-level control measurementsbefore measurements during oxygen breathing at increased pressure. Duringeach exposure to hyperoxia, cardiovascular data were obtained repeatedly: earlyin the oxygen exposure to investigate acute responses and later in the oxygenbreathing period to evaluate effects of prolonged exposure (5). All measure-ments reported here (unless noted otherwise) were performed at rest in the
II (46)
I

J. B. Pisareilo et al.
supine position, after a period of stabilization.
Cardioascular MeasurementsCardiac electrical activity ,vas continuously monitored during each
exposure and stored on magnetic tape for later computer analysis. Electricalimpedance cardiography (8) "vas utilized to follow changes in cardiac outputthroughout the exposure. Arterial blood pressure was measured intermittentlyby the cuff method during the 30 ATA series and by indwelling catheter inthe 2.5 ATA, 2.0 ATA, and 1.5 ATA series. Systemic vascular resistance was
calculated from cardiac output and me-n blood pressure data, assumingconstant right atrial pressure. Values are expressed as percent changes frompreexposure values.
Responses to Actiie StandingBlood pressure and heart rate responses to active standing (9) were
measured before and during the oxygen exposures at 2.5, 2.0, and 1.5 ATA toinvestigate the effect of hperbaric ., breathing on autonomic modulation of
orthostatic reflexes. To perform this measurement, ECG and arterial bloodpressure were continuously recorded while the subject actively rose from thesupine to the upright position in less than 5 s. Instantaneous heart rates whilesupine and during the initial 60 to 90 s after active standing were obtainedfrom an ECG-activated cardiotachometer. The pattern of this response has beenshown previously to be a reproducible phenomenon in the evaluation ofbaroreflex autonomic function (9).
Liver Blood FlowTo study possible oxygen effects on regional hepatic circulation, liver
blood flow was measured as the rate of indocyanine (ICG) clearance (10) at sealevel and during early and late oxygen exposure at 2.0 and 1.5 ATA. For eachflow measurement, 0.5 mg/kg of ICG was injected i.v. while the subject wasresting in a supine position. Blood sampling was performed at 0, 1, 2, 3, 6, 9,
12, 15, 18, and 21 rain from the indwelling arterial catheter. Plasma concen-tration of ICG was determined spectrophotometrically, using the subjectspreinjection arterial sample as a blank to construct a standard calibrationcurve.
RESULTS
Cardioiascular Oxygen Tolerance Limits at 3.0, 2.5, 2.0, and 1.5 ATAIn the 3.0 ATA series of exposures, all but 2 were continued to the
predetermined maximum duration of 3.5 h. One of the 2 exceptions wasterminated at 2.5 h because of excessive bradycardia, and the other wasstopped at 3.0 h upon the onset of an oxygen convulsion. Two exposures at 2.5ATA and I at 1.5 ATA were stopped at 5.5, 5.8, and 17.7 h, respectively, whenthe subjects developed asymptomatic, unifocal, ventricular ectopic activity of
I(4,7)
II

3 Human Circulatory Responses to BO0
increasing frequency. All remaining exposures at 2.5, 2.0. and 1.5 ATA thatwere terminated before predetermined maximum durations were stopped on thebasis of pulmonary symptoms and/or changes in lung volumes and flow rates.
Effects on Resting Heart Rate and Cardiac RhythmAs observed by others during short hyperbaric oxygen exposures (J, 2).
initial responses in the 3.0, 2.5, and 2.0 ATA series were characterized byaverage reductions in sinus node frequency discharge of approximately 6 to 12I eats/min. An initial average reduction of 3 beats/min was observed in the 1.5ATA series (Table I ). Sinus arrhythmia, sinus pauses, and occasional periods ofnodal control occurred early in the exposures.at 3.0, 2.5, and 2.0 ATA (Fig. 1).These phenomena were usually transient and were not associated withsymptoms in any subject except the I at 3.0 ATA who developed progressive,severe bradycardia. Immediately after termination of oxygen breathing at 2.5 h,this subject had a sinus pause of 13 s in association with a 20-s period ofsyncope. Sinus rhythm returned promptly at the rate of 60/min and, within 20s, he became mentally alert. No further ECG abnormalities occurred, andposteXposure measurements were completed.
Table 1
Resting }eart Rate During Oxygen Breathing in Man, Beats/Min, Mean ± SE
Pressure Preexpolure Early Exposure Late Exposure
3.0 ATA (n = 12) 60.1 ± 4 54.2 t 3 53.0 ± 2
2.S ATA (t = 8) S7.3 ± 2 45.0 ± 2' 47.1 ± 2"2.0 ATA (it = 7) 59.0 ± 4 50.0 4 63.5 ± 2""
.S ATA (it = 7) s9.1 t 5 56.2±3 64.2± 5
3 P < O.OS compared to preexposure. P* P < 0.05 comrred to eariy exposure.
In contrast to the sustained decreases in resting heart rate observed at3.0 and 2.5 ATA, initial decrease in sinus frequency discharge at 2.0 and 1.5ATA was followed after about 3 h of exposure by progressive acceleration. At9.8 h of exposure in the 2.0 ATA series, pulse rate was significantly greaterthan the initial oxygen exposure value (Table 1). Along with increasedfrequency of sinus discharge at 2.0 and 1.5 ATA, sinus pauses disappeared andperiods of nodal control occurred. In some cases, atrial and ventricularpremature depolarizations were observed during the later part of the 2.5, 2.0,and 1.5 ATA exposures (Fig. 2). This ectopic activity was infrequent and notassociated with symptoms during the 2.0 ATA exposure series. However, in Isubject at 1.5 ATA, and in 2 others at 2.5 ATA, exposures were terminatedbecause of increasing numbers of unifocal, premature ventricular depolar-izations. None of the 3 subjects had associated symptoms, and the continuousmonitoring demonstrated complete disappearance of ectopic phenomena withii3 h of exposure termination.
(I8
I

I
J. B. Pisarello et al.
i PRE-EXPOSURE NORMAL HR-73 9:20 .IAI
, . AA i
2.5 ATA EXPOSURE TIME 11 UIN CONTINULOUS HR-44 11:21 .3P1.
2.5 ATA EXPOSURE TIME 42 WIN SINUS ARRH. HR-89 12:42 .6A2
3.0 ATA EXPOSURE TIME 23 WIN NOOAL RHYTHM HR-65 11:25 .4AI
Fig. 1. Electrocardiographic features during the lit h of oxygen exposure in man at 2.5 and 3.0ATA. Top to bottom: normal sea-level tracing, sinus bradycardla, sinus arrhythmia, and nodal
escape (last two beats).
2.5 ATA EXPOSURE TIME 5.0 HRS TRIGEMINY HR-62 5:45 .0PI.. .. ... .. ..... ... ....... .... ... ............. .. .... ... ....... . . . .. .... .: . ..... .- ....... ; .;.. ... ...... .. . _; ... .... . .. +.. _
I- ..1 ! .:.- .
2.5 ATA EXPOSURE TIME 5.5 HRS SVPB HR-55 1:00 .2A2... ... ... . ..........
10.. A.
Fig. 2. Electrocardiogram of a subject exposed to oxygen at 2.5 ATA. Ectopic premature beats of
ventricular and suprayentricular origin are demonstrated In the top and bottom tracing#,respectively.
I
1 49
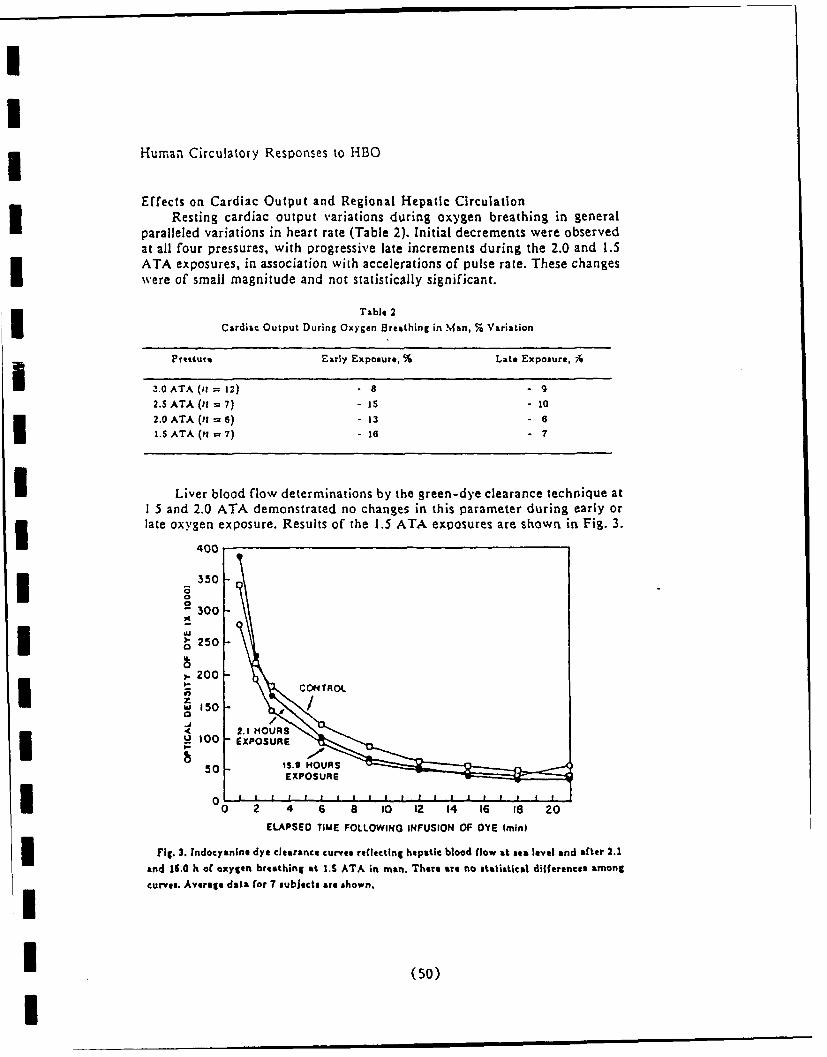
Human Circulatory Responses to HBO
Effects on Cardiac Output and Regional Hepatic CirculationResting cardiac output variations during oxygen breathing in general
paralleled variations in heart rate (Table 2). Initial decrements were observedat all four pressures, with progressive late increments during the 2.0 and 1.5ATA exposures, in association with accelerations of pulse rate. These changes
were of small magnitude and not statistically significant.
Table 2
Cardiac Output During Oxygen Breathing in Man, % Variation
PoirsEarly Exposu re, % Late Exposure, A
I3.0OATA (i= 12) .8 - 92.5SATA ()I =7) -1is - 10
2.0OATA(i =6) - 13 - 6
L.SATA (n =7) - is-6
I Liver blood flow determinations by the green-dye clearance technique at1 5 and 2.0 ATA demonstrated no changes in this parameter during early or3 late oxygen exposure. Results of the 1.5 ATA exposures are shown in Fig. 3.
400
350
30
250::1- cotiiaoae
50 h5.O /OAEXPOSURE
OI 20 4L~O 6 10 12 14 16 le 20
ELAPSED TIME FOLLOWING INFUSION OF DYE (mini
Fig. 3. Indlocyanlne dye clearance curves reflecting hepatic blood flow at sea level and after 2.1
end 15.0 h of oxygen breathing at 1.5 ATA in man. There ar. no statistical differences among
curves. Average data for 7 subjects are shown.
I (50)

J. B. Pisarello et al.
Effects on Arterial Blood Pressure and Systemic Vascular ResistanceAverage changes in resting arterial blood pressure during early oxygenIexposure at 3.0, 2.5, and 1.5 ATA indicated decreases of 0.5, 6.2, and 7.7
mmHg, respectively, and an increase of 12.2 mmHg at 2.0 ATA (Table 3). Onlythe. decrement at 2.5 ATA was statistically significant. During late oxygenexposure at 3.0, 2.5, and 2.0 ATA, average values of mean arterial pressureexceeded preexposure control values by 4.4, 1.0, and 3.4 mmHg, respectively(Table 3). The late exposure value at 1.5 ATA was 4.6 mmHg less than control.None of these late exposure changes was statistically significant.
Table 3Mean Arterial Blood Pressure During Oxygen Breathing in Man, mmHg, Mean t SE
Pressure Preexposure Early Exposure Late Exposure
3.0 ATA (11 = 12) 90.0 t 4 89.5 :t 3 94.4 ±: 42.5 ATA (11 = 7) 94.9 t 4 88.7 ±: 3' 95.9 ± 22.0 ATA (11 = 6) 84.4 ± 3 96.6±: 4 87.8 + 8
I.S ATA (i1 = 7) 97.3 ± 4 89.6: 3 92.7 ± 4
P < 0.05 compared to preexposure value.
Average calculated values of systemic vascular resistance during earlyoxygen exposure at 3.0. 2.5, 2.0, and 1.5 ATA were increased by 8, 9, 31, and6%, respectively (Table 4). During late oxygen exposure, values of systemicvascular resistance increased further to 16 and 11% above control values at 3.0and 2.5 ATA, respectively, and decreased at 2.0 ATA to 10% with respect tocontrol values. None of these changes was statistically significant.
Table 4
Systemic Vascular Resistance During Oxygen Breathing In Man, % Variation
Pressure Early Exposure, % Late Exposure, %
3.0ATA(it = 12) + a + 162.5ATA(?I=7) + 9 + 112.0 ATA (11 = 6) + 31 + 101.S ATA (;i = 7) + 6 + 1
Hemodynamic Responses to Actie StandingNormal acceleration of heart rate in response to an abrupt transition
from supine to standing positions occurred during both early and late oxygen
exposure in all 9 subjects studied at 1.5 ATA and in 6 of the 7 subjectsexposed to oxygen at 2.0 ATA. However, in I of the 2.0 ATA subjects,complete blunting of the normal tachycardic response to active standing wasobserved in follow-up measurements 2 h after termination of an 8-h exposure
(I
I (51)
U ma m i

Human Circulatory Responses to HBO
(Fig. 4). This event was not associated with symptoms, and arterial bloodpressure did not fall.
140-
130-PIG-Exposure
120-
n 110-
<'C100- Eal 02 Exposure at 2.0 ATAzI/
go-U:CO601
7 2Hrs Post-Exposure
0 5 10 15 20253035 4045 50 5560TIME (secs)
Fig. 4. Immnediate heart rate responses to standing In 1 subject before, during. and after S h ofI oxygen breathing at 2.0 ATA. Ntote the complete blunting of this response In the postexposurecurve. Despite failure of pulse rate acceleration, blood pressure In the standing position wasmaintained and the subject experienced no symptoms.
(52)

J. B. Pisarello eta).
Similar inhibition of heart rate acceleration upon standing occurred in 4of the 8 subjects who breathed oxygen for 5 to 6 h at 2.5 ATA (Fig. 5).During lzte oxygen exposure in these subjects, heart rate increased over the^irst 15 to 20 s of standing, but then decreased to stabilize at a level onlyslightly above the supine value. No symptom was associated with this effect,and blood pressure was maintained. In all cases, postexposure measurements atsea level demonstrated complete reversal of this effect, with restoration ofnormal tachycardic responses to standing.
I l20-
0
I *100
90W 80
}"- 8 0 - Po t-Expo ure
7 70
Lte 0 Exposure at 2.5 ATA
150
1 0 5 10 15 20 25 30 35 40 45 50 55 60I TIME (secs)
I Standing
Fig. 5. Immediate heart rate responses to standing in I subject before, during, and after 6 h of
oxygen breathing at 2.S ATA. Note the abnormal response during oxygen exposure and its return
to normal during the postexposure period.
Ii (53)
I

Human Circulatory Responses to HBO
DISCUSSION
These experiments indicate that resting hemodynamic responses toprolonged hyperbaric oxygen breathing in man usually consist of smalldeviations from normal sea-level responses. At all four oxygen pressuresinvestigated, rapid onset of bradycardia occurred. This effect, previouslyshown to be mediated by vagal mechanisms (2), was accompanied by a rate-I dependent reduction in cardiac output and a degree of systematic vasocon-striction. All these effects were small in m.gnitude and appeared to befunctionally unimportant.I During late oxygen exposure at 2.5, 2.0, and 1.5 ATA, excitatory influ-ences on cardiac depolarization were manifested by both a progressive accel-eration of sinus node frequency discharge and an occasional appearance ofectopic electrical activity of both supraventricular and ventricular origin. Theseevents were not accompanied by symptoms and are not likely to interfere withperformance in normal individuals.
While both the early inhibitory and late excitatory cardiac electricalphenomena were generally small in magnitude and were not accompanied bysymptoms, it is important to emphasize that four oxygen exposures wereterminated on the basis of cardiac depolarization abnormalities. One exposureat 3.0 ATA was stopped when extreme bradycardia occurred, and a total ofI three exposures at 1.5 and 2.5 ATA were terminated when unifocal ventricularectopy of increasing frequency developed. These cardiac manifestations mayrepresent direct effects of oxygen on cardiac tissue, or they may be causedindirectly by oxygen effects on neural or neurohormonal influences withsecondary modification of cardiac function. Whatever the mechanism, theseobservations clearly demonstrate that, in selected individuals, cardiacdepolarization events can limit the duration of extended, continuous exposuresto oxygen at increased pressures.
This initial evaluation of dynamic circulatory events during oxygenbreathing indicates the potential occurrence of interference with basic reflexi mechanisms during hyperbaric hyperoxia. Furthermore, the observed modifi-cation of the normal response to active standing during the 2.0 and 2.5 ATAexperiments, with preservation of the vasoconstrictor response, indicates theselective nature of this interference. In those subjects in whom acceleration ofheart rate did not occur upon standing, cardiac output was reduced more thanthe normal physiologic decrement. However, the absence of a fall in bloodpressure indicates a compensatory increase in reflex vasoconstriction. It ispossible that, in a subject with a marginal state of hydration, even maximalvasoconstriction would be insufficient to assure optimal cerebral perfusion.This may have been the mechanism underlying the orthostatic intoleranceobserved in some of the subjects exposed to oxygen at 2.0 ATA reported in aprevious, related series (11).
III (54)
S. B. Pisarello et al.
References
1. Whalen RE, Saltzman HA, Holloway DH Jr, McIntosh HD, Sieker HO, Brown IW Jr.
Cardiovascular and blood g.s responses to hyperbaric oxygenation. Am J Cardlol 1965;
15:638-646.
2. Egger GWN Jr, Paley HW, Leonard Ji, Warren JV. Hemodynamic responses to oxygenbreathing In man. J Appi Physiol 1962; 17:75-79.
3. Behnke AR, Forbes HS, Motley EP. Circulatory and visual effects of oxygen at 3atmospheres pressure. Am J Physiol 193S; 114:436-442.
4. Donald KW. Oxygen poisoning in man. I & 11. Br Med J 1947; 1:667-672, 712-717.
5. Lambertsen CJ, Clark JM, Gelfand R, et al. Definition of tolerance to continuous
hyperoxia in man. An abstract report of predictive studies V. In: Bove AA, BachrachAJ, Greenbaum LJ Jr, eds. Underwater and hyperbaric physiology IX. Proceedings of theninth symposium on underwater and hyperbaric physiology. Bethesda, MD: Underwaterand Hyperbaric Medical Society, 19B7.
S. Clark .M, Gelfand R, Flores ND, Lambertsen CJ, Plsarello JB. Pulmonary tolerance in
man to continuous oxygen exposure at 3.0, 2.5, 2.0, and 1.5 ATA in predictive studies
V. In: Bove AA, Bachrach AJ, Greenbaum LJ Jr, ads. Underwater and hyperbaricphysiology IX. Proceedings of the ninth symposium on underwater and hyperbaricphysiology. Bethesda, MD: Underwater and Hyperbaric Medical Society, 1987.
7. Gelfand R, Clark JM, Lambertsen CJ, Plsarello JB. Effects on respiratory homeostasis ofprolonged continuous hyperoxia at 1.5 to 3.0 ATA in man in predictive studies V. In:
Bove A.A, Bachrach AJ, Greenbaum LJ Jr, eds. Underwater and hyperbaric physiology
IX. Proceedings of the ninth symposium on underwater and hyperbaric physiology.
Bethesda, MD: Underwater and Hyperbaric Medical Society, 1987.8. Denniston JC, Maher JT, Reeves JT, CruL JC, Cymerman A, Grover RF. Measurement of
cardiac output by electrical impedance at rest and during exercise. J Appi Physiol 1976;
40:91-95.9. Ewing DJ, Hums L, Campbell IW, Murray A, Neilson JMM, Clarke BF. Autonomic
mechanisms in the initial heart rate response to standing. J AppI Physiol 1980; 49:809-
I814.10. Winkler K, Tygsturp N. Determination of hepatic blood flow in man by cardio-green.
Scand i Clin Labs Invest 1960; 12:353-356.11. Clark IM, Lambertsen CJ. Rate of development of pulmonary oxygen toxicity In man
during oxygen breathing at 2.0 ATA. J Appi Physiol 1971; 30:739-752.
I Acknowledgment
Supported in part by NMRDC contract N00014-81-C-0820, NASA contract NAS9-17238, andthe State of Pennsylvania through the Benjamin Franklin Partnership.
II1 (55)
1 July 1990
PUBLICATIONS
1940 - 1984
1990
Gelfand, R., J.M. Clark, and C.J. Lambertsen. Ventilatoryresponse to hypoxia is preserved following prolonged hyperbarichyperoxia at 1.5, 2.0, and 2.5 ATA in man (Predictive Studies V).Undersea Biomed. Res. 17(Suppl.): 163, 1990.
1989
Clark, J.M. and C.J. Lambertsen. Principles of oxygen toleranceextension defined in the rat by intermittent oxygen exposure at2.0 and 4.0 ATA. Undersea Biomed. Res. 16(Suppl.): 99, 1989.
Gelfand, R., Clark, J.M. and C.J. Lambertsen. Respiratorycontrol timing characteristics during prolonged hyperoxia at 1.5,2.0, 2.5 and 3.0 ATA (Predictive Studies V). Undersea Biomed.Res. 16:(Suppl.): 93-94, 1989.
1988
Clark, J.M., C.J. Lambertsen, D.J. Montabana, R. Gelfand and J.H.Cobbs. Comparison of visual function effects in man duringcontinuous oxygen exposures at 3.0 and 2.0 ATA for 3.4 and 9.0hours (in Predictive Studies V). Undersea Biomed. Res. 15(Suppl.): 32, 1988.
Gelfand, R., J.M. Clark, C.J. Lambertsen and J.B. Pisarello.Ventilatory responses to hypoxia following prolonged hyperoxia at2.5 ATA in man in Predictive Studies V. Undersea Biomed. Res.15 (Suppl): 34, 1988.
Gelfand, R., J.M. Clark, C.J. Lambertsen and J.B. Pisarello.Ventilatory response to C02 following prolonged hyperoxia at 1.5I and 2.5 ATA in man. FASEB J. 2: A1508, 1988.
Clark, J.M. Pulmonary limits of oxygen tolerance in man. In:Symposium on Extension of oxygen Tolerance. Exper. Lung Res.14: 897-910, 1988.
Lambertsen, C.J. Extension of oxygen tolerance: the philosophyand significance. In: Symposium on Extension of OxygenTolerance. Exper. Lung Res. 14:1035-1058, 1988.
I1I
I

Lambertsen, C.J. Relations of decompression to use of oxygen:Harmful effects and their prevention. In: Symposium on HealthExamination of Divers - Decompression/Use of Oxygen. Stavanger,Norway, sponsored by Norwegian Petroleum Directorate, February,1988.
Lambertsen, C.J. Physiologic factors in human organ oxygentolerance extension. In: On Diving and Hyperbaric Medicine andDiving Medical Advisory Committee Workshop. Aberdeen, Scotland,European Undersea Biomedical Soc., Sept, 1988.
Torbati, D. and K.J. Reilly. Effect of prolonged normobarichyperoxia on regional cerebral metabolic rate for glucose inconscious rats. Brain Res. 459: 187-191, 1988.
Torbati, D. Hyperbaric Oxygenation. In: Encyclopedia ofMedical Devices and Instrumentation. Vol. 3. Webster, J.G., Ed.pp. 1564-1583, 1988.
1987
Clark, J.M., R. Gelfand, N.D. Flores, J.B. Pisarello and C.J.Lambertsen. Pulmonary function alterations and symptoms in manduring and after 02 exposure at 2.5 ATA for 5-6 hours. Am. Rev.Resp. Dis. 135: A265, 1987.
Gelfand, R., J.M. Clark and C.J. Lambertsen. Effects on bodytemperature of continuo-s hyperoxia at 1.5, 2.0 and 3.0 ATA inman (in Predictive Studies V). Undersea Biomed. Res.14(Suppl.): 28, 1987.
Gelfand, R., J.M. Clark, C.J. Lambertsen and J.B. Pisarello.Ventilatory response to hypoxia following prolonged hyperoxia at1.5 ATA in man. Fed. Proc. 46: 827, 1987.
IClark, J.M., R. Gelfand, N.D. Flores, C.J. Lambertsen and J.B.Pisarello. Pulmonary tolerance in man to continuous oxygenexposure at 3.0, 2.5, 2.0 and I - ATA in Predictive Studies V.In: Underwater and Hyperbaric iVsiloqy IX. Bove, A.A., A.J.Bachrach and L.J. Greenbaum, Eds. Bethesda: Undersea andHyperbaric Medical Soc., pp. 737-749, 1987.
Dise, C.A., J.M. Clark, C.J. Lambertsen and D.B.P. Goodman.Hyperbaric hyperoxia reversibly inhibits erythrocyte phospholipidfatty acid turnover. J. Appl. Physiol. 62: 533-538, 1987.
Gelfand, R., J.M. Clark, C.J. Lambertsen and J.B. Pisarello.Effects on respiratory homeostasis of prolonged continuoushyperoxia in man at 1.5 to 3.0 ATA in Predictive Studies V.In: Underwater and Hyperbaric Physiology IX. Bove, A.A., A.J.Bachrach and L.J. Greenbaum, Eds. Bethesda: Undersea andHyperbaric Medical Soc., pp. 751-761, 1987.
2IU

Lambertsen, C.J., J.M. Clark, R. Gelfand, J.B. Pisarello, W.Cobbs, J.E. Bevilacqua, D.M. Schwartz, D.J. Montabana, C.S.Leach, P.C. Johnson and D.E. Fletcher. Definition of toleranceto continuous hyperoxia in man. An abstract report of PredictiveStudies V. In: Underwater and Hyperbaric Physiology IX. Bove,A.A., A.J. Bachrach and L.J. Greenbaum, Eds. Bethesda: Underseaand Hyperbaric Medical Soc., pp. 717-735, 1987.
Pisarello, J.B., J.M. Clark, R. Gelfand and C.J. Lambertsen.Human circulatory responses to prolonged hyperbaric hyperoxia inPredictive Studies V. In: Underwater and Hyperbaric PhysiologyIX. Bove, A.A., A.J. Bachrach and L.J. Greenbaum, Eds.Bethesda: Undersea and Hyperbaric Medical Soc., 763-772, 1987.
Torbati, D. and C.J. Lambertsen. Effects of hyperbaricoxygenation on regional cerebral glucose utilization rate in theawake rat. In: Proceedings of the Eighth International Congresson Hyperbaric Medicine. Kindwall, E.P., Ed. San Pedro, CA:Best, pp.48-56, 1987.
1986
Clark, J.M., R. Gelfand, N.D. Flores, J.B. Pisarello and C.J.Lambertsen. Pulmonary mechanics and gas exchange in man duringand after oxygen exposure at 1.5 ATA for 16 to 19 hours. Am.Rev. Resp. Dis. 133:A31, 1986.
Pisarello, J.B., J.M. Clark, R. Gelfand and C.J. Lambertsen.Human circulatory response during prolonged exposure to oxygen at2 ATA. Fed. Proc. 45:644, 1986.
Torbati, D. Effect of 8 hours oxygen breathing at 2 atmosphereson brain glucose utilization in the rat. Fed. Proc. 45: 535,1986.
Torbati, D. and A. Torbati. Blood glucose as a predictivemeasure for central nervous system oxygen toxicity in consciousrats. Undersea Biomed. Res. 13: 147-154, 1986.
1985
Marsh, R.R., C.J. Lambertsen, D.M. Schwartz, J.M. Clark and R.F.Westmore. Auditory and vestibular function in hyperbaric oxygen.Otolaryngol. Head Neck Surg. 93: 390-393, 1985.
Torbati, D. Regional cerebral metabolic rate for glucoseimmediately following exposure to 2 atmosphere absolute oxygen inconscious rats. Neurosci. Lett. 55: 109-112, 1985.
Torbati, D. Effect of pentobarbital anesthesia on regionalcerebral metabolic rate for glucose during hyperbaric oxygenationin rat. Brain Res. 336: 350-353, 1985.
3
III I I

ITorbati, D. Heparin effects during hyperbaric oxygenation inrats. Life Sciences 36: 147-151, 1985.
Torbati, D. and C.J. Lambertsen. The relationship betweencortical electrical activity and regional cerebral glucosemetabolic rate in rats exposed to 3 atmospheres absolute oxygen.Brain Res. 344: 186-190, 1985.
Torbati, D. Effect of propranolol on the electrical activity ofthe brain during hyperbaric oxygenation in the rat. UnderseaBiomed. Res. 12: 423-429, 1985.
1984
Clark, J.M. and C.J. Lambertsen. Effects of inspired oxygenpressure on the nature and degree of oxygen tolerancemodification. In: Underwater Physioloqy VIII. Bachrach, A.J.and M.M. Matzen, Eds. Bethesda: Undersea Medical Soc., 1984.pp. 31-41.
Jackson, R. The endotoxin-pretreated, oxygen-adapted rat modelin 2.0 and 4.0 ATA 02. In: Underwater PhysioloQy, VIII.Bachrach, A.J. and M.M. Matzen, Eds. Bethesda: UnderseaMedical Soc., 1984. pp. 51-59.
Torbati, D. Cellular mechanisms of oxygen toxicity. In:Oxygen: An in-depth study of its pathophysioloQy. 28th UnderseaMedical Society Workshop. Bethesda, MD: Undersea Medical Soc.,1984. pp. 377-409.
Torbati, D. and C.J. Lambertsen. Alterations in rat local brainand spinal cord glucose utilization following 30 to 60-minuteexposure to 2 and 3 ATA 02 and normoxic N-02 at 3 ATA. In:Underwater Physiology, VIII. Bachrach, A.J. and M.M. Matzen,Eds. Bethesda: Undersea Medical Soc., 1984. pp. 61-68.
Torbati, D., C.J. Lambertsen and J. Greenberg. Regional cerebralglucose utilization rates in rats during asymptomatic period ofexposure to 1, 2, and 3, ATA 02. Neuroscience 11: 947-950, 1984.
Torbati, D., P. Lo and C.J. Lambertsen. Local cerebral glucoseutilization rate following intermittent exposures to 2 atmosphereabsolute oxygen. Neuroscience Lett. 50: 79-84, 1984.I
II
4I